 Jiyuan Zhang1,2†Xiaopeng Ma1,2†
 Zhiguang Li3Hu Liu1,4,5Mei Tian1,4,5
 Ya Wen1,4,5
 Shan Wang1,4,5
 Liang Wang1,4,5*
- 1Department of Neurology, The Second Hospital of Hebei Medical University, Shijiazhuang, China
- 2School of Basic Medicine, Hebei Medical University, Shijiazhuang, China
- 3Xingtai Third Hospital, Xingtai, China
- 4The Key Laboratory of Neurology, Hebei Medical University, Ministry of Education, Shijiazhuang, China
- 5Neurological Laboratory of Hebei Province, Shijiazhuang, China
Background: Circadian rhythm disruption is typical in Parkinson’s disease (PD) early stage, and it plays an important role in the prognosis of the treatment effect in the advanced stage of PD. There is growing evidence that circadian rhythm genes can influence development of PD. Therefore, this study explored specific regulatory mechanism of circadian genes (C-genes) in PD through bioinformatic approaches.
Methods: Differentially expressed genes (DEGs) between PD and control samples were identified from GSE22491 using differential expression analysis. The key model showing the highest correlation with PD was derived through WGCNA analysis. Then, DEGs, 1,288 C-genes and genes in key module were overlapped for yielding differentially expressed C-genes (DECGs), and they were analyzed for LASSO and SVM-RFE for yielding critical genes. Meanwhile, from GSE22491 and GSE100054, receiver operating characteristic (ROC) was implemented on critical genes to identify biomarkers, and Gene Set Enrichment Analysis (GSEA) was applied for the purpose of exploring pathways involved in biomarkers. Eventually, immune infiltrative analysis was applied for understanding effect of biomarkers on immune microenvironment, and therapeutic drugs which could affect biomarkers expressions were also predicted. Finally, we verified the expression of the genes by q-PCR.
Results: Totally 634 DEGs were yielded between PD and control samples, and MEgreen module had the highest correlation with PD, thus it was defined as key model. Four critical genes (AK3, RTN3, CYP4F2, and LEPR) were identified after performing LASSO and SVM-RFE on 18 DECGs. Through ROC analysis, AK3, RTN3, and LEPR were identified as biomarkers due to their excellent ability to distinguish PD from control samples. Besides, biomarkers were associated with Parkinson’s disease and other functional pathways.
Conclusion: Through bioinformatic analysis, the circadian rhythm related biomarkers were identified (AK3, RTN3 and LEPR) in PD, contributing to studies related to PD treatment.
1 Introduction
Parkinson’s disease (PD) is a long-term, progressive neurodegenerative condition that is mainly characterized by motor dysfunction, including bradykinesia, instability in posture, muscle stiffness, and resting tremor (Yang et al., 2020; Aarsland et al., 2021). One distinguishing feature of the illness is the selective loss of dopaminergic neurons in the Substantia Nigra pars compacta (SNpc), which causes motor symptoms (Maiti et al., 2017; Guatteo et al., 2022). Another distinct characteristic of PD is the existence of Lewy bodies, which are cytoplasmic aggregates mostly made of ubiquitin and α-synuclein (α-syn), within the remaining neurons (Bérard et al., 2022; Surguchov and Surguchev, 2022; Stoker and Greenland, 2018). The pathophysiology of PD is yet unknown, however, hereditary factors, environmental variables, age, and oxidative stress may all play a role in the degenerative death of dopaminergic neurons (Chang and Chen, 2020; Jankovic and Tan, 2020). Living independently is challenging for PD patients, which places a huge load on individuals and their families. At present, the diagnosis criteria for PD are still dependent only on motor symptoms that appear years after the neurodegenerative process has begun (Tolosa et al., 2021). But the emergence of symptoms linked to dyskinesia has revealed that PD patients are at an advanced clinical stage. Symptoms of mobility abnormalities in PD patients can be avoided as soon as feasible if the neurodegeneration is identified and treated at an early stage.
Although PD is classified as a movement illness, most patients also have a wide range of non-motor symptoms (NMS) (Kulisevsky et al., 2013). NMS often appear in the early stages of PD and often precede motor dysfunction. Nonmotor symptoms such as decreased olfaction, constipation, nocturia, neuropsychiatric symptoms, and sleep difficulties are very prevalent and can occur many years before the clinical diagnosis of PD (Zhang et al., 2016).
The circadian rhythm is a 24-h cycle that governs physiological and behavioral processes (Hood and Amir, 2017). Circadian rhythms control almost all bodily functions and behaviors, including sleep–wake cycles, body temperature, blood pressure, food intake, hormone release, and others (Serin and Acar Tek, 2019). Circadian rhythm disruption is typical in PD early stage. And symptoms associated with circadian rhythms can persist into the later stages of Parkinson’s disease (Hunt et al., 2022). Circadian rhythm disorder can cause rapid eye movement sleep behavior disorder, night insomnia, excessive daytime sleepiness and many other sleep disorders (Gros and Videnovic, 2020). Circadian rhythm disruption also impacts the corresponding fluctuations in blood pressure and heart rate, resulting in hypertension at night and hypotension during the day. Circadian rhythm issues for PD patients may have an impact on depression propensity, treatment responsiveness, body temperature, endocrine abnormalities, and other occurrences (Videnovic and Zee, 2015). Polymorphisms in clock genes have been linked to an increased risk of PD (De Lazzari et al., 2018; Shkodina et al., 2022). It has been postulated that clock gene mutations may contribute to PD pathogenesis by altering circadian regulation of processes such as mitochondrial bioenergetics, autophagy, and neuroendocrine function (Hunt et al., 2022). Many neurological illnesses, including schizophrenia, bipolar disorder, depression, and autism, rely on circadian rhythms (Hunt et al., 2022).
We hope to investigate the mechanism of circadian rhythm disturbance in Parkinson’s disease patients using high-throughput chip technology, as well as uncover relevant molecular markers that may diagnose and predict PD at an early stage and monitor patients’ circadian rhythm disruption for a long period. We extracted data sets GSE22491 and GSE100054 and 1,288 circadian rhythm genes from a public database. Differential expression analysis, WGCNA, LASSO, SVM-RFE, ROC, etc. were used to find circadian-related PD biomarkers, and genome enrichment analysis (GSEA) was used to investigate the functional pathways connected to PD. Finally, immunoinfiltration analysis was carried out in order to better understand the role of biomarkers in the immune milieu and to suggest therapeutic drugs that may influence biomarker expression. The strategy of this study is shown in Figure 1. It is crucial for the diagnosis and therapy of Parkinson’s disease to understand the mechanism of circadian biomarkers in the illness. The aim of this study was to investigate the regulatory mechanisms of circadian rhythm genes in Parkinson’s disease and to provide new ideas to guide the clinical treatment of Parkinson’s disease patients.
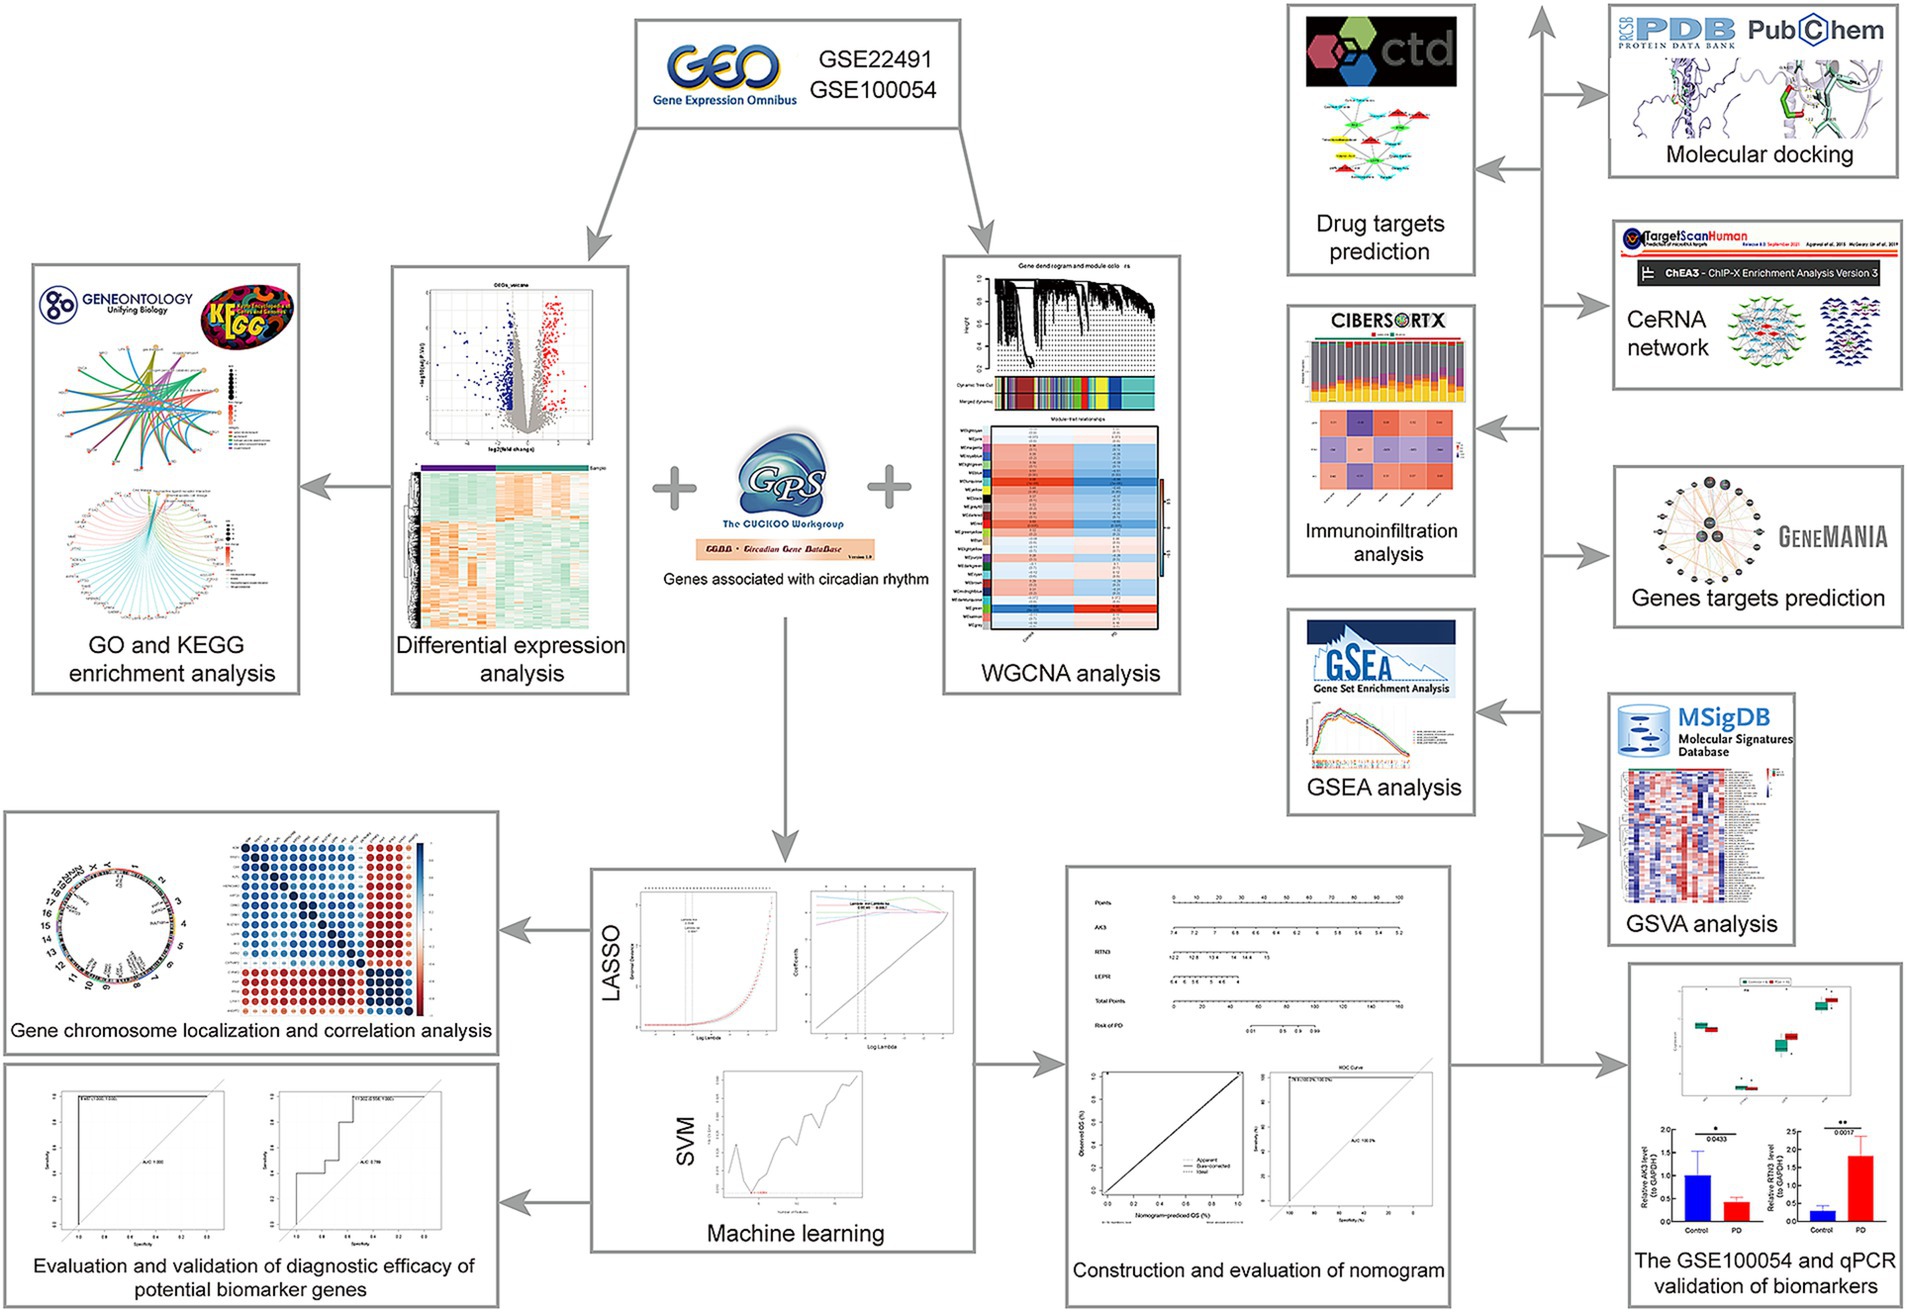
Figure 1. Flow chart of this study.
2 Materials and methods
2.1 Sources of data
Datasets GSE22491 and GSE100054 were acquired via GEO,1 in which the GSE22491 included peripheral blood mononuclear cells (PBMC) for 10 Parkinson’s disease (PD) samples and PBMC for 8 control samples (Mutez et al., 2011). GSE100054 contained 8 PD PBMC samples and 8 control PBMC samples (Miki et al., 2018). Then, totally 1,288 circadian genes (C-genes) were extracted via Circadian Gene DataBase (CGDB) database2 (Li et al., 2017; Yin X. et al., 2022; Yin Z. et al., 2022).
2.2 Differential expression analysis and ingenuity pathway analysis
After acquiring the (GSE22491) dataset, we first applied log2(x + 1) normalization to ensure the accuracy and reliability of the subsequent analysis. Subsequently, we performed differential gene analysis using stringent criteria (p.adjust<0.05, |log2FC| > 1) (Wang et al., 2021) to accurately screen for genes that were significantly differentially expressed between the disease and control groups. Through this process, genes that were lowly expressed in all samples were virtually automatically excluded, thus eliminating the need for additional screening for lowly expressed genes. Then, for the remaining gene were subjected to GO and KEGG through R package clusterProfiler (version 1.58.0) for finding functional pathways, filter criteria was adj. p < 0.05 (Yu et al., 2012). Subsequently, IPA was implemented in GSE22491 for exploring enrichment pathways of DEGs (Krämer et al., 2014). The symbol columns of DEGs and corresponding logFC columns were uploaded to IPA software, and preference was set to 3,000 mb, confirming that analyzed data was consistent with molecular background. Construction of interactions network was set to consider indirect effects, and data filtering threshold of 100–2000 was set to include contents of MyPathways and List created by individual into analysis together, RUN was clicked to start analysis. Z-score > 0 in indicated pathway was activated, and Z-score < 0 indicated inhibited. Role of biomarkers in transmission of signaling pathway corresponding to the highest value of |z-score| was displayed (Wang et al., 2022; Yang et al., 2022). In this study, we chosed thresholds of z-score > 2 or z-score < −2.
2.3 WGCNA
In this study, WGCNA analysis was performed on the entire sample of the training set using PD as a trait. WGCNA was applied in GSE22491 via R package WGCNA (version 1.70–3) (Langfelder and Horvath, 2008). GSE22491 samples were clustered for removing outliers, sample clusters were constructed for visualizing results. A soft threshold was chosen on the light of facts with constructed network maximally conformed to scale-free distribution and R2 closed to threshold 0.85. For constructing the co-expression matrix, all detected genes from GSE22491 were clustered into different modules. Therefore, neighboring and similarity were estimated for introducing coefficient of dissimilarity among genes, systematic clustering tree among genes was yielded according to coefficient of dissimilarity. Modules (set MEDissThres = 0.25 to merge similar modules, p < 0.05) with minimum number of 100 genes were sifted out for correlations analysis with sample groups (PD and control), key module that was highly correlated with PD was sifted out.
2.4 Acquisition of differentially expressed C-genes
The DEGs, C-genes and genes in the key module were overlapped to yield DECGs, and their localization on chromosomes as well as correlations among them were analyzed, GO and KEGG analyses were also applied with threshold p < 0.05 to identify relevant functional pathways.
2.5 Screening for critical genes via machine learning methods
In order to further screen out biomarkers that could diagnose the PD, we applied machine learning algorithm analyses. First, least absolute shrinkage and selection operator (LASSO) logistic regression algorithm was implemented on DECGs, and gene coefficient and cross-validation error maps were gained. The importance degrees of DECGs were ranked by support vector machine-recursive feature elimination (SVM-RFE) algorithm, and genes with the lowest error rate point were sifted out. Subsequently, critical genes were identified after taking the intersection of genes obtained by LASSO and SVM-RFE, the parameters were set to Lambda.min = 0.0046, AUC > 0.7.
2.6 Assessment of biomarkers’ diagnostic value
To evaluate ability of critical genes to distinguish PD from control samples, ROC curves were applied in GSE22491 and GSE100054 via pROC package (version 1.0.3) (Robin et al., 2011). ROC curves are plotted based on different dichotomous thresholds, where the vertical coordinate is the true-positive rate (Sensitivity) and the horizontal coordinate is the false-positive rate (1-Specificity). The closer the AUC (Area Under the Curve) is to 1, the higher the diagnostic accuracy of the model. Our analysis is based on an existing dataset designed to predict the risk of disease prevalence. We used an AUC value of 0.7 as a criterion, and area under the curve (AUC) of critical genes exceed 0.7 both in GSE22491 and GSE100054 were defined as biomarkers.
2.7 Construction of the diagnostic model
In GSE22491, the “rms” package (Liu et al., 2021) was used to construct a biomarker-based column plot model for PD risk prediction. Then, using the “pROC” package, we analyzed the ROC analysis (AUC > 0.7) of the column charts and evaluated the performance of the column charts in predicting the risk of PD, and the result was 1, which indicated that the performance was good. In addition, based on the column-line diagram prediction model, we plotted the calibration curves corresponding to the column-line diagrams. The horizontal coordinate of the calibration curve is the predicted probability and the vertical coordinate is the actual probability, and the closer the slope of the calibration curve is to 1, the more accurate the model prediction.
2.8 GSEA, gene set variation analysis
To explore the regulatory pathways or biological functions associated with target gene expression, we performed GSEA enrichment analysis. Compared with traditional enrichment analysis, GSEA enrichment analysis does not need to specify explicit differential gene thresholds, and the algorithm analyzes according to the actual overall trend, and does not miss some key information due to unreasonable screening parameters. Therefore, GSEA enrichment analysis can retain the key information without differential screening, and thus find the functional gene sets with insignificant differences but very consistent trends. The purpose of single-gene GSEA analysis is to find the regulatory pathways or biological functions associated with the expression of target genes. In this study, we calculated the correlation coefficients of the expression of all the genes with the target genes as a sorting criterion for the GSEA enrichment analysis.
For purpose of exploring functional pathways involved in biomarkers, GSEA was applied via R package clusterProfiler (version 1.58.0) (Yu et al., 2012) with adj. p < 0.05 (background gene set: KEGG: c2.cp.kegg.v2022.1.Hs.entrez.gmt), Individual biomarkers and all genes inside GSE22491 were analyzed for correlation and scored in order of correlation value. Next, expression high/low groups were classified according to biomarkers’ median expression, and significant pathways between these two groups in GSE22491 were displayed in heatmap through R packages clusterProfiler (version 1.58.0) (Yu et al., 2012) and GSVA (version 3. 15.0) (Su et al., 2022) (background gene set: h.all.v7.5.1.symbols.gmt).
2.9 Immune infiltrative analysis
To understand role that biomarkers played in immune microenvironment of PD, immune infiltration analysis was carried out in GSE22491. First infiltration abundance of immune cells in GSE22491 samples was estimated via cell type identification by estimating relative subsets of RNA transcripts (CIBERSORT). Spearman correlations among them was analyzed. After that, differences in immune cells’ proportions between PD and control samples from GSE22491 were compared, and sensibly different immune cells were selected for correlation analysis with biomarkers (p < 0.05, |r| > 0.3).
2.10 Construction of the GeneMANIA, competing endogenous RNA, and mRNA-miRNA-transcription factor networks
For the purpose of understanding the genes associated with biomarkers and functional pathways in which they are involved, GeneMANIA analysis was carried out (Franz et al., 2018). Then, Starbase3 (Li et al., 2014) and TargetScan4 databases (McGeary et al., 2019; Jia et al., 2022) were utilized to predict miRNAs targeting biomarkers, MiRNAs meeting the criteria with Conserved Sites in TargetScan database and all miRNAs predicted in the Starbase database were selected to determine the intersection and obtain the intersected miRNAs. Following this, lncRNAs targeting the intersected miRNAs were identified via the Starbase database with clipExpNum >15. A ceRNA network was acquire using Cytoscape software based on the above results. Additionally, TFs that regulate biomarkers were predicted from the ChEA3 database5 (Keenan et al., 2019), and a mRNA-miRNA-TF network was constructed.
2.11 Prediction and molecular docking analysis of potential therapeutic agents
In order to predict the drugs that affect the expression of biomarkers. Therapeutic drugs which targeting multiple biomarkers were predicted using the comparative toxicogenomics database (CTD)6 (Davis et al., 2021). Drugs with Interaction Count ≥2 and Organism Count ≥2 were selected to construct a drug-gene network with biomarkers. Subsequently, 3D crystal structures of biomarker encoded proteins were downloaded utilizing Protein Data Bank (PDB)7 (Berman et al., 2000), and saved as protein PDB format files. 2D structures of drugs were obtained from the PubChem database8 (Kim et al., 2023), and saved in SDF format, OpenBabel software was applied to convert them to PDB format for small molecule ligands. Next, water molecules and original ligands were removed by using PyMOL software, and the proteins and small molecules’ PDB files were converted to pdbqt format utilizing AutoDockTools software. Protein receptors and small molecule ligands were docked by AutoDock using.
2.12 External gene set validation
In order to assess biomarkers’ expression levels of between PD and control samples in this study, their expression trends were demonstrated by plotting box plots in GSE22491. Meanwhile, expression levels were further validated in GSE100054.
2.13 Patient sample collection and ethical clearance
We collected blood samples from 5 PD patients and 5 controls from the Second Hospital of Hebei Medical University. This study is consistent with the Declaration of Helsinki. The study involving human participants was reviewed and approved by the Ethics Committee of the Second Hospital of Hebei Medical University, and all included patients signed written informed consent for the study.
2.14 Quantitative real-time polymerase chain reaction
To demonstrate the expression levels of the biomarkers in GSE22491 and GSE100054. Total RNA from the 10 samples was extracted using the TRIzol reagent (Invitrogen, China) according to the manufacturer’s protocol. Afterwards, RNA concentrations were detected with NanoPhotometer N50. Subsequently, cDNA was generated through reverse transcription using SureScript-First-strand cDNA synthesis kit (Servicebio, China). Finally, the qPCR assay was conducted using CFX Connect Thermal Cycler (Bio-Rad, United States). The relative quantification of mRNAs was calculated using the 2-ΔΔCT method. The sequence fragments of RNAs are shown in Table 1.
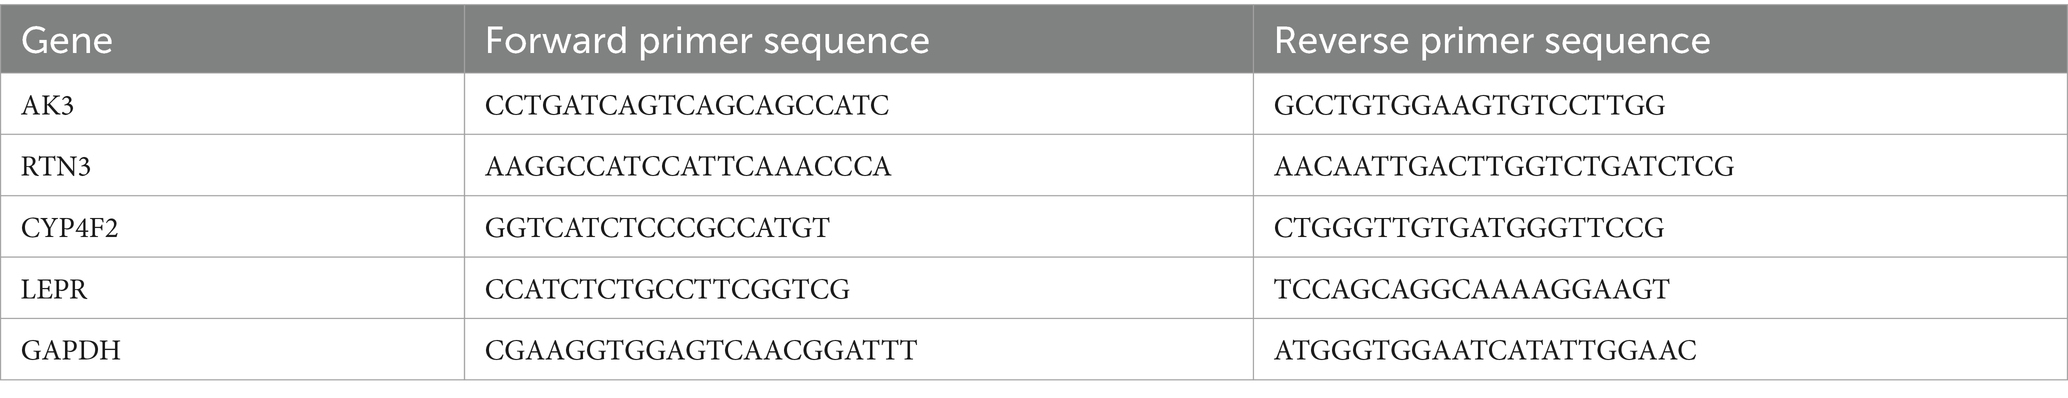
Table 1. PCR primers.
2.15 Statistical analysis
Statistical analysis was carried out through R software (version R-4.2.2).9 Differences between samples were analyzed via Wilcox test and t-test. *p < 0.05, **p < 0.005, ***p < 0.0005; ****p < 0.00005, represented significant difference. In GSEA, judgment standard was adj. p < 0.05. Correlation coefficients and p-values were estimated utilizing Spearman correlation analysis. p < 0.05 was considered statistically significant.
3 Results
3.1 Identification of DEGs
A total of 634 DEGs were yielded between PD and control samples from GSE22491 (Supplementary material S1). Figure 2A shows the volcano map after the differential expression analysis of all genes. The heat map showed the expression and clustering of differentially expressed genes in PD group and control group (Figure 2B). Next, DEGs were analyzed for KEGG and GO enrichment, and the results showed that DEGs were involved in GO terms such as neutrophil-mediated killing of symbiont cell, regulation of vascular permeability, transmission of nerve impulse, regulation of transmission of nerve impulse (Figure 2C). Meanwhile, they were participated in four KEGG pathways containing hematopoietic cell lineage, nitrogen metabolism, neuroactive ligand-receptor interaction, Malaria (Figure 2D). Ultimately, IPA indicated that S100 family signaling pathway, gustation pathway, neutrophil extracellular trap signaling pathway, superpathway of melatonin degradation, erythropoietin signaling pathway and other classical pathways identified based on DEGs were found to be suppressed in PD (Figure 3A). Additionally, A Regulatory network of biomarkers was constructed, in which factors indirectly associated with biomarkers including Viral infection (disease-related), Cell movement (cell-related), angiogenesis (cell-related), NPM1 (TF), FOXM1 (TF), NSUN6 (gene), EGFR (chemical compound), etc., where NPM1 could indirectly inhibit FOXM1 (Figure 3B). Diseases and functional pathways identified based on DEGs including increases cardiac dilation, cardiac fibrosis, liver proliferation, increases liver hyperplasia/hyperproliferation, cytochrome p450 panel-substrate is an eicosanoid (human), etc., all of which were found to be suppressed in PD (Figures 3C,D).
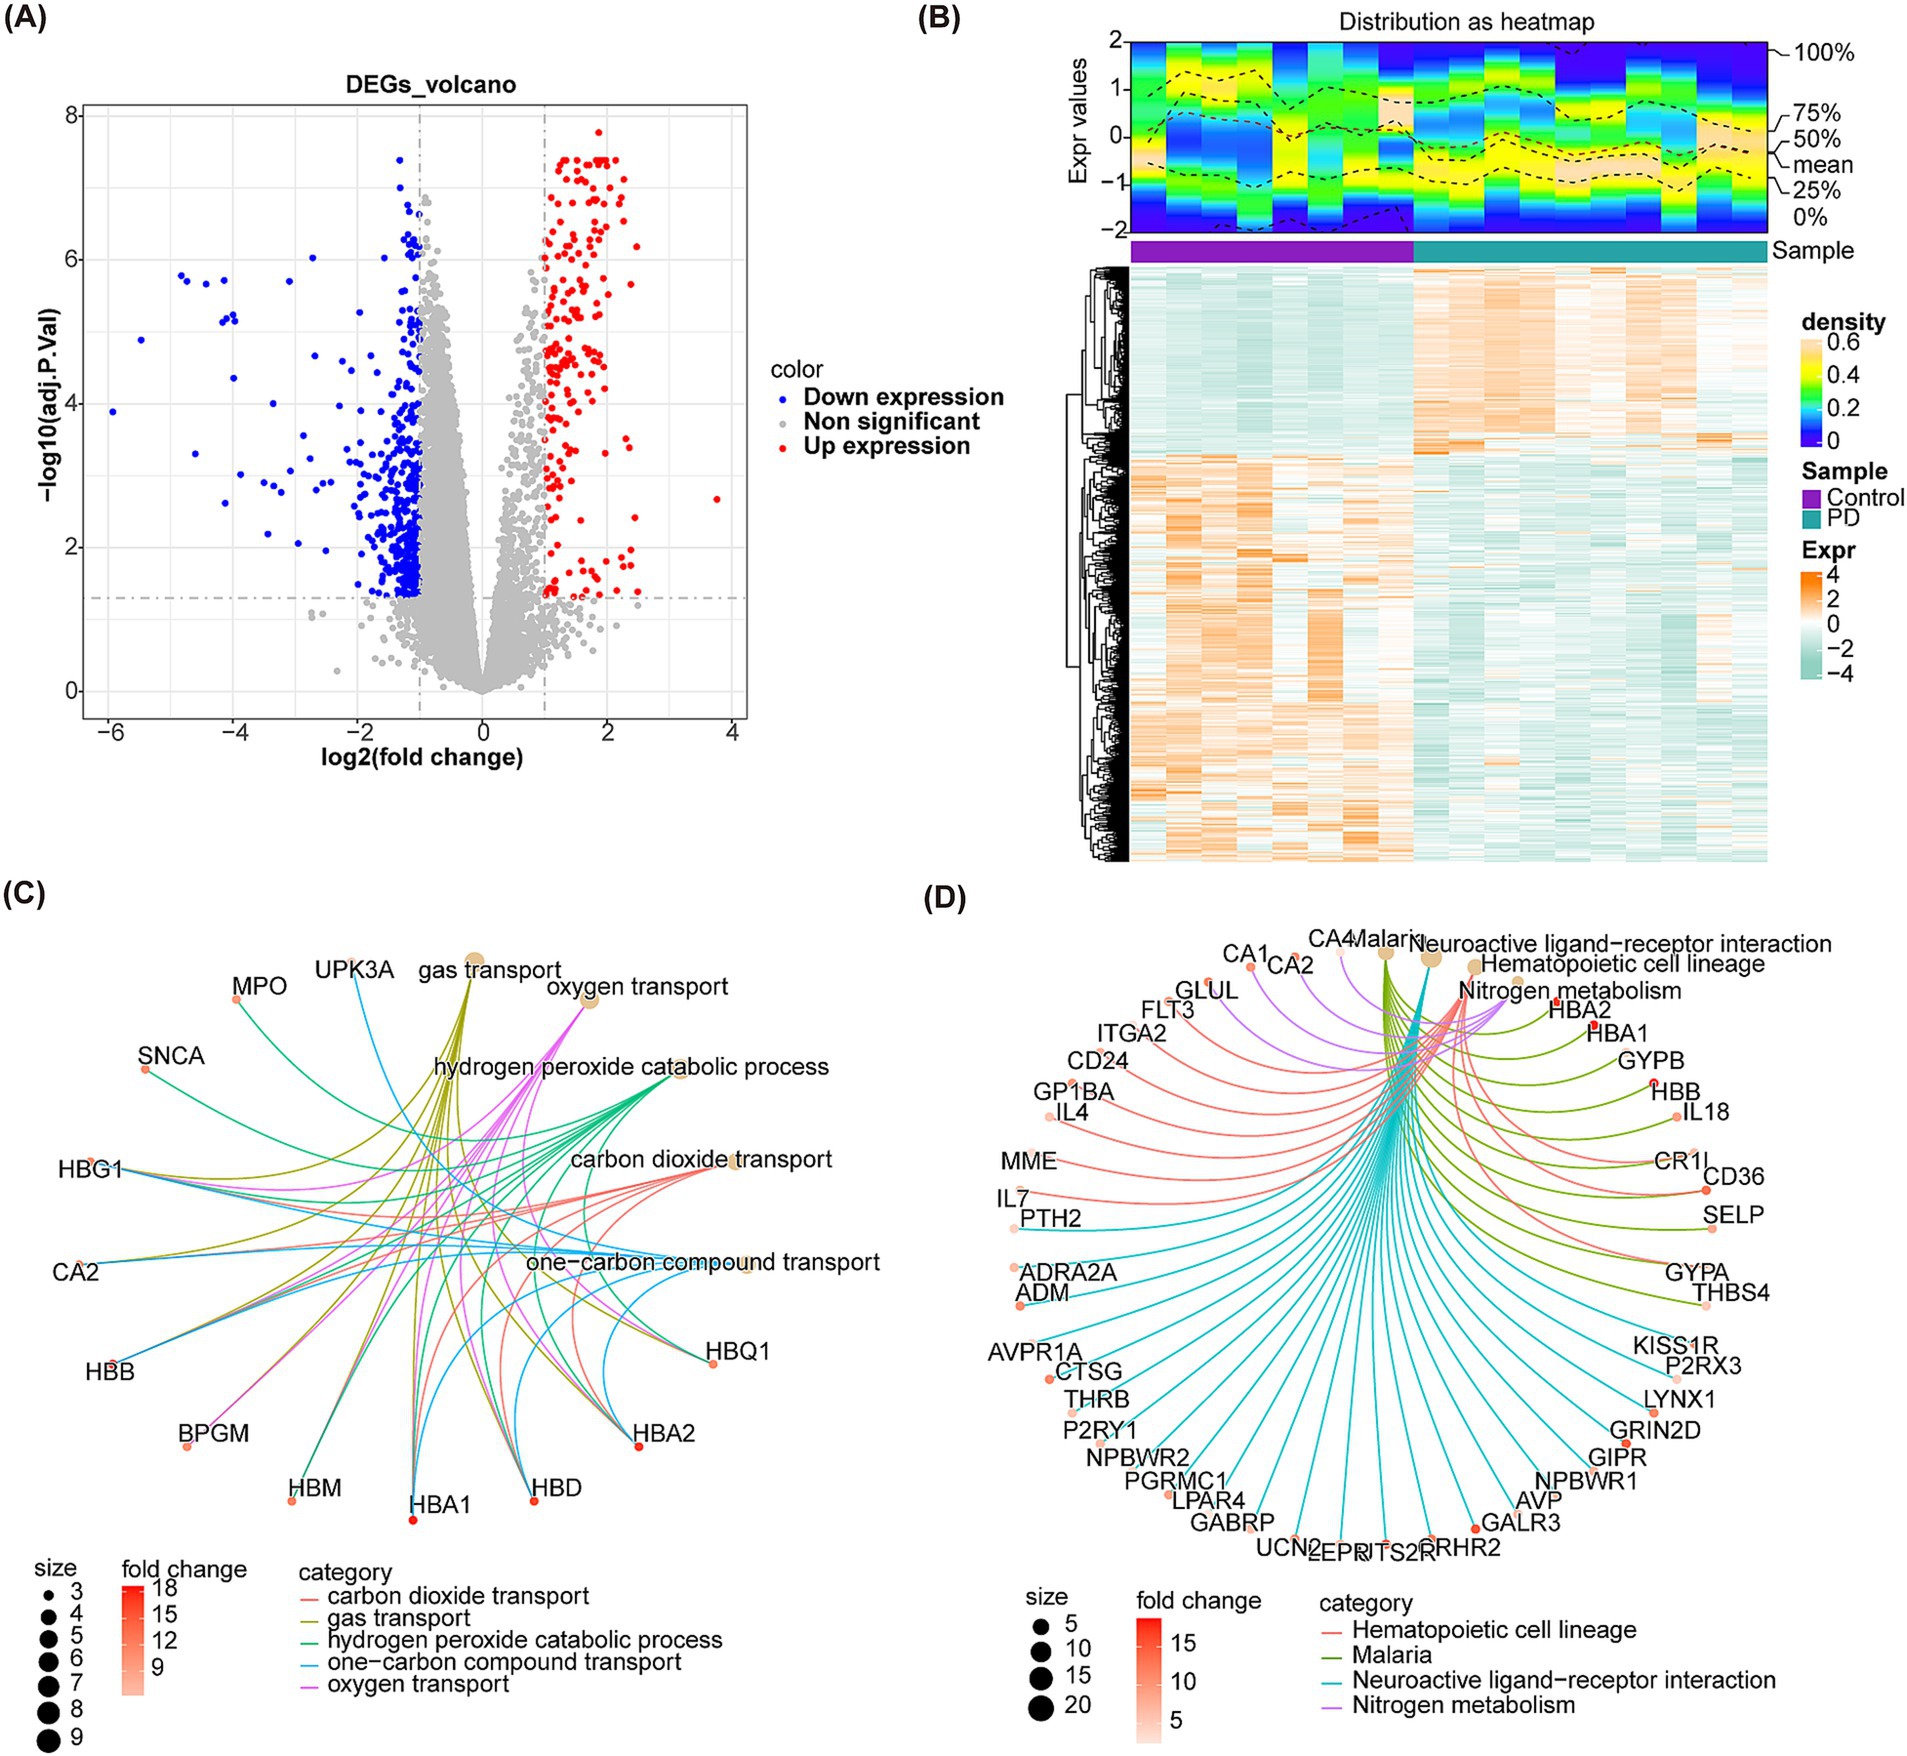
Figure 2. Identification of DEGs and enrichment of DEGs. (A) Volcano plot of differential expression analysis. The red dots represent up-regulated genes and the blue dots represent down-regulated genes. (B) Heatmaps of expression clusters for all genes in PD and control groups. Green represents down regulation, and orange represents up regulation. (C) The diagram shows GO enrichment of DEGs. (D) The diagram shows KEGG enrichment of DEGs.
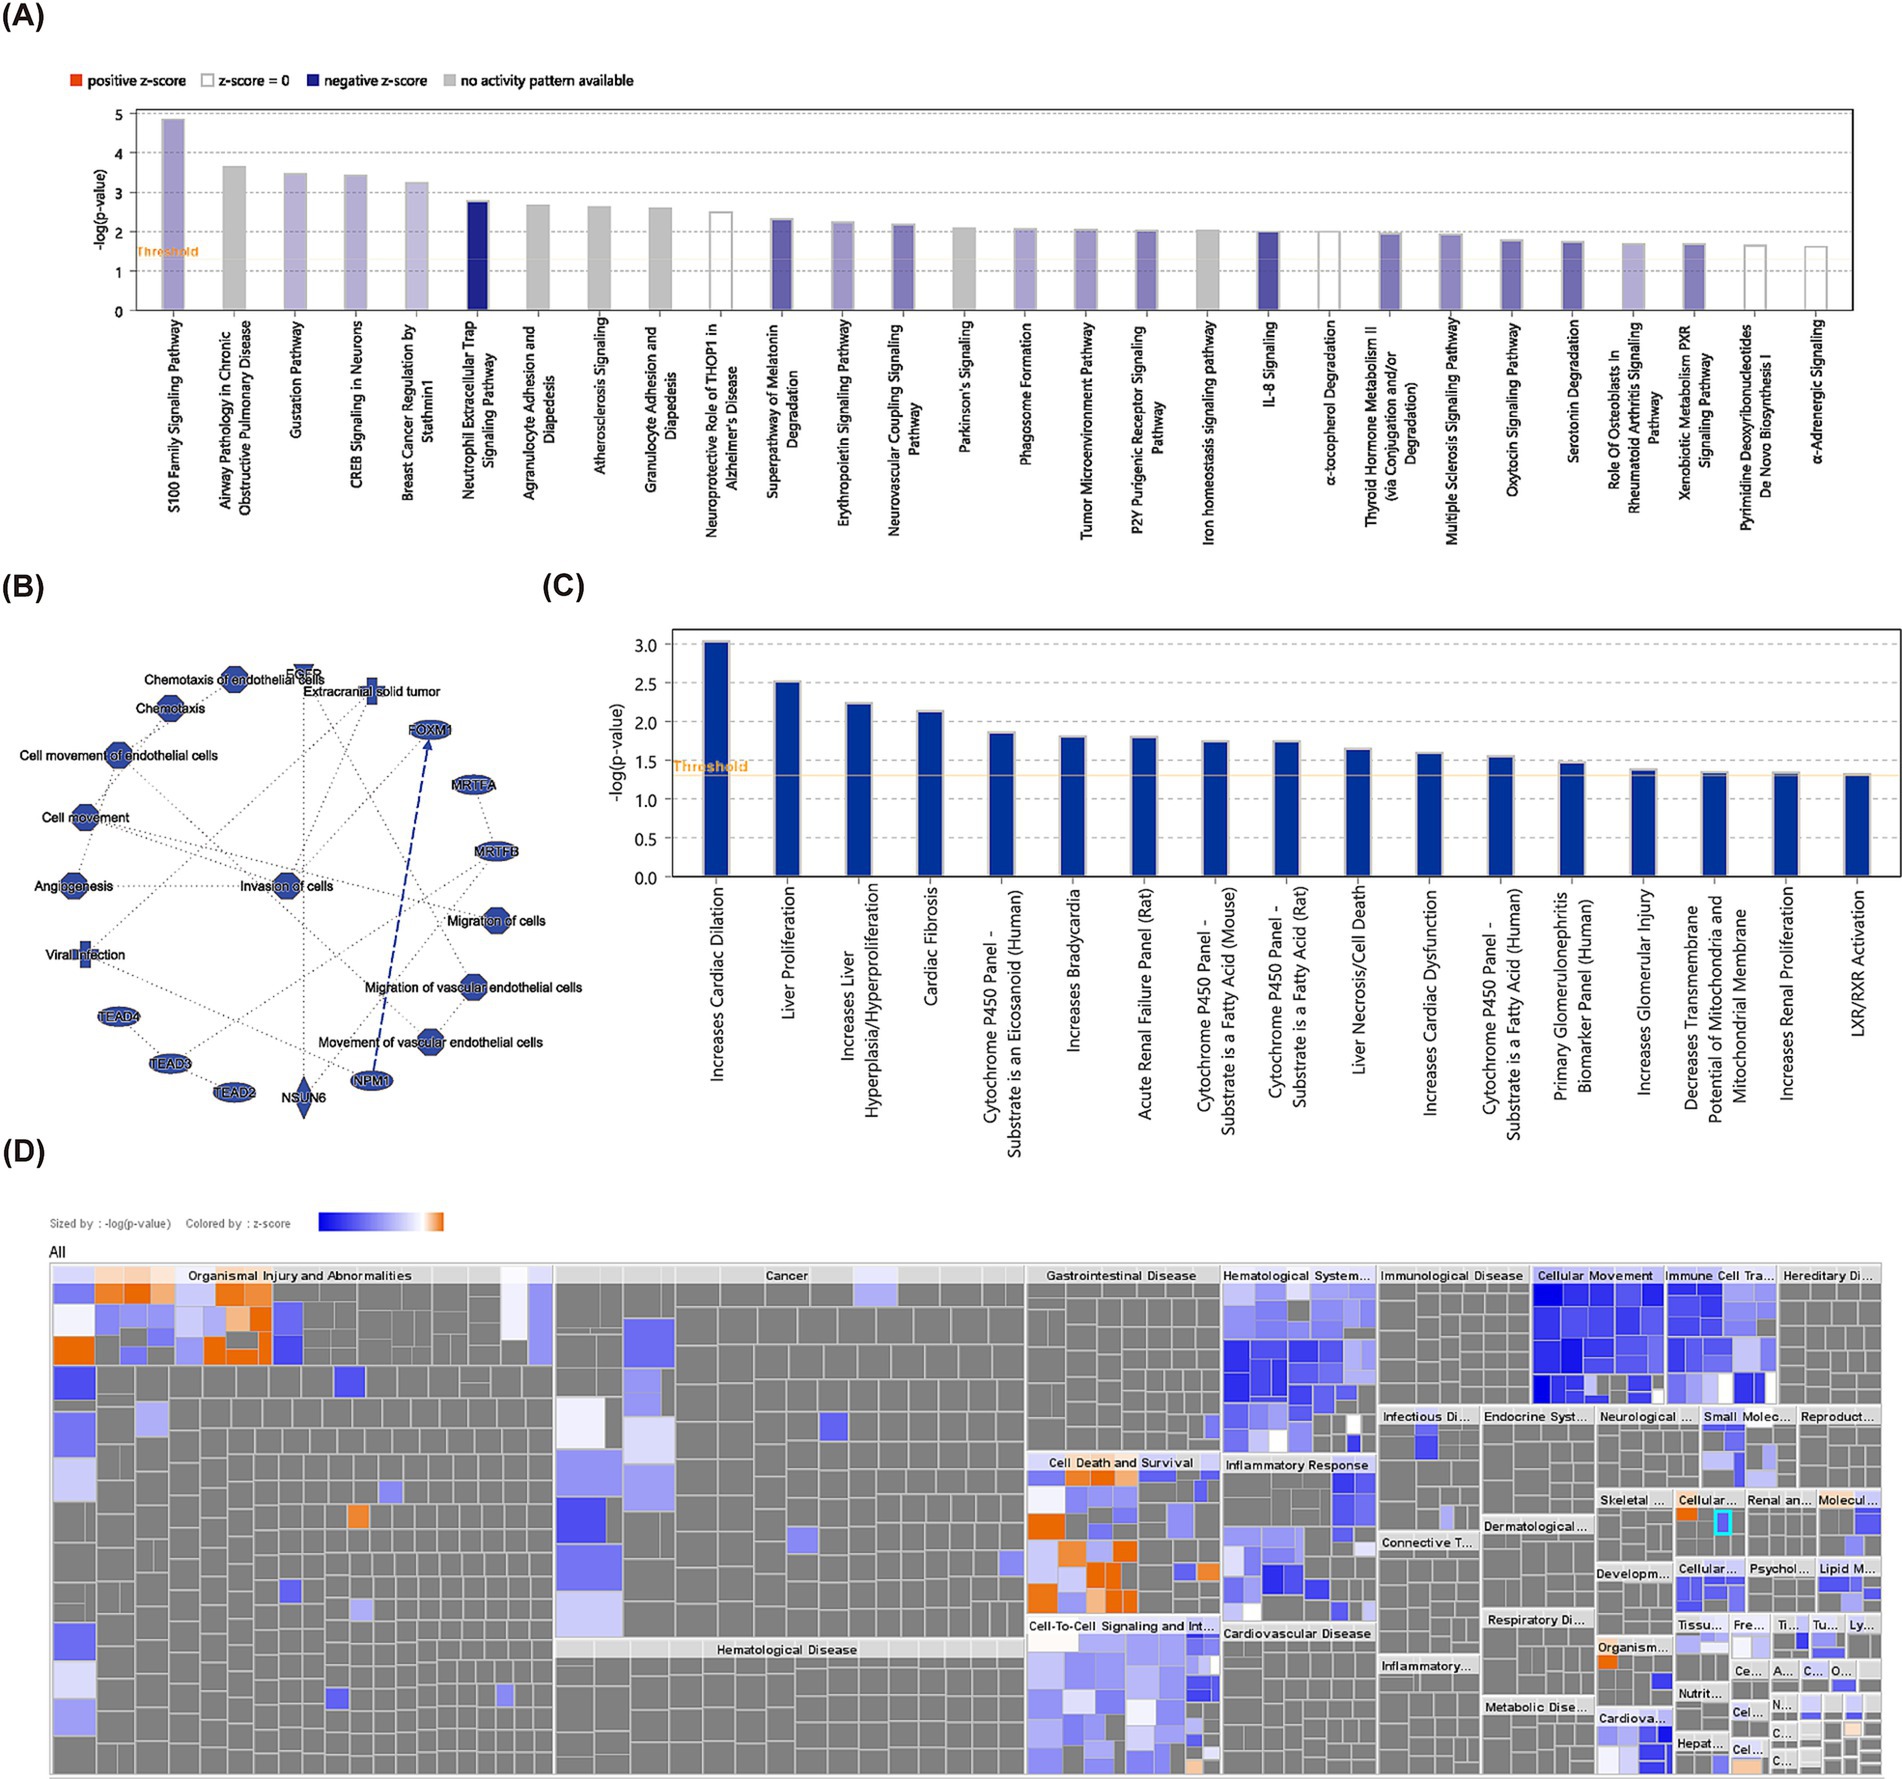
Figure 3. IPA analysis. (A) Classical pathway analysis using IPA in GSE22491 revealed enriched pathways for differentially expressed genes. (B) Biomarker regulatory network. (C) Disease function bar graph of differentially expressed genes in GSE22491. (D) Disease function items of differentially expressed genes.
3.2 Screening for key module
Subsequently, the R package “WGCNA” was used to check the clustering outliers of the samples. The results show that general clustering of samples in GSE22491 was good, thus there was no need to exclude samples (Figure 4A). A soft threshold was chosen as 13 because vertical coordinate R^2 approached 0.85 at this time (Figure 4B). Next, totally 24 merged modules were finally sifted out (Figure 4C). Figure 4D shows the correlation heat maps of all the genes in these 24 modules. MEgreen module was highly correlated with PD (Cor = 0.92, and p < 0.05), therefore, it was defined as the key module containing 1,144 genes (Figure 4E). There is high correlation between Module Membership (MM) and Gene Significance (GS) (Cor = 0.5, and p < 0.05) (Figure 4F). Taking intersection of DEGs, C-genes and genes in the key module resulted in 18 DECGs (Figure 5A). Figure 5B illustrated localization of DECGs on chromosomes, where the most of genes were localized on chromosome 7, including TPST1, HEPACAM2 and CNTNAP2. Enrichment analyses showed that DECGs were enriched in GO entries, including positive regulation of angiogenesis, purine ribonucleoside bisphosphate metabolic process, and 3′ − phosphoadenosine 5′ − phosphosulfate metabolic process, etc. (Figure 5C; Supplementary material S2). They were also engaged in Neuroactive ligand−receptor interaction, Purine metabolism, Biosynthesis of cofactors and other KEGG pathways (Figure 5D; Supplementary material S3). Ultimately, there had notably negatively correlations among CYP4F2, FHIT, RTN3, LYNX1, and ANGPT2 (Figure 5E).
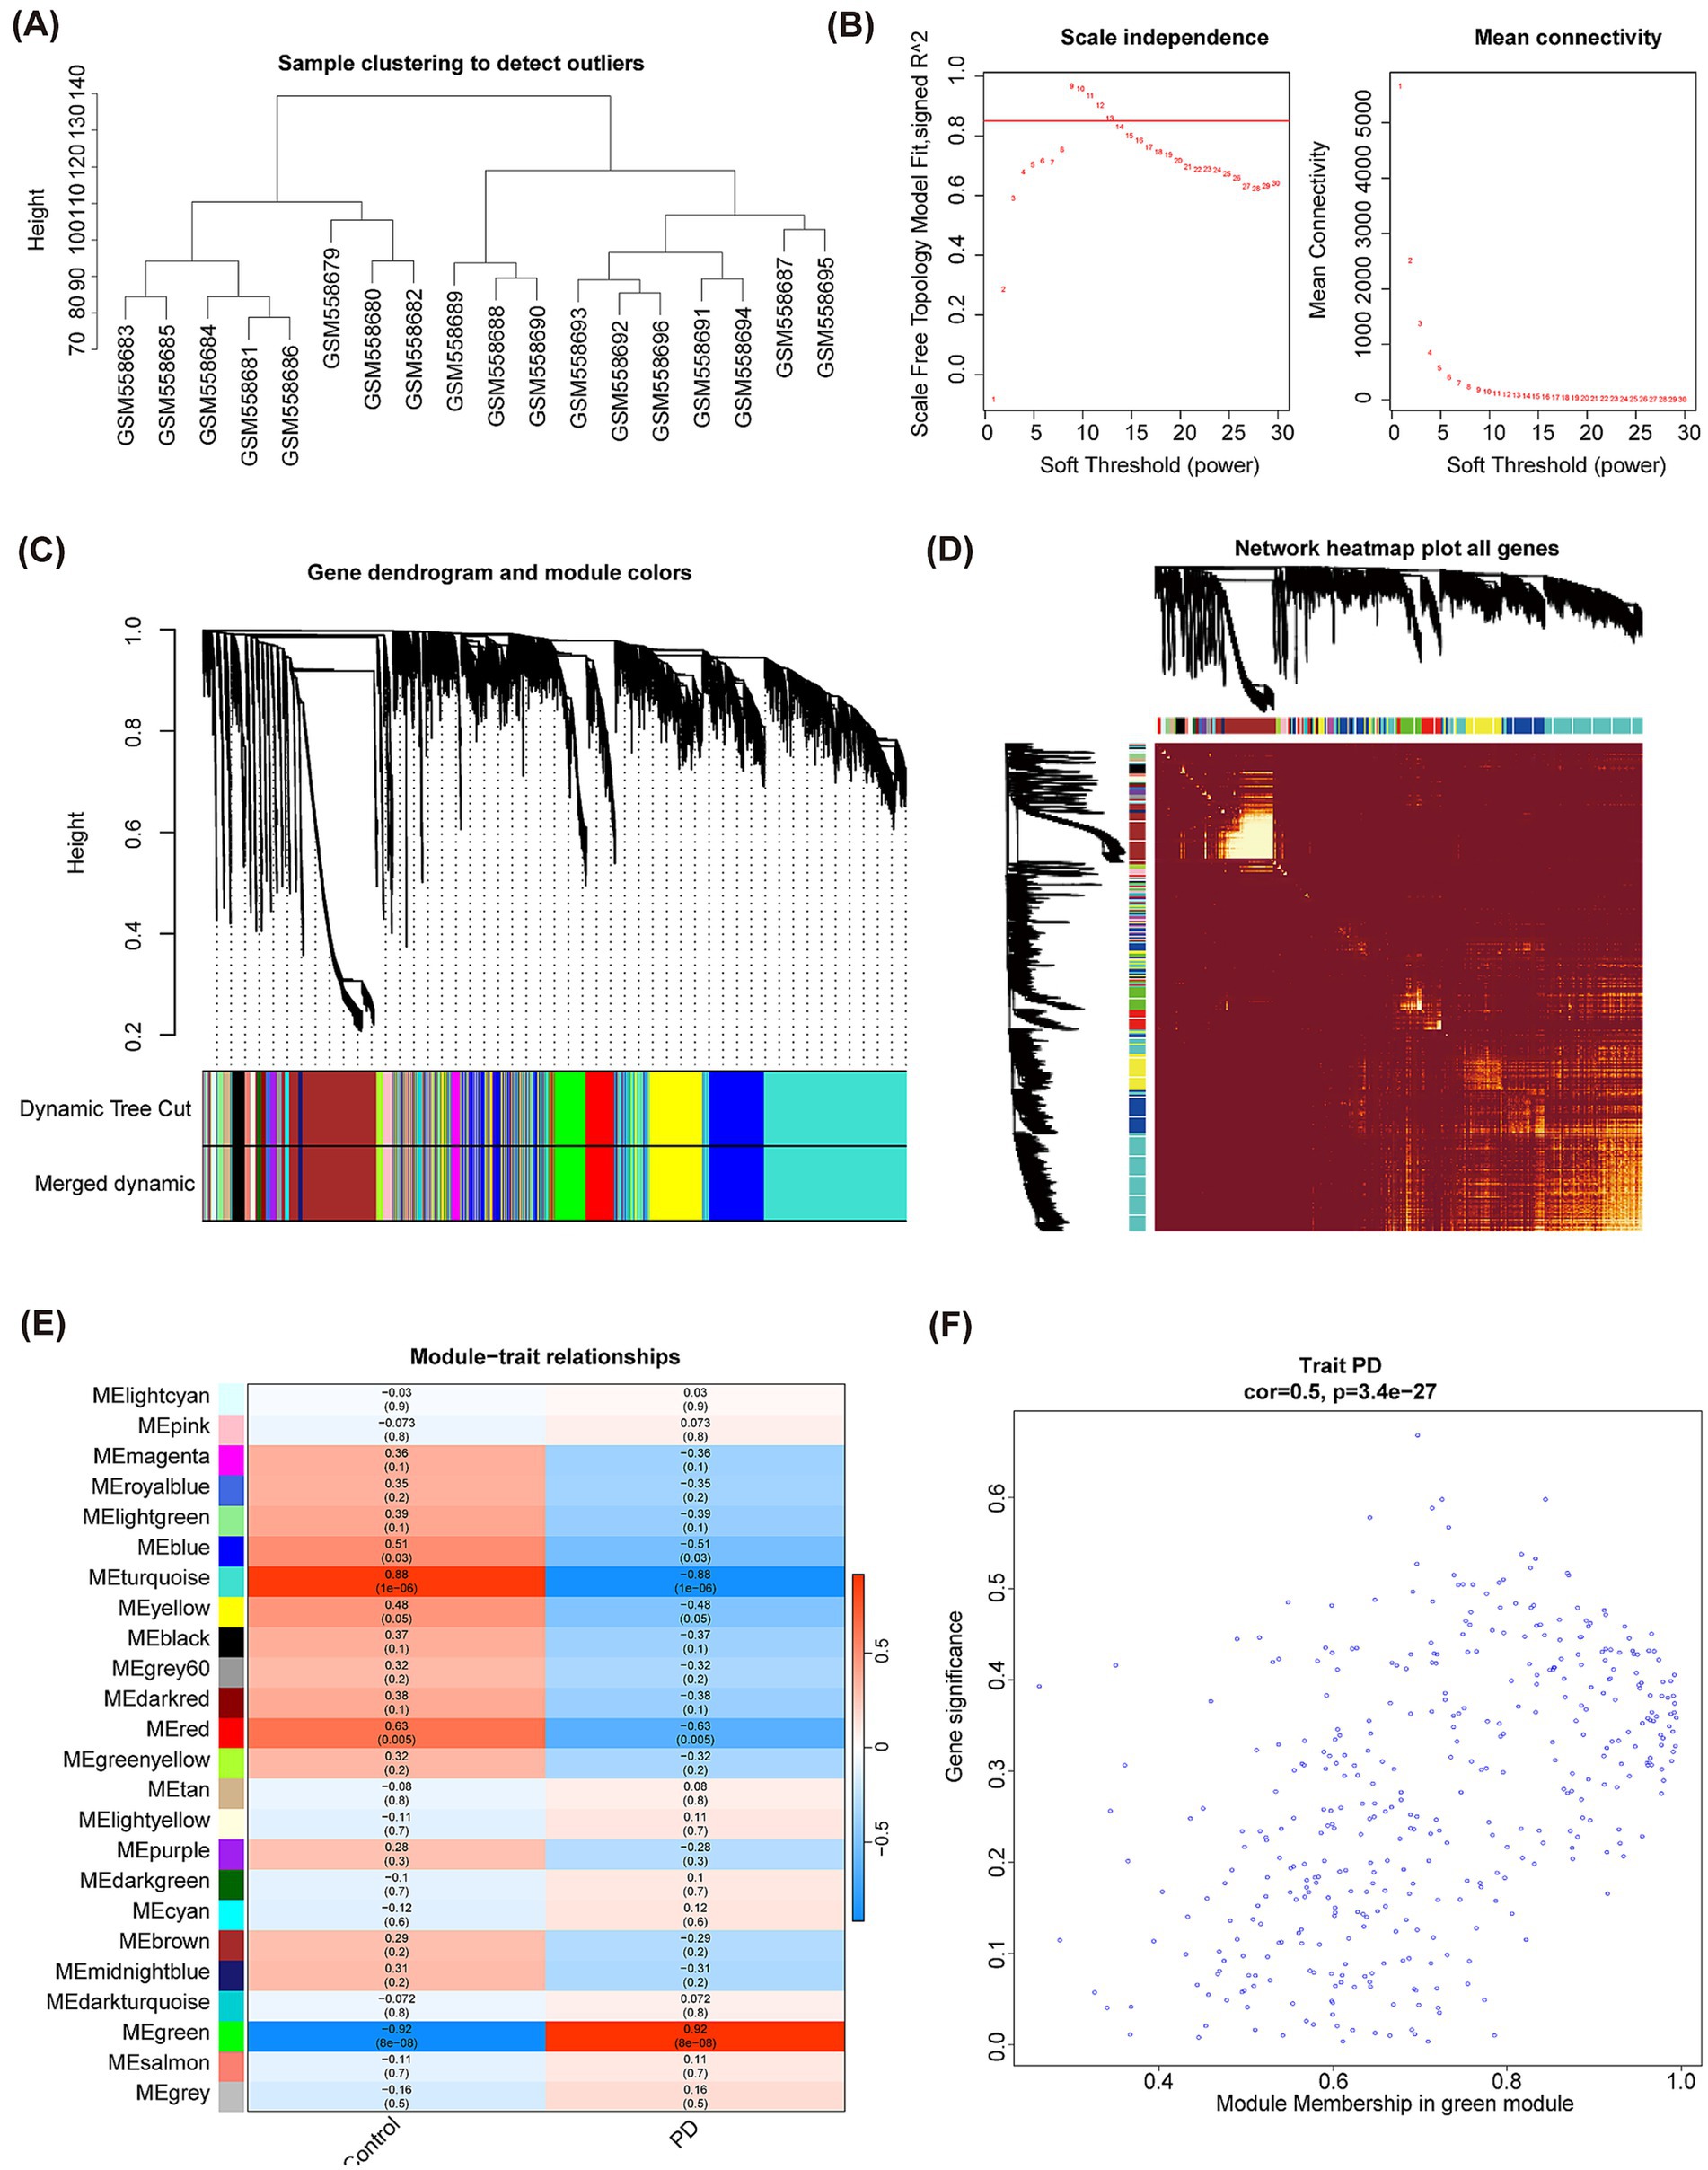
Figure 4. WGCNA analysis of GSE22491 and acquisition of key module. (A) Sample clustering tree diagram. (B) The selection of soft threshold power. (C) A tree diagram based on hierarchical clustering is generated. Different hues reflect different modules of co-expression. (D) Heatmap of correlation between different genes. (E) Correlation analysis between modules and PD clinical status. Blue represents negative correlation, and orange represents up positive correlation. A number inside a square shows the degree of statistical significance. (F) GS vs. MM correlation scatterplot of green module.
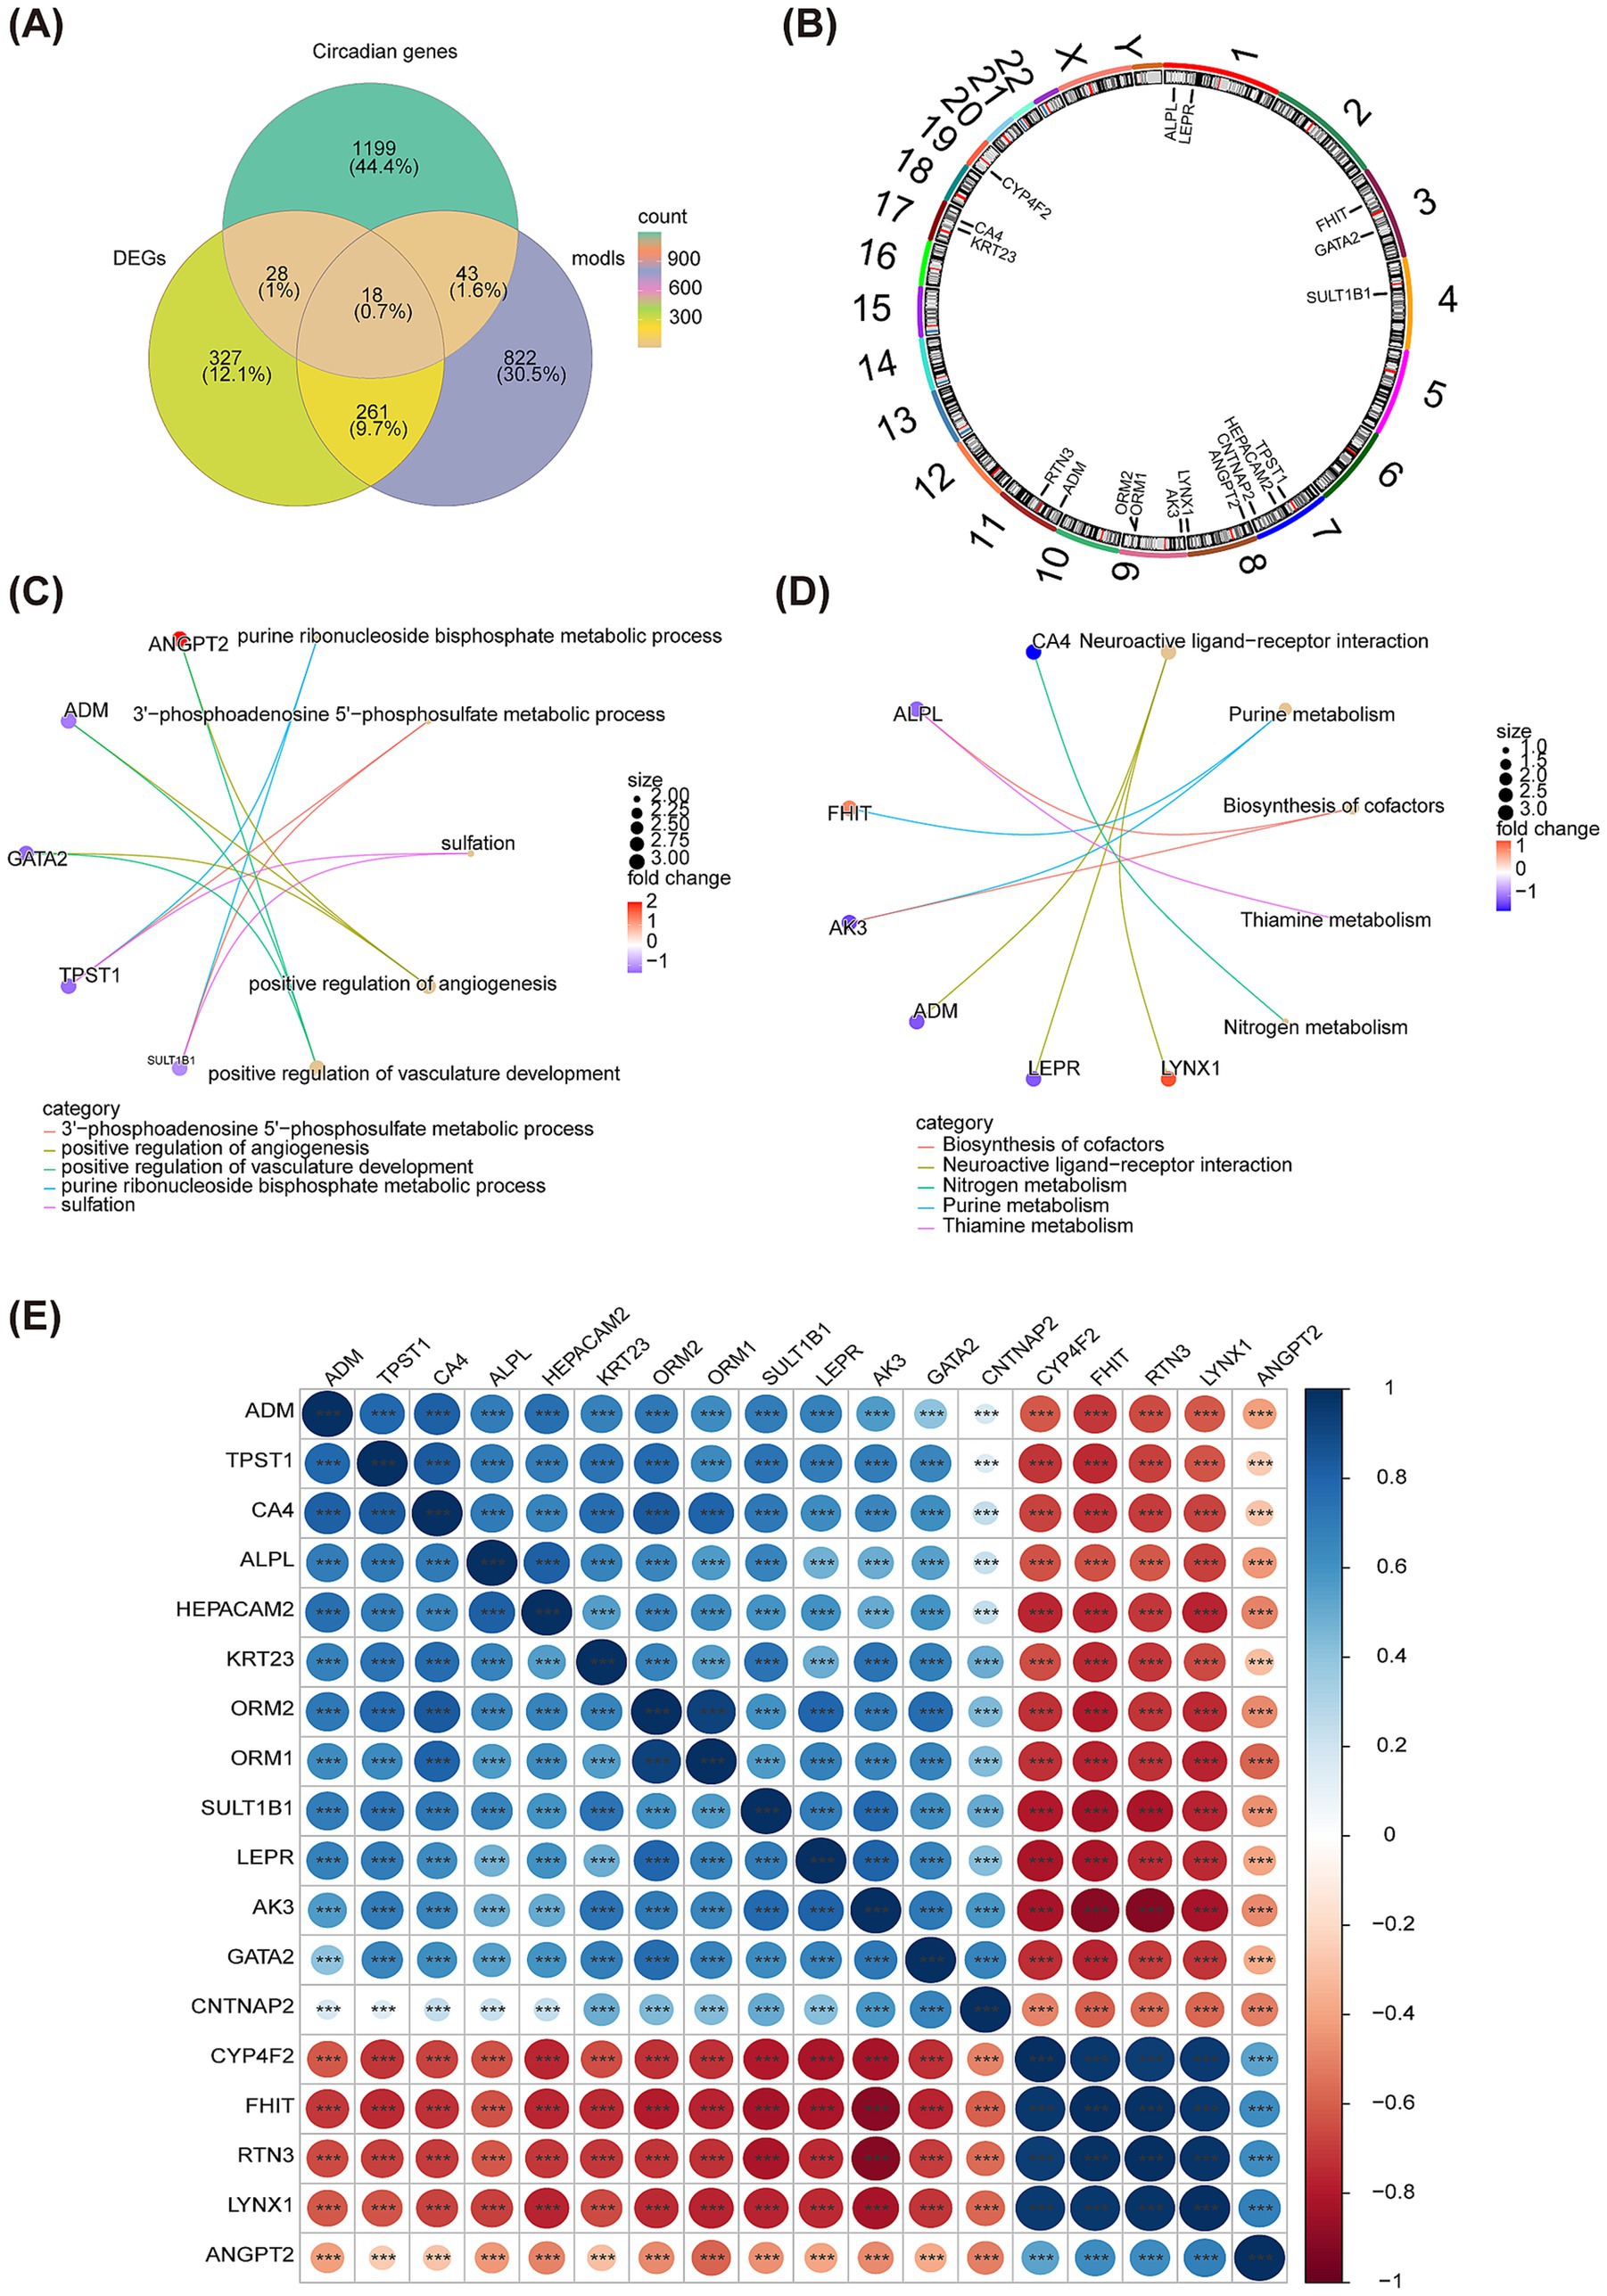
Figure 5. Identification of DECGs. (A) The Venn diagram shows the intersection of the green module genes of WGCNA and DEGs and C-genes. (B) The diagram shows the localization of DECGs on chromosomes. (C) The chordal graph shows GO enrichment of DECGs. (D) The chordal graph shows KEGG enrichment of DECGs. (E) Correlation heat map of DECGs. Red represents negative correlation, and blue represents positive correlation. *p < 0.05; **p < 0.01; ***p < 0.001; ****p < 0.0001.
3.3 Biomarkers had terrific ability for distinguishing PD from control samples
To identify biomarkers, we screened 18 circadian rhythm-associated differential genes by the Lasso model, when lambda = 0.0046, error rate was the lowest, and five genes (AK3, RTN3, CYP4F2, LEPR, and HEPACAM2) were obtained at this point (Figure 6A). Four genes (AK3, RTN3, CYP4F2, and LEPR) were also yielded via SVM-RFE (Figure 6B). Four critical genes, namely AK3, RTN3, CYP4F2, and LEPR, were identified after taking intersection of genes obtained by LASSO and SVM-RFE (Figure 6C). In GSE22491 and GSE100054, AUC values of AK3, RTN3 and LEPR all exceeded 0.7, indicating that they had terrific ability for distinguishing PD from control samples, thus they were defined as biomarkers (Figure 6D). Corners of ROC curve indicated optimal critical value point, with the values in parentheses Specificity and Sensitivity, respectively. It could be seen that sensitivity and specificity of optimal critical value points in all ROC curves were high [AK3 (1,1), RTN3 (1,1), CYP4F2 (1,1), and LEPR (1,0.9)], and false positives and false negatives were also the least, which indicated that AUC of ROC curve was the most desirable examination index at this time. Additionally, C-index of nomogram was 1, suggesting that diagnostic model had a nice ability for predicting PD patients. In calibration curve, “Apparent,” “Bias−corrected,” and “Ideal” curves were almost coincident, and their slopes were closed to 1, suggesting that diagnostic model could prediced PD patients accurately, AUC of diagnostic model was 1 further validated that it could prediced PD patients well, DCA curve showed that nomogram curve was higher than ALL and None curves, indicating that the diagnostic model could be applied to PD patients (Figures 6E–H).
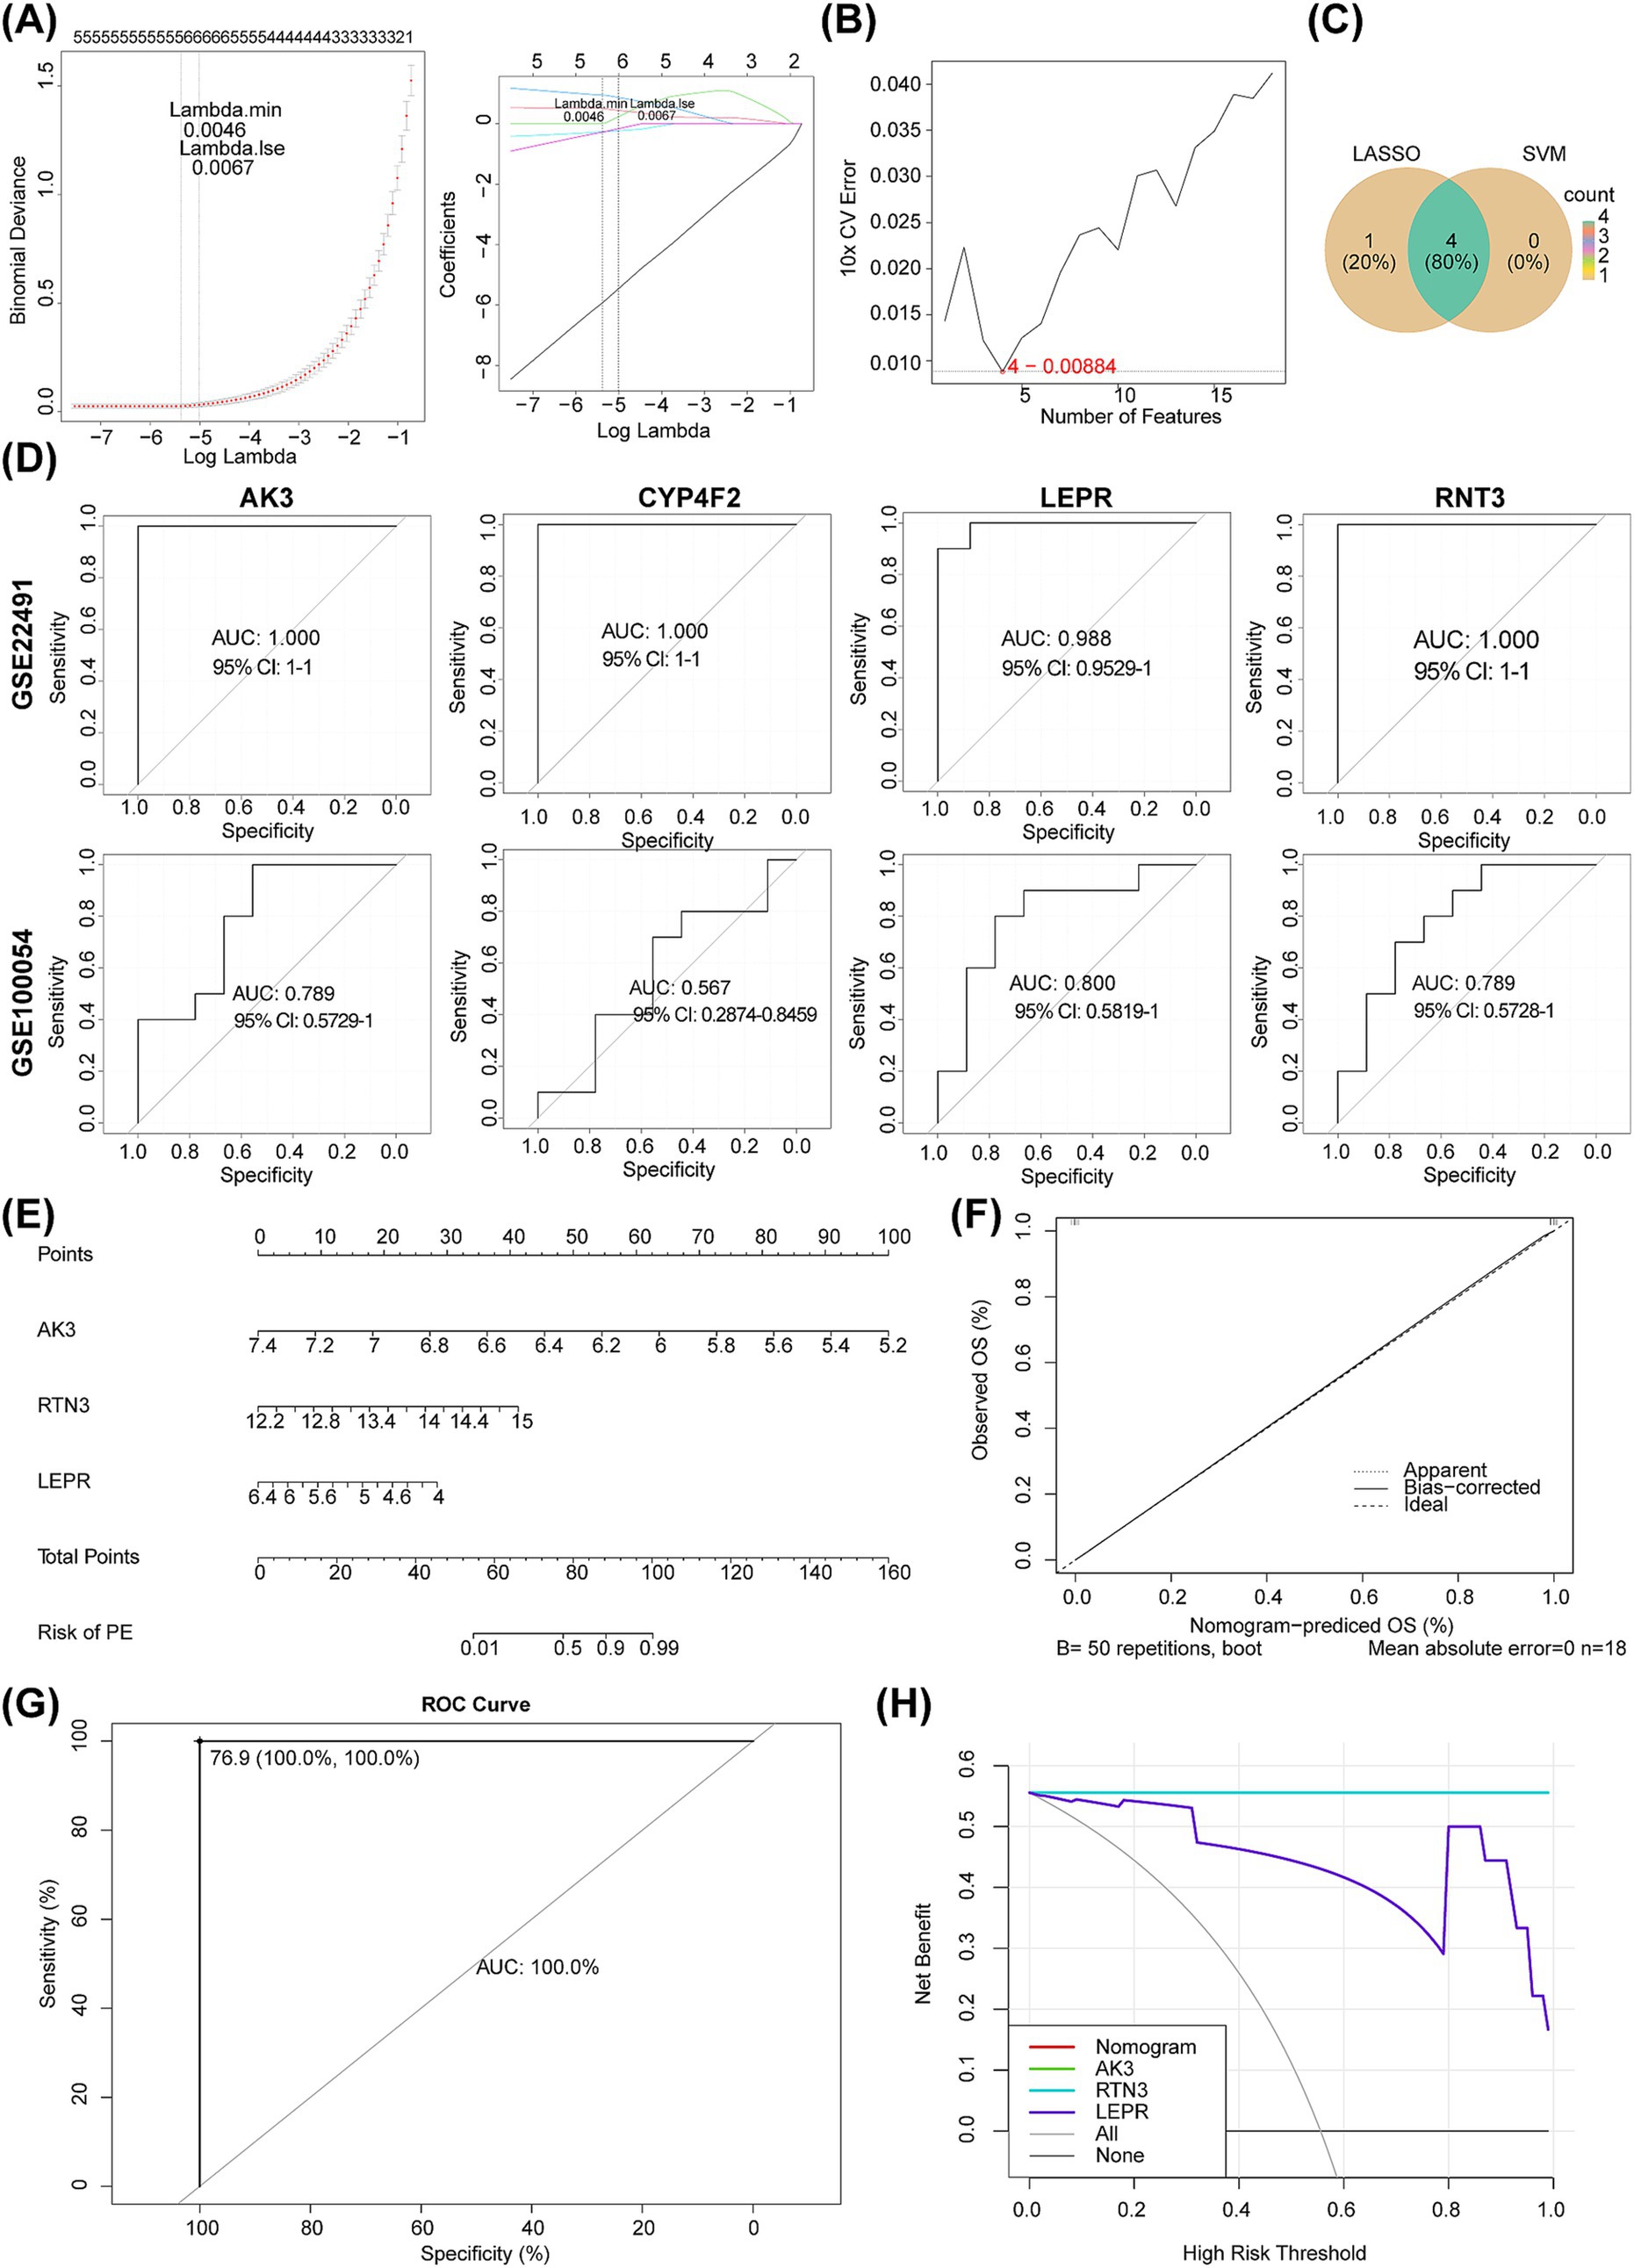
Figure 6. Identification of molecular biomarkers determined by machine learning and evaluation of their diagnostic value. (A) LASSO regression analysis. (B) SVM machine learning analysis. (C) The Venn diagram shows the LASSO regression analysis and SVM machine learning analysis results. (D) ROC curves of AK3, RTN3, CYP4F2 and LEPR in GSE22491 and GSE100054. (E–H) The nomogram, calibration curve, prediction model ROC curve and decision curve analysis of GSE22491 were performed.
3.4 Biomarkers were associated with PD related pathways
For exploring functional pathways involved in biomarkers, GSEA was carried out. KEGG enrichment results showed that AK3 positively regulated SPLICEOSOME, RIBOSOME, CELL_CYCLE and CITRATE CYCLE TCA_CYCLE pathways and negatively regulated MATURITY ONSET DIABETES OF THE_YOUNG pathway. The RTN3 negatively regulated the CELL_CYCLE, SPLICEOSOME, PARKINSONS_DISEAS, UBIQUITIN_MEDIATED PROTEOLYSIS and PATHOGENIC ESCHERICHIA_COLLINFECTION pathways. The LEPR positively regulated the PARKINSONS DISEASE, OXIDATIVE_PHOSPHORYLATION, SPLICEOSOME, ALZHEIMERS DISEASE and HUNTINGTONS DISEASE pathways (Figure 7A). Meanwhile, pancreas beta cells, apical surface, hedgehog signaling, kras signaling, heme metabolism, oxidative phosphorylation and other hallmark pathways were simultaneously and differentially enriched in high/low expression groups for each biomarker (Figure 7B).
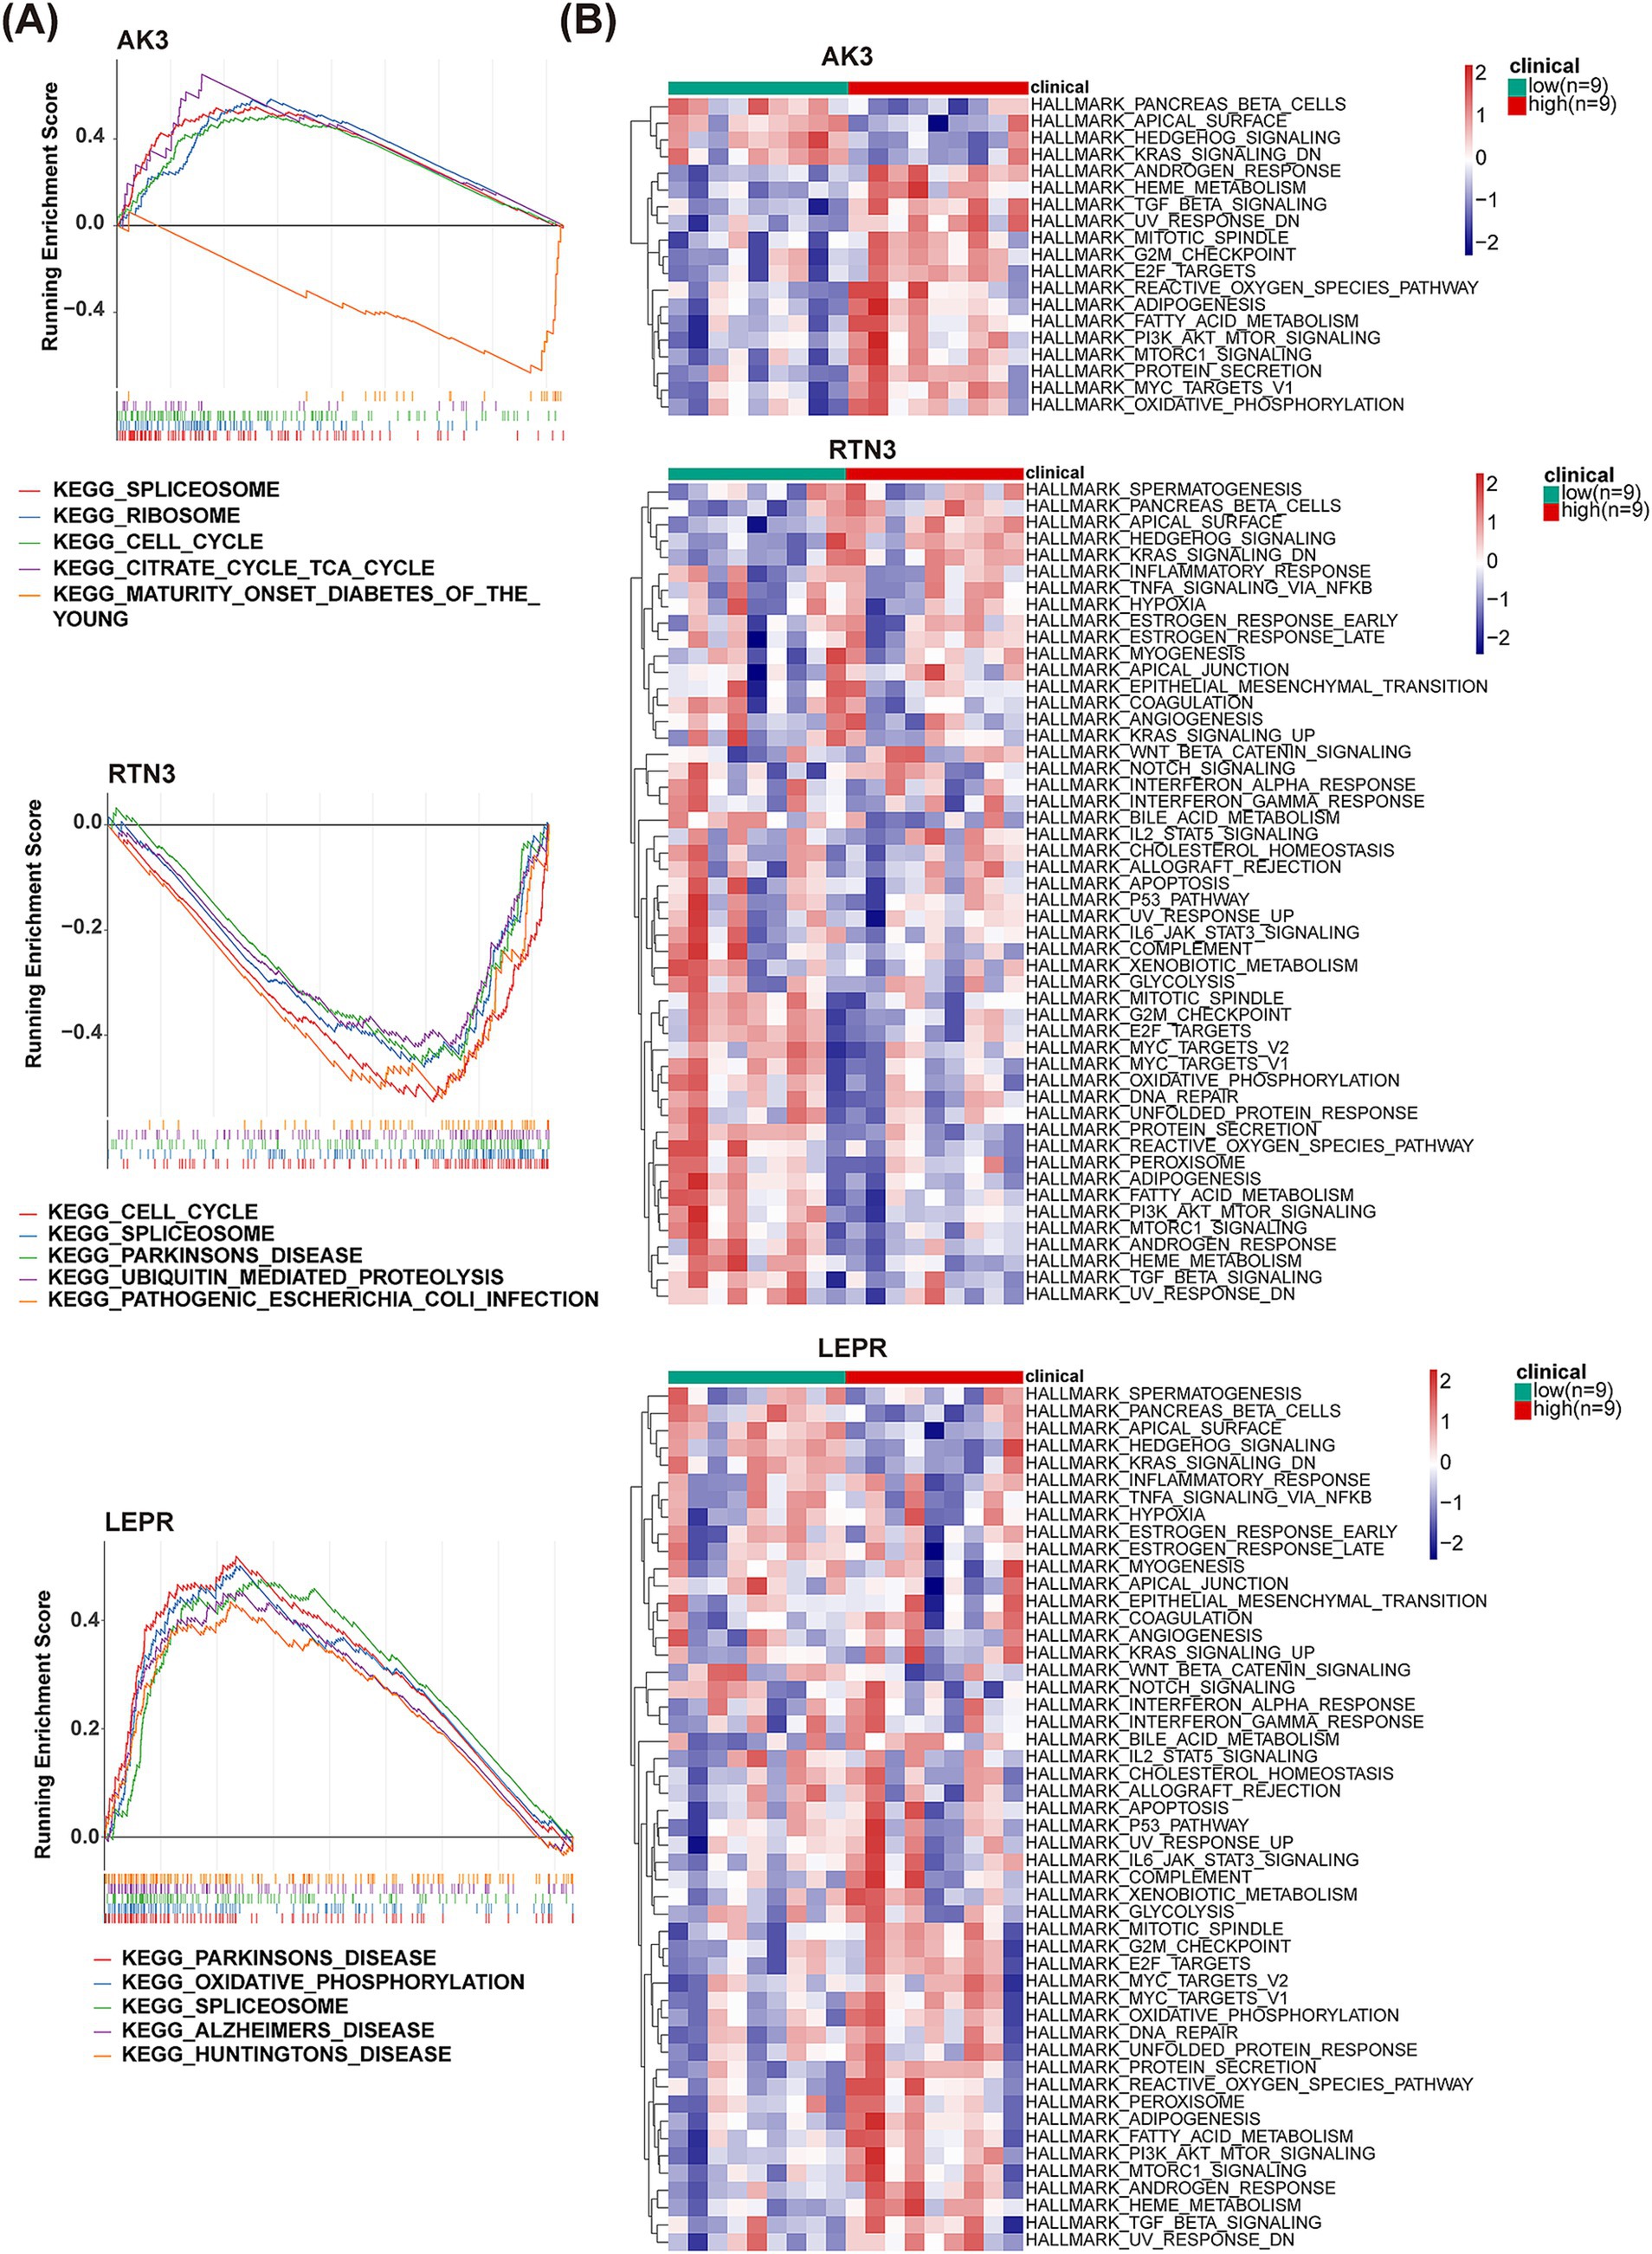
Figure 7. GSEA and GSVA analysis of AK3, RTN3 and LEPR. (A) GSEA analysis results of AK3, RTN3 and LEPR. (B) GSVA analysis heatmap of AK3, RTN3 and LEPR.
3.5 Biomarkers was important for PD’s immune microenvironment
Next, we used CIBERSORT to assess the relative abundance of 22 immune cells per sample in the training set GSE22491. It could be seen from the stacked plot that the monocytes occupied a relatively high proportion in GSE22491 samples (Figure 8A). Besides, the highest positive correlation was found between M1 macrophages and resting dendritic cells (Cor = 1, p < 0.05) (Figure 8B). The box plot revealed notable differences in the proportion of M0 macrophages, naive B cells, activated NK cells, resting mast cells, monocytes, between PD and control samples, except the activated NK cells, the other four immune cell types were highly expressed in control samples (Figure 8C). Apparently, LEPR was strongly negatively correlated with activated NK cells (Cor = −0.65, p < 0.05) (Figure 8D).
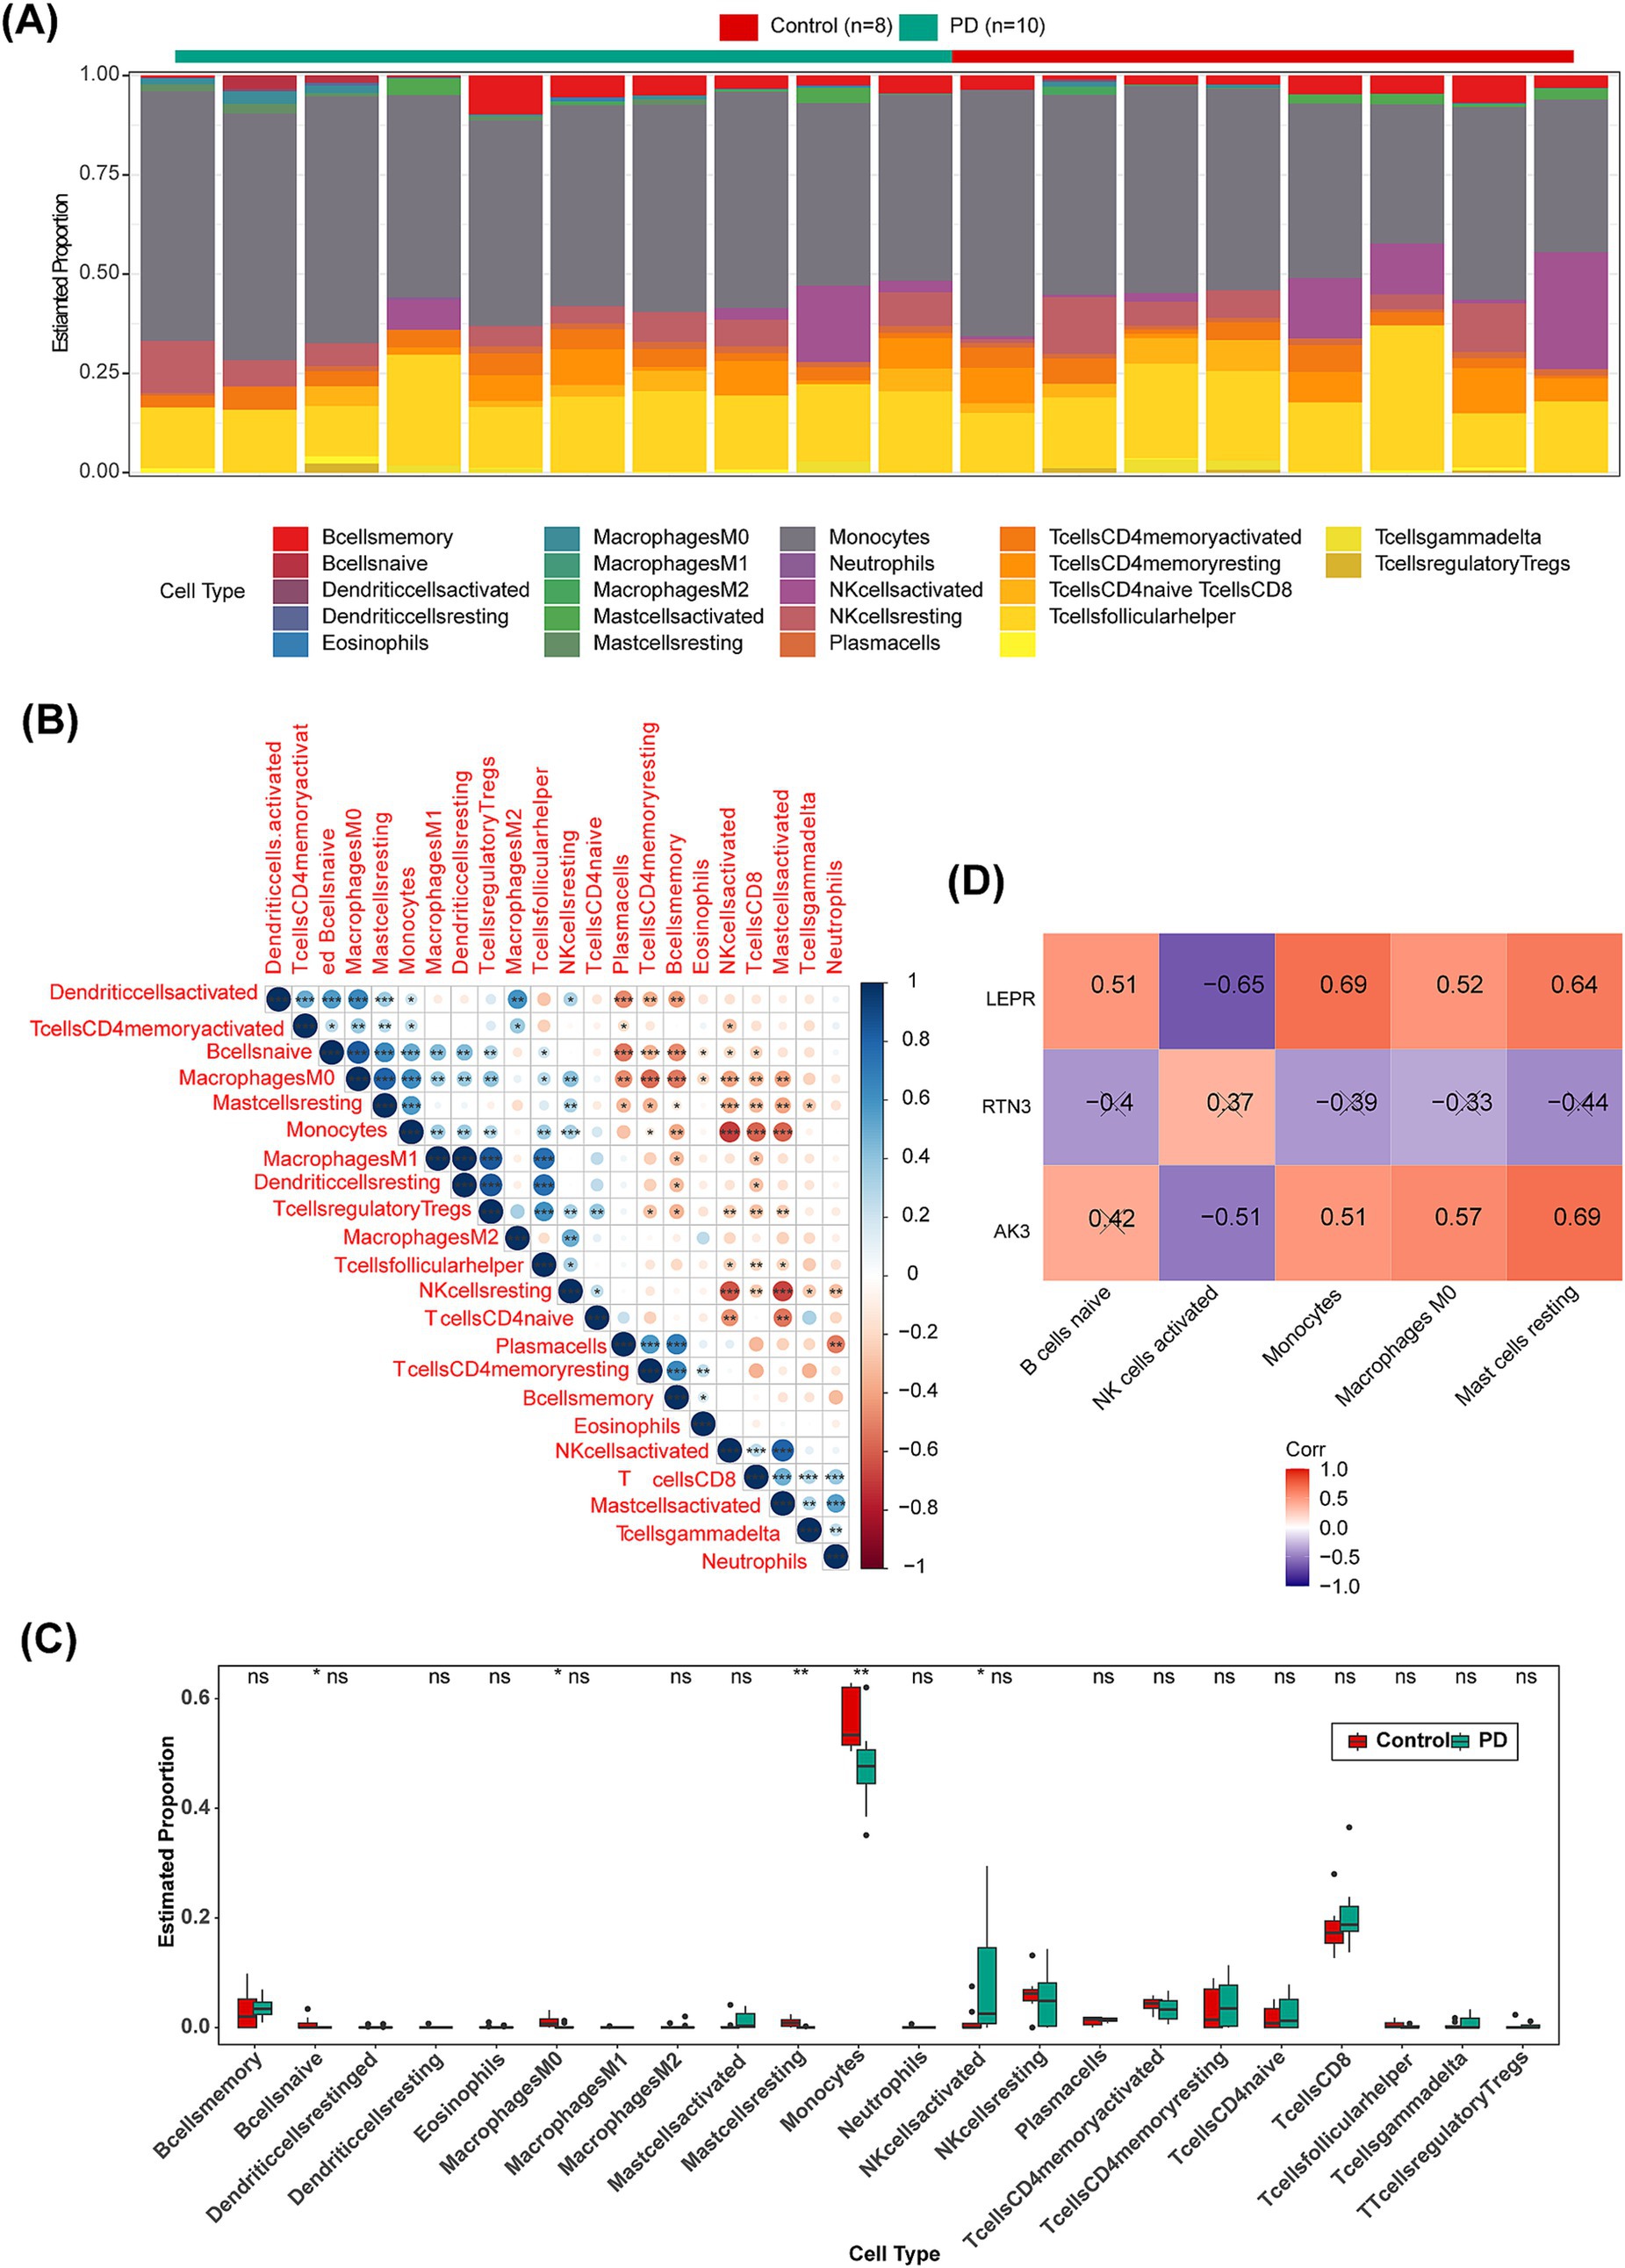
Figure 8. Immune infiltration analysis of GSE22491. (A) Distribution of 22 kinds of immune cells in PD and control groups. (B) Correlation analysis and heat map of 22 immune cells. Red represents negative correlation, and blue represents positive correlation. (C) Boxplot of infiltration of 22 immune cells in PD and control groups. (D) Heat map for correlation analysis of biomarker (AK3, RTN3 and LEPR) and five immune cells (B cells naïve, NK cells activated, Monocytes, Macrophages M0 and Mast cells resting). “דmeans statistically significant. *p < 0.05; **p < 0.01; ***p < 0.001; ****p < 0.0001; ns = no significance.
3.6 The GeneMANIA, ceRNA, and mRNA-miRNA-TF networks
A total of 20 genes associated with biomarkers were predicted through GeneMANIA database, and they were involved in 7 pathways. Among these pathways, LEP, RTN4, APOD, ZFYVE27, SOD1, and LEPR collectively played a role in developmental growth (Figure 9A). AK3, LEPR, and RNT3, respectively, correspond to 10, 5, and 4 intersected miRNAs targeting them (Figure 9B). In the ceRNA network, there was a phenomenon where one lncRNA simultaneously regulated multiple miRNAs at the same time was existed. For example, MALAT1 could simultaneously target hsa-miR-1-3p, hsa-miR-205-5p, etc., while NEAT1 could simultaneously target hsa-miR-181a-5p, hsa-miR-181b-5p, etc. (Figure 9C). The ceRNA network related information of the three molecular markers is shown in Table 2. Besides, AK3, LEPR, and RNT3 were, respectively, corresponded to 13 TFs, 8 TFs, and 30 TFs (Table 3). Among these TFs, CTCF could regulate both AK3 and RNT3, MYOG could simultaneously regulate AK3 and LEPR, and ZNF143 could regulate LEPR and RNT3 at the same time. Furthermore, an mRNA-miRNA-TF network containing relationship pairs such as PAX5-AK3, GATA2-LEPR, FOXP2-RTN3 was constructed (Figure 9D).
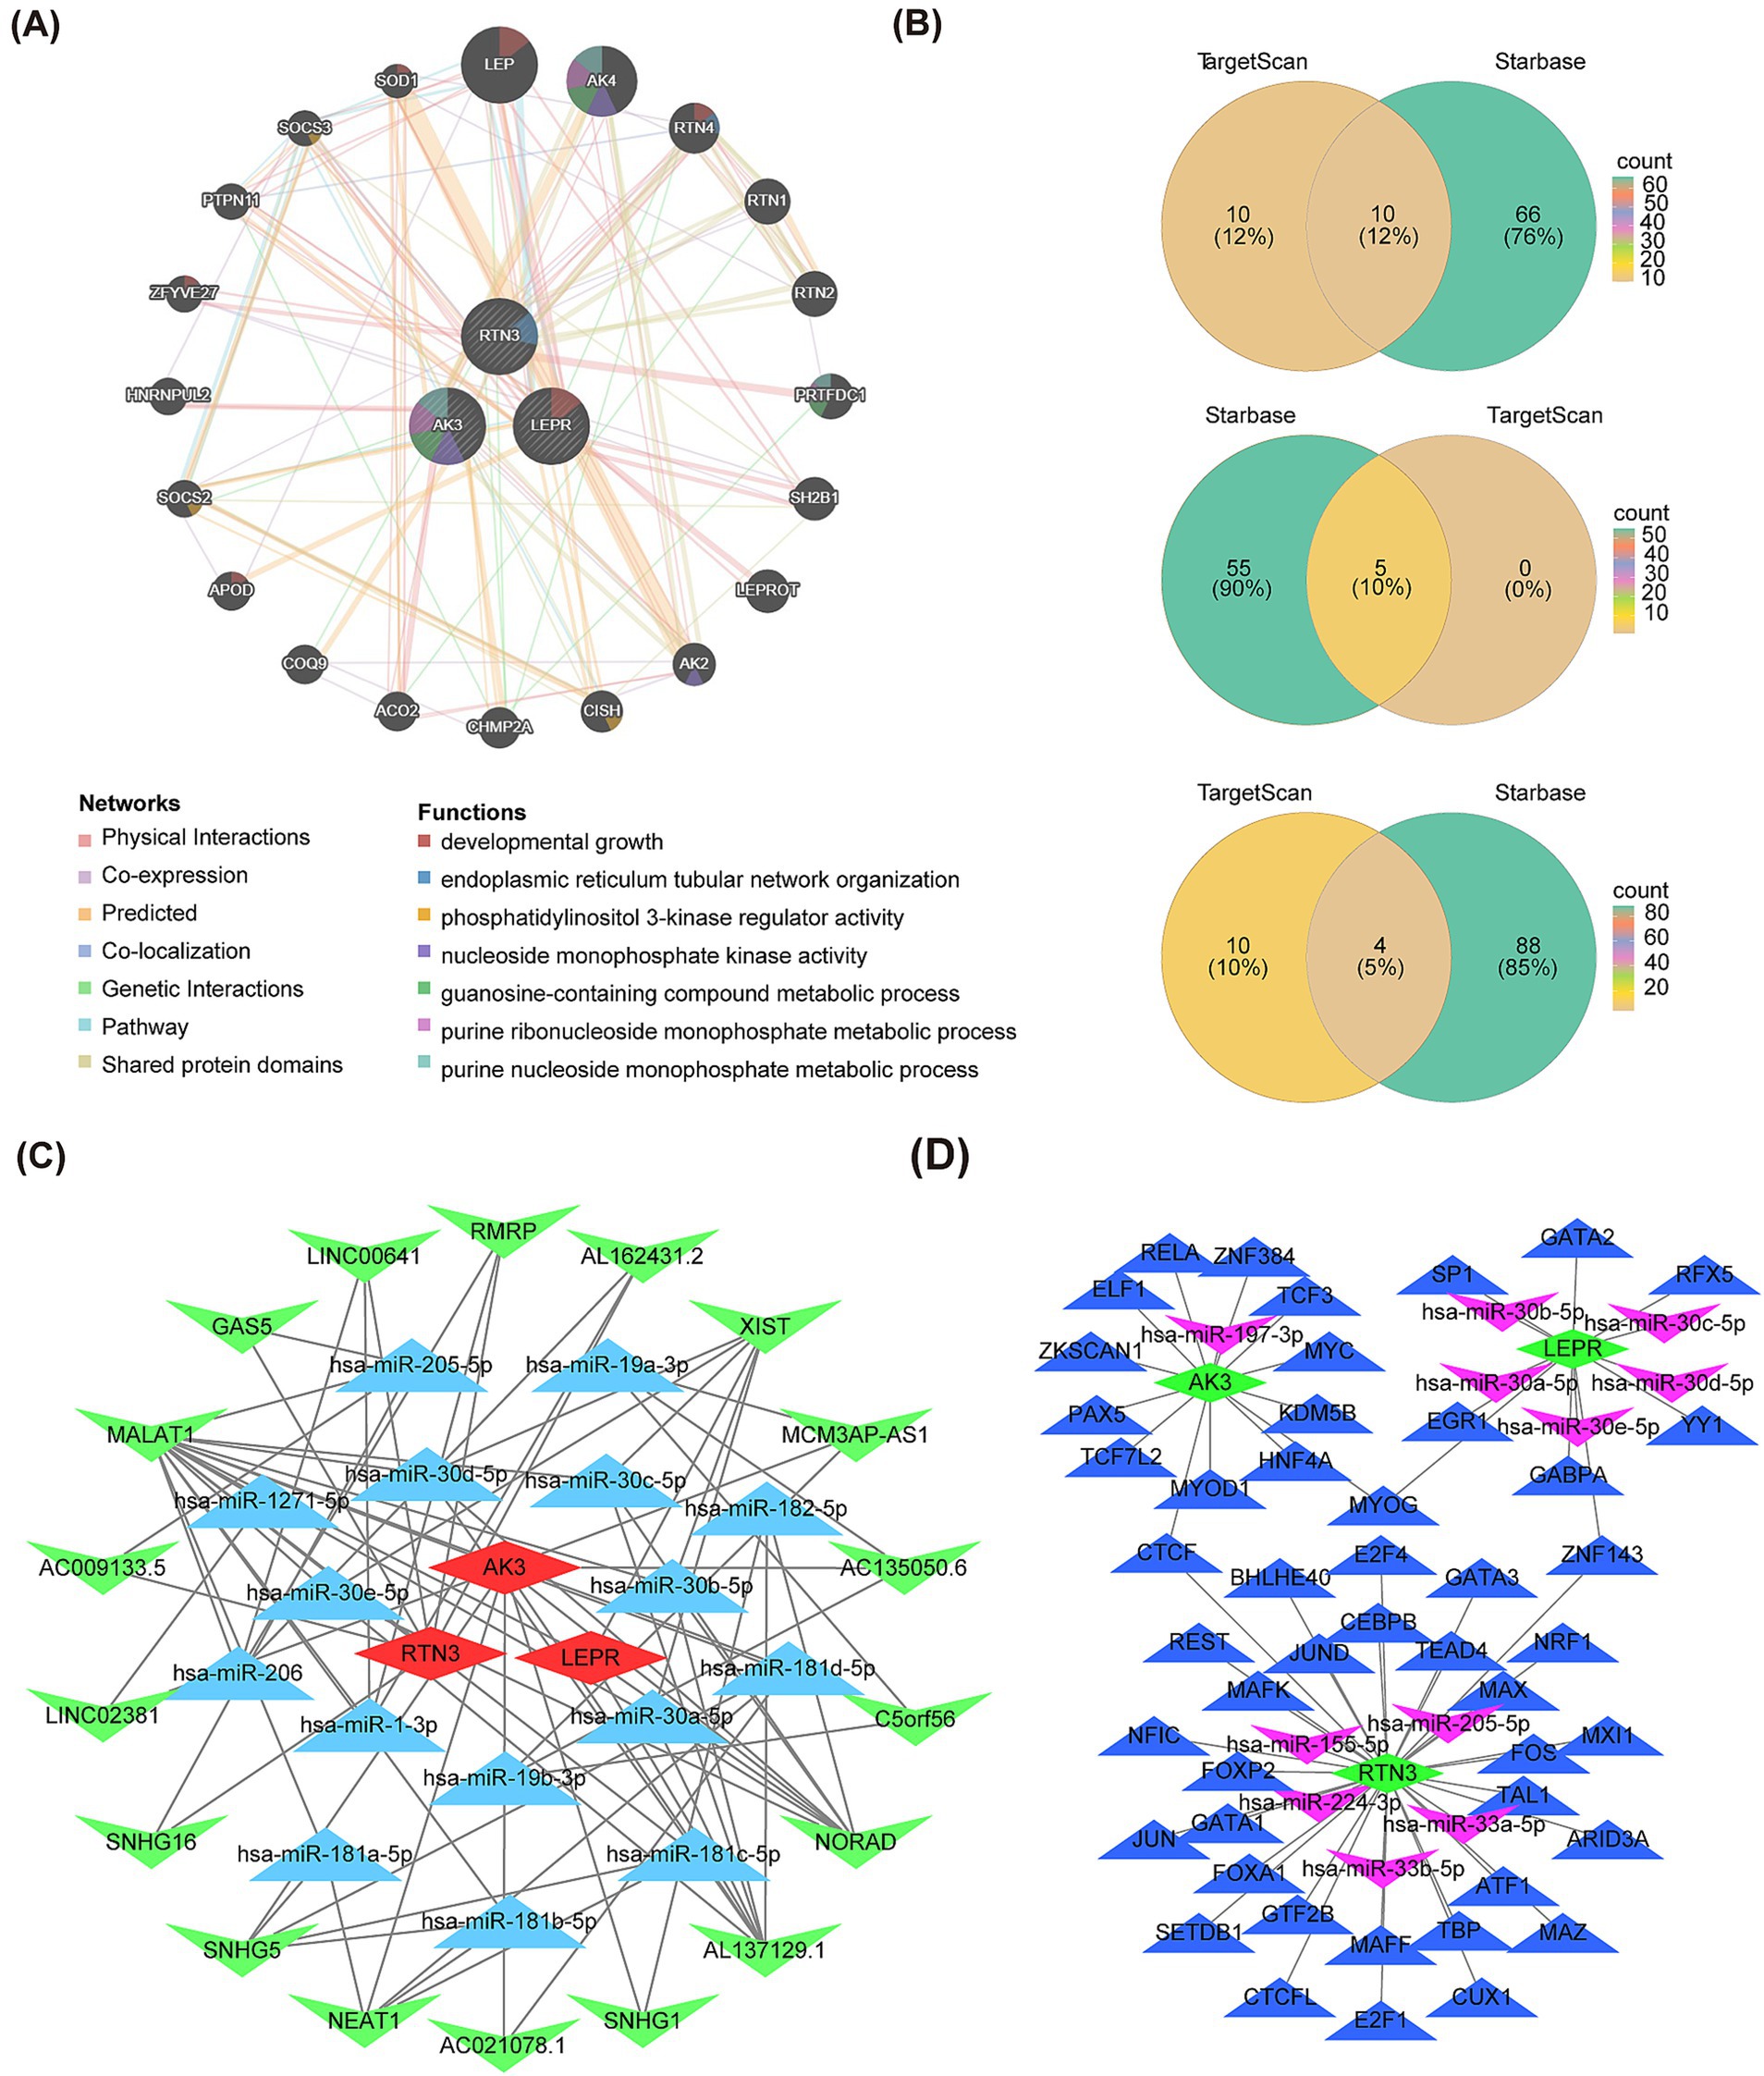
Figure 9. Interaction network of AK3, RTN3 and LEPR. (A) Gene–gene interaction network of AK3, RTN3 and LEPR. (B) Venn diagram shows the common miRNA of AK3, RTN3 and LEPR in the TargetScan and Starbase databases. (C) The ceRNA regulatory network of AK3, RTN3 and LEPR. Red is the biomarkers; blue is the miRNAs and green is the lncRNAs. (D) mRNA-miRNA-TF network of AK3, RTN3 and LEPR. Biomarkers are shown in green, miRNA in purple, and TF in blue.
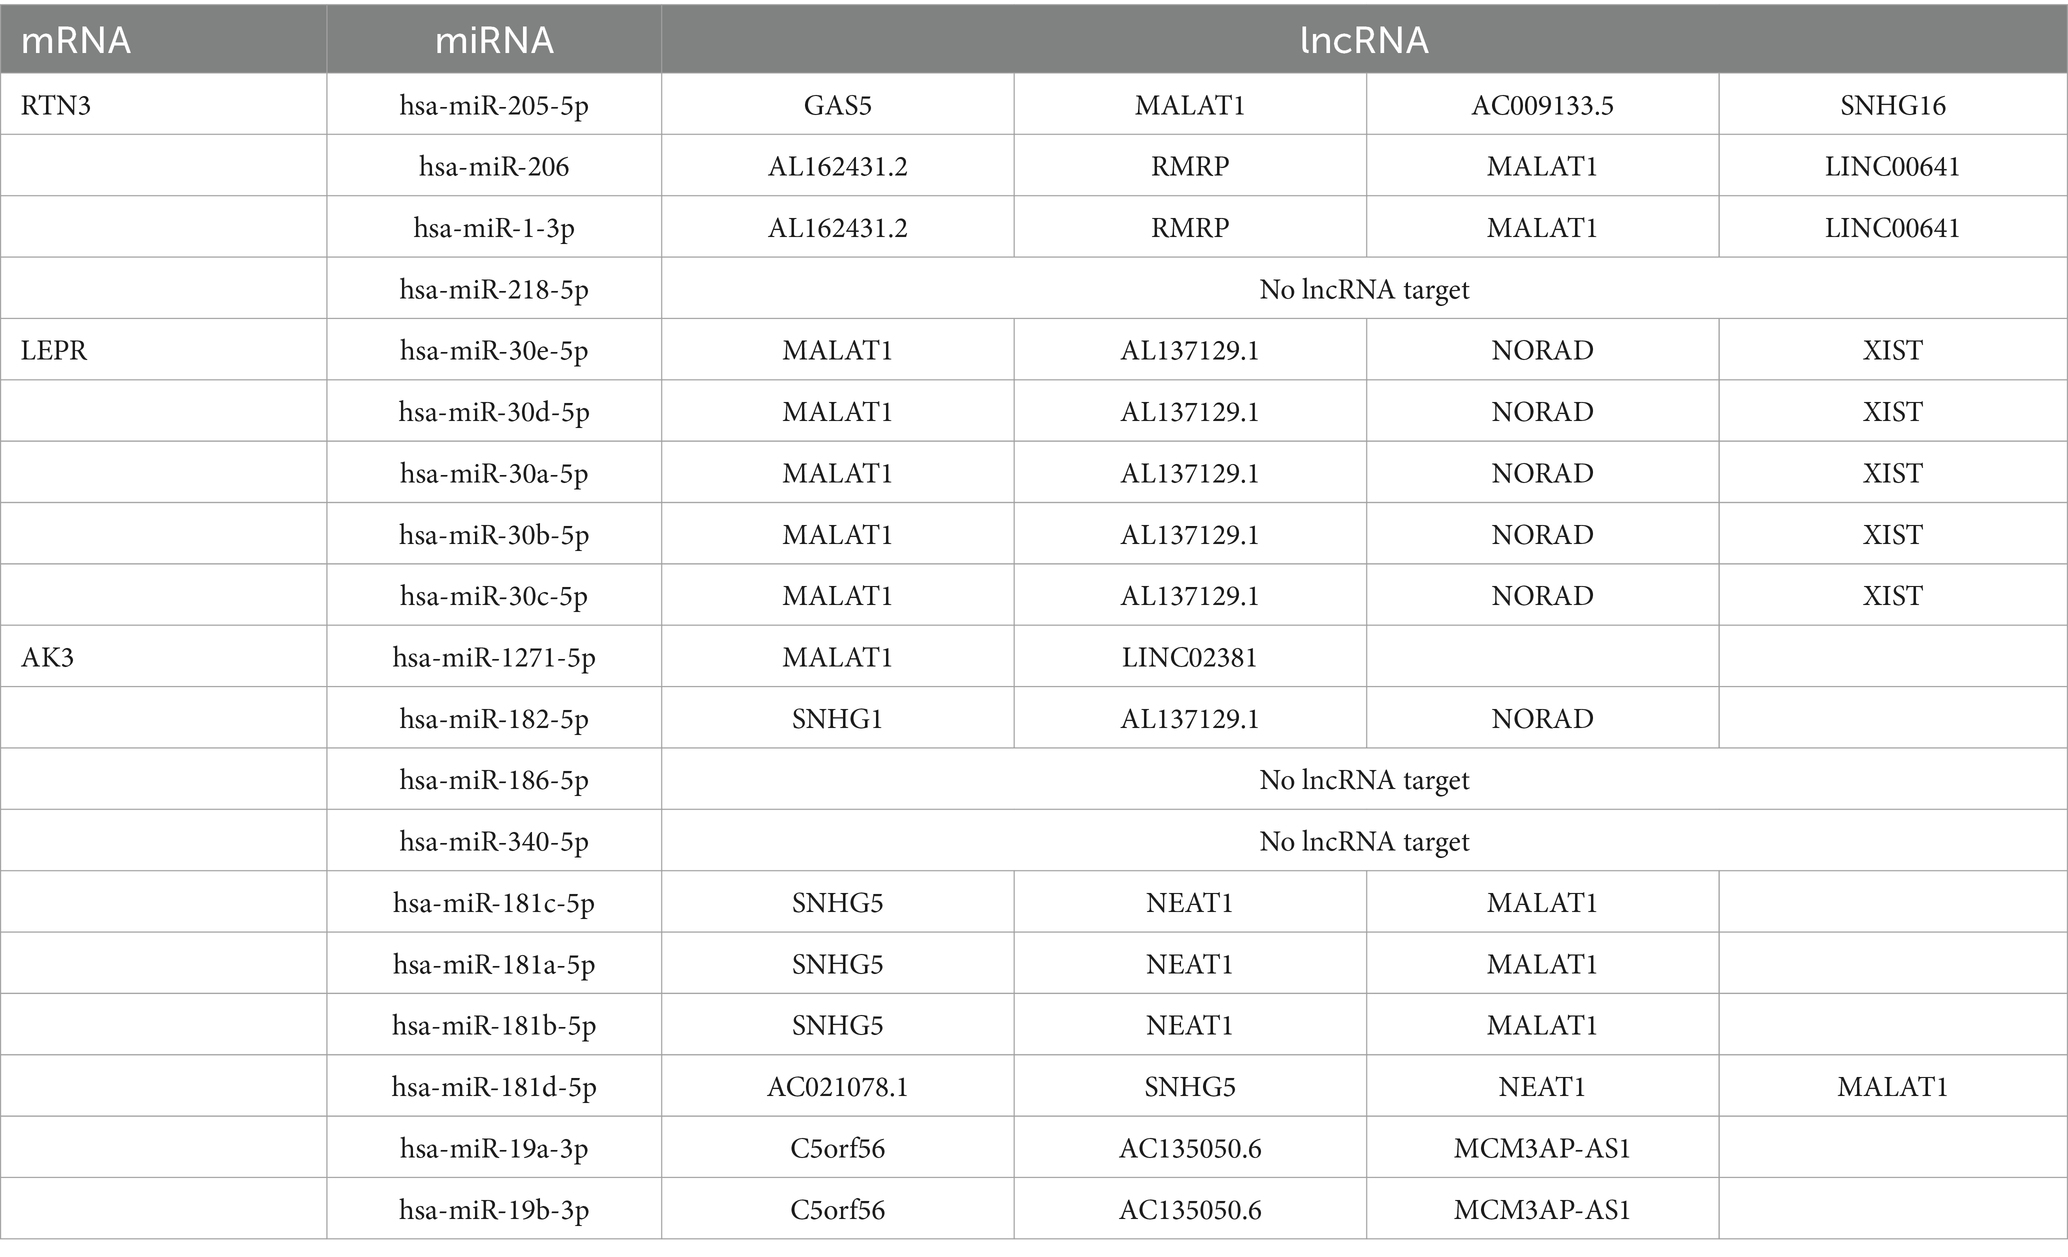
Table 2. The ceRNA network information of RTN3, LEPR, and AK3.
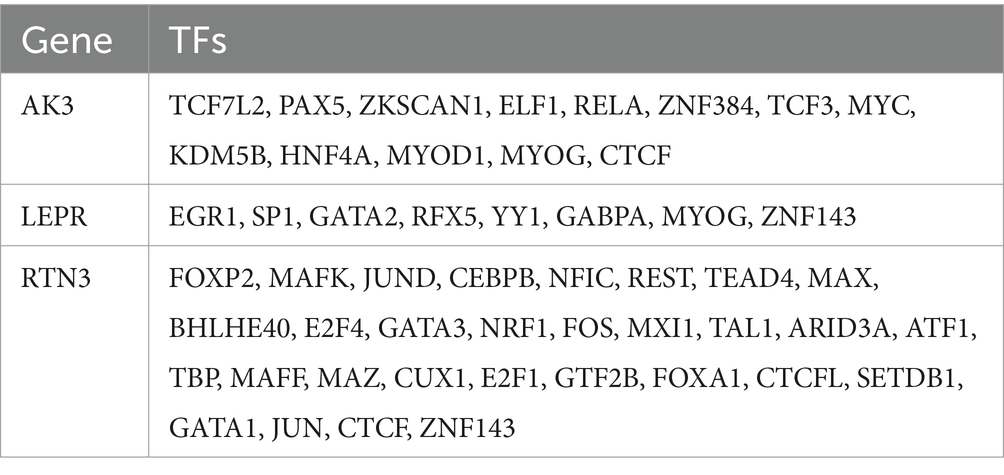
Table 3. Gene and transcription factors (TFs).
3.7 Prediction of potential therapeutic agents
The 14 potential therapeutic agents were identified based on biomarkers, each of which had different effects on biomarkers expression. For instance, bisphenol A increased expression of AK3, RTN3 and LEPR, while Aflatoxin B1 inhibited expression of both RTN3 and LEPR. A drug-gene network was constructed, including relationship pairs such as cadmium Chloride-AK3, Estradiol-LEPR, Cyclosporine-RTN3 and other relationship pairs was constructed (Figure 10A). Eventually, AK3 was molecularly docked with doxorubicin. Forming two hydrogen bonds including GLU-105 and LYS-102 (Figure 10B). RNT3 was docked to acetaminophen, forming two hydrogen bonds (LEU-488 and GLY-489) (Figure 10C). LEPR was molecularly docked to bisphenol A by three hydrogen bonds including GLN-677, SER-719 and ASP-635 (Figure 10D). The molecular docking energies of AK3 and doxorubicin, RTN3 and acetaminophen, and LEPR and bisphenol A were − 4.04 kcal/mol, −3.14 kcal/mol, and − 3.735 kcal/mol, respectively.
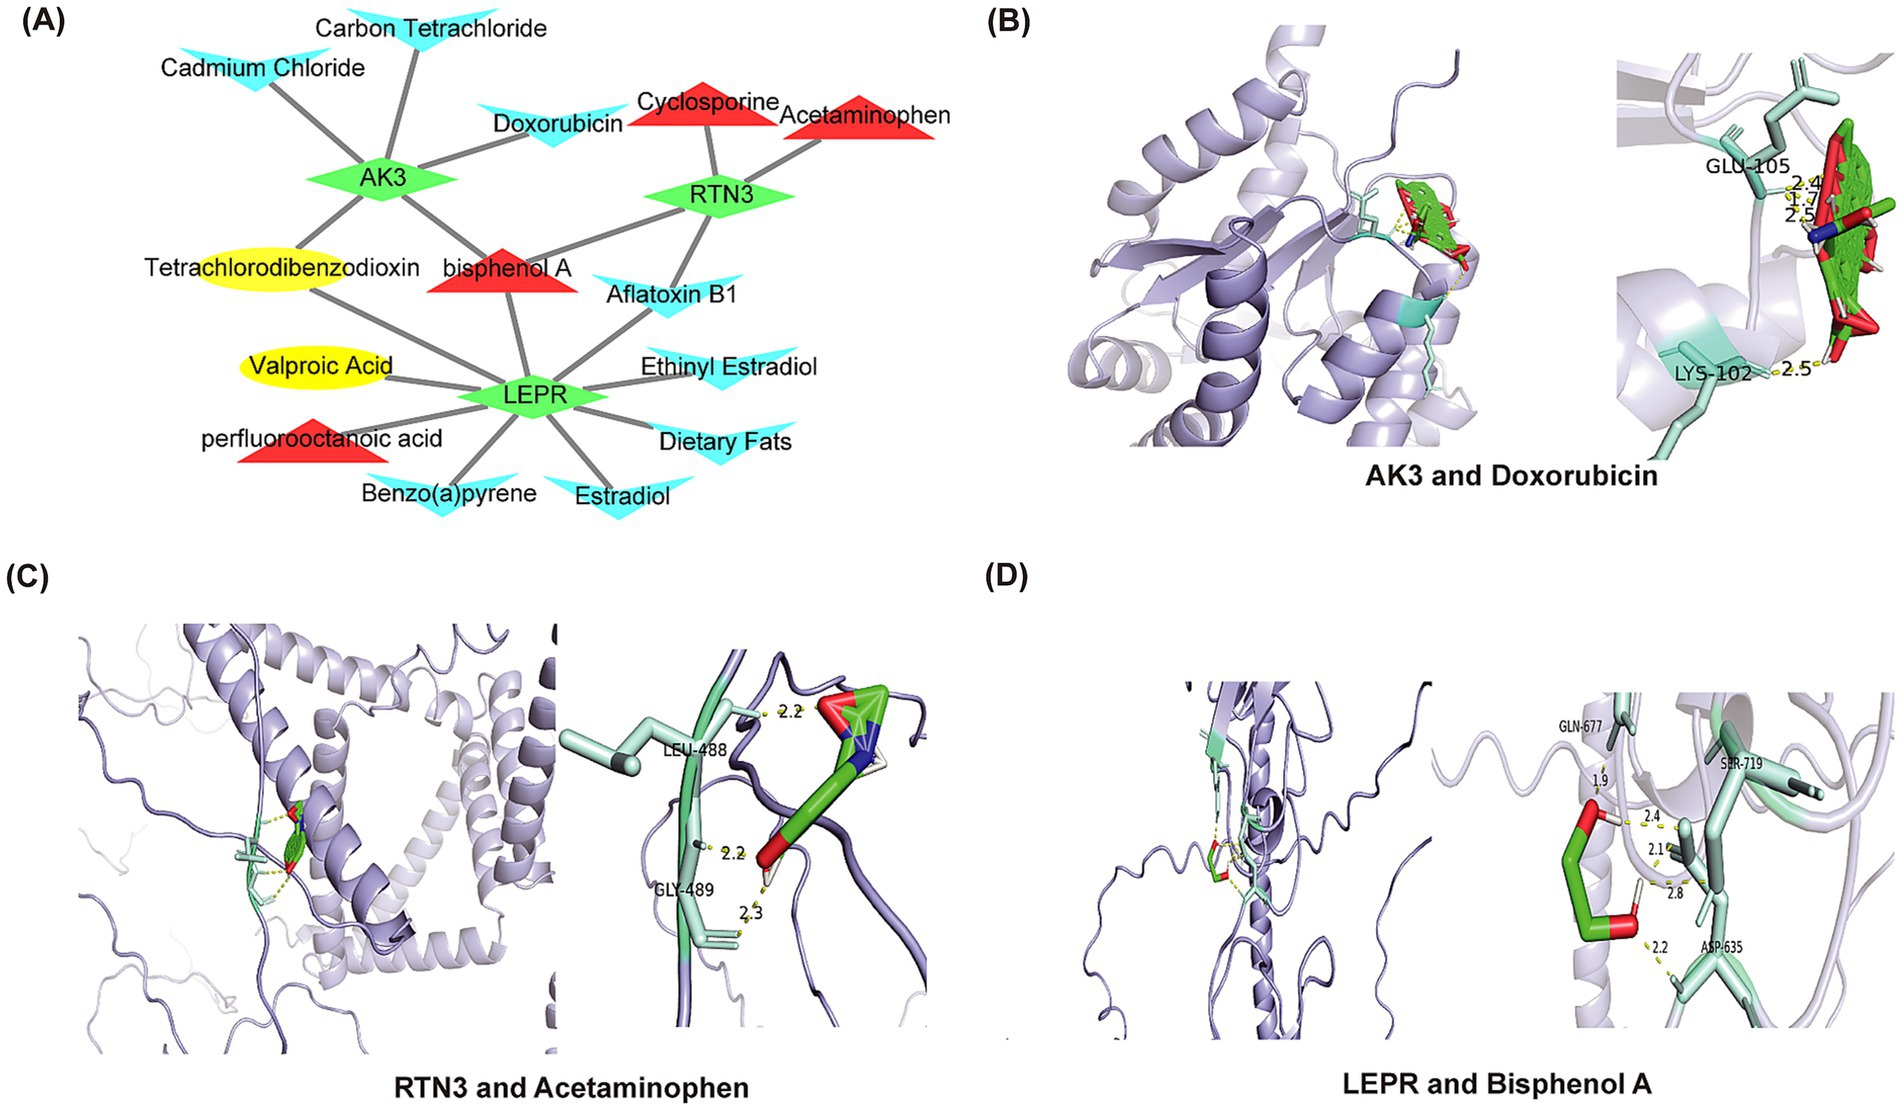
Figure 10. Prediction of drugs that affect biomarkers expression and molecular docking. (A) The network interaction map showed the drug target prediction. Biomarkers are shown in green. Drugs that upregulate target genes are represented in red; drugs that downregulate target genes are represented in blue; and drugs that affect target genes are represented in yellow. (B) Molecular docking of AK3 and doxorubicin. (C) Molecular docking of RTN3 and acetaminophen. (D) Molecular docking of LEPR and bisphenol A.
3.8 Gene expression levels in GEO data sets and qRT-PCR experiments
To demonstrate the expression levels of the biomarkers in GSE22491 and GSE100054, we performed qRT-PCR experiments. In GSE22491, AK3 and LEPR in PD patients were significantly down-regulated, while CYP4F2 and RTN3 were significantly up-regulated (Figure 11A). In GSE100054, AK3 was down-regulated in PD patients, while LEPR and RTN3 were significantly up-regulated (Figure 11B). In the qRT-PCR test, AK3 was down-regulated (p = 0.0433) and RTN3 up-regulated (p = 0.0283) in PD, and the expression was consistent with the results in GEO datasets. CYP4F2 was up-regulated in PD, and LEPR was not differentially expressed. The qRT-PCR results are shown in Figures 11C–F.
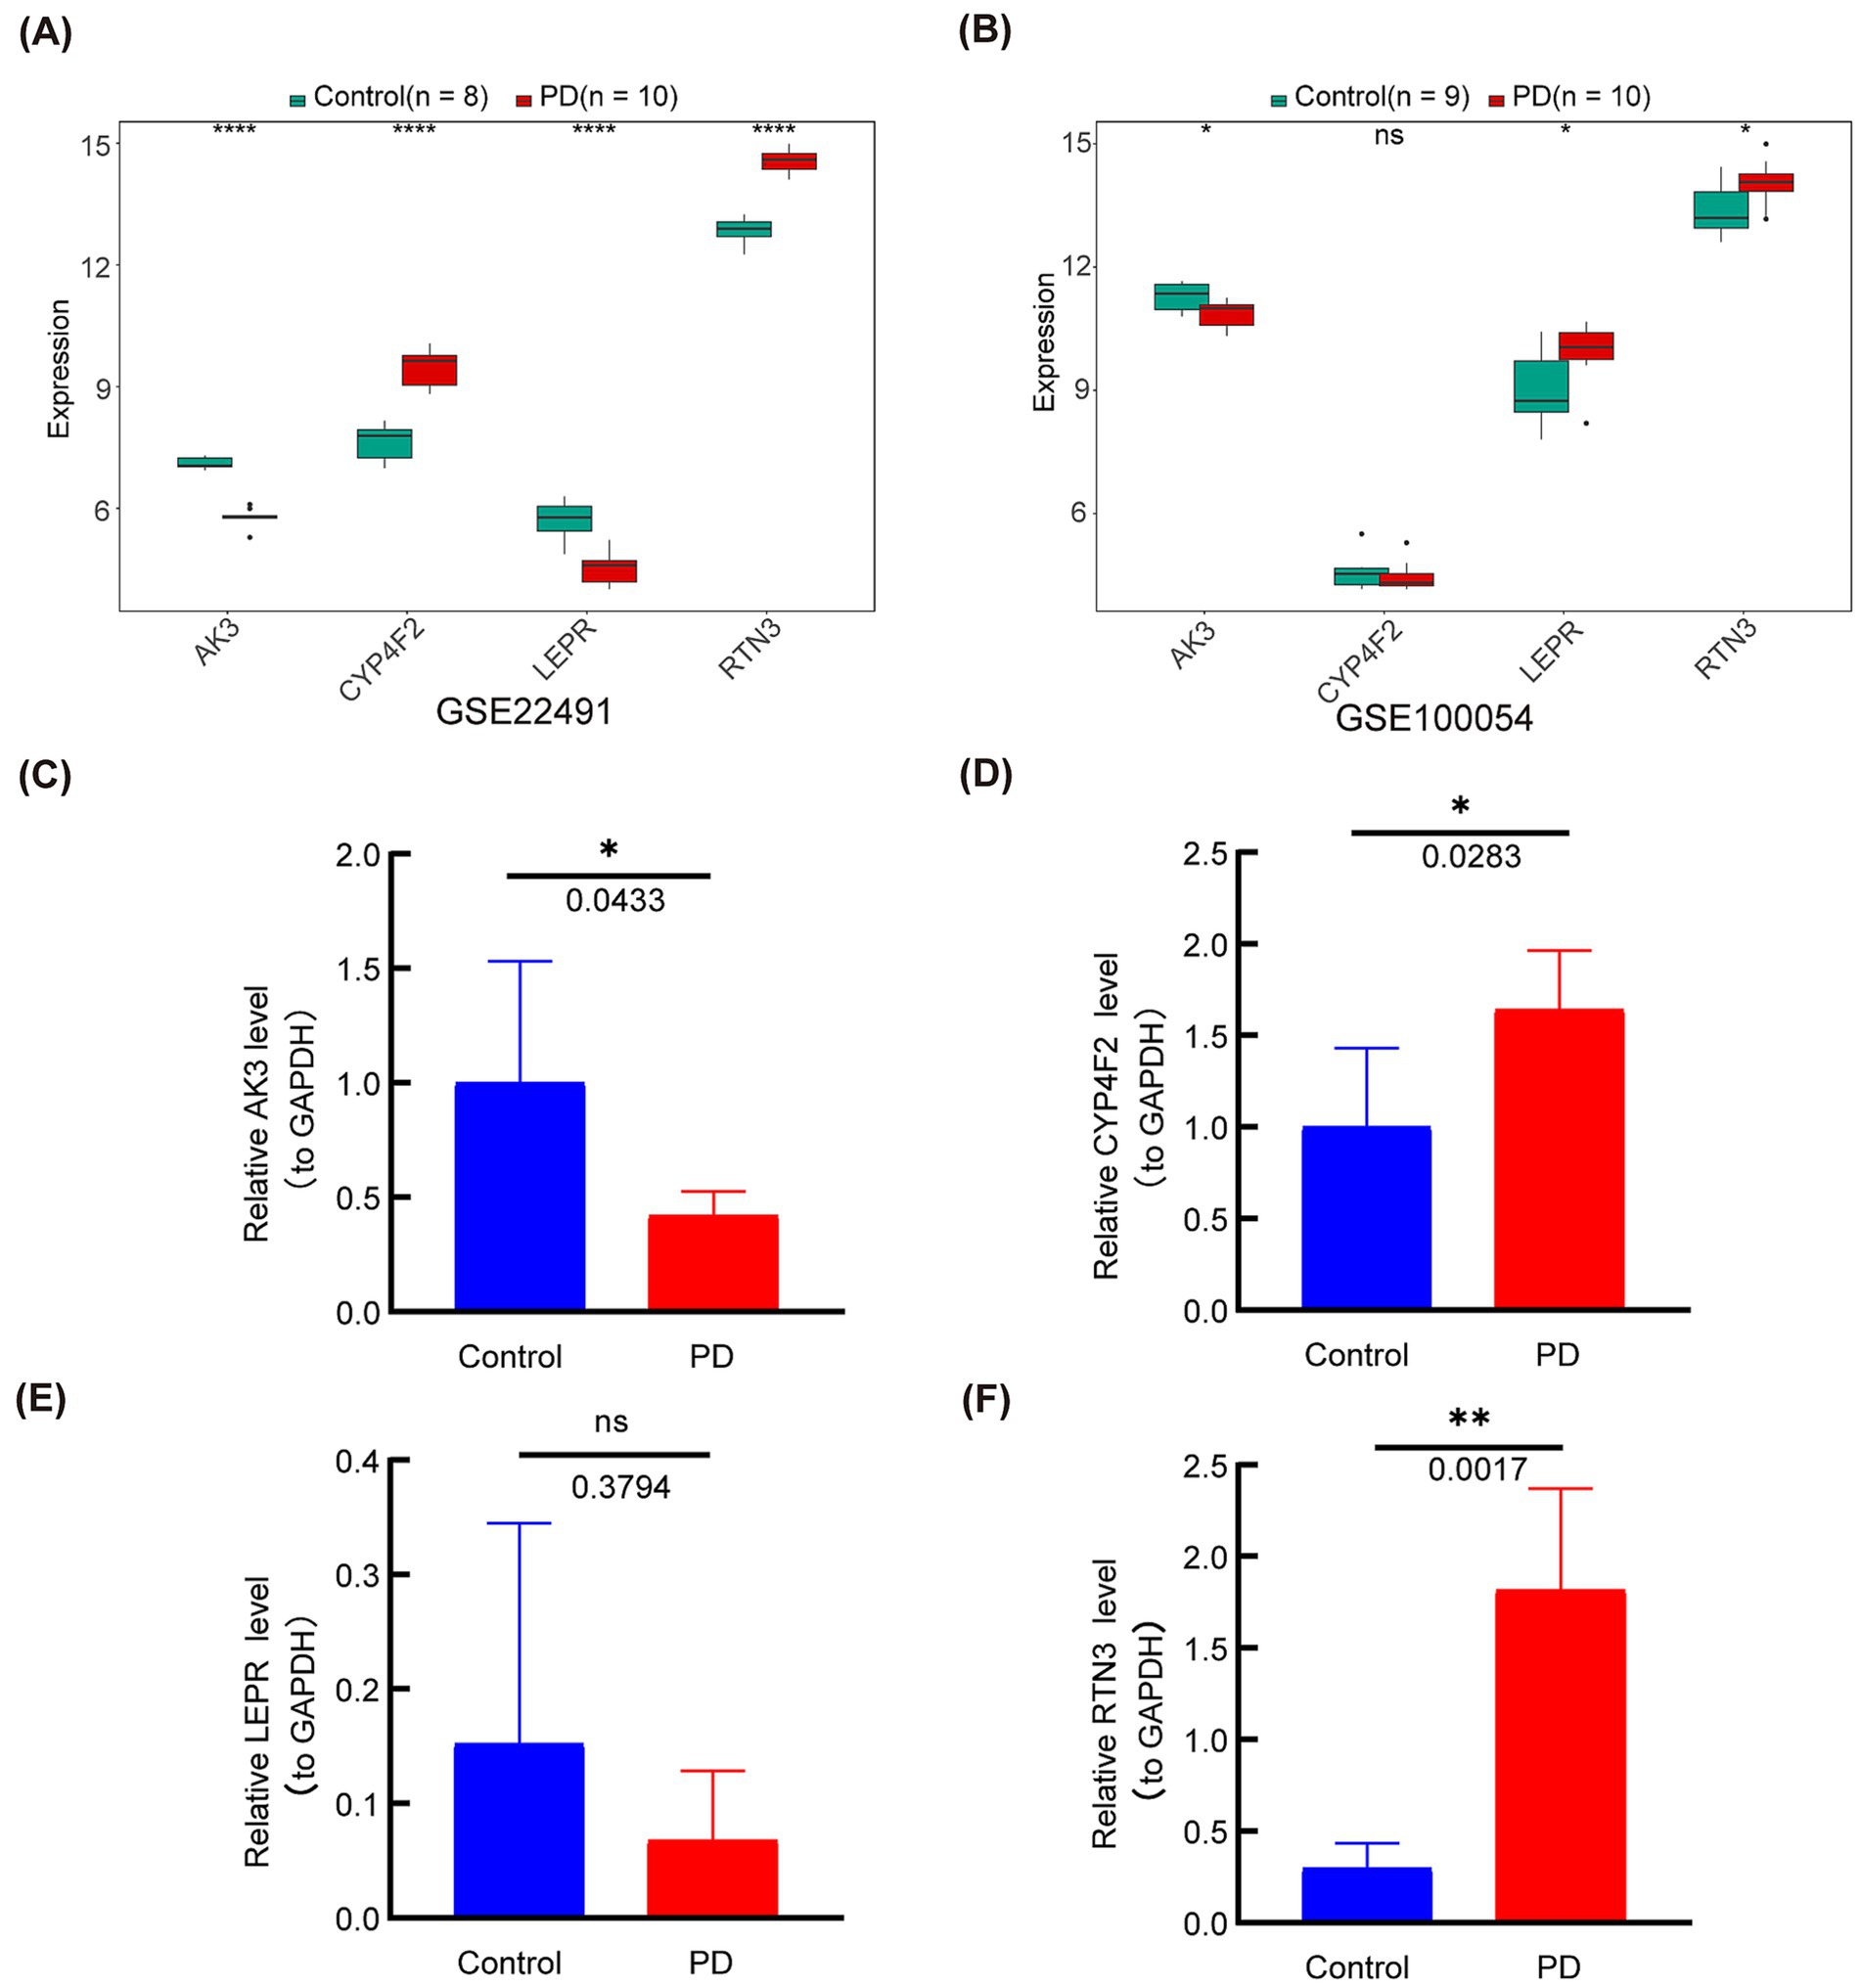
Figure 11. The expression levels of the four genes (AK3, CYP4F2, LEPR and RTN3) were analyzed in the GEO datasets and verified by q-PCR. (A) The expression level of genes in GSE22491. (B) The expression level of genes in GSE100054. (C) Gene expression level of AK3 was determined by q-PCR. (D) Gene expression level of CYP4F2 was determined by q-PCR. (E) Gene expression level of LEPR was determined by q-PCR. (F) Gene expression level of RTN3 was determined by q-PCR. *p < 0.05; **p < 0.01; ***p < 0.001; ****p < 0.0001; ns = no significance.
4 Discussion
Parkinson’s disease is the second most common neurodegenerative disease, and its incidence is increasing year by year (Emamzadeh and Surguchov, 2018). PD-related symptoms have a serious impact on the normal life of patients and their families. The current diagnosis of PD is based on clinical criteria that require the presence of retardation along with at least one motor symptom, such as tremor, stiffness, or postural instability (Tolosa et al., 2021). However, the latency period from the first non-motor symptoms of Parkinson’s disease to meeting the current diagnostic criteria for PD can range from 5 to 20 years, and we also call this period the prodromal phase of PD. Through the study of body fluid and tissue biomarkers, clinical non-motor symptoms and neuroimaging related to PD prodromal stage, it can provide new ideas for relieving and preventing PD motor symptoms. Many processes in the human body, including brain function, are regulated over a 24-h cycle, and there is a strong association between circadian rhythm disturbances, such as sleep–wake cycles, and central nervous system disorders. Studies have shown that 80% of PD patients suffer from sleep–wake disorders, and nighttime hypertension is almost universal in PD patients, and patients’ blood pressure often reverses, with nighttime blood pressure higher than daytime levels (Hunt et al., 2022). Although various circadian rhythm real-time detection instruments have been used to observe the rhythm disturbance in PD patients, the mechanism of circadian rhythm disturbance in PD patients and the impact of circadian rhythm disturbance on the occurrence and development of PD are not clear.
The purpose of this study was to screen out blood molecular markers related to prodromal Parkinson’s disease on the one hand, and to explore the relationship and mechanism between circadian rhythm disturbance and PD development on the other hand. We analyzed the expression of circadian rhythm-related genes and the enrichment of functional pathways in PD patients by bioinformatics. In addition, we used machine learning methods to screen out candidate markers with diagnostic value, and used other data sets to conduct external validation with clinical patient blood samples. Elize Aparecida Santos Musachio et al. found that bisphenol A can cause changes in drosophila Parkinson’s disease through oxidative stress (Musachio et al., 2020). Drug target prediction indicated that bisphenol A could up-regulate the expression of LEPR, AK3 and RTN3 (Ptak and Gregoraszczuk, 2012; Thongkorn et al., 2019; Ooi et al., 2021). The interaction of the three molecular markers is shown in Figure 12.
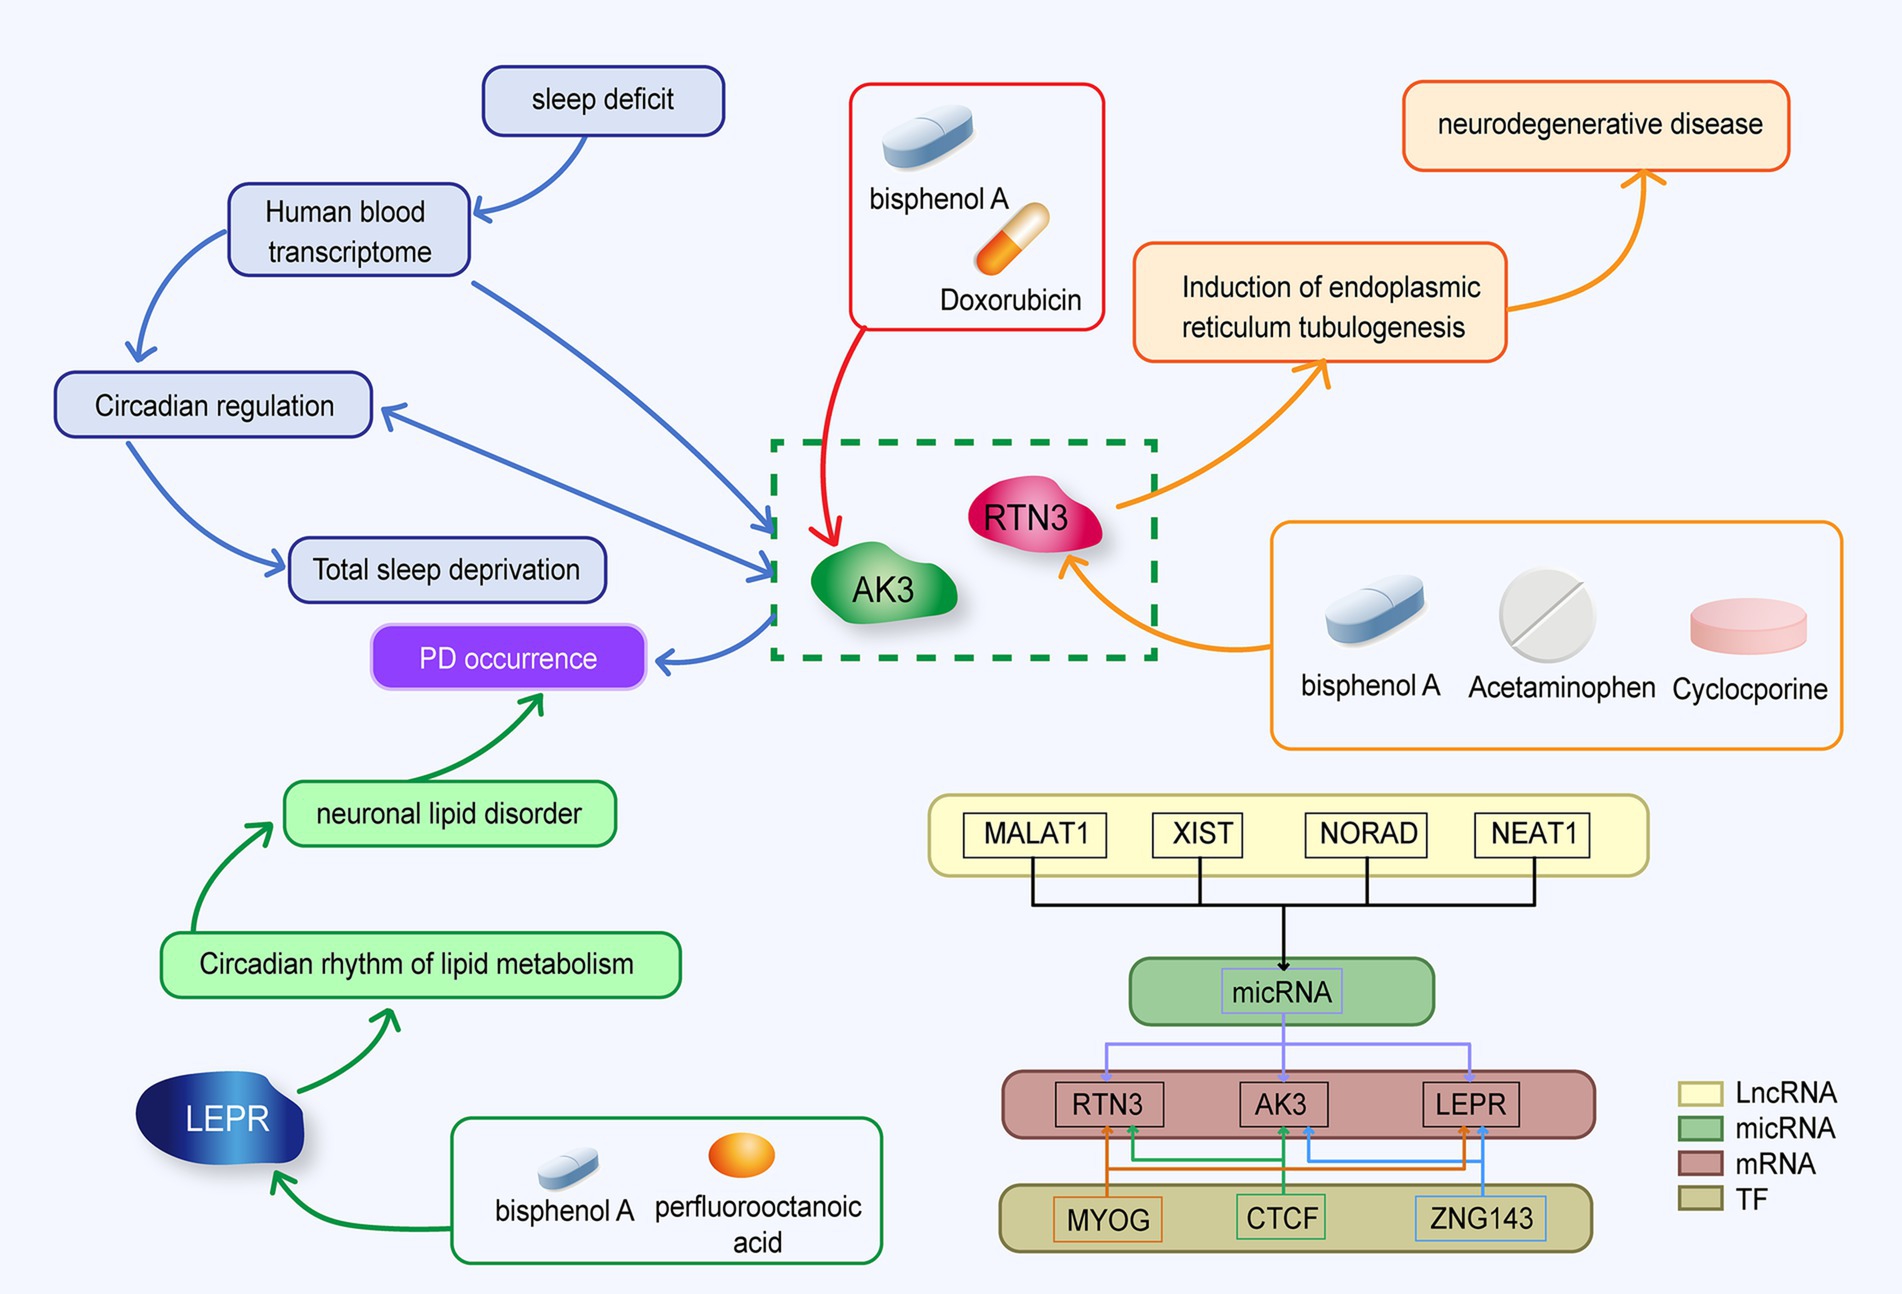
Figure 12. Mechanistic diagram of circadian rhythm-related molecular markers.
The leptin protein receptor, encoded by the LEPR gene, act as a regulator of energy homeostasis and feeding behavior (Yin X. et al., 2022; Yin Z. et al., 2022). Adipose tissue, a metabolically active organ, showing highly rhythmic behavior. MADRID et al. found that the expression of LEPR, which is related to fat metabolism, showed obvious rhythmic behavior (Garaulet et al., 2011). In contrast, Wang et al. found that the expression of the LEPR gene was significantly elevated in PD patients compared to healthy controls (Yin X. et al., 2022; Yin Z. et al., 2022). This contradicts our results. Leptin maintains cell survival in neuronal SH-SY5Y cells by maintaining ATP levels and mitochondrial membrane potential to resist MPP+ toxicity (Parkinson’s disease model) (Shin et al., 2011). The up-regulation of the LEPR gene may indicate that neurons activate feedback protection or that early downregulation of LEPR activates a cascade that promotes upregulation. Analyzing the expression of LEPR in different stages of PD development is of great significance for exploring the occurrence, development, and etiology of PD.
Reticulon 3 (RTN3), which is a member of the reticulon family of proteins, that is preferentially expressed in neuroendocrine tissues. Additionally, it has been discovered that RTN3 interacts with beta-amyloid converting enzyme 1 (BACE1), an enzyme that starts the production of amyloid peptides from amyloid precursor protein and reticulon proteins are negative modulators of BACE1 in cells (Sharoar and Yan, 2017). Sleep deprivation affects transcriptome levels in the blood, disrupting their circadian regulation and exacerbating the effects of acute total sleep deprivation. RTN3 is one of the genes affected by circadian rhythms (Möller-Levet et al., 2013). Studies have revealed that RTN3 is a particular receptor for the breakdown of endoplasmic reticulum tubules (Grumati et al., 2017). RTN3 belongs to the reticulin family, which is most abundant in the brain, and it is frequently activated in response to endoplasmic reticulum stress. Down-regulation of RTN3 has been demonstrated to enhance the clearance of cytoplasmic PrP aggregates, restore the activity of the ubiquitin proteasome system, and reduce endoplasmic reticulum stress, and the clearance of cytoplasmic PrP aggregates has been shown to suppress apoptosis. Therefore, the targeted suppression of RTN3 expression helps to lower the stress level of neuronal cells and stop the progression to apoptosis (Chen et al., 2011). In this study, the expression of RTN3 was up-regulated in PD patients, which may serve as a potential target for future treatment of organelle oxidative stress and inhibition of neuronal apoptosis in PD patients. Some studies have found that PD patients have more peripheral natural killer (NK) cells than non-PD controls, and Rachael H Earls et al. demonstrated that NK cells successfully internalize and destroy α-syn aggregates via the endosome/lysosome route (Earls and Lee, 2020; Earls et al., 2020). In this study, immunoinfiltration analysis revealed that the number of activated NK cells in the peripheral blood of Parkinson’s disease patients was greater than in the control group. This finding proves and supplements the results of prior investigations. In the correlation analysis between biomarkers and immune cells, RTN3 showed a high positive correlation with activated NK cells. The increased expression of RTN3 in PD patients may be a significant target in the process of encouraging the aggregation of NK cells, offering a fresh perspective on how α-syn is degraded. Sacha Bohler et al. have suggested that acetaminophen overdose is a potential risk factor for Parkinson’s disease (Bohler et al., 2019). Acetaminophen can up-regulate the expression of RTN3 (Yu et al., 2018). Aya Yassin Labib et al. found that acetaminophen had a neuroprotective effect on rotenone-induced Parkinson’s disease in rat models (Labib et al., 2021). Different doses of acetaminophen may have different effects on PD, which requires us to find out the answer in further large-scale clinical studies and related experiments.
Adenylate Kinase 3 (AK3) is a Protein Coding gene. Diseases associated with AK3 include Reticular Dysgenesis and Orofacial Cleft 8. AK3 functions to participate in the maintenance of cellular nucleotide homeostasis by catalyzing interconversion between nucleotides. Down-regulation of genes in the substantia nigra may be regarded as a result of dopaminergic cell death. Paula Garcia-Esparcia et al. discovered that the expression of AK3 was down-regulated in the substantia nigra at stages 3–6 (Garcia-Esparcia et al., 2015). In GEO database and q-PCR verification, AK3 was down-regulated in PD groups. Doxorubicin results in decreased expression of AK3 mRNA (Vijay et al., 2016; Verheijen et al., 2018). A prominent feature of Parkinson’s disease is α-syn protein aggregation, and there have been cases where patients undergoing Doxorubicin are prone to Parkinson-like symptoms. It may be due to protein aggregation caused by Doxorubicin (Garg and Sinha, 2022).
In this study, by means of GSVA and GSEA enrichment analysis, three core biomarkers were significantly enriched in key biological processes such as OXIDATIVE_PHOSPHORYLATION, DNA_REPLICATION and DNA_REPAIR. Some studies have confirmed that the oxidative phosphorylation activity of rat brain mitochondria is regulated by rotenone and melatonin, showing a significant circadian rhythm (Spira and Spiegel, 1992). This finding not only highlights the central role of mitochondrial function in the pathological mechanism of PD, but also reveals the underlying circadian regulation mechanism. At the same time, it is particularly worth mentioning that the regulatory effect of melatonin on health and disease states has also been fully confirmed (Reiter et al., 2021). Studies have shown that melatonin can promote the transition from aerobic glycolysis to mitochondrial oxidative phosphorylation in solid tumor cells and other pathological cells (including Alzheimer’s disease, fibrosis lesions, macrophage hyperactivation, etc.). This mechanism may be the cornerstone of its inhibition of disease development and maintenance of health. In addition, the roles of key enzymes in DNA repair and replication, as well as their important roles in the pathogenesis of neurodegenerative diseases, have also been investigated (Catarzi et al., 2022). The changes in the activities of these enzymes not only reflect the stability of the DNA repair system, but also may be used as biomarkers for the early diagnosis of neurodegenerative diseases such as PD, providing a new perspective and direction for the early intervention and treatment strategies of the disease. Taken together, these findings not only enrich our understanding of the pathogenesis of PD and other neurodegenerative diseases, but also provide valuable scientific evidence for the development of future disease diagnosis and treatment strategies, especially for the exploration of new therapeutic targets based on mitochondrial function and DNA repair systems.
In our study, three key genes related to circadian rhythm were identified by bioinformatics analysis, which were AK3, RTN3 and LEPR. In addition, we constructed a diagnostic prediction model and proved that the model had good diagnostic prediction ability. Functional enrichment showed that these three biomolecular markers played an important role in the pathogenesis and development of PD. Analysis of immune infiltration AK3, RTN3 and LEPR may be involved in the progression of PD by regulating NK cells. However, how these genes contribute to PD progression by influencing related genes still needs to be further investigated in clinical trials. The mechanism of the influence of the three genes on circadian rhythm needs to be further studied in the experiment. These key genes may serve as new biomarkers of PD in the future and provide more references for the exploration of the pathogenesis of PD in the future. And we will continue to pay attention to the research progress of circadian rhythm and Parkinson’s disease.
There are some limitations to this study. First, this study mainly uses bioinformatics analysis to process transcriptome data in public databases, and although the gene-chip results may be flawed, the data used is rigorously processed and screened. Since this study is a preliminary exploration, a small sample size is used for rapid verification, and the results will provide a basis for subsequent large-scale studies. Although this study had a small sample size and was not disaggregated by sex, we have taken various measures to ensure the accuracy and reliability of the data. Secondly, we realized that the sample size of the current study was limited, so we tried different data sets for verification, and verified by experimental means. The combination of the three obtained a credible result to further ensure its potential application value. Finally, since the current AUC value of the model is 0.7, although it shows certain predictive ability, in order to ensure the applicability of the model in clinical practice, we recognize that a larger number of samples are needed for further experiments and validation. In the future, we will increase the study sample size, classify the sexes, and add more experimental validation, such as protein level verification, gene editing experiments, etc., to ensure the robustness and generalization ability of the model.
Data availability statement
The raw data supporting the conclusions of this article will be made available by the authors, without undue reservation.
Ethics statement
The studies involving humans were approved by the Institutional Research Ethics Committee of the Second Hospital of Hebei Medical University. The studies were conducted in accordance with the local legislation and institutional requirements. The participants provided their written informed consent to participate in this study.
Author contributions
JZ: Methodology, Writing – original draft. XM: Methodology, Writing – original draft. ZL: Writing – original draft, Investigation, Supervision. HL: Writing – original draft, Validation, Visualization. MT: Writing – original draft, Conceptualization, Data curation. YW: Writing – original draft, Formal analysis. SW: Writing – original draft, Project administration, Supervision. LW: Supervision, Funding acquisition, Resources, Visualization, Writing – review & editing.
Funding
The author(s) declare financial support was received for the research, authorship, and/or publication of this article. The work was supported by Hebei Natural Science Foundation (project ID: H2021206153), Hebei Provincial Government Funded Provincial Medical Talents Project and Scientific Research Fund of the Second Hospital of Hebei Medical University (project ID: 2HC202112).
Acknowledgments
We would like to express our sincere gratitude to all individuals and organizations who supported and assisted us throughout this research.
Conflict of interest
The authors declare that the research was conducted in the absence of any commercial or financial relationships that could be construed as a potential conflict of interest.
Publisher’s note
All claims expressed in this article are solely those of the authors and do not necessarily represent those of their affiliated organizations, or those of the publisher, the editors and the reviewers. Any product that may be evaluated in this article, or claim that may be made by its manufacturer, is not guaranteed or endorsed by the publisher.
Supplementary material
The Supplementary material for this article can be found online at: https://www.frontiersin.org/articles/10.3389/fnagi.2024.1458476/full#supplementary-material
Abbreviations
PD, Parkinson’s disease; C-genes, Circadian genes; DEGs, Differentially expressed genes; DECGs, Differentially expressed C-genes; ROC, Receiver operating characteristic; GSEA, Gene Set Enrichment Analysis; SNpc, Substantia Nigra pars compacta; α-syn, α-synuclein; NMS, Non-motor symptoms; PBMC, Peripheral blood mononuclear cells; CGDB, Circadian Gene DataBase; LASSO, Least absolute shrinkage and selection operator; SVM-RFE, Support vector machine-recursive feature elimination; AUC, Area under the curve; DCA, Decision curve analysis; ceRNA, Competing endogenous RNA; TF, Transcription factor; CTD, The comparative toxicogenomics database; qRT-PCR, Quantitative real-time polymerase chain reaction; RTN3, Reticulon 3; BACE1, Beta-amyloid converting enzyme 1; AK3, Adenylate Kinase 3.
Footnotes
1. ^https://www.ncbi.nlm.nih.gov/gds
3. ^http://starbase.sysu.edu.cn/
4. ^https://www.targetscan.org/vert_80/
5. ^https://maayanlab.cloud/chea3/
References
Aarsland, D., Batzu, L., Halliday, G. M., Geurtsen, G. J., Ballard, C., Ray Chaudhuri, K., et al. (2021). Parkinson disease-associated cognitive impairment. Nat. Rev. Dis. Primers 7:47. doi: 10.1038/s41572-021-00280-3
Bérard, M., Sheta, R., Malvaut, S., Rodriguez-Aller, R., Teixeira, M., Idi, W., et al. (2022). A light-inducible protein clustering system for in vivo analysis of α-synuclein aggregation in Parkinson disease. PLoS Biol. 20:e3001578. doi: 10.1371/journal.pbio.3001578
Berman, H. M., Westbrook, J., Feng, Z., Gilliland, G., Bhat, T. N., Weissig, H., et al. (2000). The Protein Data Bank. Nucleic Acids Res. 28, 235–242. doi: 10.1093/nar/28.1.235
Bohler, S., Liu, X., Krauskopf, J., Caiment, F., Aubrecht, J., Nicolaes, G., et al. (2019). Acetaminophen overdose as a potential risk factor for Parkinson's Disease. Clin. Transl. Sci. 12, 609–616. doi: 10.1111/cts.12663
Catarzi, D., Varano, F., Vigiani, E., Lambertucci, C., Spinaci, A., Volpini, R., et al. (2022). Casein kinase 1δ inhibitors as promising therapeutic agents for neurodegenerative disorders. Curr. Med. Chem. 29, 4698–4737. doi: 10.2174/0929867329666220301115124
Chang, K. H., and Chen, C. M. (2020). The role of oxidative stress in Parkinson's Disease. Antioxidants (Basel) 9:597. doi: 10.3390/antiox9070597
Chen, R., Jin, R., Wu, L., Ye, X., Yang, Y., Luo, K., et al. (2011). Reticulon 3 attenuates the clearance of cytosolic prion aggregates via inhibiting autophagy. Autophagy 7, 205–216. doi: 10.4161/auto.7.2.14197
Davis, A. P., Grondin, C. J., Johnson, R. J., Sciaky, D., Wiegers, J., Wiegers, T. C., et al. (2021). Comparative Toxicogenomics database (CTD): update 2021. Nucleic Acids Res. 49, D1138–D1143. doi: 10.1093/nar/gkaa891
De Lazzari, F., Bisaglia, M., Zordan, M. A., and Sandrelli, F. (2018). Circadian rhythm abnormalities in Parkinson's Disease from humans to flies and Back. Int. J. Mol. Sci. 19:3911. doi: 10.3390/ijms19123911
Earls, R. H., and Lee, J. K. (2020). The role of natural killer cells in Parkinson's disease. Exp. Mol. Med. 52, 1517–1525. doi: 10.1038/s12276-020-00505-7
Earls, R. H., Menees, K. B., Chung, J., Gutekunst, C. A., Lee, H. J., Hazim, M. G., et al. (2020). NK cells clear α-synuclein and the depletion of NK cells exacerbates synuclein pathology in a mouse model of α-synucleinopathy. Proc. Natl. Acad. Sci. USA 117, 1762–1771. doi: 10.1073/pnas.1909110117
Emamzadeh, F. N., and Surguchov, A. (2018). Parkinson's Disease: biomarkers, treatment, and risk factors. Front. Neurosci. 12:612. doi: 10.3389/fnins.2018.00612
Franz, M., Rodriguez, H., Lopes, C., Zuberi, K., Montojo, J., Bader, G. D., et al. (2018). GeneMANIA update 2018. Nucleic Acids Res. 46, W60–W64. doi: 10.1093/nar/gky311
Garaulet, M., Ordovás, J. M., Gómez-Abellán, P., Martínez, J. A., and Madrid, J. A. (2011). An approximation to the temporal order in endogenous circadian rhythms of genes implicated in human adipose tissue metabolism. J. Cell. Physiol. 226, 2075–2080. doi: 10.1002/jcp.22531
Garcia-Esparcia, P., Hernández-Ortega, K., Ansoleaga, B., Carmona, M., and Ferrer, I. (2015). Purine metabolism gene deregulation inParkinson's disease. Neuropathol. Appl. Neurobiol. 41, 926–940. doi: 10.1111/nan.12221
Garg, A., and Sinha, S. (2022). Doxorubicin induced aggregation of α-synuclein: insights into the mechanism of drug induced parkinsonism. Colloids Surf. B Biointerfaces 212:112371. doi: 10.1016/j.colsurfb.2022.112371
Gros, P., and Videnovic, A. (2020). Overview of sleep and circadian rhythm disorders in Parkinson Disease. Clin. Geriatr. Med. 36, 119–130. doi: 10.1016/j.cger.2019.09.005
Grumati, P., Morozzi, G., Hölper, S., Mari, M., Harwardt, M. I., Yan, R., et al. (2017). Full length RTN3 regulates turnover of tubular endoplasmic reticulum via selective autophagy. eLife 6:e25555. doi: 10.7554/eLife.25555
Guatteo, E., Berretta, N., Monda, V., Ledonne, A., and Mercuri, N. B. (2022). Pathophysiological features of Nigral dopaminergic neurons in animal models of Parkinson's Disease. Int. J. Mol. Sci. 23:4508. doi: 10.3390/ijms23094508
Hood, S., and Amir, S. (2017). The aging clock: circadian rhythms and later life. J. Clin. Invest. 127, 437–446. doi: 10.1172/JCI90328
Hunt, J., Coulson, E. J., Rajnarayanan, R., Oster, H., Videnovic, A., and Rawashdeh, O. (2022). Sleep and circadian rhythms in Parkinson's disease and preclinical models. Mol. Neurodegener. 17:2. doi: 10.1186/s13024-021-00504-w
Jankovic, J., and Tan, E. K. (2020). Parkinson's disease: etiopathogenesis and treatment. J. Neurol. Neurosurg. Psychiatry 91, 795–808. doi: 10.1136/jnnp-2019-322338
Jia, A., Yang, Z. W., Shi, J. Y., Liu, J. M., Zhang, K., and Cui, Y. F. (2022). MiR-325-3p alleviates acute pancreatitis via targeting RIPK3. Dig. Dis. Sci. 67, 4471–4483. doi: 10.1007/s10620-021-07322-6
Keenan, A. B., Torre, D., Lachmann, A., Leong, A. K., Wojciechowicz, M. L., Utti, V., et al. (2019). ChEA3: transcription factor enrichment analysis by orthogonal omics integration. Nucleic Acids Res. 47, W212–W224. doi: 10.1093/nar/gkz446
Kim, S., Chen, J., Cheng, T., Gindulyte, A., He, J., He, S., et al. (2023). PubChem 2023 update. Nucleic Acids Res. 51, D1373–D1380. doi: 10.1093/nar/gkac956
Krämer, A., Green, J., Pollard, J. Jr., and Tugendreich, S. (2014). Causal analysis approaches in ingenuity pathway analysis. Bioinformatics 30, 523–530. doi: 10.1093/bioinformatics/btt703
Kulisevsky, J., Luquin, M. R., Arbelo, J. M., Burguera, J. A., Carrillo, F., Castro, A., et al. (2013). Advanced Parkinson's disease: clinical characteristics and treatment (part 1). Neurologia 28, 503–521. doi: 10.1016/j.nrl.2013.05.001
Labib, A. Y., Ammar, R. M., El-Naga, R. N., El-Bahy, A., Tadros, M. G., and Michel, H. E. (2021). Mechanistic insights into the protective effect of paracetamol against rotenone-induced Parkinson's disease in rats: possible role of endocannabinoid system modulation. Int. Immunopharmacol. 94:107431. doi: 10.1016/j.intimp.2021.107431
Langfelder, P., and Horvath, S. (2008). WGCNA: an R package for weighted correlation network analysis. BMC Bioinformatics 9:559. doi: 10.1186/1471-2105-9-559
Li, J. H., Liu, S., Zhou, H., Qu, L. H., and Yang, J. H. (2014). starBase v2.0: decoding miRNA-ceRNA, miRNA-ncRNA and protein-RNA interaction networks from large-scale CLIP-Seq data. Nucleic Acids Res. 42, D92–D97. doi: 10.1093/nar/gkt1248
Li, S., Shui, K., Zhang, Y., Lv, Y., Deng, W., Ullah, S., et al. (2017). CGDB: a database of circadian genes in eukaryotes. Nucleic Acids Res. 45, D397–D403. doi: 10.1093/nar/gkw1028
Liu, T. T., Li, R., Huo, C., Li, J. P., Yao, J., Ji, X. L., et al. (2021). Identification of CDK2-related immune forecast model and ceRNA in lung adenocarcinoma, a Pan-Cancer analysis. Front. Cell Dev. Biol. 9:682002. doi: 10.3389/fcell.2021.682002
Maiti, P., Manna, J., and Dunbar, G. L. (2017). Current understanding of the molecular mechanisms in Parkinson's disease: targets for potential treatments. Transl Neurodegener 6:28. doi: 10.1186/s40035-017-0099-z
McGeary, S. E., Lin, K. S., Shi, C. Y., Pham, T. M., Bisaria, N., Kelley, G. M., et al. (2019). The biochemical basis of microRNA targeting efficacy. Science 366:eaav1741. doi: 10.1126/science.aav1741
Miki, Y., Shimoyama, S., Kon, T., Ueno, T., Hayakari, R., Tanji, K., et al. (2018). Alteration of autophagy-related proteins in peripheral blood mononuclear cells of patients with Parkinson's disease. Neurobiol. Aging 63, 33–43. doi: 10.1016/j.neurobiolaging.2017.11.006
Möller-Levet, C. S., Archer, S. N., Bucca, G., Laing, E. E., Slak, A., Kabiljo, R., et al. (2013). Effects of insufficient sleep on circadian rhythmicity and expression amplitude of the human blood transcriptome. Proc. Natl. Acad. Sci. USA 110, E1132–E1141. doi: 10.1073/pnas.1217154110
Musachio, E., Araujo, S. M., Bortolotto, V. C., de Freitas Couto, S., Dahleh, M., Poetini, M. R., et al. (2020). Bisphenol a exposure is involved in the development of Parkinson like disease in Drosophila melanogaster. Food Chem. Toxicol. 137:111128. doi: 10.1016/j.fct.2020.111128
Mutez, E., Larvor, L., Leprêtre, F., Mouroux, V., Hamalek, D., Kerckaert, J. P., et al. (2011). Transcriptional profile of Parkinson blood mononuclear cells with LRRK2 mutation. Neurobiol. Aging 32, 1839–1848. doi: 10.1016/j.neurobiolaging.2009.10.016
Ooi, S., Jiang, H., Kang, Y., and Allard, P. (2021). Examining the developmental trajectory of an in vitro model of mouse primordial germ cells following exposure to environmentally relevant Bisphenol a levels. Environ. Health Perspect. 129:97013. doi: 10.1289/EHP8196
Ptak, A., and Gregoraszczuk, E. L. (2012). Bisphenol a induces leptin receptor expression, creating more binding sites for leptin, and activates the JAK/stat, MAPK/ERK and PI3K/Akt signalling pathways in human ovarian cancer cell. Toxicol. Lett. 210, 332–337. doi: 10.1016/j.toxlet.2012.02.003
Reiter, R. J., Sharma, R., and Ma, Q. (2021). Switching diseased cells from cytosolic aerobic glycolysis to mitochondrial oxidative phosphorylation: a metabolic rhythm regulated by melatonin. J. Pineal Res. 70:e12677. doi: 10.1111/jpi.12677
Robin, X., Turck, N., Hainard, A., Tiberti, N., Lisacek, F., Sanchez, J. C., et al. (2011). pROC: an open-source package for R and S+ to analyze and compare ROC curves. BMC Bioinform. 12:77. doi: 10.1186/1471-2105-12-77
Serin, Y., and Acar Tek, N. (2019). Effect of circadian rhythm on metabolic processes and the regulation of energy balance. Ann. Nutr. Metab. 74, 322–330. doi: 10.1159/000500071
Sharoar, M. G., and Yan, R. (2017). Effects of altered RTN3 expression on BACE1 activity and Alzheimer's neuritic plaques. Rev. Neurosci. 28, 145–154. doi: 10.1515/revneuro-2016-0054
Shin, J. H., Ko, H. S., Kang, H., Lee, Y., Lee, Y. I., Pletinkova, O., et al. (2011). PARIS (ZNF746) repression of PGC-1α contributes to neurodegeneration in Parkinson's disease. Cell 144, 689–702. doi: 10.1016/j.cell.2011.02.010
Shkodina, A. D., Tan, S. C., Hasan, M. M., Abdelgawad, M., Chopra, H., Bilal, M., et al. (2022). Roles of clock genes in the pathogenesis of Parkinson's disease. Ageing Res. Rev. 74:101554. doi: 10.1016/j.arr.2021.101554
Spira, J. L., and Spiegel, D. (1992). Hypnosis and related techniques in pain management. Hosp. J. 8, 89–119. doi: 10.1300/J011v08n01_05
Stoker, T. B., and Greenland, J. C. (2018). Parkinson’s Disease: Pathogenesis and clinical aspects. Brisbane (AU): Codon Publications.
Su, R., Jin, C., Bu, H., Xiang, J., Zhou, L., and Jin, C. (2022). Development and validation of an immune-related prognostic signature in cervical Cancer. Front. Oncol. 12:861392. doi: 10.3389/fonc.2022.861392
Surguchov, A., and Surguchev, A. (2022). Synucleins: new data on Misfolding, aggregation and role in diseases. Biomedicines 10:3241. doi: 10.3390/biomedicines10123241
Thongkorn, S., Kanlayaprasit, S., Jindatip, D., Tencomnao, T., Hu, V. W., and Sarachana, T. (2019). Sex differences in the effects of prenatal Bisphenol a exposure on genes associated with autism Spectrum disorder in the Hippocampus. Sci. Rep. 9:3038. doi: 10.1038/s41598-019-39386-w
Tolosa, E., Garrido, A., Scholz, S. W., and Poewe, W. (2021). Challenges in the diagnosis of Parkinson's disease. Lancet Neurol. 20, 385–397. doi: 10.1016/S1474-4422(21)00030-2
Verheijen, M., Schrooders, Y., Gmuender, H., Nudischer, R., Clayton, O., Hynes, J., et al. (2018). Bringing in vitro analysis closer to in vivo: studying doxorubicin toxicity and associated mechanisms in 3D human microtissues with PBPK-based dose modelling. Toxicol. Lett. 294, 184–192. doi: 10.1016/j.toxlet.2018.05.029
Videnovic, A., and Zee, P. C. (2015). Consequences of circadian disruption on neurologic health. Sleep Med. Clin. 10, 469–480. doi: 10.1016/j.jsmc.2015.08.004
Vijay, V., Moland, C. L., Han, T., Fuscoe, J. C., Lee, T., Herman, E. H., et al. (2016). Early transcriptional changes in cardiac mitochondria during chronic doxorubicin exposure and mitigation by dexrazoxane in mice. Toxicol. Appl. Pharmacol. 295, 68–84. doi: 10.1016/j.taap.2016.02.003
Wang, Y., Wang, Z., Sun, J., and Qian, Y. (2021). Identification of HCC subtypes with different prognosis and metabolic patterns based on Mitophagy. Front. Cell Dev. Biol. 9:799507. doi: 10.3389/fcell.2021.799507
Wang, H., Zhou, Z., Liu, Y., Wang, P., Chen, L., Qi, S., et al. (2022). Identification and validation of HOXD3 and UNC5C as molecular signatures in keloid based on weighted gene co-expression network analysis. Genomics 114:110403. doi: 10.1016/j.ygeno.2022.110403
Yang, W., Hamilton, J. L., Kopil, C., Beck, J. C., Tanner, C. M., Albin, R. L., et al. (2020). Current and projected future economic burden of Parkinson's disease in the U.S. NPJ Parkinson's Dis. 6:15. doi: 10.1038/s41531-020-0117-1
Yang, Y., Wu, X., Lu, X., Wang, C., Xiang, L., and Zhang, C. (2022). Identification and validation of autophagy-related genes in vitiligo. Cells 11:1116. doi: 10.3390/cells11071116
Yin, Z., Deng, J., Zhou, M., Li, M., Zhou, E., Liu, J., et al. (2022). Exploration of a novel circadian miRNA pair signature for predicting prognosis of lung adenocarcinoma. Cancers (Basel) 14:5106. doi: 10.3390/cancers14205106
Yin, X., Wang, M., Wang, W., Chen, T., Song, G., Niu, Y., et al. (2022). Identification of potential miRNA-mRNA regulatory network contributing to Parkinson's Disease. Parkinson's Dis. 2022:2877728. doi: 10.1155/2022/2877728
Yu, G., Wang, L. G., Han, Y., and He, Q. Y. (2012). clusterProfiler: an R package for comparing biological themes among gene clusters. OMICS 16, 284–287. doi: 10.1089/omi.2011.0118
Yu, D., Wu, L., Gill, P., Tolleson, W. H., Chen, S., Sun, J., et al. (2018). Multiple microRNAs function as self-protective modules in acetaminophen-induced hepatotoxicity in humans. Arch. Toxicol. 92, 845–858. doi: 10.1007/s00204-017-2090-y
Keywords: Parkinson’s disease, circadian rhythm, GEO, bioinformatics, biomarkers
Citation: Zhang J, Ma X, Li Z, Liu H, Tian M, Wen Y, Wang S and Wang L (2024) Identification of key genes and diagnostic model associated with circadian rhythms and Parkinson’s disease by bioinformatics analysis. Front. Aging Neurosci. 16:1458476. doi: 10.3389/fnagi.2024.1458476
Edited by:
Robert Petersen, Central Michigan University, United StatesReviewed by:
Andrei Surguchov, University of Kansas Medical Center, United StatesDhiraj Kumar, National Eye Institute (NIH), United States
Copyright © 2024 Zhang, Ma, Li, Liu, Tian, Wen, Wang and Wang. This is an open-access article distributed under the terms of the Creative Commons Attribution License (CC BY). The use, distribution or reproduction in other forums is permitted, provided the original author(s) and the copyright owner(s) are credited and that the original publication in this journal is cited, in accordance with accepted academic practice. No use, distribution or reproduction is permitted which does not comply with these terms.
*Correspondence: Liang Wang, d2FuZ2xpYW5nMDIxNDEwOEAxNjMuY29t
†These authors have contributed equally to this work