
94% of researchers rate our articles as excellent or good
Learn more about the work of our research integrity team to safeguard the quality of each article we publish.
Find out more
ORIGINAL RESEARCH article
Front. Aging Neurosci. , 18 June 2018
Sec. Alzheimer's Disease and Related Dementias
Volume 10 - 2018 | https://doi.org/10.3389/fnagi.2018.00175
 Ling-Yun Fan1,2Kai-Yuan Tzen3,4,5Ya-Fang Chen6
 Ta-Fu Chen1
 Ya-Mei Lai1Ruoh-Fang Yen3,5Ya-Yao Huang5
 Chyng-Yann Shiue3,5,7
 Shieh-Yueh Yang8
 Ming-Jang Chiu1,2,9,10*
Background: Neuritic plaques and neurofibrillary tangles are the pathological hallmarks of Alzheimer’s disease (AD), while the role of brain amyloid deposition in the clinical manifestation or brain atrophy remains unresolved. We aimed to explore the relation between brain amyloid deposition, cortical thickness, and plasma biomarkers.
Methods: We used 11C-Pittsburgh compound B-positron emission tomography to assay brain amyloid deposition, magnetic resonance imaging to estimate cortical thickness, and an immunomagnetic reduction assay to measure plasma biomarkers. We recruited 39 controls, 25 subjects with amnesic mild cognitive impairment (aMCI), and 16 subjects with AD. PiB positivity (PiB+) was defined by the upper limit of the 95% confidence interval of the mean cortical SUVR from six predefined regions (1.0511 in this study).
Results: All plasma biomarkers showed significant between-group differences. The plasma Aβ40 level was positively correlated with the mean cortical thickness of both the PiB+ and PiB- subjects. The plasma Aβ40 level of the subjects who were PiB+ was negatively correlated with brain amyloid deposition. In addition, the plasma tau level was negatively correlated with cortical thickness in both the PiB+ and PiB- subjects. Moreover, cortical thickness was negatively correlated with brain amyloid deposition in the PiB+ subjects. In addition, the cut-off point of plasma tau for differentiating between controls and AD was higher in the PiB- group than in the PiB+ group (37.5 versus 25.6 pg/ml, respectively). Lastly, ApoE4 increased the PiB+ rate in the aMCI and control groups.
Conclusion: The contributions of brain amyloid deposition to cortical atrophy are spatially distinct. Plasma Aβ40 might be a protective indicator of less brain amyloid deposition and cortical atrophy. It takes more tau pathology to reach the same level of cognitive decline in subjects without brain amyloid deposition, and ApoE4 plays an early role in amyloid pathogenesis.
Although neuritic plaques composed of beta-amyloid (Aβ) fibrils and neurofibrillary tangles (NFTs) consisting of hyperphosphorylated tau protein are the pathological hallmarks of Alzheimer’s disease (AD), the role of brain amyloid deposition in the clinical manifestation or brain atrophy of AD has been debated over decades.
On the one hand (advantages), Aβ deposition has been associated with cognitive decline and neurodegeneration (Frisoni et al., 2009; Villemagne et al., 2013; Sevigny et al., 2016; Iaccarino et al., 2018; Jacobs et al., 2018) or even with emotional (Krell-Roesch et al., 2018) and behavioral symptoms (Marshall et al., 2013; Mori et al., 2014). A recent functional connectivity study showed that brain regions involved in the default mode network (including the precuneus, posterior cingulate, and angular gyrus and medial prefrontal cortex) happen to be among the earliest brain regions of amyloid deposition. Studies also showed that disconnection of the default mode network was related to cognitive dysfunction (Gili et al., 2011) and that functional connectivity and glucose metabolism showed a negative correlation with amyloid burden in nondemented older individuals (Drzezga et al., 2011). On the other hand (disadvantages), Aβ deposition may also be found in some cognitively normal older people (Rowe et al., 2007), even in those already showing cortical thinning (Becker et al., 2011). Functional imaging studies using 18F-deoxyglucose-positron emission tomography (PET) showed inconsistent results regarding whether this region showed hypermetabolism or hypometabolism in PiB-positive (PiB+) normal subjects, and a structural study assessing the cortical thickness in these vulnerable brain regions also showed variable results in this group (Oh et al., 2014a). There are still healthy subjects with prominent brain amyloid deposition, either neuritic or diffuse plaques, who remain cognitively unimpaired throughout life (Malek-Ahmadi et al., 2016).
Nevertheless, the development of brain amyloid imaging by PET has advanced dementia research (Villemagne et al., 2013) and clinical trials, especially for AD (Liu et al., 2015; Sevigny et al., 2016). An inverse relation between in vivo amyloid deposition measured by 11C-Pittsburgh compound B (11C-PiB)-PET and cerebral spinal fluid (CSF) Aβ42 has long been proposed (Fagan et al., 2006). The relation between CSF Aβ and amyloid deposition has been further explored in subjects with normal cognition and preclinical AD (Racine et al., 2016). On the other hand, blood is an easily accessible biofluid, which can be routinely collected and analyzed repetitively to detect or track the disease. However, studies of the relation between plasma biomarkers and the in vivo amyloid deposition measured by 11C-PiB-PET still showed mixed results (Kaneko et al., 2014; Tzen et al., 2014; Racine et al., 2016; Fandos et al., 2017; Park et al., 2017). Moving from CSF to blood is a clinical trend of using biomarkers for AD (Blennow, 2017). A reliable blood-based biomarker for AD would be useful in large-scale screening of the general population, diagnosis, and therapeutic decision-making in clinical settings, and longitudinal follow-up of therapeutic effects for disease-modifying therapy in clinical trials (Wang et al., 2017). Our group has developed a superconductivity-based ultrasensitive immunomagnetic reduction (IMR) assay that is reliable for measuring plasma biomarkers of AD and other neurodegenerative diseases (Chiu et al., 2012, 2013; Lee et al., 2016; Yang et al., 2016; Lin et al., 2017).
The epsilon four allele of apolipoprotein (ApoE4) has been identified as an independent risk factor for sporadic AD and a genetic factor that is associated with a lower age at disease onset (Bertram and Tanzi, 2005; Sando et al., 2008). Biomarker studies in subjects with subjective cognitive decline and early mild cognitive impairment (MCI) have revealed increased Aβ deposition and decreased CSF Aβ levels in ApoE4 carriers (Risacher et al., 2013, 2015). In addition, a recent study indicated that there is a positive relationship between plasma Aβ40/Aβ42 and 11C-PiB-PET amyloid deposition (Swaminathan et al., 2014).
Therefore, the aims of the present study are the following: first, to evaluate whether cortical amyloid deposition is related to blood biomarkers and clinical manifestation of dementia; second, to elucidate the relation between amyloid deposition and cortical atrophy in individual brain regions; and third, to explore the effects of ApoE4 carrier status on cortical amyloid deposition in healthy control subjects, subjects with amnesic MCI (aMCI) and subjects with AD.
In this case–control observational study, we included a total of 80 subjects, who were divided into three groups: 39 healthy control subjects, 25 MCI subjects, and 16 AD subjects. Subjects with the diagnoses of aMCI or AD were recruited from the Department of Neurology and Memory Clinic of the National Taiwan University Hospital according to the National Institute on Aging/Alzheimer’s Association Diagnostic Guidelines for MCI due to AD and dementia due to AD (Jack et al., 2011; McKhann et al., 2011; Sperling et al., 2011). Subjects with major systemic diseases, neuropsychiatric disorders, and visual or auditory problems sufficiently severe to interfere with the cognitive function tests were excluded. The demographic data and basic clinical information, including age, gender, education year, Taiwanese Mental Status Examination score, and Clinical Dementia Rating (CDR) score, were collected. A neuropsychological test battery was performed by a board-certified clinical neuropsychologist to help demarcate mild changes in cognition in the subjects with aMCI and in normal daily function. The battery of neuropsychological tests included the Wisconsin Card Sorting Test, Trail Making Test parts A and B, digit span test, logical memory subtests of the Wechsler Memory Scale Version III, Wechsler Adult Intelligence Scale Version III, semantic verbal fluency test, word sequence learning test, visual recognition test, and three-dimensional (3D) block design test as well as a basic language evaluation. The cut-off point for the diagnosis of aMCI was below the fourth percentile of the scaled scores of the age- and education-matched controls of their performance on the neuropsychological tests. The ethics committee of the National Taiwan University Hospital approved the study (201301036 RIND). All subjects and/or their proxies gave their written informed consent before participation in the study. ApoE genotyping was also performed for all participants. All subjects received a 11C-PiB-PET scan and underwent a 3D T1-weighted brain magnetic resonance imaging (MRI) scan for the measurements of cortical thickness and subcortical volume.
Positron emission tomography data were acquired using a PET/CT scanner (Discovery ST4, GE Healthcare, Chicago, IL, United States) with a 2D mode, 47 image planes, and a 15.0-cm axial field of view. After injecting 370–555 MBq of 11C-PiB, the PET data were acquired over 30 min (40–70 min postinjection). The emission data were corrected for attenuation, scatter, and radioactive decay, and reconstructed using the ordered subset expectation maximization (OSEM) algorithm with 2 iterations and 15 subsets. A full-width at half-maximum (FWHM) of the 3D Gaussian smoothing kernel (6 mm) was applied to the images in the transverse plane before estimating the realignment parameters. A cranial computer tomography (CT) scan was obtained from each participant before a PET session, so that PET/CT image coregistration could be performed.
The 11C-PiB-PET image preprocessing was performed with SPM12 software1. First, 11C-PiB-PET images were coregistered to the CT brain images and were then further coregistered to the T1-weighted brain MRI template. Second, the T1-coregistered 11C-PiB-PET images were normalized to the Montreal Neurological Institute (MNI) space and then smoothed. Third, the amyloid retention in each cortical region was extracted using the MarsBaR toolbox of SPM (Matthew Brett et al., 2002) in the template of the Automated Anatomical Labeling (AAL) atlas. The standard uptake value (SUV) was calculated as the SUV within each cortical region. The mean cerebellar SUV was taken as the average of the cerebellar gray matter (22 regions). Each cortical SUV was subsequently normalized to the mean cerebellar SUV to define the SUV ratio (SUVR) of each cortical region. We calculated the cut-off point for PiB positivity (PiB+) by averaging the SUVRs from the frontal, parietal, lateral temporal, precuneus, anterior, and post-cingulate cortices, and used the upper limit of the 95% confidence interval of the control group as the cut-off point for PiB+, which was 1.0511 in this study (Mormino et al., 2012; Oh et al., 2014b).
High-resolution structural brain MRI scans were acquired using a 1.5-T MRI scanner (EXCITE, General Electric, Milwaukee, WI, United States). A whole-brain T1-weighted 3D spoiled gradient recovery (SPGR) sequence was used (TE = 9.3 ms, TR = 3.9 ms, TI = 600 ms, flip angle = 12°, matrix size = 192 × 192, and FOV = 25 cm), and 170 images of contiguous sagittal slices that were 1.3 mm in thickness were acquired. The analyzed datasets included the T1-weighted structural MRI scans obtained from all of the available subjects (n = 80). The MRI image analysis to determine the cortical thickness, gray matter volume, and white matter volume was performed using the FreeSurfer software package (we used the Destrieux cortical atlas with fine parcellation of the cortical areas, we then combined space-related Destrieux cortical areas to approximate an AAL cortical area for comparison with the findings from PET images)2.
Approximately 20 ml of whole blood was collected into EDTA-treated tubes. The samples were centrifuged at 2,500 × g for 15 min at room temperature within 15 min of the blood draw. The plasma was removed, aliquoted into various volumes, and stored at -80°C. The white blood cell pellets were used for determination of the ApoE genotype. The assays were carried out without knowledge of individual identification or diagnosis. The blood sampling process was arranged to ensure consistency with previous studies using IMR-based assays (Chiu et al., 2012, 2013).
The reagents used to assay the biomarkers consisted of magnetic nanoparticles coated with dextran and antibodies. All antibody-functionalized magnetic nanoparticles were dispersed in phosphate-buffered saline solution. The magnetic core was Fe3O4. Depending on the biomarkers, different antibodies were separately conjugated to dextran-coated magnetic nanoparticles. The antibody used for the reagent assaying Aβ40 was anti-β amyloid (A3981, Sigma). The antibody used for the reagent assaying Aβ42 was anti-β amyloid 37–42 (ab34376, Abcam). The antibody used for the reagent assaying tau was anti-tau (T9450, Sigma). The averaged values of the hydrodynamic diameters of the antibody-functionalized magnetic nanoparticles were approximately 55 nm. The concentration of each kind of reagent was 8 mg Fe/ml.
For IMR measurements, 80 μl of Aβ1-40 reagent (MF-AB0-0060, MagQu) was mixed with 40 μl of sample, 60 μl of Aβ1-42 reagent (MF-AB2-0060, MagQu) was mixed with 60 μl of sample, and 80 μl of tau reagent (MF-TAU-0060, MagQu) was mixed with 40 μl of sample for assaying Aβ1-40, Aβ1-42, and tau, respectively. Duplicated measurements were conducted for each biomarker per sample. The measurements were performed with an IMR analyzer (XacPro-S, MagQu). For further technological details, please refer to our previous work (Yang et al., 2011, 2017; Chiu et al., 2012, 2013).
Parametric variables, including age, education years, TMSE scores, and neuroimaging measures, were analyzed and examined for intergroup differences using analysis of variance (ANOVA) with post hoc test using Bonferroni method. Nonparametric data, such as gender, ApoE4 carrier status, and brain amyloid positivity, were compared using the Pearson Chi-square test for intergroup differences. Multivariate analysis of covariance (MANCOVA), using age as the covariate, was applied to examine all of the cortical regions of interest (ROIs) for significant between-group differences in cortical amyloid deposition and cortical thickness with a false-discovery rate (FDR) correction for type I error (Benjamini–Hochberg procedure) for multiple comparisons.
Lastly, the Spearman correlation analysis was used to clarify the correlation between plasma levels of biomarkers, cortical thickness, and amyloid deposition in subjects with high amyloid deposition, designated the PiB+ group, and in those with low amyloid deposition, designated the PiB– group, respectively. We further examined the contribution of plasma biomarkers and amyloid deposition to cortical thickness by using stepwise linear regression. All statistical analyses were performed by using SPSS software version 22.0 (IBM, Armonk, NY, United States).
There were no significant between-group differences in age, education years, and gender distribution (Table 1). The percentage of ApoE4 carrier status was highest in the AD group, followed by the aMCI group and the control group (Pearson Chi-square 6.348, P = 0.042). The plasma biomarkers showed significant between-group differences in levels of total tau, Aβ40, and Aβ42: post hoc test using Bonferroni method further showed that plasma tau levels were significantly different between the control group and both the aMCI and AD groups (both P < 0.001), and the plasma tau levels between the aMCI group and the AD group also showed a significant difference (P = 0.001) (control < aMCI < AD); plasma levels of Aβ40 were significantly different between the control group and both the aMCI and AD groups (both P < 0.001) but not between the aMCI group and the AD group (control > aMCI and control > AD); plasma Aβ42 levels were significantly different between the AD group and both the control and aMCI groups (both P < 0.001) but not between the aMCI group and the control group (Table 2 and Figure 1A) (control < AD and aMCI < AD).
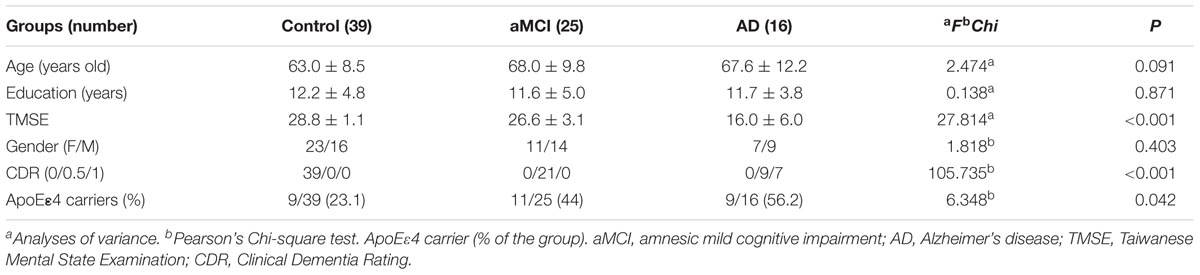
TABLE 1. Demographic and clinical information of the three groups.
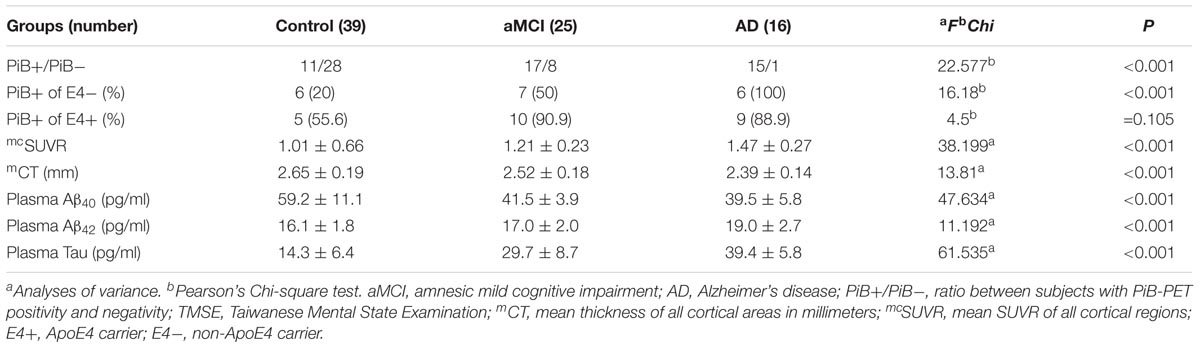
TABLE 2. Biomarkers of the three groups.
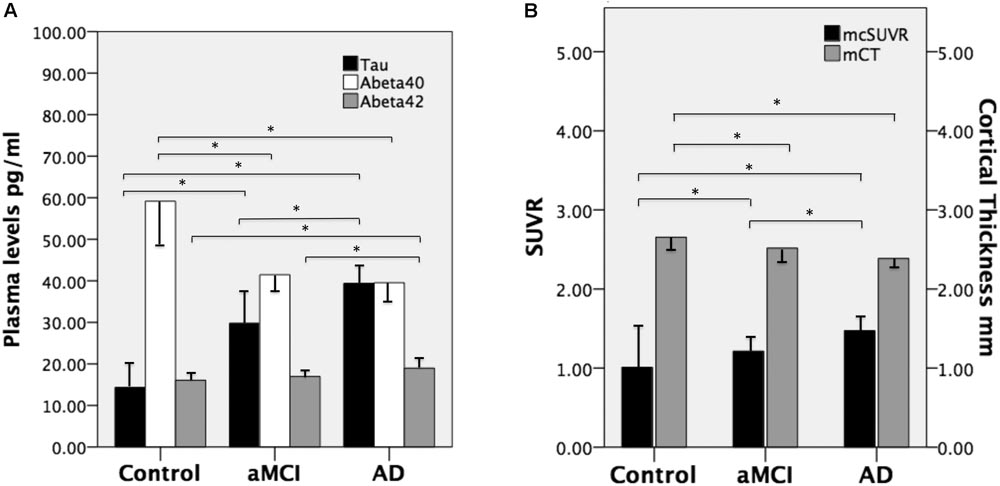
FIGURE 1. (A) Mean plasma levels of tau, Aβ40, and Aβ42 in the three groups and the between-group differences (∗ indicates P ≤ 0.001). (B) The mean cortical thickness in millimeters (mCT) and mean cortical SUVR (mcSUVR) in the three groups and the between-group differences (∗ indicates P < 0.001). aMCI, amnesic mild cognitive impairment and AD, Alzheimer’s disease. T bars (inversed T bars) stand for 1 standard deviation of each biomarker of each group.
We calculated the mean SUVR of all cortical regions to obtain the mean cortical SUVR (mcSUVR) for each subject. There was a significant between-group difference for mcSUVR (P < 0.001). The post hoc analyses showed significant differences between all three groups (all P < 0.001; Table 2) (control < aMCI < AD). In a similar vein, we calculated the mean cortical thickness of all cortical regions (mCT) for each subject. There was a significant between-group difference for mCT (P < 0.001); post hoc analyses showed significant differences between the control group and both the aMCI (P = 0.01) and AD groups (P < 0.001) but not between the aMCI group and the AD group (P = 0.074; Table 2 and Figure 1B) (control > aMCI and control > AD).
First, we examined the relation between plasma biomarkers and mCT in both the PiB+ group (n = 42) and PiB- group (n = 38). Plasma Aβ40 levels were positively correlated with mCT in both the PiB+ (rho = 0.457, P = 0.002) and PiB- groups (rho = 0.351, P = 0.031). Plasma tau levels were negatively correlated with mCT in both the PiB+ group (rho = -0.59, P = 0.02) and PiB- group (rho = -0.322, P = 0.048). Plasma Aβ42 levels were negatively correlated with mCT in the PiB- group (rho = -0.338, P = 0.038) but not in the PiB+ group (rho = -0.051, P = 0.750).
Second, we examined the relation between plasma biomarkers and mcSUVR in both the PiB+ group and PiB- group. Plasma Aβ40 levels were negatively correlated with mcSUVR in the PiB+ group (rho = -0.585, P < 0.001) but not in the PiB– group (rho = -0.203, P = 0.221). Plasma tau levels showed a significant positive correlation with mcSUVR in the PiB+ group (rho = 0.422, P = 0.003) but not in the PiB- group (rho = 0. 126, P = 0.451). Plasma Aβ42 levels were not significantly correlated with mcSUVR in both the PiB– group (rho = -0.295, P = 0.072) and PiB+ group (rho = -0.281, P = 0.072).
In summary, there was no significant correlation between plasma biomarkers and mcSUVR in the PiB(-) group.
Then, we examined the relation between mCT and mcSUVR. mCT was negatively correlated with mcSUVR (rho = -0.506, P = 0.001) in the PiB+ group but not in the PiB- group (rho = 0.04, P = 0.81). We also found a negative correlation between MMSE scores and plasma tau levels in the PiB+ group (rho = -0.624, P < 0.001) but not in the PiB- group (rho = -0.188, P = 0.259). Age was not significantly correlated with plasma biomarkers, mCT, or mcSUVR in PiB+ group or the PiB- group.
We further examined the contribution of plasma biomarkers and mcSUVR (independent variables) to mCT (dependent variable) by stepwise linear regression analysis. In Supplementary Figure 1, univariate linear regression of the plasma biomarkers and mcSUVR is shown, demonstrating a linear relation between plasma biomarkers, amyloid deposition, and cortical atrophy. Age and ApoE4 loading were also included as covariates in the stepwise linear regression analysis. The results showed that mcSUVR contributed the most to mCT accounting for about 20% of the factor (R square change 0.210, F 20.678, P < 0.001, β -0.305 Model II) followed by plasma Aβ40 level, which explained additional 6.5% (R square change 0.065, F 6.895, P = 0.010, β 0.297 Model II). Finally, we examined the contribution of mcSUVR (independent variables) to plasma tau levels (dependent variable) by stepwise linear regression analysis with age, ApoE4 loading, and mCT included as covariates. We found that mcSUVR was the only contributing factor explaining more than 25% (R square change 0.257, F 26.978, P < 0.001, β 0.507 Model I) for plasma tau levels.
In the PiB- group, the cut-off points of plasma biomarkers for differentiating between controls and subjects with AD are much higher (tau 37.54 pg/ml and Aβ42 21.92 pg/ml) than those of their PiB+ counterparts (tau 25.57 pg/ml and Aβ42 16.81 pg/ml) (Table 3). On the other hand, the mcSUVR cut-off point of the PiB+ subjects (1.2167) is higher than that of their PiB- counterparts (1.0143).
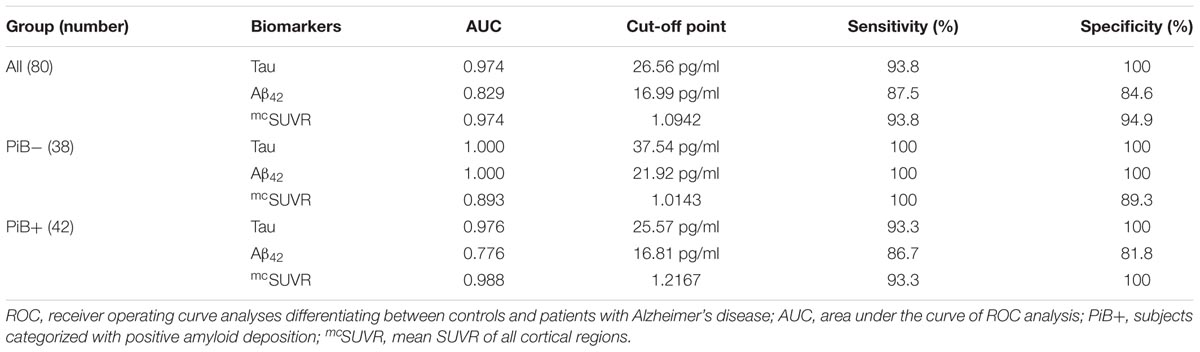
TABLE 3. Results of the ROC analyses of plasma biomarkers and amyloid deposition.
Aβ40 have low AUC (0.058) thus a useful cut-off point is not available. From the above receiver operating curve (ROC) analyses we may conclude that plasma tau levels and Aβ42 levels together with mcSUVR are useful biomarkers for differentiating controls and subjects with AD.
There were significant region-specific between-group differences in cortical thickness in most regions (all P < 0.009, FDR adjustment) except in the bilateral orbital frontal gyri, fusiform gyri, anterior cingulate, and right inferior frontal gyrus and lingual gyrus (Table 3). On the other hand, there were significant region-specific between-group differences in amyloid deposition in most regions (all P < 0.009, FDR adjustment) except in the bilateral temporal poles and inferior temporal gyri (Table 3).
The relationship between amyloid deposition and cortical thickness (designated atrophy due to a negative correlation) could be categorized into two groups according to their levels of correlation. Group I was the group with relatively high (compared to the rest of the analyzed regions) levels of correlation (H in Table 4) and a designated significance level of P < 0.005 on either side of the cortical region, with the Spearman rho ranging from -0.317 to -0.514 (Supplementary Table 1). The cortical regions in group I were heteromodal isocortices, which also had significant between-group differences in cortical thickness and amyloid deposition. Group II consisted of either low levels of correlation, with the Spearman rho ranging from -0.070 to -0.215 (P > 0.05) on both sides, or moderate levels of correlation, with the Spearman rho ranging from -0.221 to -0.314 (P < 0.05 but P ≥ 0.005 on either side; Supplementary Table 1). Group II was further classified phylogenetically into three subgroups, IIa limbic (allocortex), IIb paralimbic (mesocortex or periallocortex), and IIIc proisocortex (unimodal neocortex that abuts the insula and parahippocampus) (Table 4). In group-IIa, both the hippocampus and amygdala had significant brain atrophy and amyloid deposition, while the correlation levels between atrophy and deposition were low for amygdala and moderate for hippocampus. In group-IIb, except the temporal poles, all regions had significant between-group differences in amyloid deposition. On the other hand, the brain atrophy was variable, and there was no significant atrophy in the frontal orbital gyri and anterior cingulate gyri. In group-IIc, all but the inferior temporal gyri had significant between-group differences in amyloid deposition. The fusiform gyri had no significant between-group difference in cortical thickness.
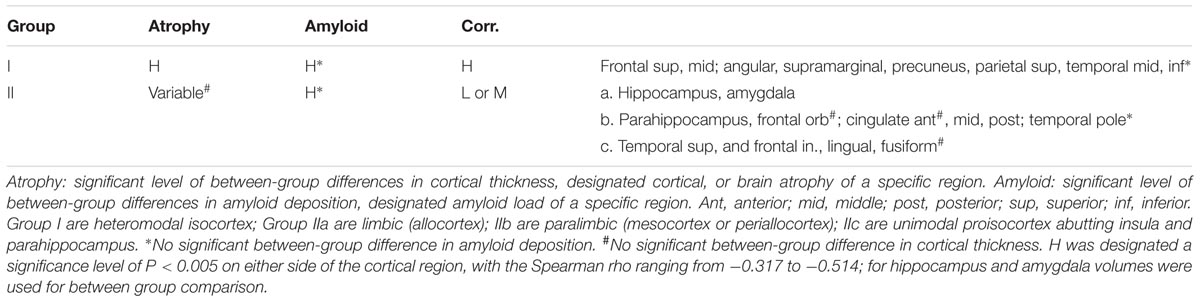
TABLE 4. Grouping of regions by significance of amyloid deposition, cortical atrophy, and correlation.
The percentage of PiB+ was higher in both the aMCI and AD groups than in the control group; ApoE4 carrier status increased the rate of PiB+, especially in the aMCI group and the control group (Table 2).
We demonstrated in this study that cortical amyloid deposition, in terms of mcSUVR, explains more than 20% of the cortical thickness. In the same vein, mcSUVR explains more than 25% of the plasma tau levels, which are surrogate biomarkers of neuroaxonal injury due to neurodegeneration. Cortical thickness was negatively correlated with amyloid deposition, plasma tau was negatively correlated with cognitive decline but positively with amyloid deposition only in the PiB+ group but not in the PiB- group. These findings support the hypothesis that Aβ may increase the accumulation of tau aggregates and, in particular, accelerate the spread of tau into the isocortex with the consequence of neuronal loss, cortical atrophy (R. Sperling et al., 2014) and cognitive decline. Numerically, the lack of associations between plasma biomarkers and cerebral amyloid deposition in the PiB- group could be best explained by the floor effect of the mcSUVR in this group.
Then, we found that in the PiB+ group, plasma Aβ40 was negatively correlated with amyloid deposition (r = -0.510, P = 0.001), although amyloid plaques in Alzheimer’s pathology mainly consist of Aβ42 despite the fact that Aβ40 is several fold more abundant in the brain as well as the plasma (Hardy and Selkoe, 2002; Chiu et al., 2012; Tzen et al., 2014; Economou et al., 2016). Some studies showed that although Aβ40 fibrils may participate in the formation of amyloid plaques, the aggregation of Aβ40 fibrils is too slow to form insoluble aggregates to account for amyloid deposition in AD (McGowan et al., 2005). In a transgenic mouse study, intraneuronal Aβ42 but not Aβ40 was found to lead to cellular Aβ lesions (Abramowski et al., 2012). This might suggest that there is dissociated neuronal toxicity between these two major alloforms of Aβ, i.e., Aβ42 versus Aβ40 (Sengupta et al., 2016). In addition, plasma Aβ40 levels also showed a positive correlation with total cortical thickness in both the PiB+ group (rho = 0.510, P = 0.001) and PiB- group (rho = 0.402, P = 0.007). This might imply not only that Aβ40 is less toxic in the brain but also that the plasma Aβ40 level may be a protective indicator in terms of less cortical atrophy and less amyloid pathology. The effect of age on cortical thickness was significant only in the control group (rho = -0.356, P = 0.026), which is in agreement with previous studies (Thambisetty et al., 2010; Hurtz et al., 2014). Cortical atrophy may be attributed more to disease severity than to age within the prodromal or early dementia stage of AD.
In PiB- group, the cut-off point of the plasma tau level (37.54 pg/ml) is much higher than in their amyloid positive counterparts (25.57 pg/ml). This might suggest that without the participation of amyloid plaques in the brain, total plasma tau levels, a surrogate biomarker of neuronal loss, would be elevated to reach the same level of cognitive decline (Rosen et al., 2013; Tatebe et al., 2017).
In this study, we found significant between-group differences in cortical thickness (cortical atrophy) in the bilateral hippocampus; parahippocampus; amygdala; middle and posterior cingulate, angular, and supramarginal gyrus; precuneus; and bilateral temporal, superior, and middle frontal cortices, which is in accordance with AD-signature areas (Dickerson et al., 2009; Abu-Raya et al., 2016). Furthermore, our results revealed cortical thinning over multimodal association cortical regions, such as the angular gyrus, supramarginal gyrus, precuneus, bilateral temporal cortices, and superior and middle frontal cortices, which are phylogenetically heteromodal isocortices (Table 4). In contrast, the hippocampus, amygdala, and cingulate cortices are allocortex (limbic) or periallocortex (paralimbic) phylogenetically, and the atrophy in these regions is much less dependent on the existence of amyloid protein (Table 4).
According to previous studies, some AD-signature regions with cortical thinning primarily contribute by accumulating NFTs, whereas in other regions, both amyloid plaques and NFTs account for cortical atrophy (Arnold et al., 1991; Braak and Braak, 1991). For instance, NFT accumulation in the medial temporal lobe and particular perirhinal and entorhinal cortex could cause regional atrophy, even in the absence of Aβ deposition (Braak et al., 2011). These differential vulnerabilities may have resulted from different cellular stress susceptibilities to toxic proteinopathy (Posimo et al., 2015). Recent PET studies supported the idea that tau deposition in isocortical regions might require the presence of Aβ but not in the allocortical region (Scholl et al., 2016; Sepulcre et al., 2016).
Our results revealed that amyloid depositions were affected by ApoE4 carrier status, which is compatible with previous findings (Reiman et al., 2009), supporting the concept that ApoE4 plays an early role in the pathogenesis of AD. ApoE4 manifests its influences by increasing the prevalence of PiB+ in both the control and aMCI groups. The ApoE4 effect was not significant in the AD group, probably due to the already widespread amyloid plaques at this clinical stage. Several potential mechanisms linking ApoE4 and the Aβ process have been proposed, for example, ApoE would affect Aβ clearance and aggregation (Bell et al., 2007; Deane et al., 2008; Cerf et al., 2011; Kanekiyo et al., 2014), protease-dependent degradation of Aβ is enhanced by various ApoE isoforms (Saido and Leissring, 2012), and cellular uptake of Aβ is influenced by ApoE (Cudaback et al., 2011). Thus, we may conclude that ApoE4 plays an early role in the pathogenesis of amyloid deposition in AD.
There are some limitations to this study. First, this was a retrospective, case–control observational study. We did not observe longitudinally whether the subjects who showed positive amyloid deposition experienced more rapid cortical atrophy than did those without amyloid deposition. Second, tau imaging was lacking, and such imaging could have directly revealed the role of tau in cortical thickness reduction. Lastly, the SUVRs were normalized to an MNI 152 space by SPM while the morphometric measures were normalized to MNI 305 by FreeSurfer. These two coordinates may not match each other; we could only use the combination of Destrieux atlas to approximate the AAL areas. This is an important methodological constraint, which should be beared in mind when we are interpretating or generalizing the image data from this report.
In the future, a large-scale longitudinal study with subjects with different disease severity is warranted.
Our study demonstrated that the contributions of amyloid deposition to AD pathology and cortical thickness are spatially distinct. Plasma Aβ40 might be a protective indicator in terms of less amyloid pathology and cortical atrophy. It takes more tau pathology to reach the same level of cognitive decline in subjects without much amyloid deposition. Finally, ApoE4 plays an early role in amyloid pathogenesis.
This study was carried out in accordance with the recommendations and guidelines by the ethics committee of our university hospital with written informed consent from all subjects. All subjects gave written informed consent in accordance with the Declaration of Helsinki. The protocol was approved by the Ethics Committee of our University Hospital.
L-YF drafted the manuscript, processed the image data, and performed the statistical analyses. K-YT performed the acquisition and preprocessing of the PET data and revised the manuscript. Y-FC performed the acquisition and preprocessing of the MRI data. T-FC recruited the clinical patients and processed the clinical information. Y-ML performed the neuropsychological tests and preprocessing of the data. R-FY performed the acquisition and preprocessing of the PET data. Y-YH and C-YS monitored the quality control of 11C-PiB production and provided advice for the amyloid PET scans. S-YY supervised the measurement of plasma biomarkers. M-JC was responsible for the research concept initiation, study design, data quality, manuscript revisions, and final approval.
The study was supported in part by a grant from the Ministry of Science and Technology (105-2314-B002-039-MY2, 106-2321-B002-018, and 107-2321-B002-007), the National Taiwan University (105R8954-2), and the National Health Research Institutes, Taiwan (05A1-PHSP03-028).
S-YY is an employee of MagQu Co., Ltd., Xindian District, New Taipei City, Taiwan.
The remaining authors declare that the research was conducted in the absence of any commercial or financial relationships that could be construed as a potential conflict of interest.
We are thankful for the technical support with IMR from Drs. Che-Chuan Yang and Bing-Hsien Liu, at MagQu Lab, New Taipei City, Taiwan.
The Supplementary Material for this article can be found online at: https://www.frontiersin.org/articles/10.3389/fnagi.2018.00175/full#supplementary-material
Abramowski, D., Rabe, S., Upadhaya, A. R., Reichwald, J., Danner, S., Staab, D., et al. (2012). Transgenic expression of intraneuronal Aβ42 but not Aβ40 leads to cellular Aβ lesions, degeneration, and functional impairment without typical Alzheimer’s disease pathology. J. Neurosci. 32, 1273–1283. doi: 10.1523/JNEUROSCI.4586-11.2012
Abu-Raya, B., Kollmann, T. R., Marchant, A., and MacGillivray, D. M. (2016). The immune system of HIV-exposed uninfected infants. Front. Immunol. 7:383. doi: 10.3389/fimmu.2016.00383
Arnold, S. E., Hyman, B. T., Flory, J., Damasio, A. R., and Van Hoesen, G. W. (1991). The topographical and neuroanatomical distribution of neurofibrillary tangles and neuritic plaques in the cerebral cortex of patients with Alzheimer’s disease. Cereb. Cortex 1, 103–116. doi: 10.1093/cercor/1.1.103
Becker, J. A., Hedden, T., Carmasin, J., Maye, J., Rentz, D. M., Putcha, D., et al. (2011). Amyloid-beta associated cortical thinning in clinically normal elderly. Ann. Neurol. 69, 1032–1042. doi: 10.1002/ana.22333
Bell, R. D., Sagare, A. P., Friedman, A. E., Bedi, G. S., Holtzman, D. M., Deane, R., et al. (2007). Transport pathways for clearance of human Alzheimer’s amyloid beta-peptide and apolipoproteins E and J in the mouse central nervous system. J. Cereb. Blood Flow Metab. 27, 909–918. doi: 10.1038/sj.jcbfm.9600419
Bertram, L., and Tanzi, R. E. (2005). The genetic epidemiology of neurodegenerative disease. J. Clin. Invest. 115, 1449–1457. doi: 10.1172/JCI24761
Blennow, K. (2017). A review of fluid biomarkers for Alzheimer’s disease: moving from CSF to blood. Neurol. Ther. 6, 15–24. doi: 10.1007/s40120-017-0073-9
Braak, H., and Braak, E. (1991). Neuropathological stageing of Alzheimer-related changes. Acta Neuropathol. 82, 239–259. doi: 10.1007/BF00308809
Braak, H., Thal, D. R., Ghebremedhin, E., and Del Tredici, K. (2011). Stages of the pathologic process in Alzheimer disease: age categories from 1 to 100 years. J. Neuropathol. Exp. Neurol. 70, 960–969. doi: 10.1097/NEN.0b013e318232a379
Cerf, E., Gustot, A., Goormaghtigh, E., Ruysschaert, J. M., and Raussens, V. (2011). High ability of apolipoprotein E4 to stabilize amyloid-beta peptide oligomers, the pathological entities responsible for Alzheimer’s disease. FASEB J. 25, 1585–1595. doi: 10.1096/fj.10-175976
Chiu, M. J., Yang, S. Y., Chen, T. F., Chieh, J. J., Huang, T. Z., Yip, P. K., et al. (2012). New assay for old markers-plasma beta amyloid of mild cognitive impairment and Alzheimer’s disease. Curr. Alzheimer Res. 9, 1142–1148. doi: 10.2174/156720512804142967
Chiu, M. J., Yang, S. Y., Horng, H. E., Yang, C. C., Chen, T. F., Chieh, J. J., et al. (2013). Combined plasma biomarkers for diagnosing mild cognition impairment and Alzheimer’s disease. ACS Chem. Neurosci. 4, 1530–1536. doi: 10.1021/cn400129p
Cudaback, E., Li, X., Montine, K. S., Montine, T. J., and Keene, C. D. (2011). Apolipoprotein E isoform-dependent microglia migration. FASEB J. 25, 2082–2091. doi: 10.1096/fj.10-176891
Deane, R., Sagare, A., and Zlokovic, B. V. (2008). The role of the cell surface LRP and soluble LRP in blood-brain barrier Aβ clearance in Alzheimer’s disease. Curr. Pharm. Des. 14, 1601–1605. doi: 10.2174/138161208784705487
Dickerson, B. C., Bakkour, A., Salat, D. H., Feczko, E., Pacheco, J., Greve, D. N., et al. (2009). The cortical signature of Alzheimer’s disease: regionally specific cortical thinning relates to symptom severity in very mild to mild AD dementia and is detectable in asymptomatic amyloid-positive individuals. Cereb. Cortex 19, 497–510. doi: 10.1093/cercor/bhn113
Drzezga, A., Becker, J. A., Van Dijk, K. R., Sreenivasan, A., Talukdar, T., Sullivan, C., et al. (2011). Neuronal dysfunction and disconnection of cortical hubs in non-demented subjects with elevated amyloid burden. Brain 134, 1635–1646. doi: 10.1093/brain/awr066
Economou, N. J., Giammona, M. J., Do, T. D., Zheng, X., Teplow, D. B., Buratto, S. K., et al. (2016). Amyloid beta-protein assembly and Alzheimer’s disease: dodecamers of Aβ42, but Not of Aβ40, seed fibril formation. J. Am. Chem. Soc. 138, 1772–1775. doi: 10.1021/jacs.5b11913
Fagan, A. M., Mintun, M. A., Mach, R. H., Lee, S. Y., Dence, C. S., Shah, A. R., et al. (2006). Inverse relation between in vivo amyloid imaging load and cerebrospinal fluid Aβ42 in humans. Ann. Neurol. 59, 512–519. doi: 10.1002/ana.20730
Fandos, N., Perez-Grijalba, V., Pesini, P., Olmos, S., Bossa, M., Villemagne, V. L., et al. (2017). Plasma amyloid beta 42/40 ratios as biomarkers for amyloid beta cerebral deposition in cognitively normal individuals. Alzheimers Dement. (Amst.) 8, 179–187. doi: 10.1016/j.dadm.2017.07.004
Frisoni, G. B., Lorenzi, M., Caroli, A., Kemppainen, N., Nagren, K., and Rinne, J. O. (2009). In vivo mapping of amyloid toxicity in Alzheimer disease. Neurology 72, 1504–1511. doi: 10.1212/WNL.0b013e3181a2e896
Gili, T., Cercignani, M., Serra, L., Perri, R., Giove, F., Maraviglia, B., et al. (2011). Regional brain atrophy and functional disconnection across Alzheimer’s disease evolution. J. Neurol. Neurosurg. Psychiatry 82, 58–66. doi: 10.1136/jnnp.2009.199935
Hardy, J., and Selkoe, D. J. (2002). The amyloid hypothesis of Alzheimer’s disease: progress and problems on the road to therapeutics. Science 297, 353–356. doi: 10.1126/science.1072994
Hurtz, S., Woo, E., Kebets, V., Green, A. E., Zoumalan, C., Wang, B., et al. (2014). Age effects on cortical thickness in cognitively normal elderly individuals. Dement. Geriatr. Cogn. Dis. Extra 4, 221–227. doi: 10.1159/000362872
Iaccarino, L., Tammewar, G., Ayakta, N., Baker, S. L., Bejanin, A., Boxer, A. L., et al. (2018). Local and distant relationships between amyloid, tau and neurodegeneration in Alzheimer’s Disease. Neuroimage Clin. 17, 452–464. doi: 10.1016/j.nicl.2017.09.016
Jack, C. R. Jr., Albert, M. S., Knopman, D. S., McKhann, G. M., Sperling, R. A., Carrillo, M. C., et al. (2011). Introduction to the recommendations from the National Institute on Aging-Alzheimer’s Association workgroups on diagnostic guidelines for Alzheimer’s disease. Alzheimers Dement. 7, 257–262. doi: 10.1016/j.jalz.2011.03.004
Jacobs, H. I. L., Hedden, T., Schultz, A. P., Sepulcre, J., Perea, R. D., Amariglio, R. E., et al. (2018). Structural tract alterations predict downstream tau accumulation in amyloid-positive older individuals. Nat. Neurosci. 21, 424–431. doi: 10.1038/s41593-018-0070-z
Kanekiyo, T., Xu, H., and Bu, G. (2014). ApoE and Aβ in Alzheimer’s disease: accidental encounters or partners? Neuron 81, 740–754. doi: 10.1016/j.neuron.2014.01.045
Kaneko, N., Nakamura, A., Washimi, Y., Kato, T., Sakurai, T., Arahata, Y., et al. (2014). Novel plasma biomarker surrogating cerebral amyloid deposition. Proc. Jpn. Acad. Ser. B Phys. Biol. Sci. 90, 353–364. doi: 10.2183/pjab.90.353
Krell-Roesch, J., Lowe, V. J., Neureiter, J., Pink, A., Roberts, R. O., Mielke, M. M., et al. (2018). Depressive and anxiety symptoms and cortical amyloid deposition among cognitively normal elderly persons: the Mayo Clinic Study of Aging. Int. Psychogeriatr. 30, 245–251. doi: 10.1017/S1041610217002368
Lee, N. C., Yang, S. Y., Chieh, J. J., Huang, P. T., Chang, L. M., Chiu, Y. N., et al. (2016). Blood Beta-amyloid and tau in down syndrome: a comparison with Alzheimer’s disease. Front. Aging Neurosci. 8:316. doi: 10.3389/fnagi.2016.00316
Lin, C. H., Yang, S. Y., Horng, H. E., Yang, C. C., Chieh, J. J., Chen, H. H., et al. (2017). Plasma alpha-synuclein predicts cognitive decline in Parkinson’s disease. J. Neurol. Neurosurg. Psychiatry 88, 818–824. doi: 10.1136/jnnp-2016-314857
Liu, E., Schmidt, M. E., Margolin, R., Sperling, R., Koeppe, R., Mason, N. S., et al. (2015). Amyloid-beta 11C-PiB-PET imaging results from 2 randomized bapineuzumab phase 3 AD trials. Neurology 85, 692–700. doi: 10.1212/WNL.0000000000001877
Malek-Ahmadi, M., Perez, S. E., Chen, K., and Mufson, E. J. (2016). Neuritic and diffuse plaque associations with memory in non-cognitively impaired elderly. J. Alzheimers Dis. 53, 1641–1652. doi: 10.3233/JAD-160365
Marshall, G. A., Donovan, N. J., Lorius, N., Gidicsin, C. M., Maye, J., Pepin, L. C., et al. (2013). Apathy is associated with increased amyloid burden in mild cognitive impairment. J. Neuropsychiatry Clin. Neurosci. 25, 302–307. doi: 10.1176/appi.neuropsych.12060156
Matthew Brett, J.-L. A., Valabregue, R., and Poline, J. B. (2002). Region of interest analysis using an SPM toolbox [abstract]. Paper Presented at the 8th International Conference on Functional Mapping of the Human Brain, Sendai.
McGowan, E., Pickford, F., Kim, J., Onstead, L., Eriksen, J., Yu, C., et al. (2005). Aβ42 is essential for parenchymal and vascular amyloid deposition in mice. Neuron 47, 191–199. doi: 10.1016/j.neuron.2005.06.030
McKhann, G. M., Knopman, D. S., Chertkow, H., Hyman, B. T., Jack, C. R. Jr., Kawas, C. H., et al. (2011). The diagnosis of dementia due to Alzheimer’s disease: recommendations from the National Institute on Aging-Alzheimer’s Association workgroups on diagnostic guidelines for Alzheimer’s disease. Alzheimers Dement. 7, 263–269. doi: 10.1016/j.jalz.2011.03.005
Mori, T., Shimada, H., Shinotoh, H., Hirano, S., Eguchi, Y., Yamada, M., et al. (2014). Apathy correlates with prefrontal amyloid beta deposition in Alzheimer’s disease. J. Neurol. Neurosurg. Psychiatry 85, 449–455. doi: 10.1136/jnnp-2013-306110
Mormino, E. C., Brandel, M. G., Madison, C. M., Rabinovici, G. D., Marks, S., Baker, S. L., et al. (2012). Not quite PIB-positive, not quite PIB-negative: slight PIB elevations in elderly normal control subjects are biologically relevant. Neuroimage 59, 1152–1160. doi: 10.1016/j.neuroimage.2011.07.098
Oh, H., Habeck, C., Madison, C., and Jagust, W. (2014a). Covarying alterations in Aβ deposition, glucose metabolism, and gray matter volume in cognitively normal elderly. Hum. Brain Mapp. 35, 297–308. doi: 10.1002/hbm.22173
Oh, H., Madison, C., Villeneuve, S., Markley, C., and Jagust, W. J. (2014b). Association of gray matter atrophy with age, beta-amyloid, and cognition in aging. Cereb. Cortex 24, 1609–1618. doi: 10.1093/cercor/bht017
Park, J. C., Han, S. H., Cho, H. J., Byun, M. S., Yi, D., Choe, Y. M., et al. (2017). Chemically treated plasma Aβ is a potential blood-based biomarker for screening cerebral amyloid deposition. Alzheimers Res. Ther. 9:20. doi: 10.1186/s13195-017-0248-8
Posimo, J. M., Weilnau, J. N., Gleixner, A. M., Broeren, M. T., Weiland, N. L., Brodsky, J. L., et al. (2015). Heat shock protein defenses in the neocortex and allocortex of the telencephalon. Neurobiol. Aging 36, 1924–1937. doi: 10.1016/j.neurobiolaging.2015.02.011
Racine, A. M., Koscik, R. L., Nicholas, C. R., Clark, L. R., Okonkwo, O. C., Oh, J. M., et al. (2016). Cerebrospinal fluid ratios with Aβ42 predict preclinical brain beta-amyloid accumulation. Alzheimers Dement. (Amst.) 2, 27–38.
Reiman, E. M., Chen, K., Liu, X., Bandy, D., Yu, M., Lee, W., et al. (2009). Fibrillar amyloid-beta burden in cognitively normal people at 3 levels of genetic risk for Alzheimer’s disease. Proc. Natl. Acad. Sci. U.S.A. 106, 6820–6825. doi: 10.1073/pnas.0900345106
Risacher, S. L., Kim, S., Nho, K., Foroud, T., Shen, L., Petersen, R. C., et al. (2015). APOE effect on Alzheimer’s disease biomarkers in older adults with significant memory concern. Alzheimers Dement. 11, 1417–1429. doi: 10.1016/j.jalz.2015.03.003
Risacher, S. L., Kim, S., Shen, L., Nho, K., Foroud, T., Green, R. C., et al. (2013). The role of apolipoprotein E (APOE) genotype in early mild cognitive impairment (E-MCI). Front. Aging Neurosci. 5:11. doi: 10.3389/fnagi.2013.00011
Rosen, C., Hansson, O., Blennow, K., and Zetterberg, H. (2013). Fluid biomarkers in Alzheimer’s disease - current concepts. Mol. Neurodegener. 8:20. doi: 10.1186/1750-1326-8-20
Rowe, C. C., Ng, S., Ackermann, U., Gong, S. J., Pike, K., Savage, G., et al. (2007). Imaging beta-amyloid burden in aging and dementia. Neurology 68, 1718–1725. doi: 10.1212/01.wnl.0000261919.22630.ea
Saido, T., and Leissring, M. A. (2012). Proteolytic degradation of amyloid beta-protein. Cold Spring Harb. Perspect. Med. 2:a006379. doi: 10.1101/cshperspect.a006379
Sando, S. B., Melquist, S., Cannon, A., Hutton, M. L., Sletvold, O., Saltvedt, I., et al. (2008). APOE epsilon 4 lowers age at onset and is a high risk factor for Alzheimer’s disease; a case control study from central Norway. BMC Neurol. 8:9. doi: 10.1186/1471-2377-8-9
Scholl, M., Lockhart, S. N., Schonhaut, D. R., O’Neil, J. P., Janabi, M., Ossenkoppele, R., et al. (2016). PET imaging of tau deposition in the aging human brain. Neuron 89, 971–982. doi: 10.1016/j.neuron.2016.01.028
Sengupta, U., Nilson, A. N., and Kayed, R. (2016). The role of amyloid-beta oligomers in toxicity, propagation, and immunotherapy. EBioMedicine 6, 42–49. doi: 10.1016/j.ebiom.2016.03.035
Sepulcre, J., Schultz, A. P., Sabuncu, M., Gomez-Isla, T., Chhatwal, J., Becker, A., et al. (2016). In vivo tau, amyloid, and gray matter profiles in the aging brain. J. Neurosci. 36, 7364–7374. doi: 10.1523/JNEUROSCI.0639-16.2016
Sevigny, J., Chiao, P., Bussiere, T., Weinreb, P. H., Williams, L., Maier, M., et al. (2016). The antibody aducanumab reduces Aβ plaques in Alzheimer’s disease. Nature 537, 50–56. doi: 10.1038/nature19323
Sperling, R., Mormino, E., and Johnson, K. (2014). The evolution of preclinical Alzheimer’s disease: implications for prevention trials. Neuron 84, 608–622. doi: 10.1016/j.neuron.2014.10.038
Sperling, R. A., Aisen, P. S., Beckett, L. A., Bennett, D. A., Craft, S., Fagan, A. M., et al. (2011). Toward defining the preclinical stages of Alzheimer’s disease: recommendations from the National Institute on Aging-Alzheimer’s Association workgroups on diagnostic guidelines for Alzheimer’s disease. Alzheimers Dement. 7, 280–292. doi: 10.1016/j.jalz.2011.03.003
Swaminathan, S., Risacher, S. L., Yoder, K. K., West, J. D., Shen, L., Kim, S., et al. (2014). Association of plasma and cortical amyloid beta is modulated by APOE epsilon4 status. Alzheimers Dement. 10, e9–e18. doi: 10.1016/j.jalz.2013.01.007
Tatebe, H., Kasai, T., Ohmichi, T., Kishi, Y., Kakeya, T., Waragai, M., et al. (2017). Quantification of plasma phosphorylated tau to use as a biomarker for brain Alzheimer pathology: pilot case-control studies including patients with Alzheimer’s disease and down syndrome. Mol. Neurodegener. 12:63. doi: 10.1186/s13024-017-0206-8
Thambisetty, M., Wan, J., Carass, A., An, Y., Prince, J. L., and Resnick, S. M. (2010). Longitudinal changes in cortical thickness associated with normal aging. Neuroimage 52, 1215–1223. doi: 10.1016/j.neuroimage.2010.04.258
Tzen, K. Y., Yang, S. Y., Chen, T. F., Cheng, T. W., Horng, H. E., Wen, H. P., et al. (2014). Plasma Aβ but not tau is related to brain PiB retention in early Alzheimer’s disease. ACS Chem. Neurosci. 5, 830–836. doi: 10.1021/cn500101j
Villemagne, V. L., Burnham, S., Bourgeat, P., Brown, B., Ellis, K. A., Salvado, O., et al. (2013). Amyloid beta deposition, neurodegeneration, and cognitive decline in sporadic Alzheimer’s disease: a prospective cohort study. Lancet Neurol. 12, 357–367. doi: 10.1016/S1474-4422(13)70044-9
Wang, C. Y., Wang, P. N., Chiu, M. J., Finstad, C. L., Lin, F., Lynn, S., et al. (2017). UB-311, a novel UBITh(R) amyloid beta peptide vaccine for mild Alzheimer’s disease. Alzheimers Dement. (N Y.) 3, 262–272. doi: 10.1016/j.trci.2017.03.005
Yang, C. C., Yang, S. Y., Chieh, J. J., Horng, H. E., Hong, C. Y., Yang, H. C., et al. (2011). Biofunctionalized magnetic nanoparticles for specifically detecting biomarkers of Alzheimer’s disease in vitro. ACS Chem. Neurosci. 2, 500–505. doi: 10.1021/cn200028j
Yang, S. Y., Chiu, M. J., Chen, T. F., and Horng, H. E. (2017). Detection of plasma biomarkers using immunomagnetic reduction: a promising method for the early diagnosis of Alzheimer’s disease. Neurol. Ther. 6, 37–56. doi: 10.1007/s40120-017-0075-7
Yang, S. Y., Chiu, M. J., Lin, C. H., Horng, H. E., Yang, C. C., Chieh, J. J., et al. (2016). Development of an ultra-high sensitive immunoassay with plasma biomarker for differentiating Parkinson disease dementia from Parkinson disease using antibody functionalized magnetic nanoparticles. J. Nanobiotechnol. 14:41. doi: 10.1186/s12951-016-0198-5
Keywords: plasma Aβ40, plasma tau, beta-amyloid, amyloid PET, cortical thickness
Citation: Fan L-Y, Tzen K-Y, Chen Y-F, Chen T-F, Lai Y-M, Yen R-F, Huang Y-Y, Shiue C-Y, Yang S-Y and Chiu M-J (2018) The Relation Between Brain Amyloid Deposition, Cortical Atrophy, and Plasma Biomarkers in Amnesic Mild Cognitive Impairment and Alzheimer’s Disease. Front. Aging Neurosci. 10:175. doi: 10.3389/fnagi.2018.00175
Received: 18 January 2018; Accepted: 22 May 2018;
Published: 18 June 2018.
Edited by:
Nibaldo C. Inestrosa, Pontificia Universidad Católica de Chile, ChileReviewed by:
Gerard Nisal Bischof, Forschungszentrum Jülich, GermanyCopyright © 2018 Fan, Tzen, Chen, Chen, Lai, Yen, Huang, Shiue, Yang and Chiu. This is an open-access article distributed under the terms of the Creative Commons Attribution License (CC BY). The use, distribution or reproduction in other forums is permitted, provided the original author(s) and the copyright owner are credited and that the original publication in this journal is cited, in accordance with accepted academic practice. No use, distribution or reproduction is permitted which does not comply with these terms.
*Correspondence: Ming-Jang Chiu, bWpjaGl1QG50dS5lZHUudHc=
Disclaimer: All claims expressed in this article are solely those of the authors and do not necessarily represent those of their affiliated organizations, or those of the publisher, the editors and the reviewers. Any product that may be evaluated in this article or claim that may be made by its manufacturer is not guaranteed or endorsed by the publisher.
Research integrity at Frontiers
Learn more about the work of our research integrity team to safeguard the quality of each article we publish.