 Naomi Intrator
 Amal Jayakumar
 Bess B. Ward
- Department of Geosciences, Princeton University, Princeton, NJ, United States
Nitrous oxide (N2O) is a potent greenhouse gas and a major cause of ozone depletion. One-third of atmospheric N2O originates in aquatic environments. Reduction of N2O to dinitrogen gas (N2) requires the nitrous oxide reductase enzyme, which is encoded by the gene nosZ. Organisms that contain nosZ are the only known biological sinks of N2O and are found in diverse genera and a wide range of environments. The two clades of nosZ (Clade I and II) contain great diversity, making it challenging to study the population structure and distribution of nosZ containing organisms in the environment. A database of over 11,000 nosZ sequences was compiled from NCBI (representing diverse aquatic environments) and unpublished sequences and metagenomes (primarily from oxygen minimum zones, OMZs, where N2O levels are often elevated). Sequences were clustered into archetypes based on DNA and amino acid sequence identity and their clade, phylogeny, and environmental source were determined. Further analysis of the source and environmental distribution of the sequences showed strong habitat separation between clades and phylogeny. Although there are more Clade I nosZ genes in the compilation, Clade II is more diverse phylogenetically and has a wider distribution across environmental sources. On the other hand, Clade I nosZ genes are predominately found within marine sediment and are primarily from the phylum Pseudonomonadota. The majority of the sequences analyzed from marine OMZs represented distinct phylotypes between different OMZs showing that the nosZ gene displays regional and environmental separation. This study expands the known diversity of nosZ genes and provides a clearer picture of how the clades and phylogeny of nosZ organisms are distributed across diverse environments.
1 Introduction
Nitrous oxide (N2O) is a potent greenhouse gas, with a ~300-fold greater global warming potential per molecule compared to carbon dioxide on the 100 year timescale, and a significant player in ozone depletion (Ravishankara et al., 2009; Felgate et al., 2012). Biological reduction of N2O to dinitrogen gas (N2) requires the enzyme nitrous oxide reductase (N2OR), which is encoded by the gene nosZ (Zumft, 1997). Organisms that contain nosZ are the only known biological sinks of N2O. The ability to reduce N2O has been found in a wide range of genera and environments (Jones et al., 2008). The widespread distribution and high abundance of nosZ containing organisms across environments indicates the ability to reduce N2O is an ecologically important trait. The prevalence of nosZ implies a potential N2O sink, thereby impacting net N2O emissions (Jones et al., 2012).
One-third of atmospheric N2O originates in aquatic environments, predominantly from microbial metabolism (Ciais et al., 2013), and ~20% of global N2O emissions are estimated to come from natural processes in the global ocean (Gluschankoff et al., 2023). N2O can be formed both biotically through processes such as denitrification, nitrification, codenitrification, and nitrfier-denitrfication as well as abiotically through chemodenitrification. In the ocean, oxygen minimum zones (OMZs), regions where dissolved oxygen concentrations reach low ( ≤ 20 μM; Lam and Kuypers, 2011) or zero concentrations, are significant sources of N2O (Nevison et al., 2004; Arévalo-Martínez et al., 2015; Yang et al., 2020; Gluschankoff et al., 2023). NosZ is often associated with canonical denitrification, also referred to as complete denitrification. The biological reduction of N2O is the final step in the denitrification pathway in which fixed nitrogen is reduced through anaerobic respiration in which nitrate (), nitrite (), nitric oxide (NO), and N2O are successively reduced to dinitrogen gas (N2) (Zumft, 1997; Felgate et al., 2012). However, the capacity and genetic potential for N2O reduction through N2OR likely extends beyond known denitrifying organisms such that the scope of natural N2O-reducing microbial community is likely greatly underestimated (Chee-Sanford et al., 2020). Denitrification is assumed to regulate oceanic N2O concentrations because this pathway is both a sink and a source of nitrous oxide (Granger and Ward, 2003). This study aims to characterize nosZ in marine and other aquatic microbial communities that can remove N2O from the environment.
Although nosZ has been studied in cultivated organisms for decades (Zumft, 1997), much is still unknown about the distribution, taxonomy, function, and biogeochemical impacts of nosZ-containing organisms within the environment (Sanford et al., 2012; Hallin et al., 2018; Bertagnolli et al., 2020). This knowledge gap is partly due to the high taxonomic diversity of nosZ, which has been revealed in the environment through multiple approaches including PCR amplification and sequence analyses (Jones et al., 2012; Sanford et al., 2012; Orellana et al., 2014; Hallin et al., 2018; Chee-Sanford et al., 2020; Zhang B. et al., 2021; Wei et al., 2023). New studies are continuously adding to the nosZ diversity implying that novel sequences are likely still undiscovered.
NosZ has a complex evolutionary history. Studies comparing the phylogeny of denitrification genes found them to be incongruent with 16S rRNA suggesting horizontal gene transfer (HGT) as the potential cause behind this disagreement (Delorme et al., 2003; Dandie et al., 2007; Jones et al., 2008). However, compared to other denitrification genes, nosZ has been found to have the highest level of congruence with 16S rRNA taxonomic classifications (Dandie et al., 2007; Zumft and Körner, 2007). Therefore, other mechanisms such as gene duplication and divergence or lineage sorting may better explain nosZ's evolutionary history. If HGT occurred during the evolution of nosZ, it likely transpired between closely related organisms (Jones et al., 2008).
Two phylogenetically distinct variants of nosZ have been identified: Clade I and II, also known as typical and atypical, respectively (Jones et al., 2012; Sanford et al., 2012). Differences in kinetics (Yoon et al., 2016; Tang et al., 2022), community composition, and/or environmental distribution between Clade I and II containing organisms are likely to impact environmental N2O fluxes. Clade I organisms are often found to also contain genes encoding the enzymes for complete denitrification. In contrast, Clade II organisms typically lack one or more of the other denitrification enzymes and are therefore often referred to as “incomplete denitrifiers” (Sanford et al., 2012; Graf et al., 2014). Additional research is necessary to better understand the biogeochemical impacts of the two clades on global microbial N2O fluxes.
The majority of previous research examining nosZ focuses on terrestrial sources, predominately soils, leaving nosZ understudied in marine and other aquatic environments including hydrothermal vent systems, salt marshes, wastewaters, freshwater and estuary systems. We surveyed published databases and metagenomic datasets of three major marine OMZs to focus on nosZ sequences from marine and other aquatic environments. NosZ containing organisms have the potential to regulate N2O emissions that contribute to ozone depletion and the greenhouse effect; therefore, characterization of their diversity and environmental distribution will help to understand their biogeochemical impacts. This study analyzes the diversity and distribution of nosZ focusing on the environmental sources of the gene to provide further insight into what environments and taxa are involved in the reduction of N2O.
2 Materials and methods
2.1 Database compilation
To encompass the full range of diversity of the nosZ gene, all gene features and CDS (coding sequences) of annotated nosZ nucleotide sequences between 500–3,500 bp were downloaded from the National Center for Biotechnology Information (NCBI). Genbank database on June 1st, 2021 (28,866 sequences). These nosZ gene sequences were extracted from whole genomes as well as fragments from environmental clones and metagenomes. To extract these sequences Hidden Markov Models (HMM) for nosZ sequences were generated using a custom curated subset of nosZ sequences from NCBI and used to search assembled reads of metagenomes from the Arabian Sea (AS, during late Monsoon/intermonsoon transition in September–October 2007) and Eastern Tropical North (ETNP in 2016 and 2018) and South Pacific (ETSP in 2013) using HMMR (v3.3.2) (Eddy, 1998) (Supplementary Table 1, Supplementary Figure 1). HMMR recovered 255 new sequences from these sources with the inclusion threshold of an E value of 0.01 or less and a per-domain conditional E-value of 0.01 or less.
Additional nosZ sequences from the Chesapeake Bay in 2020 and ETNP in 2018 were obtained from clone libraries of PCR products amplified using clade specific primers. PCR products (~699 bp) for Clade I were amplified using NosZ1F (5′-WCS YTG TTC MTC GAC AGC CAG-3′) and NosZR (5′-CAT GTG CAG NGC RTG GCA GAA-3′) (Henry et al., 2006) and for Clade II, a ~745 bp product using nosZ-II-F: (5′-CTI GGI CCI YTK CAY AC-3′) and nosZ-II-R36 (5′-GCI GAR CAR AAI TCB GTR C-3′) (Jones et al., 2012). This resulted in 107 and 268 novel nosZ sequences found from the Chesapeake Bay in 2020 and ETNP in 2018, respectively. Lastly, sequences from Jayakumar et al. (2018) and Bertagnolli et al. (2020) were added to the compilation. Duplicate sequences were then removed from the compilation of all the sequences listed above using SeqKit (v.2.5.1; Shen et al., 2016) by keeping only the first instance of each sequence and its accession number, resulting in a total of 11,095 nosZ sequences.
2.2 Database processing
The compilation of nosZ sequences was clustered into operational taxonomic units (OTUs) using CD-HIT (Li and Godzik, 2006; Fu et al., 2012) with a defined similarity threshold of 87% sequence identity (Taroncher-Oldenburg et al., 2003; Ward et al., 2007; Bulow et al., 2008), which generated 2,282 OTUs. This threshold was chosen in order to cluster homologous genes at the level found to differentiate functional genes at the approximate level of species distinction (Purkhold et al., 2000; Taroncher-Oldenburg et al., 2003). Six hundred seventy-four OTUs contained >2 sequences. The remaining OTUs containing one or two sequences were treated as individual sequences, which are identified by their accession numbers.
The environmental source of the sequences clustered within each OTU were determined by searching NCBI and published literature. Sequences were labeled with the following environmental sources: marine sediment, marine water column, marine OMZs, hydrothermal vent systems, terrestrial, animal (i.e., from the animal microbiome), salt marsh, freshwater and estuary systems, wastewater systems, and aquatic other. Other aquatic environments mainly included hypersaline and/or soda lakes and contaminated waters. These environments were classified as other because of the great variability between them. There were not enough sequences from each kind of these other environments to make clear conclusions. OTUs that did not contain any marine or aquatic sequences or sequences from Jayakumar et al. (2018) and Bertagnolli et al. (2020) were removed from further study. The remaining OTUs containing more than three sequences were aligned with MAFFT v7.407 (Katoh and Standley, 2013), and a consensus sequence for each OTU was generated with emboss v6.6.0 (Stamatakis, 2014).
An alignment including all of the consensus sequences and the individual sequences could not be made using the nucleotide sequences. Therefore, DNA sequences were converted to protein sequences using gene prediction program GeneMarkS (v.4.28; Besemer, 2001). Protein sequences were then aligned using Clustal Omega (v.1.2.4; Sievers et al., 2011). Because most of the sequences are nosZ fragments (usually cloned PCR products), they fell on either the 5′ or 3′ end of a full nosZ gene with only a small (~42 bp) region of overlap. Consequently, sequences were further separated into 5′ and 3′ groups for further analysis (Supplementary Figure 2). In the absence of complete continuous sequences the phylogenetic coherence between the 5′ and 3′ regions cannot be ascertained; therefore, the two regions were analyzed separately. Twenty-four clusters and 127 individual sequences, which were mainly extracted from whole genomes, spanned both the 5′ and 3′ regions and were included in both groups. The longest possible aligned 5′ and 3′ region within each alignment was extracted and used for further analyses.
The extracted aligned protein regions were converted back to nucleotide sequences and analyzed with the probe finding algorithm to form archetypes (Bulow et al., 2008). These aligned nucleotide sequences for each region were analyzed using a pairwise distance matrix. The 70 bp region which had the greatest average distance between sequences was selected for further analyses. Therefore, this algorithm determines the most distinct 70 bp region within the aligned region and was used to group the sequences into archetypes, each of which is represented by a unique 70-mer region. The 70-mer archetype region with an identity threshold of 87% provides the optimal discrimination between related sequences at approximately the species level for previously studied functional genes (Ward et al., 2007; Bulow et al., 2008). A 70-mer region is long enough to represent and distinguish amongst related types, but also allowed us to incorporate shorter sequences into the analyses, therefore, allowing us to obtain a high resolution of divergence and diversity. Compared to the reference sequence of the Pseudomonas fluorescens's nosZ gene consisting of 1,920 bp (Philippot et al., 2001; AF197468.1), the 5′ 70-mer region is located around ~792–862 bp, and the 3′ 70-mer region is ~1,322–1,392 bp (Supplementary Figure 2).
The archetypes were identified as Clade I, II, or unknown based on phylogenetic inference by using NCBI's blastn and blastp (Altschul et al., 1990). Additional metadata were collected by searching with the archetype using blastn optimized for highly similar sequences on NCBI (Camacho et al., 2009). Archetype sequence information and metadata are listed in Supplementary Tables 2, 3. Phylogenetic trees were generated with the aligned 5′ and 3′ 70-mer archetype regions using RAxML v8.2.12 (Stamatakis, 2014) and viewed and edited in iTOL v6 (Letunic and Bork, 2006).
3 Results
3.1 Aquatic nosZ sequence compilation overview
A total of 11,095 nosZ sequences were collected as described above from the databases and from other published and newly obtained clone library analysis and metagenome searches. In addition, we searched assembled reads of metagenomes from the Arabian Sea (in 2007), ETSP (in 2013), and ETNP (in 2016 and 2018), and found 146, 16, 52 and 41 new nosZ sequences respectively. Furthermore, small clone libraries from the Chesapeake Bay and ETNP (2018) added 107 and 268 nosZ sequences respectively (Supplementary Table 1). Database compilation resulted in 3,942 total unique marine or other aquatic nosZ sequences that were further used for analyses. Most of the sequences were derived from PCR amplification but several new sequences were discovered in metagenomes.
All the nosZ sequences (i.e., prior to separation into 5′ and 3′ groups) were clustered into 2,282 OTUs using CD-HIT (Supplementary Figure 3). However, only 592 clusters contained sequences from marine or other aquatic environmental sources and were included in further analyses. Of those, 179 OTUs contained more than 2 sequences. These 179 OTUs represent only ~30% of the clusters, but account for ~87% of the sequences (3,442 sequences). The largest cluster contains 643 sequences (~16% of the sequences). The remaining OTUs, the unique individual sequences, represent ~70% of the clusters and ~13% of the sequences (500 sequences). This distribution of sequences shows that while the majority of the clusters are unique, most of the sequences group into larger OTUs (Figure 1).
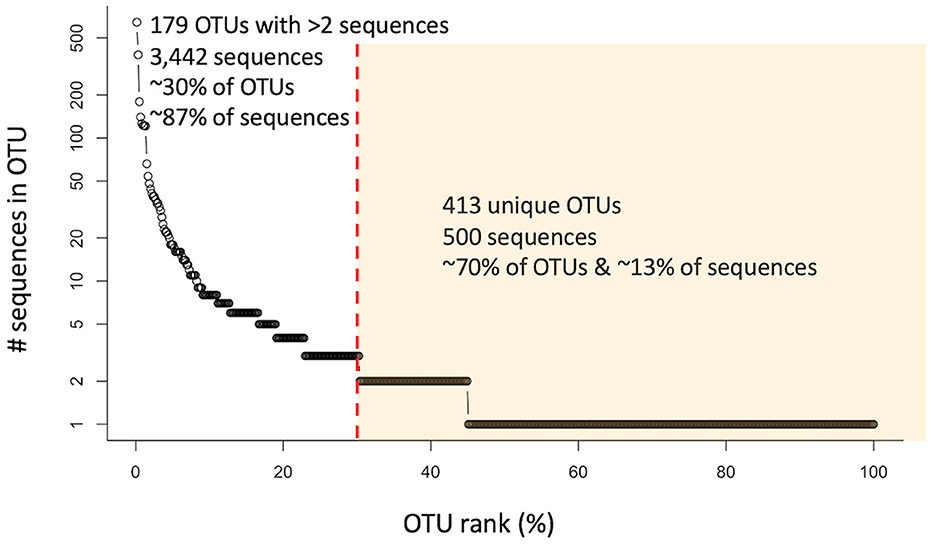
Figure 1. Rank abundance curve of 592 analyzed OTUs (circles) containing nosZ sequences from marine or other aquatic environments. Red dashed line separates OTUs containing more than 2 sequences from those containing 2 or less (unique/individual sequences) highlighted in yellow.
3.2 5′ region of nosZ gene
A total of 866 sequences aligned at the 5′ region of the nosZ gene and were grouped into 250 archetypes, which were further examined. One hundred eighty-one archetypes represented 252 unique individual sequences only and therefore, did not contain clusters. However, the remaining 69 archetypes contained the majority of the sequences (614 sequences). The largest archetype represented 75 sequences. Archetypes were classified into Clade I (169 archetypes, 67.6%) and Clade II (78, 31.2%). Clade I archetypes represent 681 sequences, while Clade II represent 182 sequences. The clade affiliation of three archetypes could not be determined so they were classified as unknown. The unknown sequences were all single sequences obtained from marine OMZs. The clades therefore show very clear phylogenetic separation (Figure 2).
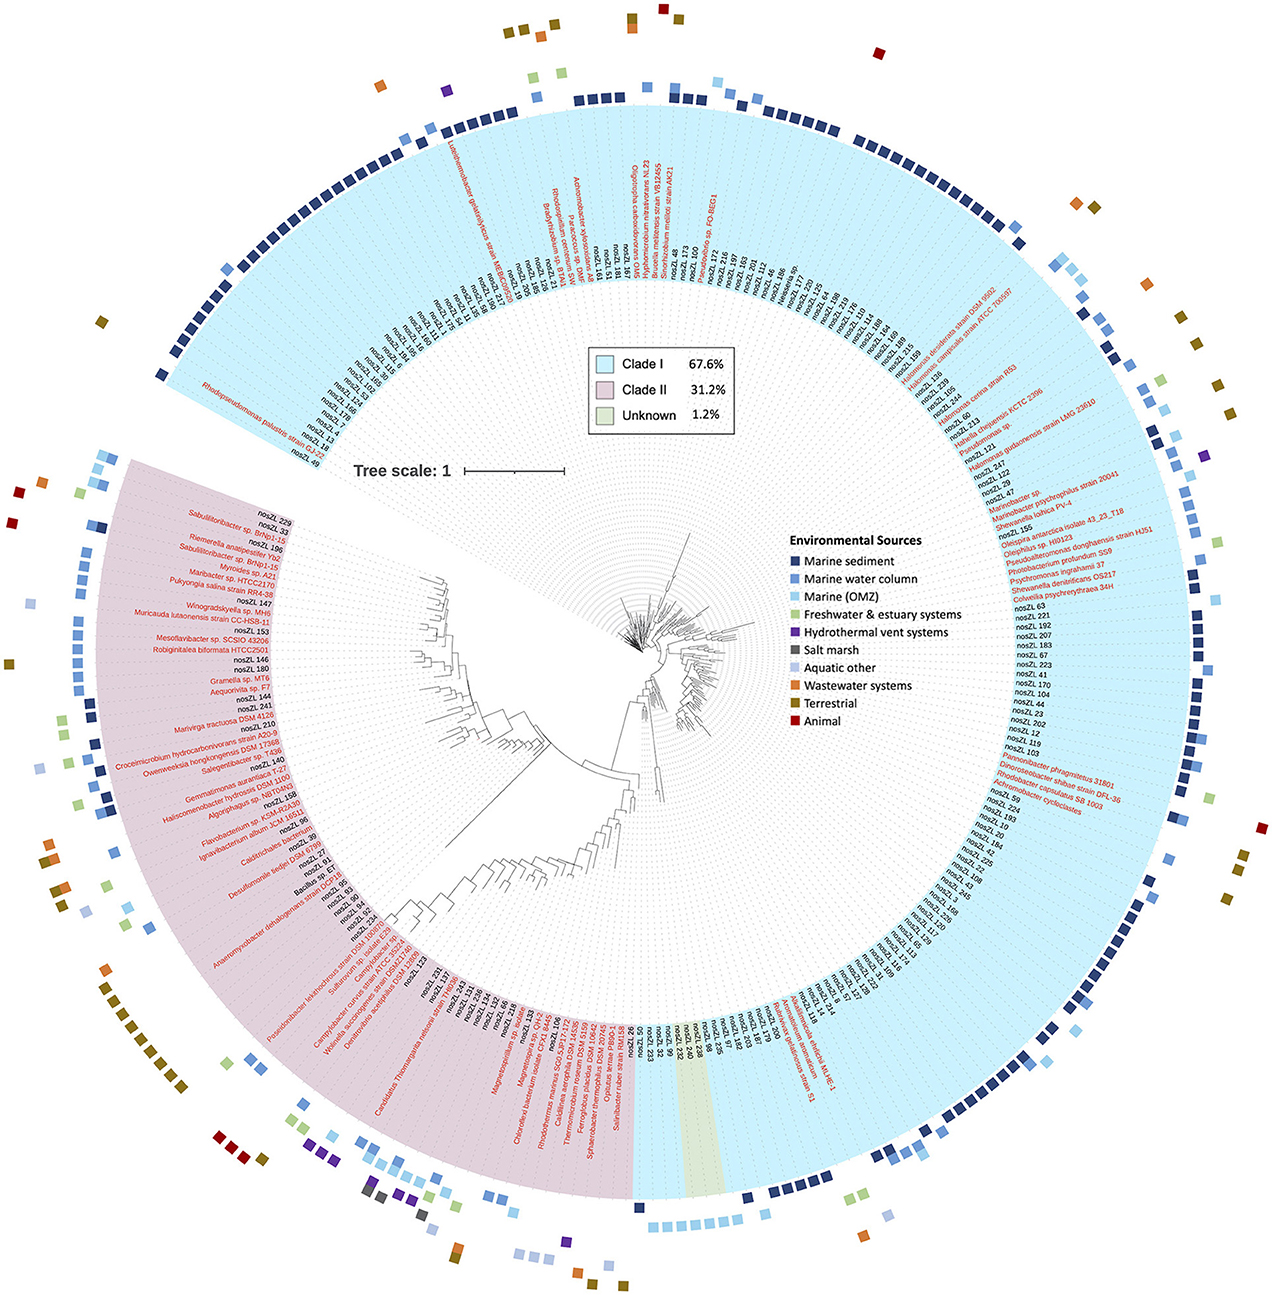
Figure 2. Phylogenetic tree of nosZ based on representative archetype nucleotide sequence from the 5′ region. Tree is based on 866 nosZ sequences. Names of nodes written in red represent cultured/known organisms. Colored squares on the outermost rim represents the environmental sources of the sequences within each archetype. The inner colored rim represents the achetype's nosZ clade assignment (key in black box).
The majority of archetypes contain sequences obtained from only one of the environmental sources (205 archetypes, 82%); no archetype contains sequences representing more than three different sources (36 represent two environmental sources and 8 represent three different environmental sources). Figure 2 depicts the phylogeny of the nosZ sequences of the 5′ region of the gene and shows the spread of environmental sources across archetypes and clades. The environmental sources for each archetype (based on the 70-mer archetype analysis) were identified, separated by clade, and the total number of archetypes representing an environmental source within each clade was determined (Figure 3A). Archetypes within Clade I were predominately obtained from marine sediment (62.7%) while archetypes of Clade II sequences derive from a much more diverse range of environmental sources, although the marine water column represents the largest representative environmental source (27.6%). Environmental sources of terrestrial, animal, wastewater systems, marine water column, hydrothermal vent systems, freshwater & estuary systems are found more often in Clade II nosZ genes.
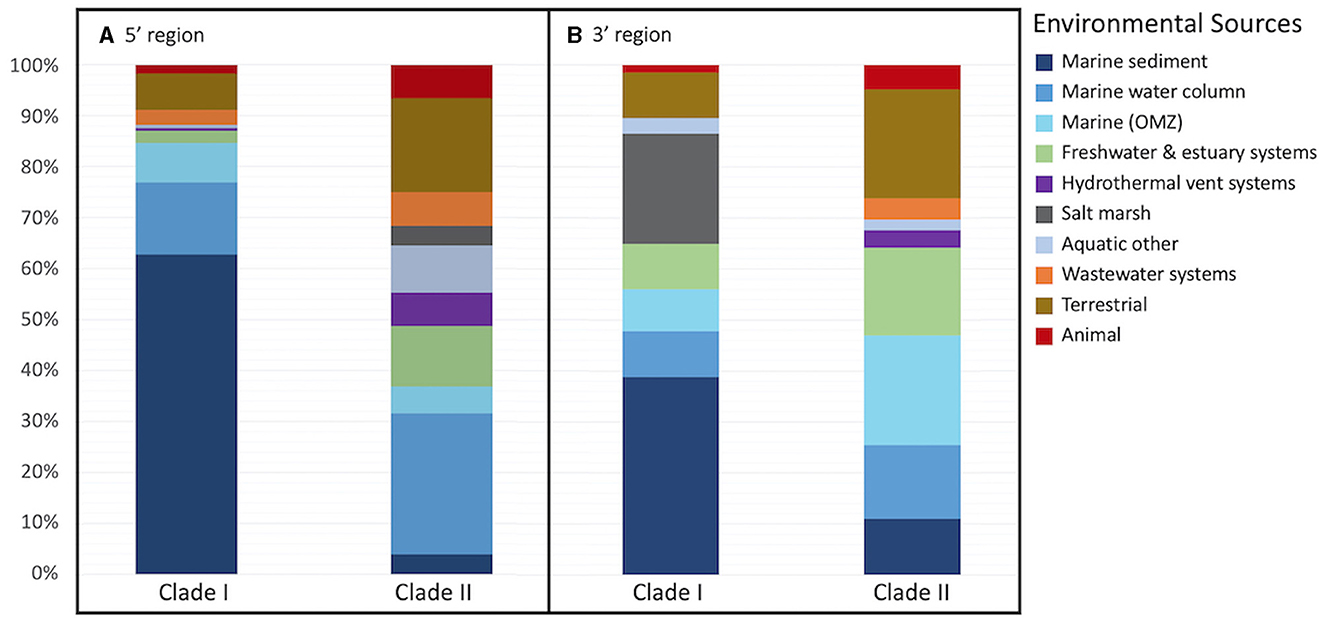
Figure 3. Percent of representative archetype sequences found from each environmental source. Bar plots display the percent of representative archetype sequences found from each environmental source for each nosZ clade (A) the 5′ region containing 250 archetypes and (B) the 3′ region containing 280 archetypes. For 3 of the 5′ region archetypes (obtained from marine OMZs) and 1 3′ region archetype (obtained from the marine water column) the clade could not be determined; they are not included in the figure.
Archetypes containing sequences retrieved from marine OMZs were examined further to resolve if there was smaller scale regional biogeography by comparing their occurrence within and among the three major OMZs (Table 1). The majority (76%) of archetypes containing OMZ sequences contained sequences from only one of the OMZ regions (i.e., either AS, ETNP, or ETSP). Twenty-four percent of the archetypes contained sequences from both the AS and ETNP, and no archetypes contained sequences from all three major OMZs. Therefore, most of the OMZ sequences appear to be unique to a specific region.
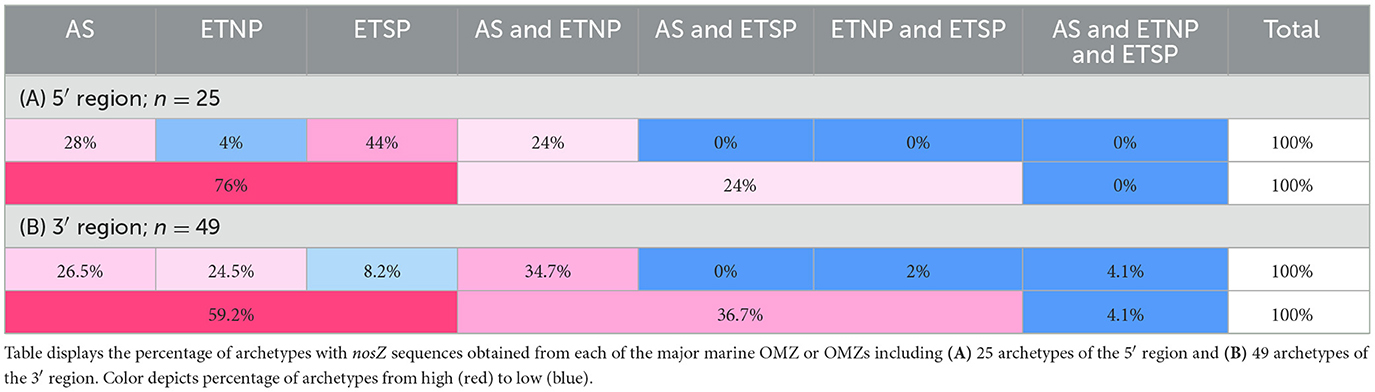
Table 1. Regional biogeography of marine OMZ archetypes.
The taxonomy of each archetype's representative sequence was determined through phylogenetic inference (Figure 4A). The phylum/class of both Clade I and II could be determined for a majority of the sequences, 70.4%/66.9% and 89.6%/83.1% respectively. However, only 20.7% of Clade I sequences could be assigned to the genus/family level and 64.9% for Clade II. Clade I primarily consisted of sequences from the Pseudomonadota phylum (65.7%), with most classified as Alphaproteobacteria (36.1%). On the other hand, Clade II was dominated by Bacteroidota sequences (41.6%). In addition, Clade II was more diverse, containing sequences from 16 different phyla, while Clade I only had five phyla, three of which were found in both Clades.
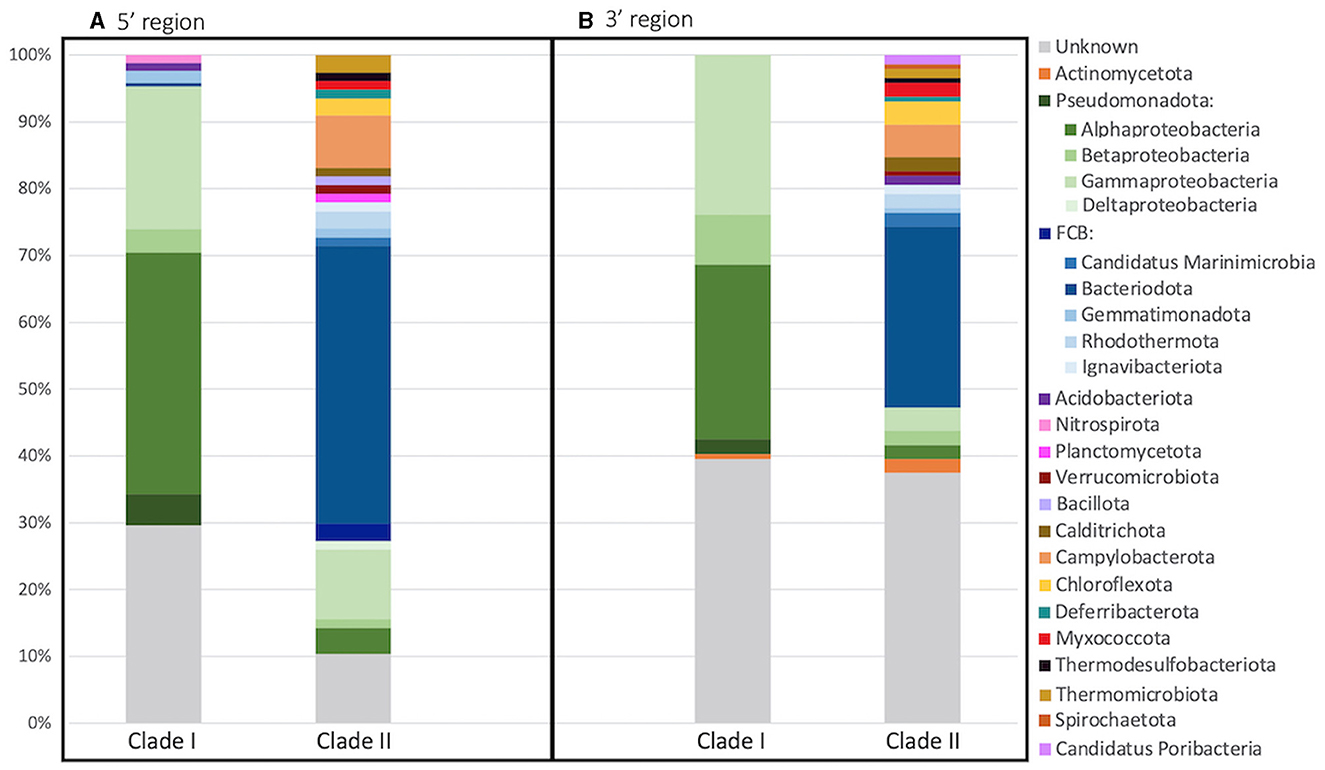
Figure 4. Archetype taxonomy between clades. Taxonomy of each archetype's representative sequence was determined through phylogenetic inference for the (A) 5′ and (B) 3′ region of the nosZ gene. Bar plot depicts the percentage of archetypes within each phyla for each clade. Superphylum FCB is divided into phylum in shades of blue and phylum Pseudomonadota is divided further into classes in shades of green.
The two dominant phyla, Bacteroidata and Pseudomonadota, were examined further by determining what percent of archetypes came from each environmental source within each phylum (Figure 5A). Bacteroidota, which was represented in of 33 archetypes (59 sequences), was primarily obtained from the marine water column (~48.5%), followed by freshwater and estuarine systems (21.2%). On the other hand, Pseudomonoadota (125 archetypes representing 447 sequences) was mostly retrieved from the marine sediment (53.6%). The Pseudomonoadota classes were further analyzed. Alpha-, Gamma-, and Deltaproteobacteria were all predominately obtained from marine sediment (71.9%, 31.9%, and 71.4% respectively). Betaproteobacteria's main environmental source was terrestrial; however, it only comprises 7 archetypes and 18 sequences.
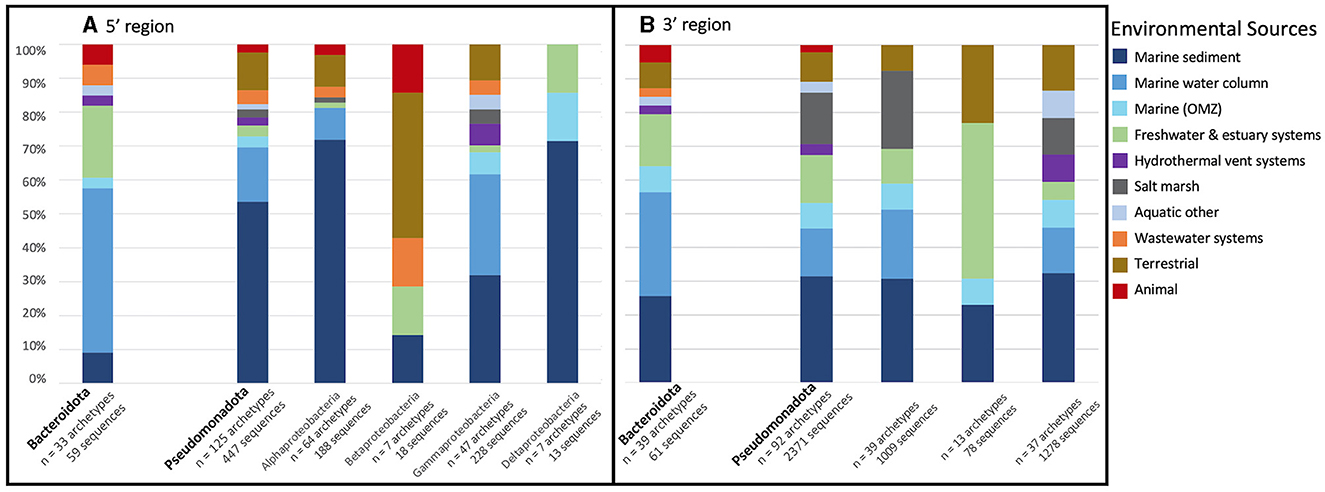
Figure 5. Percent of archetype environmental source of the two dominant phyla. Bar plot displays the percent of representative archetype sequences found from each environmental source of the two dominant phyla, Bacteroidota (left) and Pseudomonadota (right), for (A) the 5′ and (B) 3′ region of the nosZ gene. Pseudomonadota is further divided into classes.
3.3 3′ region of nosZ gene
The majority of the nosZ sequences aligned on the 3′ region of the gene. A total of 3,190 nosZ sequences grouped into 280 archetypes, which were further analyzed. Two hundred and twenty-four individual sequences made up 189 archetypes while most of the sequences (2,966 sequences) were clustered into 171 archetypes. The largest archetype represented 849 sequences. Archetypes divided almost equally between Clade I and II, 47.9% (134) and 51.8% (145) respectively, with only one archetype in which the clade affiliation could not be determined. Despite a nearly equal divide between Clade I and II archetypes, there are significantly more sequences represented within the Clade I archetypes vs. Clade II, 2,758 and 431 sequences respectively. Similar to the 5′ region of the nosZ gene, the clades separate out phylogenetically (Figure 6).
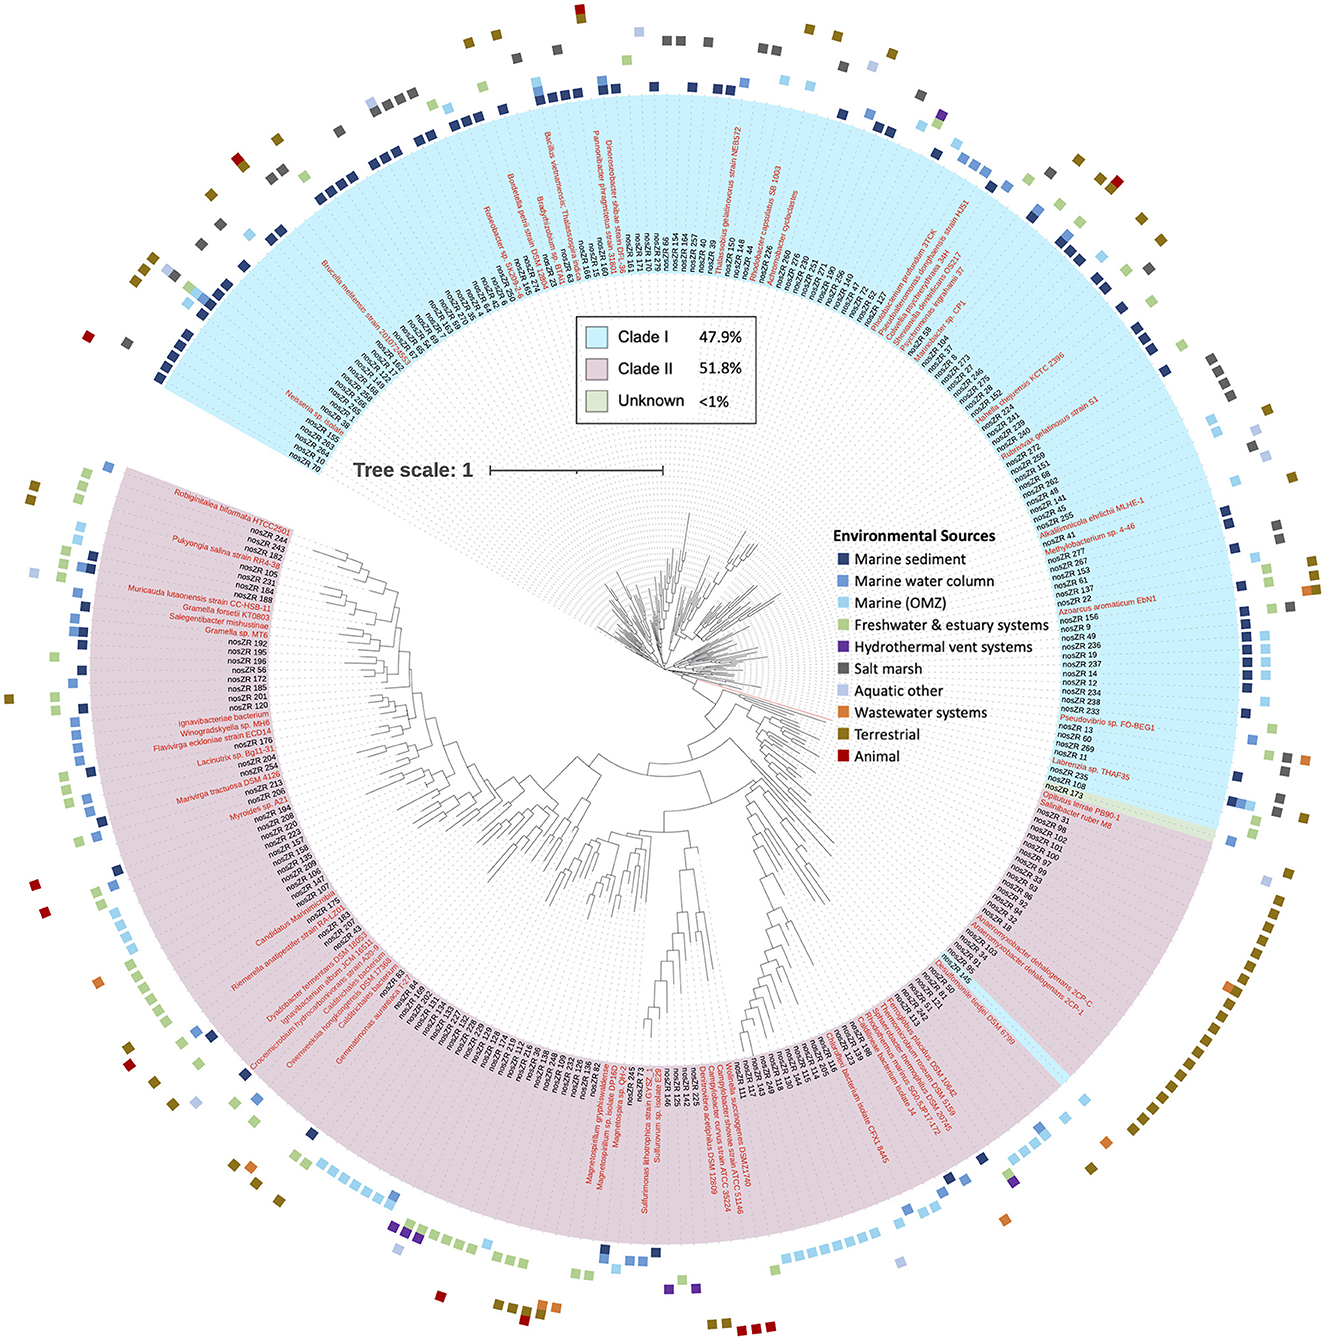
Figure 6. Phylogenetic tree of nosZ based on representative archetype nucleotide sequence from the 3′ region. Tree is based on 3,190 nosZ sequences. Names of nodes written in red represent cultured/known organisms. Colored squares on the outermost rim represents the environmental sources of the sequences within each archetype. The inner colored rim represents the achetype's nosZ clade assignment (key in black box).
The environmental source for each archetype was determined. Like the 5′ region of the nosZ gene, most of the archetypes from the 3′ region (210 archetypes, 75%) represent only one environmental source. However, there are two archetypes represented by sequences from five different environmental sources (Labrenzia sp. and uncultured gammaproteobacterial), and one archetype representing six different environmental sources (uncultured alphaproteobacterial). The remainder of the archetypes represent three or fewer different environmental sources. The phylogenetic tree of the representative nosZ archetype sequences in the 3′ region of the gene in Figure 6 portrays the spread of the environmental sources across the clades. Figure 3B depicts spread of environmental sources for each archetype's representative sequence. Similar to the 5′ region of the nosZ gene, archetypes within Clade I were predominately obtained from marine sediment (38.8%), followed by salt marshes (21.6%). On the other hand, Clade II archetypes have a wider distribution across environmental sources. Among the Clade II archetypes the terrestrial and marine OMZ environmental sources were equally represented (21.38%) followed by freshwater and estuarine systems (17.2%). Environmental sources of terrestrial, marine OMZs, animal, wastewater systems, marine water column, hydrothermal vent systems, wastewater systems, and freshwater & estuary systems were found more often in Clade II nosZ genes.
Biogeography of the nosZ sequence was examined at a smaller scale by focusing on the archetypes that contained sequences retrieved from marine OMZs. Within each of these archetypes, the source of the sequences was determined, i.e., which of the major OMZs (AS, ETNP, or ETSP) (Table 1). Similar to the 5′ region, archetypes containing OMZ sequences from the 3′ region were predominately obtained (59.2%) from only one of the major OMZs. Fewer archetypes were retrieved from two distinct OMZs (36.7%). Only 4.1% archetypes contained sequences from all three of the major OMZs. This suggests the majority of nosZ sequences are unique to their environment.
Like the 5′ region of the nosZ gene, the majority of the sequences could be classified into phylum/class for Clade I (60.4%/58.2%) and Clade II (63.2%/54.2%) (Figure 4B). Additionally, only 23.1% of Clade I and 32.6% of Clade II sequences could be assigned to the genus/family. Like the 5′ region, most of the Clade I sequences are within the Pseudomonadota phylum (59.7%) with Alpha- and Gamma-proteobacteria dominating (26.1% and 23.9%). Clade II was again predominately Bacteroidota sequences (27.1%). Clade II had greater diversity consisting of sequences from 18 different phyla compared to sequences from Clade I which were found within only 2 different phyla.
As noted above, Bacteroidota and Pseudomonadota were the largest phyla containing nosZ sequences, as was also observed from the 5′ region. Within each phylum, the percent of archetypes derived from each environmental source was determined (Figure 5B). Similar to the 5′ region, Bacteroidota's (39 archetypes representing 61 sequences) main environmental source was the marine water column (30.8%); however, this is followed by marine sediment (25.6%) instead of freshwater and estuarine systems. As with the 5′ region, archetypes within the phylum Pseudomonadota (92 archetypes representing 2,371 sequences) were mostly obtained from the marine sediment (30.8%). Alpha- and Gammaproteobacteria were both predominately retrieved from marine sediment (30.7% and 32.4% respectively). Betaproteobacteria was mainly obtained from freshwater and estuarine systems; however, it was the smallest Pseudomonadota class in terms of both number of archetypes and sequences (13 and 78 respectively).
4 Discussion
4.1 nosZ diversity
Although the nosZ gene has been identified and studied for decades, knowledge of the function, distribution, and taxonomy of nosZ containing organisms in the environment is still fragmented (Hallin et al., 2018; Bertagnolli et al., 2020). This is in part due to the high taxonomic diversity of nosZ-containing organisms revealed through phylogenetic- and high throughput sequencing analysis of nosZ genes in natural communities (Jones et al., 2012; Sanford et al., 2012; Orellana et al., 2014; Hallin et al., 2018). The nosZ sequences analyzed in this study were so distinct at the nucleotide level, they could not be well aligned, further highlighting the nosZ diversity. However, the sequences were similar enough at the protein level such that they could be aligned, suggesting despite the great DNA level diversity, the genes encode fundamentally the same enzyme. The high level of similarity at the protein level implies strong functional constraints on the enzymes, which probably extends to ecologically significant features such as oxygen sensitivity and the requirement for copper at the active sites. While the gene sequence has evolved consistently with the host genome, the functionality of the protein has been conserved.
This great diversity of nosZ at the DNA level introduced detection and analytical challenges, which suggests that the extent of the N2O-reducing microbial community is still underestimated (Chee-Sanford et al., 2020). Over 600 new and widely divergent nosZ sequences were found in our searches of marine metagenomes and even in small clone libraries from estuarine and oceanic environments (Supplementary Table 1). It is clear that new studies are continuously adding to the nosZ diversity, and likely much diversity is still undiscovered. This great diversity is evident in Figure 1, while the majority of sequences group together into larger clusters, most of the clusters, ~70%, are unique. Even after further grouping into archetypes, a similar pattern is evident: the majority of the archetypes represent individual sequences for both the 5′ and 3′ region of the nosZ gene (72% and 68% respectively), meaning most of the branches on the phylogenetic trees (Figures 2, 6) are unique. While this study uncovered an extensive diversity of nosZ sequences, this rate of discovery implies that additional diversity not covered in this study is yet to be revealed.
4.2 Variation between Clade I and Clade II
4.2.1 Clade abundance
Jones et al. (2012) identified two distinct groups of the N2OR protein, Clade I and Clade II. It has since been suggested that differences between Clade I and II organisms could impact N2O emissions. A kinetics study showed Clade I organisms to have higher half-saturation constants for N2O than Clade II organisms, suggesting Clade II would perform better at lower N2O concentrations (Yoon et al., 2016). Our study found that the majority of the examined nosZ sequences are Clade I. If the two clades represent microbes with different N2O reduction kinetics, variations in community composition could influence the in-situ net N2O fluxes, causing ecological and environmental consequences (Hallin et al., 2018). Field studies are required to understand the biogeochemical impacts of the two clades on N2O consumption. In ETSP surface waters Clade II nosZ was found to be active and more abundant, implying a significant contribution to N2O consumption (Sun et al., 2017). However, in estuarine and coastal areas of China, Clade I nosZ was transcribed more actively than Clade II, despite being less abundant (Dai et al., 2022). Chesapeake Bay qPCR measurements show Clade II as ~2 orders of magnitude more abundance than Clade I, suggesting it dominates N2O consumption (Tang et al., 2022). Therefore, the two nosZ clades have varying biochemical impacts on N2O consumption, likely dependent on their environmental source.
In addition, analysis of co-occurrence of nosZ with other genes in the canonical denitrification pathway in cultivated microbes suggests that Clade I organisms were more often complete denitrifiers, with 83% of Clade I genomes also possessing nirS or nirK genes (which encode for reduction), while about half of Clade II organisms lacked nir genes and are therefore “incomplete-denitrifiers” (Graf et al., 2014). This would suggest that a significant number of our nosZ sequences represent complete denitrifiers as the majority (~85% of sequences) are Clade I organisms. The denitrification pathway is often thought to be modular, but the extent of this modularity is unclear. If we assume that 83% of Clade I organisms and 50% of Clade II are complete denitrifiers (Graf et al., 2014), then ~76% of all sequences in the 5′ region and ~79% of in the 3′ region are complete denitrifiers. However, the estimate for the proportion of complete denitrifiers (Graf et al., 2014) used for this calculation was derived from cultivated organisms, therefore potentially introducing a bias. In addition, this may be an overestimate due to primer or sampling bias, especially since Clade II sequences were not recognized as distinct from Clade I prior to 2012. Nevertheless, the extent of the reduction of N2O to N2 by nosZ containing organisms may be clade dependent and should be investigated further.
4.2.2 Taxonomic diversity
The 3′ region of the nosZ gene, which contained the majority of the total sequences, had a nearly equal number of archetypes representing Clade I and II (Figure 6); however, 86.5% of the sequences were in Clade I. This discrepancy suggests that there is a much greater level of diversity amongst Clade II organisms compared to Clade I. This difference might be in part due to a historical sampling bias favoring the discovery of Clade I sequences as Clade II was discovered over a decade later (Jones et al., 2012; Sanford et al., 2012). Regardless, a higher diversity for Clade II has been seen in other studies (Jones et al., 2014; Tsiknia et al., 2015; Wittorf et al., 2016) and is predicted due to a larger taxonomic breadth of Clade II sequenced genomes (Graf et al., 2014). In this study, the Clade II sequences from both the 5′ and 3′ regions of the nosZ gene come from a wider taxonomic range than observed for Clade I (Figure 4). The Clade II nosZ sequences in this study were identified as belonging to 20 distinct phyla, while Clade I sequences only included five phyla. Although Bacteroidota was the largest phylum found in Clade II, most of the total representative Clade II sequences were distributed across the remaining phyla. This is in contrast to Clade I sequences where the majority of representative sequences fell into one branch (i.e., Pseudomonadota/Proteobacteria). The high diversity of Clade II nosZ has made it impossible to create universal primers for PCR amplification. Chee-Sanford et al. (2020) tried to overcome this challenge by designing multiple primer sets to target different subclades. They assigned ten subclades of Clade II nosZ genes and were able to develop primer sets specifically targeting seven of those subclades. Even though Clade I nosZ has lower diversity, some of the existing primer sets for Clade I may not be suitable for high throughput analyses (Ma et al., 2019). Recently a new primer set was developed to target a broader range of Clade I sequences found in soils (Zhang L. et al., 2021). Due to the clear phylogenetic separation between Clades (Figures 2, 6) a truly universal nosZ primer set covering both clades would be impossible to design. In addition, it is important to note that while most sequences could be taxonomically assigned to phyla, 24% and 38% of the 3′ and 5′ representative sequences could not be taxonomically identified. This suggests that even with expanded and improved primer sets, it is likely not all nosZ sequences will be covered. Even the search for new nosZ genes in metagenomic datasets is hindered by the shear diversity of the gene at the DNA level.
4.2.3 Ecological distribution (environmental sources) and niche differentiation
Due to the expanding view of nosZ diversity discussed above, little is known about the ecological distribution of the microbes capable of N2O reduction. In this study we analyzed the environmental sources and environmental distribution of the nosZ gene. Starting with a database of over 11,000 sequences, we were able to cluster and identify sequences by phylogenetic inference and classify them based on the environment from which they were obtained (Figures 2, 3, 6). Even though our data compilation discovered many previously unknown nosZ sequences, it is still important to recognize that many of the sequences included in this study were obtained by PCR amplification and clone libraries. Therefore, the patterns in the environmental sources and distribution that emerge in the following discussion are subject to PCR bias. Sequences that cannot be detected by PCR or even by HMMR searches at the DNA level may not exhibit the same patterns. With that caveat in mind, it is interesting to explore the biogeographical and ecological patterns in our expanded nosZ database.
We examined sequences from diverse biomes but focused primarily on those in marine and other aquatic environments. Most archetypes contained sequences from only one environmental source (82% and 75% for 5′ and 3′ regions), indicating they are unique to their environments (i.e., display biogeography). This supports previous findings of niche separation found between and within environmental sources and nosZ clades (Graf et al., 2014; Castro-González et al., 2015; Fuchsman et al., 2017). In the current study, archetypes from Clade II had a wider distribution across environmental sources than Clade I (Figures 2, 3, 6). This implies Clade II nosZ is better adapted to a broader range of environments than Clade I, likely due to the greater diversity observed. For both 5′ and 3′ regions of the nosZ gene, Clade I was predominately retrieved from marine sediment. This is consistent with results from a study of coastal sediment in which Clade I nosZ was found at a 10-fold higher abundance than Clade II (Wittorf et al., 2016). Unlike Clade I, a single environmental source did not dominate the Clade II sequences, which may be tied to the higher diversity of Clade II.
The widespread distribution of Clade II organisms, together with the high diversity, highlights the reduction of N2O as an ecologically important and favorable trait, not necessarily associated with canonical denitrification, but which may control net N2O emissions (Hallin et al., 2018). Physiological analyses of a few taxa suggest that bacteria with Clade II nosZ have a higher affinity for N2O compared to Clade I denitrifiers (Yoon et al., 2016). This potential mechanism for niche differentiation between clades would have ecological and environmental consequences. Oceanic OMZs are apparently dominated by Clade II organisms, selecting for efficient N2O scavenging which, in turn, would affect N2O removal rates (Bertagnolli et al., 2020). Clade I and II sequences from the 5′ region were nearly equally represented in the marine OMZs (7.8% and 5.3% respectively of sequences represented by each clade, Figures 2, 3A. However, in the 3′ region, which represents the majority of the sequences, Clade II (21.4%) was more highly represented than Clade I (8.2%) in the marine OMZs (Figures 3B, 6).
The archetypes containing sequences sourced from marine OMZs were examined at more localized scale to determine if the nosZ gene displayed regional, as well as environmental, biogeography. Archetypes containing marine OMZ sequences from both the 5′ and 3′ regions of the nosZ gene were mostly restricted to a particular OMZ (76% and 59.2% contained sequences sourced from only one OMZ, respectively; Table 1), although, it is possible that the sequences exist in other OMZs and have yet to be found. Distinct phylotypes have been detected between different OMZs and within an OMZ (Jayakumar et al., 2009; Castro-González et al., 2015; Bertagnolli et al., 2020). This further highlights the great diversity of nosZ containing organisms phylogenetically and possibly functionally. Several factors such as nutrient availability, oxygen concentration, redox state, etc., could help control this observed environmental distribution and needs to be examined further. For instance, differing nosZ community compositions was observed in the ETSP OMZ and was attributed to variations in oxygen concentrations (Sun et al., 2017). A study on salt marsh sediments observed variations in nosZ community structures at differing nitrogen loads (Kearns et al., 2015). Similarly, reef sediments have been shown to have redox-driven stratification of nosZ-containing bacterial communities (Gao et al., 2011). Phylogenetically distinct organisms have their own ranges and tolerances to environmental conditions, often allowing them to fill a niche. Phylogenetic variations in nosZ could further contribute to the observed environmental distribution as these variations may impact factors such as affinity constants (Yoon et al., 2016), oxygen tolerance, copper requirements, etc. The spread of the diverse taxa across environments has implications for N2O consumption rates between OMZs and is an active area of study.
Niche differentiation was also observed between the two predominant phyla, Bacteroidata and Pseudomonadota (Figure 5). For both 5′ and 3′ regions on the nosZ gene Bacteroidata sequences were primarily obtained from the marine water column and Pseudomonadota from marine sediment. Previous studies have shown Alphaproteobacteria, the Pseudomonadota class with the largest number of archetypes and sequences in this study, to be dominant in coastal marine sediments (Hunter et al., 2006; Wittorf et al., 2016). Niche differentiation between clades and phyla is unsurprising; however, the mechanism is unclear and requires further investigation. Niche partitioning beyond N2O affinity has been found in relation to oxygen availability, pH, and C:N ratios in soil (Domeignoz-Horta et al., 2015; Wittorf et al., 2016); however, niche partitioning in relation to environmental factors is understudied in marine and other aquatic environments.
4.3 Summary and future directions
NosZ containing organisms are found inhabiting diverse environments and cover a wide range of genera. The prevalence of these organisms has the potential to regulate global N2O emissions as nosZ is the only known biological sink of N2O. Although nosZ was first characterized in 1997 (Zumft), much remains unknown about the distribution, taxonomy, and biogeochemical impacts in the environment. Great diversity of the nosZ gene was found at the nucleotide level (such that sequences could not be well aligned); however, nosZ was highly conserved at the protein level and functionally remains the same despite evolving in diverse environments. This apparent functional constraint on the enzyme implies further ecological constraints, such as oxygen sensitivity or copper requirements; however, this has yet to be proven and requires further investigation. In addition, the extensive nucleotide sequence diversity found introduces detection and analytical challenges. Universal PCR primers for nosZ are not possible and, in turn, it is likely that nosZ diversity and environmental abundance are greatly underestimated. The ecological significance of this underestimation should be further examined. Instead of PCR primers, applying HMM to metagenomic studies is likely a better approach to identifying and characterizing new nosZ sequences, as done in this study.
We found Clade II to have a wider taxonomic range and distribution across environmental sources compared to Clade I. Differences in community composition, environmental distribution, and/or kinetics between Clade I and II containing organisms are likely to impact environmental N2O fluxes causing various ecological and environmental consequences. However, the extent of this is beyond the scope of this study, and field studies are required to understand the biogeochemical impacts of the two clades. The spread of the diverse taxa across environments has implications for N2O consumption rates.
This study examined the environmental distribution of the nosZ gene with a focus on marine and other aquatic environments to explore the breadth of environmental sources across both clades. In both 5′ and 3′ regions the majority of archetypes contain sequences obtained from only one environmental source. This suggests nosZ sequences, regardless of clade, is typically unique to an environment. Environmental factors such as oxygen levels, redox, nutrient availability, temperature, pH, etc., are likely involved in creating this observed separation between environmental sources. Clade I was mostly retrieved from marine sediments while Clade II sequences were derived from a much more diverse range of environmental sources including terrestrial, animal, wastewater systems, marine water column, hydrothermal vent systems, freshwater, and estuary systems. We found Clade I sequences primarily consisted of sequences from the Pseudomonadota phylum (predominately alphaproteobacteria) and Clade II was dominated by Bacteroidota sequences. These Bacteroidota sequences were mainly obtained from the marine water column while the Pseudomonadota were predominately obtained from marine sediments. The mechanism for the environmental distribution of nosZ, such as N2O affinity, nutrient availability, oxygen concentration, redox state, etc., is not well understood and should be examined further as it could explain variations in N2O fluxes. NosZ has the potential to regulate N2O emissions that contribute to ozone depletion and the greenhouse effect; this study characterized the diversity and environmental distribution of this gene to help further understand its biogeochemical impacts.
Data availability statement
The original contributions presented in the study are included in the article/Supplementary material, further inquiries can be directed to the corresponding author.
Author contributions
NI: Conceptualization, Data curation, Formal analysis, Investigation, Methodology, Visualization, Writing – original draft, Writing – review & editing. AJ: Data curation, Writing – review & editing, Investigation, Methodology. BBW: Conceptualization, Funding acquisition, Resources, Supervision, Writing – review & editing, Project administration.
Funding
The author(s) declare that financial support was received for the research, authorship, and/or publication of this article. This work was support by National Science Foundation grants to BBW (1657663) (1946516).
Acknowledgments
We would like to acknowledge Maggie C. Y. Lau (University of Chinese Academy of Sciences) for her suggestions on the best method approaches. We appreciate Mandy Lin and Yaakov Zinberg for their assistance determining environmental sources of sequences. We would like to thank Anthony Bertagnolli for supplying his sequences and alignment to be used in this study.
Conflict of interest
The authors declare that the research was conducted in the absence of any commercial or financial relationships that could be construed as a potential conflict of interest.
Publisher's note
All claims expressed in this article are solely those of the authors and do not necessarily represent those of their affiliated organizations, or those of the publisher, the editors and the reviewers. Any product that may be evaluated in this article, or claim that may be made by its manufacturer, is not guaranteed or endorsed by the publisher.
Supplementary material
The Supplementary Material for this article can be found online at: https://www.frontiersin.org/articles/10.3389/fmicb.2024.1407573/full#supplementary-material
References
Altschul, S. F., Gish, W., Miller, W., Myers, E. W., and Lipman, D. J. (1990). Basic local alignment search tool. J. Molec. Biol. 215, 403–410. doi: 10.1016/S0022-2836(05)80360-2
Arévalo-Martínez, D. L., Kock, A., Löscher, C. R., Schmitz, R. A., and Bange, H. W. (2015). Massive nitrous oxide emissions from the tropical South Pacific Ocean. Nat. Geosci. 8, 530–533. doi: 10.1038/ngeo2469
Bertagnolli, A. D., Konstantinidis, K. T., and Stewart, F. J. (2020). Non-denitrifier nitrous oxide reductases dominate marine biomes. Environ. Microbiol. Rep. 12, 681–692. doi: 10.1111/1758-2229.12879
Besemer, J. (2001). GeneMarkS: a self-training method for prediction of gene starts in microbial genomes. Implications for finding sequence motifs in regulatory regions. Nucl. Acids Res. 29, 2607–2618. doi: 10.1093/nar/29.12.2607
Bulow, S. E., Francis, C. A., Jackson, G. A., and Ward, B. B. (2008). Sediment denitrifier community composition and nirS gene expression investigated with functional gene microarrays. Environ. Microbiol. 10, 3057–3069. doi: 10.1111/j.1462-2920.2008.01765.x
Camacho, C., Coulouris, G., Avagyan, V., Ma, N., Papadopoulos, J., Bealer, K., et al. (2009). BLAST+: architecture and applications. BMC Bioinform. 10, 1–9. doi: 10.1186/1471-2105-10-421
Castro-González, M., Ulloa, O., and Farías, L. (2015). Structure of denitrifying communities reducing N2O at suboxic waters off northern Chile and Perú. Rev. Biol. Mar. Oceanogr. 50, 95–110. doi: 10.4067/S0718-19572015000100008
Chee-Sanford, J. C., Connor, L., Krichels, A., Yang, W. H., and Sanford, R. A. (2020). Hierarchical detection of diverse Clade II (atypical) nosZ genes using new primer sets for classical- and multiplex PCR array applications. J. Microbiol. Methods 172:105908. doi: 10.1016/j.mimet.2020.105908
Ciais, P., Sabine, C., Bala, G., Bopp, L., Brovkin, V., Canadell, J., et al. (2013). “Carbon and other biogeochemical cycles supplementary material,” in Climate Change 2013: The Physical Science Basis. Contribution of Working Group I to the Fifth Assessment Report of the Intergovernmental Panel on Climate Change, eds. T.F. Stocker, D. Qin, G.-K. Plattner, M. Tignor, S.K. Allen, J. Boschung, et al. (Cambridge: Cambridge University Press).
Dai, X., Chen, M., Wan, X., Tan, E., Zeng, J., Chen, N., et al. (2022). Potential contributions of nitrifiers and denitrifiers to nitrous oxide sources and sinks in China's estuarine and coastal areas. Biogeosciences 19, 3757–3773. doi: 10.5194/bg-19-3757-2022
Dandie, C. E., Burton, D. L., Zebarth, B. J., Trevors, J. T., and Goyer, C. (2007). Analysis of denitrification genes and comparison of nosZ, cnorB and 16S rDNA from culturable denitrifying bacteria in potato cropping systems. System. Appl. Microbiol. 30, 128–138. doi: 10.1016/j.syapm.2006.05.002
Delorme, S., Philippot, L., Edel-Hermann, V., Deulvot, C., Mougel, C., and Lemanceau, P. (2003). Comparative genetic diversity of the narG, nosZ, and 16S rRNA genes in fluorescent pseudomonads. Appl. Environ. Microbiol. 69, 1004–1012. doi: 10.1128/AEM.69.2.1004-1012.2003
Domeignoz-Horta, L. A., Spor, A., Bru, D., Breuil, M.-C., Bizouard, F., Léonard, J., et al. (2015). The diversity of the N2O reducers matters for the N2O:N2 denitrification end-product ratio across an annual and a perennial cropping system. Front. Microbiol. 6. doi: 10.3389/fmicb.2015.00971
Eddy, S. R. (1998). Profile hidden Markov models. Bioinformatics 14, 755–763. doi: 10.1093/bioinformatics/14.9.755
Felgate, H., Giannopoulos, G., Sullivan, M. J., Gates, A. J., Clarke, T. A., Baggs, E., et al. (2012). The impact of copper, nitrate and carbon status on the emission of nitrous oxide by two species of bacteria with biochemically distinct denitrification pathways. Environ. Microbiol. 14, 1788–1800. doi: 10.1111/j.1462-2920.2012.02789.x
Fu, L., Niu, B., Zhu, Z., Wu, S., and Li, W. (2012). CD-HIT: accelerated for clustering the next-generation sequencing data. Bioinformatics 28, 3150–3152. doi: 10.1093/bioinformatics/bts565
Fuchsman, C. A., Devol, A. H., Saunders, J. K., McKay, C., and Rocap, G. (2017). Niche partitioning of the N cycling microbial community of an offshore oxygen deficient zone. Front. Microbiol. 8:2384. doi: 10.3389/fmicb.2017.02384
Gao, Z., Wang, X., Hannides, A. K., Sansone, F. J., and Wang, G. (2011). Impact of redox-stratification on the diversity and distribution of bacterial communities in sandy reef sediments in a microcosm. Chin. J. Ocean. Limnol. 29, 1209–1223. doi: 10.1007/s00343-011-0316-z
Gluschankoff, N., Santoro, A. E., Buchwald, C., and Casciotti, K. L. (2023). Shifts in the isotopic composition of nitrous oxide between El Niño and La Niña in the Eastern Tropical South Pacific. Global Biogeochem. Cycles 37:e2023GB007959. doi: 10.1029/2023GB007959
Graf, D. R. H., Jones, C. M., and Hallin, S. (2014). Intergenomic comparisons highlight modularity of the denitrification pathway and underpin the importance of community structure for N2O emissions. PLoS ONE 9:e114118. doi: 10.1371/journal.pone.0114118
Granger, J., and Ward, B. B. (2003). Accumulation of nitrogen oxides in copper-limited cultures of denitrifying bacteria. Limnol. Oceanogr. 48, 313–318. doi: 10.4319/lo.2003.48.1.0313
Hallin, S., Philippot, L., Löffler, F. E., Sanford, R. A., and Jones, C. M. (2018). Genomics and ecology of novel N2O-reducing microorganisms. Trends Microbiol. 26, 43–55. doi: 10.1016/j.tim.2017.07.003
Henry, S., Bru, D., Stres, B., Hallet, S., and Philippot, L. (2006). Quantitative detection of the nosZ gene, encoding nitrous oxide reductase, and comparison of the abundances of 16S rRNA, narG, nirK, and nosZ genes in soils. Appl. Environ. Microbiol. 72, 5181–5189. doi: 10.1128/AEM.00231-06
Hunter, E. M., Mills, H. J., and Kostka, J. E. (2006). Microbial community diversity associated with carbon and nitrogen cycling in permeable shelf sediments. Appl. Environ. Microbiol. 72, 5689–5701. doi: 10.1128/AEM.03007-05
Jayakumar, A., Balachandran, D., Rees, A. P., Kearns, P. J., Bowen, J. L., and Ward, B. B. (2018). Community composition of nitrous oxide reducing bacteria investigated using a functional gene microarray. Deep Sea Res. Part II. 156, 44–50. doi: 10.1016/j.dsr2.2018.10.002
Jayakumar, A., O'Mullan, G. D., Naqvi, S. W. A., and Ward, B. B. (2009). Denitrifying bacterial community composition changes associated with stages of denitrification in oxygen minimum zones. Microb. Ecol. 58, 350–362. doi: 10.1007/s00248-009-9487-y
Jones, C. M., Graf, D. R. H., Bru, D., Philippot, L., and Hallin, S. (2012). The unaccounted yet abundant nitrous oxide-reducing microbial community: a potential nitrous oxide sink. ISME J. 7, 417–426. doi: 10.1038/ismej.2012.125
Jones, C. M., Spor, A., Brennan, F. P., Breuil, M.-C., Bru, D., Lemanceau, P., et al. (2014). Recently identified microbial guild mediates soil N2O sink capacity. Nat. Clim. Change 4, 801–805. doi: 10.1038/nclimate2301
Jones, C. M., Stres, B., Rosenquist, M., and Hallin, S. (2008). Phylogenetic analysis of nitrite, nitric oxide, and nitrous oxide respiratory enzymes reveal a complex evolutionary history for denitrification. Molec. Biol. Evol. 25, 1955–1966. doi: 10.1093/molbev/msn146
Katoh, K., and Standley, D. M. (2013). MAFFT multiple sequence alignment software version 7: improvements in performance and usability. Molec. Biol. Evol. 30, 772–780. doi: 10.1093/molbev/mst010
Kearns, P. J., Angell, J. H. III., Feinman, S. G., and Bowen, J. L. (2015). Long-term nutrient addition differentially alters community composition and diversity of genes that control nitrous oxide flux from salt marsh sediments. Estuar. Coast. Shelf Sci. 154, 39–47. doi: 10.1016/j.ecss.2014.12.014
Lam, P., and Kuypers, M. M. M. (2011). Microbial nitrogen cycling processes in oxygen minimum zones. Annu. Rev. Mar. Sci. 3, 317–345. doi: 10.1146/annurev-marine-120709-142814
Letunic, I., and Bork, P. (2006). Interactive Tree Of Life (iTOL): an online tool for phylogenetic tree display and annotation. Bioinformatics 23, 127–128. doi: 10.1093/bioinformatics/btl529
Li, W., and Godzik, A. (2006). Cd-hit: a fast program for clustering and comparing large sets of protein or nucleotide sequences. Bioinformatics 22, 1658–1659. doi: 10.1093/bioinformatics/btl158
Ma, Y., Zilles, J. L., and Kent, A. D. (2019). An evaluation of primers for detecting denitrifiers via their functional genes. Environ. Microbiol. 21, 1196–1210. doi: 10.1111/1462-2920.14555
Nevison, C. D., Lueker, T. J., and Weiss, R. F. (2004). Quantifying the nitrous oxide source from coastal upwelling. Global Biogeochem. Cycles 18:2110. doi: 10.1029/2003GB002110
Orellana, L. H., Rodriguez, R. L. M., Higgins, S., Chee-Sanford, J. C., Sanford, R. A., Ritalahti, K. M., et al. (2014). Detecting nitrous oxide reductase (nosZ) genes in soil metagenomes: method development and implications for the nitrogen cycle. mBio 5:10-1128. doi: 10.1128/mBio.01193-14
Philippot, L., Mirleau, P., Mazurier, S., Siblot, S., Hartmann, A., Lemanceau, P., et al. (2001). Characterization and transcriptional analysis of Pseudomonas fluorescens denitrifying clusters containing the nar, nir, nor and nos genes. Biochim. Biophys. Acta 1517, 436–440. doi: 10.1016/S0167-4781(00)00286-4
Purkhold, U., Pommerening-Röser, A., Juretschko, S., Schmid, M. C., Koops, H.-P., and Wagner, M. (2000). Phylogeny of all recognized species of ammonia oxidizers based on comparative 16S rRNA and amoA sequence analysis: implications for molecular diversity surveys. Appl. Environ. Microbiol. 66, 5368–5382. doi: 10.1128/AEM.66.12.5368-5382.2000
Ravishankara, A. R., Daniel, J. S., and Portmann, R. W. (2009). Nitrous Oxide (N 2 O): The dominant ozone-depleting substance emitted in the 21st Century. Science 326, 123–125. doi: 10.1126/science.1176985
Sanford, R. A., Wagner, D. D., Wu, Q., Chee-Sanford, J. C., Thomas, S. H., Cruz-García, C., et al. (2012). Unexpected nondenitrifier nitrous oxide reductase gene diversity and abundance in soils. Proc. Natl. Acad. Sci. U.S.A. 109, 19709–19714. doi: 10.1073/pnas.1211238109
Shen, W., Le, S., Li, Y., and Hu, F. (2016). SeqKit: a cross-platform and ultrafast toolkit for FASTA/Q file manipulation. PLoS ONE 11:e0163962. doi: 10.1371/journal.pone.0163962
Sievers, F., Wilm, A., Dineen, D., Gibson, T. J., Karplus, K., Li, W., et al. (2011). Fast, scalable generation of high-quality protein multiple sequence alignments using Clustal Omega. Molec. Syst. Biol. 7:539. doi: 10.1038/msb.2011.75
Stamatakis, A. (2014). RAxML version 8: a tool for phylogenetic analysis and post-analysis of large phylogenies. Bioinformatics 30, 1312–1313. doi: 10.1093/bioinformatics/btu033
Sun, X., Jayakumar, A., and Ward, B. B. (2017). Community composition of nitrous oxide consuming bacteria in the oxygen minimum zone of the eastern tropical South Pacific. Front. Microbiol. 8:1183. doi: 10.3389/fmicb.2017.01183
Tang, W., Jayakumar, A., Sun, X., Tracey, J. C., Carroll, J., Wallace, E., et al. (2022). Nitrous oxide consumption in oxygenated and anoxic estuarine waters. Geophys. Res. Lett. 49:e2022GL100657. doi: 10.1029/2022GL100657
Taroncher-Oldenburg, G., Griner, E. M., Francis, C. A., and Ward, B. B. (2003). Oligonucleotide microarray for the study of functional gene diversity in the nitrogen cycle in the environment. Appl. Environ. Microbiol. 69, 1159–1171. doi: 10.1128/AEM.69.2.1159-1171.2003
Tsiknia, M., Paranychianakis, N. V., Varouchakis, E. A., and Nikolaidis, N. P. (2015). Environmental drivers of the distribution of nitrogen functional genes at a watershed scale. FEMS Microbiol. Ecol. 91:fiv052. doi: 10.1093/femsec/fiv052
Ward, B. B., Eveillard, D., Kirshtein, J. D., Nelson, J. D., Voytek, M. A., and Jackson, G. A. (2007). Ammonia-oxidizing bacterial community composition in estuarine and oceanic environments assessed using a functional gene microarray. Environ. Microbiol. 9, 2522–2538. doi: 10.1111/j.1462-2920.2007.01371.x
Wei, C., Su, F., Yue, H., Song, F., and Li, H. (2023). Spatial distribution characteristics of denitrification functional genes and the environmental drivers in Liaohe estuary wetland. Environ. Sci. Pollut. Res. 31, 1064–1078. doi: 10.1007/s11356-023-30938-2
Wittorf, L., Bonilla-Rosso, G., Jones, C. M., Bäckman, O., Hulth, S., and Hallin, S. (2016). Habitat partitioning of marine benthic denitrifier communities in response to oxygen availability. Environ. Microbiol. Rep. 8, 486–492. doi: 10.1111/1758-2229.12393
Yang, S., Chang, B. X., Warner, M. J., Weber, T. S., Bourbonnais, A. M., Santoro, A. E., et al. (2020). Global reconstruction reduces the uncertainty of oceanic nitrous oxide emissions and reveals a vigorous seasonal cycle. Proc. Natl. Acad. Sci. U.S.A. 117, 11954–11960. doi: 10.1073/pnas.1921914117
Yoon, S., Nissen, S., Park, D., Sanford, R. A., and Löffler, F. E. (2016). Nitrous oxide reduction kinetics distinguish bacteria harboring Clade I NosZ from those harboring Clade II NosZ. Appl. Environ. Microbiol. 82, 3793–3800. doi: 10.1128/AEM.00409-16
Zhang, B., Penton, C. R., Yu, Z., Xue, C., Chen, Q., Chen, Z., et al. (2021). A new primer set for Clade I nosZ that recovers genes from a broader range of taxa. Biol. Fertil. Soils 57, 523–531. doi: 10.1007/s00374-021-01544-6
Zhang, L., Wang, X., Wang, J., Wan, Q., Liao, L., Liu, G., et al. (2021). Grazing exclusion reduces soil N2O emissions by regulating nirK- and nosZ-type denitrifiers in alpine meadows. J. Soils Sediments 21, 3753–3769. doi: 10.1007/s11368-021-03035-5
Zumft, W. G. (1997). Cell biology and molecular basis of denitrification. Microbiol. Mol. Biol. Rev. 61, 533–616. doi: 10.1128/mmbr.61.4.533-616.1997
Keywords: nitrous oxide, nosZ, oxygen minimum zone, nitrogen cycling, denitrification
Citation: Intrator N, Jayakumar A and Ward BB (2024) Aquatic nitrous oxide reductase gene (nosZ) phylogeny and environmental distribution. Front. Microbiol. 15:1407573. doi: 10.3389/fmicb.2024.1407573
Received: 26 March 2024; Accepted: 06 May 2024;
Published: 21 May 2024.
Edited by:
Xianbiao Lin, Ocean University of China, ChinaCopyright © 2024 Intrator, Jayakumar and Ward. This is an open-access article distributed under the terms of the Creative Commons Attribution License (CC BY). The use, distribution or reproduction in other forums is permitted, provided the original author(s) and the copyright owner(s) are credited and that the original publication in this journal is cited, in accordance with accepted academic practice. No use, distribution or reproduction is permitted which does not comply with these terms.
*Correspondence: Naomi Intrator, bmFvbWlpQHByaW5jZXRvbi5lZHU=