 Zhi-Xiang Dong
94% of researchers rate our articles as excellent or good
Learn more about the work of our research integrity team to safeguard the quality of each article we publish.
Find out more
ORIGINAL RESEARCH article
Front. Microbiol. , 14 April 2021
Sec. Systems Microbiology
Volume 12 - 2021 | https://doi.org/10.3389/fmicb.2021.513962
This article is part of the Research Topic Insect Microbiome: From Diversity To Applications View all 35 articles
The Asian honey bee Apis cerana is a valuable biological resource insect that plays an important role in the ecological environment and agricultural economy. The composition of the gut microbiota has a great influence on the health and development of the host. However, studies on the insect gut microbiota are rarely reported, especially studies on the dynamic succession of the insect gut microbiota. Therefore, this study used high-throughput sequencing technology to sequence the gut microbiota of A. cerana at different developmental stages (0 days post emergence (0 dpe), 1 dpe, 3 dpe, 7 dpe, 12 dpe, 19 dpe, 25 dpe, 30 dpe, and 35 dpe). The results of this study indicated that the diversity of the gut microbiota varied significantly at different developmental stages (ACE, P = 0.045; Chao1, P = 0.031; Shannon, P = 0.0019; Simpson, P = 0.041). In addition, at the phylum and genus taxonomic levels, the dominant constituents in the gut microbiota changed significantly at different developmental stages. Our results also suggest that environmental exposure in the early stages of development has the greatest impact on the gut microbiota. The results of this study reveal the general rule of gut microbiota succession in the A. cerana life cycle. This study not only deepens our understanding of the colonization pattern of the gut microbiota in workers but also provides more comprehensive information for exploring the colonization of the gut microbiota in insects and other animals.
The gut microbiota has attracted extensive attention due to its close relationship with the host. The gut microbiota not only promotes digestion and absorption of food by the host (Cummings, 1984) but also plays an important role in host development (Sommer and Bäckhed, 2013; Lin et al., 2019), immunity (Pickard et al., 2017), aging (O’Toole and Jeffery, 2015), and resistance to pathogen invasion (Pamer, 2016). The realization of gut microbiota function depends on the composition and structure of the gut microbiota. The composition and structure of the gut microbiota change dynamically during the whole life cycle of the host. Interestingly, previous studies have shown that improving the structure of the host gut microbiota can increase the lifespan of the host (Smith et al., 2017; Han et al., 2018). For example, by transferring young African turquoise killifish (Nothobranchius furzeri) gut microbes into older hosts, the lifespan of the hosts was increased, and the rate of decline in exercise ability was delayed (Smith et al., 2017). In addition, the rapid change in the abundance of subdominant bacteria in the gut is a hallmark of human aging. Interestingly, health-related bacteria were enriched in a long-lived population (Biagi et al., 2016).
There are few reports on the colonization and succession of the host gut microbiota in the natural state, and most research has focused on vertebrates, such as foals (Costa et al., 2016), goats (Lei et al., 2018), chickens (Xi et al., 2019), and southern catfish (Zhang et al., 2018). These results indicate that the structure of the gut microbiota is constantly changing with the development of the host, and the structure of the gut microbiota is significantly correlated with host age. These studies not only revealed the succession of a series of gut microbiota species but also provided an important reference value for studying the colonization of other gut microbiota species.
Insects (Arthropoda: Insecta) are the most ubiquitous and diverse animals on the planet. The relationship between the composition of insect gut microbes and the host has gradually been revealed, including gut microbes with effects on host immunity (Wei et al., 2017), metabolism (Zheng et al., 2017), environmental exposure (Wintermantel et al., 2018), and pest control (Xie et al., 2019). In addition, the succession of insect gut microbes has also been studied. For example, Duguma et al. (2015) found that the Culex mosquito gut microbiota had different structures in different stages of development. Similar studies have been conducted in other insects, such as the burying beetle (Nicrophorus vespilloides) (Wang and Rozen, 2017), the cockroach (Blattella germanica) (Purificación et al., 2014), the queen bee (Apis mellifera) (Tarpy et al., 2015) and Drosophila melanogaster (Han et al., 2017). The results of these studies all revealed that the structure of the gut microbiota showed a significant correlation at different stages of development in different insects. However, little is known about the natural succession of the insect gut microbiota in the natural state, such as that in honey bees.
Honey bees are important pollinators and convey great economic benefits to crop pollination worldwide (Southwick and Southwick, 1992; Kevan, 1999; Klein et al., 2007; Kleijn et al., 2015). In addition, the relationship between the bee gut microbiota and health has received considerable attention. When honey bees are exposed to pesticides, their gut microbiota is disturbed, and their mortality increases (Motta et al., 2018). Moreover, the overuse of antibiotics also leads to structural changes in the gut microbiota of honey bees, making them more susceptible to infection by pathogens and leading to greater challenges to bee survival (Raymann and Moran, 2017). In addition, when A. cerana were infected with Nosema ceranae, the steady state of the gut microbiota was disturbed, leading to an increase in the mortality rate of the bees (Huang et al., 2018). These studies all suggest that the gut microbiota plays an important role in bee health and disease. However, the gut microbes of A. cerana are poorly studied, and little is known about the succession rules of the gut microbiota of honey bees. This lack of knowledge limits our understanding of the gut microbiota throughout the life cycle of A. cerana and hinders our ability to protect resource insects.
The goal of this study was to elucidate the dynamic changes in the gut microbiota throughout the life cycle of A. cerana from the perspective of the composition and structure of the gut microbiota. In this study, high-throughput sequencing technology was used to sequence the gut microbiota of workers 0 days post emergence (dpe), 1 dpe, 3 dpe, 7 dpe, 12 dpe, 19 dpe, 25 dpe, 30 dpe, and 35 dpe. The purpose of this study was to elucidate the colonization rules of gut microbes in A. cerana, which inform important theories for improving host health through gut microbes. In addition, this study provides reference information for the study of gut microbe colonization in other animals.
Worker samples were collected in Kunming, Yunnan Province in July 2018. To obtain bees of different ages, we conducted sample collection in accordance with the method described in previous publications (Powell et al., 2014; Guo et al., 2015). First, we identified a healthy hive, determined the age of the workers and selected a frame in which new workers were appearing. A frame of late-stage pupae (eyes were pigmented, but pupae lacked movement) was selected from the hive and moved to a sterile incubator (34°C and 90% relative humidity, mimicking hive conditions), and the pupae were allowed to eclose naturally. We first collected worker samples 0 dpe (0 days post emergence) and placed them in 1.5 mL centrifuge tubes (0 dpe individuals had no contact with the environment). Next, 300 newly emerged worker individuals from the incubator were marked with red Testors enamel paint and then returned to the original hive to allow for natural growth. Finally, according to the life cycle of the bees, samples were randomly collected 1 dpe, 3 dpe, 7 dpe, 12 dpe, 19 dpe, 25 dpe, 30 dpe and 35 dpe. Three worker samples were collected 0 dpe, 1 dpe, 3 dpe and 7 dpe, and six worker samples were collected 12 dpe, 19 dpe, 25 dpe, 30 dpe and 35 dpe. All worker samples were immediately placed in an ultralow temperature freezer (EU1DW/BD-55W321EU1, China) after collection.
In the process of sample collection, we to reduce the contamination of the samples, including the use of sterile centrifuge tubes. All experiments were conducted on a sterile ultraclean platform, and all the equipment was treated with high-temperature sterilization.
First, workers were removed from the ultralow temperature freezer and placed onto an ultraclean working table. Then, sterile tweezers were used to remove the entire gut of the workers, and the gut was then placed into a 1.5 mL sterile centrifuge tube. Then, 60 μL of Krebs Ringer buffer was added to the centrifuge tube, and the sample was ground. A soil DNA kit (Omega Biotek, Norcross, GA, United States) was used to extract the gut bacterial DNA of the workers according to the manufacturer’s protocol. Finally, 60 μL of elution buffer was added to obtain the DNA sample, and the resulting DNA sample was stored in a freezer at −20°C. The final DNA concentration and purity were determined with a NanoDrop 2000 UV-vis spectrophotometer (Thermo Scientific, Wilmington, United States), and the DNA quality was determined with 1% agarose gel electrophoresis. The V3-V4 hypervariable regions of the bacterial 16S rRNA gene were amplified with the primers 338F (5′-ACTCCTACGGGAGGCAGCAG-3′) and 806R (5′-GGACTACHVGGGTWTCTAAT-3′) by a thermocycler PCR system (GeneAmp 9700, ABI, United States). PCR was conducted using the following program: 3 min of denaturation at 95°C; 27 cycles of 30 s at 95°C, 30 s annealing at 55°C, and 45 s elongation at 72°C; and a final extension at 72°C for 10 min. Each PCR was performed in triplicate in 20 μL of reaction mixtures containing 4 μL of 5 × FastPfu buffer, 2 μL of 2.5 mM dNTPs, 0.8 μL of each primer (5 μM), 0.4 μL of FastPfu Polymerase and 10 ng of template DNA. The resulting PCR products were extracted from a 2% agarose gel, further purified using an AxyPrep DNA gel extraction kit (Axygen Biosciences, Union City, CA, United States) and quantified using QuantiFluorTM-ST (Promega, United States) according to the manufacturer’s protocol.
Purified amplicons were pooled in equimolar amounts and paired-end sequenced (2 × 300) on an Illumina MiSeq platform (Illumina, San Diego, United States) according to the standard protocols by Majorbio Bio-Pharm Technology Co., Ltd. (Shanghai, China).
MiSeq sequencing results were reported as paired-end sequence data. First, according to the overlap relation between PE reads, pairs of reads were merged into a single sequence. At the same time, the quality of the reads and the effect of merging were used as filters. Barcode and primer sequences at both ends of the sequence were used to distinguish the samples and obtain the effective sequence. In addition, the sequence direction was corrected to optimize the data.
Raw fastq files were quality filtered by Trimmomatic and merged by FLASH with the following criteria: (i) The reads were truncated at any site with an average quality score <20 over a 50 bp sliding window; (ii) sequences with overlaps longer than 10 bp were merged according to their overlap, with no more than 2 bp mismatched; and (iii) the sequences of each sample were separated according to barcodes (exactly matching) and primers (allowing 2 nucleotide mismatches), and reads containing ambiguous bases were removed. Operational taxonomic units (OTUs) were clustered with a 97% similarity cutoff using UPARSE (version 7.1)1 with a novel “greedy” algorithm that performs chimera filtering and OTU clustering simultaneously. The taxonomy of each 16S rRNA gene sequence was analyzed by the RDP Classifier algorithm2 against the Silva (SSU123) 16S rRNA database at a confidence threshold of 70%.
One-way analysis of variance (ANOVA) was used to analyze the diversity parameters (ACE, Chao1, Shannon and Simpson) of the gut microbiota of workers at different dpe (the time points after the emergence of workers, 0 dpe, 1 dpe, 3 dpe, 7 dpe, 12 dpe, 19 dpe, 25 dpe, 30 dpe and 35 dpe). In addition, Kruskal-Wallis H test was performed to analyze the bacteria with the highest abundance (phylum and genus taxa) in the gut of workers at different dpe. According to the gut microbiota abundance of workers of different ages, Kruskal-Wallis H test was performed to conduct hypothesis tests for different groups. In addition, the significance level of differences in species abundance was evaluated, and the species with significant differences at different ages were obtained (from analysis using the stats package in R and the SciPy package in Python). The non-metric multidimensional scaling (NMDS) distance algorithm based on Bray-Curtis distance was used to calculate the differences between the assessment of microbial communities (QIIME was used to calculate the beta diversity distance matrix, and the R language vegan software package was used for NMDS analysis and mapping).
Deep sequencing of 42 gut samples from workers yielded 1,988,217 sequences with a total length of 886,569,845 bp and an average length of 445.91 bp. A total of 1670 OTUs were obtained at a 97% similarity level. Cluster analysis was conducted at the phylum and genus levels, and 30 phyla and 512 genera were obtained. Good’s coverage index showed that the estimated values of all samples were over 99%, indicating that all samples reached an appropriate sequencing depth (Table 1). In addition, the raw reads were deposited into the NCBI Sequence Read Archive (SRA) database (accession numbers SRR9715685-SRR9715699, SRR9715700-SRR9715726).
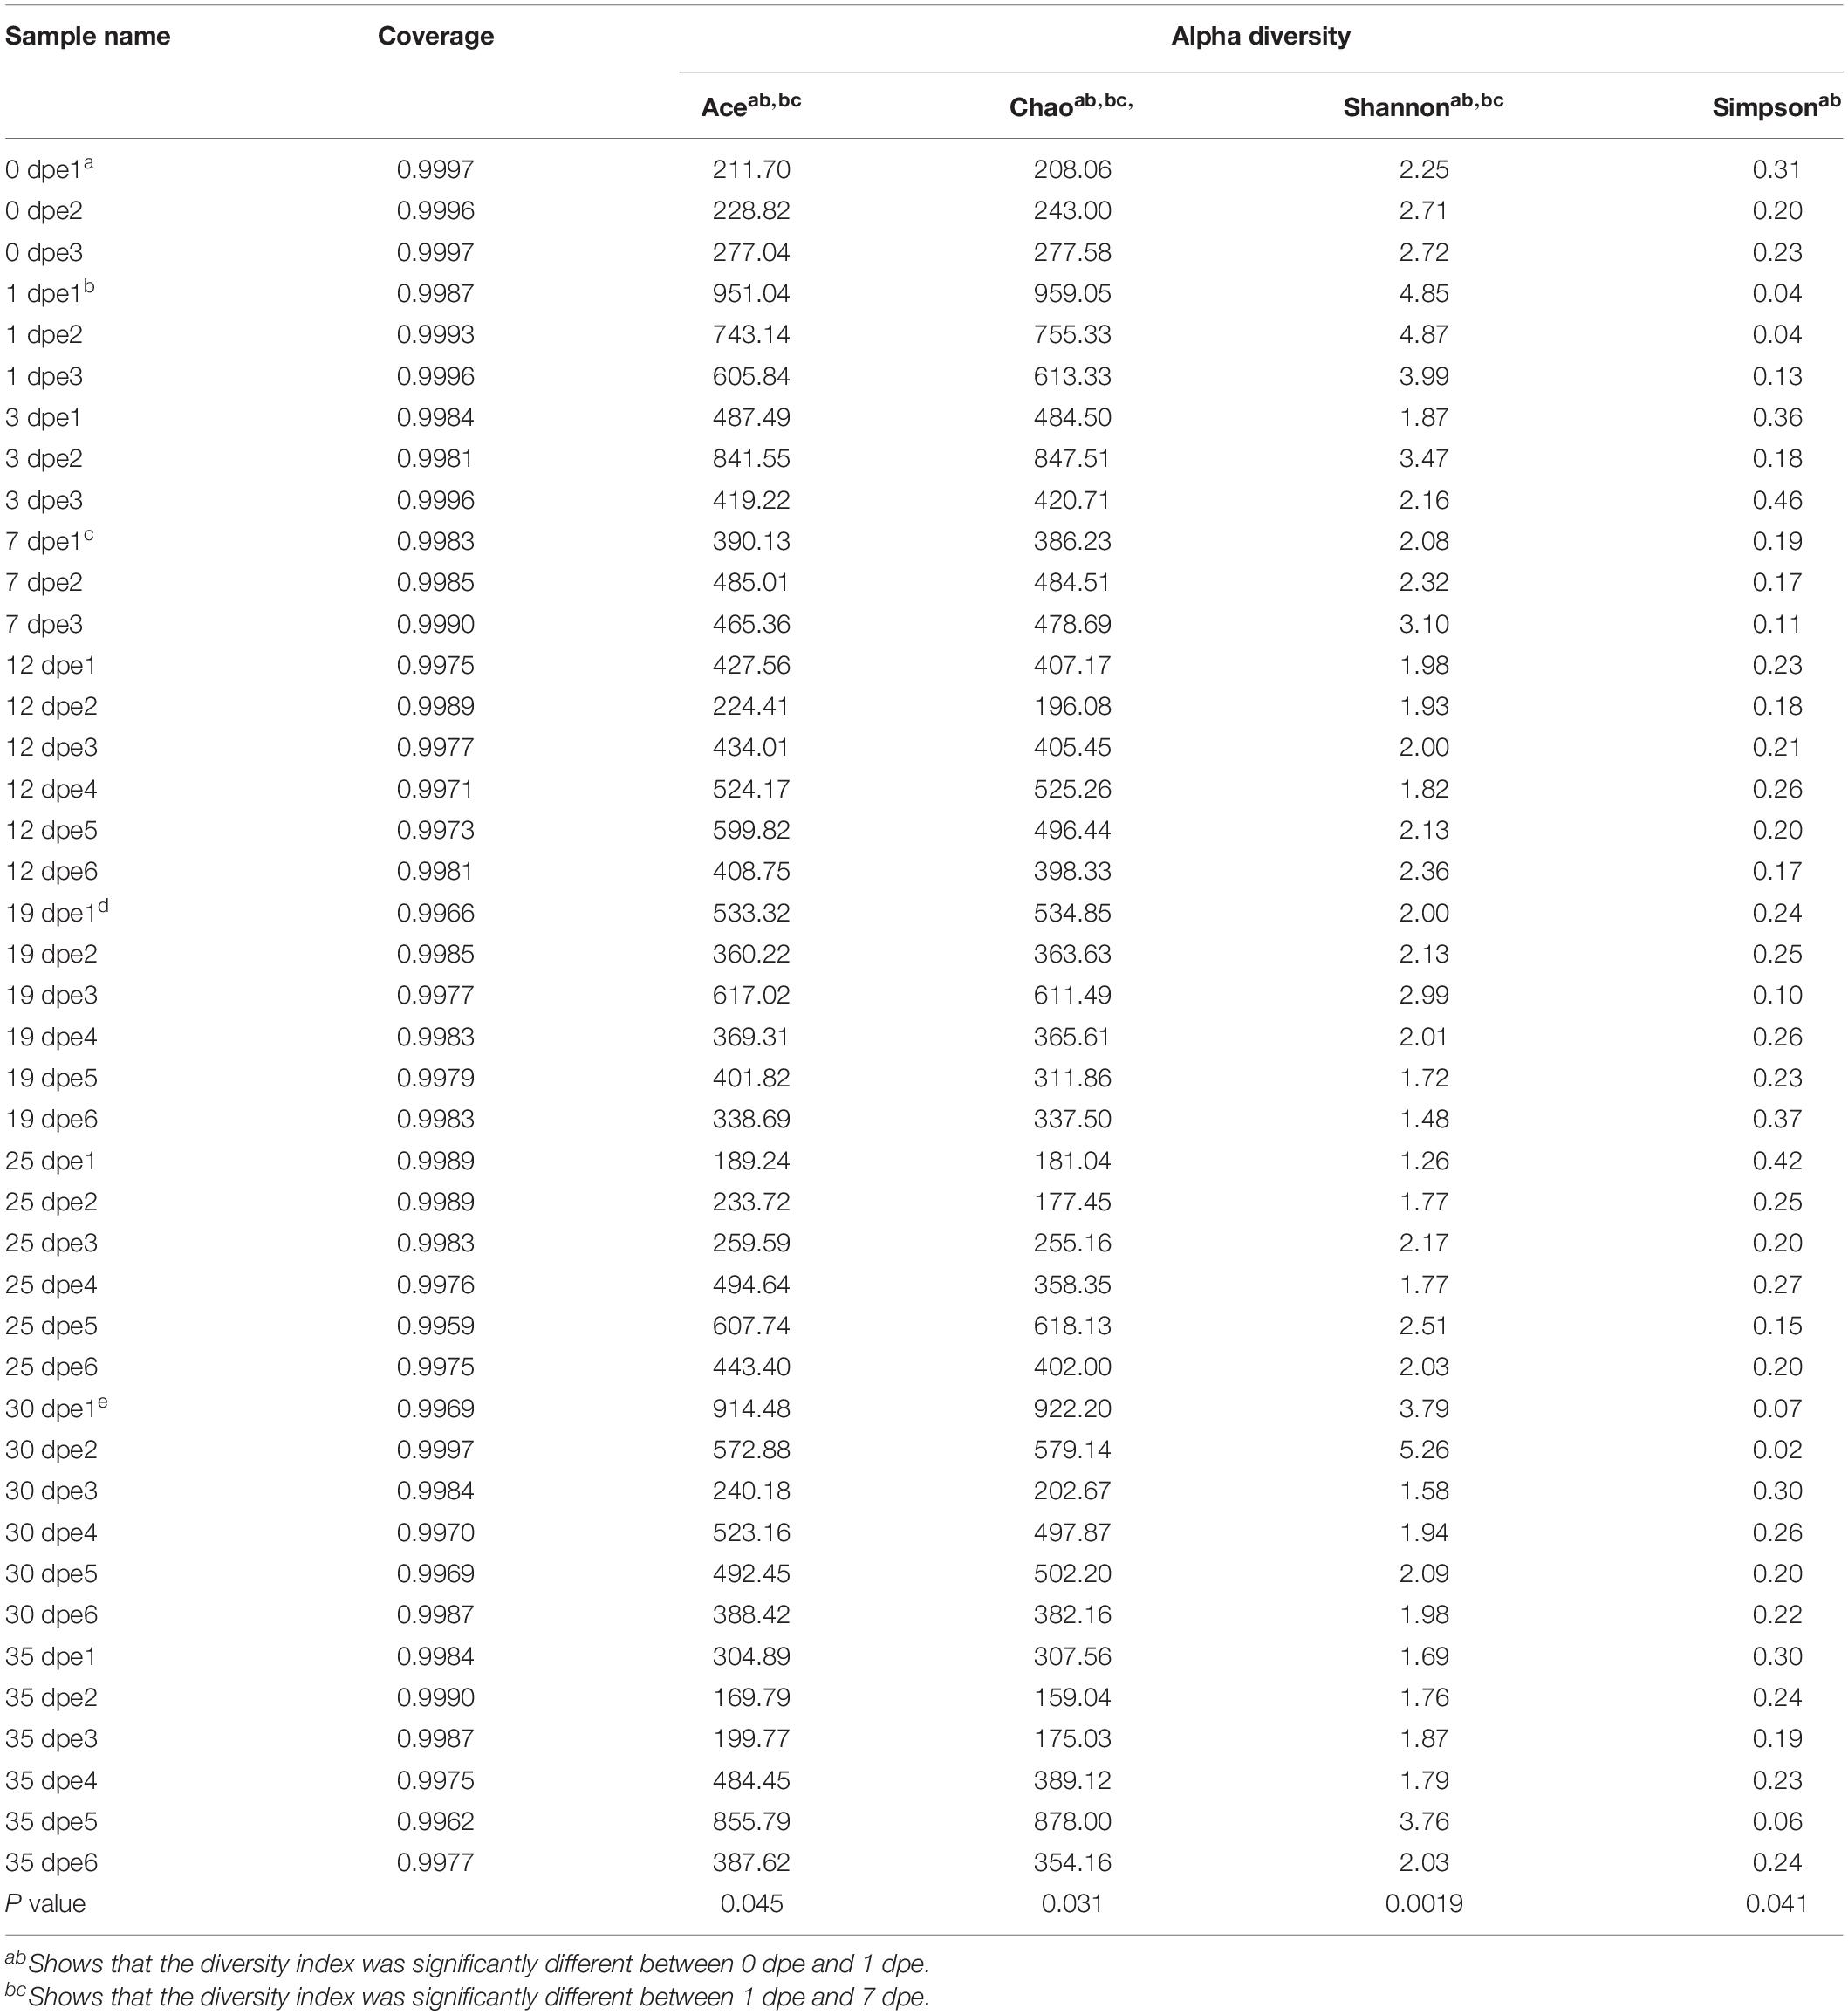
Table 1. Richness and diversity indices relative to each gut sample.
The diversity of bacterial communities is reflected through the Shannon and Simpson indices, and the richness of the community is reflected by the Chao1 and ACE indices. The results showed that the diversity of the gut microbiota was influenced by the age of the host; moreover, the composition and structure of the gut microbiota of workers of different ages were significantly different (Table 1). Namely, the P-values of the bacterial diversity index differences were as follows: ACE, P = 0.045; Chao1, P = 0.031; Shannon, P = 0.0019; and Simpson, P = 0.041.
At the phylum level of classification, the gut microbiota of workers consisted mainly of the following bacteria: Proteobacteria, Cyanobacteria, Planctomycetes, Spirochaetae, Bacteroidetes, Actinobacteria, Verrucomicrobia, Acidobacteria, Firmicutes, and Fibrobacteres. The results of this study also showed that there were significant differences in the relative abundance of some of the top 10 phyla in the gut of workers of different ages (Table 2). Proteobacteria had the highest relative abundance 0 dpe (71.97%) and the lowest abundance 1 dpe (15.50%) (P = 0.013). Bacteroidetes are an important and consistent components of the worker gut, and their relative abundance was lowest 0 dpe (2.45%) and highest 30 dpe (28.07%) (P = 0.021). Actinobacteria had the highest relative abundance 0 dpe (11.06%) and the lowest 1 dpe (0.72%). In addition, the relative abundance of Firmicutes was lowest 0 dpe and highest 3 dpe (54.94%) (P = 0.008). Moreover, the following bacteria were significantly different in the gut of workers of different ages: the relative abundance of cyanobacteria was highest at 1 dpe and lowest at 25 dpe (P = 0.015), the relative abundance of Spirochaetae was highest 1 dpe and lowest at 25 dpe (P = 0.0095), the relative abundance of Fusobacteria was lowest 0 dpe and highest 1 dpe (P = 0.011), the relative abundance of Verrucomicrobia was lowest 0 dpe and highest 1 dpe (P = 0.032), the relative abundance of Acidobacteria was highest 0 dpe and lowest at 25 dpe (P = 0.00061), and the relative abundance of Chloroflexi was highest 0 dpe and lowest 19 dpe (P = 0.0092) (Supplementary Figure 1).
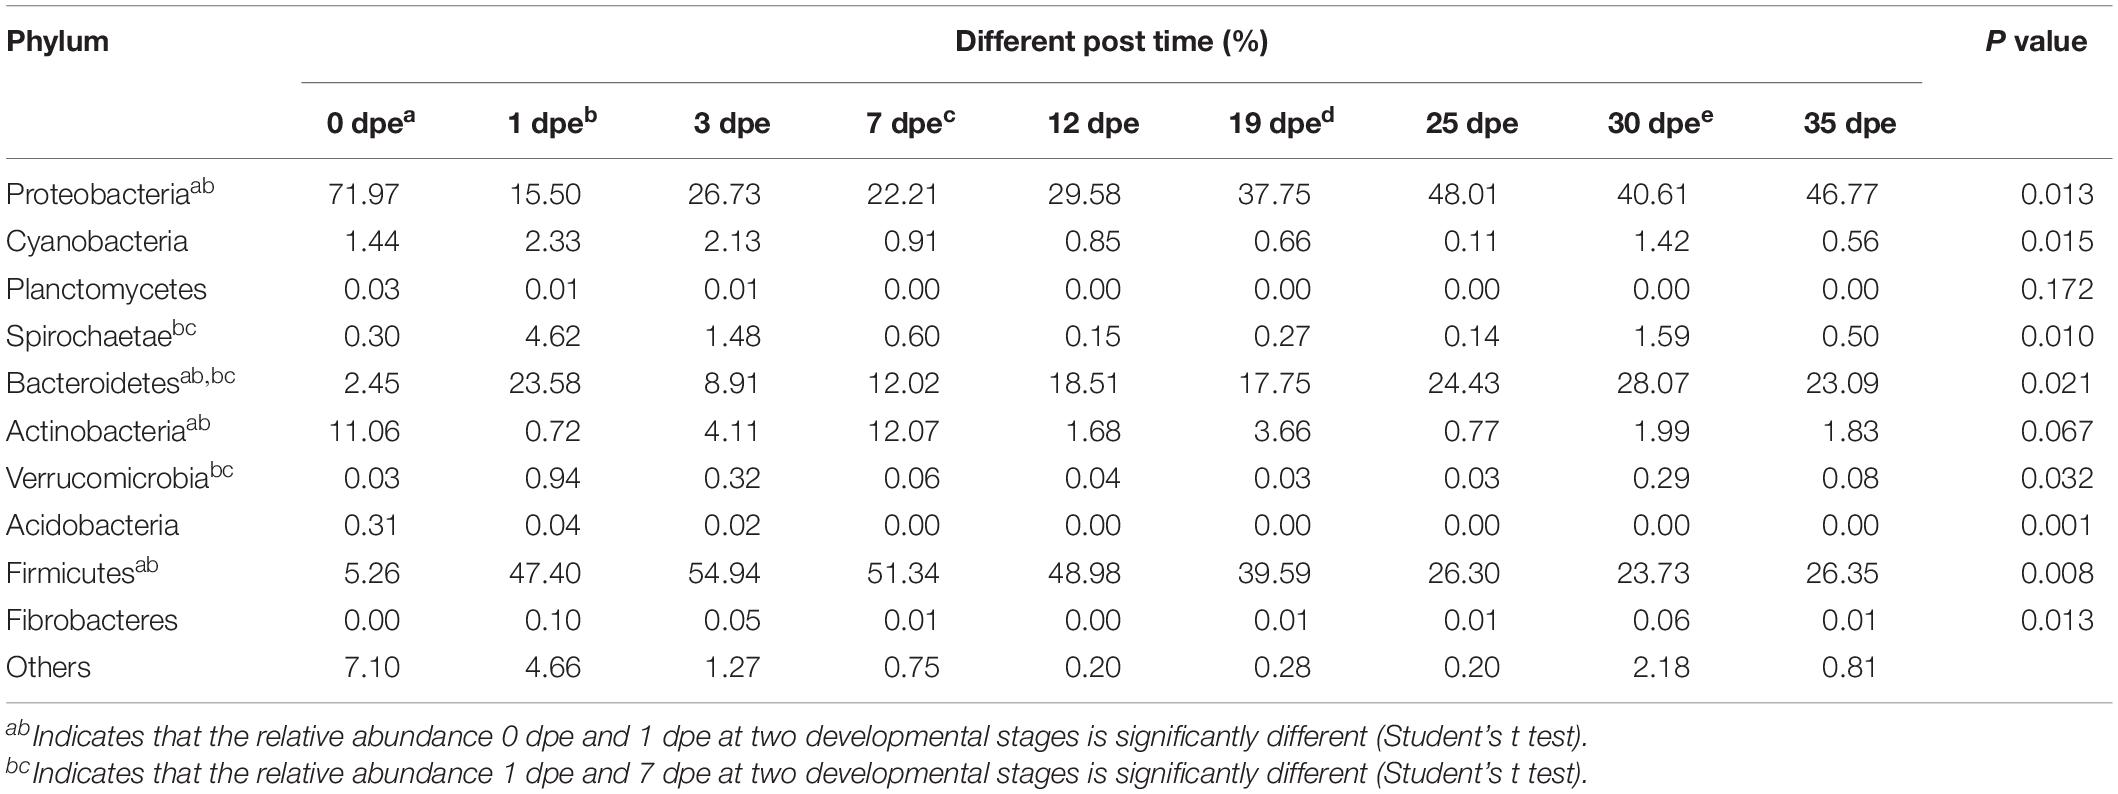
Table 2. Top 10 abundant phyla.
The results of this study indicated that there were 35 genera with a relative abundance higher than 1% in the gut of A. cerana workers (Figure 1A). Among them, the genera with the highest relative abundances were Lactobacillus, Gilliamella, Apibacter, Acinetobacter, Snodgrassella, Bifidobacterium, Peptostreptococcaceae, Escherichia-Shigella, Bacteroides, and Sphingomonas. In addition, the gut microbiota 0 dpe and 1 dpe had similarities in structure, and the genera with the highest relative abundances were Acinetobacter, Sphingomonas and Lactobacillus (Figure 1B). After 3 dpe, the structure of the gut microbiota was more uniform (Figure 1B).
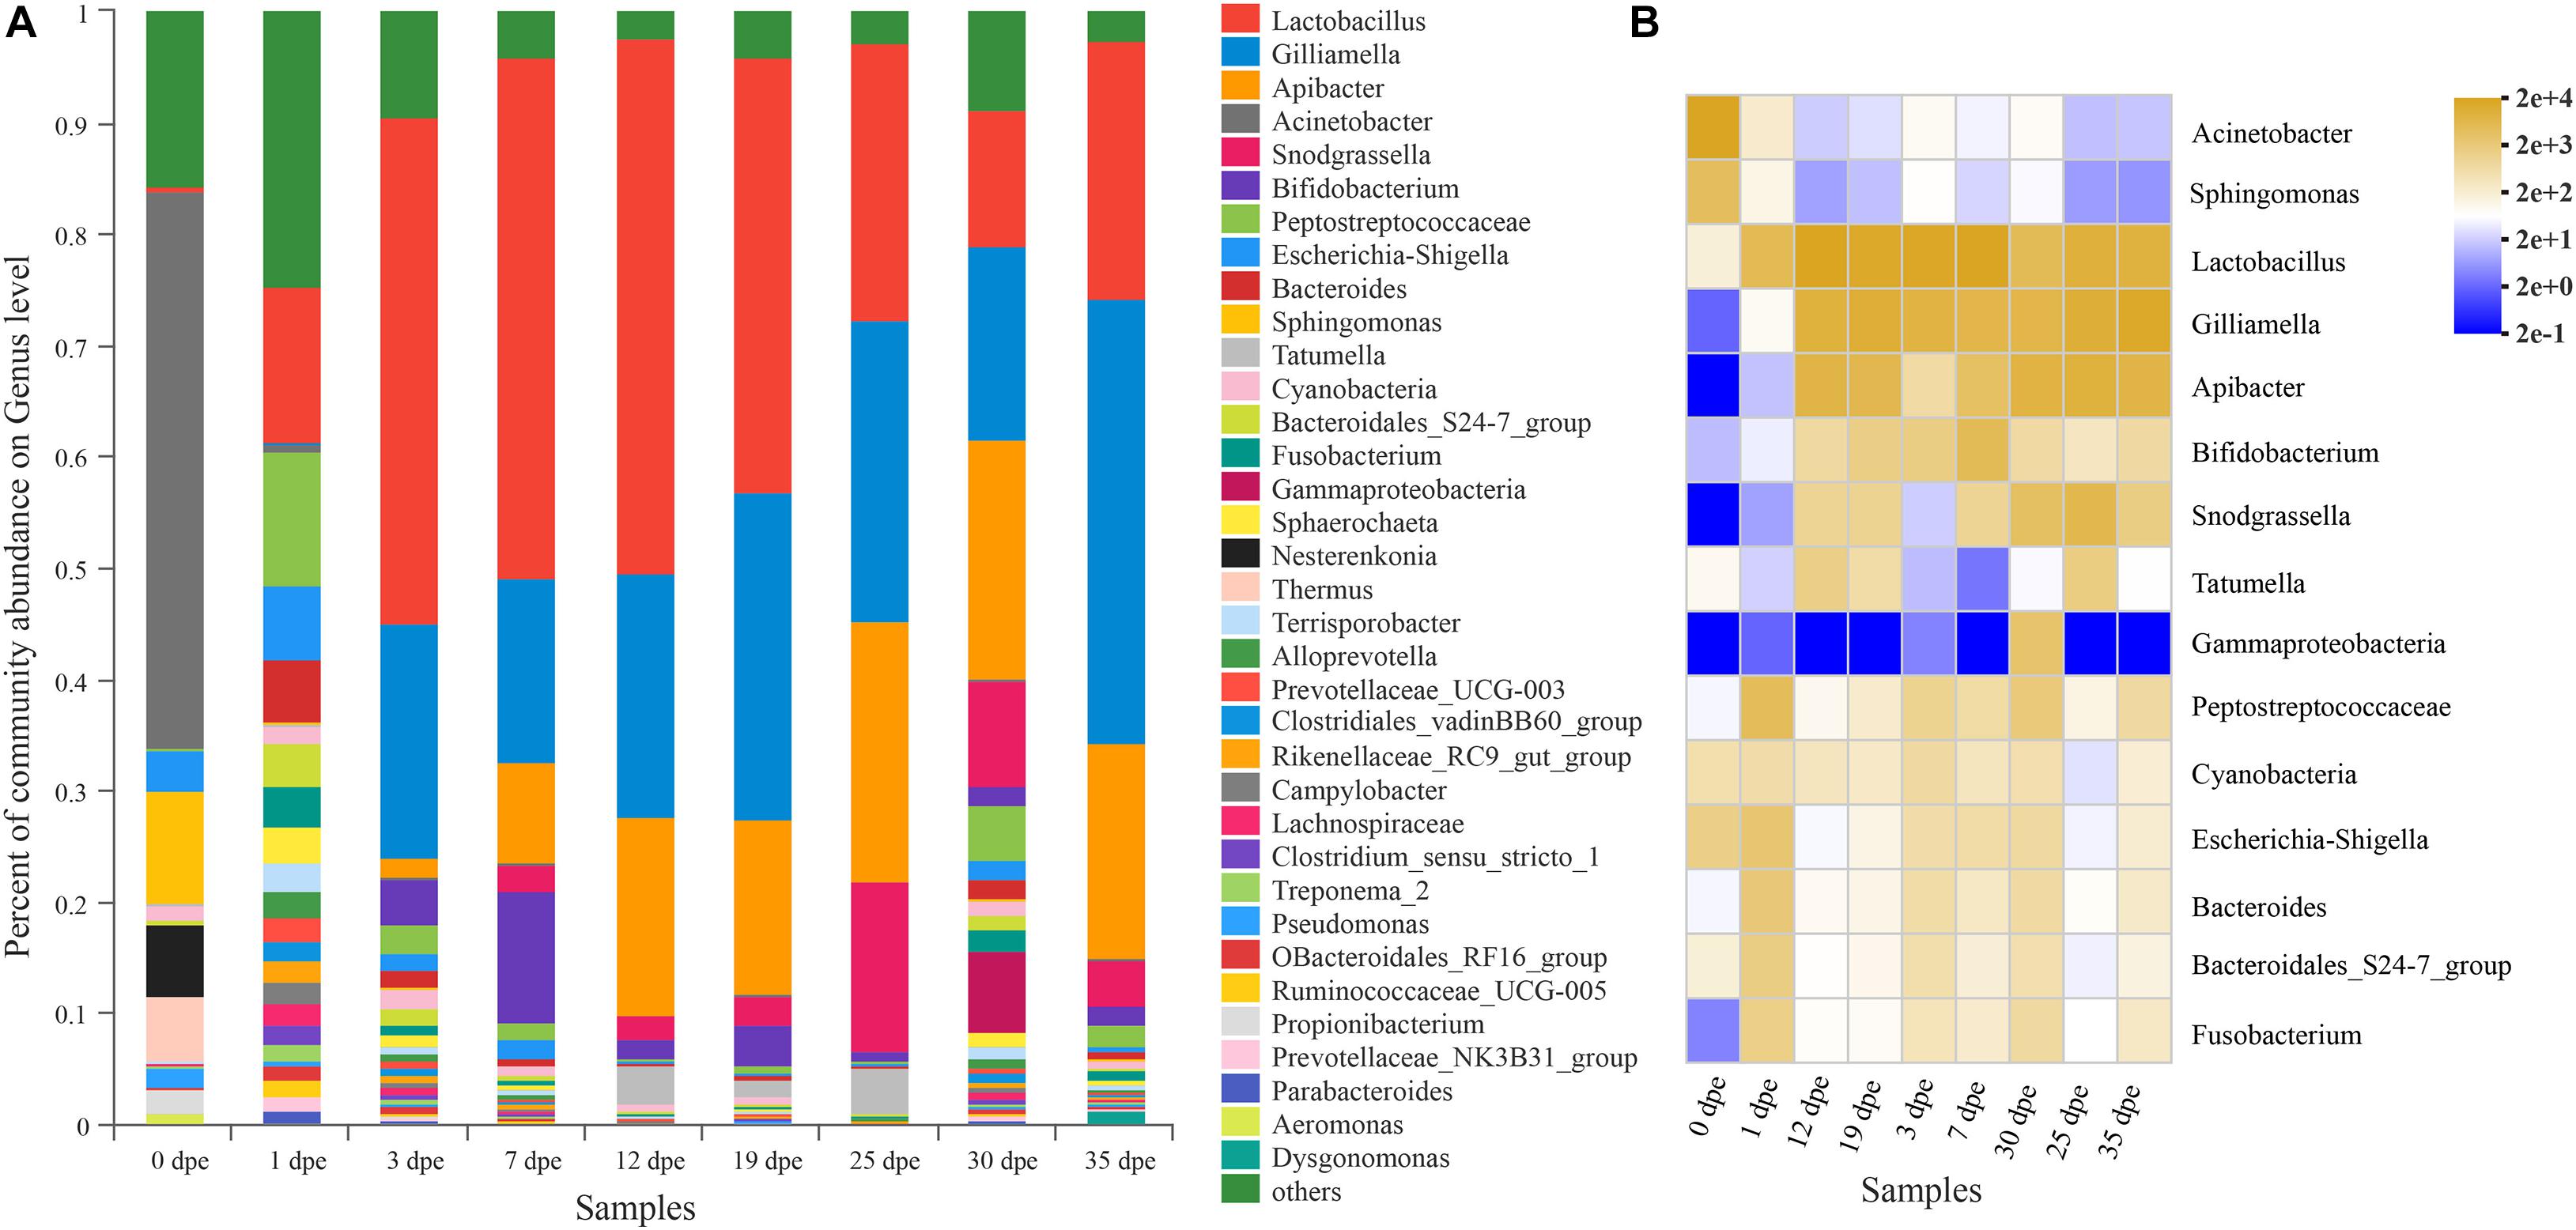
Figure 1. (A) The abscissa is the sample name, and the ordinate is the proportion of species in the sample. The column of different colors represents different species, and the length of the column represents the proportion of the species. (B) The abscissa is the name of the sample, and the ordinate is the name of the species. The abundance of different species in the sample is shown by the color gradient of the color block. The right side of the figure is the value represented by the color gradient.
An interesting result of this study was that there were significant differences in the relative abundance at the genus level of the gut microbiota (top 14) of workers of different ages (Table 3). The relative abundance of Lactobacillus was only 0.44% 0 dpe and 48.09% 12 dpe. The relative abundances of Gilliamella and Apibacter were the lowest 0 dpe (both lower than 0.01%), and the relative abundance of Gilliamella had increased significantly by 3 dpe and then became stable. The relative abundance of Apibacter reached 17.62% 12 dpe and then stabilized. The relative abundances of Acinetobacter and Sphingomonas were the highest 0 dpe (49.91 and 10.21%, respectively). Interestingly, the relative abundance of both genera decreased significantly after 0 dpe, and although Acinetobacter and Sphingomonas still occupied a certain niche, their relative abundances in the gut of the workers were not high and tended to be stable. Snodgrassella and Bifidobacterium are important bacteria in the gut of workers. Their relative abundances were the lowest 0 dpe; the highest relative abundance of Snodgrassella was observed 25 dpe (14.28%), and the highest relative abundance of Bifidobacterium was observed 7 dpe (11.98%). The relative abundance of bacteria of the genera Peptostreptococcaceae, Escherichia-Shigella, Bacteroides, Tatumella, Cyanobacteria, Fusobacterium and Gammaproteobacteria in the gut of workers was higher than 1%, and the relative abundance was significantly different at different ages of A. cerana (Figure 2 and Table 3). The abundance of Peptostreptococcaceae was lowest 0 dpe and highest 1 dpe (P = 0.006). The abundance of Escherichia-Shigella was highest 1 dpe and lowest 12 dpe. The abundance of Bacteroides was lowest 0 dpe and highest 1 dpe (P = 0.016). The abundance of Tatumella was lowest 7 dpe and highest 25 dpe. The changes in the abundances of Cyanobacteria, Fusobacterium and Gammaproteobacteria were significantly different; P-values were as follows: P = 0.019, P = 0.005, P = 0.012, respectively.
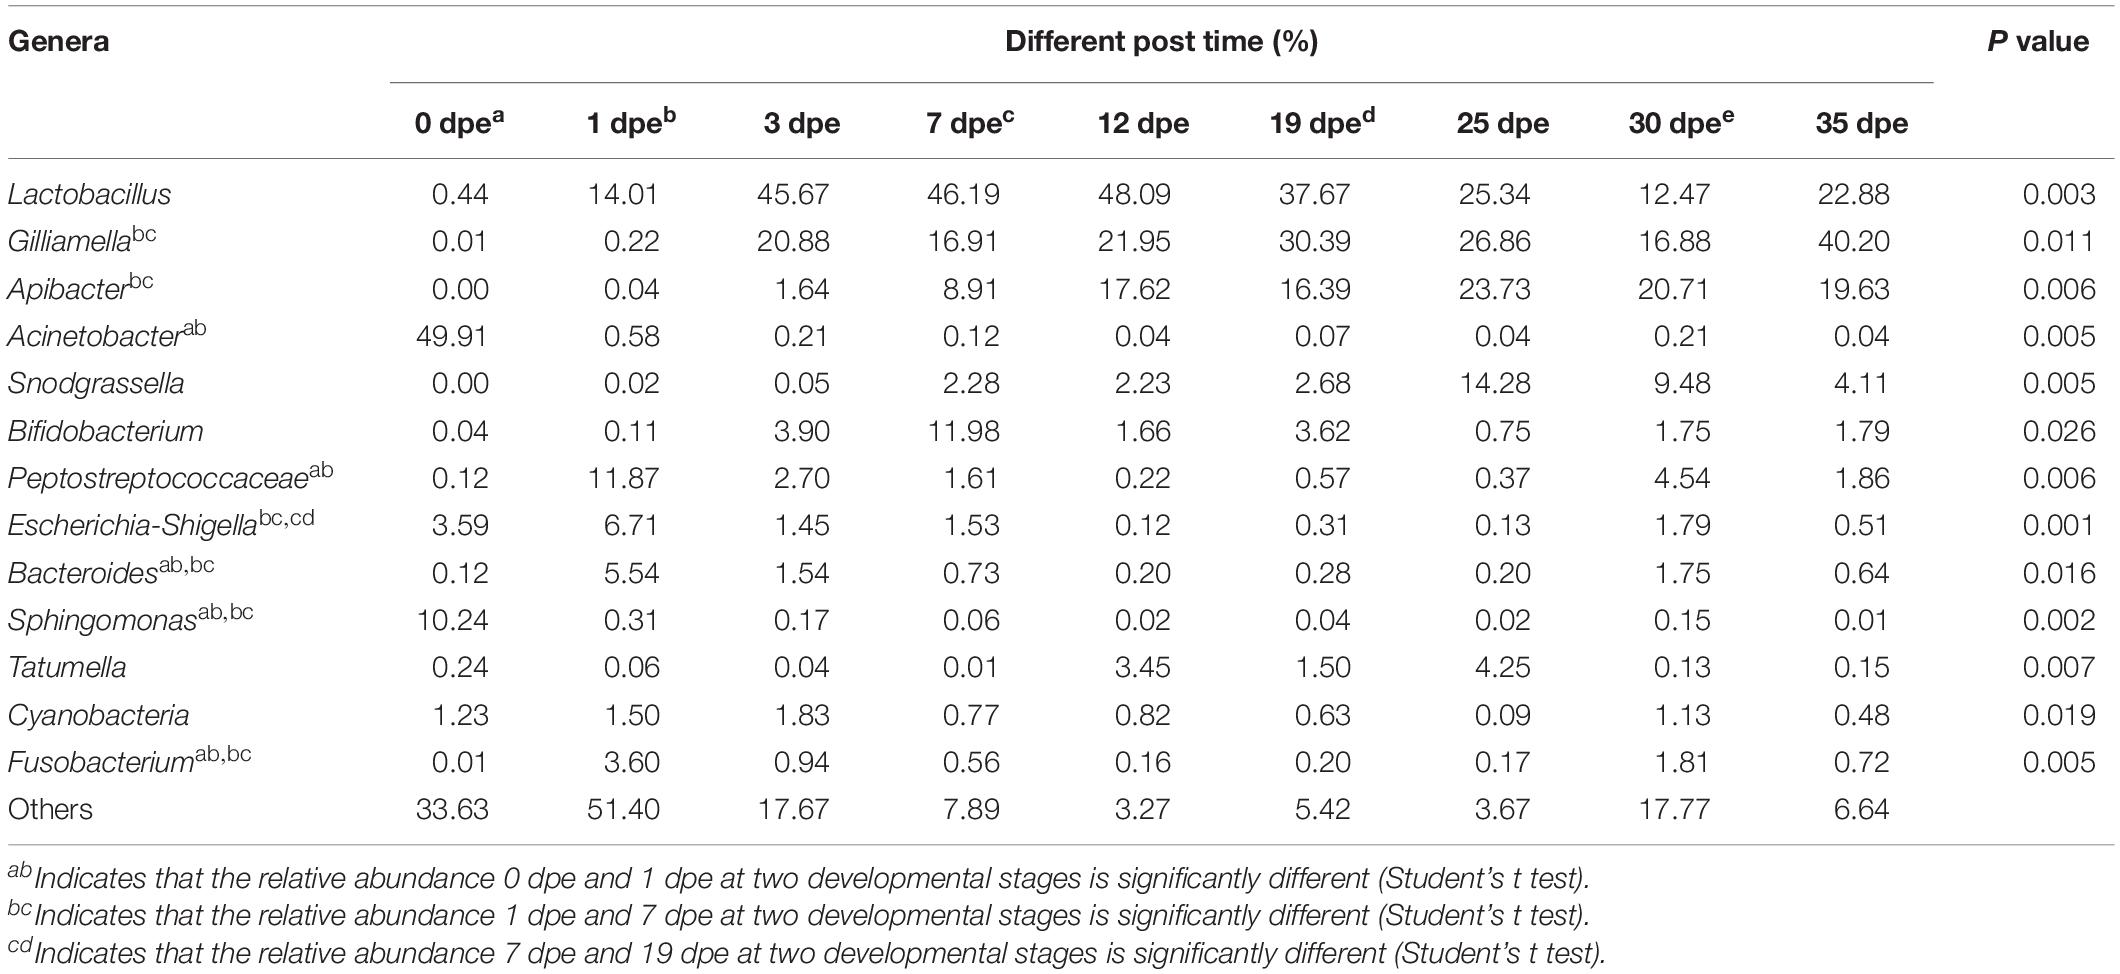
Table 3. Top 13 abundant genera.
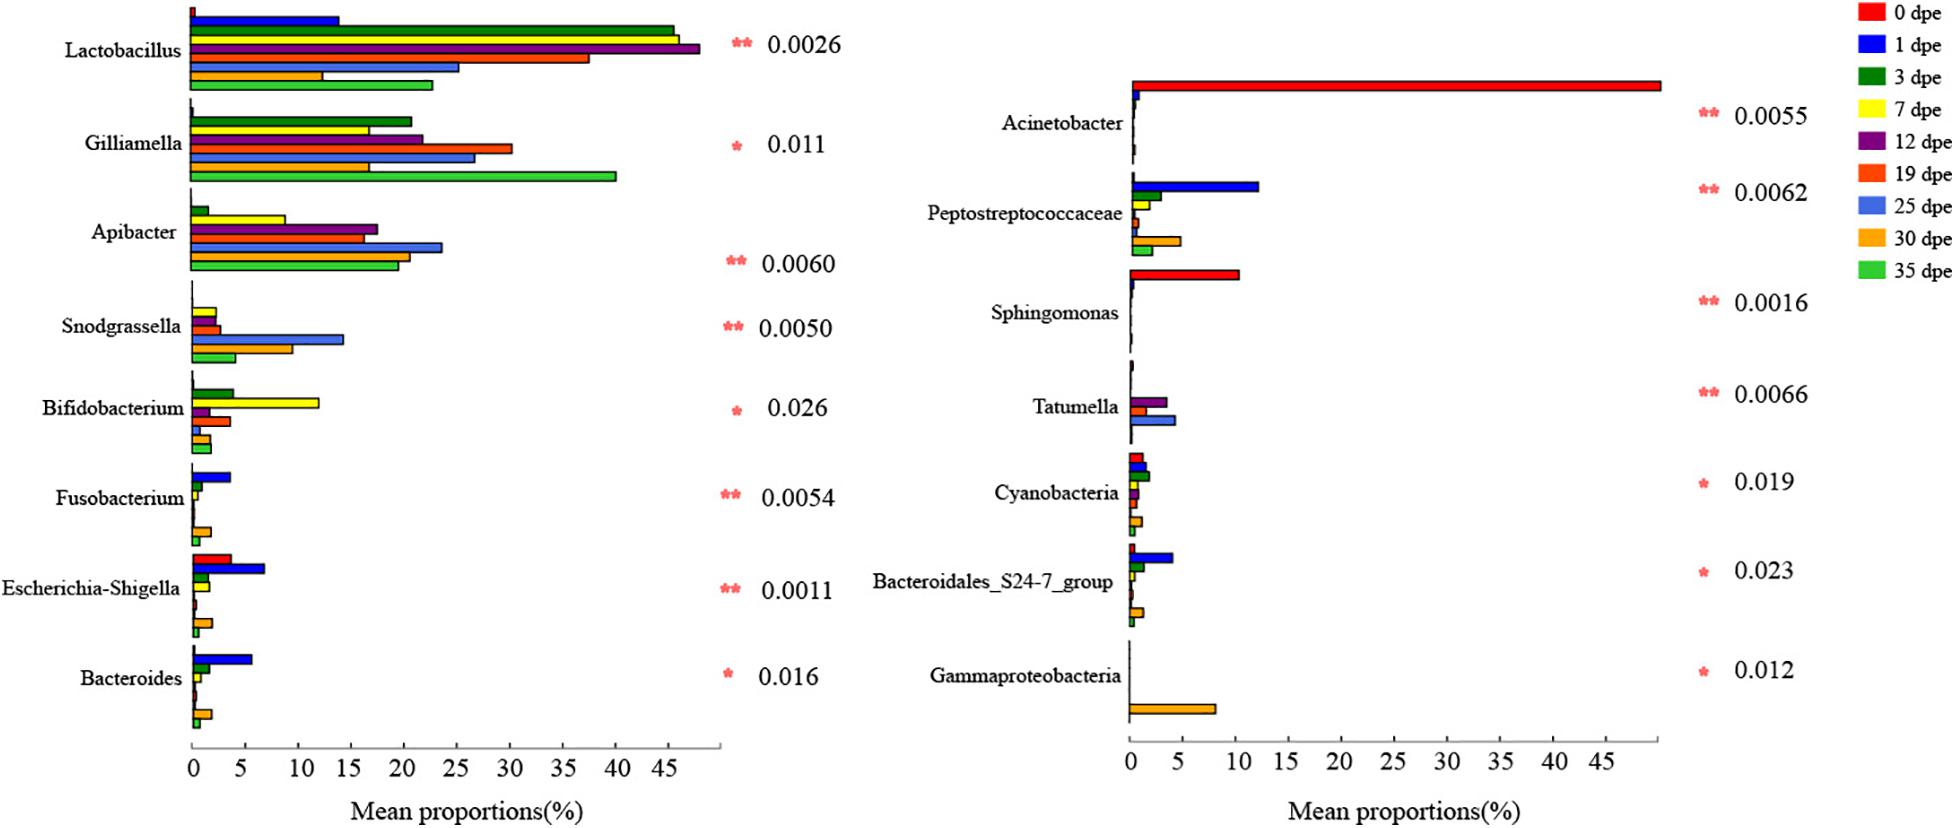
Figure 2. The vertical axis represents the species names at genus classification level, the corresponding column length represents the average relative abundance of the species in various groups, and different colors represent different groups. On the far right is the value of P, *0.01 < P ≤ 0.05, **0.001 < P ≤ 0.01, ***P ≤ 0.001.
Interestingly, we performed statistical analysis on the intestinal flora of bees at different developmental stages, and the results showed that at the phylum and genus levels, there were significant changes in the relative abundance of 19 phyla and 236 genera, respectively. Details of the relative abundances are shown in Supplementary Table 1.
The gut microbiota was analyzed based on the weighted UniFrac distance of a principal coordinates analysis (PCoA) and Bray-Curtis distance of the non-metric multidimensional scaling (NMDS) method for workers at different dpe. PCoA and NMDS analyses revealed that the compositions of the gut microbiota of workers at different dpe were different (Figure 3). In addition, the gut microbiota of workers 0 dpe was significantly separated from that of workers at other dpe, indicating that the composition of the gut microbiota of workers 0 dpe was significantly different from that at other dpe. Next, the gut microbiota of workers 1 dpe and 3 dpe was separated from that at other dpe, indicating that the composition of the gut microbiota of workers 1 dpe and 3 dpe was different from that at other dpe. Although the distances between the 7 dpe, 12 dpe, 19 dpe, 25 dpe, 30 dpe and 35 dpe groups were small, the samples of different dpe groups were clustered in their respective groups. Overall, samples from each group were concentrated in clusters of workers of different ages. In the PCoA, PC1 accounted for 38.75% of the total variance, and PC2 accounted for 22.72% (Figure 3A). In the NMDS, stress = 0.104, which indicated that the grouping and sampling were reliable (Figure 3B).
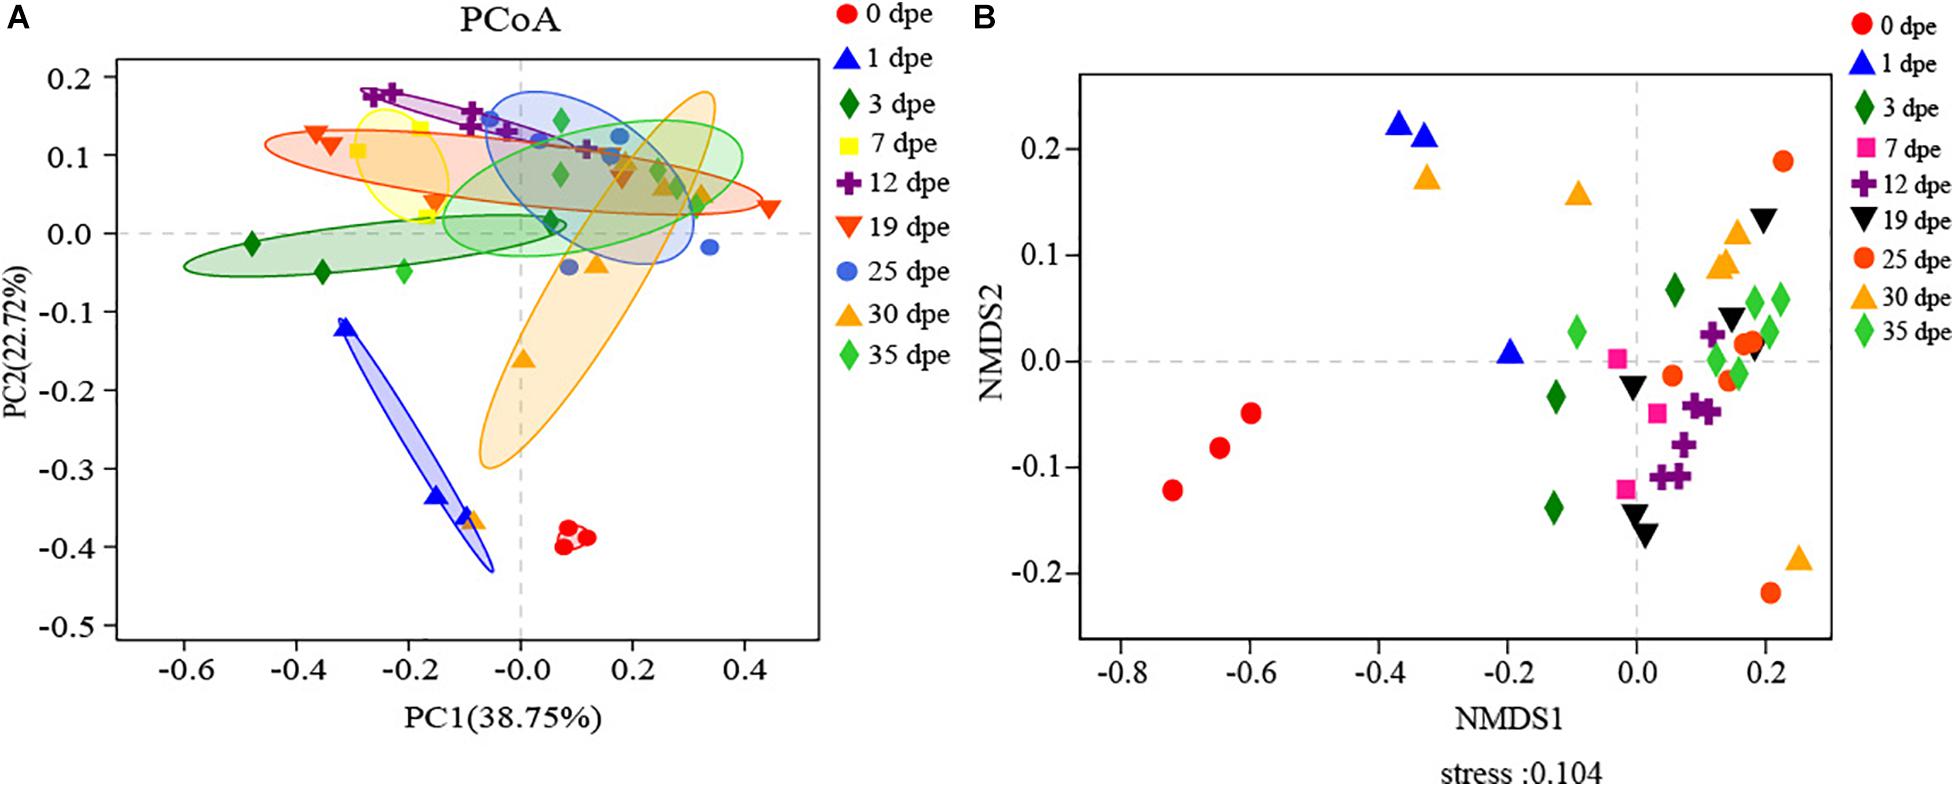
Figure 3. (A,B) The horizontal and vertical coordinates represent the two selected principal coordinate components, and the percentage represents the contribution value of the principal coordinate component to the sample composition difference. The scales of the horizontal and vertical axes are relative distances and have no practical significance. Points of different colors or shapes represent samples of different groups. The closer the two sample points are, the more similar the species composition of the two samples will be.
A. cerana and Apis mellifera, as the two largest commercial species of bees in China, not only produce an abundance of bee products with huge economic value but also provide pollination services for crops. In addition, these bees exhibit similar life cycles and behaviors, including division of labor. Previous studies have shown that the gut of Apis mellifera consists mainly of nine types of bacteria, Lactobacillus Firm-4, Lactobacillus Firm-5, Snodgrassella alvi, Gilliamella apicola, Bifidobacterium, Frischella perrara, Bartonella apis, Parasaccharibacter apium and Alpha 2.1 (Jeyaprakash et al., 2003; Babendreier et al., 2007; Bottacini et al., 2012; Kwong and Moran, 2013; Philipp et al., 2013). In addition, many published studies have shown that gut microbes in A. mellifera undergo dynamic changes at different developmental stages, and there were significant correlations between microbes and host development, aging and social behavior (Dong et al., 2020). However, studies on the gut microbes of A. cerana at different stages of host development are rare. This fact is not conducive to the recognition and protection of this important bee species. Therefore, this study used high-throughput sequencing technology to explore the gut microbes of A. cerana at different stages of development.
The gut microbiota plays an important role in the health and disease of the host (Raymann and Moran, 2018), and the study of the gut microbiota is of great significance for the protection of bees, important resources, and can further reveal the dynamic succession of the insect gut microbiota. The results showed that the diversity of the gut microbiota changed significantly throughout the life cycle of bees. Interestingly, the diversity of the gut microbiota of A. cerana was highest 1 dpe. Previous studies reported that the gut microbiota of honey bees was acquired mainly through social contact (Powell et al., 2014). Stephens et al. (2016) studied the gut microbiota of zebrafish at different developmental stages and found that environmental exposure in early development had the greatest impact on the gut microbiota (Stephens et al., 2016). After pupation of A. cerana 0 dpe, the bees were quickly in contact with the hive environment and the older bees, which may be an important reason for the significant increase in gut microbiota diversity 1 dpe. Therefore, environmental exposure has a huge impact on the diversity of the gut microbiota during the development of the host. This phenomenon is true for insects and fish. However, further research is needed to determine whether this theory applies to other animal groups. In addition, the same is true for infants who have a low gut microbiota diversity, which becomes more abundant as the infants grow (Azad et al., 2015). It can be inferred from these results that the transformation of gut microbiota diversity of A. cerana is similar to that of humans; it may be a common rule that gut microbiota diversity changes with host development, but further experimental exploration is needed.
In this study, it was found that 0 dpe samples lacked the core microbiota in the gut, which was consistent with previous reports (Yun et al., 2018). The results of this study further support the reliability of previous results. The gut microbiota of A. cerana 0 dpe is dominated by Proteobacteria, which are among the major gut microbiota constituents of other insects (Yun et al., 2014). These results indicate that the dominant role of Proteobacteria in the insect gut microbiota may be a distinctive feature of insect gut microbiota composition. Notably, this hypothesis needs to be confirmed by analysis of the gut microbiota of more insect groups. In addition, the composition of the gut microbiota of A. cerana and Anoplophora glabripennis at the phylum level is similar, with both being dominated by Proteobacteria, Firmicutes, Bacteroidetes and Actinobacteria (Schloss et al., 2006). This relatedness indicates that the gut microbial compositions of A. cerana and A. glabripennis are highly similar, and we preliminarily speculate that this structure may be the unique composition of the gut microbiota of insects.
The relative abundance of the dominant bacteria of the A. cerana gut microbiota at the genus level varied significantly at different developmental stages. At 0 dpe, the main components were Acinetobacter and Sphingomonas. Acinetobacter is an important part of the gut microbiota of many insects and has been found in the gut microbiota of Pardosa laura, Pardosa astrigera, Nurscia albofasciata, Omphisa fuscidentalis and other insects (Liu et al., 2016; Hu et al., 2019). Acinetobacter assists the host in digesting food and converting nitrogen (Briones-Roblero et al., 2016) and is an important insect gut probiotic. However, after 1 dpe, Acinetobacter was quickly replaced by other dominant bacteria, which may be due to the gut microbiota adapting to a more complex environment, as it does 0 dpe, A. cerana had not yet come into contact with the environment. Apibacter is highly abundant in the gut of A. cerana and bumblebees; however, its abundance in the gut of A. mellifera is low (Smagghe et al., 2016; Kwong et al., 2018), and Apibacter metabolizes mainly monosaccharides and dicarboxylic acids (Kwong et al., 2018). Apibacter abundance increased significantly by 7 dpe, indicating that the host began to ingest large amounts of monosaccharides or was on the verge of metabolizing and absorbing monosaccharides. Lactobacillus, Gilliamella, Snodgrassella and Bifidobacterium compose the core microbiota of bees and occupy an important niche (Babendreier et al., 2007; Bottacini et al., 2012; Kwong and Moran, 2013). The relative abundances of Lactobacillus, Gilliamella, Snodgrassella and Bifidobacterium in the gut were low 0 dpe, and they then rapidly colonized the gut 1-7 dpe. Previous studies have shown that Lactobacillus and Bifidobacteria can promote the absorption of nutrients and activate the host immune system (Alberoni et al., 2018). Therefore, an increase in the relative abundance of both microbes may indicate rapid development of workers and changes in diet. In addition, Bifidobacterium can stimulate the production of hormones by the host, which can affect the development of bees and accelerate the development of workers (Kešnerová et al., 2017). Therefore, the rapid increase in Bifidobacterium abundance in the gut of workers may coincide with the peak of A. cerana development. Gilliamella and Bifidobacterium are involved in the degradation of complex polysaccharides (Zheng et al., 2016; Kwong et al., 2018); however, pollen, bee bread and honey contain a variety of complex polysaccharides, and colonization by these two microbes promotes the catabolism of these compounds, indirectly promoting the development of workers. Interestingly, while workers, such as nurse bees, mainly feed larvae and old bees (Seeley, 1982; Crailsheim, 1991, 1992), the feeding material depends mainly on the metabolism of pollen and polysaccharides by these microbes. Therefore, these microbes in the gut of workers may also contribute to changes in the host’s social behavior.
An interesting phenomenon in this study is that the succession of the gut microbiota of A. cerana occurs via the constant colonization of core microbiota at different developmental stages and the replacement of non-core microbiota 0 dpe. The colonization of the core microbiota is a dynamic process, but once established the composition of the microbiota is relatively stable.
Notably, although certain negative controls were needed to prevent erroneous results, we lacked these controls, and the absence of these controls may have affected the results of this study to some extent. A negative control was not included for the materials (tubes, swaps, etc.) used in this study; therefore, there is a potential risk of introducing a contaminating sequence. This study mainly focused on the changes in the main dominant microbiota in the gut of workers at different developmental stages. However, a negative control is certainly important for the study of gut microbiota, especially for improved data interpretation (Hornung et al., 2019). Therefore, in future gut microbial-related studies, multiple controls should be adopted to reduce the influence of environmental factors on the conclusions. In addition, to ensure the reliability of the experimental results, it is necessary to add some positive controls such as (1) a positive control for DNA extraction, to ensure that the DNA of the contained organisms can be sufficiently extracted with the method used, and (2) a positive control for sequencing (a pre-extracted DNA mix), to ensure that the sequencing itself did not introduce any errors (Hornung et al., 2019).
In summary, exploration of the colonization characteristics of the gut microbiota in insects is an essential step for further understanding microbiota formation in the animal gut. Here, the composition and abundance of the gut microbiota were determined and quantified comprehensively in workers, and the colonization pattern of the gut microbiota and various genera was further revealed in the comparison across different time points within 35 days after worker pupation. In particular, the colonization characteristics of the gut microbiota of workers were compared with those of other species of animals (mainly vertebrates) based on the overall tendency of microbiota colonization and genera (or species), which revealed several common and characteristic colonization rules between insects and other animals. This study not only deepens our understanding of the colonization pattern of the gut microbiota in workers but also provides useful information for exploring colonization of the gut microbiota in insects and other animals more comprehensively.
The datasets generated for this study can be found in the raw reads were deposited into the NCBI Sequence Read Archive (SRA) database (Accession Number: SRR9715685-SRR9715699 and SRR9715700-SRR9715726).
Z-XD wrote the article on data analysis. H-YL, Y-FC, and Q-HT took samples. JG designed the experiment. All authors contributed to the article and approved the submitted version.
This study was supported by the National Natural Science Foundation of China (31660695).
The authors declare that the research was conducted in the absence of any commercial or financial relationships that could be construed as a potential conflict of interest.
The Supplementary Material for this article can be found online at: https://www.frontiersin.org/articles/10.3389/fmicb.2021.513962/full#supplementary-material
Alberoni, D., Baffoni, L., Gaggìa, F., Ryan, P., Murphy, K., Ross, P. R., et al. (2018). Impact of beneficial bacteria supplementation on the gut microbiota, colony development and productivity of Apis mellifera L. Benef. Microbes 9, 269–278. doi: 10.3920/BM2017.0061
Azad, M. B., Konya, T., Guttman, D. S., Field, C. J., Sears, M. R., HayGlass, K. T., et al. (2015). Infant gut microbiota and food sensitization: associations in the first year of life. Clin. Exp. Allergy 45, 632–643. doi: 10.1111/cea.12487
Babendreier, D. J. D., Romeis, J., Bigler, F., and Widmer, F. (2007). Bacterial community structures in honeybee intestines and their response to two insecticidal proteins. FEMS Microbiol. Ecol. 59, 600–610. doi: 10.1111/j.1574-6941.2006.00249.x
Biagi, E., Franceschi, C., Rampelli, S., Severgnini, M., Ostan, R., Turroni, S., et al. (2016). Gut microbiota and extreme longevity. Curr. Biol. 26, 1480–1485. doi: 10.1016/j.cub.2016.04.016
Bottacini, F., Milani, C., Turroni, F., Sánchez, B., Foroni, E., Duranti, S., et al. (2012). Bifidobacterium asteroides PRL2011 genome analysis reveals clues for colonization of the insect gut. Plos One 7:e44229. doi: 10.1371/journal.pone.0044229
Briones-Roblero, C. I., Rodríguez-Díaz, R., Santiago-Cruz, J. A., Zúñiga, G., and Rivera-Orduña, F. N. (2016). Degradation capacities of bacteria and yeasts isolated from the gut of Dendroctonus rhizophagus (curculionidae: scolytinae). Folia Microbiol. 62, 1–9. doi: 10.1007/s12223-016-0469-4
Costa, M. C., Stämpfli, H. R., Allen-Vercoe, E., and Weese, J. S. (2016). Development of the faecal microbiota in foals. Equine Vet. J. 48, 681–688. doi: 10.1111/evj.12532
Crailsheim, K. (1992). The flow of jelly within a honeybee colony. J. Comp. Physiol. B 162, 681–689. doi: 10.1007/bf00301617
Crailsheim, K. (1991). Interadult feeding of jelly in honeybee (Apis mellifera L.) colonies. J. Comp. Physiol. B 161, 55–60. doi: 10.1007/bf00258746
Cummings, J. H. (1984). Microbial digestion of complex carbohydrates in man. P. Nutr. Soc. 43, 35–44. doi: 10.1079/pns19840025
Dong, Z. X., Li, H. Y., Chen, Y. F., Wang, F., Deng, X. Y., Lin, L. B., et al. (2020). Colonization of the gut microbiota of honey bee (Apis mellifera) workers at different developmental stages. Microbiol. Res. 231:126370. doi: 10.1016/j.micres.2019.126370
Duguma, D., Hall, M. W., Rugman-Jones, P., Stouthamer, R., Terenius, O., Neufeld, J. D., et al. (2015). Developmental succession of the microbiome of culex mosquitoes. BMC Microbiol. 15:140. doi: 10.1186/s12866-015-0475-8
Guo, J., Wu, J., Chen, Y., Evans, J. D., Dai, R., Luo, W., et al. (2015). Characterization of gut bacteria at different developmental stages of Asian honey bees, Apis cerana. J. Invertebr. Pathol. 127, 110–114. doi: 10.1016/j.jip.2015.03.010
Han, B., Sivaramakrishnan, P., Lin, C.-C. J., Neve, I. A. A., He, J. Q., Tay, L. W. R., et al. (2018). Microbial genetic composition tunes host longevity. Cell 173, 1058–1058. doi: 10.1016/j.cell.2018.04.026
Han, G., Lee, H. J., Jeong, S. E., Jeon, C. O., and Hyun, S. (2017). Comparative analysis of drosophila melanogaster gut microbiota with respect to host strain, sex, and age. Microb. Ecol. 74, 207–216. doi: 10.1007/s00248-016-0925-3
Hornung, B. V. H., Zwittink, R. D., and Kuijper, E. J. (2019). Issues and current standards of controls in microbiome research. FEMS Microbiol. Ecol. 5:fiz045. doi: 10.1093/femsec/fiz045
Hu, G., Zhang, L., Yun, Y., and Peng, Y. (2019). Taking insight into the gut microbiota of three spider species: no characteristic symbiont was found corresponding to the special feeding style of spiders. Ecol. Evol. 9, 8146–8156. doi: 10.1002/ece3.5382
Huang, S. K., Ye, K. T., Huang, W. F., Ying, B. H., Su, X., Lin, L. H., et al. (2018). Influence of feeding type and nosema ceranae infection on the gut microbiota of apis cerana workers. mSystems 3, 118–177. doi: 10.1128/mSystems.00177-18
Jeyaprakash, A., Hoy, M. A., and Allsopp, M. H. (2003). Bacterial diversity in worker adults of apis mellifera capensis and Apis mellifera scutellata (insecta: hymenoptera) assessed using 16S rRNA sequences. J. Invertebr. Pathol. 84, 96–103. doi: 10.1016/j.jip.2003.08.007
Kešnerová, L., Mars, R. A. T., Ellegaard, K. M., Troilo, M., Sauer, U., and Engel, P. (2017). Disentangling metabolic functions of bacteria in the honey bee gut. PLoS Biol. 15:e2003467. doi: 10.1371/journal.pbio.2003467
Kevan, P. G. (1999). Pollinators as bioindicators of the state of the environment: species, activity and diversity. Agr. Ecosyst. Environ. 74, 373–393. doi: 10.1016/S0167-8809(99)00044-4
Kleijn, D., Winfree, R., Bartomeus, I., Carvalheiro, L. G., Henry, M., Isaacs, R., et al. (2015). Delivery of crop pollination services is an insufficient argument for wild pollinator conservation. Nat. Commun. 6, 7414–7414. doi: 10.1038/ncomms8414
Klein, A. M., Vaissière, B. E., Cane, J. H., Steffan-Dewenter, I., Cunningham, S. A., Kremen, C., et al. (2007). Importance of pollinators in changing landscapes for world crops. Proc. Biol. Sci. 274, 303–313. doi: 10.1098/rspb.2006.3721
Kwong, W. K., and Moran, N. A. (2013). Cultivation and characterization of the gut symbionts of honey bees and bumble bees: description of Snodgrassella alvi gen. nov., sp. nov., a member of the family Neisseriaceae of the betaproteobacteria, and gilliamella apicola gen. nov., sp. nov., a membe. Int. J. Syst. Evol. Microbiol. 63, 2008–2018. doi: 10.1099/ijs.0.044875-0
Kwong, W. K., Steele, M. I., and Moran, N. A. (2018). Genome sequences of Apibacter spp., gut symbionts of asian honey bees. Genome Biol. Evol. 10, 1174–1179. doi: 10.1093/gbe/evy076
Lei, Y., Zhang, K., Guo, M., Li, G., Li, C., Li, B., et al. (2018). Exploring the spatial-temporal microbiota of compound stomachs in a pre-weaned goat model. Front. Microbiol. 9:1846. doi: 10.3389/fmicb.2018.01846
Lin, L., Xie, F., Sun, D., Liu, J., Zhu, W., and Mao, S. (2019). Ruminal microbiome-host crosstalk stimulates the development of the ruminal epithelium in a lamb model. Microbiome 7, 83–83. doi: 10.1186/s40168-019-0701-y
Liu, S., Wang, Y., Ruan, Z., Ma, K., Wu, B., Xu, Y., et al. (2016). Acinetobacter larvae sp. nov., isolated from the larval gut of omphisa fuscidentalis. Int. J. Syst. Evol. Micr. 67, 806–811.
Motta, E. V. S., Raymann, K., and Moran, N. A. (2018). Glyphosate perturbs the gut microbiota of honey bees. P. Natl. Acad. Sci. U. S. A. 115, 10305–10310. doi: 10.1073/pnas.1803880115
O’Toole, P. W., and Jeffery, I. B. (2015). Gut microbiota and aging. Science 350, 1214–1215. doi: 10.1126/science.aac8469
Pamer, E. G. (2016). Resurrecting the intestinal microbiota to combat antibiotic-resistant pathogens. Science 352, 535–538. doi: 10.1126/science.aad9382
Philipp, E., Kwong, W. K., and Moran, N. A. (2013). Frischella perrara gen. nov., sp. nov., a gammaproteobacterium isolated from the gut of the honeybee, Apis mellifera. Int. J. Syst. Evol. Microbiol. 63, 3646–3651. doi: 10.1099/ijs.0.049569-0
Pickard, J. M., Zeng, M. Y., Caruso, R., and Núñez, G. (2017). Gut microbiota: role in pathogen colonization, immune responses, and inflammatory disease. Immunol. Rev. 279, 70–89. doi: 10.1111/imr.12567
Powell, J. E., Martinson, V. G., Urban-Mead, K., and Moran, N. A. (2014). Routes of acquisition of the gut microbiota of the honey bee Apis mellifera. Appl. Environ. Microbiol. 80, 7378–7387. doi: 10.1128/AEM.01861-14
Purificación, C., Ana Elena, P. C., Claudia, V. D. P., Joaquín, B., Andrés, M., and Amparo, L. (2014). Succession of the gut microbiota in the cockroach blattella germanica. Int. Microbiol. 17, 99–109. doi: 10.2436/20.1501.01.212
Raymann, K., and Moran, N. A. (2018). The role of the gut microbiome in health and disease of adult honey bee workers. Curr. Opin. Insect Sci. 26, 97–104. doi: 10.1016/j.cois.2018.02.012
Raymann, K. S. Z., and Moran, N. A. (2017). Antibiotic exposure pertubs the gut micxrobiota and elevates mortality in honeybees. Plos Biol. 15:e2001861. doi: 10.1371/journal.pbio.2001861
Schloss, P. D., Delalibera, I. Jr., Handelsman, J., and Raffa, K. F. (2006). Bacteria associated with the guts of two wood-boring beetles: anoplophora glabripennis and saperda vestita (cerambycidae). Environ. Entomol. 35, 625–629. doi: 10.1603/0046-225X-35.3.625
Seeley, T. D. (1982). Adaptive significance of the age polyethism schedule in honeybee colonies. Behav. Ecol. Sociobiol. 11, 287–293. doi: 10.1007/bf00299306
Smagghe, G., Brandt, E., Vandamme, P., Meeus, I., Aerts, M., and Praet, J. (2016). Apibacter mensalis sp. nov.: a rare member of the bumblebee gut microbiota. Int. J. Syst. Evol. Micr. 66, 1645–1651. doi: 10.1099/ijsem.0.000921
Smith, P., Willemsen, D., Popkes, M., Metge, F., Gandiwa, E., Reichard, M., et al. (2017). Regulation of life span by the gut microbiota in the short-lived african turquoise killifish. Elife 6:e27014. doi: 10.7554/eLife.27014
Sommer, F., and Bäckhed, F. (2013). The gut microbiota — masters of host development and physiology. Nat. Rev. Mocrobiol. 11, 227–238. doi: 10.1038/nrmicro2974
Southwick, E. E., and Southwick, L. (1992). Estimating the economic value of honey bees (hymenoptera: apidae) as agricultural pollinators in the united states. J. Econ. Entomlo. 85, 621–633. doi: 10.1093/jee/85.3.621
Stephens, W. Z., Burns, A. R., Stagaman, K., Wong, S., Rawls, J. F., Guillemin, K., et al. (2016). The composition of the zebrafish intestinal microbial community varies across development. ISME J. 10, 644–654. doi: 10.1038/ismej.2015.140
Tarpy, D. R., Mattila, H. R., and Newton, I. L. G. (2015). Development of the honey bee gut microbiome throughout the queen-rearing process. Appl. Envoron. Microb. 81, 3182–3191. doi: 10.1128/aem.00307-15
Wang, Y., and Rozen, D. E. (2017). Gut microbiota colonization and transmission in the burying beetle nicrophorus vespilloides throughout development. Appl. Envoron. Microb. 83, e3216–e3250. doi: 10.1128/aem.03250-16
Wei, G., Lai, Y., Wang, G., Chen, H., Li, F., and Wang, S. (2017). Insect pathogenic fungus interacts with the gut microbiota to accelerate mosquito mortality. P. Natl. Acad. Sci. U. S. A. 114, 5994–5999. doi: 10.1073/pnas.1703546114
Wintermantel, D., Locke, B., Andersson, G. K. S., Semberg, E., Forsgren, E., Osterman, J., et al. (2018). Field-level clothianidin exposure affects bumblebees but generally not their pathogens. Nat. Commun. 9, 5446–5446. doi: 10.1038/s41467-018-07914-3
Xi, Y., Shuling, N., Kunyuan, T., Qiuyang, Z., Hewen, D., ChenCheng, G., et al. (2019). Characteristics of the intestinal flora of specific pathogen free chickens with age. Microb. Pathog. 132, 325–334. doi: 10.1016/j.micpath.2019.05.014
Xie, J., Li, S., Zhang, W., and Xia, Y. (2019). RNAi-knockdown of the locusta migratoria nuclear export factor protein results in insect mortality and alterations in gut microbiome. Pest Manag. Sci. 75, 1383–1390. doi: 10.1002/ps.5258
Yun, J. H., Roh, S. W., Whon, T. W., Jung, M. J., Kim, M. S., Park, D. S., et al. (2014). Insect gut bacterial diversity determined by environmental habitat, diet, developmental stage, and phylogeny of host. Appl. Envoron. Microb. 80, 5254–5264. doi: 10.1128/aem.01226-14
Yun, J. H., Jung, M. J., Kim, P. S., and Bae, J. W. (2018). Social status shapes the bacterial and fungal gut communities of the honey bee. Sci. Rep. 8:2019. doi: 10.1038/s41598-018-19860-7
Zhang, Z., Li, D., Refaey, M. M., Xu, W., Tang, R., and Li, L. (2018). Host age affects the development of southern catfish gut bacterial community divergent from that in the food and rearing water. Front. Microbiol. 9:495. doi: 10.3389/fmicb.2018.00495
Zheng, H., Nishida, A., Kwong, W. K., Koch, H., Engel, P., Steele, M. I., et al. (2016). Metabolism of toxic sugars by strains of the bee gut symbiont gilliamella apicola. MBio 7, e1316–e13126. doi: 10.1128/mBio.01326-16
Keywords: Apis cerana, core microbiota, colonization, relative abundance, environmental exposure
Citation: Dong Z-X, Chen Y-F, Li H-Y, Tang Q-H and Guo J (2021) The Succession of the Gut Microbiota in Insects: A Dynamic Alteration of the Gut Microbiota During the Whole Life Cycle of Honey Bees (Apis cerana). Front. Microbiol. 12:513962. doi: 10.3389/fmicb.2021.513962
Received: 22 November 2019; Accepted: 23 March 2021;
Published: 14 April 2021.
Edited by:
George Tsiamis, University of Patras, GreeceReviewed by:
Diling Chen, Guangdong Academy of Science, ChinaCopyright © 2021 Dong, Chen, Li, Tang and Guo. This is an open-access article distributed under the terms of the Creative Commons Attribution License (CC BY). The use, distribution or reproduction in other forums is permitted, provided the original author(s) and the copyright owner(s) are credited and that the original publication in this journal is cited, in accordance with accepted academic practice. No use, distribution or reproduction is permitted which does not comply with these terms.
*Correspondence: Jun Guo, guojun0591@126.com
†These authors have contributed equally to this work
Disclaimer: All claims expressed in this article are solely those of the authors and do not necessarily represent those of their affiliated organizations, or those of the publisher, the editors and the reviewers. Any product that may be evaluated in this article or claim that may be made by its manufacturer is not guaranteed or endorsed by the publisher.
Research integrity at Frontiers
Learn more about the work of our research integrity team to safeguard the quality of each article we publish.