Erratum: A 3D printed device for easy and reliable quantification of fungal chemotropic growth
 Carolin Schunke
 Stefanie Pöggeler
 Daniela Elisabeth Nordzieke
- Department of Genetics of Eukaryotic Microorganisms, Institute of Microbiology and Genetics, Georg August University Göttingen, Göttingen, Germany
Chemical gradients are surrounding living organisms in all habitats of life. Microorganisms, plants and animals have developed specific mechanisms to sense such gradients. Upon perception, chemical gradients can be categorized either as favorable, like nutrients or hormones, or as disadvantageous, resulting in a clear orientation toward the gradient and avoiding strategies, respectively. Being sessile organisms, fungi use chemical gradients for their orientation in the environment. Integration of this data enables them to successfully explore nutrient sources, identify probable plant or animal hosts, and to communicate during sexual reproduction or early colony development. We have developed a 3D printed device allowing a highly standardized, rapid and low-cost investigation of chemotropic growth processes in fungi. Since the 3D printed device is placed on a microscope slide, detailed microscopic investigations and documentation of the chemotropic process is possible. Using this device, we provide evidence that germlings derived from oval conidia of the hemibiotrophic plant pathogen Colletotrichum graminicola can sense gradients of glucose and reorient their growth toward the nutrient source. We describe in detail the method establishment, probable pitfalls, and provide the original program files for 3D printing to enable broad application of the 3D device in basic, agricultural, medical, and applied fungal science.
Introduction
Polar tip growth of long tubular hyphae is a fundamental characteristic of filamentous fungi (Momany, 2002). Since fungi are sessile organisms, they have to adapt dynamically to changes of the environment, re-evaluate the current growth direction and probably re-orient their growth. Thereby, environmental stimuli like light (phototropism), contact (thigmotropism), electrical currents (galvanotropism), and chemicals (chemotropism) can provoke a re-direction of growth (Corrochano and Cerdá-Olmedo, 1991; Brand and Gow, 2009; Turrà et al., 2016). The nature of chemical cues ranges from nutrients sources, host-derived signals to compounds governing fungal communication, such as pheromones. Sensing of these compounds can result in both positive and negative growth responses (Massee, 1905; Turrà et al., 2016). Intriguingly, fungi employ a prioritization of signals perceived, allowing them to discriminate between different options to identify the optimal path (Turrà et al., 2016). Despite the early identification of chemotropic processes in fungi and their role for interorganismic interaction during pathogenicity and symbiosis (de Bary, 1884), knowledge about signals and molecular factors involved in signal sensing and growth re-direction is still limited. In parts, this is due to a lack of easy methodical approaches to gain reproducible results. A method allowing the detailed investigation of chemotropic growth responses in substantial fungal processes such as mating, fusion of fungal germlings during early colony development, pathogenic as well as mutualistic interactions with plant and mammalian hosts would be highly valuable for the fungal research community (Brand and Gow, 2009; Takeshita, 2016).
In our lab, we work with the hemibiotrophic plant pathogen Colletotrichum graminicola (Ces.) G.W. Wils., originally provided by R. L. Nicholson, Purdue University, IN. This fungus belongs to the worldwide-distributed Colletotrichum species complex (O’Connell et al., 2012), causing anthracnose on leaves and stalks on its host Zea mays and also infects the roots of its host (Bergstrom and Nicholson, 1999; Sukno et al., 2008). Due the ability to infect several plant parts and its high epidemic spreading potential, this pathogen is estimated to cause crop losses up to 1 billion dollars/year (United States) corresponding to 40% per field (Perfect et al., 1999; Frey et al., 2011). C. graminicola generates two types of infectious asexual spores, falcate and oval shaped conidia (Nishihara, 1975; Panaccione et al., 1989), having distinct roles and following particular strategies during the infection cycle (Nordzieke et al., 2019b). As we recently reported, oval conidia develop a germling network by the formation of conidial anastomosis tubes (CATs) on maize leaves, which might contribute to their pathogenic potential (Nordzieke et al., 2019b). In contrast, falcate conidia germinate on short germ tubes on maize leaves followed by rapid development of appressoria for plant penetration (Mims and Vaillancourt, 2002). Since root infection as well as CAT formation requires chemotropic sensing of host roots or fungal germlings, respectively, we sought for an easy, low cost method allowing reliable examination of chemotropic growth responses in C. graminicola.
In the last years, microfluidic devices were used in several studies to investigate the process of pheromone gradient sensing and the formation of mating projections (shmoos) of unicellular yeast (Paliwal et al., 2007; Moore et al., 2008). In this setup, changing gradient application due to pump rearrangement makes it possible to investigate re-orientation of shmoos (Brett et al., 2012). For filamentous fungi, several microfluidic devices were developed to investigate polar growth, germination, sporulation, nutrient distribution, response upon fungivore attack, and circadian rhythms. They also serve as a platform for high-throughput screening for secreted enzyme activities (Lee et al., 2013; Geng et al., 2015; Marshall et al., 2017; Schmieder et al., 2019). However, these approaches fail to depict growth re-orientation processes. To cope with this methodical gap, Turrà et al. (2015) developed a method termed “chemotropic assay” to investigate growth re-orientation processes of Fusarium oxysporum f. sp. Lycopersici germlings, a pathogen of tomato roots (Turrà et al., 2015). In contrast to most microfluidic devices, this method is based on slow gradient establishment in water agar. When the signal gradient reaches the fungus, most of the embedded F. oxysporum conidia have germinated and established a general growth direction. Sensing of the gradient signal results in a re-direction of their polar axis. The re-orientation of the germ tube tip can be determined by microscopic investigations of the projection angle in analogy to investigations in yeast (Brett et al., 2012; Turrà et al., 2015). However, to learn the handling of the method is rather time consuming and several drawbacks hinder the employment. First, exact parallel wells for signal application have to be drawn by hand to enable uniform gradient formation. Further, fixing of the reaction chamber, a dish, under a common microscope is difficult and hinders the readout procedure. Third, since dishes are not adapted for microscopic approaches, the investigation of fluorescent-labeled proteins during the chemotropic process is not possible.
We describe here the design of a 3D printed device consisting of a frame and combs fitting on custom microscope slides, overcoming most of the drawbacks present in the original chemotropic assay. For the validation process, we use oval conidia of the plant pathogen C. graminicola. We provide evidence that germlings derived from these conidia are able to re-direct their growth to gradients of 50 mM glucose in a timeframe of 6 h using the original method of Turrà et al. (2015) as a control. Together, the here presented method allows easy and low-cost elucidation of fungal chemotropic mechanisms and can push forward research in basic and applied science.
Materials and Equipment
Implementation of the 3D Printed Device
- Device design: Inventor 2019 (Autodesk, Mill Valley, CA, United States)
- Ultimaker 3 printer (FDM) equipped with the Cura software (Ultimaker, Geldermalsen, Netherlands)
- Material for printing: acrylonitrile butadiene styrene polymer
Fungal Culture
- Complete medium sucrose (CMS): glucose 10 g/L, yeast extract 1 g/L, peptone 1 g/L, solution A [Ca(NO3)2 100 g/L] 10 ml/L, solution B (KH2PO4 20 g/L, MgSO4 25 g/L, NaCl 5.4 g/L) 100 ml/L, sucrose 171.15 g/L
- 250 ml Erlenmeyer not baffled flasks with cotton plugs, sterile
- Minitron incubator (INFORS HAT, Bottmingen, Germany)
- Plastic funnel
- Miracloth (EMD Millipore Corp., Billerica, MA, United States)
- Centrifuge 5810 R (Eppendorf AG, Hamburg, Germany); tubes 50 ml
- Falcate conidia of Colletotrichum graminicola (Ces.) G.W. Wilson (teleomorph Glomerella graminicola D. J. Politis)
- Hemacytometer acc. to Neubauer Improved
Chemotropic Growth Assay
- Melted basic agar (Agarose (1% w/v), Serva Agar (1% w/v) in water)
- Melted top agar (Agarose (0.25% w/v), Serva Agar (0.25% w/v) in water)
- Microscope slides, cover slips
- 3D printed device
- Blue pen, set square
- Oval conidia of C. graminicola wildtype, c = 5∗105/ml in water
Methods
Directed growth to chemical gradients is fundamental to fungal lifestyle. However, current approaches to study the corresponding processes are limited or error prone. We have developed an assay to allow easy and standardized investigation of chemotropic responses using a new-engineered 3D printed device.
Establishment
3D Printed Device
The basis for the development of the 3D printed device was the chemotropic assay for the analysis of directed growth responses of F. oxysporum published previously (Turrà et al., 2015). Due to the usage of a dish as reaction chamber in this assay, several error sources may influence the reliability of the obtained results (Figure 1A). The aim of the new device is to simplify the methodical setup and readout procedure. In short, the 3D printed frame is designed to fit on a microscope slide, which can be directly used for the quantification of fungal growth by microscopy. To allow constant signal gradient formation, we also designed combs by 3D printing. These fit in specific slots in the 3D printed frame, allowing the generation of wells in a distance of 10 mm to each other (Figure 1B and Supplementary File 1). In both methods, the strict vertical evaluation line is drawn by hand centering the two wells, serving as optical line for the examination of chemotropic growth. We have equipped the bottom side of the 3D printed device with two notches in the center between the wells to ensure exact positioning of this optical line (Table 1). In principal, water agar volumes from 1.5 to 4 ml fit into the 3D printed device, which allow for different volumes of signal application. Here, we are using 2.5 ml of water agar and 40 μl of chemoattractant as standard volumes.
FIGURE 1
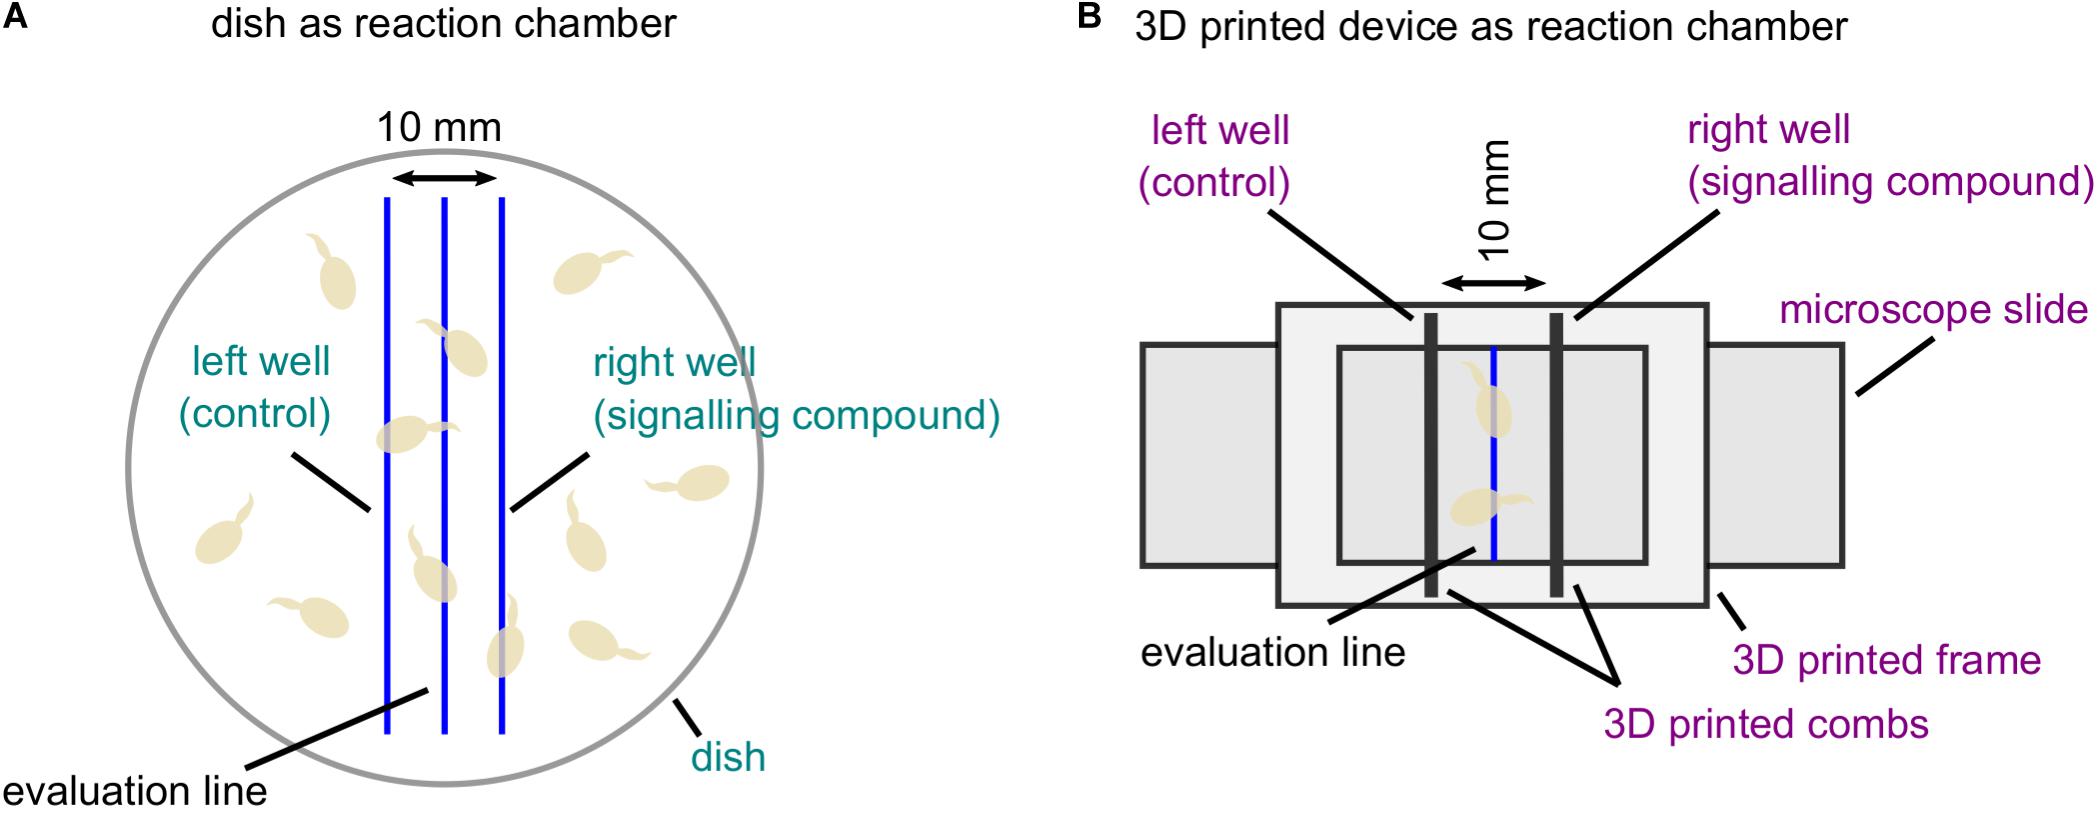
Figure 1. Comparison of two different reaction chambers for the analysis of directed fungal growth. (A) Classical setup of the chemotropic assay based on a dish as reaction chamber (Turrà et al., 2015). A dish is filled with water agar mixed with fungal conidia (light brown). Along hand-drawn parallel lines, two wells are cut serving the application of the signaling compound and the solvent control. Along the evaluation line, the orientation of germ tube tips is evaluated. Error-prone methodical parts are indicated in turquoise. (B) Chemotropic assay using the new 3D printed device consisting of a frame and two combs. The 3D printed frame is fixed on a microscope slide coated with water agar providing a hand-drawn evaluation line. Two 3D printed combs are placed in provided slots with a distance of 10 mm to create reproducible wells. Fungal conidia (light brown) are applied on water agar topping the evaluation line. Improvements of the methodical setup are marked in violet.
TABLE 1
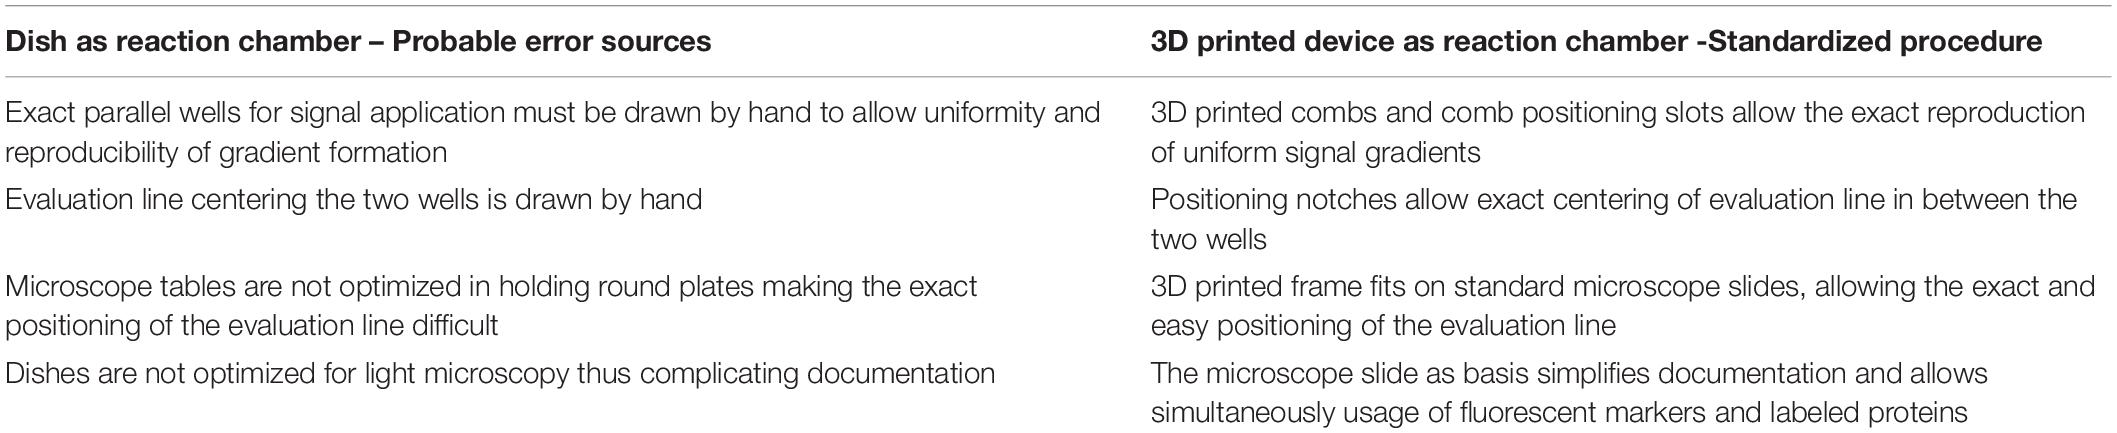
Table 1. Improvement of the chemotropic assay by the newly designed 3D printed device.
Choice of Chemoattractant Signal
Directed growth toward chemical stimuli is fundamental to filamentous fungi. However, the nature of signals provoking directed growth responses differs between fungal species due to their distinct lifestyles (Massee, 1905). It is reasonable that besides these species-specific signals, a set of “common” molecules exists with the general ability to attract filamentous fungi. One of the oldest known chemoattractant molecules is glucose, described as being able to attract fungi like F. oxysporum and Botrytis vulgaris (Miyoshi, 1894; Fulton, 1906; Turrà et al., 2015). For F. oxysporum it was reported that 1% of glucose (55.6 mM) has a high chemoattracting potential (Turrà et al., 2015). Anticipating that C. graminicola might be able to sense similar concentrations, we used 50 mM of glucose as chemoattractant throughout this study.
Fungal Growth Conditions
C. graminicola generates two distinct asexual spores, falcate and oval conidia, differing in morphology, germination behavior, and maize infection strategies (Panaccione et al., 1989; Nordzieke et al., 2019b). Since C. graminicola oval conidia are morphologically similar to microconidia of F. oxysporum used in former studies (Turrà et al., 2015; Nordzieke et al., 2019a; Vitale et al., 2019), we adapted fungal-specific conditions for oval conidia and optimized incubation time, water agar composition and spore concentration alike as the spore application procedure. Here, we obtained best results applying 40 μl of oval conidia (c = 5∗105/ml) on water agar (0.25% (w/v) agarose mixed with 0.25% (w/v) agar (Serva)) layered on the evaluation line instead of spreading the spores into the water agar (Figure 1B). After 6 h of incubation, we determined a chemotropic response of 16.7% (± = 2.7%) for C. graminicola oval conidia to a gradient of 50 mM glucose (Figure 2A). For C. graminicola, we recommend not to extend the incubation time to more than 8 h.
FIGURE 2
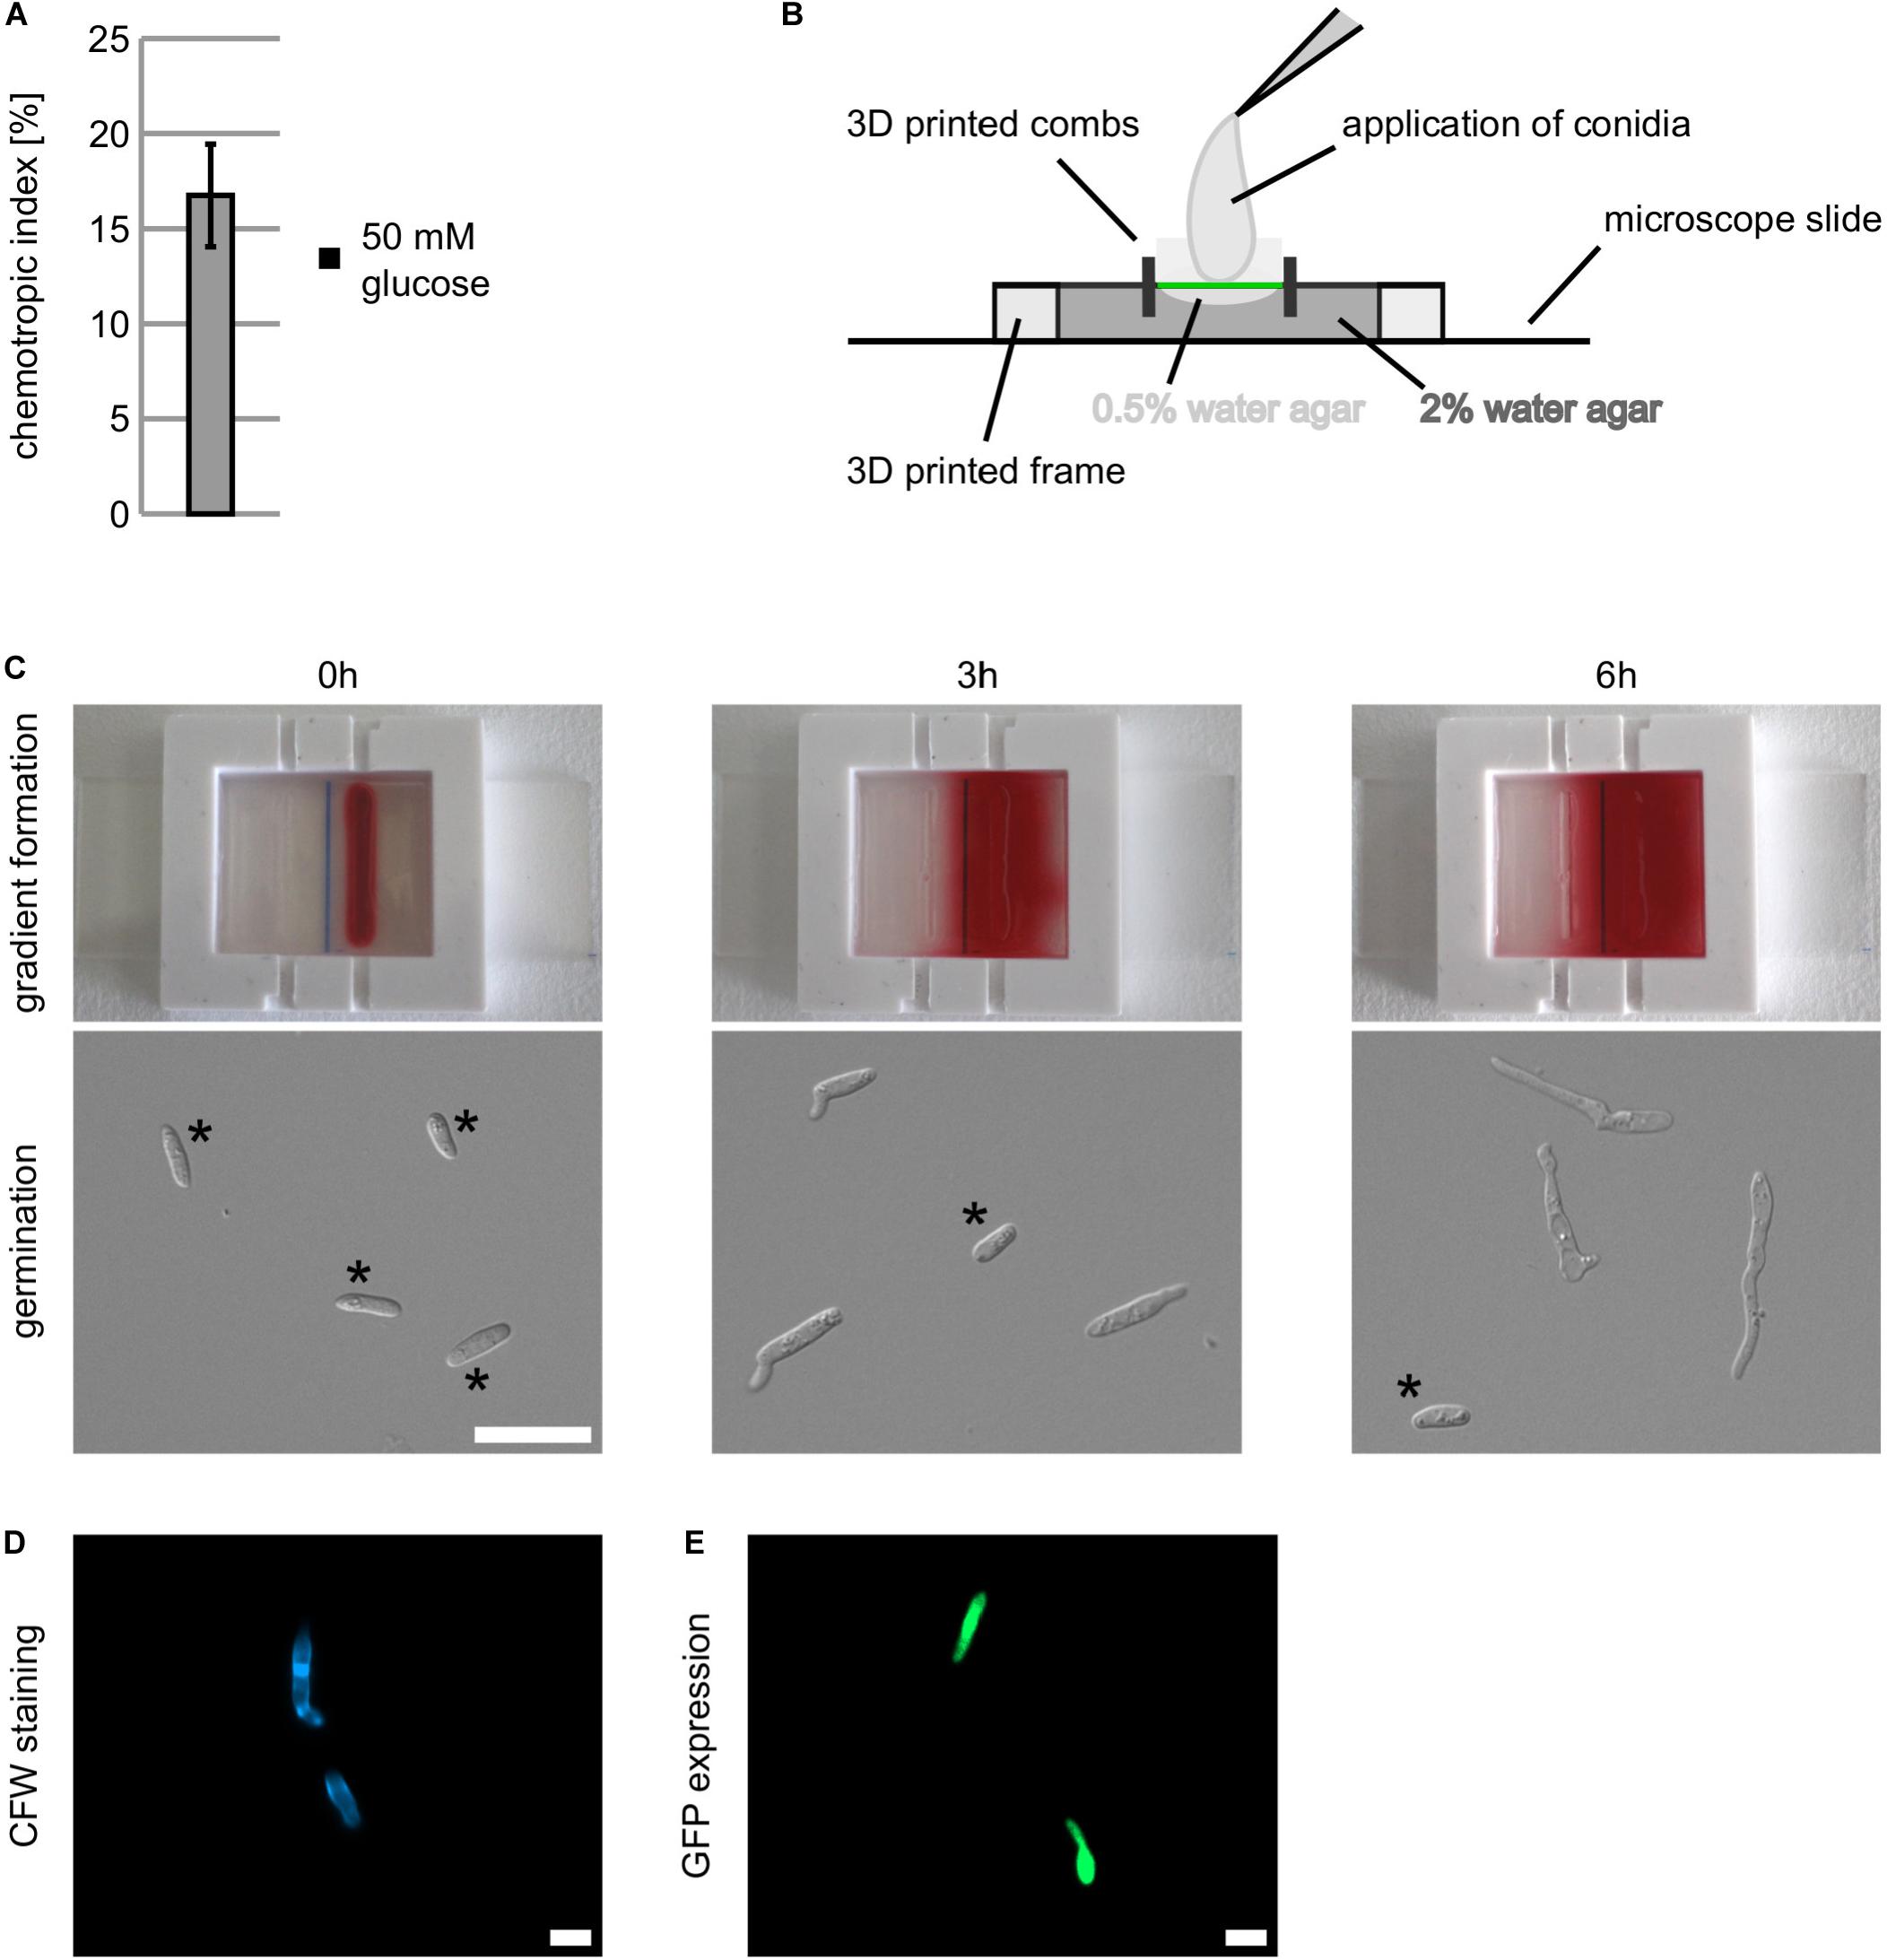
Figure 2. Establishment of an operation mode to measure chemotropic growth responses using the new generated 3D printed device. (A) Chemotropic growth of C. graminicola oval conidia to a gradient of 50 mM of glucose quantified with the chemotropic plate assay, error bars represent SD calculated from n = 5 experiments as indicated. (B) Arrangement of 3D printed frame and 3D printed combs on an microscopic slide. 2% of water agar [1% (w/v) agarose, 1% (w/v) agar (Serva)] is fixing the device on the microscope slide (dark gray). Due to surface tension, a concave surface forms in between the created wells. To even the surface (green line), 0.5% of water agar [0.25% (w/v) agarose, 0.25% (w/v) agar (Serva)] are applied (light gray). (C) Depiction of gradient buildup over time by spread of Ponceau stain and respective germination of C. graminicola oval conidia. Conidia not germinated are indicated*. (D,E) Visualization of C. graminicola germlings stained with 1:1 diluted calcofluor white (CFW, D) and expressing cytosolic GFP (E) after incubation in the 3D printed device for 6 h, size bar = 10 μm.
Assembling and Gradient Formation
In a first step, we had to identify the best matrix for fungal growth and gradient establishment. We put the 3D printed frame on a microscope slide and inserted the combs in the designated positions to create wells for the application of the chemoattractant signal. Then we filled 2.5 ml of 2% water agar [1% (w/v) agarose 1% (w/v) agar (Serva)] inside the device to fix it to the microscopic slide (Figure 2B). After solidification, we observed that the surface of the agar between the combs was concave, hampering the application of a cover glass for microscopy (Figure 2B, dark gray). To provide an even surface, we filled 0.5% water agar [0.25% (w/v) agarose mixed with 0.25% (w/v) agar (Serva)] upon the solidified water agar in between the combs, resulting in an even surface for the application of oval conidia and a cover glass (Figure 2B, light gray). After removal of the combs, we applied 40 μl of an aqueous Ponceau red solution in the right well and monitored time-dependent gradient formation (Figure 2C and Supplementary File1). After 6 h, a robust and uniform gradient is established, matching optimal time for germination of C. graminicola oval conidia on water agar (Figure 2C). To investigate chemotropic growth in greater depth, our experimental setup allows the visualization of specific cellular structures by fluorescence microscopy. As examples, we show germlings either stained with an aqueous 1:1 calcofluor white (CFW) solution (Figure 2D) or expressing a green fluorescence protein (GFP; Weihmann et al., 2016; Figure 2E).
Evaluation of Directed Growth Patterns
For the evaluation whether or not a germ tube tip directs to an applied chemoattractant, the hyphal tip projection angle is used along an imaginary vertical line (Figure 3A). However, besides clearly attracted or repelled germ tube tips, the possibility exists that a germling shows bi-directional growth or that a conidium is not germinated during the incubation time. Since in both latter cases no clear growth direction can be determined, these are not included into our evaluation (Figure 3B).
FIGURE 3
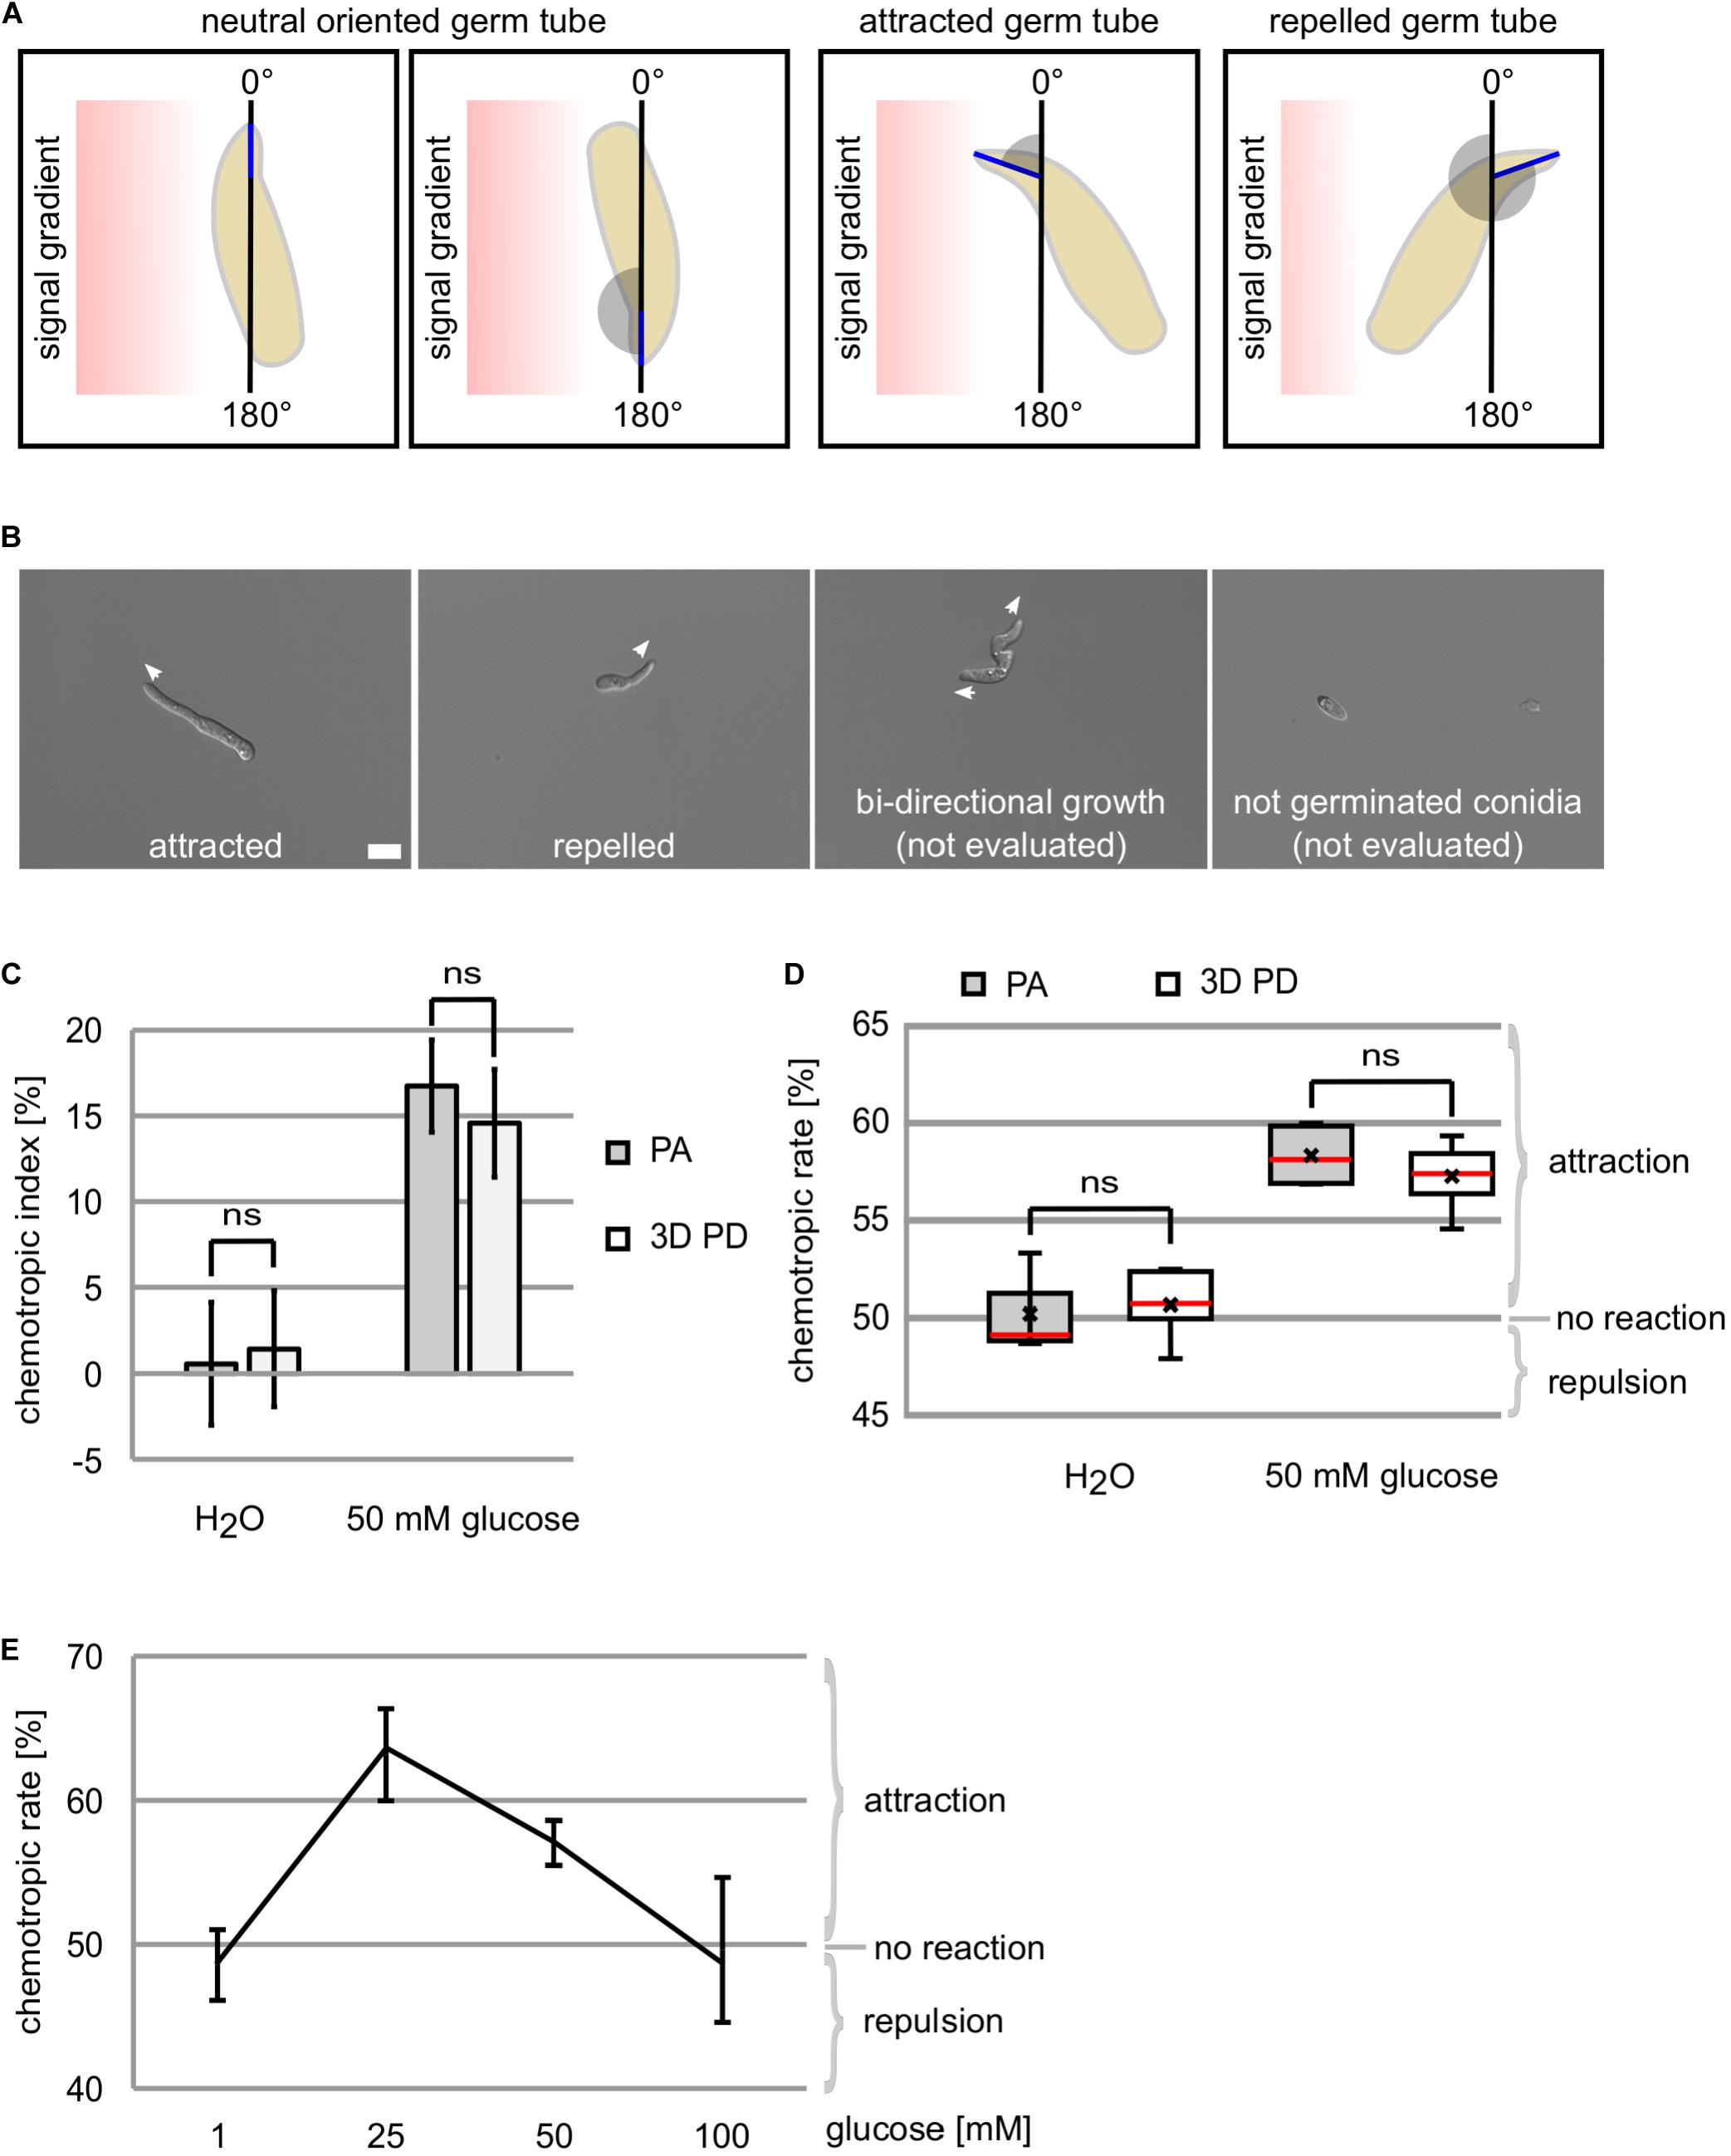
Figure 3. Chemotropic growth of C. graminicola oval conidia. (A) Determination of the hyphal tip projection angle (blue) allows the evaluation of germ tube growth directions as attracted (1°–179°), repelled (181°–359°), or neutral (0°/360° and 180°). (B) Evaluation of germ tube growth direction to a gradient of 50 mM glucose after incubation for 6 h, size bar = 10 μm. (C–E) Growth re-direction of germlings derived from C. gramincola oval conidia to glucose gradients is quantified using the original plate assay (PA) and the new developed 3D printed device (3D PD) after 6h of incubation at 23°C, n ≥ 4, ns = not significant (p > 0.05). (C) Depiction of results as deviation from the expected attraction potential of the negative control (water), termed chemotropic index. For each replicate, a minimum of 70 germlings were evaluated. (D) Data are provided as chemotropic rate, giving the ratio of attracted to total germlings. For each replicate, a minimum of 40 germlings were evaluated. Meridian is indicated in red, average by x. (E) Dose-response curve of germlings to glucose concentrations as indicated quantified using the 3D printed device. For each replicate, a minimum of 40 germlings were evaluated.
When the growth direction of all germ tube tips is examined, there are three possible outcomes how the total of germlings react to the chemoattractant applied:
- Equal distribution between fungal tips growing to the chemoattractant signal and the negative control (positive: negative/50%: 50%). This distribution is expected when the tested compound has not the ability to change the growth direction of the fungus.
- More fungal tube tips are pointing toward the chemoattractant signal compared to the control (positive: negative/ > 50%: <50%). This result corresponds with an attracting potential of the tested compound.
- Less fungal tube tips are pointing toward the chemoattractant signal compared to the control (positive: negative/ < 50%: > 50%). This result corresponds with a repelling potential of the tested compound.
So far, the quantified chemotropic growth response is depicted using the chemotropic index. This index bases on the deviation of the obtained results from the equal distribution as the expected situation (Turrà et al., 2015):
As an alternative, we propose to display the quantified chemotropic growth as box plot giving the direct rates from attracted and repelled hyphal tips:
In Figures 3C,D, the representation of the chemotropic index and the chemotropic rate are compared to each other.
Probable Pitfalls
For the original assay alike as the here described one it is vital to take into account the optical path of the used microscope to allow correct classification of germlings as “attracted” or “repelled.” We recommend a maximum imaging time of 20 min per experiment.
Stepwise Procedures
Printing of 3D Device
3D printed frame and combs are designed using the Autodesk Inventor 2019 software. After export to.stl files (Supplementary Files 2, 3), both files are imported in the “Ultimaker Cura” program. Printing of an acrylonitrile butadiene styrene polymer was conducted with a “Ultimaker3” 3D printer using the FDM technology for layer-by-layer printing. General settings of the 3D printer are given in Table 2.
TABLE 2

Table 2. Settings of 3D printer.
Preparation of the C. graminicola Inoculum
For the generation of C. graminicola oval conidia, 300 ml glass flasks are filled with 100 ml of complex medium with saccharose (CMS) and inoculated with 50 μl of falcate conidia obtained from a fresh plate culture [oat meal agar (OMA), 14–21 days] or a deep frozen glycerol stock (final concentration 50% glycerol) (Leach et al., 1982; Werner et al., 2007). Cultures are incubated at 23°C for 2 days in shaking conditions (80 rpm) followed by 5 days static incubation in the dark. After a total of 7 days, mycelia and liquid phase are separated by miracloth filtration. After two rounds of centrifugation (10 min, 7,000 rpm) and washing of the pellet with distilled water, oval conidia are quantified using a Neubauer counting chamber (Nordzieke et al., 2019b). Finally, spore concentration is adapted to c = 5∗105/ml in distilled water.
Preparation of Chemotropic Assay
All following steps are performed at a clean bench. First, a blue vertical evaluation line is drawn on a microscope slide and its position adjusted with the help of the notches. Then the 3D printed frame is fixed on the slide with 2.5 ml 2% of water agar [1% (w/v) agarose 1% (w/v) agar (Serva)], allowing the application of 40 μl of chemoattractant chemical. The middle area framed by the 3D printed combs is repeatedly filled with 100 μl of 0.5% of water agar [0.25% (w/v) agarose mixed with 0.25% (w/v) agar (Serva)] until an even surface is created. After removal of the combs, 20 μl of conidial suspension (c = 5∗105/ml) is equally applied on the evaluation line and dried for 2–5 min under the laminar flow. 40 μl of the chemoattractant compound (50 mM glucose) and the corresponding solvent control (water) are applied in the right and left well, respectively. The microscope slide is now placed into a square dish and incubated for 6 h at 23°C (Supplementary File 1). After incubation time, the 3D printed frame is removed, leaving the agar block with the germlings and the signal gradient on the glass slide. A cover slip is placed on top of the middle area and the slide is fixed on an upright microscope table. Using 10x magnification, the evaluation line is centered. Along this line, microscopic pictures of growing germlings are taken with the 40x objective (DIC).
Quantification of Directed Growth Events
By means of the microscopic pictures taken, the hyphal tip projection angle is determined in analogy to the yeast system along a virtual vertical line as 0° reference (Brett et al., 2012; Figure 3A). Evaluation of the angle allows to sort the germ tubes into the three categories: (1) attracted (1°–179°), 2) repelled (181°–359°), and (3) neutral (180° or 0°/360°) (Figure 3A). A minimum of 40 germlings are analyzed for each experiment. Neutral positioned germ tube tips are not included in the evaluation. When a germling grows with two germination tubes, directional growth is only recorded when both tips are sorted into the same category. Based on the obtained numbers, the chemotropic index or the chemotropic rate are calculated.
Results
Oval Conidia of C. graminicola Redirect Their Growth to Glucose Gradients
In this study, we aimed to develop an improved method for the analysis of chemotropic growth responses enabling the study of different chemotropic responses in C. graminicola. In a first step, we tested if germlings derived from oval conidia of this fungus are able to sense glucose gradients. Using the published method from Turrà et al. (2015) and the method we describe here, we provide evidence that C. graminicola germlings adapt growth direction in a time corridor of 6 h to 50 mM glucose giving a chemotropic index of 16.7% (± 2.7%) and 14.6% (± 3.2%), respectively (Figures 2A, 3). In control experiments using water as neutral compound, no directed growth was detectable (Figure 3). The results obtained by the application of the different methods are statistically not different (p > 0.05) showing that the 3D printed device can be used as alternative to the dish-based assay (Figure 3). To elucidate whether other concentrations of glucose are able to provoke chemotropic re-direction in C. graminicola germlings, we used the 3D printed device to test 1, 25 mM as well as 100 mM of glucose as chemoattractants. Consistent with previous observations of fungal chemoattraction (Segall, 1993; Turrà et al., 2015), we obtained a dose response curve in which 25 mM and 50 mM of glucose result in strong chemoattraction, whereas 1 and 100 mM did not provoke redirection of growth (Figure 3E).
Discussion
In the last years, several microfluidic devices were designed for the small-scale investigation of growth responses of bacteria, tumor cell lines, yeast but also multicellular organisms by the application of fluids, which overflow the biological material (Moore et al., 2008; Brett et al., 2012; Choi et al., 2012; Yanagisawa and Higashiyama, 2018). Unicellular organisms can be investigated quite easily with these systems: Liquid chemical gradients are established and can be changed by the utilization of pumps applying solutions from source to sink. The position of single cells can be tracked by fluorescence labeling, allowing retracing the movement reaction in detail (Wheeler et al., 2003; Choi et al., 2012; Sai et al., 2016). This is especially interesting for the investigation of tumor migration, since here even the invasion of tissue by single tumor cells can be monitored by applying different fluorescence markers for each cell type (Sai et al., 2016). In yeast, microfluidic devices are used to monitor growth responses of mating projections (Brett et al., 2012). By the application of yeast strains expressing fluorescence-labeled proteins, even the screening for proteins involved in the chemotropic growth of smooths was reported (Yuan et al., 2016). However, the application of a stable gradient throughout the experiment is insufficient to identify cells deficient in shmoo growth adaptation. Coping with this problem, Brett et al. (2012) designed a microfluidic device allowing the dynamic change of applied pheromone gradients. As a result, re-direction of shmoo cells can be visualized (Brett et al., 2012). An example for multicellular tissue reorienting to chemical signals, are pollen tubes. These have to reach the plant ovary to apply the non-motile sperms for the fertilization process (Higashiyama and Yang, 2017). Recently, a microfluidic device was designed to investigate this process. In contrast to the other approaches discussed, the signaling gradient is not established by liquids, but by the application of a dissected ovary in a chamber separated by the pollen tubes. Cells, which aim to reach the ovary, have to grow toward a solid matrix of agar and fulfill two directional changes. Due to this dual direction change, the number of false results is minimized (Yanagisawa and Higashiyama, 2018). Similar as described for pollen tubes, fungi are prone to grow toward gradients established in solid matrices by polar elongation. However, fungi are not focused on a special signaling gradient as pollen tubes but are able to sense various chemical compounds and therefore an adequate method has to enable the application of different chemicals (Gooday, 1975; Jansson et al., 1988; Turrà et al., 2016). In contrast to pollen tubes, fungal cells are also constantly interacting with each other, resulting in the formation of cellular fusions of hyphae, germlings and conidia (Fleissner and Herzog, 2016). Consequently, cross signaling has to be avoided by a strictly controlled cell number and density to exclude mixing of growth response outputs throughout the experiment (Moore et al., 2008). An optimal stadium to allow such controlled conditions is the early growth stage of fungi consisting of spores and germlings (Turrà et al., 2015). The here developed method combines advantages of approaches previously reported. Similar to the chemotropic assay established by Turrà et al. (2015), solution of chemicals can be applied reaching the fungal germlings after a precise time of incubation. Further, the 3D printed device allows a standardization of the process that is comparable to a microfluidic device. The here presented method permits further the investigation of fluorescent-labeled proteins during chemotropic growth responses, enabling the usage of marker proteins and localization studies during fungal growth redirection.
C. graminicola is an ascomycetous fungus infecting several plant parts of its host Zea mays, including leaves and roots, but can also live on dead organic matter (Bergstrom and Nicholson, 1999; Sukno et al., 2008). Despite the formation of CATs during early colony development, C. graminicola needs to re-direct growth for successful plant infection for example during penetration peg emergence and, presumably, for root infection. For the first time our study provides evidence that germlings derived from oval conidia C. graminicola are able to sense applied glucose concentrations of 25 mM and 50 mM and to adapt their polar axis toward the signal (Figure 2A). Intriguingly, in the bell-shaped dose response curve low and high glucose concentrations do not provoke growth re-direction (Figure 3E). This is in line with previous reports from yeast and F. oxysporum about chemotropic growth to distinct pheromone and glucose concentrations, respectively (Segall, 1993; Turrà et al., 2015). Somewhat counterintuitive, the bell-shaped curve reveals the difference between a chemotropic response to glucose and a mere influence of the nutrient on general growth patterns. In the latter case, we would expect faster growth with augmenting glucose concentrations applied. For fungi, several receptors for the sensing of extracellular nutrients have been reported (Xue et al., 2008). The 7 transmembrane G-protein coupled receptor (GPCR) Gpr1 of S. cerevisiae requires about 20–30 mM of glucose for its half-maximal activation (EC50) (Versele et al., 2001). However, it is difficult to speculate if a homolog protein might be involved in chemotropic glucose sensing in C. graminicola. As often, the investigation of Gpr1 homologs in filamentous fungi did not reveal a homolog function in glucose sensing as reported for yeast (Miwa et al., 2004; Maidan et al., 2005). In Neurospora crassa and Schizosaccharomyces pombe two distinct GPCRs were identified as probable glucose sensing receptors, but both are not homologous to Gpr1 (Welton and Hoffman, 2000; Li and Borkovich, 2006). In F. oxysporum, the FMK1 MAPK module homologous to the S. cerevisiae pheromone pathway as well as the transcription factor STE12 were shown to be involved in sensing of glucose gradients (Turrà et al., 2015). Whether these factors play also a role for chemotropic glucose sensing and which other compounds might induce growth re-direction in C. graminicola has to be elucidated in further studies.
Conclusion
In summary, the here presented chemotropic assay for the investigation of directed growth of filamentous fungi based on a 3D printed device advances the methods reported earlier. By using glass slides, it allows easy positioning under a standard upright microscope and enables the investigation of dynamic protein localization during chemotropic processes using fluorescence microscopy. The 3D printed combs further enable uniform signal gradient formation throughout different experiments, increasing the reproducibility of the assay. Due to these characteristics, the 3D printed device is ideally suited for the investigation of chemotropic growth responses like germling fusion in early colony development, host-pathogen and symbiotic interactions in the fungal community. Regarding pathogenic interactions, this method can further be applied for the identification of inhibitors of such and might help to improve food safety strategies and contribute to human health.
Data Availability Statement
The raw data supporting the conclusions of this article will be made available by the authors, without undue reservation, to any qualified researcher.
Author Contributions
CS performed experiments described in the manuscript, analyzed the data, and revised the manuscript. SP contributed to the experimental design and revised the manuscript. DN designed the study, contributed to experimental design, performed experiments described in the manuscript, analyzed the data, and wrote the manuscript. All authors contributed to the article and approved the submitted version.
Funding
This work was funded by the Deutsche Forschungsgemeinschaft (Bonn-Bad Godesberg, projects Nos. 1230/2-1 and 1230/3-1). We acknowledge support by the Open Access Publication Funds of the Göttingen University.
Conflict of Interest
The authors declare that the research was conducted in the absence of any commercial or financial relationships that could be construed as a potential conflict of interest.
Acknowledgments
We are grateful to Gertrud Stahlhut for excellent technical assistance. The 3D printed device was developed together with Dennis Stromburg of the mechanical workshop at the Institute of Microbiology and Genetics (Georg-August University Göttingen, Germany). The supplementary video about experiment assembly was recorded with the help of Anina Rudolph and Gabriele Beyer.
Supplementary Material
The Supplementary Material for this article can be found online at: https://www.frontiersin.org/articles/10.3389/fmicb.2020.584525/full#supplementary-material
References
Bergstrom, G. C., and Nicholson, R. L. (1999). The biology of corn anthracnose: knowledge to exploit for improved management. Plant Dis. 83, 596–608. doi: 10.1094/PDIS.1999.83.7.596
Brand, A., and Gow, N. A. (2009). Mechanisms of hypha orientation of fungi. Curr. Opin. Microbiol. 12, 350–357. doi: 10.1016/j.mib.2009.05.007
Brett, M. E., DeFlorio, R., Stone, D. E., and Eddington, D. T. (2012). A microfluidic device that forms and redirects pheromone gradients to study chemotropism in yeast. Lab. Chip 12, 3127–3134. doi: 10.1039/c2lc40398f
Choi, E., Chang, H. K., Lim, C. Y., Kim, T., and Park, J. (2012). Concentration gradient generation of multiple chemicals using spatially controlled self-assembly of particles in microchannels. Lab. Chip 12, 3968–3975. doi: 10.1039/c2lc40450h
Corrochano, L. M., and Cerdá-Olmedo, E. (1991). Photomorphogenesis in Phycomyces and in other fungi. Photochem. Photobiol. 54, 319–327. doi: 10.1111/j.1751-1097.1991.tb02023.x
de Bary, A. (1884). Vergleichende Morphologie und Biologie der Pilze, Mycetozoen und Bacterien. Leipzig: Wilhelm Engelmann.
Fleissner, A., and Herzog, S. (2016). Signal exchange and integration during self-fusion in filamentous fungi. Semin. Cell. Dev. Biol. 57, 76–83. doi: 10.1016/j.semcdb.2016.03.016
Frey, T., Weldekidan, T., Colbert, T., Wolters, P., and Hawk, J. (2011). Fitness evaluation of Rcg1, a locus that confers resistance to Colletotrichum graminicola (Ces.) GW Wils. using near-isogenic maize hybrids. Crop. Sci. 51, 1551–1563. doi: 10.2135/cropsci2010.10.0613
Geng, T., Bredeweg, E. L., Szymanski, C. J., Liu, B., Baker, S. E., Orr, G., et al. (2015). Compartmentalized microchannel array for high-throughput analysis of single cell polarized growth and dynamics. Sci. Rep. 5:16111. doi: 10.1038/srep16111
Gooday, G. (1975). “Chemotaxis and chemotropism in fungi and algae,” in Primitive Sensory and Communication Systems, ed. M. J. Charlile (London: Academic Press), 155–204.
Higashiyama, T., and Yang, W. C. (2017). Gametophytic pollen tube guidance: attractant peptides, gametic controls, and receptors. Plant Physiol. 173, 112–121. doi: 10.1104/pp.16.01571
Jansson, H.-B., Johansson, T., Nordbring-Hertz, B., Tunlid, A., and Odham, G. (1988). Chemotropic growth of germ-tubes of Cochliobolus sativus to barley roots or root exudates. Trans. Br. Mycol. Soc. 90, 647–650. doi: 10.1016/s0007-1536(88)80072-x
Leach, J., Lang, B., and Yoder, O. (1982). Methods for selection of mutants and in vitro culture of Cochliobolus heterostrophus. Microbiology 128, 1719–1729. doi: 10.1099/00221287-128-8-1719
Lee, K. K., Ahn, C. H., and Hong, C. I. (2013). Circadian rhythms in Neurospora crassa on a polydimethylsiloxane microfluidic device for real-time gas perturbations. Biomicrofluidics 7:44129. doi: 10.1063/1.4819478
Li, L., and Borkovich, K. A. (2006). GPR-4 is a predicted G-protein-coupled receptor required for carbon source-dependent asexual growth and development in Neurospora crassa. Eukaryot. Cell 5, 1287–1300. doi: 10.1128/EC.00109-06
Maidan, M., Thevelein, J., and Van Dijck, P. (2005). Carbon source induced yeast-to-hypha transition in Candida albicans is dependent on the presence of amino acids and on the G-protein-coupled receptor Gpr1. Biochem. Soc. Trans. 33, 291–293. doi: 10.1042/bst0330291
Marshall, J., Qiao, X., Baumbach, J., Xie, J., Dong, L., and Bhattacharyya, M. K. (2017). Microfluidic device enabled quantitative time-lapse microscopic-photography for phenotyping vegetative and reproductive phases in Fusarium virguliforme, which is pathogenic to soybean. Sci. Rep. 7:44365. doi: 10.1038/srep44365
Mims, C. W., and Vaillancourt, L. J. (2002). Ultrastructural characterization of infection and colonization of maize leaves by Colletotrichum graminicola, and by a C. graminicola pathogenicity mutant. Phytopathology 92, 803–812. doi: 10.1094/PHYTO.2002.92.7.803
Miwa, T., Takagi, Y., Shinozaki, M., Yun, C.-W., Schell, W. A., Perfect, J. R., et al. (2004). Gpr1, a putative G-protein-coupled receptor, regulates morphogenesis and hypha formation in the pathogenic fungus Candida albicans. Eukaryot. Cell 3, 919–931. doi: 10.1128/EC.3.4.919-931.2004
Momany, M. (2002). Polarity in filamentous fungi: establishment, maintenance and new axes. Curr. Opin. Microbiol. 5, 580–585. doi: 10.1016/s1369-5274(02)00368-5
Moore, T. I., Chou, C. S., Nie, Q., Jeon, N. L., and Yi, T. M. (2008). Robust spatial sensing of mating pheromone gradients by yeast cells. PLoS One 3:e3865. doi: 10.1371/journal.pone.0003865
Nishihara, N. (1975). Two types of conidia of Colletotrichum graminicola (Ces.) GW Wils. formed on artificial media, and their pathogenicity. Ann. Phytopath. Soc. Jpn. 41, 171–175.
Nordzieke, D. E., Fernandes, T. R., El Ghalid, M., Turrà, D., and Di Pietro, A. (2019a). NADPH oxidase regulates chemotropic growth of the fungal pathogen Fusarium oxysporum towards the host plant. New Phytol. 224, 1600–1612. doi: 10.1111/nph.16085
Nordzieke, D. E., Sanken, A., Antelo, L., Raschke, A., Deising, H. B., and Pöggeler, S. (2019b). Specialized infection strategies of falcate and oval conidia of Colletotrichum graminicola. Fungal Genet. Biol. 133:103276. doi: 10.1016/j.fgb.2019.103276
O’Connell, R. J., Thon, M. R., Hacquard, S., Amyotte, S. G., Kleemann, J., Torres, M. F., et al. (2012). Lifestyle transitions in plant pathogenic Colletotrichum fungi deciphered by genome and transcriptome analyses. Nat. Genet. 44, 1060–1065. doi: 10.1038/ng.2372
Paliwal, S., Iglesias, P. A., Campbell, K., Hilioti, Z., Groisman, A., and Levchenko, A. (2007). MAPK-mediated bimodal gene expression and adaptive gradient sensing in yeast. Nature 446, 46–51. doi: 10.1038/nature05561
Panaccione, D. G., Vaillancourt, L. J., and Hanau, R. M. (1989). Conidial dimorphism in Colletotrichum graminicola. Mycologia 81, 876–883. doi: 10.1080/00275514.1989.12025677
Perfect, S. E., Hughes, H. B., O’Connell, R. J., and Green, J. R. (1999). Colletotrichum: a model genus for studies on pathology and fungal–plant interactions. Fungal Genet. Biol. 27, 186–198. doi: 10.1006/fgbi.1999.1143
Sai, J., Rogers, M., Hockemeyer, K., Wikswo, J. P., and Richmond, A. (2016). Study of chemotaxis and cell-cell interactions in cancer with microfluidic devices. Methods Enzymol. 570, 19–45. doi: 10.1016/bs.mie.2015.09.023
Schmieder, S. S., Stanley, C. E., Rzepiela, A., van Swaay, D., Sabotic, J., Norrelykke, S. F., et al. (2019). Bidirectional propagation of signals and nutrients in fungal networks via specialized hyphae. Curr. Biol. 29, 217.e4–228.e4. doi: 10.1016/j.cub.2018.11.058
Segall, J. E. (1993). Polarization of yeast cells in spatial gradients of alpha mating factor. Proc. Natl. Acad. Sci. U.S.A. 90, 8332–8386. doi: 10.1073/pnas.90.18.8332
Sukno, S. A., Garcia, V. M., Shaw, B. D., and Thon, M. R. (2008). Root infection and systemic colonization of maize by Colletotrichum graminicola. Appl. Environ. Microbiol. 74, 823–832. doi: 10.1128/AEM.01165-07
Takeshita, N. (2016). Coordinated process of polarized growth in filamentous fungi. Biosci. Biotechnol. Biochem. 80, 1693–1699. doi: 10.1080/09168451.2016.1179092
Turrà, D., El Ghalid, M., Rossi, F., and Di Pietro, A. (2015). Fungal pathogen uses sex pheromone receptor for chemotropic sensing of host plant signals. Nature 527, 521–524. doi: 10.1038/nature15516
Turrà, D., Nordzieke, D., Vitale, S., El Ghalid, M., and Di Pietro, A. (2016). Hyphal chemotropism in fungal pathogenicity. Semin. Cell. Dev. Biol. 57, 69–75. doi: 10.1016/j.semcdb.2016.04.020
Versele, M., Lemaire, K., and Thevelein, J. M. (2001). Sex and sugar in yeast: two distinct GPCR systems. EMBO Rep. 2, 574–579. doi: 10.1093/embo-reports/kve132
Vitale, S., Di Pietro, A., and Turrà, D. (2019). Autocrine pheromone signalling regulates community behaviour in the fungal pathogen Fusarium oxysporum. Nat. Microbiol. 4, 1443–1449. doi: 10.1038/s41564-019-0456-z
Weihmann, F., Eisermann, I., Becher, R., Krijger, J. J., Hubner, K., Deising, H. B., et al. (2016). Correspondence between symptom development of Colletotrichum graminicola and fungal biomass, quantified by a newly developed qPCR assay, depends on the maize variety. BMC microbiology 16:94. doi: 10.1186/s12866-016-0709-4
Welton, R. M., and Hoffman, C. S. (2000). Glucose monitoring in fission yeast via the gpa2 Gα, the git5 Gβ and the git3 putative glucose receptor. Genetics 156, 513–521.
Werner, S., Sugui, J. A., Steinberg, G., and Deising, H. B. (2007). A chitin synthase with a myosin-like motor domain is essential for hyphal growth, appressorium differentiation, and pathogenicity of the maize anthracnose fungus Colletotrichum graminicola. Mol. Plant. Microbe. Interact. 20, 1555–1567. doi: 10.1094/MPMI-20-12-1555
Wheeler, A. R., Throndset, W. R., Whelan, R. J., Leach, A. M., Zare, R. N., Liao, Y. H., et al. (2003). Microfluidic device for single-cell analysis. Anal. Chem. 75, 3581–3586. doi: 10.1021/ac0340758
Xue, C., Hsueh, Y. P., and Heitman, J. (2008). Magnificent seven: roles of G protein-coupled receptors in extracellular sensing in fungi. FEMS Microbiol. Rev. 32, 1010–1032. doi: 10.1111/j.1574-6976.2008.00131.x
Yanagisawa, N., and Higashiyama, T. (2018). Quantitative assessment of chemotropism in pollen tubes using microslit channel filters. Biomicrofluidics 12:024113. doi: 10.1063/1.5023718
Keywords: chemotropism, 3D printed device, glucose, Colletotrichum graminicola, filamentous fungi
Citation: Schunke C, Pöggeler S and Nordzieke DE (2020) A 3D Printed Device for Easy and Reliable Quantification of Fungal Chemotropic Growth. Front. Microbiol. 11:584525. doi: 10.3389/fmicb.2020.584525
Received: 17 July 2020; Accepted: 12 October 2020;
Published: 03 November 2020.
Edited by:
J. Philipp Benz, Technical University of Munich, GermanyReviewed by:
Marc-Henri Lebrun, Institut National de la Recherche Agronomique (INRA), FranceAlexander Lichius, University of Innsbruck, Austria
Copyright © 2020 Schunke, Pöggeler and Nordzieke. This is an open-access article distributed under the terms of the Creative Commons Attribution License (CC BY). The use, distribution or reproduction in other forums is permitted, provided the original author(s) and the copyright owner(s) are credited and that the original publication in this journal is cited, in accordance with accepted academic practice. No use, distribution or reproduction is permitted which does not comply with these terms.
*Correspondence: Daniela Elisabeth Nordzieke, dnordzi@gwdg.de
†Present address: Carolin Schunke, Biochemistry Center, Heidelberg University, Heidelberg, Germany