- 1Department of Bridge Engineering, College of Civil Engineering, Tongji University, Shanghai, China
- 2Department of Transportation Engineering, H-12 Campus, NUST Islamabad, Islamabad, Pakistan
- 3Peter the Great St. Petersburg Polytechnic University, St. Petersburg, Russia
- 4Institute of Energy Infrastructure, Universiti Tenaga Nasional, Kajang, Malaysia
- 5Department of Civil Engineering, University of Engineering and Technology Peshawar (Bannu Campus), Bannu, Pakistan
- 6Department of Civil Engineering, Institute of Engineering and Fertilizer Research, Faisalabad, Pakistan
- 7Department of Architecture and Design, Escuela Politécnica Superior, Montepríncipe Campus, Universidad San Pablo-CEU, CEU Universities, Madrid, Spain
The performance of asphalt pavements is significantly influenced by the mix design and the binder film thickness (BFT) around aggregates. Adjusting the proportions of binders and aggregates modifies the properties of asphalt mixtures, with different mix designs substantially impacting these properties. This study evaluates the influence of two traditional mix designs (i.e., Marshall and Superpave Gyratory Compacted) and one innovative mix design (the one using BFT as a criterion) on asphalt pavement performance Two methods, which are modifications of the Hveem Surface Area Factor method, were used to calculate the optimum BFT. The mix with 3.5% asphalt content (AC) was selected for the innovative mix design as it showed the optimal BFT. For the Marshall and Superpave mix designs, the optimum binder content was determined using the respective Marshall and Superpave Gyratory Compacted methods, yielding values of 4.3% and 4.4%, respectively. Samples were prepared from each type of mix design and then tested using a Universal Testing Machine (UTM) and a Double Wheel Tracker (DWT). Performance tests showed that the innovative mix design samples had superior rutting resistance under DWT, the Marshall samples had the highest Resilient Modulus (Mr) and moisture resistance, and the Superpave samples exhibited the best fatigue resistance, enduring the most cycles until failure in the Indirect Tensile Fatigue Test (ITFT). These findings underscore the importance of considering BFT as a critical mix design criterion, demonstrating its significant potential to enhance the overall performance and durability of asphalt pavements.
1 Introduction
Modern infrastructure relies heavily on asphalt concrete for road construction due to its durability and adaptability. Asphalt concrete properties can be tailored by adjusting the proportions of bitumen, aggregate, and other components to meet specific performance requirements (Dhir et al., 2018; Dhir, Ghataora, and Lynn, 2017). While traditional methods like the Marshall Mix design and advanced approaches like Superpave have contributed significantly to asphalt pavement design, there remains a need to address performance challenges under high-traffic and adverse environmental conditions. Recent research points to Binder Film Thickness (BFT) as a promising factor to enhance durability and moisture resistance, addressing these challenges.
The Marshall Mix design, initially developed for optimizing stability and flow, has been widely used but demonstrates limitations under heavy traffic and high temperatures, where it struggles to maintain durability. Studies indicate that while modifications improve stability, flow, and Indirect Tensile Strength (ITS), Marshall Mix still underperforms under intense loads, underscoring a need for methods that incorporate field density and traffic impact considerations (Azzam, Al-Ghazawi, and Al-Otoom, 2016; Lv et al., 2018). As an evolution of these designs, Superpave introduced performance-graded binder specifications and gyratory compaction to improve rutting and fatigue resistance in high-traffic scenarios (Ghuzlan, Al-Mistarehi, and Al-Momani, 2020; Gu et al., 2017). Originating from the Strategic Highway Research Program (SHRP), Superpave emphasizes compaction levels (Ndesign) and BFT for durability, though challenges in meeting minimum voids in mineral aggregates (VMA) remain (Martinez Soto, 2018; Souza et al., 2024). Research has recommended refinements such as using average asphalt binder film thickness (ABFT) over VMA to enhance performance (Pérez-Jiménez et al., 2014; Harvey et al., 2015; Al-Khateeb and Aroon, 2019; Al-Khateeb, 2018). This shift from Marshall to Superpave reflects the need for adaptable design methods to meet modern infrastructure demands.
Sustainability has guided recent research toward environmentally friendly materials for asphalt applications, emphasizing the use of alternative materials and innovative techniques (Gu et al., 2023; Rudenko et al., 2024; Sun et al., 2024). Meanwhile, BFT has emerged as an essential parameter in enhancing the durability and moisture resistance of asphalt mixtures. Originally proposed by Francis Hveem, BFT has been recognized as a crucial factor in mix design. Researchers have correlated BFT with pavement durability, suggesting its inclusion in mixed design criteria (Remišová, 2015; Kandhal and Sanjoy, 1996; Elseifi et al., 2008; Jiang et al., 2022) and identified the optimal BFT for Hot Mix Asphalt (HMA) using SGC specimens, finding an optimum BFT of 9–10 µm to minimize moisture susceptibility, emphasizing its importance in HMA durability (Karim, Hussain, and Hafeez, 2021; Wang et al., 2024). Further research has quantified aging and durability across various BFTs, concluding that aging is more likely when BFT falls below 9–10 µm (Lin et al., 2023). Analytical imagery techniques have revealed that bitumen films surrounding larger aggregates in mastic asphalt can reach thicknesses above 100 µm (Cavalli, Partl, and Poulikakos, 2017). Additionally, air voids and binder content were shown to be significant, with an average BFT of 8 µm recommended for improved durability (Miranda et al., 2021; Lu et al., 2019; Zhang et al., 2024). The Shell Bitumen Handbook highlighted the role of BFT in asphalt hardening, suggesting a minimum thickness of 6–8 µm for satisfactory performance (Sims, 2016). In summary, BFT emerges as a crucial parameter in asphalt mixture durability, with researchers advocating for its inclusion in mix design criteria to enhance pavement longevity and moisture resistance.
Despite research supporting BFT’s role in durability, its application in mix design remains limited, particularly in performance-based specification systems. Departments of Transportation (DOTs) globally, including Pakistan, face challenges in adopting BFT criteria due to precise binder control requirements and a lack of standardized testing methodologies. Increased traffic volumes, environmental stressors, poor construction practices, and outdated mix designs contribute to premature pavement failures, primarily due to fatigue, rutting, and other distresses. Thus, a performance-based study is needed to evaluate various mixes designed with BFT, Marshall, and Superpave criteria under diverse loading and climate conditions. This study aims to validate BFT determination techniques and conduct a performance-based analysis comparing Marshall, Superpave, and BFT-based innovative mix design under various conditions, including rutting, resilience, fatigue, and moisture susceptibility. By examining BFT’s impact across these mix designs, this research addresses the need for comprehensive testing through both analytical and experimental approaches, contributing to the development of more durable, cost-effective asphalt mixtures suited for modern traffic and environmental demands.
2 Experimental program/methodology
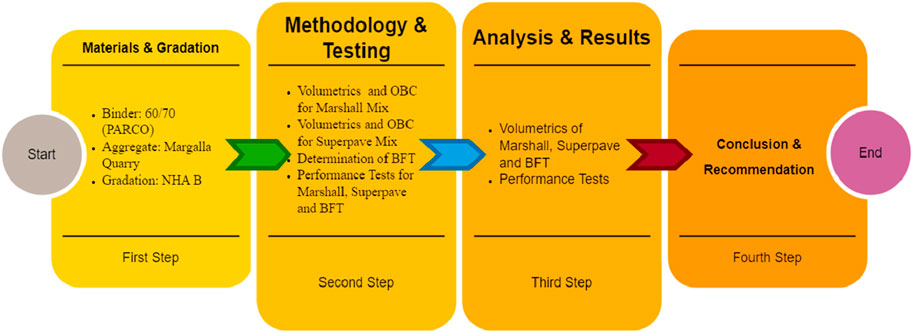
The experimental program and methodology outline the material acquisition, sample preparation, and testing procedures, adhering to National Highway Authority (NHA) B gradation standards. Performance assessments were carried out utilizing the Double Wheel Tracker (DWT) and Universal Testing Machine (UTM). Virgin aggregates from the Margalla quarry and grade 60/70 bitumen from PARCO Islamabad were used. This study encompasses several critical steps to ensure comprehensive evaluation and accurate results. Initially, volumetrics and the Optimal Binder Content (OBC) were determined for the Marshall and Superpave mix designs. This involves assessing the specific gravity, air voids, voids in mineral aggregates, and other relevant volumetric properties essential for defining the mix characteristics. Following this, the BFT was calculated using established analytical methods. BFT determination is crucial as it is a criterion for one of the mixes prepared in this study. Finally, performance tests were conducted to evaluate the efficacy of the mixes prepared under Marshall, Superpave, and BFT criteria. These tests included ITS, moisture susceptibility, rutting resistance using the DWT, fatigue life assessment using the Indirect Tensile Fatigue Test (ITFT), and Resilience Modulus (Mr) tests using a UTM. Each step in this methodology is designed to assess the properties and performance of the asphalt mixtures rigorously. This provides a comprehensive understanding of the impact of different mix designs and BFT on asphalt pavement performance. Figure 1 illustrates the research workflow chart for evaluating the influence of BFT on asphalt pavement performance.
2.1 Materials
In this study, fine and coarse aggregates were sourced from the Margalla quarry, while penetration grade 60/70 bitumen was obtained from PARCO Islamabad. Grade 60/70 was chosen due to its everyday use in Pakistan and suitability for colder to intermediate temperature regions. Aggregates primarily resist permanent deformation in the mix, with the asphalt binder contributing for the remaining 5%. Aggregates’ gradation and surface texture significantly impact hot mix asphalt’s properties and volumetrics, with rough-textured aggregates offering greater shear strength than smooth-surfaced ones. All necessary tests on the acquired aggregates and bitumen were conducted per standards and specifications.
2.2 Material testing
2.2.1 Aggregate testing
According to NHA specifications (1998), the aggregate selected for this research study adhered to NHA class B gradation, specifically designed for the wearing course. The Nominal Maximum Aggregate Size (NMAS) for NHA-B is 19mm, as per the Marshal Mix Design (MS2) (Asphalt Institute MS-2 1993). The specific gradation chosen for this research is outlined in Figure 2.
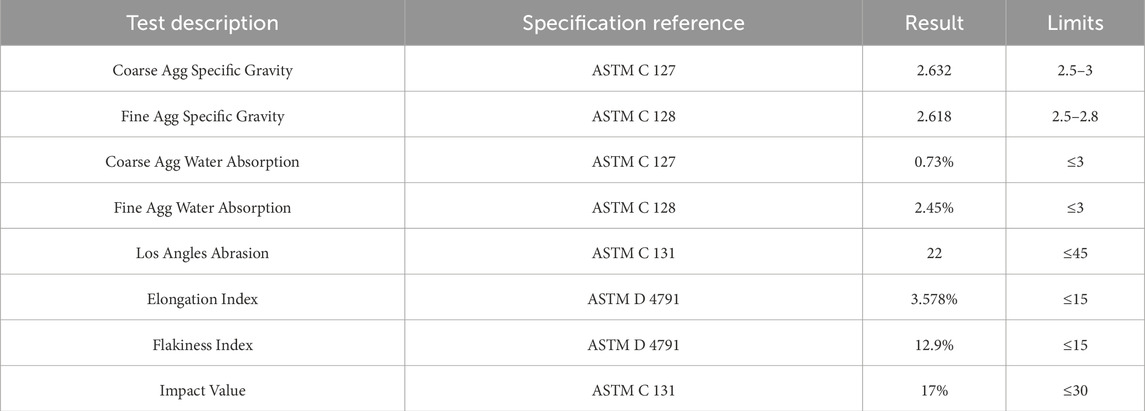
Several tests were performed to ensure the suitability of the aggregates for asphalt mix design, with each test conducted on three specimens and the average values used for analysis. Specific gravity tests for coarse and fine aggregates were performed according to ASTM C 127 and ASTM C 128, respectively (ASTM C 127-08 2008; ASTM C128/C128M 2001). Water absorption rates for both coarse and fine aggregates were also determined using these standards. The Los Angeles Abrasion test (ASTM C 131) was performed to evaluate the hardness and wear resistance of the aggregates (Monyakeng, 2022). The Shape Test (ASTM D 4791) assessed the quantity of elongated and flat particles (ASTM D4791-10 2010). The Impact Value Test was also performed following BS 812 to measure the aggregates’ resistance to breaking (BS 812-112 1990). At the same time, the crushing Value Test was conducted to evaluate the aggregate strength under compressive loads (BS 812-110 1990). The results obtained from these tests are shown in Table 1.
2.2.2 Asphalt binder testing
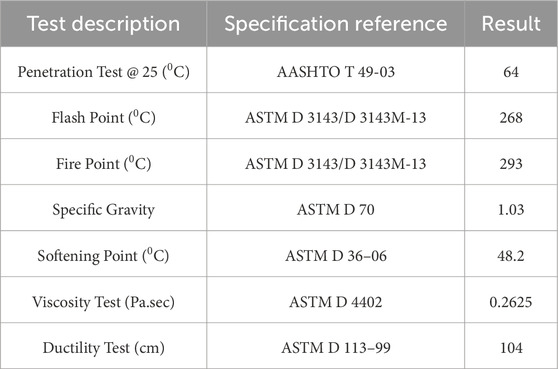
The binder’s consistency, safety, and purity are crucial for construction and engineering applications. Since bituminous binder consistency varies with temperature, standard temperature testing is essential. To assess the performance and suitability of the asphalt binder (PARCO 60/70) for HMA mixtures, several tests were conducted; i.e., ductility, measured according to ASTM D 113-99 (ASTM D 113-99 2000), indicates the bitumen’s elongation without breaking when pulled at a specified velocity at 25°C, with all specimens exceeding the 100 cm minimum criterion. The Rotational Viscosity (RV) test, conducted at 135°C and 160°C using the Brookfield RV apparatus, determines asphalt binder viscosity, following AASHTO T-316 (AASHTO T316 2019) and ASTM D4402 (ASTM D4402 2016). Heated bitumen is stirred, avoiding air bubbles, and poured into the sample chamber. The spindle rotates at 20 RPM, and three viscosity readings are averaged. The penetration test, conducted according to AASHTO T 49–03 standards (AASHTO T 49-15 2012), assesses the consistency of asphaltic materials, with softer binders exhibiting higher penetration values. This test is performed at 25°C with a 100-g load applied for 5 s. Five penetration values were recorded for each of the two Parco 60/70 specimens; all values met the required standards, confirming their appropriate consistency. According to ASTM D36-06 (ASTM D36-06 2008), the softening point is the temperature at which bitumen cannot support a 3.5 gm steel ball. The test performed for it involves heating bitumen disks until the steel balls drop one inch, using the standard ring and ball setup. Similarly, the flash and fire point test, conducted according to ASTM D3143/D3143M-13 standards (ASTM D3143/D3143M − 13 2013), assesses bitumen’s suitability for mix preparation, ensuring safety and compliance with specifications. Table 2 provides a summary of the test outcomes.
2.3 Asphalt mixtures preparation
Laboratory samples were meticulously prepared for Marshall, SGC, and BFT methods. For both the Marshall Mix Design and the Superpave Gyratory Mix Design, five different bitumen content levels were tested: 3.5%, 4%, 4.5%, 5%, and 5.5%, with three samples prepared for each bitumen content level, totaling 15 samples per mix design. Subsequently, these samples underwent comprehensive testing and scrutiny to assess various volumetric properties and stability characteristics.
2.3.1 Preparation of bituminous mixes for marshall mix design
Bituminous mixes for the Marshall Mix Design were prepared using the Marshall Apparatus. Volumetric characteristics, including stability and flow, were determined to verify the criteria and establish the OBC. Aggregates were dried at 110°C after sieve analysis. For consistency, 1,200 g of aggregates were measured for each sample, following ASTM D6926 (ASTM D 6926 2014). The required asphalt cement for each sample was calculated as a percentage of the total mix weight from a predefined Equations 1, 2 (Roberts et al., 1996).
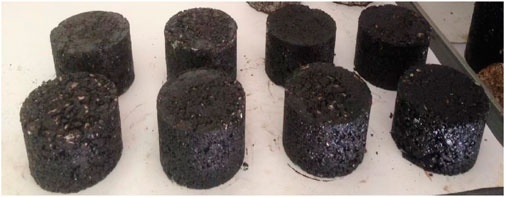
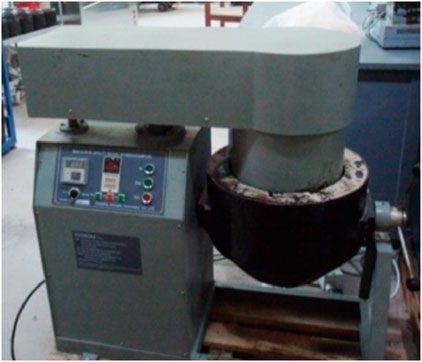
Where MT stands for the total mass of the mix in kilograms (kg), MAgg represents the aggregate’s mass in kilograms (kg), MBin denotes the binder’s mass in kilograms (kg), and %X indicates the binder’s percentage. Following ASTM D6926 guidelines (ASTM D 6926 2014), a mechanical mixer thoroughly combined heated aggregates (160°C–165°C as per NHA specifications) and bitumen binder. The mix was then compacted with a Marshall Compactor, evenly distributed in the mold with a spatula, and filter paper applied to both ends. Each sample side received seventy-five (75) compaction blows to meet heavy traffic criteria. After compaction, specimens cooled before being ejected with an extraction jack and cooled to room temperature as shown in Figure 3.
2.3.2 Preparation of bituminous mixes for Superpave mix design
Achieving the required gradation is essential for the Superpave mix design. Following the Asphalt Institute’s Mix Design Method for Superpave (SP-2) guidelines (Asphalt Institute MS-2 1993), aggregates were oven-dried at 105°C–110°C. A 19 mm NMAS was selected, using 4,500 g of aggregates for the 6-inch gyratory compacted specimen. The heated dry aggregates (Figure 4A) and bitumen (Figure 4B) were mixed using a mechanical mixer (Figure 5) at 160°C–165°C for 10–15 min.
According to SP-2 guidelines (Asphalt Institute MS-2 1993), specimens were compacted using the Superpave Gyratory Compactor (SGC) (Figure 6) at 135°C. The mold, preheated to 100°C for 30 min, had a 150 mm inner diameter and a base plate to ensure proper compaction. The SGC operated at a constant 30 rpm, with the mold at a 1.25-degree angle and 600 kPa pressure applied. The compaction process was carried out to meet heavy traffic design criteria until the desired compaction was achieved. After compaction, specimens were extracted from the mold for further testing as shown in Figure 7.
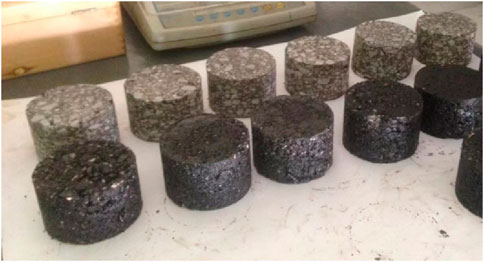
Figure 7. Bituminous samples prepared using superpave (grey) and marshall (black) mix design methods.
2.4 Determination of VFA (voids filled with asphalt), VMA, and OBC
Determining VFA, VMA, and OBC is crucial for Marshall and Superpave Mix Designs.
2.4.1 VFA, VMA, and OBC for Marshall mix design
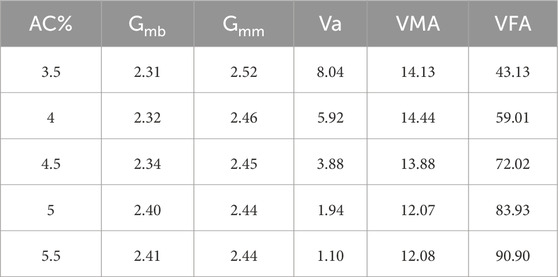
For Marshall Mix Design, VMA, VFA, air voids (Va), and unit weight were calculated using Mix Theoretical Maximum Specific Gravity (Gmm) and Mix Bulk Specific Gravity (Gmb), determined according to ASTM D2041 (ASTM D2041 2018) and ASTM D2726 (ASTM D2726 2013), respectively. The mix characteristics are shown in Figure 2. After obtaining these values, specimens were conditioned in a water bath at 60°C for an hour and tested for stability and flow using Marshall testing equipment (Figure 8). A load was applied at a 5 mm/min deformation rate until failure. The maximum load (kN) was recorded as Marshall Stability, and the deformation at maximum load (mm) was noted as the flow number. Stability must be at least 8.006 kN for heavily trafficked-wearing courses, and the flow number should be between 2 and 3.5. The specimens were tested immediately after removal from the water bath. Following the Marshall mix design method guidelines, the OBC will be determined at 4% Va. This approach ensures durability and stability, as 4% air voids are optimal. Lower air voids may result in rutting and bleeding, while higher air voids can increase permeability and oxidation. This practice is recommended by the Asphalt Institute and various transportation agencies, as detailed in the Asphalt Institute’s Manual Series No. 2 (MS-2) (Asphalt Institute MS-2 1993), which specifies that the air voids should be approximately 4%.
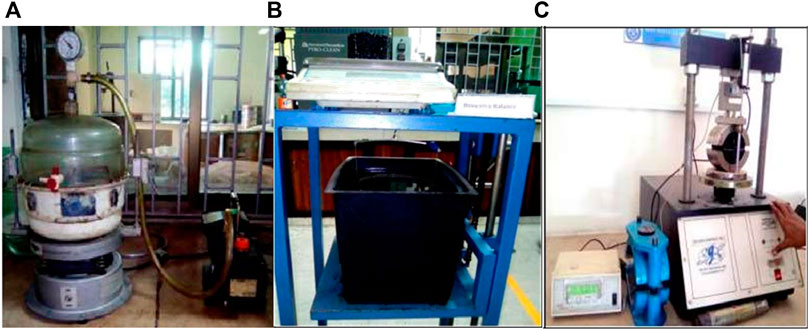
Figure 8. Marshall Testing Equipment (A, B) Gmm, Gmb, determination apparatus (C) Stability and flow apparatus.
2.4.2 VFA, VMA, and OBC for super pave mix design
Samples for both 19mm and 25 mm gradations were prepared following the Superpave mix design manual (SP-2) to determine the optimal asphalt content (Asphalt Institute MS-2 1993). Binder content ranged from 3% to 4.5% in 0.5% increments. Two samples were prepared for each gradation for each binder content, resulting in eight samples for the 19 mm gradation and eight for the 25 mm gradation. Volumetric parameters, including theoretical maximum specific gravity (Gmm), effective specific gravity (Gse), bulk specific gravity (Gmb), and %Gmm of the prepared specimens, were measured and verified according to Superpave mix design criteria. Due to its weight, testing the entire Superpave sample was impractical, so 2000 g were used to determine the volumetrics. The same apparatus used for the Marshall test was employed. For a 19.0 NMAS, the minimum VMA is 13%; in this case, it was 15.71%. The VFA should be between 65% and 75%, calculated at 71.64%, meeting the criteria. The dust-to-binder ratio should be between 0.8 and 1.6; in this instance, it was 1.54. The OBC was then determined at the binder percentage, which achieved 96% Gmm. Based on the results, 19 mm NMAS was chosen as it effectively met all the Superpave mix design criteria.
2.5 Determination of BFT
Different researchers employed various equations to determine the BDT, many of which are modifications of the Hveem Surface Area Factor method. The following outlined methods were used for deciding BFT in this study.
2.5.1 The Shell Bitumen Handbook method
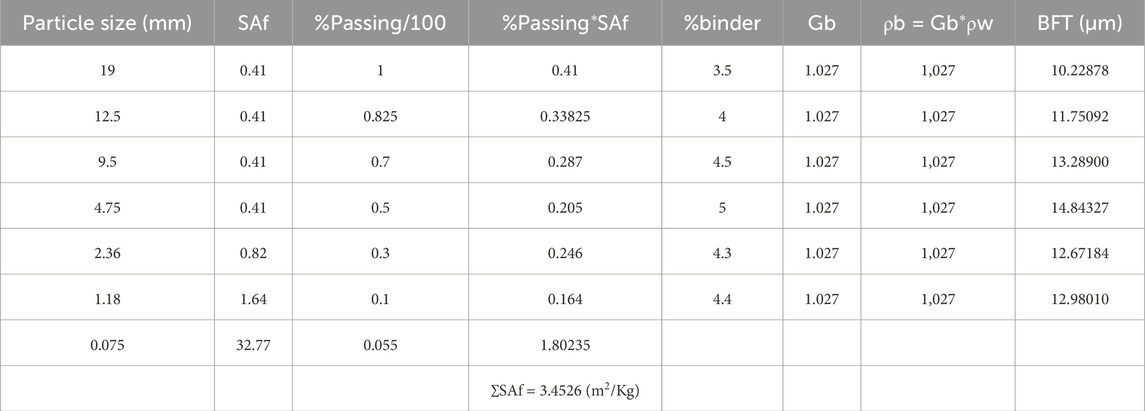
The Shell Bitumen Handbook uses the Hveem Surface Area Factor method to estimate the BFT (Sims, 2016). This method estimates the aggregate surface area by coating it with oil and measuring the required amount, accounting for absorbed asphalt. Alternatively, the Hveem (ASTM 1992) surface area factor can be used, assuming a spherical shape and a specific gravity of 2.65. Surface area factors are presented in Table 3:
To calculate the aggregate surface area, multiply the mass percentage passing each sieve by the corresponding surface area factor and sum the results. The BFT is then calculated using the following Equation 3:
Where
2.5.2 The Hveem method in Zaniewski, Reyes, et al
Zaniewski, Reyes, et al. recommend Equation 4 for determining BFT (Sukkari et al., 2022):
BFT is the average thickness of the binder film, measured in micrometers (µm). The term Wb represents the ratio of binder weight to aggregate weight, Gb is the specific gravity of the binder, and SAfdenotes, the surface area factor of the aggregate, measured in square meters per kilogram (m2/kg). This formula is advantageous due to its simplicity and the inclusion of binder percentage by the weight of the entire mix.
2.6 Performance comparison among mixes based on BFT, Marshall mix design, and SGC mix design
After determining the optimum criteria for all three mixes—Marshall, Superpave, and BFT—the mixes were subjected to a series of tests. Rutting was evaluated using the DWT. At the same time, the UTM was employed to assess the Mr, ITFT, ITS, and moisture susceptibility.
2.6.1 Performance comparison test using DWT
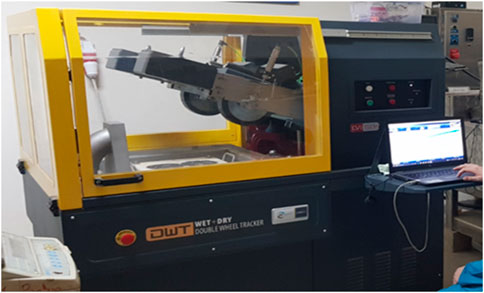
Performance tests for Marshall, Superpave, and BFT-designed mixes were conducted using the DWT to assess rutting. Samples, aged for 48 h, were prepared and cut to specified dimensions. As shown in Figure 9, the DWT operated at 25 cycles per minute for 5,000 cycles at room temperature. Despite initial weight differences, samples were uniformly cut for consistent testing.
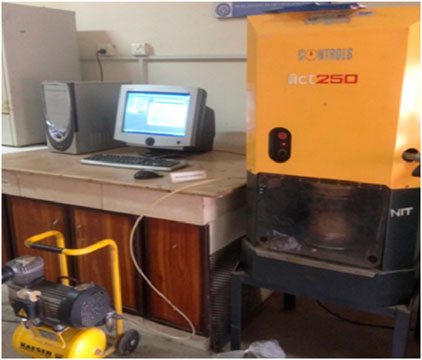
2.6.2 Performance comparison tests using UTM
The Mr test was performed using the ASTM D7369-11 standard (ASTM D7369-11, 1860). It involves applying compressive loads in a haversine waveform to cylindrical specimens to record vertical and horizontal deformations. Resilient Poisson’s ratio is calculated from these deformations, and two Mr values, instantaneous and total, are obtained based on recoverable deformations.
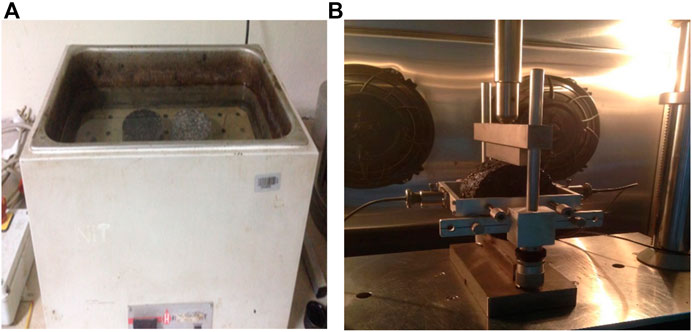
The ITS and Moisture Susceptibility tests were conducted using UTM, following ASTM D 6931-07 specifications (ASTM D6931-07 2022). Three unconditioned specimens per mix were tested, while another set of three conditioned specimens per mix underwent saturation and exposure to elevated temperatures before testing. Conditioning was performed according to ALDOT-361 standards, involving saturation followed by immersion in a 60°C ± 1°C water bath for 24 h and subsequent immersion in a water bath at 25°C ± 1°C for 50 h as shown in Figure 10A (ALDOT-361-88 2005). Both unconditioned and conditioned specimens were loaded on their diametric plane at a 50 mm/min rate as shown in Figure 10B.
The tensile strength of each specimen was calculated based on its dimensions and failure load. The tensile strength ratio (TSR) was then determined by dividing the average tensile strength of conditioned specimens by the average tensile strength of unconditioned specimens, with an acceptable TSR value set at 80%. The resistance to moisture damage is then expressed as a ratio of the conditioned sample’s tensile strength retained after the conditioning to the unconditional tensile strength. Tensile strength (St) was calculated using Equation 5:
where St represents the tensile strength in kilopascals (KPa), P is the maximum load in newtons (N), t denotes the sample thickness in millimeters (mm), and D is the sample diameter in millimeters (mm).
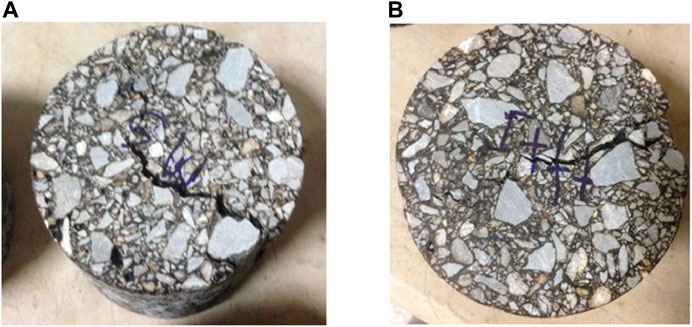
The ITFT was conducted according to ASTM D7460–08 to assess fatigue cracking in asphalt pavements and primary distress caused by tensile and shear stresses from traffic loads (ASTM D7460-08 2010). Fatigue performance models, both empirical and mechanics-based, have been developed to characterize the behavior of HMA mixtures. The ITFT is conducted on cylindrical samples to characterize virgin and modified mixes under repeated vertical compression loads. This loading generates uniform tensile stress in the horizontal direction, perpendicular to the load. Figure 11 indicates failure by the sample splitting along the vertical plane. Vertical deformations calculate tensile stresses and strain at the specimen’s center, assuming a Poisson’s ratio. The number of cycles to failure determines the fatigue life.
3 Results and discussion
This section presents a detailed analysis of the results, beginning with volumetric calculations and the determination of the OBC. Subsequently, it discusses the findings from various performance tests, including ITS and Moisture Susceptibility, rutting resistance using the DWT, and fatigue life assessment using the ITFT. Each test result is evaluated against relevant criteria to comprehensively understand the material’s performance.
3.1 Volumetric analysis and OBC
The Volumetric Analysis included determining the VFA and VMA for Marshall Mix and Superpave mix Designs. Based on the calculated VMA and VFA, the OBC and BFT were determined for Marshall and Superpave mixes. The volumetric properties, stability, and flow of the Marshall mix are presented in Table 4.
To determine the Marshall mix’s OBC, graphs were plotted in Figure 12 between asphalt content and volumetric properties, stability, and flow, as specified in the MS-2 manual (Asphalt Institute MS-2 1993).
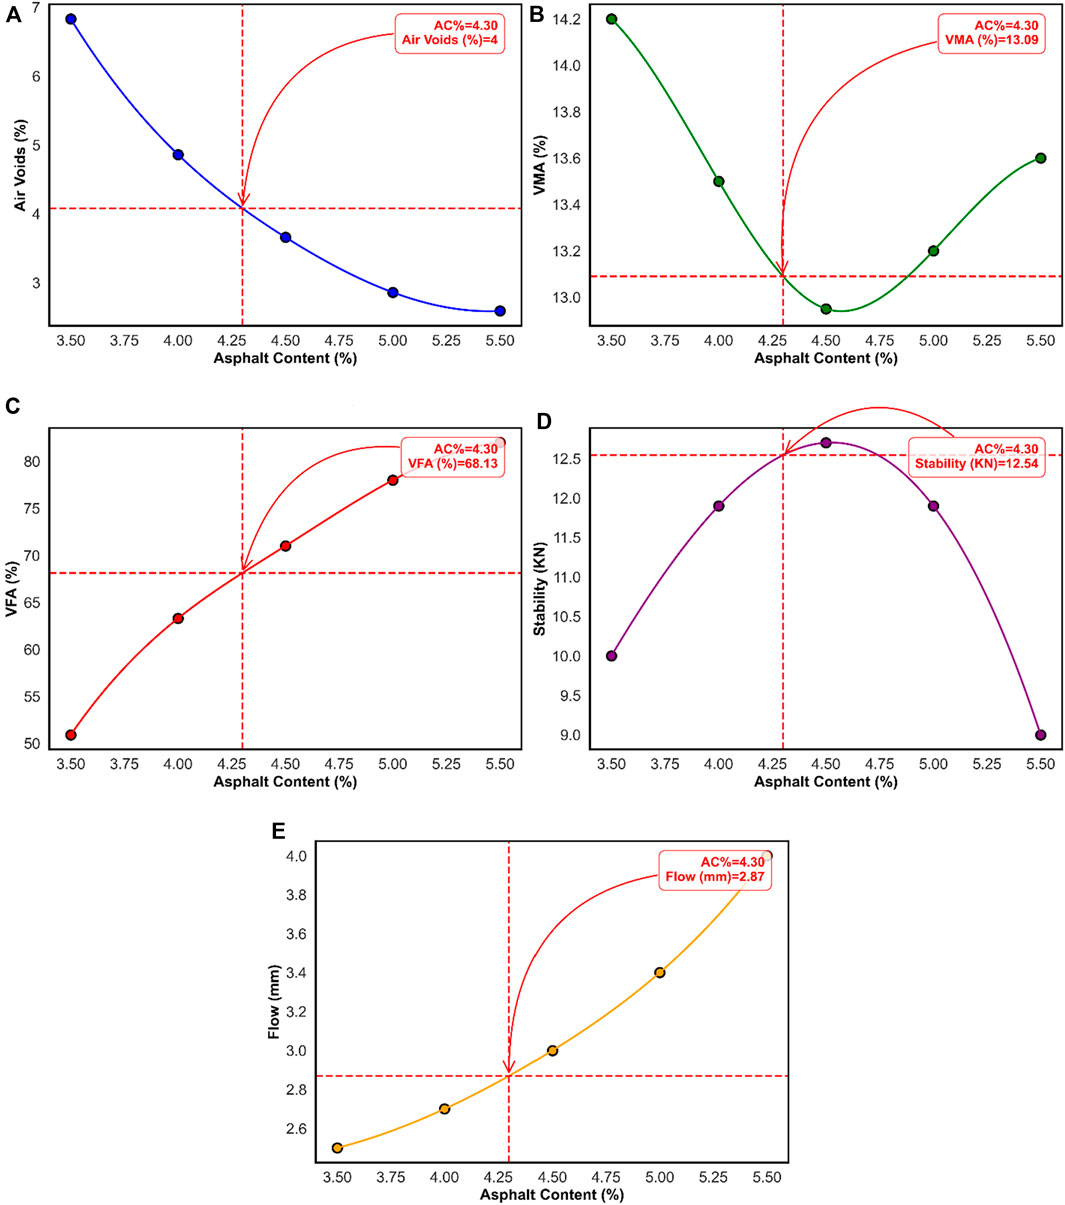
Figure 12. Relationship between (A) AC vs. Va (B) AC vs. VMA (C) AC vs. VFA (D) AC vs. Stability (E) AC vs. Flow.
The Marshall mix design results showed that the OBC was determined to be 4.30% at 4% air voids as shown in Figure 12A. This aligns with the typical practice of using 4% air voids to balance durability and stability in asphalt pavements. The VMA was calculated to be 13.23%, which exceeds the minimum requirement of 13%, indicating a sufficient void space within the aggregate structure to accommodate the asphalt binder. The VFA of 69% falls within the recommended range of 65%–75%, ensuring an adequate binder film around the aggregate particles, which is essential for long-term durability and resistance to moisture damage.
The stability and flow values at the OBC were also within acceptable ranges, with a stability of 12.5 kN (well above the minimum requirement of 8.006 kN) and a flow number of 2.7 mm (within the range of 2–3.5 mm). These results suggest that when properly optimized, the Marshall mix design method can produce asphalt mixtures that meet the required performance criteria for stability and durability.
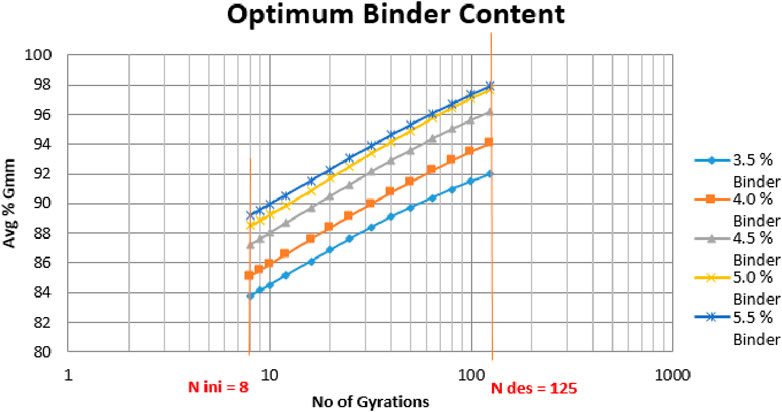
For the Superpave mix design, the volumetric properties such as VMA and VFA were also within acceptable limits., as shown in Table 5. Figure 13 illustrates the relationship between the number of gyrations and the average %Gmm for various binder contents in the Superpave mix design. The vertical lines at N_ini = 8 and N_des = 125 represent the initial and design gyrations, respectively. The target %Gmm for optimal performance was 96% at 125 gyrations, consistent with the Superpave mix design criteria. The binder content that achieved this target was determined to be 4.4%, slightly higher than the Marshall mix design’s OBC. This slight increase in binder content can be attributed to the more rigorous compaction process used in the Superpave method, which aims to simulate the long-term densification of the asphalt pavement under traffic loads.
The findings indicate that both mix design methods can produce high-quality asphalt mixtures. Still, the Superpave method provides a more comprehensive approach to optimizing the mix for long-term performance. Using gyrations to simulate compaction and the detailed analysis of volumetric properties ensure that the Superpave mix design can produce mixtures with improved resistance to rutting and fatigue cracking.
3.2 Determination of BFT
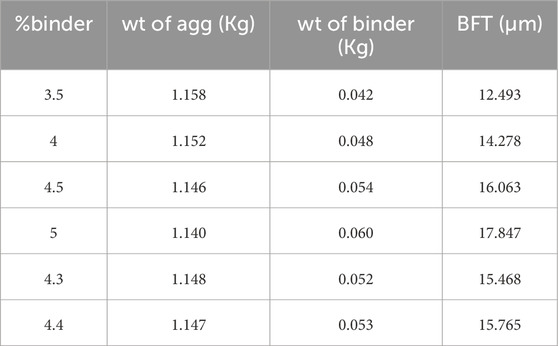
This study determined the BFT using the Hveem surface area factor method, as detailed in the Shell Bitumen Handbook. The results, presented in Table 6 BFT for different, were calculated based on particle size distribution and specific surface area factors for each aggregate size, demonstrating the method’s practical application in accurately determining the BFT for the asphalt mixtures analyzed. The binder content varies between 3.5% and 5%, and the BFT increases with higher binder content.
Similarly, BFT was also determined using the Hveem Method described by Zaniewski, Reyes, et al., which includes a formula for calculating BFT that uses the ratio of binder weight to aggregate weight, the surface area factor, and the specific gravity of the binder. The BFT values obtained using this method are presented in Table 7.
Both methods indicate that BFT increases with higher binder content, which aligns with expectations as more binder provides a thicker film around aggregates. However, the methods produce slightly different BFT values due to variations in calculation approaches:
Figure 14 shows a radar chart illustrating BFT across different binder content percentages obtained from both methods as explained earlier, and it also includes Marshall and Superpave OBC. This graph effectively demonstrates the importance of selecting an appropriate binder content to achieve optimal BFT. Higher binder content results in thicker binder films in both methods. This relationship is crucial for ensuring adequate binder coverage, impacting the durability and performance of asphalt mixtures. The Hveem surface area factor method provides a detailed calculation based on specific aggregate sizes and their surface area factors. In contrast, the Zaniewski, Reyes et al. method uses a simplified approach based on the binder to aggregate weight ratio, which may lead to slightly higher BFT values. The comparison of the two methods highlights the significance of accurate BFT determination in asphalt pavement performance. Including BFT as a design criterion is essential for preventing moisture damage and enhancing the long-term durability of asphalt pavements. The study’s results support the literature, emphasizing the importance of BFT in maintaining structural integrity under traffic loads (AASHTO, 2004).
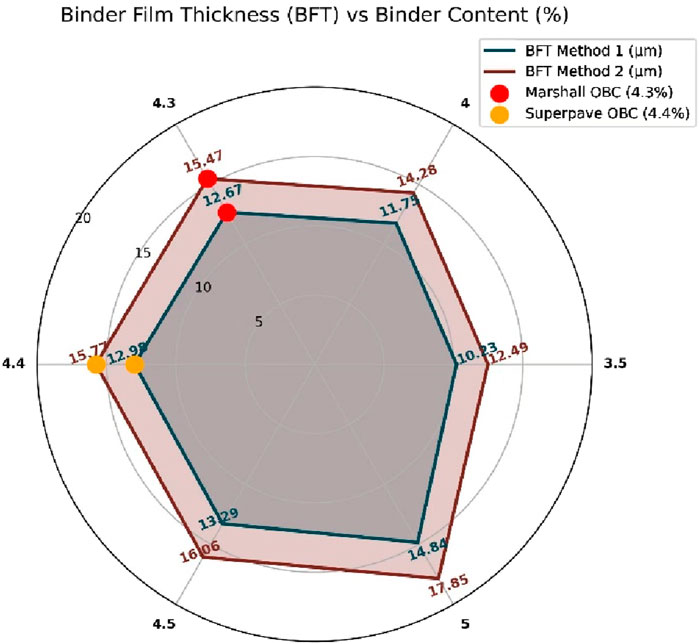
Figure 14. Radar chart illustrating BFT across different binder content percentages using two methods, including marshall and superpave OBC.
3.3 Performance comparison test using DWT
The selection of the BFT criterion is essential for enhancing the durability and performance of asphalt mixtures, particularly under heavy traffic and adverse environmental conditions. BFT directly influences the binder distribution around aggregates, which is critical in reducing the risk of rutting, fatigue, and moisture damage, thereby potentially extending the pavement’s service life as per previous studies. By calculating BFT values through two independent methods, a binder content of 3.5% was determined as optimal for achieving reduced BFT values. Consequently, three mix designs were prepared: a BFT-based design with 3.5% AC, a Marshall mix design with 4.3% OBC, and a Superpave mix design with 4.4% OBC.
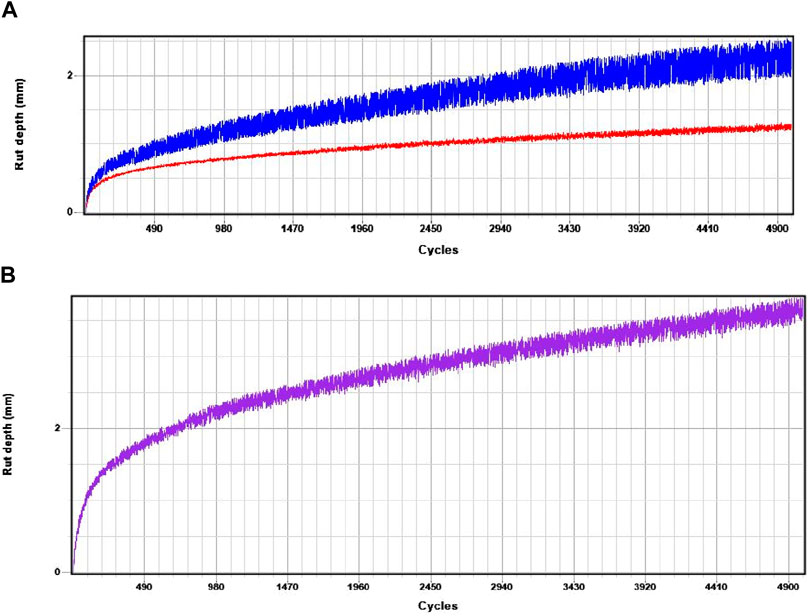
The DWT test, set at 5,000 cycles or 10,000 wheel passes, was used to assess rutting resistance across the three mix designs. The BFT-based mix demonstrated superior rutting resistance, with a lower rut depth progression than both the Superpave and Marshall designs, as illustrated in Figure 15A. This improved performance suggests that the optimized BFT criterion at 3.5% binder content enhances the mix’s ability to withstand high loads without significant deformation. The smaller BFT achieved at this binder content results in a more compact and stable mix structure, which distributes stress more evenly and minimizes rutting under repeated wheel loads.
In contrast, while effective in stability and ease of implementation, the Marshall mix design showed the highest rut depth, reaching an average of 3.645 mm, as depicted in Figure 15B. This value indicates that the Marshall design is more susceptible to rutting, making it less suitable for high-stress conditions or heavy-traffic pavements. The Marshall design’s performance aligns with its historical usage, where it has been effective in moderate traffic but may not offer the durability required for modern high-load applications.
3.4 Performance comparison test using UTM
A comprehensive performance comparison of the three asphalt mix designs, i.e., BFT, Marshall, and Superpave was carried out through several key mechanical tests. Each test provided insights into the distinct properties and advantages of the mix designs, including Resilience Modulus (Mr) to assess stiffness and load-bearing capacity, Indirect Tensile Strength (ITS) and Moisture Susceptibility to evaluate durability and resistance to moisture-induced damage, and Indirect Tensile Fatigue Test (ITFT) to determine fatigue life under repeated loading.
3.4.1 Resilience modulus test
The Mr is a critical parameter for evaluating the stiffness of asphalt mixtures and their capacity to recover after loading, directly affecting the pavement’s ability to withstand repeated traffic loads. High Mr values indicate that a mix design can endure traffic stresses with minimal deformation, essential for maintaining pavement structure and longevity. The UTM was used to determine Mr for the BFT, Marshall, and Superpave mix designs, revealing distinctive performance characteristics that highlight the strengths and weaknesses of each approach.
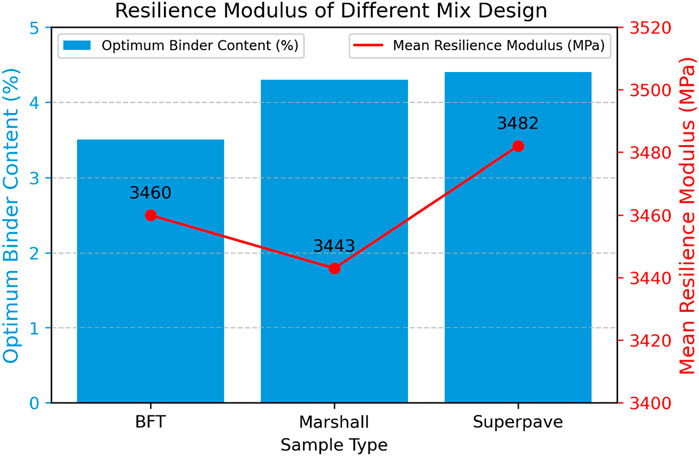
Figure 16 illustrates the relationship between the OBC and the mean Mr for the three mix designs. In this graph, blue bars represent the OBC for each design, while the red line indicates mean Mr values. The Superpave mix design demonstrated the highest Mr value at 3,482 MPa, highlighting its suitability for heavy traffic loads and extreme conditions, where durability and resistance to deformation are essential. However, Superpave’s required OBC of 4.4% may raise material costs, potentially impacting cost-effectiveness in budget-limited projects. Despite this, its high stiffness makes it an excellent choice when structural integrity is the priority.
In contrast, the Marshall mix design exhibited the lowest Mr at 3,443 MPa, even with a relatively high OBC of 4.3%. This more traditional mix design is well-suited to moderate traffic conditions, where stability rather than extreme load resistance is prioritized. Its ease of implementation and familiarity among engineers can make it an economical choice for less demanding environments, though its lower stiffness may lead to quicker deformation under heavy loads.
The BFT-based mix design, with a 3.5% binder content, achieved an Mr of 3,460 MPa, offering a balance between stiffness and flexibility. While slightly lower in stiffness than Superpave, the BFT mix’s optimized binder distribution allows it to withstand load stresses efficiently, reducing the risk of cracking and deformation. This balance makes the BFT-based design a sustainable, cost-effective alternative for high-traffic applications, where comparable performance with reduced binder content is desired.
3.4.2 Indirect tensile strength and moisture susceptibility tests
The ITS and Moisture Susceptibility tests are essential for evaluating the durability and resistance of asphalt mixtures to moisture-induced damage, which is a critical factor in determining pavement longevity. These tests assess the TSR, a measure of a mixture’s ability to retain tensile strength after moisture conditioning. Figure 17 provides a comparison of TSR values for the BFT, Marshall, and Superpave mix designs, along with their respective OBC.
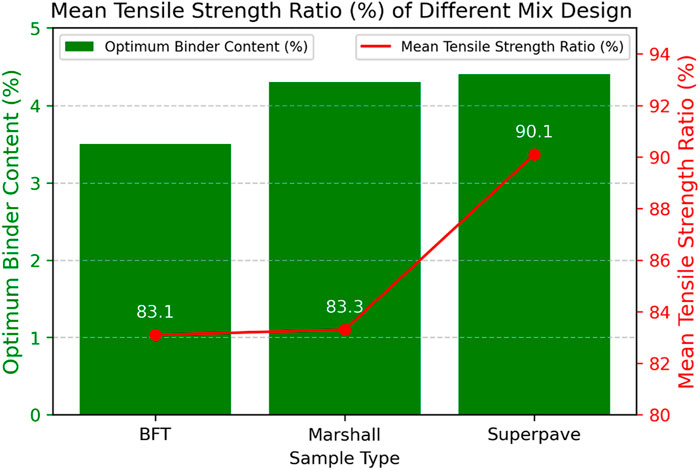
Figure 17. Comparison of mean tensile strength ratio and OBC for BFT, marshall, and superpave mix designs.
The test results show that all three mix designs exhibit good moisture resistance, with varying levels of performance. The Superpave mix design achieved the highest TSR at 90.1%, which reflects excellent resistance to moisture-induced damage. This high TSR indicates that the Superpave mix retains a significant portion of its tensile strength after conditioning, making it highly suitable for regions with high moisture levels or frequent freeze-thaw cycles. However, this performance is achieved with an OBC of 4.4%, leading to increased binder use, which may raise costs.
In comparison, the Marshall mix design achieved a TSR of 83.3% with an OBC of 4.3%. While this design demonstrates sufficient resistance to moisture, its lower TSR relative to Superpave indicates slightly reduced performance in moisture-prone environments. The Marshall mix remains suitable for moderate moisture conditions but may not offer the same durability under extreme environmental stress.
The BFT-based mix design, with a 3.5% binder content, achieved a TSR of 83.1%. This TSR indicates that the BFT mix retains 83.1% of its tensile strength after moisture conditioning, which is comparable to the Marshall mix despite the lower binder content. The BFT mix’s ability to maintain strength with reduced binder content reflects a balanced approach to durability and cost-effectiveness, making it a practical choice for areas that require moderate moisture resistance without incurring high binder costs. The optimized binder distribution in the BFT design ensures that the mix retains its integrity and strength even under wet conditions, supporting its long-term performance.
3.4.3 Indirect tensile fatigue test
The ITFT assesses the fatigue life of asphalt mixtures by applying repeated loading cycles until the material fails. Fatigue resistance is crucial for pavements subjected to heavy traffic, as it determines the material’s ability to withstand cycles of stress without cracking. Figure 18 illustrates the mean cycles to failure for the BFT, Marshall, and Superpave mix designs, providing insights into their respective fatigue performance.
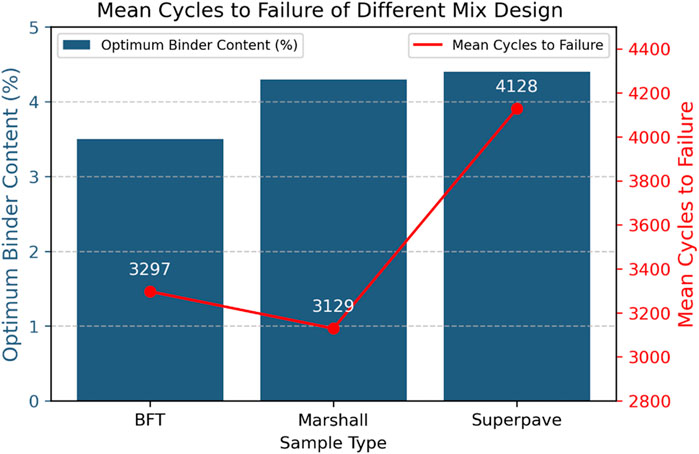
Figure 18. Comparison of mean cycles to failure and OBC for BFT, marshall, and superpave mix designs.
The ITFT results indicate that all three designs exhibit good fatigue resistance, with varying levels of performance. The Superpave mix design achieved the highest fatigue resistance, enduring 4,128 cycles to failure, indicating its suitability for high-stress applications and heavy traffic environments. This high cycle count demonstrates the Superpave mix’s ability to resist cracking under repeated loading, which is particularly beneficial in regions with extreme traffic loads or environmental conditions.
In comparison, the Marshall mix design exhibited the lowest fatigue resistance, with an average of 3,129 cycles to failure. While this level of fatigue resistance may be adequate for moderate traffic conditions, the Marshall design’s lower cycle count suggests it may be more susceptible to cracking and fatigue-related failure under heavy or frequent loading conditions. Consequently, the Marshall mix may be better suited for applications with lower traffic demands.
The BFT-based mix design, with an OBC of 3.5%, demonstrated a fatigue life of 3,297 cycles to failure. Although slightly lower than Superpave, this level of fatigue resistance indicates that the BFT-based design can effectively endure repeated loading cycles, making it a robust choice for high-traffic applications. The BFT mix’s optimized binder content and balanced design allow it to withstand cyclic stress efficiently, reducing the risk of early fatigue failure. By achieving competitive fatigue resistance with a lower binder content, the BFT-based design supports cost-effective and durable pavement solutions.
The findings underscore the need for DOTs to adopt performance-based specifications, integrating BFT and advanced mix design methods to address the challenges posed by increased traffic and adverse conditions. The selection of BFT as a criterion in mix design is justified by its ability to improve rutting resistance, ensure balanced binder distribution, enhance durability, and provide comprehensive performance benefits. The results from the performance tests substantiate that BFT-based mix designs offer superior resilience and longevity, making it a critical parameter for optimizing asphalt pavement performance. This approach aligns with the need for high-performance pavements and supports sustainable and cost-effective construction practices.
3.5 Comparative analysis and limitations
The BFT-based mix design demonstrates several strategic advantages over both Superpave and Marshall designs across key performance metrics, offering a balanced approach that combines cost-efficiency with effective performance in stiffness, moisture resistance, and fatigue life.
In terms of Mr, the BFT mix achieves near-equivalent stiffness to Superpave but at a lower binder content (3.5% compared to Superpave’s 4.4%), making it a more economical option. The balanced stiffness and flexibility of the BFT mix help reduce the risk of cracking and deformation over time, while Superpave’s higher stiffness may lead to brittleness. Unlike the Marshall mix, which has the lowest Mr despite a higher binder content, the BFT mix optimizes binder distribution to provide efficient load-bearing capacity and durability.
For Moisture Susceptibility and ITS, the BFT mix achieves a comparable TSR to Marshall (83.1% vs. 83.3%) but with reduced binder usage, making it more cost-effective. Although Superpave provides the highest TSR, this performance comes at the expense of a higher binder content. The BFT mix, with its optimized binder usage, offers balanced moisture resistance, allowing it to retain strength under moderate moisture exposure without incurring high material costs.
In terms of Fatigue Resistance as measured by the ITFT, the BFT mix provides substantial fatigue life (3,297 cycles), closely approaching Superpave’s performance at a lower binder cost. While Superpave demonstrates the highest fatigue life, its greater stiffness can increase susceptibility to cracking over time. The BFT design’s flexibility helps mitigate fatigue cracking under repeated loads, making it a durable choice for variable loading conditions. Compared to Marshall, which has the lowest cycles to failure, the BFT design improves fatigue performance with a lower binder content, offering better durability without additional costs.
Despite its advantages, the BFT-based mix design has some limitations. The slightly lower stiffness compared to Superpave may make it less suitable for extreme, high-stress applications where maximum rigidity is essential. Additionally, while the BFT mix achieves good moisture resistance, it does not surpass Superpave in this aspect, which could be a consideration for regions with very high moisture levels or freeze-thaw cycles. Lastly, the BFT design requires precise control in binder distribution to optimize film thickness, which may introduce complexity in mix preparation and consistency, potentially limiting its application in areas where such control cannot be consistently maintained.
4 Conclusions and recommendations
This study aimed to test various design mixes and criteria, focusing on BFT. Detailed analysis of BFT was conducted using both analytical and experimental methods. The analytical calculation of BFT yielded an OBC of 3.5%. For Marshall Mix designs, samples with varying binder percentages determined an OBC of 4.3%. Similarly, samples were prepared with varying binder percentages for Superpave mix designs, resulting in an OBC of 4.4%, corresponding to 96% of Gmm. Once the OBC values were established, samples were prepared for performance testing. These samples were subjected to rutting tests using a DWT and various UTM tests, including Mr, ITS, Moisture Susceptibility, and ITFT. The results of these tests led to the following conclusions and recommendations.
• By optimizing the BFT, the mix design ensures better distribution and adhesion of the binder around aggregates, enhancing the durability and performance of the asphalt pavement.
• The BFT criterion helps balance performance parameters, such as rutting resistance, stiffness, moisture susceptibility, and fatigue life.
• Incorporating BFT into the mix design allows for a comprehensive evaluation of asphalt mixtures under various performance conditions, leading to more resilient and long-lasting pavements.
• In rutting tests using the DWT, the BFT-based mix design with 3.5% binder content shows superior rutting resistance compared to Superpave and marshall mix design, which is crucial for pavements subjected to heavy traffic loads. The smaller BFT effectively minimizes rutting depth.
• Mr values indicate that all mix designs exhibit similar stiffness, indicating that the BFT criterion does not compromise the pavement’s structural integrity.
• Superpave Mix showcased superior performance in ITS and Moisture Susceptibility Tests, with Marshall Mix and BFT Mix trailing behind. The BFT-based mix design shows good moisture resistance, ensuring durability in wet conditions.
• In the ITFT, the Superpave mix design shows the best fatigue performance, while the BFT mix design provides substantial fatigue resistance. This indicates that the BFT-based design can effectively withstand repeated loading cycles, reducing the risk of fatigue-related failures.
• Overall, BFT performed satisfactorily across most tests and excelled in the dry DWT test under room temperature conditions. Moreover, it is noteworthy that BFT mixes have the lowest OBC, implying a reduced need for binders.
Future research should validate BFT as a design criterion across various environmental conditions and traffic loads. Long-term performance studies under field conditions are essential to confirm the laboratory results. Additionally, optimizing BFT determination through advanced simulation models and exploring new materials or additives can lead to significant advancements in mix design. Addressing the limitations of this study, such as specific environmental conditions and the scale of the experimental setup, will be vital in refining the use of BFT in asphalt mix design. Interdisciplinary approaches, including collaboration with material scientists and incorporating nanomaterials, could further enhance binder properties and pavement performance, making BFT a robust criterion for future mix designs.
Data availability statement
The raw data supporting the conclusions of this article will be made available by the authors, without undue reservation.
Author contributions
MAK: Conceptualization, Data curation, Formal Analysis, Investigation, Methodology, Validation, Visualization, Writing–original draft, Writing–review and editing. MSK: Conceptualization, Formal Analysis, Software, Validation, Visualization, Writing–review and editing. BN: Conceptualization, Data curation, Formal Analysis, Investigation, Methodology, Software, Validation, Visualization, Writing–original draft, Writing–review and editing. AK: Data curation, Formal Analysis, Investigation, Visualization, Writing–review and editing, Software. MMSS: Funding acquisition, Validation, Project administration, Resources, Supervision, Writing–review and editing. MA: Formal Analysis, Validation, Resources, Writing–review and editing WQ: Formal Analysis, Project administration, Resources, Validation, Writing–review and editing. RAG-L: Formal Analysis, Validation, Writing–review and editing.
Funding
The author(s) declare that financial support was received for the research and/or publication of this article. This research was supported by a grant from the Russian Science Foundation No. 22-79-10021, https://rscf.ru/project/22-79-10021/.
Conflict of interest
The authors declare that the research was conducted in the absence of any commercial or financial relationships that could be construed as a potential conflict of interest.
Publisher’s note
All claims expressed in this article are solely those of the authors and do not necessarily represent those of their affiliated organizations, or those of the publisher, the editors and the reviewers. Any product that may be evaluated in this article, or claim that may be made by its manufacturer, is not guaranteed or endorsed by the publisher.
References
Aashto, M. P. 2 (2004). Standard specification for Superpave volumetric mix design. Available at: https://www.document-center.com/standards/show/AASHTO-MP2.1
AASHTO, T. 316. (2019). AASHTO t316-standard method of test for viscosity determination of asphalt binder using rotational viscometer. 1–5.
ALDOT-361-88 (2005). Resistance of compacted bituminous mixture,” in Testing manual bureau of materials and tests (Montgomery, AL: Albama Dept. of transportation), 1–5.
Al-Khateeb, G. G. (2018). Conceptualizing the asphalt film thickness to investigate the Superpave VMA criteria. Int. J. Pavement Eng. 19 (11), 957–965. doi:10.1080/10298436.2016.1224414
Al-Khateeb, G. G., and Aroon, S. (2019). Mixture-property-independent asphalt film thickness model. Mater. Today Commun. 19 (November 2017), 482–486. doi:10.1016/j.mtcomm.2017.11.007
ASTM D7369-11. (1860). Standard test method for determining the resilient Modulus of bituminous mixtures by Indirect tension Test1. i:4–5. doi:10.1520/D7369-11.2
ASTM C 127-08 (2008). Standard test method for density, relative density (specific gravity), and absorption of coarse aggregate, 1–7.
ASTM C128/C128M (2001). “Standard test method for density, relative density (specific gravity), and absorption of fine aggregate,” in ASTM International. West Conshohocken, PA: ASTM International, 1–6. Available at: www.astm.org,or.
ASTM D 113-99. (2000). Standard test method for ductility of bituminous materials. 08:13–4. doi:10.1520/C1709-18
ASTM D2041 (2018). “Standard test method for theoretical maximum specific gravity and density of bituminous paving mixtures,” in Designation (West Conshohocken, PA: ASTM International), 778–87. (Reapproved 2004), i:3–5.
ASTM D2726. (2013). “Standard test method for bulk specific gravity and density of non-absorptive compacted asphalt mixtures, 1–3. doi:10.1520/D2726
ASTM D3143/D3143M − 13 (2013). Standard test method for flash point of cutback asphalt with tag open-cup. Astm 05, 1–6. doi:10.1520/D3143
ASTM D36-06 (2008). “Standard test method for softening point of bitumen (Ring-and-Ball apparatus),” in ASTM International. West Conshohocken, Pennsylvania: ASTM International, 50–54. doi:10.1520/mnl10830m
ASTM D4402 (2016). “Standard test method for viscosity determination of asphalt at elevated temperatures using a rotational viscometer,” in ASTM International. West Conshohocken, Pennsylvania: ASTM International 14, 1–5.
ASTM D4791-10. (2010). “Standard test method for flat particles, elongated particles, or flat and elongated particles in coarse aggregate,” 1–6. doi:10.1520/D4791-10.2
ASTM D 6926 (2014). Standard practice for preparation of bituminous specimens using marshall. Annu. Book Am. Soc. Test. Materiasl ASTM Stand. i Sept., 1–6. doi:10.1520/D6926-10.2
ASTM D6931-07. (2022). “Standard test method for Indirect tensile (IDT) strength of bituminous mixtures. 1–4. doi:10.1520/D6931-07.2
ASTM D7460-08. (2010). “Standard test method for determining fatigue failure of compacted asphalt concrete subjected to repeated flexural bending, i:5–7. doi:10.1520/D7460-08.2
Azzam, M. O. J., Al-Ghazawi, Z., and Al-Otoom, A. (2016). Incorporation of Jordanian oil shale in hot mix asphalt. J. Clean. Prod. 112 (November), 2259–2277. doi:10.1016/j.jclepro.2015.10.128
BS 812-112 (1990). Methods for determination of aggregate impact value (AIV), 8. Available at: https://www.en-standard.eu/bs-812-112-1990-testing-aggregates-method-for-determination-of-aggregate-impact-value-aiv/.
Cavalli, M. C., Partl, M. N., and Poulikakos, L. D. (2017). Measuring the binder film residues on black rock in mixtures with high amounts of reclaimed asphalt. J. Clean. Prod. 149 (April), 665–672. doi:10.1016/j.jclepro.2017.02.055
Dhir, R. K., de Brito, J., Lynn, C. J., and Silva, R. V. (2018). “Geotechnics and road pavements,” in Sustainable construction materials, 197–237. doi:10.1016/B978-0-08-100997-0.00006-3
Dhir, R. K., Ghataora, G. S., and Lynn, C. J. (2017). “Epilogue,” in Sustainable construction materials, 261–263. doi:10.1016/B978-0-08-100987-1.00010-X
Elseifi, M. A., Al-Qadi, I. L., Yang, S.-H., and Carpenter, S. H. (2008). Validity of asphalt binder film thickness concept in hot-mix asphalt. Transp. Res. Rec. J. Transp. Res. Board 2057 (1), 37–45. doi:10.3141/2057-05
Ghuzlan, K. A., Al-Mistarehi, B. W., and Al-Momani, A. S. (2020). Rutting performance of asphalt mixtures with gradations designed using bailey and conventional Superpave methods. Constr. Build. Mater. 261, 119941. doi:10.1016/j.conbuildmat.2020.119941
Gu, F., Xie, J., Vuye, C., Wu, Ya, and Zhang, J. (2023). Synthesis of geopolymer using alkaline activation of building-related construction and demolition wastes. J. Clean. Prod. 420 (July), 138335. doi:10.1016/j.jclepro.2023.138335
Gu, F., Zhang, Y., Luo, X., Sahin, H., and Lytton, R. L. (2017). Characterization and prediction of permanent deformation properties of unbound granular materials for pavement ME design. Constr. Build. Mater. 155, 584–592. doi:10.1016/j.conbuildmat.2017.08.116
Harvey, J., Liu, A., Zhou, J., Signore, J. M., Coleri, E., and He, Y. (2015). Superpave implementation phase II: comparison of performance-related test results, no. July 2014.
Jiang, J., Ying, Li, Zhang, Y., and Bahia, H. U. (2022). Distribution of mortar film thickness and its relationship to mixture cracking resistance. Int. J. Pavement Eng. 23 (3), 824–833. doi:10.1080/10298436.2020.1774767
Kandhal, P. S., and Sanjoy, C. (1996). Effect of asphalt film thickness on short- and long-term aging of asphalt paving mixtures. Transp. Res. Rec. J. Transp. Res. Board 1535 (1), 83–90. doi:10.1177/0361198196153500111
Karim, F., Hussain, J., and Hafeez, I. (2021). Estimating the asphalt binder film thickness using scanning electron microscope and energy dispersive X-ray spectroscopy. Adv. Mater. Sci. Eng. 2021, 16. doi:10.1155/2021/8894970
Lin, P., Liu, X., Ren, S., Xu, J., Li, Yi, and Li, M. (2023). Effects of bitumen thickness on the aging behavior of high-content polymer-modified asphalt mixture. Polymers 15 (10), 2325. doi:10.3390/polym15102325
Lu, D., Liang, J., Du, X., Ma, C., and Gao, Z. (2019). Fractional elastoplastic constitutive model for soils based on a novel 3D fractional plastic flow rule. Comput. Geotech. 105, 277–290. doi:10.1016/j.compgeo.2018.10.004
Lv, J., Zhancheng, Xu, Yin, Y., Zhang, J., Sun, X., and Wu, C. (2018). Comparison of asphalt mixtures designed using the marshall and improved GTM methods. Adv. Mater. Sci. Eng. 2018, 1–7. doi:10.1155/2018/7328791
Martinez Soto, F. (2018). Volumetric mix-design optimization of bituminous rubber-mixtures in railway sub-ballast. Int. J. Eng. Sci. and Res. Technol. 7 (1), 483–507. doi:10.5281/ZENODO.1158653
Miranda, H. M. B., Batista, F. A., Neves, J., and Antunes, M. de L. (2021). Influence of the aggregate skeleton matrix and volumetric composition on the resistance of stone mastic asphalt to permanent deformation. Road Mater. Pavement Des. 22 (11), 2538–2551. doi:10.1080/14680629.2020.1773303
Pérez-Jiménez, F., Martínez, A. H., Miró, R., Hernández-Barrera, D., and Araya-Zamorano, L. (2014). Effect of compaction temperature and procedure on the design of asphalt mixtures using marshall and gyratory compactors. Constr. Build. Mater. 65 (August), 264–269. doi:10.1016/j.conbuildmat.2014.04.135
Remišová, E. (2015). Effect of film thickness on resistance to permanent deformation in asphalt mixtures. Baltic J. Road Bridge Eng. 10 (4), 333–339. doi:10.3846/bjrbe.2015.42
Roberts, F. L., Kandhal, P. S., Brown, E. R., Lee, D. Y., and Kennedy, T. W. (1996). Hot mix asphalt materials, mixture design, and construction. Lanham, MD: National Asphalt Pavement Association (NAPA).
Rudenko, O., Galkina, D., Sadenova, M., Beisekenov, N., Kulisz, M., and Begentayev, M. (2024). Modelling the properties of aerated concrete on the basis of raw materials and ash-and-slag wastes using machine learning paradigm. Front. Mater. 11 (October), 1–21. doi:10.3389/fmats.2024.1481871
Sims, I. (2016). The Shell bitumen Handbook. Proc. Institution Civ. Eng. - Constr. Mater. 169, 44. doi:10.1680/jcoma.15.00061
Souza, T. D. de, Enríquez-León, A. J., Mesquita, A. R., Gomes, O. da F. M., Ulsen, C., Underwood, B. S., et al. (2024). Characterization of binder, mastic, and FAM film thickness within asphalt concrete mixtures. Constr. Build. Mater. 421 (March), 135595. doi:10.1016/j.conbuildmat.2024.135595
Sukkari, A., Ghazi, Al K., Ziada, W., and Ezzat, H. (2022). Estimating asphalt film thickness in asphalt mixtures using microscopy to further enhance the performance of UAE roadways. In Advances in road infrastructure and mobility, 87–96. Springer, Cham. doi:10.1007/978-3-030-79801-7_7
Sun, Li, Wang, G., and Zhang, C. (2024). Experimental investigation of a novel high performance multi-walled carbon nano-polyvinylpyrrolidone/silicon-based shear thickening fluid damper. J. Intelligent Material Syst. Struct. 35 (6), 661–672. doi:10.1177/1045389X231222999
Wang, K., Cao, J., Ye, J., Qiu, Z., and Wang, X. (2024). Discrete element analysis of geosynthetic-reinforced pile-supported embankments. Constr. Build. Mater. 449 (April), 138448. doi:10.1016/j.conbuildmat.2024.138448
Keywords: Marshall mix design, Superpave Gyratory Compacted mix design, binder film thickness, optimum binder content, asphalt content
Citation: Khan MA, Khan MS, Nasir B, Khan A, Sabri MMS, Ahmad M, Qamar W and Gonzalez-Lezcano RA (2025) Performance optimization of asphalt pavements using binder film thickness as a criterion in innovative mix design compared to Marshall and Superpave methods. Front. Mater. 11:1488310. doi: 10.3389/fmats.2024.1488310
Received: 29 August 2024; Accepted: 05 December 2024;
Published: 07 January 2025.
Edited by:
Leilei Chen, Southeast University, ChinaReviewed by:
Ping Liu, State Grid Jiangsu Electric Power Co., LTD., ChinaSyahrul Fithry Senin, Universiti Teknologi Teknologi MARA, Cawangan Pulau Pinang, Malaysia
Hasanain Radhi Radeef, University of Technology Malaysia, Malaysia
Qinglin Guo, Hebei University of Engineering, China
Copyright © 2025 Khan, Khan, Nasir, Khan, Sabri, Ahmad, Qamar and Gonzalez-Lezcano. This is an open-access article distributed under the terms of the Creative Commons Attribution License (CC BY). The use, distribution or reproduction in other forums is permitted, provided the original author(s) and the copyright owner(s) are credited and that the original publication in this journal is cited, in accordance with accepted academic practice. No use, distribution or reproduction is permitted which does not comply with these terms.
*Correspondence: Muhammad Salman Khan, c2FsbWFuQHRvbmdqaS5lZHUuY24=; Mahmood Ahmad, YWhtYWRtQHVuaXRlbi5lZHUubXk=
 Muhammad Adeel Khan
 Muhammad Salman Khan
 Bilal Nasir2
 Asad Khan
 Mohanad Muayad Sabri Sabri
 Mahmood Ahmad