- 1Zhejiang College of Security Technology, Wenzhou, China
- 2Wenzhou Darong Textile Instrument Co., Ltd., Wenzhou, China
- 3Zhejiang Institute of Metrology, Hangzhou, China
- 4Collage of Energy Environment and Safety Engineering, China Jiliang University, Hangzhou, China
- 5Zhejiang Light Industrial Products Inspection and Research Institute, Hangzhou, China
Thermal protection performance (TPP) is an important index to evaluate the performance of firefighting clothing. The purpose of this work is to build a model to predict the TPP values of fabrics with fewer variables. Two properties of flame-retardant cotton were tested with TPP values under different air gaps, and the correlations between these properties were also analyzed. A combined model was established by integrating multivariate nonlinear regression model and gradient boosting regression tree model. Then the combined model was compared with these two single models. The results showed that the correlation coefficients between gram weight and thickness of fabric and TPP value were 0.833 and 0.837, respectively, indicating a strong correlation. The correlation coefficient between air gap and TPP value was 0.304, indicating a weak correlation. In predicting the thermal protective performance of flame-retardant cotton, this study employed a multivariate nonlinear regression model, a Gradient Boosting Regression Tree (GBRT) model, and a combined model. After comparing various evaluation metrics, it was finally decided to adopt the combined model for predicting the thermal protective performance values of flame-retardant cotton. This method improved the prediction accuracy of thermal protective performance, facilitating the promotion and application of the combined model. Furthermore, when exploring the thermal protective performance of flame-retardant cotton, the use of fewer variables to establish the prediction model can not only significantly simplify the complex structure of the model but also greatly enhance the analysis efficiency, ensuring the efficiency and precision of the research process.
1 Introduction
Firefighters frequently work in high temperatures while performing their duties and are subject to a variety of thermal hazards, such as flash fires, intense thermal radiation, hot gases, hot objects, hot liquid splashes and hot steam, etc. The heat flux can be as high as 200 kW/m2 (Su et al., 2016; Udayraj et al., 2017). Therefore, fire protection clothing must have good flame retardant, heat insulation and heat stability (Xu et al., 2020).
TPP experiment and burning dummy experiment are two commonly used methods to evaluate the thermal protection performance (TPP) at present. TPP experiment is simple and low cost, but it is limited to measure the TPP of small fabric samples. The burning dummy experiment can simulate the second and third degree of human burns and their distribution to evaluate the TPP of clothing, but it has high technical requirements, high cost and complex operation (Li et al., 2015).
Factors influencing the thermal protective performance of fabrics include weight per unit area, thickness, air permeability, and air gap. Li et al. (2008) conducted TPP experiments with 13 fabrics that can be used for the outer layer of firefighting suits and found that there was a linear positive correlation between fabric thickness, areal density, and thermal protective performance, with thickness having a more significant impact on thermal protective performance. Liu et al. (2018) tested the thermal protective performance of different fabrics and found a positive correlation between areal density, thickness, and TPP values. Zong et al. (2009) compared and studied materials such as aramid, polysulfonamide, and flame-retardant cotton fabrics for outer layers and found that the thermal protective performance of various fabrics increased with their areal density and thickness. Based on previous research, it can be concluded that there was a positive correlation between fabric thickness, weight per unit area, and thermal protective performance, and that the thermal protective performance of fabrics increased with increasing thickness and weight per unit area (Yang et al., 2014).
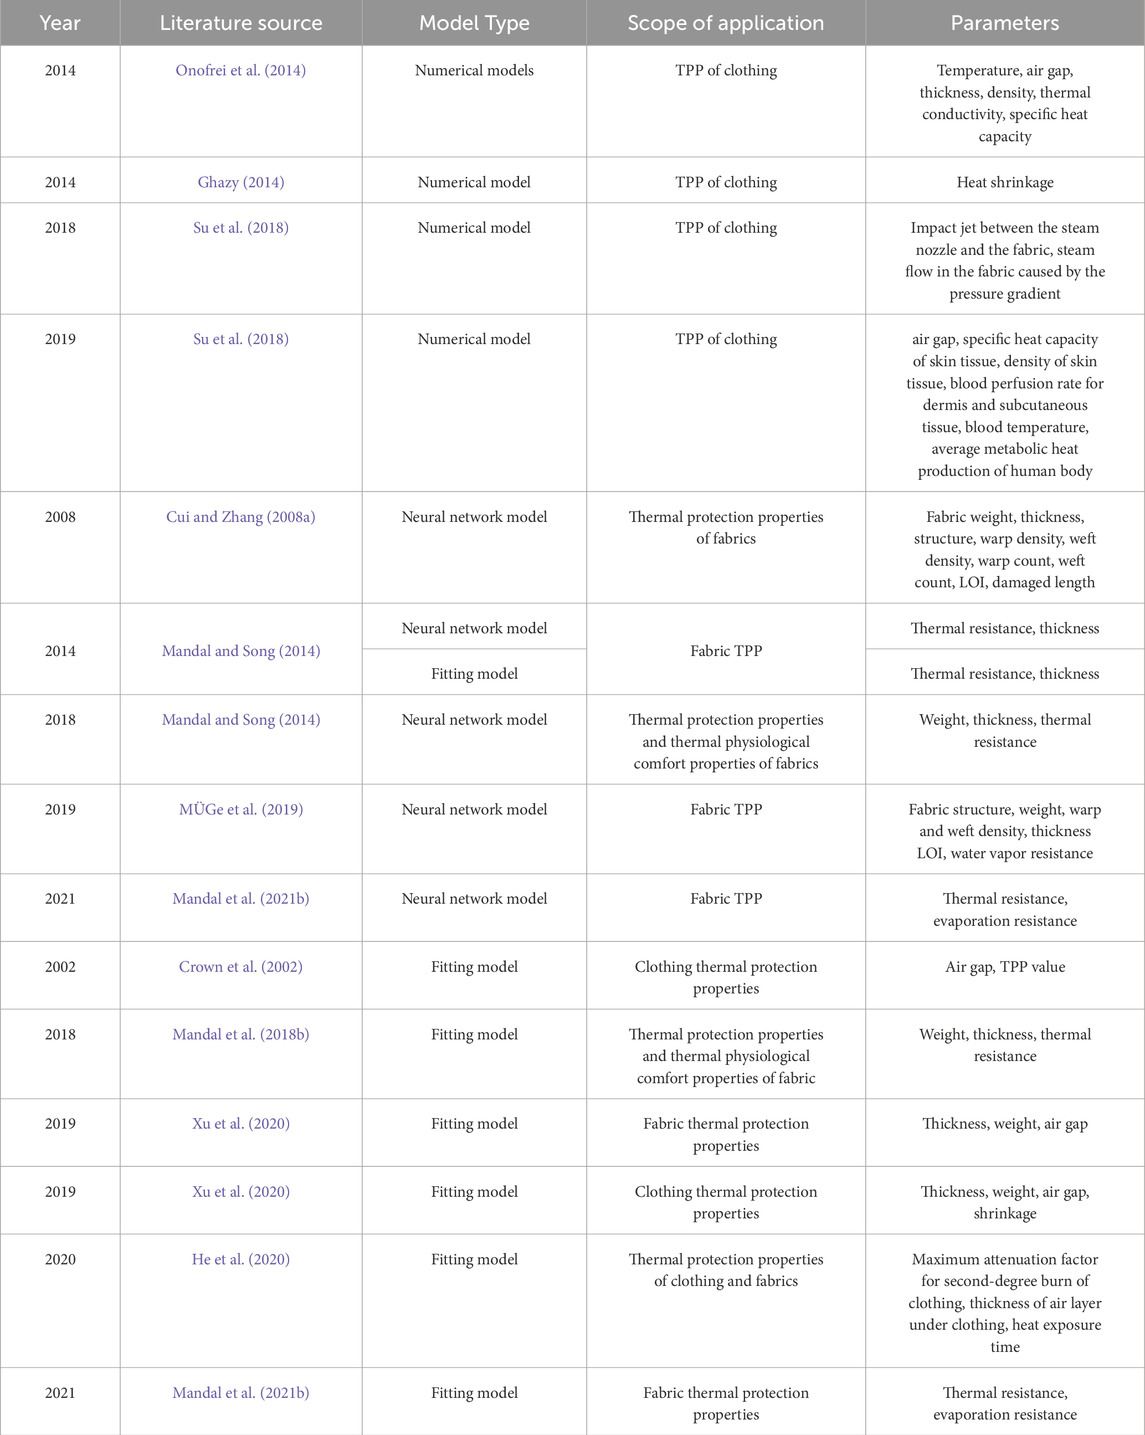
Most of the studies that have been carried out to predict the TPP of fabrics through properties of fabrics. Table 1 lists the various prediction models for TPP, which can be categorized as numerical model, neural network model and fitted model. As can be seen from Table 1, (Onofrei et al., 2014; Ghazy, 2014; Su et al., 2018) established numerical models for predicting the TPP of clothing. Although the numerical model had a high accuracy, there were many difficulties to measure the parameters (including impact jet between the steam nozzle and the fabric, blood perfusion rate between the dermis and subcutaneous tissue, etc.). Cui Z. and Zhang W. (2008), (Mandal and Song, 2014; Mandal et al., 2018a; Mandal et al., 2021a; MÜGe et al., 2019) established neural network models that can predict the TPP of fabrics, while (Mandal et al., 2018a) also established a model to predict the thermal physiological comfort performance. However, the accuracy of machine learning is contingent upon the sample size, with higher numbers of samples yielding greater precision. Besides, (Mandal et al., 2021b; Xu et al., 2020; He et al., 2020) built fitting models to predict the TPP of fabrics. Crown et al. (2002), Xu et al. (2020), He et al. (2020) established fitting models to predict the TPP of clothings. Furthermore, most of the above scholars predicted the TPP of fabrics and garments through gram weight, thickness, air gap, thermal resistance, etc. Bates and Granger first proposed the system of combinatorial prediction theory, which combined different prediction models to reduce the prediction errors caused by parameters or models (Andrawis et al., 2011).
Investigating the performance of flame-retardant cotton is of great importance in improving product quality and meeting market demands. Studying the TPP of flame-retardant cotton is not only in line with current trends in environmental protection and sustainable development, but also contributes to the advancement of green and safe protective materials. In order to improve the prediction accuracy, this work used a combined model that integrating the strengths of multivariate nonlinear regression and gradient boosting regression trees to more effectively capture nonlinear relationships and multidimensional features in complex data.
2 Materials and methods
2.1 Flame-retardant cotton fabric
Cotton fabrics are favored by people due to their good moisture absorption, breathability, skin-friendliness, and comfortable wearing experience. However, cotton fibers have a limited oxygen index of only 17%–19%, making them flammable and highly combustible, which limits the application range of cotton fabrics. Therefore, it is extremely necessary to conduct flame-retardant finishing on cotton fabrics (Yang et al., 2012).
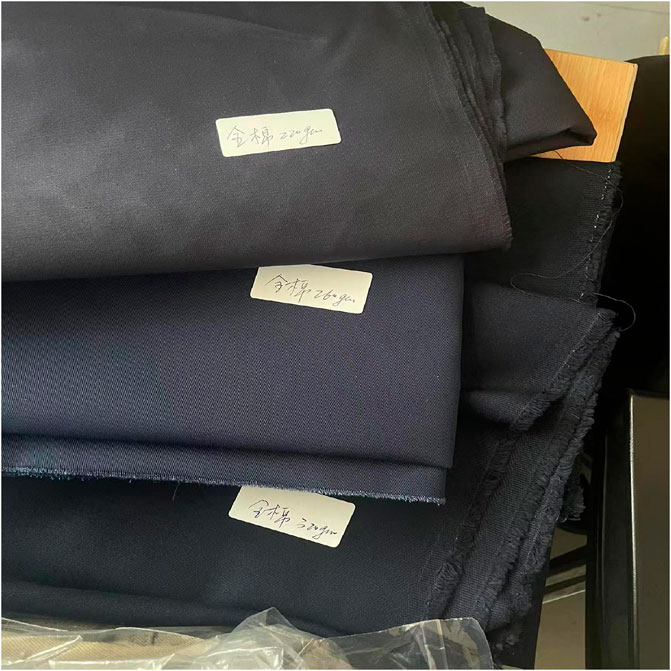
Flame-retardant cotton is a type of new fire-resistant material made by adding flame retardants or using flame-retardant modification technology to 100% cotton fabric (Jin et al., 2020). It is a type of fabric that is difficult to ignite, and once removed from the source of ignition, it will automatically extinguish and not reignite. It belongs to the category of post-finishing flame-retardant fabrics. The principle behind its flame-retardant properties is that when the flame retardant encounters high temperatures or heat, it rapidly generates gases that hinder the combustion process, reducing the released thermal energy and preventing the combustion from continuing, thereby actively contributing to the flame retardancy of the fabric (Yang et al., 2012). The sample diagram of flame-retardant cotton fabric is shown in Figure 1.
Flame-retardant cotton materials have found widespread applications in various fields such as industrial safety, personal protective clothing, thermal insulation in transportation, and household textiles due to their superior fire-retardant and thermal insulation properties. They not only significantly enhance safety but also improve the comfort of use (Yang, 2015). With the continuous increase in safety requirements from all sectors of society, the application prospects of flame-retardant cotton materials are exhibiting even broader development opportunities.
Fire-fighting clothing follows the standards of “Firefighter’s Protective Clothing for Fire Fighting”, consisting of four layers: flame-retardant outer layer, waterproof and breathable layer, thermal insulation layer, and comfort layer. Each layer performs specific functions of flame retardancy and high-temperature resistance, waterproofness and breathability, thermal insulation, and comfort, collectively enhancing thermal protective performance (Zhou, 2021). In this study, the flame-retardant cotton fabric was used as the outer layer of fire-fighting clothing to effectively exert its flame-retardant properties.
2.2 Fabric TPP experiment
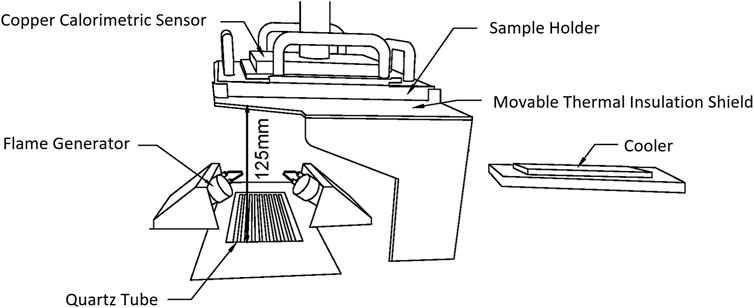
The TPP test is currently the most commonly used test method to measure the thermal protection properties of fabrics. In this work, a thermal protection performance tester (model type: DR255) was used to measure TPP value of flame-retardant cotton fabrics. The experiments were carried out according to the Protective clothing—Thermal protective performance test method (Textile Protection and Comfort Center, 2019). During the experiment, the total heat flux was set to 84 kW/m2, and the sample size was 150 mm × 150 mm. The TPP value is the total heat flux multiplied by the time to cause second degree burn, and the higher the TPP value, the better the TPP values (Shalev and Barker, 1984; Stoll and Chianta, 1968). Figure 2 shows the schematic diagram of the TPP experimental device.
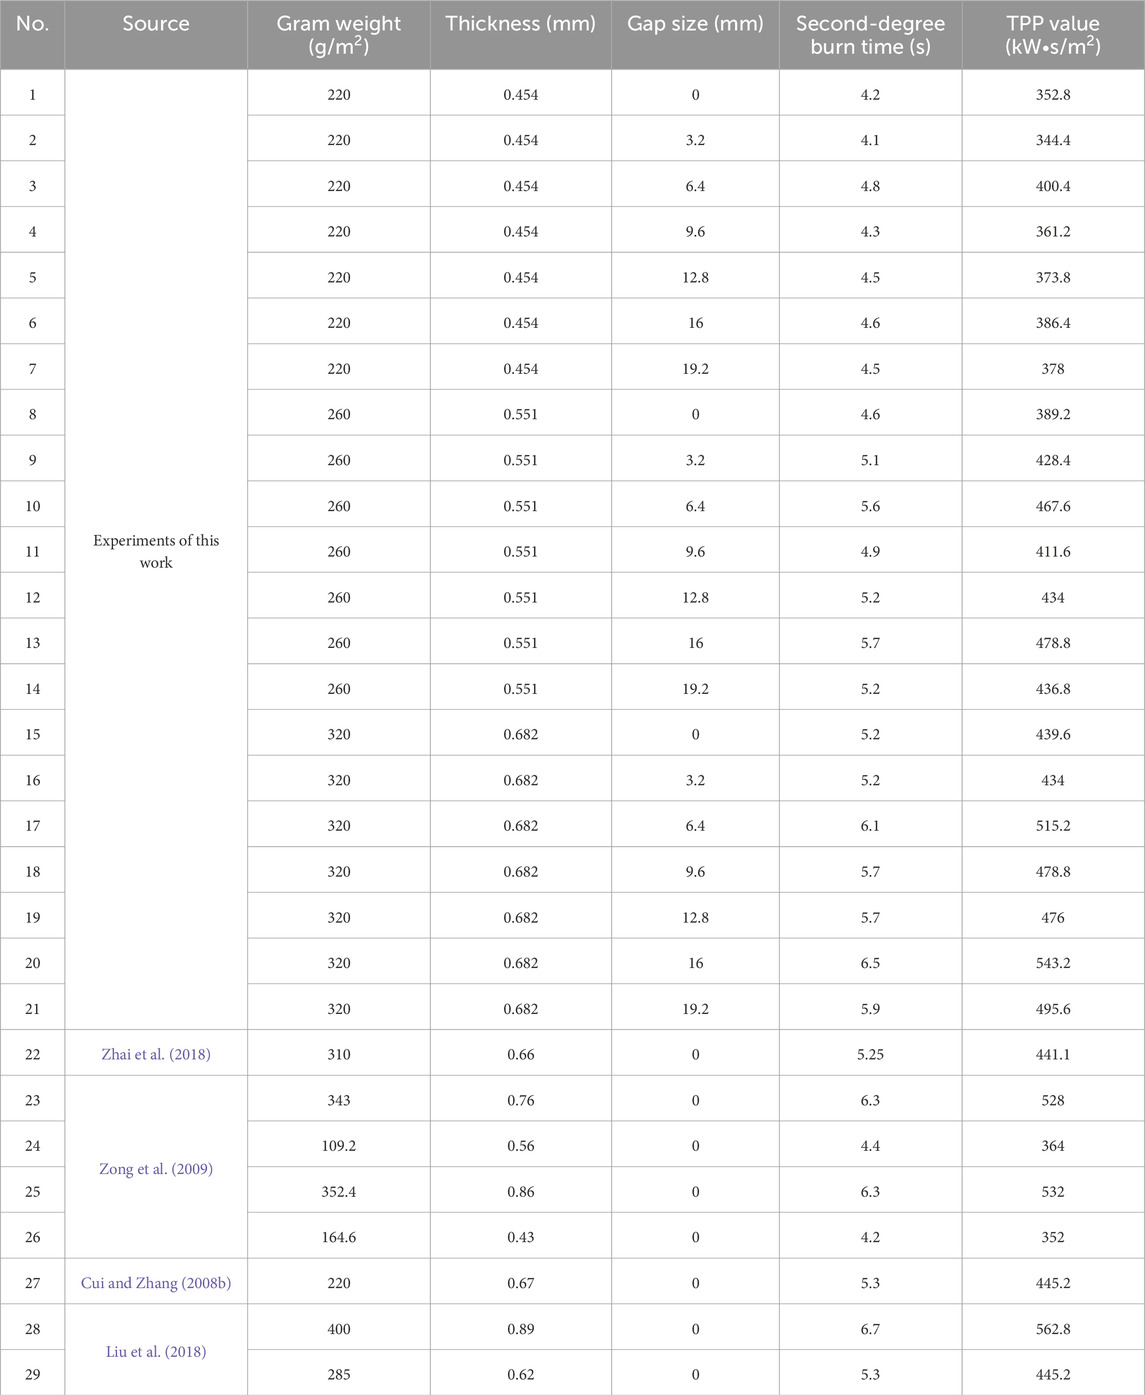
According to previous studies, convective heat transfer begins to occur when the air gap exceeds 6.4 mm in the TPP tests (Deng et al., 2018). Therefore, in this experiment, spacers of 3.2 mm and 6.4 mm were made to create different air gap layer thicknesses to measure the thermal protection properties of the fabrics. Table 2 shows the performance of fabrics and TPP experimental results.
The samples used in the experimental results presented in this study, as well as those from the experiments conducted by other researchers, were all flame-retardant cotton materials. The key differences lie in the weight, thickness, and air gaps of the experimental samples. The purpose of selecting these samples was to expand the data set in order to improve the accuracy of the gradient boosting regression tree (GBRT).
3 Results and discussion
3.1 Correlation analysis between fabric properties and TPP value
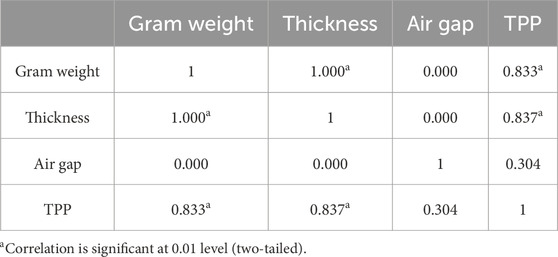
From the previous studies, it is known that the prediction of fabric’s thermal protective performance involves factors such as gram weight, thickness, air gap, and thermal resistance. In this experiment, gram weight, thickness, and air gap were used to predict the TPP value. The Pearson correlation analysis method was employed to analyze the correlation between fabric’s gram weight, thickness, air gap, and thermal protective performance (TPP). The calculation formula of correlation coefficient is shown in Formula 1: (Zhou et al., 2023):
where r is the correlation coefficient. The calculated results are shown in Table 3. The correlation coefficients between gram weight and thickness of fabric and TPP value were 0.833 and 0.837 respectively, both greater than 0.8, indicating that gram weight, thickness and TPP value had high linear correlations. The r between air gap and TPP value was 0.304, indicating that there was a weak linear correlation between air gap and TPP value. Meanwhile, gram weight, air gap and thickness were positively correlated with the TPP value, indicating that the TPP value would increase with the increase of these variables. Correlation analysis of each variable showed that the r between gram weight and thickness was 1 and that there was a perfect positive linear correlation.
3.2 Regression analysis and prediction model
3.2.1 Influence of air gap on TPP
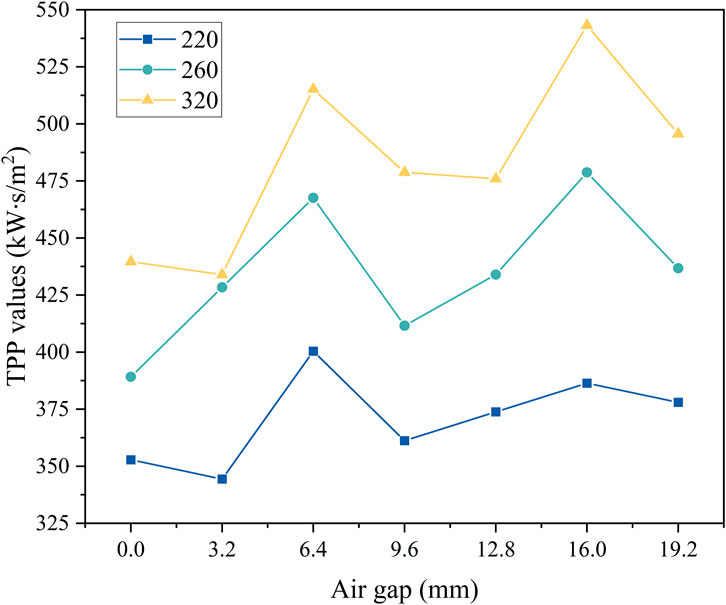
Figure 3 shows the TPP values of flame-retardant cotton with different air gaps. It was evident that the TPP values with various weights decreased when the air gap was 9.6 mm. This is because the air’s ability to act as a thermal insulation is weakened when the air gap is more than 6.4 mm (Deng et al., 2018; Talukdar et al., 2010; Torvi et al., 1999). As the air gap continued to increase, the heat decreased, and the thermal protective performance increased (Deng et al., 2018). Subsequently, as the air gap continued to increase up to 16.0 mm, the TPP gradually improved. With the further increase of air gap, a large amount of smoke and tar were found to be produced. A significant amount of hot gas, hot tar, smoke, etc. was released when the flame-retardant cotton came into contact with the heat source and the flame-retardant gas and flame retardant in the fabric were exhausted (Zong et al., 2009). Therefore, the thermal protective performance decreased when the air gap was 19.2 mm.
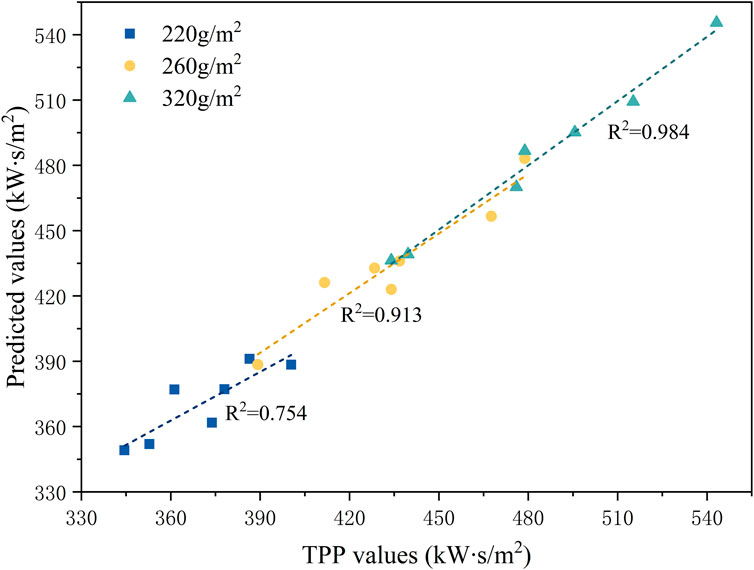
Correlation analysis showed that the r between TPP values and air gaps was 0.304, indicating that there might be a nonlinear relationship between them. In this experiment, with the increase of air gap, the TPP first increased and decreased, and then increased and decreased again. The TPP values of fabrics with gram weight of 220 g/m2, 260 g/m2 and 320 g/m2 under different air gaps were fitted by polynomial. Formula 2 is the TPP fitting equation for fabrics with a weight of 220 g/m2, Formula 3 is for 260 g/m2, and Formula 4 is for 320 g/m2:
where x1 is the air gap, z1 is the TPP value with a gram weight of 220 g/m2, z2 is the TPP value of 260 g/m2, and z3 is the TPP value of 320 g/m2.
Figure 4 shows the comparison between the measured TPP values and the predicted TPP values of the above three models. It can be seen from the figure, the R2 of the three models were 0.754, 0.913, and 0.984, respectively. Therefore, these three models can respectively predict the TPP value of flame-retardant cotton of 220 g/m2, 260 g/m2 and 320 g/m2 in the air gap between 0 and 19.2 mm.
3.2.2 Multivariate nonlinear regression
Through the above analysis and previous studies, it can be seen that there was a high linear correlation between gram weight and thickness and TPP (Mandal and Song, 2014; Sawcyn and Torvi, 2009; Torvi and Dale, 1999). Hence, a model can be established to relate TPP to weight, thickness, and air gap, as shown in Formula 5:
where x1 is the air gap (mm), x2 is the thickness (mm) and x3 is the gram weight (g/m2). Substituting data from Table 1 into model (5), yielded a = −0.005, b = 0.234, c = −3.769, d = 24.029, e = −45.119, f = 0.193, g = 402.12, h = 127.694.
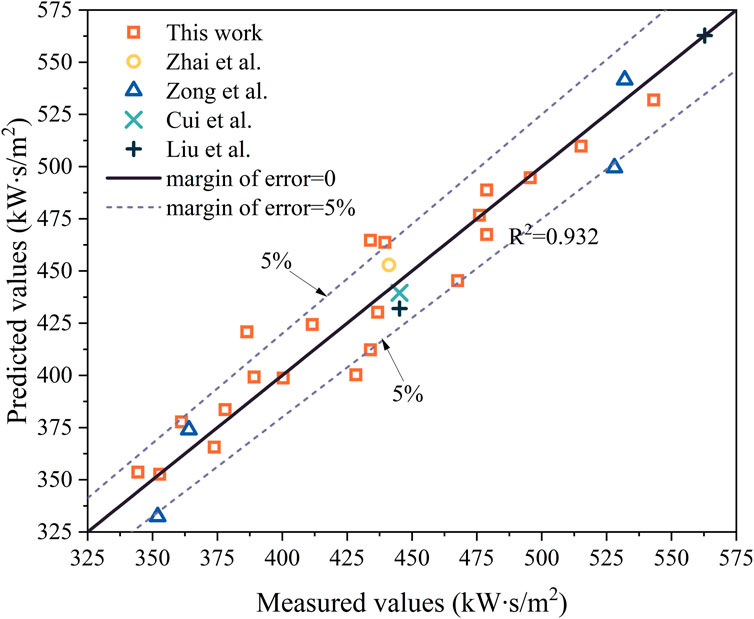
Figure 5 shows the comparison between the measured values and the predicted values of the multivariate nonlinear regression model. It can be seen from the figure that most of the relative errors between the predicted values and the measured values were less than 5%, and the model had a good fitting effect (R2 was 0.932). Therefore, model (5) can predict the TPP value of flame-retardant cotton between 0 and 19.2 mm.
3.3 Gradient boosting regression tree (GBRT)
Gradient boosting regression tree is a type of ensemble learning algorithm, whose core lies in that each tree learns from the residuals of all previous trees, uses the negative gradient value of the loss function in the current model as an approximation of the residuals in the progressive tree algorithm, and then fits a regression tree (Friedman, 2001).
Gram weight, thickness and air gap were set as input parameters and TPP value was set as output parameter. 70% of the data was randomly chosen for training of the model, 15% of the data was for validated, and the remaining 15% was for tested. When the model parameters were set as default, the training set R2 was 0.999 and the test set R2 was 0.862, and overfitting occurred. The parameters known to have great influence on the accuracy of GBRT model are maximum depth of regression tree (max_depth), maximum number of iterations (n_estimators), subsample and learning rate (Song, 2019).
Due to the small number of data set samples, the single random chance results in too small data for model training, and it is impossible to obtain data information comprehensively (Liu et al., 2021). Cross-validation is often used when data sets are small. The principle of K-fold cross-validation was used to divide the whole data sample set into K groups, taking the K-1 group in the data set as the training set in turns, and the remaining 1 group as the test set. A corresponding score will be obtained for each model training, and the average score value will be calculated as the model evaluation standard (Arlot and Celisse, 2010).
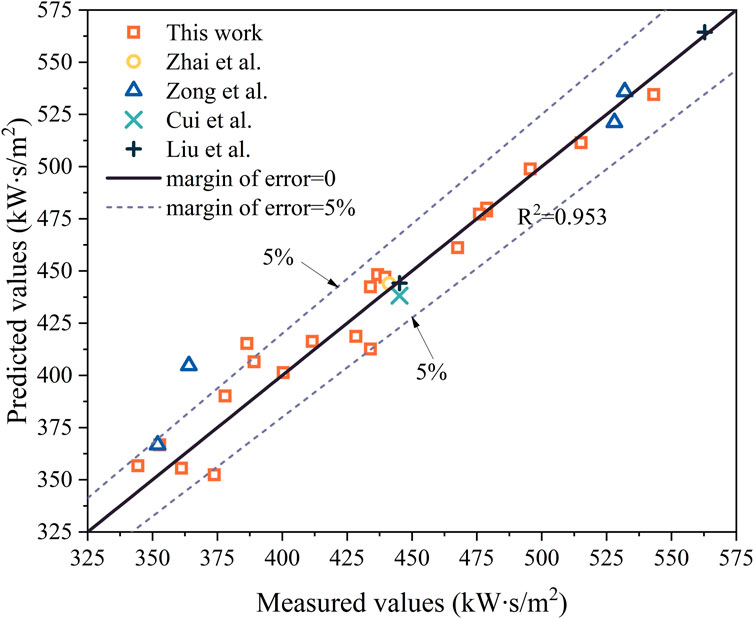
In order to avoid overfitting and the appearance of local optimal solutions, random search was first used to narrow the search scope, and grid search and cross-validation were then used to automatically find the optimal of hyperparameters. After adjustment, max_depth = 16, n_estimators = 220 and subsample = 0.2 were set finally. The training set R2 as 0.983 and the test set R2 as 0.931. Figure 6 shows the comparison of the predicted and measured GBRT values. The figure shows that the model fitted well (R2 = 0.953). The average relative error between predicted values and measured values was less than 5%, and only three predicted values had relative error greater than 5%.
3.4 Combined model
3.4.1 Establishment of combined model
Model combination is a method of weighting the prediction results of different models according to a certain proportion to obtain a brand-new prediction data that combining all the results (Wu et al., 2022). It improves the accuracy of multi-step prediction by combining several models with different domains and high variability to achieve complementary prediction results. In Section 2.2 and 2.3, a multivariate nonlinear regression model as well as a gradient boosting regression tree model were developed to predict the TPP of fabrics, respectively. In order to improve the accuracy of the prediction results, a combined model was used to predict the TPP, and the model can be expressed as shown in Formula 6:
where z6 is the predicted TPP value obtained by the combined model, z4 is the predicted value obtained by the multivariate nonlinear regression model, z5 is the predicted value obtained by the gradient boosting regression tree, w1 and w2 are the weights of the multivariate nonlinear regression model and the gradient boosting regression tree in the combined model respectively.
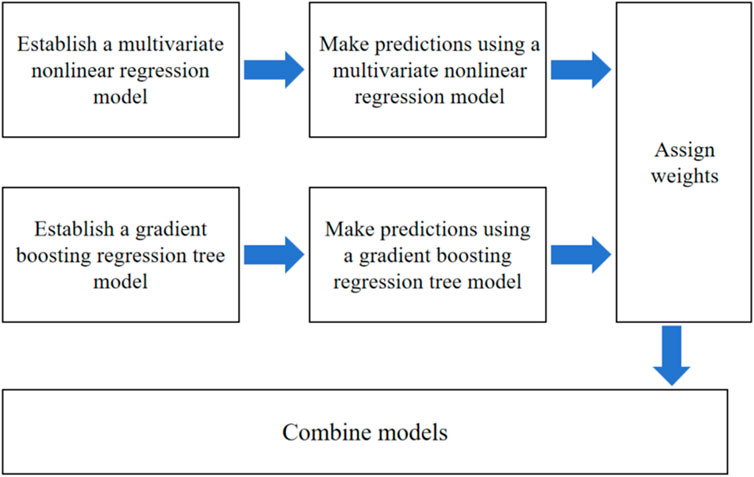
Figure 7 shows the establishment process of the weighted combined model. Firstly, multivariate nonlinear regression and gradient boosting regression tree were used to build the prediction models. Secondly, weights were assigned to these two single models. Finally, a combined model was established.
3.4.2 Determination of weight coefficients
The key to the combined model is to determine the weight coefficient in the model. In this work, the inverse variance method was used for weight assignment. The formula of the inverse variance method is as follows:
where Si is the variance of a single model. S1 and S2 are the variances of the prediction results of the multivariate nonlinear regression model and GBRT respectively. Here, S1 was 5079.7 and S2 was 7355.6 after calculation. By substituting S1 and S2 into Formula 7, w1 was 0.41 and w2 was 0.59. So the weighted combined model was shown in Formula 8.
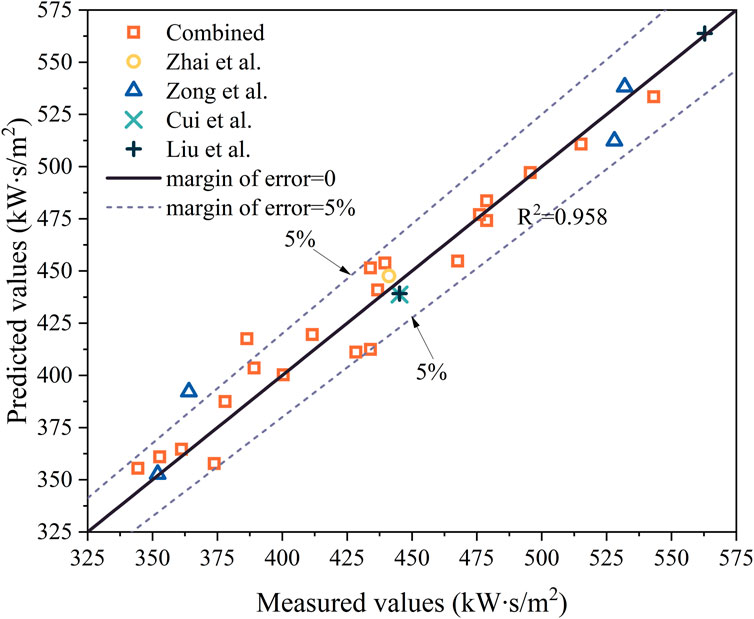
Figure 8 shows a comparison of the predicted values from the combined model and the actual measured values, R2 value of 0.958, indicating a good fit.
3.5 Model evaluation
In this analysis, root mean square error (RMSE), mean relative error (MRE) and determination coefficient R2 were used to evaluate the models. The RMSE can directly quantify the prediction error (LeCun et al., 2015). The formulas for root mean square error (RMSE), mean relative error (MRE), and R2 are shown in Formulas 9–11:
where zk is the measured value, zi is the predicted value, n is the total number of the measured values, and
Table 4 shows the values of these three evaluation indexes. Judging from the R2, the fitting effect of the combined model was optimal (R2 = 0.958). According to MRE, the average relative error of the combined model was the smallest. Compared with the RMSE, it can be seen that the root-mean-square error of the combined model was smallest. According to all these evaluation indexes, the combined model was optimal in predicting the TPP of flame-retardant cotton.
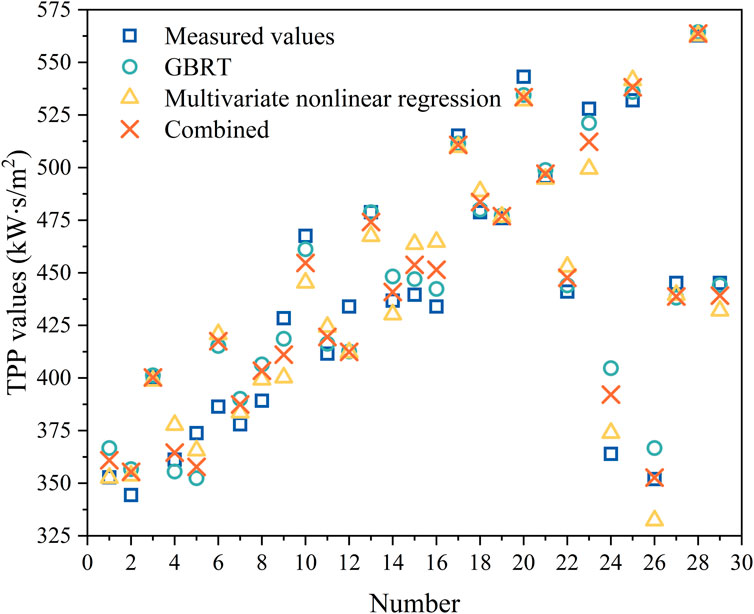
Figure 9 shows the comparison between the measured TPP and the predicted results of the three models. It can be seen that both of the two single models predicted the TPP relatively well. However, the multivariate nonlinear regression model was better than the GBRT in some prediction results, while the latter model was better in other prediction results. Comparing the combined model with the single models, it can be seen that the combined model took the advantages of the multivariate nonlinear regression model and the GBRT model. Hence, the prediction results of the combined model were better than these of the single models on the whole.
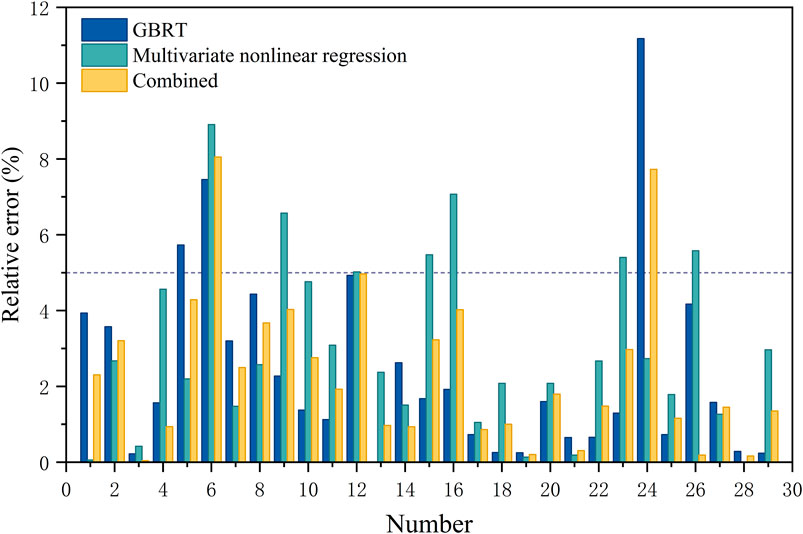
Figure 10 shows the relative errors of the prediction results of the three models. It can be seen that the relative errors of the multivariate nonlinear regression model and the combined model were all less than 9%, and the average relative errors were 2.99% and 2.36% respectively. Most of the relative errors of the GBRT were less than 9%, and its average relative error was 2.40%. However, some of the relative errors between the measured value and the predicted value of the GBRT was greater than 10%, and the accuracy of some predicted results was not high. Compared with the average relative error of the three prediction models, the combined model had a best prediction effect.
On the whole, the GBRT model and the combined model were good in predicting TPP values. However, according to the above analysis, the GBRT prediction results included a predicted value with a relative error of up to 11.18%. According to the root-mean-square error formula, the RMS error is more sensitive to outliers than the mean absolute error. Compared with the RMS errors of the three models, the combined model had a smallest error. When predicting the TPP of flame-retardant cotton, it is necessary to ensure that the relative errors between the predicted values and the measured values are small in addition to ensuring that the overall accuracy is high. According to the model evaluation indexes, the fitting effect of the combined model was best and the error was smallest. Therefore, model (8) can predict the TPP of flame-retardant cotton with air gap between 0 and 19.2 mm. The combined model was conducive to application.
4 Conclusion
This work analyzed the correlations between gram weight, thickness, air gap, and thermal protection performance (TPP). Multivariate nonlinear regression model, gradient boosting regression tree model and combined model were established and compared. The following conclusions were drawn:
(1) There were strong linear correlations between gram weight, thickness, and TPP value, as indicated by the correlation coefficients between these three variables being larger than 0.8. There was a slight linear correlation between the TPP value and air gap, as indicated by the correlation coefficient of 0.304.
(2) In the multivariate nonlinear regression model and GBRT model, most of the relative errors between the predicted values and the measured values were less than 5%.
(3) The inverse variance method was used to construct a combined model for predicting the TPP value. The R2, MRE and RMSE of the combined model were superior to single models, By integrating the strengths of both models, the combined model enhanced the prediction accuracy of thermal protective performance, facilitating a wider application.
(4) In investigating the thermal protective performance of flame-retardant cotton, this study utilized a limited number of variables to establish the prediction model. This approach significantly streamlined the model’s complexity while dramatically improving analysis efficiency, ensuring both efficiency and precision.
However, there were certain limitations in the exploration of flame-retardant cotton fabrics in this work. The methodology presented was specifically tailored for flame-retardant cotton fabrics and has not been validated for other types of fabrics. Future research could explore the applicability of this approach by incorporating data from additional fabric types.
Data availability statement
The original contributions presented in the study are included in the article/supplementary material, further inquiries can be directed to the corresponding author.
Author contributions
SZ: Conceptualization, Methodology, Writing–original draft. KM: Funding acquisition, Project administration, Resources, Writing–original draft. LW: Software, Validation, Visualization, Writing–review and editing. ZZ: Data curation, Methodology, Writing–original draft. XY: Conceptualization, Investigation, Resources, Writing–review and editing. JZ: Data curation, Methodology, Resources, Writing–original draft. HL: Conceptualization, Supervision, Writing–review and editing.
Funding
The author(s) declare that financial support was received for the research, authorship, and/or publication of this article. This research was funded by Basic Scientific Research Fund of Zhejiang Province (No. 2022YW18), Eyas Program Incubation Project of Zhejiang Provincial Administration for Market Regulation (No. CY2022003), Horizontal Research Project of Zhejiang College of Security Technology (HX2023025), and NQI Project of Zhejiang Provincial Administration for Market Regulation (2021012).
Conflict of interest
Authors KM and JZ were employed by Wenzhou Darong Textile Instrument Co., Ltd.
The remaining authors declare that the research was conducted in the absence of any commercial or financial relationships that could be construed as a potential conflict of interest.
Publisher’s note
All claims expressed in this article are solely those of the authors and do not necessarily represent those of their affiliated organizations, or those of the publisher, the editors and the reviewers. Any product that may be evaluated in this article, or claim that may be made by its manufacturer, is not guaranteed or endorsed by the publisher.
References
Andrawis, R., Atiya, A. F., and El-Shishiny, H. (2011). Combination of long term and short term forecasts, with application to tourism demand forecasting. Int. J. Forecast. 27, 870–886. doi:10.1016/j.ijforecast.2010.05.019
Arlot, S., and Celisse, A. (2010). A survey of cross-validation procedures for model selection. Stat. Surv. 4. doi:10.1214/09-ss054
Crown, E. M., Dale, J. D., and Bitner, E. (2002). A comparative analysis of protocols for measuring heat transmission through flame resistant materials: capturing the effects of thermal shrinkage. Fire Mater. 26, 207–213. doi:10.1002/fam.797
Cui, Z., and Zhang, W. (2008a). An adaptive neural network system for prediction of thermal protective performance of fabrics. 3rd Int. Conf. Intelligent Syst. Knowl. Eng. 1, 837–841. doi:10.1109/ISKE.2008.4731045
Cui, Z. Y., and Zhang, W. Y. (2008b). Thermal protective performance of heat and flame resistantfabrics in flame exposure. J. Text. Res., 56–58+66. [In Chinese]. doi:10.13475/j.fzxb.2008.09.015
Deng, M., Wang, Y., and Li, P. (2018). Effect of air gaps characteristics on thermal protective performance of firefighters’ clothing. Int. J. Cloth. Sci. Technol. 30, 246–267. doi:10.1108/ijcst-07-2017-0103
Friedman, J. H. (2001). Greedy function approximation: a gradient boosting machine. Ann. Statistics 29, 1189–1232. doi:10.1214/aos/1013203451
Ghazy, A. (2014). Influence of thermal shrinkage on protective clothing performance during fire exposure: numerical investigation. Mech. Eng. Res. 4. doi:10.5539/mer.v4n2p1
He, J. Z., Xue, X. Y., Wang, M., and Li, J. (2020). Predicting thermal protective performance of clothing based on maximum attenuation factor model. J. Text. Res. 41, 112–117. [In Chinese]. doi:10.13475/j.fzxb.20191100106
Jin, Y. P., Wang, Z. Y., Zhu, H., and Cai, Y. (2020). Study on relationships between the structure and performance of flame retardant cotton fabrics. Tech. Text. 38, 15–21. [In Chinese].
LeCun, Y., Bengio, Y., and Hinton, G. (2015). Deep learning. Nature 521, 436–444. doi:10.1038/nature14539
Li, H. Y., Wu, X. R., and Zhang, W. Y. (2008). Relationships between thermal protective performance and properties of fabrics. J. Text. Res., 59–61+71. [In Chinese]. doi:10.13475/j.fzxb.2008.09.016
Li, X. H., Guan, M. H., and Li, J. (2015). Evaluation on thermal protective performance of fabric for firefighter protective clothing. J. Text. Res. 36, 110–115. [In Chinese]. doi:10.13475/j.fzxb.20141101106
Liu, L. Y., Jin, Y. P., and Ni, P. (2018). Relationship between thermal protective performance and physical properties of flame resistant fabric. Wool Text. J. 46, 84–87. [In Chinese]. doi:10.19333/j.mfkj.2017110391004
Liu, X., Tian, M., Su, Y., Wang, Y., and Li, J. (2021). Predicting the mechanical strength of fire protective fabrics after thermal aging using machine learning. AATCC J. Res. 8, 46–50. doi:10.14504/ajr.8.S2.9
Mandal, S., Annaheim, S., Camenzind, M., and Rossi, R. M. (2018b). Characterization and modelling of thermal protective performance of fabrics under different levels of radiant-heat exposures. J. Industrial Text. 48, 1184–1205. doi:10.1177/1528083718760801
Mandal, S., Annaheim, S., Greve, J., Camenzind, M., and Rossi, R. M. (2018a). Modeling for predicting the thermal protective and thermo-physiological comfort performance of fabrics used in firefighters' clothing. Text. Res. J. 89, 2836–2849. doi:10.1177/0040517518803779
Mandal, S., Mazumder, N. U., Agnew, R. J., Song, G., and Li, R. (2021a). Characterization and modeling of thermal protective and thermo-physiological comfort performance of polymeric textile materials-A review. Mater. (Basel) 14, 2397. doi:10.3390/ma14092397
Mandal, S., and Song, G. (2014). An empirical analysis of thermal protective performance of fabrics used in protective clothing. Ann. Occup. Hyg. 58, 1065–1077. doi:10.1093/annhyg/meu052
Mandal, S., Song, G., Rossi, R. M., and Grover, I. B. (2021b). Characterization and modeling of thermal protective fabrics under Molotov cocktail exposure. J. Industrial Text. 51, 1150S–1174S. doi:10.1177/1528083720984973
Müge, D., Yavuz, Ş., Ender Yazgan, B., and Taner, A. (2019). Neural network based thermal protective performance prediction of three-layered fabrics for firefighter clothing. Ind. Textila 70, 57–64. doi:10.35530/it.070.01.1527
Onofrei, E., Petrusic, S., Bedek, G., Dupont, D., Soulat, D., and Codau, T.-C. (2014). Study of heat transfer through multilayer protective clothing at low-level thermal radiation. J. Industrial Text. 45, 222–238. doi:10.1177/1528083714529805
Sawcyn, C. M. J., and Torvi, D. A. (2009). Improving heat transfer models of air gaps in bench top tests of thermal protective fabrics. Text. Res. J. 79, 632–644. doi:10.1177/0040517508093415
Shalev, I., and Barker, R. L. (1984). Protective fabrics: a comparison of laboratory methods for evaluating thermal protective performance in convective/radiant exposures. Text. Res. J. 54, 648–654. doi:10.1177/004051758405401003
Song, X. Q. (2019). Study on localization algorithm for coal mine based on gradient boosting regression tree. Master's Thesis. Shandong, China: Shandong University of Science and Technology. [In Chinese].
Stoll, A. M., and Chianta, M. A. (1968). Method and rating system for evaluation of thermal protection. Aerosp. Med. 40 (11), 1232–1238. doi:10.1080/00018736900101367
Su, Y., Li, R., Song, G., Li, J., and Xiang, C. (2018). Modeling steam heat transfer in thermal protective clothing under hot steam exposure. Int. J. Heat Mass Transf. 120, 818–829. doi:10.1016/j.ijheatmasstransfer.2017.12.074
Su, Y., Wang, Y., and Li, J. (2016). Evaluation method for thermal protection of firefighters’ clothing in high-temperature and high-humidity condition: a review. Int. J. Cloth. Sci. Technol. 28, 429–448. doi:10.1108/ijcst-10-2015-0107
Talukdar, P., Torvi, D. A., Simonson, C. J., and Sawcyn, C. M. J. (2010). Coupled CFD and radiation simulation of air gaps in bench top protective fabric tests. Int. J. Heat Mass Transf. 53, 526–539. doi:10.1016/j.ijheatmasstransfer.2009.04.041
Textile Protection and Comfort Center (2019). Protective clothing - thermal protective performance test method. Beijing, China: Ministry of Emergency Management of the People's Republic of China. GB/T 38302-2019.
Torvi, D. A., and Dale, J. D. (1999). Heat transfer in thin fibrous materials under high heat flux. Fire Technol. 35, 210–231. doi:10.1023/A:1015484426361
Torvi, D. A., Dale, J. D., and Faulkner, B. (1999). Influence of air gaps on bench-top test results of flame resistant fabrics. J. Fire Prot. Eng. 10, 1–12. doi:10.1177/104239159901000101
Udayraj, , Talukdar, P., Das, A., and Alagirusamy, R. (2017). Numerical modeling of heat transfer and fluid motion in air gap between clothing and human body: effect of air gap orientation and body movement. Int. J. Heat Mass Transf. 108, 271–291. doi:10.1016/j.ijheatmasstransfer.2016.12.016
Wu, Y. P., Li, H. Y., Li, T., and Liu, H. Y. (2022). A multi-model based combination prediction and analysis of logistics demand: taking wuhan as example. Logist. Technol. 41, 60–63. [In Chinese]. doi:10.3969/j.issn.1005-152X.2022.06.014
Xu, C., Shen, S., Fu, M., and Li, Y. (2020). A prediction method to evaluate thermal performance of protective clothing based on the correlation analysis of the bench scale and flame manikin tests. Int. J. Cloth. Sci. Technol. 32, 499–510. doi:10.1108/ijcst-02-2019-0017
Yang, L. (2015). Research on flame retardant cotton fabric performance andApplication in the firefighting suits. Master's Thesis. Xi’an Polytechnic University. [In Chinese].
Yang, L., Yang, J. Z., and Li, L. J. (2014). Research on thermal protection performance of multilayer fabrics system of fire clothing. Adv. Mater. Res. 1004, 1432–1436. doi:10.4028/www.scientific.net/amr.1004-1005.1432
Yang, Z., Wang, X., Lei, D., Fei, B., and Xin, J. H. (2012). A durable flame retardant for cellulosic fabrics. Polym. Degrad. Stab. 97, 2467–2472. doi:10.1016/j.polymdegradstab.2012.05.023
Zhai, S. N., Chen, T. Q., Jiang, C. Y., Fu, J. J., and Wang, H. B. (2018). Comprehensive evaluation on thermal protection and comfort of outer fabrics of firefighter protective clothing. J. Text. Res. 39, 100–104. [In Chinese]. doi:10.13475/j.fzxb.20170903705
Zhou, Q. (2021). Comprehensive evaluation on thermal protection performance and thermal-wet comfort performance of composite fabrics used for Firefighters’Protective clothing. J. Cloth. Res. 6, 102–107. [In Chinese]. doi:10.3969/j.issn.1671-7147.2021.02.002
Zhou, Q., Xu, F., Gao, C., Zhang, D., Shi, X., Yuen, M.-F., et al. (2023). Machine learning-assisted mechanical property prediction and descriptor-property correlation analysis of high-entropy ceramics. Ceram. Int. 49, 5760–5769. doi:10.1016/j.ceramint.2022.10.105
Keywords: flame-retardant cotton, thermal protection performance, multivariate nonlinear regression, gradient boosting regression tree, combined model
Citation: Zhang S, Ma K, Wang L, Zhang Z, Ye X, Zhang J and Li H (2024) Prediction of thermal protection performance and empirical study of flame-retardant cotton based on a combined model. Front. Mater. 11:1454935. doi: 10.3389/fmats.2024.1454935
Received: 27 June 2024; Accepted: 02 September 2024;
Published: 17 September 2024.
Edited by:
Anna Masek, Lodz University of Technology, PolandReviewed by:
Yang Liu, Wuhan Textile University, ChinaSheraz Ahmad, National Textile University, Pakistan
Adam W. Potter, US Army Research Institute of Environmental Medicine (USARIEM), United States
Copyright © 2024 Zhang, Ma, Wang, Zhang, Ye, Zhang and Li. This is an open-access article distributed under the terms of the Creative Commons Attribution License (CC BY). The use, distribution or reproduction in other forums is permitted, provided the original author(s) and the copyright owner(s) are credited and that the original publication in this journal is cited, in accordance with accepted academic practice. No use, distribution or reproduction is permitted which does not comply with these terms.
*Correspondence: Haihang Li, bGloYWloYW5nQGNqbHUuZWR1LmNu
 Siyuan Zhang1
 Haihang Li