
95% of researchers rate our articles as excellent or good
Learn more about the work of our research integrity team to safeguard the quality of each article we publish.
Find out more
ORIGINAL RESEARCH article
Front. Mater. , 16 September 2024
Sec. Computational Materials Science
Volume 11 - 2024 | https://doi.org/10.3389/fmats.2024.1454201
This study evaluates the performance of a geosynthetic reinforced soil integrated bridge system (GRS-IBS) in terms of total displacement by varying different design parameters simultaneously and also suggests optimum values of them. These parameters include, i. backfill internal friction angle (
Due to the rise in construction, engineers have shifted their interest toward soil stabilization techniques to utilize weak soils as backfill material, for pavement and road construction or foundations (Saquib Wani and Mir, 2020; Tahasildar et al., 2018; Cao et al., 2024). There are different soil stabilization techniques including mechanical stabilization and chemical stabilization and these techniques are considered costly, Further, chemical stabilization techniques impact the environment in many ways. For instance, lime stabilization produces a considerable quantity of carbon dioxide and calcium-based materials and the techniques that involve the use of bitumen impact the plant growth hence disturbing the agricultural activities. Therefore, at present, the use of these conventional soil stabilization techniques has limited scope because people are more concerned towards sustainable development by using cost-effective and environmentally friendly materials and techniques. Over the past few decades, the use of geosynthetics has become popular mainly due to its sustainability and cost-effectiveness. Moreover, they have also proven beneficial because of the increase in soil load-bearing capacity and resistance of soil settlements (Archibong et al., 2020; Rashid and Yousaf Shah, 2021; Du et al., 2023).
Geosynthetic Reinforced Soil (GRS) was primarily being used in slopes, retaining walls, and embankments, however, GRS is now being used as a part of an integrated bridge system and collectively is known as Geosynthetic Reinforced Soil Integrated Bridge System (GRS IBS). It is a substitute for the conventional bridge system in which load is transferred through piles to the deep strata (Abu-Hejleh et al., 2001; 2012; Mohamed et al., 2012; Saghebfar et al., 2017; Xie and Leshchinsky, 2015).
GRS IBS is built with commonly available construction materials and equipment which results in short construction time. The overall cost of GRS IBS is 60% less than conventional bridges and they also require less maintenance throughout their life span (Federal Highway Administration, 2019). Moreover, due to simpler design, these bridges can be constructed and adjusted to various environmental or unforeseen site conditions. In conventional bridges, with time, differential settlement of the approach road and bridge creates s bump at the bridge approach, whereas, this problem has been avoided in GRS IBS. In GRS IBS the slab and the roadway are meshed due to which they act as a monolithic structure and eventually the slab and road settle together (U.S. Department of transportation, 2020). The use of GRS IBS has also been promoted due to the ability to tolerate seismic loads and differential settlement in addition to cost-effectiveness and less construction period, (Adams et al., 2007; Lu et al., 2017; Kost et al., 2014; Talebi et al., 2014; Huang et al., 2022).
Talebi and Meehan, 2015 simulated several parametric model assessments to understand the behavior of GRS-IBS, using the finite element approach. The study investigated the backfill friction angles (
A parametric study using FLAC was conducted by Zheng and Fox (2017) to investigate the effects of backfill soil compaction, reinforcement length (Lr), reinforcement stiffness (EA), and bearing bed reinforcement, on the lateral facing deformations of GRS-IBS under static loading. The results of the study showed that the maximum displacement of lateral facing increases from 17.1 (for no compaction) to 21.8 mm (for heavy-weight compactor). Reinforcement length on the other hand has minimal effect on lateral-facing displacements. The maximum lateral displacement for a reinforcement length of 0.5H (where H is the Abutment height) was 18.7 mm which was slightly higher than the maximum lateral displacement against the baseline reinforcement length. After increasing the reinforcement length from 0.5H to 1.1H no change in the maximum lateral displacement was observed. Also, when reinforcement stiffness increased from 250 to 1000 kN/m, maximum lateral displacement decreased from 27 to 13 mm. Several bearing bed reinforcement layers ranging between 0 and 15 showed that maximum lateral deformation decreased from 18 mm to 16 mm. Abu-Farsakh and Ardah (2019a) investigated the performance of GRS IBS in terms of lateral facing displacement, strain distribution along reinforcement, and location of potential failure zone by 2D Finite Element (2D-FE) analysis method using PLAXIS 2D. They individually considered parameters including internal friction angle
Among others, Xu et al. (2020) performed a shaking table test to investigate the seismic performance of GRS IBS by considering only two parameters, i.e., reinforcement stiffness and reinforcement spacing. It was concluded that a reduction in the reinforcement spacing is more beneficial as compared to an increment in the reinforcement spacing to minimize the effect of seismic activity on GRS IBS.
In a recent study, Soo and Patinga, 2021 compared the GRS Integral Bridge (GRS-IB) that uses full height rigid (FHR) facing, GRS-IBS and a conventional integral bridge (IB) having an integral bridge system but without any reinforcement. Numerical simulations were performed using PLAXIS 2D under different loading conditions (end of construction, general traffic load, railway load). Numerical analysis showed that GRS-IB experienced the least lateral deformations of the wall as compared to the other two bridge systems. GRS IBS showed the highest lateral deformation (0.18%–0.27%) because of 0.5 m thick concrete masonry unit (CMU) blocks, whereas the other two bridge systems have 0.9 m FHR facing. This behavior of lateral deformation of bridges was similar for all the loading conditions. The main conclusion drawn from this study was the better performance of the GRS IB bridge, however, limited parameters were considered in this study.
The preceding studies have focused mainly on the performance of GRS IBS in terms of lateral facing deformations or settlements by considering parameters individually, such as friction angle, reinforcement spacing, reinforcement length, reinforcement stiffness, number of bearing bed layers, and setback distance.
A detailed investigation was needed to investigate the performance of GRS IBS in terms of total displacement (horizontal and lateral) by considering the cumulative effect of different parameters. Furthermore, it is equally important to address the optimum range of these parameters by considering their combined effect. Many studies are available for parameters such as backfill friction angle (
For analysis and design of GRS-IBS, a conventional RCC approach road bridge, constructed in 2018, near Hiran Minar, district Sheikhupura, Pakistan, was selected. Figure 1 shows the complete details of the road bridge considered for this study along with the actual bridge at the site.
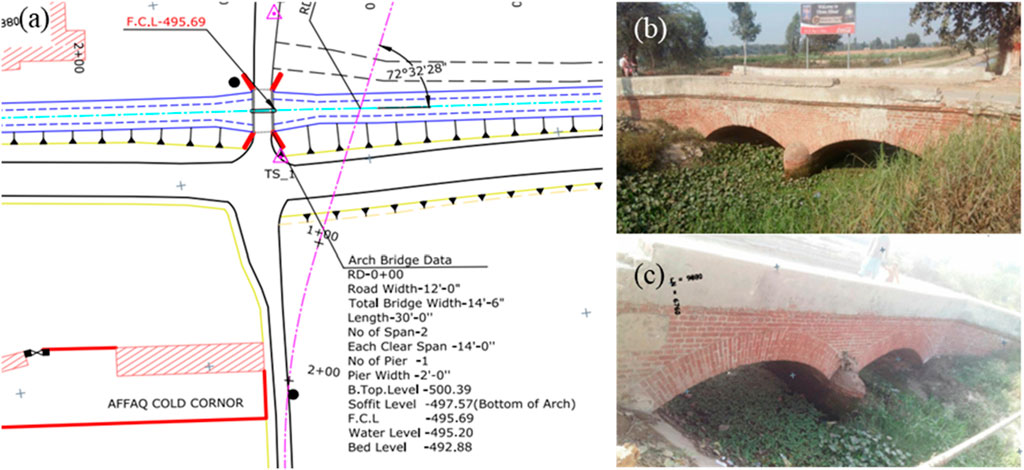
Figure 1. RCC approach road bridge data and actual bridge on site. (A) Topographic map of approach road bridge, (B) Upstream of bridge, (C) Downstream of bridge.
The GRS-IBS is designed according to the design criteria provided by the FHWA design manual (Adams and Nicks, 2018). The typical 2-dimensional GRS IBS model is shown in Figure 2. The total bridge span length was 9 m and the height of abutment was 4.2 m. Bearing width (b) was 1.2 m and the setback distance (ab) was 0.2 m. Clear space (de) which is the gap between the top of the uppermost facing block and the bottom of the girder was selected 0.076 m. The total base width (Btotal) used was 1.82 m which satisfies the FHWA minimum base to height (Btotal/H) ratio criteria i.e., minimum Btotal/H = 0.3. The depth of excavation for Reinforced Soil Foundation (DRSF) which is calculated as 2.5Btotal, was 0.46 m. The facing blocks used in this study are Concrete Masonry Unit (CMU) blocks with a thickness of 0.2 m. The length of the lowest reinforcement layer at the base is 6 ft (converted into meter) and the length of the bearing bed reinforcement layer (Lrb) is 1.52 m. Different vertical spacings between reinforcement layers
The bridge model comprises three types of soils, i. foundation soil, ii. reinforced backfill soil, iii. reinforced soil foundation. The model soil input parameters for foundation soil used in this study were based on the geotechnical investigation report collected from the highway department, government of Punjab. Due to the absence of data for parameters such as young’s modulus and Poisson ratio for retained backfill soil and reinforced soil foundation, the values have been used based on previous studies conducted by Abu-Farsakh and Ardah (2019a); Abu-Farsakh et al. (2018); Ardah et al. (2021). Since the FEM models analyzed in these studies were validated by in situ results therefore in this study the range for variation of EA,
Ardah et al. (2021) reported that analyzing geotechnical problems through numerical analysis has many advantages such as attaining comprehensive results, and evaluation of the effect of different parameters and loading conditions on the geotechnical problem, which is time-consuming and costly, otherwise. Therefore, the impacts of various variables on the performance of GRS-IBS to obtain their optimum values, have been examined in this study using the Finite Element Method (FEM) analysis program PLAXIS 2D Connect edition V21. Plaxis 3D offers a more comprehensive modeling platform than Plaxis 2D, especially when you have sufficient computational resources. In this study, we assumed a plane strain condition with a sufficiently large spread in the third dimension. If a similar model were developed in Plaxis 3D with large dimensions in the third direction, the resulting deformation would likely be close to the results of the current 2D model.
There are different constitutive models for simulation of material behavior in PLAXIS including the soft soil creep model (SS), Mohr coulomb (MC), hardening soil model (HS), and linear elastic model (EM). HS model and MC model are used extensively. HS model is considered an advanced anisotropic model as this model can predict the nonlinear behavior of over-consolidated clays, loose sands, and dense sands. It is a type of hyperbolic model that results in accurate soil behavior during loading phases due to stress dependency of stiffness moduli. There are three types of soil stiffness parameters required in the HS model i.e., secant modulus (Eref50), oedometer modulus (Erefoed), and unloading reloading stiffness (Erefur). HS model has been used by many of the previous researchers to simulate the backfill soil including Abu-Farsakh et al. (2018), Damians et al. (2016), and Ardah et al. (2017). MC model is a linear elastic perfectly plastic model with the first order approximation of the soil behavior (Murtaza Rasool et al., 2023). As discussed earlier, the hardening soil model has been used for reinforced backfill soil therefore to differentiate, in this study Mohr Coulomb soil model has been selected for reinforced backfill soil. Details of the models and input parameters used are tabulated in Table 1. A layout of the GRS IBS numerical model on PLAXIS 2D has been shown in Figure 3.
In this study, the numerical model has been simulated under a combination of dead and live load conditions. Dead load comprises the load of equivalent girder load along with the approach pavement. While live load comprises the load of general traffic (Traffic surcharge) calculated by employing the equation
The numerical analysis of this model consists of 19 phases before the load application. In every construction phase, the deformations and built pressures were transferred to the next phase until the final phase was achieved. Before the addition of a first phase, an initial phase exists by default. The model in the initial phase has been illustrated in Figure 4A. In this phase, all the structural elements were deactivated and only the original foundation soil was activated. Then first phase was created which replicated the excavation of the foundation soil for bridge construction as shown in Figure 4B. Phase 2 consists of the construction of RSF as shown in Figure 4C. After this, phase 3 to phase 19 follows the same pattern, i.e., activation of facing block, activation of backfill soil, and activation of geogrid as shown in Figures 4D, E. This pattern is repeated until phase 19 is achieved as shown in Figure 4F. In phase 20, loads are also activated as shown in Figure 4G.
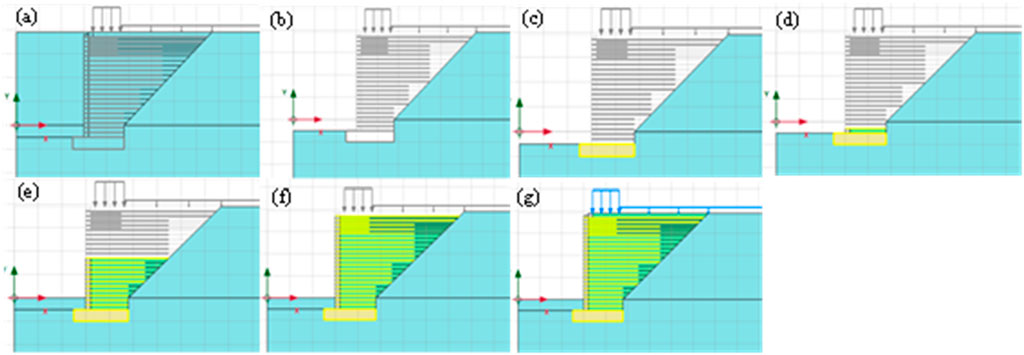
Figure 4. Stagged construction of GRS IBS on PLAXIS 2D. (A) Initial phase of model, (B) Phase 1 (excavation of foundation soil), (C) Phase 2 (construction of RSF), (D) Phase 3 (placement of first backfill soil layer and geogrid), (E) Phase 12, (F) Phase 19 (placement of all backfill soil layers and geogrids), (G) Phase 20 (activation of loads).
Three considered values for

Figure 5. Relationship between total displacement and height of the wall by varying vertical spacing between geogrids for (A) Sv = 0.1m, (B) Sv = 0.2m, and (C) Sv = 0.3m.
It can be seen that for Sv = 0.1 m, the maximum displacement at 0.8H increased from 22 to 26 mm for
The effect of varying

Figure 6. Relationship between total displacement and height of the wall by varying geogrid axial stiffness (Sv = 0.1 m) for (A) ∅b = 49, (B) ∅b = 41, and (C) ∅b = 55.
The figure showed that when

Figure 7. Relationship between total displacement and height of the wall by varying geogrid axial stiffness (Sv = 0.2 m) (A) ∅b = 49, (B) ∅b = 41, and (C) ∅b = 55.
The maximum displacement at 0.8H when
The graphical representation in Figure 8 shows that the effect of varying

Figure 8. Relationship between total displacement and height of the wall by varying geogrid axial stiffness (Sv = 0.3 m) for (A) ∅b = 49, (B) ∅b = 41, and (C) ∅b = 55.
The bearing bed reinforcement zone is located underneath the bridge seat in GRS IBS. These bearing bed layers act as embedded footing in the reinforced soil and support large bridge loads (Adams and Nicks, 2018). Previous analysis carried out by Abu-Farsakh and Ardah (2019a) was limited to the analysis showing the (which) effects with and without bearing bed layers. However, in this study, three different bearing bed layers were analyzed, i.e., 2, 4, and 6. Similarly,

Figure 9. Relationship between total displacement and height of the wall by varying number of bearing bed layers for (A) ∅b = 49, (B) ∅b = 41, and (C) ∅b = 55.
Results showed that for
Backfill and reinforcement create a substructure to bear the load from the superstructure (National concrete masonary association, 2019). Figure 10 shows the effect of different mb on maximum displacement at 20, 40, 60% and 80% of the abutment height It was observed that the magnitude of the displacement decreases only 3% at all heights of the wall as the slope gets steeper. Furthermore, no effect on the total displacement was observed at the retained backfill slope of 1:1 and 1:1.5.
The results from the finite element model must be validated to ensure that the proposed geometry, elements, and mesh refinement are adequate for accurate analysis. Typically, this validation involves comparing the model’s results with field or laboratory test data. However, due to the unavailability of such data, the results of the present study were validated by comparison with the findings of Abu Farsakh et al. (2019), who conducted a parametric study incorporating both field experiments and numerical analysis to examine the effects of reinforcement spacing and stiffness on bridge displacement.
Table 3 shows the comparison between the results of this study with the findings of Abu Farsakh et al. (2019). It can be observed from Table 3 that there is good agreement between the two studies. For instance, for a reinforcement spacing of 0.3 m, the displacement in this study is 35 mm, while 33 mm was observed by Abu Farsakh et al. (2019). Similarly, for a geogrid axial stiffness of 600 kN/m, both studies produced comparable displacement values—32 mm in this study and 32.5 mm in the study by Abu Farsakh et al. (2019). The slight difference between the results may be attributed to the use of a backfill friction angle (
Tensile forces from the soil are transferred to the geogrids through the mechanism of interaction. Geogrid takes these forces dominantly in one direction (if it is uniaxial geogrid) or both directions (if it is biaxial geogrid) (Mulabdic et al., 2018). The above cumulative parametric study of the following parameters (i.e.,
The tensile load distribution along the length of reinforcement measured from the back of the facing block by varying spacing of reinforcement layers is shown is Figure 11.
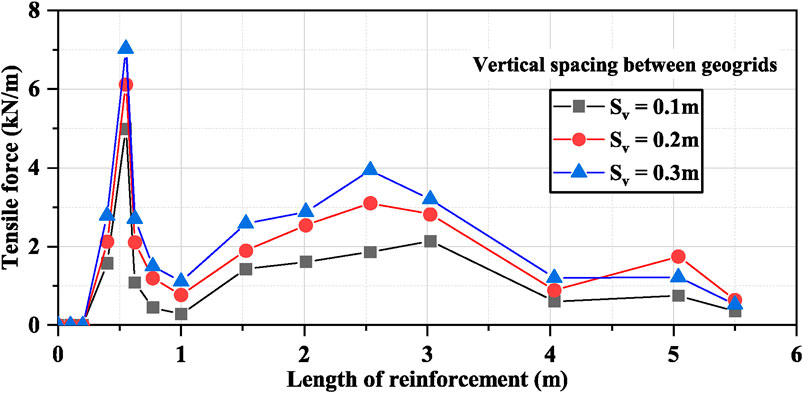
Figure 11. Effect of varying geogrid spacings on the tensile load of the topmost reinforcement layer.
It was observed that the trend of the graph is similar for all the considered spacings with the maximum tensile load at 0.55 m of the reinforcement length. When the spacing increased from 0.1 m to 0.2 m, the maximum tensile load increased by 23%, and when it increased from 0.2 m to 0.3 m the tensile load increased by 15%. With narrow reinforcement spacing, the number of layers of geogrids increases which causes an additional confining stress to the soil therefore, stress distribution on each soil layer will also increase. Hence due to friction action and interlocking between soil particles and geogrid layers in case of narrow spacing, the geogrids distribute the tensile load to the surrounding soil (Dulal and Kumar Yadav, 2021). This results in the composite behavior of GRS IBS and therefore, the internal stability of GRS abutments increases at close-spaced layers (Wu and Pham, 2013; Zheng et al., 2018). Abdullah et al. (2023) found that as the geogrid spacing decreases, the tensile forces in geogrids also decrease. A similar relationship was observed between geogrid tensile forces and spacing from the above analysis.
The effect of
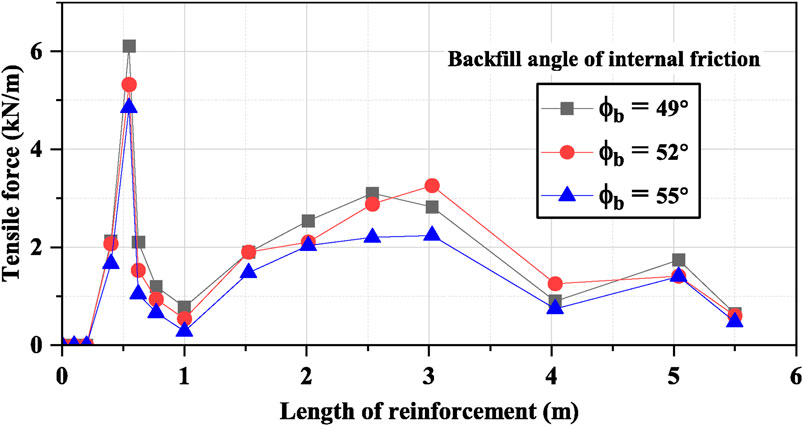
Figure 12. Effect of varying angle of internal friction on tensile load of topmost reinforcement layer.
The simulations were conducted at
Figure 13 shows the tensile load distribution along the length of reinforcement by varying EA. A negligible effect was observed by varying EA on the tensile load of the reinforcement layer.
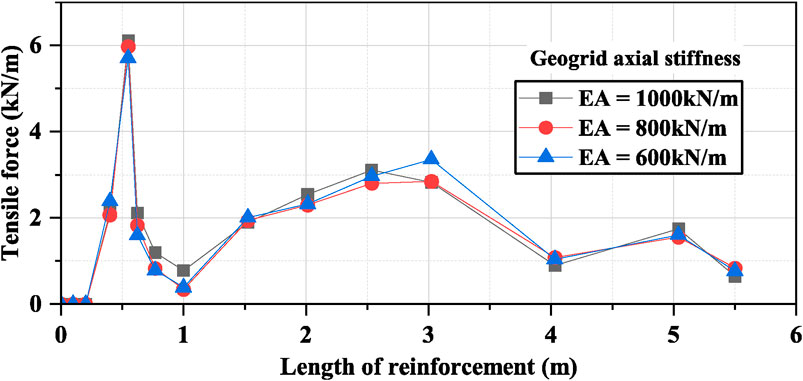
Figure 13. Effect of varying geogrid axial stiffness on the tensile load of the topmost reinforcement layer.
The maximum tensile load occurred at the length of 0.55 m of the reinforcement length. It was noted that when the EA increased from 600 kN/m to 800 kN/m, the maximum tensile load increased by only 5%, and when it was increased from 800 kN/m to 1000 kN/m the maximum tensile load further increased by only 2%. The results indicated that there is a direct relationship between maximum tensile forces in geogrids and EA. The relationship observed between geogrid tensile forces and EA from the above analysis following the study conducted by Zheng et al. (2018).
The above analysis showed that the maximum tensile load values occurred immediately behind the modular facing block (i.e., at a distance of 0.55 m) which can be attributed to the connection loads and application of D.L and L.L. Moreover, changes in
Since, the change of Sv had a greater effect on geogrid tensile forces, a detailed analysis was done to observe the effect of varying
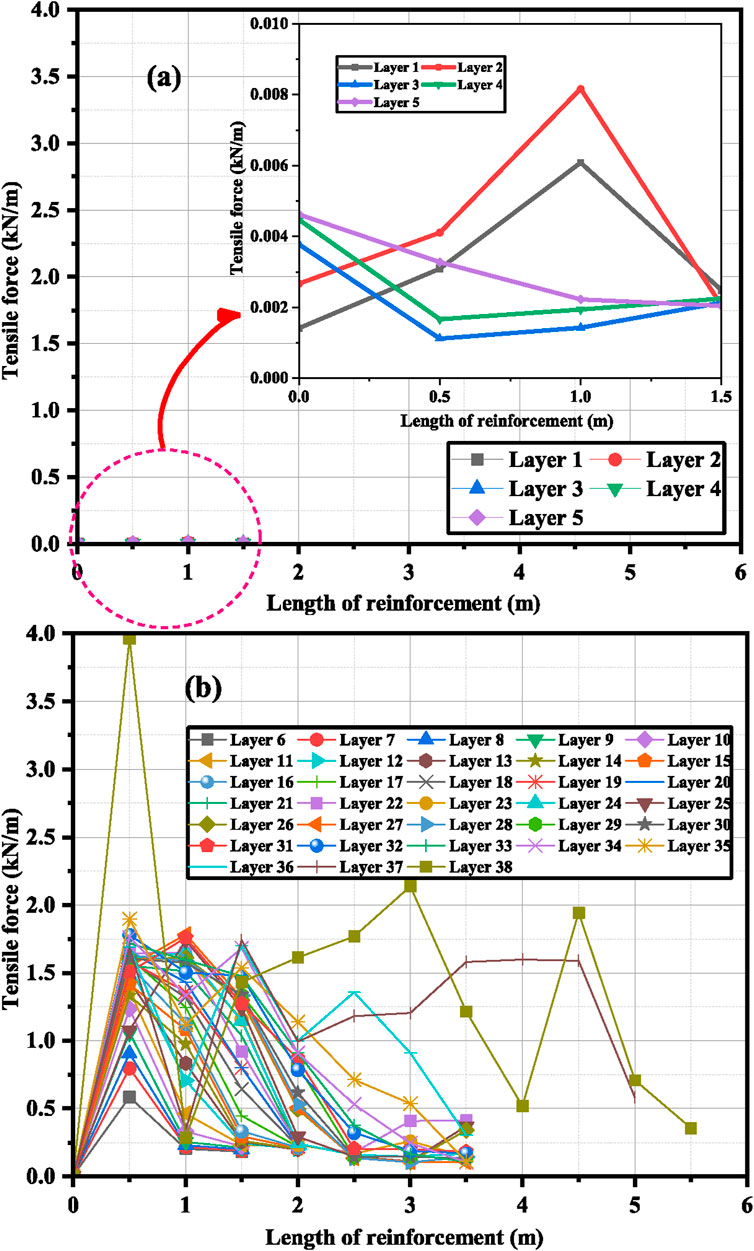
Figure 14. Tensile load distribution along the length of geogrids with spacing = 0.1 m. (A) Tensile load for layer 1 to layer 5, (B) Tensile load for layer 6 to layer 38.
Figure 14B shows that the maximum tensile load values occurred at a reinforcement length of 0.5 m. The major portion of tensile load was distributed from geogrid length of 0.5 m to 1.5 m after which a significant reduction in the load was observed except for layer no. 37 and layer no. 38, since these layers were provided immediately below the slab, hence the load was distributed from a geogrid length of 0.5 m to 3 m. The above discussion shows that if
Similarly, GRS IBS with reinforcement spacing of 0.3 m has 16 layers of geogrids. Figure 15A shows that layer no. 1 to layer no. 9 had a similar trend with peak tensile load values at a reinforcement length of 0.5 m. The major portion of the tensile load was distributed from a geogrid length of 0.5 m to 1.5 m after which a significant reduction in the load was observed. This indicates that the lengths of layer no. 6 to layer no. 9 can be decreased. The trend of the load distribution was almost identical in the remaining layers starting from 10 to layer no.16. A rise and fall in tensile load values can be observed in Figure 15B which is possible due to the presence of 6 layers of bearing bed from layer 11 to layer 16.
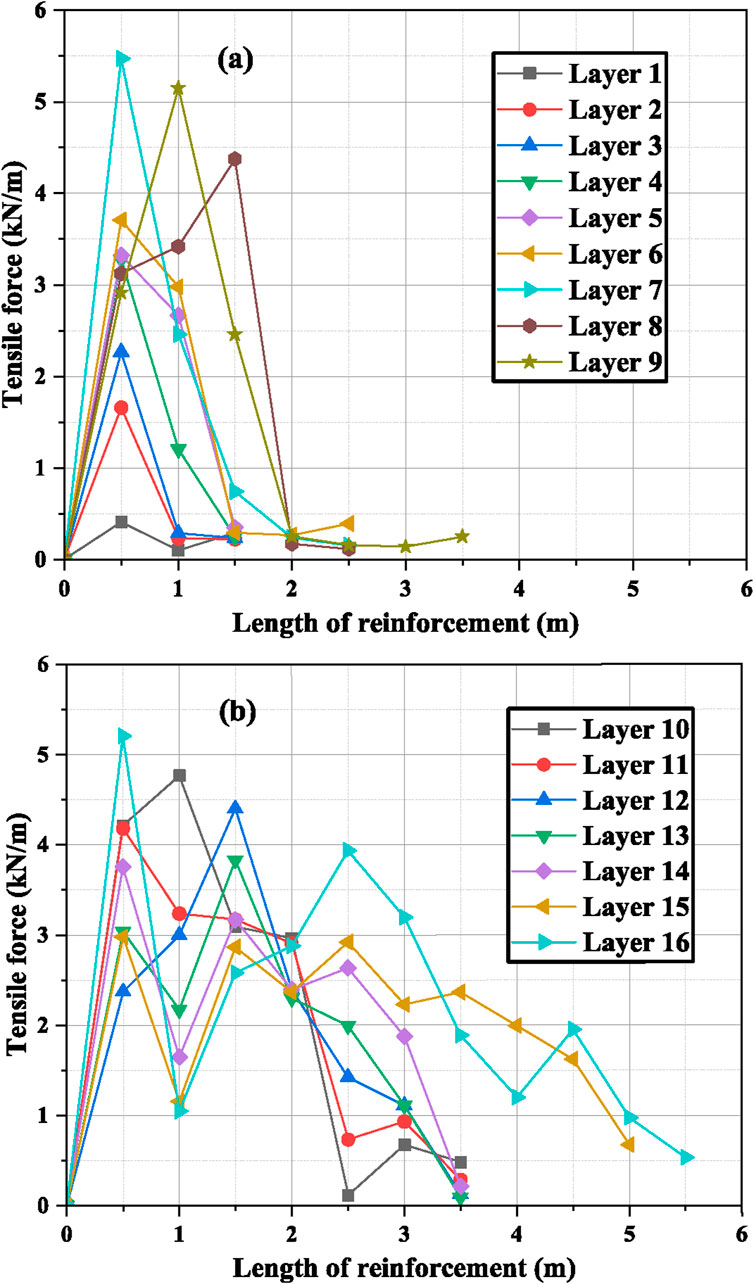
Figure 15. Tensile load distribution along the length of all the layers of geogrids with spacing = 0.3 m. (A) Tensile load for layer 1 to layer 9, (B) Tensile load for layer 10 to layer 16.
The results obtained from parametric analysis, the optimum values of
It can be observed that for each settlement range, the value of
Table 6 shows the optimum parameters for the settlement range of 31 mm to 40 mm. The values of the optimum spacing for
In this study, the effect of variation of different parameters on the performance of GRS IBS was analyzed, in terms of total displacement, and their effect on tensile load distribution in geogrid reinforcement layers was studied. Based on the parametric study, the optimum values of each parameter were selected. The main conclusions drawn from the series of analyses are as follows:
1. Although with the increase in
2. Adjustments in mb can be made as per site conditions as varying mb has an insignificant effect on the total displacement of the wall.
3. If
4. Change in
In terms of displacement, out of all the parameters, 3 had a significant effect. 1. Backfill friction angle, 2. Spacing between geogrids, and 3. Axial stiffness of geogrids.
Future research work could additionally examine the impact of these parameters by considering the following recommendations:
1. The performance of GRS IBS can be further analyzed by considering varying dynamic loads and reinforcement spacings simultaneously.
2. The performance of laboratory tests can be done to obtain the required input parameters for the software to do a more realistic analysis of the performance of GRS IBS.
3. These results can be further verified by applying optimization techniques considering cost and performance, and later a software tool can be developed to quickly obtain optimum parameter values for GRS IBS by using required settlement values.
The raw data supporting the conclusions of this article will be made available by the authors, without undue reservation.
MK: Conceptualization, Formal Analysis, Investigation, Methodology, Supervision, Writing–original draft, Writing–review and editing. MU: Data curation, Investigation, Methodology, Supervision, Writing–review and editing. MA: Formal Analysis, Investigation, Methodology, Resources, Supervision, Validation, Writing–review and editing. UA: Data curation, Validation, Writing–review and editing. NV: Funding acquisition, Resources, Writing–review and editing. HA: Resources, Writing–review and editing.
The author(s) declare that financial support was received for the research, authorship, and/or publication of this article. The research is partially funded by the Ministry of Science and Higher Education of the Russian Federation as part of the World-class Research Center program Advanced Digital Technologies (contract No. 075-15-2022-311 dated 20.04.2022). Also, this research was partially funded by Taif University, Saudi Arabia, Project No. (TU-DSPP-2024-33).
The authors extend their appreciation to Taif University, Saudi Arabia, for supporting this work through project number (TU-DSPP-2024-33).
The authors declare that the research was conducted in the absence of any commercial or financial relationships that could be construed as a potential conflict of interest.
All claims expressed in this article are solely those of the authors and do not necessarily represent those of their affiliated organizations, or those of the publisher, the editors and the reviewers. Any product that may be evaluated in this article, or claim that may be made by its manufacturer, is not guaranteed or endorsed by the publisher.
Abdullah, N., Ng, K., Jais, I., and Idrus, J. (2023). Use of geosynthetic reinforced soil-integrated bridge system to alleviate settlement problems at bridge approach: a review. Phys. Chem. Earth 129, 103304. doi:10.1016/j.pce.2022.103304
Abu-Farsakh, M., and Ardah, A. (2019a). “Finite element parametric study on the performance of geosynthetic reinforced soil–integrated bridge system (GRS-IBS),” in Geosynthetics conference. Houston, 2019 (IEEE).
Abu-Farsakh, M., Ardah, A., and Voyiadjis, G. (2018). 3D finite element analysis of the geosynthetic reinforced soil-integrated bridge system (GRS-IBS) under different loading conditions. Transp. Geotech. 15, 70–83. doi:10.1016/j.trgeo.2018.04.002
Abu-Farsakh, M., Ardah, A., and Voyiadjis, G. (2019a). Evaluating the performance of geosynthetic reinforced soil-integrated bridge system (GRS-IBS) under working stress condition. MATEC Web Conf. 271, 02001. doi:10.1051/matecconf/201927102001
Abu-Farsakh, M., Ardah, A., and Voyiadjis, G. (2019b). Numerical parametric study to evaluate the performance of a geosynthetic reinforced soil–integrated bridge system (GRS-IBS) under service loading. Transp. Geotech. 20, 100238. doi:10.1016/j.trgeo.2019.04.001
Abu-Hejleh, N., Outcalt, W., Wang, T., and Zornberg, G. (2001). Performance of geosynthetic reinforced walls supporting the founders/meadows bridge and approaching roadway structures- report 1: design, materials, construction, instrumentation, and preliminary results. Colorado, USA: Publication CDOT-DTD-R-2001-12, Colorado Department of Transportation.
Abu-Hejleh, N., Wang, T., and Zornberg, J. (2012). Performance of geosynthetic-reinforced walls supporting bridge and approaching roadway structures. Geo Denver, 218–243. doi:10.1061/40515(291)15
Adams, M., and Nicks, J. (2018). Design and construction guidelines for geosynthetic reinforced soil abutments and integrated bridge systems. U.S. Department of transportation, Federal highway administration. Available at: https://www.fhwa.dot.gov/publications/research/infrastructure/structures/bridge/17080/17080.pdf.
Adams, M., Schlatter, W., and Stabile, T. (2007). Geosynthetic reinforced soil integrated abutments at the bowman road bridge in defiance county. Ohio: Geo-Denver, 1–10. doi:10.1061/40909(228)12
Archibong, G., Uzoamaka Sunday, E., Akudike, J., and Okeke, O. (2020). A review of the principles and methods of soil stabilization. Int. J. Adv. Acad. Res. 6, 89–115.
Ardah, A., Abu-Farsakh, M., and Voyiadjis, G. (2017). Numerical evaluation of the performance of a geosynthetic reinforced soil-integrated bridge system (GRS-IBS) under different loading conditions. Geotext. Geomembr. 45, 558–569. doi:10.1016/j.geotexmem.2017.07.005
Ardah, A., Abu-Farsakh, M., and Voyiadjis, G. (2021). Numerical parametric study of geosynthetic reinforced soil integrated bridge system (GRS IBS). Geotext. Geomembr. 49289-03 49, 289–303. doi:10.1016/j.geotexmem.2020.10.005
Bentley Plaxis 2d reference manual (2020a). Available at: https://communities.bentley.com/cfs-file/__key/communityserver-wikis-components-files/00-00-00-05-58/3113.PLAXIS2DCE_2D00_V20.02_2D00_2_2D00_Reference.pdf
Bentley Plaxis 2d tutorial manual (2020b). Available at: https://communities.bentley.com/cfsfile/__key/communityserver-wikis-components-files/00-00-00-05-58/PLAXIS2DCE_2D00_V20.04_2D00_1_2D00_Tutorial.pdf
Cao, J., Du, J., Zhang, H., He, H., Bao, C., and Liu, Y. (2024). Mechanical properties of multi-bolted Glulam connection with slotted-in steel plates. Constr. Build. Mater. 433, 136608. doi:10.1016/j.conbuildmat.2024.136608
Damians, I., Bathurst, R., Lloret, A., and Josa, A. (2016). Vertical facing panel-joint gap analysis for steel-reinforced soil walls. Int. J. Geomech. 16 (4), 040151031–40151114. doi:10.1061/(ASCE)GM.1943-5622.0000632
Du, C., Xu, Z., Yi, F., Gao, J., and Shi, K. (2023). Bearing capacity mechanism of soilbagged graphite tailings. Bull. Eng. Geol. Environ. 83 (1), 24. doi:10.1007/s10064-023-03531-7
Dulal, T., and Kumar Yadav, S. (2021). Study of the effect of geogrid on the stability of embankment. 10th IOE Grad. Conf. 10, 2350–8914.
Federal Highway Administration (2019). Development of a comprehensive bridge management system. Available at: https://www.fhwa.dot.gov/publications/research/infrastructure/structures/bridge/19024/19024.pdf.
Huang, H., Xue, C., Zhang, W., and Guo, M. (2022). Torsion design of CFRP-CFST columns using a data-driven optimization approach. Eng. Struct. 251, 113479. doi:10.1016/j.engstruct.2021.113479
Huang, H., Yao, Y., Zhang, W., and Zhou, L. (2023). A push-out test on partially encased composite column with different positions of shear studs. Eng. Struct. 289, 116343. doi:10.1016/j.engstruct.2023.116343
Kost, A., Filz, G., Cousins, T., and Carey Brown, M. (2014). Full-scale investigation of differential settlements beneath a geosynthetic-reinforced soil bridge abutment. Transp. Res. Rec. 2462 (1), 28–36. doi:10.3141/2462-04
Lu, D., Ma, C., Du, X., Jin, L., and Gong, Q. (2017). Development of a new nonlinear unified strength theory for geomaterials based on the characteristic stress concept. Int. J. Geomechanics 17 (2). doi:10.1061/(ASCE)GM.1943-5622.0000729
Mohamed, K., Abouzakhm, M., and Elias, M. (2012). Applications and performance of geosynthetic-reinforced soil abutments on soft subsurface soil conditions. Transp. Res. Rec. 1, 74–81. doi:10.3141/2212-08
Mulabdic, M., Minažek, K., and Kaluđer, J. (2018). “Geogrids - what is important,” in Fifth international conference on road and rail infrastructure, 215–221. doi:10.5592/CO/CETRA.2018.934
Murtaza Rasool, A., Niazi, F., Ahmed, T., and Aziz, M. (2023). A parametric investigation on effect of supporting arrangements on earth retention system. Geomech. Eng. 33, 507–518. doi:10.12989/gae.2023.33.5.507
National concrete masonary association (2019). GRS IBS: solutions to bridge construction challenges. Available at: https://ncma.org/updates/news/grs-ibs-solutions-to-bridge-constructionchallenges/.
Rashid, S. I., and Yousaf Shah, M. (2021). State-of-the-Art review on the role of geocells in soil reinforcement. Geotech. Geol. Eng. 39, 1727–1741. doi:10.1007/s10706-020-01629-3
Saghebfar, M., Abu-Farsakh, M., Ardah, A., Chen, Q., and Fernandez, B. (2017). Performance monitoring of geosynthetic reinforced soil integrated bridge system (GRS-IBS) in Louisiana. Geotext. Geomembr. 45 (2), 34–47. doi:10.1016/j.geotexmem.2016.11.004
Saquib Wani, K., and Mir, B. (2020). Stabilization of weak dredged soils by employing waste boulder crusher dust: a laboratory study. Geotech. Geol. Eng. 38 (2), 6827–6842. doi:10.1007/s10706-020-01472-6
Soo, W. M., and Patinga, L. C. (2021). Numerical analyses on the behavior of geosynthetic-reinforced soil: integral bridge and integrated bridge system. Appl. Sci. 11 (17), 2–23. doi:10.3390/app11178144
Tahasildar, J., Erzin, Y., and Hanumantha Rao, B. (2018). Development of relationships between swelling and suction properties of expansive soils. Int.J. Geotech. Eng. 12 (1), 53–65. doi:10.1080/19386362.2016.1250040
Talebi, M., and Meehan, C. (2015). Numerical simulation of a geosynthetic reinforced soil integrated bridge system during construction and operation using parametric studies. IFCEE 2012, 1493–1502. doi:10.1061/9780784479087.135
Talebi, M., Meehan, C., Cacciola, D., and Becker, M. (2014). Design and construction of a geosynthetic reinforced soil integrated bridge system. Atlanta Georgia, United States: Geo-congress, 4176–4190. doi:10.1061/9780784413272.406
U.S. Department of transportation (2020). Federal highway administration, GRS IBS bridges. Available at: https://highways.dot.gov/federal-lands/programs-tribal/bridge/grs-ibs-bridges.
Wu, J., and Pham, T. (2013). Load-carrying capacity and required reinforcement strength of closely spaced soil-geosynthetic composites. J. Geotech. Geoenvironmental Eng- ASCE 139 (9), 1468–1476. doi:10.1061/(ASCE)GT.1943-5606.0000885
Xie, Y., and Leshchinsky, B. (2015). MSE walls as bridge abutments: optimal reinforcement density. Geotext. Geomembr. 43 (2), 128–138. doi:10.1016/j.geotexmem.2015.01.002
Xu, C., Luo, M., Shen, P., Han, J., and Ren, F. (2020). Seismic performance of a whole geosynthetic reinforced soil – integrated bridge system (GRS-IBS) in shaking table test. Geotext. Geomembr. 48, 315–330. doi:10.1016/j.geotexmem.2019.12.004
Zheng, Y., and Fox, P. (2017). Numerical investigation of the geosynthetic reinforced soil–integrated bridge system under static loading. J. Geotech. Geoenvironmental Eng.- ASCE 143 (6), 040170081–40170114. doi:10.1061/(ASCE)GT.1943-5606.0001665
Keywords: geosynthetic reinforced soil integrated bridge system GRS-IBS, finite element analysis, parametric study, tensile forces, optimum parameters
Citation: Khan M, Umar M, Alam M, Ali U, Vatin NI and Almujibah H (2024) Evaluation of design parameters for geosynthetic reinforced-soil integrated bridge system based on finite element analysis. Front. Mater. 11:1454201. doi: 10.3389/fmats.2024.1454201
Received: 24 June 2024; Accepted: 06 September 2024;
Published: 16 September 2024.
Edited by:
Alireza Tabarraei, University of North Carolina at Charlotte, United StatesReviewed by:
Lucio Nobile, University of Bologna, ItalyCopyright © 2024 Khan, Umar, Alam, Ali, Vatin and Almujibah. This is an open-access article distributed under the terms of the Creative Commons Attribution License (CC BY). The use, distribution or reproduction in other forums is permitted, provided the original author(s) and the copyright owner(s) are credited and that the original publication in this journal is cited, in accordance with accepted academic practice. No use, distribution or reproduction is permitted which does not comply with these terms.
*Correspondence: Mehtab Alam, bV9hbGFtQHRvbmdqaS5lZHUuY24=
Disclaimer: All claims expressed in this article are solely those of the authors and do not necessarily represent those of their affiliated organizations, or those of the publisher, the editors and the reviewers. Any product that may be evaluated in this article or claim that may be made by its manufacturer is not guaranteed or endorsed by the publisher.
Research integrity at Frontiers

Learn more about the work of our research integrity team to safeguard the quality of each article we publish.