- 1Department of Civil Engineering, Indian Institute of Technology Delhi, New Delhi, India
- 2Department of Electrical Engineering, Indian Institute of Technology Delhi, New Delhi, India
- 3Yardi School of Artificial Intelligence, Indian Institute of Technology Delhi, New Delhi, India
Artificial intelligence (AI) and machine learning (ML) have enabled property-targeted design of glasses. Several machine learning models and open-source tools in the literature allow researchers to predict the optical, physical, mechanical, and electrical properties of glasses as a function of their chemical compositions. However, these properties also depend on testing conditions. In this paper, we train machine learning models by considering composition and wavelength, temperature, and frequency to predict the refractive index, density, and the two electrical properties, i.e., dielectric constant and loss tangent of glasses, respectively. The predictions of trained models are explained using SHAP analysis, revealing that testing conditions, such as wavelength and temperature, interact majorly with network formers while predicting refractive index and density. In the case of electrical properties, network formers and frequency have the highest interactions, followed by network modifiers and intermediates, and hence govern predictions of dielectric constant and loss tangent. Overall, AI/ML models that can predict the properties of glasses as a function of their composition and testing conditions, coupled with SHAP plots, provide a practical tool to develop a range of glasses for application under varying conditions.
1 Introduction
Applications of inorganic glasses in different fields are widely documented. However, developing glasses for targeted applications remained a resource-intensive task until the following pioneering works (Dreyfus and Dreyfus, 2003; Brauer et al., 2007; Echezarreta-López and Landin, 2013), where the authors demonstrated that AI/ML models could learn the compositional dependence of different properties. Later, researchers used data-driven machine learning to predict various properties of glasses by using large datasets (Anoop Krishnan et al., 2018; Bishnoi et al., 2019; Liu et al., 2019; Alcobaça et al., 2020; Deng, 2020; Cassar et al., 2021b; Bishnoi et al., 2021; Cassar et al., 2021a; Zaki et al., 2022b; Mannan et al., 2023; Singla et al., 2023). Recently, Cassar (2021) used a physics-informed neural network to predict the glass transition temperature of oxide glasses. Similarly, physics-informed machine learning was used by Bødker et al. (2022) to predict glass structure. Further, Bishnoi et al. (2022) used physics-driven models to predict the optical, physical, mechanical, and thermal properties of glasses. To further facilitate the rational discovery of glasses, researchers released software packages like PyGGi (pyggi–Substantial AI, n.d.), and GlassPy (Cassar, 2023).
Understanding how different input parameters contribute to machine learning model predictions is as essential as obtaining accurate property predictions. Daniel et al. (Cassar et al., 2021a) and Zaki et al. (2022b) addressed these challenges in glass discovery through the use of SHAP analysis to quantify the compositional dependence of properties in oxide glasses. Later, Ravinder et al. (Bhattoo et al., 2023) trained 25 machine learning models to predict glasses’ physical, electrical, mechanical, optical, and electrical properties and explained their composition dependence through SHAP analysis. Recently, Mandal et al. (2023) designed Na-ion conducting glasses using a machine learning model and experimental validations.
Through past experiments, it has been known that the properties of glasses are also a function of processing and testing conditions. Zaki et al. (2023) used text mining and natural language processing tools to collect data on the composition, annealing temperature, testing load, and hardness of glasses. The authors then trained machine learning models that considered such parameters and predicted the hardness of oxide glasses. Their study revealed that including processing (annealing temperature) and testing variables (testing load) in the dataset improved predictions of Vickers hardness. Developing functional glasses under different testing conditions requires AI/ML models that can consider both composition and testing conditions as input, and predict the desired properties (Zaki et al., 2023). Glass properties such as refractive index, dielectric constant, and loss tangent are a function of wavelength or frequency; while density is a function of both composition and temperature (Varshneya and Mauro, 2019). The existing models can predict the density, refractive index, dielectric constant, and loss tangent of inorganic glasses as a function of their compositions at fixed testing conditions. Therefore, the major challenge is to develop machine learning models that can predict the properties by considering the testing conditions. In this work, we develop machine learning models to predict refractive index, dielectric constant, loss tangent as a function of composition and wavelength, and density as a function of glass composition and temperature. We use SHAP analysis to explain the effect of different input parameters on property values. Through SHAP analysis, the interaction between chemical components and testing conditions is also reported which will assist in appropriate selection of chemical compounds for targeted property. The remainder of the paper is organized as follows. First, we discuss dataset preparation, how machine learning models are trained, and how their predictions are explained. Subsequently, in the Results and discussion section, we dwell on dataset details and performance of the trained machine learning models. This is followed by a discussion of SHAP analysis to explain the compositional and testing parameter dependence of glass properties. The paper ends with the Conclusion section, where we summarize key results and discuss future research directions.
2 Methodology
2.1 Dataset preparation
Several researchers have studied the compositional governance of optical, physical, electrical, and mechanical properties of glasses using data from Sciglass (https://github.com/epam/SciGlass) and Interglad Ver (2020) databases. However, very few accounted for processing and testing conditions (Zaki et al., 2022a). Here, we use the Interglad Ver (2020) database to obtain the composition and wavelength associated with the refractive index, dielectric constant, and loss tangent of glasses. We also compiled a dataset of glass density at different testing temperatures. The compiled dataset had a few samples for which the sum of all components did not add up to 100%. Since these were very few, they were discarded. In some cases, the units of testing variables were different. We converted all units to the same scale. For example, frequencies are reported in units like Hz, kHz, MHz, and GHz; temperature is reported in both Kelvin and degrees Celsius. Therefore, all frequencies were scaled to GHz, and all temperature values to degrees Celsius for the sake of consistency. In previous works (Bishnoi et al., 2021; Cassar et al., 2021a; Bhattoo et al., 2023), duplicated values arising from different processing and testing conditions; therefore, a duplicate removal step was required. In this work, the testing conditions are also considered as variable, and hence, this step has been obviated.
Machine learning models perform well when trained on sufficient good quality data. Hence, random entries were verified with their source through natural language processing-based approaches to ensure good quality datasets for training the models. To reduce outliers, only those chemical components that were present in at least 30 glasses were chosen to be part of the dataset. After all preprocessing and cleaning steps, the dataset was split into 80:20 ratios to obtain training and test sets. The training set was subjected to 10-fold cross-validation, and the best-performing model on the validation set was selected as the final model. Note that the test set is kept hidden and is used only after the selection of the best model for final evaluation. This strategy is the same as used in one of the earlier works (Bhattoo et al., 2023).
2.2 Machine learning, hyperparameter optimization, and explainability
Extreme gradient boosting (XGBoost) models have become quite popular for accurately predicting the properties of glasses. XGBoost is a gradient boosting tree-based model, i.e., the model output is based on the values proposed by different trees (Chen and Guestrin, 2016). We trained machine learning models by using the XGBoost python package. The model hyperparameters were optimized using the Optuna python package (Akiba et al., 2019). The details of hyperparameter optimization are provided in the previous work (Bhattoo et al., 2023). The hyperparameters used and their ranges are provided in Supplementary Tables S1–S3 of Supplementary Material file of this work.
Glass researchers and manufacturers also seek to understand how glass constituents influence individual properties. The machine learning models’ predictions were explained using SHAP analysis (Lundberg and Lee, 2017), a game theoretic approach, that decides the importance of each component with regard to the predicted value. This is computationally prohibitive for multicomponent glass systems and large datasets. Therefore, we use the built-in functionality of TreeExplainer in the SHAP Python package, which provides a faster implementation. In this work, we use SHAP riverflow, scatter, and interaction plots to explain how different chemicals like network formers, modifiers, intermediates, other compounds, and testing conditions govern the properties of glasses. Each line in the SHAP riverflow plot corresponds to a unique data point, and the ordinates correspond to the effect of the respective input feature toward model predictions. Therefore, SHAP riverflow plots are used to provide detailed explanations for individual data points. However, SHAP scatter and interaction plots are used to show the global behaviour of the input features on the glass properties of interest. The readers are requested to refer to the works of (Cassar et al., 2021a; Zaki et al., 2022b; Bhattoo et al., 2023) to learn more about the SHAP analysis in the context of glass science.
3 Results and discussion
3.1 Dataset visualization
3.1.1 Refractive index
Figure 1A shows chemical components and the number of glasses in which they are present. There exist both oxide and fluoride glasses for which refractive index is known at different wavelengths. Some of the most frequently found network formers are SiO2 and B2O3, network modifiers like BaO and Na2O, and intermediates like Al2O3 and TiO2. Figure 1B shows the presence of multicomponent glasses with the maximum number of ternary glasses followed by binary glass systems. The refractive index values in the dataset lie in the range of 1.4–2.5 (Figure 1C), with the maximum number of glasses with refractive index close to 1.65. Note that the dataset of the refractive index consists of glasses at the following wavelengths: 480 nm, 486.1 nm, 546.1 nm, 643.8 nm, and 656.3 nm.
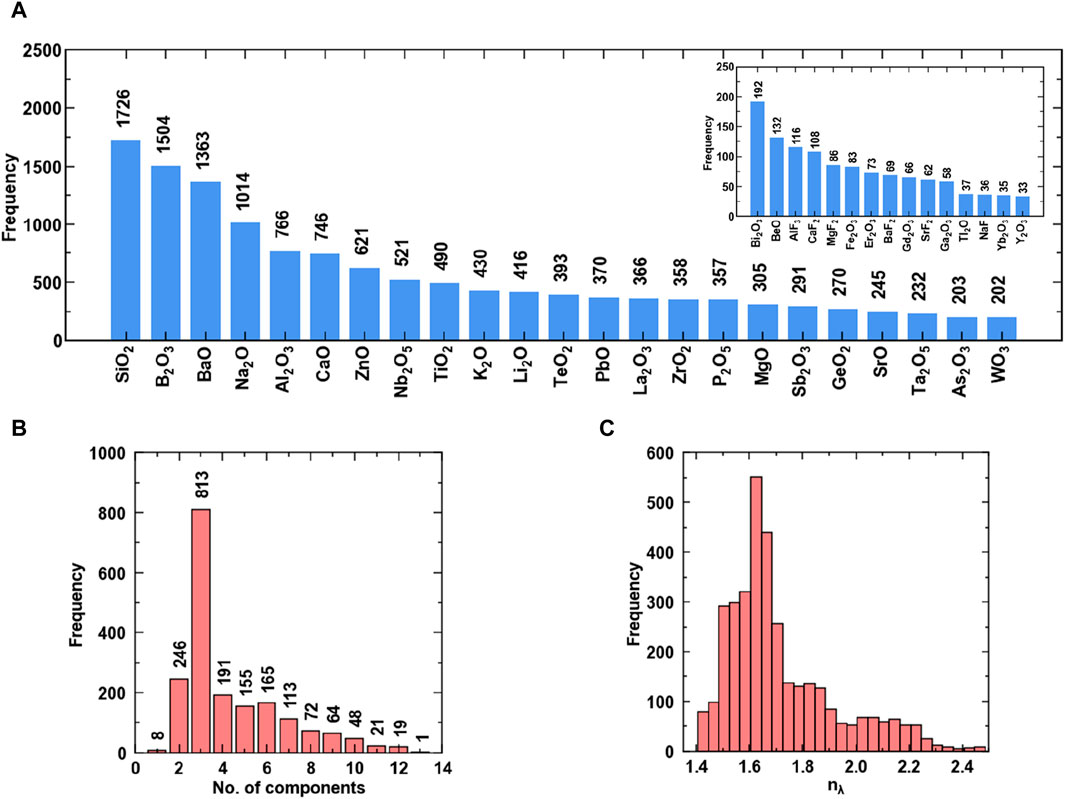
Figure 1. Visualizing data of refractive index (A) Chemical components and their frequency, (B) Number of multicomponent glasses, and (C) Histogram of property values.
3.1.2 Density
Figure 2 shows the dataset of the density of glasses in a temperature range of 100 °C–1000 °C. In this dataset, only oxide glasses are present, as seen in Figure 2A. Like the refractive index dataset, this data also consists of SiO2 and B2O3 as the most frequently found network formers, followed by network modifiers like Na2O and CaO and intermediates like PbO and Al2O3. In Figure 2B, it is observed that the majority of glasses are binary, ternary, and quaternary. The density of studied glasses varies from 1.2 to 8.4 (Figure 2C). It is interesting to observe very high density (>8) in the dataset, which corresponds to glasses having Bi2O3, a rare Earth metal oxide with wide applications in medical devices and radioactive coatings. The glasses having high density values in the range of 6–8 g/cm3 contain both PbO and Bi2O3, which have very high melting points.
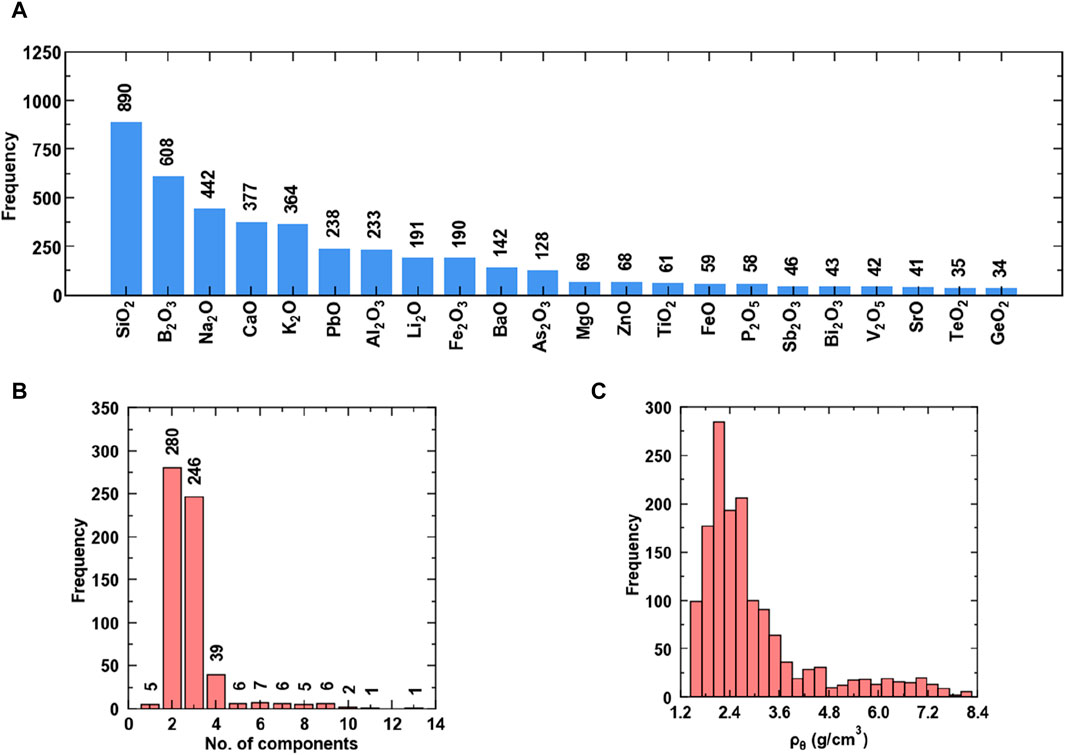
Figure 2. Visualizing data of density (A) Chemical components and their frequency, (B) Number of multicomponent glasses, and (C) Histogram of property values.
3.1.3 Dielectric constant
Figure 3 shows the dataset used for training the model for predicting the dielectric constant of glasses at frequencies in the range of 0.06 Hz–100 GHz. Figure 3A shows the presence of both oxide and halide glasses, dominated by the presence of silicate and borate glasses. The common network formers are SiO2 and B2O3, followed by network modifiers like CaO and Na2O and intermediates like Al2O3 and TiO2. In Figure 3B, it is observed that the majority of glasses are ternary, quaternary, or contain six components. The range of the dielectric constant varies from 1 to 50 (Figure 3C). The high property values, in this case, occur at high frequencies. These glasses comprise silicates, borates, and lead oxide glasses with the presence of rare Earth oxides, which make them suitable for applications like capacitors. The glasses with low dielectric constant found applications in integrated circuits and communication devices. The dataset consists of dielectric constant values with maximum measurements taken at 1 GHz, 1 KHz, and 0.1 MHz.
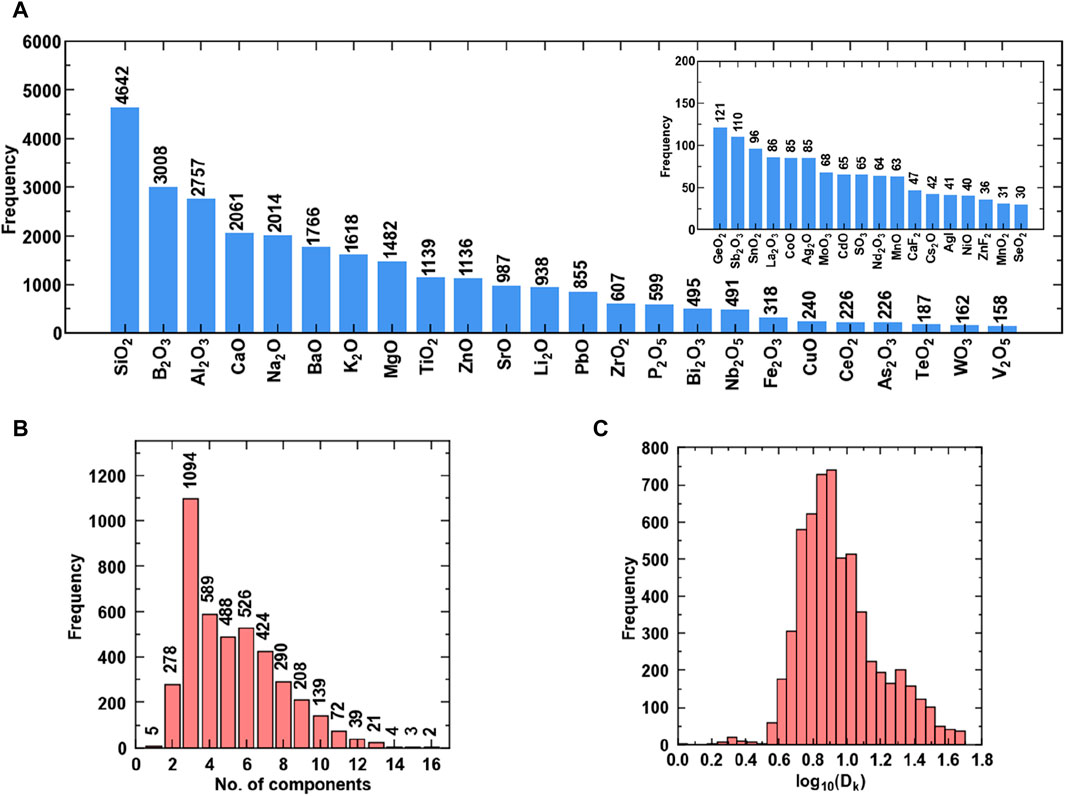
Figure 3. Visualizing data of dielectric constant (A) Chemical components and their frequency, (B) Number of multicomponent glasses, and (C) Histogram of property values.
3.1.4 Loss tangent
Figure 4 shows the details of the components and the property values used to train the machine learning model for predicting the loss tangent of glasses. Figure 4A shows the maximum presence of glasses with SiO2 and B2O3 as network formers and CaO and Na2O as network modifiers. The dataset has maximum glasses with Al2O3 and TiO2 as the intermediates. The dataset for loss tangent has the maximum number of ternaries, quaternary, and seven component glasses. The loss tangent of the glasses in the dataset goes to 10 (Figure 4C). The glasses with loss tangent values in the range of 2–10 are measured in the frequency range of 300 Hz - 1 MHz. The glasses with low loss tangent are practically useful for applications in semiconducting devices. Note that the dataset of loss tangent consists of glasses at frequencies 0.5 Hz −100 GHz, with most measurements at 1 MHz, 1 KHz, 0.1 MHz, and 1 GHz.
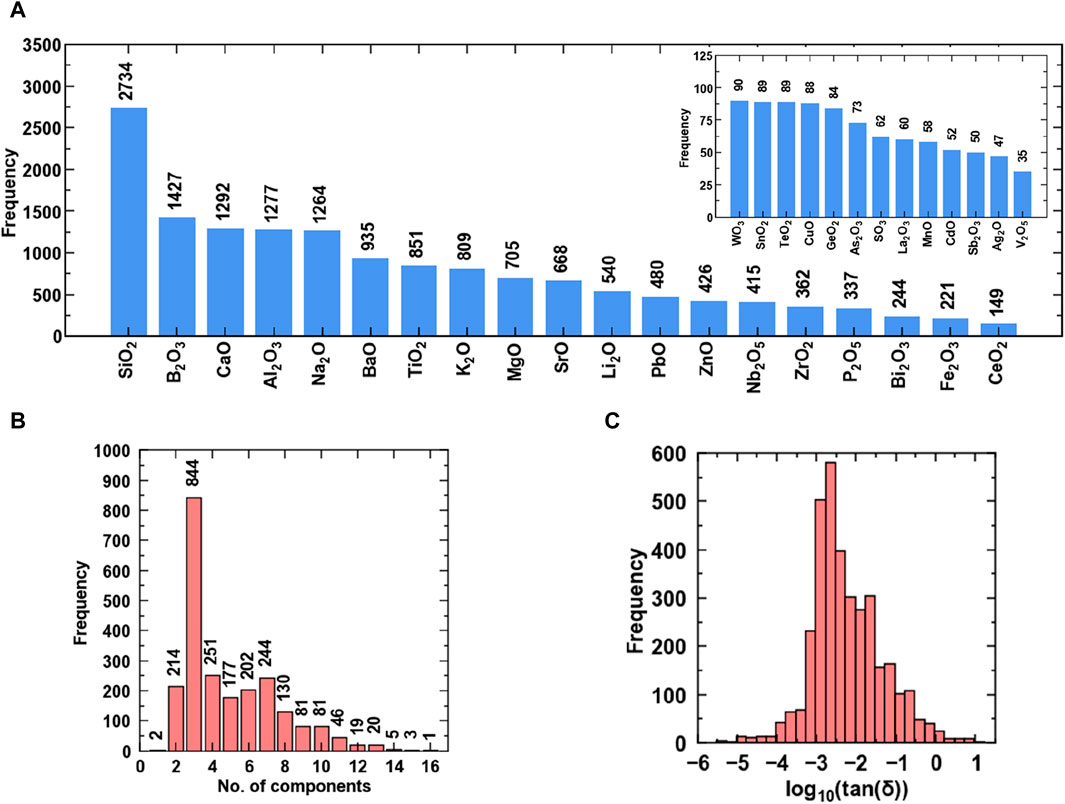
Figure 4. Visualizing data of loss tangent (A) Chemical components and their frequency, (B) Number of multicomponent glasses, and (C) Histogram of property values.
3.2 Machine learning models performance
Using the methodology described in earlier works and considering the data as shown in the previous section, the machine learning models are trained to predict four properties, i.e., (a) refractive index as a function of composition and wavelength (Figure 5A), (b) density as a function of composition and temperature (Figure 5B), (c) dielectric constant as a function of composition and frequency (Figure 5C), and (d) loss tangent as a function of composition and frequency (Figure 5D). Figure 5 shows the comparison of measured property values with the predicted ones from the test set. It can be observed from the R2 scores in Figure 5 that the performance of the model is quite good on all the splits of the dataset for each property. Further, the histogram of relative error shows that most data points in the test dataset have near-zero error, and the error for most samples lies in the range of two times the standard deviation, i.e., a 95% confidence interval. The clustering of points close to the y = x line in all the figures implies the predicted property values are close to the actual values. The model makes prediction errors mostly in cases where the presence of training data is quite less or the datapoints are out of distribution of the training set (see Supplementary Figure S1) leading to poor performance on unseen data. The hyperparameters of the trained models are provided in Section 2 of the Supplementary Material file associated with this work.
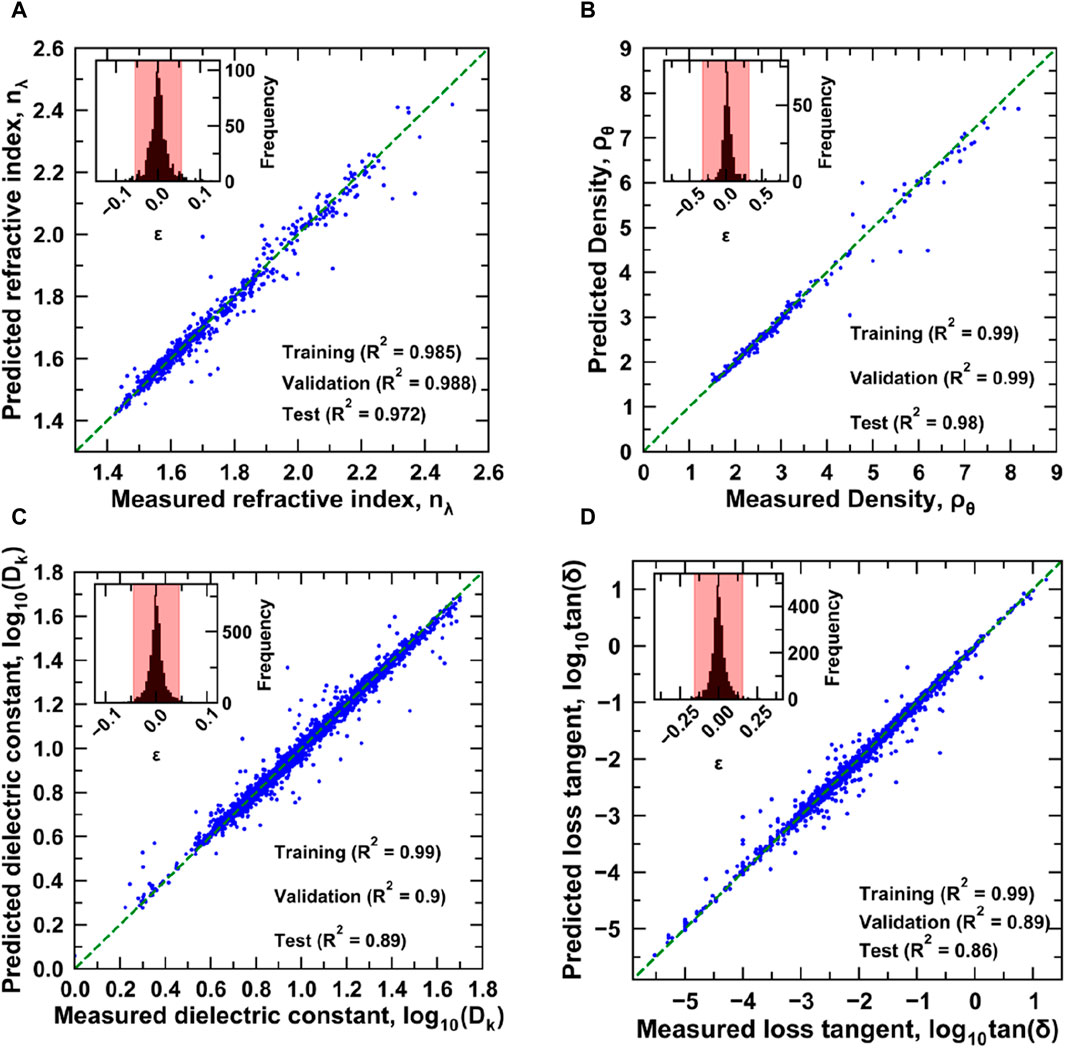
Figure 5. Visualizing predictions of trained ML models for (A)refractive index, (B) density, (C) dielectric constant, and (D) loss tangent.
The lower performance of the model in the case of electrical properties as compared to refractive index and density can be explained by the difficulty experienced in their measurements. Although accurate predictions can help glass researchers and manufacturers to develop tailored glasses rationally by reducing the number of experimental trials, it is also important to understand the effect of composition and testing conditions on the properties of developed glasses. To this end, we use SHAP plots to explain the local and global behaviour of each input feature on the predicted property values.
3.3 Composition–testing parameters–property relationship
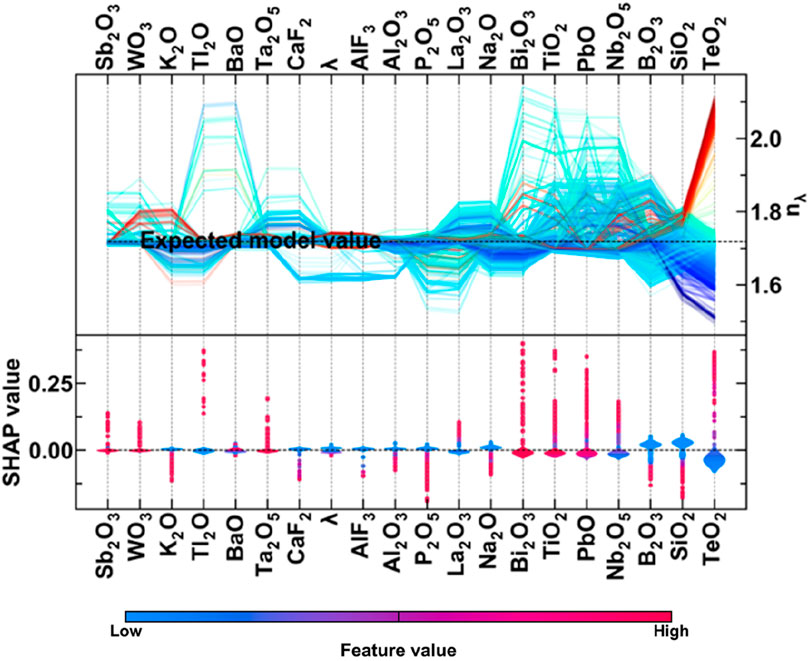
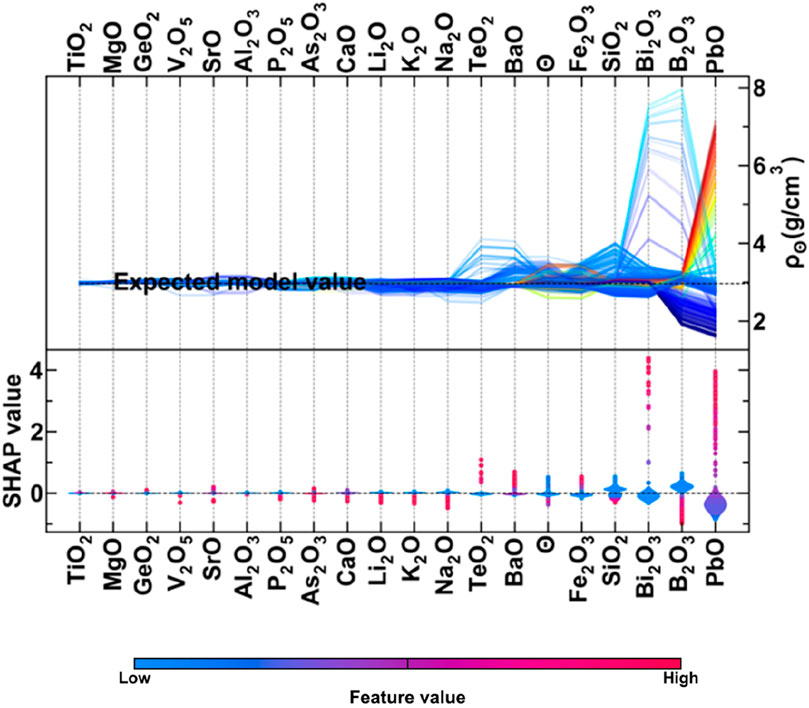
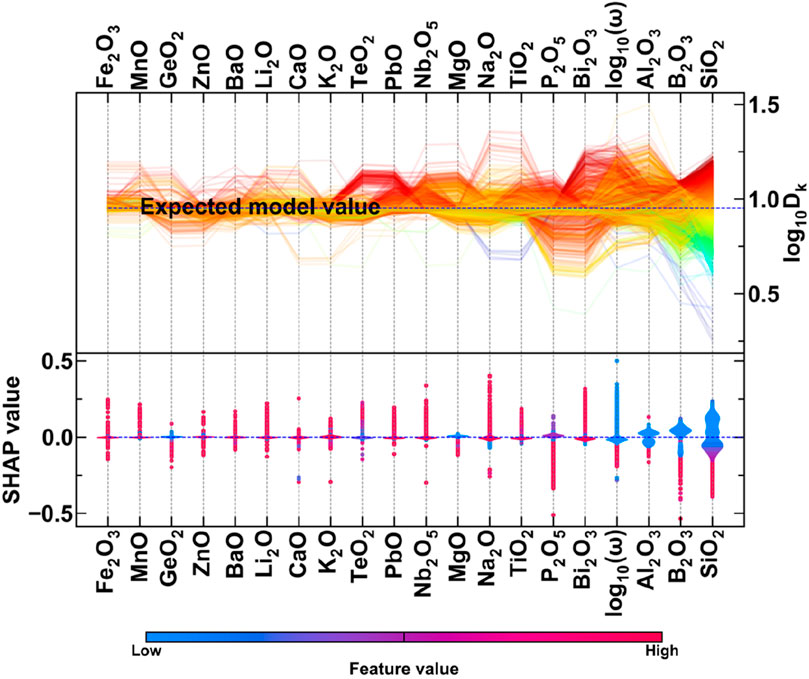
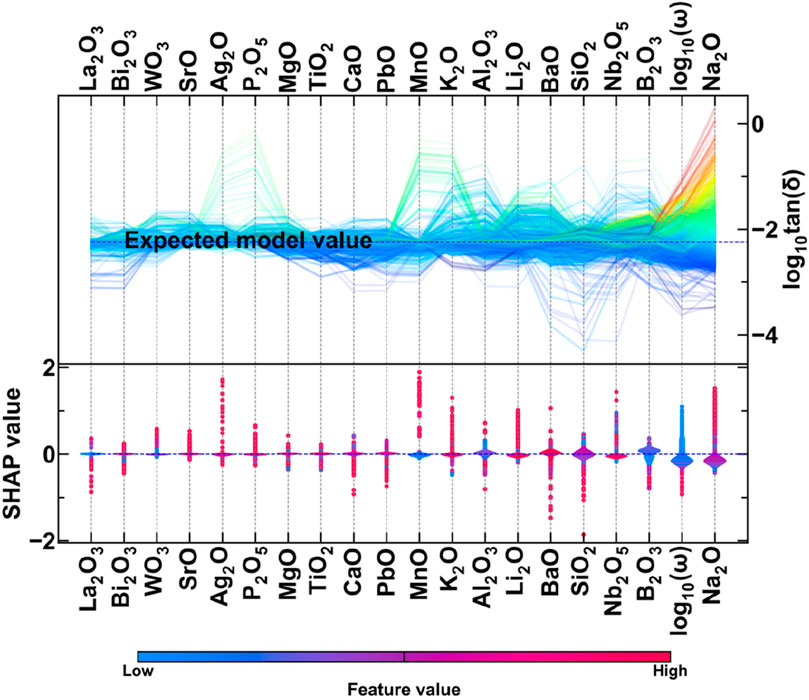
In this section, SHAP analysis is used to interpret the effect of compositions and testing conditions on the respective property values. For a given data point, i.e., composition and testing condition pair, the SHAP quantifies each input parameter’s contribution to the final output with respect to the mean value of the respective property. For instance, the SHAP value (s) corresponding to an input feature, f, with a value of x for a property, p, means that the presence of x amount of f increases the model prediction by s from the mean property value corresponding to all the input points in the training set (Cassar et al., 2021a; Zaki et al., 2022b; Bhattoo et al., 2023). In the following figures, we show SHAP river flow plots, which give the effect of each input parameter on individual data points, and SHAP scatter plots, which provide an explanation of the effect of individual feature values on the model predictions of the property values. In SHAP riverflow and scatter plots, the x-axis shows the name of the top 20 input features in descending order of their importance (right to the left), and the y-axis shows the effect of individual input features for a given data point. The importance of each feature refers to the mean absolute SHAP value obtained using the trained ML model. The input feature with the highest mean absolute SHAP value is considered as the most important feature. The colour of the line in the SHAP riverflow plot varies from blue to red, which corresponds to the minimum and maximum values of respective properties. In SHAP scatter plots, the x-axis is the same as used in the previous plot. However, the y-axis shows the SHAP value corresponding to each feature value. The blue-coloured shades of the point indicate low feature values, and the pink colour shades correspond to high feature values. The SHAP interaction plot is shown to reveal the joint effect of input features on the model predictions.
3.3.1 Individual feature effect on property values
3.3.1.1 Refractive index
The SHAP riverflow and scatter plot obtained using the trained machine learning model to predict refractive index as a function of composition and wavelength are shown in Figure 6. Like previous works, the network formers and intermediates govern the refractive index. Network modifiers have a smaller effect on refractive index predictions, in comparison to other chemical components. Network modifiers like Na2O and La2O have contrasting effects on the model predictions of refractive index. For example, with the increase in the molar concentration of Na2O, the refractive index predictions decrease. However, this is opposite in the case of La2O3. This interesting observation is the effect of wavelength, which is both positive and negative. With the increase in wavelength, the model predictions of refractive index decrease, and vice versa. This is because, when light is present, an electromagnetic wave interacts with the electronic structure of the chemical components of the materials, which then governs their refractive index. Hence, it interacts with network formers, modifiers, and intermediates to govern the refractive index predictions. This phenomenon is explained in Section 3.3.2.
3.3.1.2 Density
In this section, we show the effect of chemical compositions and temperature on the model predictions of density (Figure 7). It can be observed that the model predictions of density decrease with an increase in the concentration of network formers (SiO2 and B2O3) and modifiers (Na2O and K2O), and vice versa in case of intermediates (e.g., PbO and Bi2O3). In the case of temperature, it was observed that an increase in temperature decreases the model prediction of density and vice versa. For most materials, density decreases with increasing temperature. The interactions of temperature with other features are shown in the next section.
3.3.1.3 Dielectric constant
The effect of various input features governing the predictions of dielectric constant is shown in Figure 8. The network formers (SiO2, B2O3, and P2O5) decrease the model predictions of dielectric constant with an increase in their molar concentrations. However, network modifiers like Na2O, MgO, and K2O show mixed effects on model predictions. Further, the testing parameter (frequency) is the fourth most important parameter, preceded by network formers (SiO2 and B2O3) and intermediate (Al2O3). Higher frequencies cause a decrease in the predictions of dielectric constant due to faster changes in the polarized covalent bonds in glasses, and vice versa.
3.3.1.4 Loss tangent
In the case of loss tangent, unlike other properties where network formers and intermediates dominated the model predictions, network modifier Na2O is among the top-most loss tangent of loss tangent and increases the model predictions with an increase in its concentration (Figure 9). Network formers like B2O3 and SiO2 increase the model predictions of loss tangent with an increase in their respective molar concentrations. The intermediates like Al2O3 show mixed behavior where the SHAP value both increases and decreases with an increase in its molar concentrations. The frequency is the second most important loss tangent governing feature. Like the dielectric constant, the higher frequencies cause a decrease in the predictions of loss tangent and vice versa. In the next section, we will delineate the joint effect of input features on the property values using SHAP interaction plots.
3.3.2 SHAP interaction plots
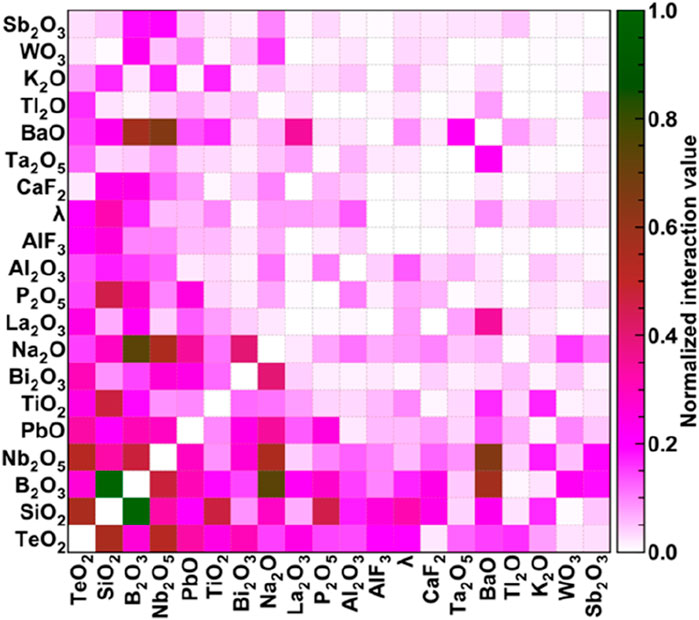
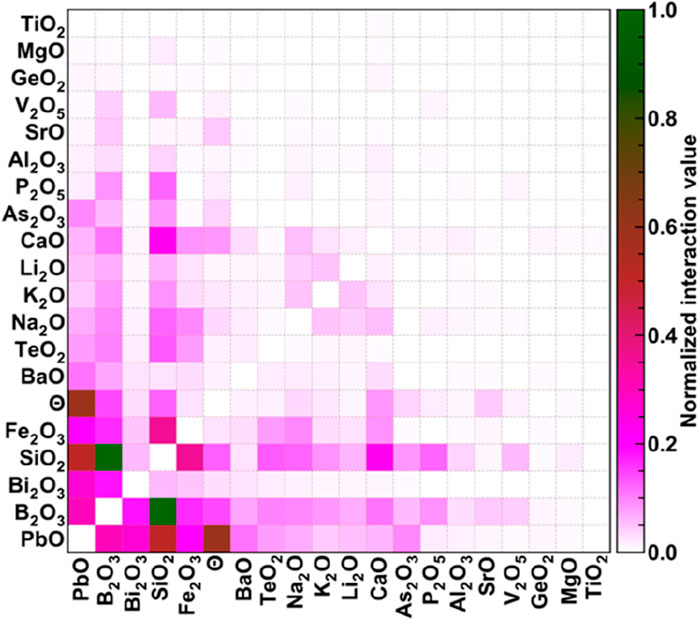
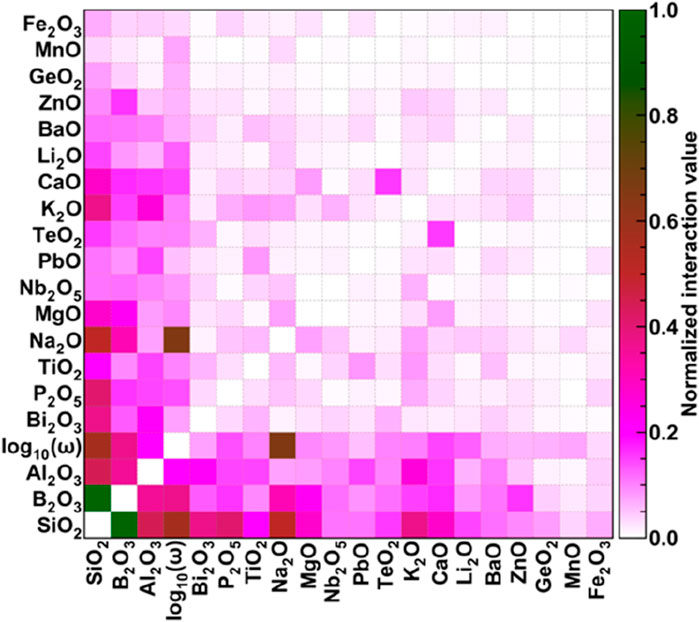
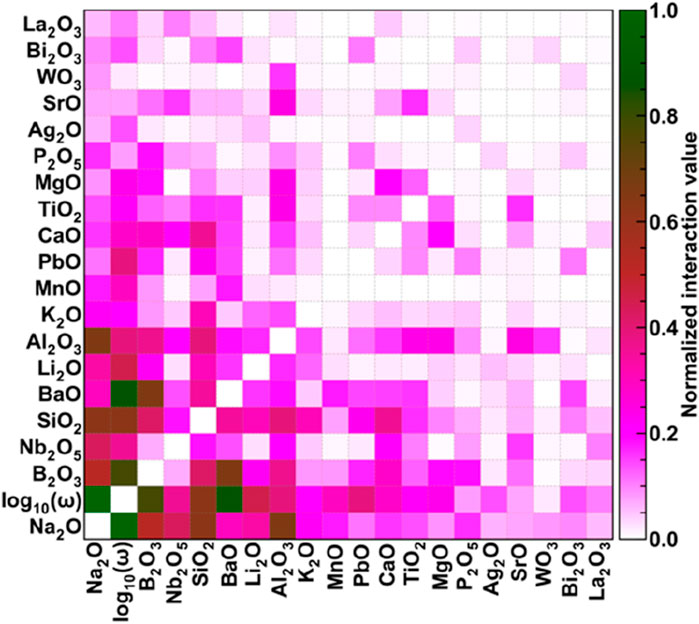
In this section, we will discuss the SHAP interaction plots showing the joint effect of top-20 input features on the properties of glasses. The diagonal of the SHAP interaction plot represents the effect of individual features, which has already been discussed in the previous section. Therefore, we have not shown those values in Figures 10–13 and choose to normalize the interaction values according to the maximum interaction among the features for respective properties. Hence, the group of features having maximum interactions is shown by dark green colour corresponding to normalized interaction of 1, the medium interaction is shown by the reddish colours, and low interaction is shown by pinkish colour, followed by negligible interaction reflected through white colour.
3.3.2.1 Refractive index
Figure 10 shows the SHAP interaction plots for the refractive index where the maximum interaction is between two network formers, i.e., SiO2 and B2O3. The other interesting interactions are between Na2O and B2O3 and interactions of Nb2O5 with TeO2, B2O3, Na2O, and BaO. In Figure 10, all the components have some interactions with the wavelength, irrespective of whether they are network formers, modifiers, intermediates, or others. Overall, network formers have higher interactions with the wavelength, followed by intermediates, others, and network modifiers.
3.3.2.2 Density
In Figure 11, the maximum interaction is again between two network formers, SiO2 and B2O3. An interesting phenomenon is that although a feature can be the most important for predicting the given property, it does not need to have maximum interaction with other input features. This is also observed by Bhattoo et al., 2023. for different properties of glasses. The testing parameter, i.e., the temperature in this case, has the highest interaction with PbO, which behaves as an intermediate in glasses, followed by interaction with network formers, SiO2 and B2O3. From Figure 11, it is also observed that the top 17 features, including temperature, have the highest interactions with each other.
3.3.2.3 Dielectric constant
In the case of the dielectric constant, chemical components like SiO2, B2O3, and Al2O3 interact with the maximum number of input features while predicting the dielectric constant. The dependent parameter, frequency, also has significant interactions with network former, modifiers, and intermediates. It has maximum interaction with Na2O, which is a network modifier, followed by SiO2, B2O3, and P2O5, which are network formers, and Al2O3 and TiO2, which are intermediates. Further, in the case of dielectric constant, stronger interactions are observed between network formers and modifiers, which also existed in the case of refractive index. However, stronger interactions between network modifiers and intermediates are observed for dielectric constant prediction, which was quite small in the case of previously studied properties.
3.3.2.4 Loss tangent
Figure 13 shows the SHAP interaction plot to explain the model prediction of loss tangent. Here, the maximum interaction is between the top governing features, which include network former, Na2O and frequency. Na2O also has significant interactions with network formers like B2O3, SiO2, and intermediates like Al2O3, and hence, it governs the predictions of loss tangent. Out of all the properties, the testing condition has maximum interaction with all kinds of input features in case of loss tangent. For example, the testing frequency has very high interactions with B2O3, BaO, SiO2, Li2O, Nb2O5, PbO, Al2O3, and MnO, to name a few.
4 Summary and conclusion
In this work, we use machine learning to predict the properties of glasses as a function of composition and testing variables. Specifically, the refractive index, dielectric constant, and loss tangent have wavelength/frequency as the dependent variable in addition to composition, and density is predicted as a function of composition and temperature. SHAP analysis is used to elucidate the local, global, and combined effect of input features on model predictions through riverflow, scatter, and interaction plots, respectively. The findings of this work can be summarised as:
1. Machine learning models can reasonably predict the glass properties while including the effects of composition and testing conditions.
2. The measurement of density for glass melts at high temperatures is a hazardous task. The highly accurate machine learning models can act as a safe tool for experimentalists to obtain the density of glasses and their melts at high temperatures.
3. In the case of refractive index, the importance of testing parameter is lowest as compared to density, dielectric constant, and loss tangent. Further, the electrical properties have the highest dependence on the testing variable (frequency).
4. While explaining model predictions for density, it was observed that with the increase in temperature, the density prediction decreases from the mean predicted value. Also, the interaction between testing temperature and network formers is more as compared to other components while predicting the density.
5. For both the electrical properties investigated in this work, i.e., dielectric constant and loss tangent, frequency can significantly influence the model’s output. Unlike refractive index and density, the testing variable interacts highly with all the input chemical components while predicting dielectric constant and loss tangent.
6. In the case of electrical properties, Na2O, a network modifier, has the highest interaction with the testing frequency while using a machine learning model for predictions.
Overall, machine learning models for property prediction, and SHAP analysis together provide valuable information to experimentalists and researchers to judiciously choose chemical components while developing glasses for targeted applications. The models developed in this work can only be used to predict properties of glasses for a fixed set of input chemical compositions and testing conditions shown to the model during the training. If the predictions are required for glasses with any new input chemical component subjected to additional processing and testing conditions, the model cannot do so. Another limitation of ML models is poor predictions on out-of-domain data. The properties of glasses also depend upon the processing conditions and jointly depend on temperature and wavelength. Therefore, further research is required to develop models independent of the input chemical components, including wide range of dependent variable and include features based on fundamental physics and chemistry-based descriptors.
Data availability statement
The data analyzed in this study is subject to the following licenses/restrictions: The dataset is taken from INTERGLAD software. Requests to access these datasets should be directed to https://www.newglass.jp/interglad_n/gaiyo/info_j.html.
Author contributions
MZ: Conceptualization, Data curation, Formal Analysis, Funding acquisition, Investigation, Methodology, Resources, Software, Validation, Visualization, Writing–original draft, Writing–review and editing. Jayadeva: Supervision, Writing–review and editing. NK: Funding acquisition, Methodology, Project administration, Resources, Supervision, Writing–review and editing.
Funding
The author(s) declare that financial support was received for the research, authorship, and/or publication of this article. NK acknowledges the funding support received from BRNS YSRA (53/20/01/2021-BRNS), and the Google Research Scholar Award. MZ acknowledges the funding received from the PMRF award by the Ministry of Education, Government of India.
Acknowledgments
The authors thank the High Performance Computing (HPC) facility at IIT Delhi for computational and storage resources.
Conflict of interest
The authors declare that the research was conducted in the absence of any commercial or financial relationships that could be construed as a potential conflict of interest.
Publisher’s note
All claims expressed in this article are solely those of the authors and do not necessarily represent those of their affiliated organizations, or those of the publisher, the editors and the reviewers. Any product that may be evaluated in this article, or claim that may be made by its manufacturer, is not guaranteed or endorsed by the publisher.
Supplementary material
The Supplementary Material for this article can be found online at: https://www.frontiersin.org/articles/10.3389/fmats.2024.1412701/full#supplementary-material
References
Akiba, T., Sano, S., Yanase, T., Ohta, T., and Koyama, M. (2019). “Optuna: a next-generation hyperparameter optimization framework,” in Proceedings of the 25th ACM SIGKDD international conference on knowledge discovery and data mining (New York, NY, USA: Association for Computing Machinery). doi:10.1145/3292500.3330701
Alcobaça, E., Mastelini, S. M., Botari, T., Pimentel, B. A., Cassar, D. R., de Carvalho, A. C. P. de L. F., et al. (2020). Explainable machine learning algorithms for predicting glass transition temperatures. Acta Mater. 188, 92–100. doi:10.1016/j.actamat.2020.01.047
Anoop Krishnan, N. M., Mangalathu, S., Smedskjaer, M. M., Tandia, A., Burton, H., and Bauchy, M. (2018). Predicting the dissolution kinetics of silicate glasses using machine learning. J. Non-Crystalline Solids 487, 37–45. doi:10.1016/j.jnoncrysol.2018.02.023
Bhattoo, R., Bishnoi, S., Zaki, M., and Krishnan, N. M. A. (2023). Understanding the compositional control on electrical, mechanical, optical, and physical properties of inorganic glasses with interpretable machine learning. Acta Mater. 242, 118439. doi:10.1016/j.actamat.2022.118439
Bishnoi, S., Badge, S., Krishnan, N., and Krishnan, N. M. A. (2022). Predicting oxide glass properties with low complexity neural network and physical and chemical descriptors. J. Non-Crystalline Solids. 616, 122488. doi:10.1016/j.jnoncrysol.2023.122488
Bishnoi, S., Ravinder, R., Grover, H. S., Kodamana, H., and Krishnan, N. M. A. (2021). Scalable Gaussian processes for predicting the optical, physical, thermal, and mechanical properties of inorganic glasses with large datasets. Mater. Adv. 2, 477–487. doi:10.1039/D0MA00764A
Bishnoi, S., Singh, S., Ravinder, R., Bauchy, M., Gosvami, N. N., Kodamana, H., et al. (2019). Predicting Young’s modulus of oxide glasses with sparse datasets using machine learning. J. Non-Crystalline Solids 524, 119643. doi:10.1016/j.jnoncrysol.2019.119643
Bødker, M. L., Bauchy, M., Du, T., Mauro, J. C., and Smedskjaer, M. M. (2022). Predicting glass structure by physics-informed machine learning. npj Comput. Mater 8, 192–199. doi:10.1038/s41524-022-00882-9
Brauer, D. S., Rüssel, C., and Kraft, J. (2007). Solubility of glasses in the system P2O5–CaO–MgO–Na2O–TiO2: experimental and modeling using artificial neural networks. J. Non-Crystalline Solids 353, 263–270. doi:10.1016/j.jnoncrysol.2006.12.005
Cassar, D. R. (2021). ViscNet: neural network for predicting the fragility index and the temperature-dependency of viscosity. Acta Mater. 206, 116602. doi:10.1016/j.actamat.2020.116602
Cassar, D. R. (2023). GlassNet: a multitask deep neural network for predicting many glass properties. Ceram. Int. 49, 36013–36024. doi:10.1016/j.ceramint.2023.08.281
Cassar, D. R., Mastelini, S. M., Botari, T., Alcobaça, E., de Carvalho, A. C. P. L. F., and Zanotto, E. D. (2021a). Predicting and interpreting oxide glass properties by machine learning using large datasets. Ceramics International 47, 23958–23972. doi:10.1016/j.ceramint.2021.05.105
Cassar, D. R., Santos, G. G., and Zanotto, E. D. (2021b). Designing optical glasses by machine learning coupled with a genetic algorithm. Ceram. Int. 47, 10555–10564. doi:10.1016/j.ceramint.2020.12.167
Chen, T., and Guestrin, C. (2016). XGBoost: a scalable tree boosting system. Proc. 22nd ACM SIGKDD Int. Conf. Knowl. Discov. Data Min., 785–794. doi:10.1145/2939672.2939785
Deng, B. (2020). Machine learning on density and elastic property of oxide glasses driven by large dataset. J. Non-Crystalline Solids 529, 119768. doi:10.1016/j.jnoncrysol.2019.119768
Dreyfus, C., and Dreyfus, G. (2003). A machine learning approach to the estimation of the liquidus temperature of glass-forming oxide blends. J. Non-Crystalline Solids 318, 63–78. doi:10.1016/S0022-3093(02)01859-8
Echezarreta-López, M. M., and Landin, M. (2013). Using machine learning for improving knowledge on antibacterial effect of bioactive glass. International Journal of Pharmaceutics 453, 641–647. doi:10.1016/j.ijpharm.2013.06.036
Interglad Ver (2020). Interglad Ver. Available at: https://www.newglass.jp/interglad_n/gaiyo/outline_e.html (Accessed December 14, 2020).
Liu, H., Zhang, T., Anoop Krishnan, N. M., Smedskjaer, M. M., Ryan, J. V., Gin, S., et al. (2019). Predicting the dissolution kinetics of silicate glasses by topology-informed machine learning. npj Mater. Degrad. 3, 32–12. doi:10.1038/s41529-019-0094-1
Lundberg, S. M., and Lee, S. I. (2017). “A unified approach to interpreting model predictions,” in Advances in neural information processing systems 30. I. Guyon, U. V. Luxburg, S. Bengio, H. Wallach, R. Fergus, and S. Vishwanathan, (Curran Associates, Inc.), 4765–4774. Available at: http://papers.nips.cc/paper/7062-a-unified-approach-to-interpreting-model-predictions.pdf.
Mandal, I., Mannan, S., Wondraczek, L., Gosvami, N. N., Allu, A. R., and Krishnan, N. M. A. (2023). Machine learning-assisted design of Na-Ion-Conducting glasses. J. Phys. Chem. C 127, 14636–14644. doi:10.1021/acs.jpcc.3c01834
Mannan, S., Zaki, M., Bishnoi, S., Cassar, D. R., Jiusti, J., Faria, J. C. F., et al. (2023). Glass hardness: Predicting composition and load effects via symbolic reasoning-informed machine learning. Acta Mater. 255, 119046. doi:10.1016/j.actamat.2023.119046
Singla, S., Mannan, S., Zaki, M., and Krishnan, N. A. (2023). Accelerated design of chalcogenide glasses through interpretable machine learning for composition–property relationships. J. Phys. Mater. 6, 024003. doi:10.1088/2515-7639/acc6f2
Varshneya, A. K., and Mauro, J. C. (2019). Fundamentals of inorganic glasses. 3rd edition. Amsterdam, Netherlands ; Cambridge, MA: Elsevier.
Zaki, M., Jan, A., Krishnan, N. M. A., and Mauro, J. C. (2023). Glassomics: an omics approach toward understanding glasses through modeling, simulations, and artificial intelligence. MRS Bull. 48, 1026–1039. doi:10.1557/s43577-023-00560-1
Zaki, M., Jayadeva, , and Krishnan, N. M. A. (2022a). Extracting processing and testing parameters from materials science literature for improved property prediction of glasses. Chem. Eng. Process. - Process Intensif. 180, 108607. doi:10.1016/j.cep.2021.108607
Keywords: inorganic glasses, material discovery, machine learning, testing conditions, dielectric constant, loss tangent, refractive index
Citation: Zaki M, Jayadeva and Krishnan NMA (2024) Interpretable machine learning for understanding compositional and testing condition effects on refractive index, density, dielectric constant, and loss tangent of inorganic melts and glasses. Front. Mater. 11:1412701. doi: 10.3389/fmats.2024.1412701
Received: 05 April 2024; Accepted: 22 July 2024;
Published: 18 September 2024.
Edited by:
Jincheng Du, University of North Texas, United StatesReviewed by:
Ahmed El-Fiqi, National Research Centre, EgyptHaizheng Tao, Wuhan University of Technology, China
Copyright © 2024 Zaki, Jayadeva and Krishnan. This is an open-access article distributed under the terms of the Creative Commons Attribution License (CC BY). The use, distribution or reproduction in other forums is permitted, provided the original author(s) and the copyright owner(s) are credited and that the original publication in this journal is cited, in accordance with accepted academic practice. No use, distribution or reproduction is permitted which does not comply with these terms.
*Correspondence: Jayadeva, amF5YWRldmFAZWUuaWl0ZC5hYy5pbg==; N. M. Anoop Krishnan, a3Jpc2huYW5AaWl0ZC5hYy5pbg==
 Mohd Zaki
 Jayadeva
 N. M. Anoop Krishnan