
94% of researchers rate our articles as excellent or good
Learn more about the work of our research integrity team to safeguard the quality of each article we publish.
Find out more
ORIGINAL RESEARCH article
Front. Mater., 12 July 2023
Sec. Energy Materials
Volume 10 - 2023 | https://doi.org/10.3389/fmats.2023.1209149
This article is part of the Research TopicInnovators in Energy MaterialsView all 4 articles
 O. Ivanova1†
 W. Lüke2
 K. Nemkovski1†
 M.-S. Appavou1N. K. Szekely1V. Pipich1
 H. Frielinghaus1
 M. Monkenbusch3R. Zorn3W. Lehnert2,4
 O. Holderer1*
The design of suitable and efficient membranes for fuel and electrolyzer cells has been a long standing problem that still seeks for technical improvements. The structural properties of proton conducting poly [2,2-(m-phenylene)-5,5-bibenzimidazole] (PBI) membranes doped with phosphoric acid as electrolyte have been investigated prior and after thermal treatment by small angle neutron scattering (SANS), neutron diffraction with polarization analysis and transmission electron microscopy (TEM). Our observations indicate that during the first heating attempt stable crystalline domains in the PBI are formed and they persist in all further thermal cycles typical for electrolyte membrane operation. The combination of real space TEM picture under cryogenic conditions and reciprocal space scattering pattern with enhanced contrast by partial deuteration allows obtaining unique insight into the structure of proton conducting membranes, i.e., characteristic distances associated with irreversible changes as well as volume fraction of the different phases of the sample.
Different polymeric membranes are candidates for polymer electrolyte fuel cells (PEFC) Page et al. (2012); Wang et al. (2011). High temperature polymer electrolyte fuel cells (HT-PEFC) operating at elevated temperatures between 100°C and 200°C (mainly in the range 140°C–180°C) are an interesting class of PEFCs with advantages for certain applications Kreuer (2013); Asensio et al. (2004). The most common material studied for low temperature polymer electrolyte fuel cells (LT-PEFC), operating at temperatures below 100°C is Nafion®Page et al. (2012); Schmidt-Rohr and Chen (2008); Moilanen et al. (2008). Operating temperatures above 100°C in HT-PEFCs simplify significantly the water management during operation, since water is mainly present in the vapour phase. The CO tolerance is also better in HT-PEFCs compared to the LT-PEFC counterparts. The typical application range is at medium power (in the order of 5 kW) Liu et al. (2016). At the heart of a HT-PEFC is the proton conducting polyelectrolyte membrane between anode and cathode of the cell. The properties in terms of ion conduction and chemical stability are key for the performance of a HT-PEFC and are widely studied Kreuer (2013); Li et al. (2009); Wannek et al. (2009a). The operation temperatures of HT-PEFC above 100°C in acidic environment require polymerswith excellent thermal and chemical stability, one promising material being poly (2,5-benzimidazole)-based (PBI) membranes Wannek et al. (2009b). The aromatic backbone is the reason for its good thermal and chemical stability and its high glass transition temperature Kreuer (2013); Di et al. (2012). Due to the basic nature of PBI it can be doped with large amounts of phosphoric acid (PA) as an electrolyte, which has a high proton conductivity Vilciauskas et al. (2012) and provides in combination with the scaffolding PBI material a well-performing proton conducting membrane Maier et al. (2012). Conductivity data of phosphoric acid and PBI are presented in Ref. Korte et al. (2016). A recent review on PBI based membranes can be found in Ref. Aili et al. (2020).
The structure of the polymer membrane in PEFCs is an important parameter for the thermal stability and ageing of the membrane under the harsh operating conditions, and also has an influence on the conductivity due to the confinement of the electrolyte inside the porous membrane. Many studies of Nafion-based perfluorosulfonic acid (PFSA) membranes for LT-PEFCs use small angle scattering (SANS) for structural investigations Schmidt-Rohr and Chen (2008); Moilanen et al. (2008); Haubold et al. (2001); Elliot et al. (2000). Molecular dynamics (MD) simulations of a hydrated perfluoro sulfonyl imide (PFSI) model system address the question how nanostructure and proton transport are related Idupulapati et al. (2011). The relationship between structure and transport for similar systems was investigated recently in details Berrod et al. (2015). X-ray radiography Maier et al. (2012) and tomography Eberhardt et al. (2015) as well as neutron imaging Boillat et al. (2014); Arlt et al. (2015) served as tools to study HT-PEFC fuel cells or different part of its core component, the membrane electrode assembly (MEA). Structural length scales of a similar ABPBI membrane were investigated on a broad range of length scales with microscopic and scattering techniques Ivanova et al. (2017). The swelling of the PBI membrane upon doping with an alkali ion conductor has been investigated with SANS and prompt gamma activation analysis Babcock et al. (2019). Phosphoric acid diffusion in the swollen PBI membrane has been measured with quasielastic neutron scattering and analyzed by a fractal diffusion model Hopfenmüller et al. (2018). Aili et al., stated that the degree of crystallinity of PBI membranes increases under heating, which results in creating highly proton conducting pathways through the membrane cross-section by forcing phosphoric acid into the amorphous regions Aili et al. (2012). However, details of structural changes and its interpretation are lacking. This report aims of shedding light on the mesoscopic structural changes of the PBI membrane demonstrating irreversibility of these changes under thermal cycles from room temperature to typical operating temperatures of HT-PEFCs with neutron scattering and diffraction as well as with transmission electron microscopic techniques.
The membrane material poly [2,2-(m-phenylene)-5,5-bibenzimidazole] (PBI) was obtained from Danish Power Systems or Fumatech and doped with phosphoric acid according to the following (standard) procedure: The pristine
Sample preparation for both neutron experiments was similar apart from the different sample holder geometry (standard sandwich cell with quartz windows for the small angle scattering experiment and flat aluminium container for diffraction) and sample environment (furnace and closed cycle cryofurnace, respectively). Several sheets of dPA-doped PBI membrane were stacked together under Argon atmosphere and hermetically sealed in a PFA foil sachet in order to achieve the necessary sample volume and to prevent losing deuterated PA (dPA) by pumping in the diffraction experiment. The resulting samples have been measured at several temperatures (from RT temperature to 180°C and back) with equalibration time of 30 min. The temperature range is chosen in order to cover effect of water loss (above 80°C) and change from phosphoric acid (H3PO4) to pyrophosphoric acid (H4P2O7) above 140°C. The heating stages and temperatures presented for SANS and neutron diffraction are explained in more detail in the corresponding Section 3, Results and Discussion.
With small angle neutron scattering (SANS), the ensemble averaged structure of the sample on length scales of nm to μm can be probed in reciprocal space where the modulus of the scattering vector Q is linked to the real space distance d. The average distance between the particles can be estimated by d ∼ 2π/QTeixeira (1988).
Our SANS experiments presented in this paper were conducted at the KWS-2 beam line Radulescu et al. (2012) operated by Jülich Centre for Neutron Science at the FRM-II reactor, Heinz-Maier-Leibnitz Zentrum (MLZ), Garching. Two sample-to-detector distances of 2 and 8 m have been used to obtain a Q-range of 0.006 < Q < 0.3 Å−1 with a wavelength of 4.97 Å and 8 × 8 mm2 sample aperture. The instrument had a velocity selector with a wavelength spread of δλ/λ = 0.2. SANS data were corrected with the usual procedure for instrumental background, sample transmission and detector sensitivity. The freely available software QtiKWS Pipich (2012) has been used for SANS data treatment.
SANS experiments allow to extract parameters such as the volume fraction of two different phases of the sample with a model-independent approach by determining the scattering invariant Porod (1982). The scattering invariant INV reads:
with the difference in scattering length density between the two phases, Δρ and the volume fraction of one phase with respect to the other, Φ.
The Q-dependent scattering intensity has a power law decay of the form I(Q) ∝ Q−p at low Q typical for a fractal structure at this range of length scales, with an exponent p which indicates the fractality of the structure. At larger Q a correlation peak appears which indicates a typical characteristic repeat distance within the sample. Developed for bicontinuous microemulsions, the Teubner-Strey formula Teubner and Strey (1987) describes such correlations with a typical repeat distance d and a correlation length in the sample, ξ:
The characteristic length scale d can be simply obtained from Q0 and the correlation length ξ is a measure how “crumpled” the structures are.
Neutron diffraction experiments that give access to the higher q-values compared to SANS data, have been conducted at the diffuse neutron scattering spectrometer with polarization analysis DNS Su et al. (2015); Schweika and Böni (2001) operated by Jülich Centre for Neutron Science at the FRM-II reactor, Heinz-Maier-Leibnitz Zentrum (MLZ), Garching. The measurements have been performed with an incident wavelength λ = 4.2 Å that allows to cover the Q-range from 0.2 to 2.5 Å−1.
Despite using deuterated phosphoric acid, all our samples still contain a high amount of hydrogen. Due to its huge spin incoherent scattering cross-section, a strong shapeless incoherent background is found under the scattering from the structural correlations. In order to separate the coherent and incoherent differential cross sections in the DNS experiment we have used neutron polarization analysis. Neutron polarization was chosen to be perpendicular to the scattering plane. We have measured separately the intensities with and without flipping of the neutron polarization. Raw data have been corrected for detector efficiency and for the flipping ratio Stewart et al. (2009). Combining spin-flip and non-spin-flip Schärpf and Capelmann (1993); Stewart et al. (2009) we have separated the coherent and incoherent contributions. The coherent intensity provides information on the structural correlations. The incoherent signal is an independent quantification of the hydrogen amount in the sample. Below we present results of the diffraction experiments as a ratio of the coherent to incoherent scattering. In this representation the incoherent scattering term serves as an internal calibration factor for the coherent one. Such a calibration allows to get rid of the effects of sample size and geometry, as well as of influence of the inelastic scattering on the detector efficience Gaspar et al. (2010).
Two samples have been used: a fresh sample with 377% of D3PO4, and the sample previously used in our quasielastic neutron scattering experiments Hopfenmüller et al. (2018) with 558% of D3PO4. Background from the PFA foil has been measured and subtracted. Data reduction has been performed using the “dnsplot” interface of plot.py package Glavic.
In real space, TEM provides a view onto the PA-swollen PBI membrane on similar length scales as SANS (although without the possibility to perform in situ heat cycles). Therefore only the initial structure of the PBI membrane filled with phosphoric acid could be investigated.
Two resulting doped membranes were cut into pieces sized 3.5 × 10 mm. The obtained pieces were stacked and placed in a Leica FC7 cryo-ultra-microtome holder. The large-area sides were protected with Teflon tape and only the side perpendicular to the surface was cryo-sectioned: 100 nm sections of PBI polymer were produced by cryo-sectioning at −90°C in liquid nitrogen atmosphere using a glass knife with a clearance angle of 4°. The aim of using cryo-sectioning was to harden the specimen block. The sections were collected and deposited onto 100–200 mesh bare gold grids. Samples and grids were stored in Argon atmosphere when not used. The specimens were inserted into a Multi-Specimen Cryo Transfer Holder (Model 910, Gatan, Munich, Germany) and transferred to a JEM 2200 FS EFTEM instrument (JEOL, Tokyo, Japan). Experiments were carried out at temperatures around −180°C and a vacuum of 2.85 × 10⁻⁶ Pa. The transmission electron microscope was operated at an acceleration voltage of 200 kV. Zero-loss filtered images, enhancing the contrast, were recorded digitally by a bottom-mounted 16 bit CCD camera system (FastScan F214, TVIPS, Munich, Germany). Images of the PBI membrane slices (perpendicular to the surface) have been taken with the EMenu 4.0 image acquisition program (TVIPS, Munich, Germany) and processed with a free digital imaging processing system Image J Rasband (2012); Abràmoff et al. (2004); Schneider et al. (2012).
The temperature dependence of the structure of PBI membranes doped with D3PO4 has been studied with SANS on nanometer scale prior to heating to the typical operation temperature of HT-PEFCs and and at elevated temperatures in the range of operating temperatures. Figure 1 (left) shows two curves of the small angle scattering data for the initial membrane (top) measured at a temperature of 80°C (which is identical to the measurement at lower temperature), and the same membrane heated for the first time to the 140°C (bottom). Any further cooling and heating of the membrane resulted in no further change. The structures developed during the first heating cycle and discussed in more detail below remained also after cooling down and in all further heating cycles without additional changes.
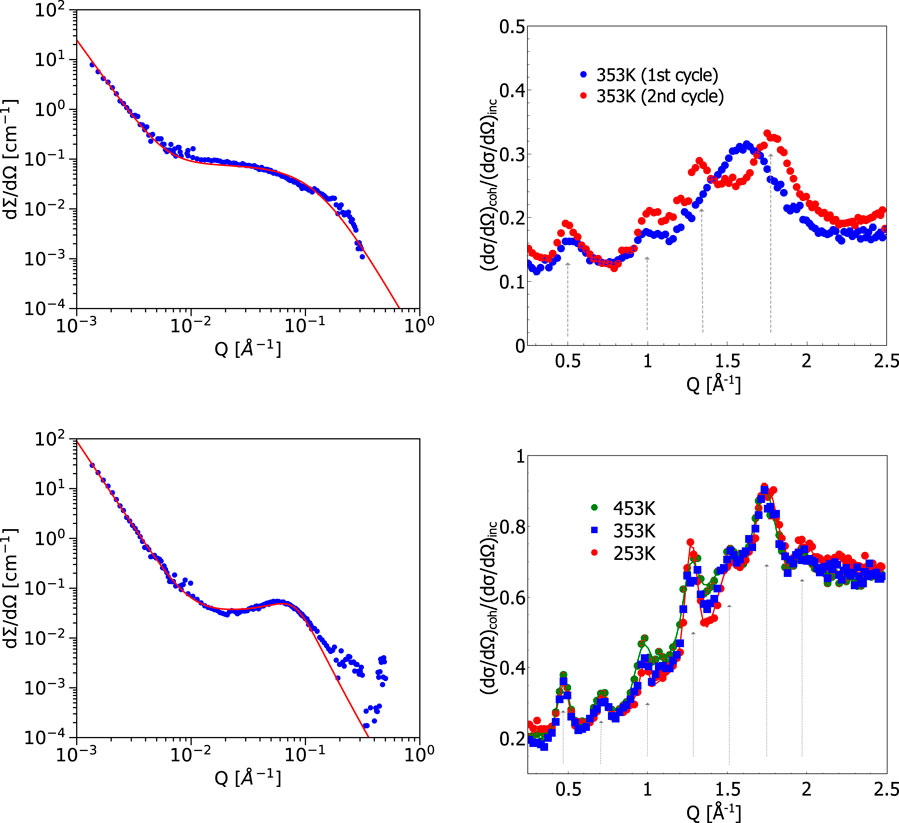
FIGURE 1. Left: Small angle neutron scattering data from phosphoric-acid-doped membrane: Top left: membrane measured at 80°C or 353 K and the same membrane heated to 140°C or 413 K (bottom left). The correlation peak at q
The SANS intensity resulting from the measurement of PBI membrane doped with dPA at 80°C is fitted with a model combining the power law decay and the Teubner-Strey description for the broad shoulder at larger Q:
The resulting parameters for the low temperature phase were Q0 = 0.03 ± 0.001 Å−1, d = 2π/Q0 = 20.9 ± 0.5 nm and ξ = 0.8 ± 0.1 nm.
The power law decay of the second term with I1Q−p describes the large scale fractal structure of the membrane at small Q-values. It is then followed by the broad shoulder, described with Eq. 2, which finally results in a Q−4 decay at large Q. The broad structure reflects the network of PBI strands in the swollen membrane.
As one can see from Figure 1 (left, bottom), for the measurement at 140°C the shoulder at large Q developed into a much more pronounced correlation peak. This has been accounted for by a second contribution of the form of Eq. 2. The high temperature SANS intensity ITS,HT(Q) is fitted with the following function:
which results in Q0,HT = 0.073 ± 0.001 Å−1, dHT = 2π/Q0,HT = 8.6 ± 0.1 nm and ξHT = 3.2 ± 0.3 nm.
The second Teubner-Strey contribution indicates that an additional structure with a characteristic average distance between the emerged objects, dHT, has been created.
The scattering invariant gives a hint on the volume fraction occupied by one phase in a two phase system. If we take only the fitted component from ITS(Q) and integrate it over Q, this leads to an indication of the volume fraction of the part of additionally emerged structure after the first heating cycle. Here, we find that the resulting volume fraction of the additional phase after heating is Φ = 0.04. We assumed here that the difference in scattering length density between the amorphous phase and the crystalline phase of PBI is approximately 0.5 × 10⁻⁶ Å−2.
Crystalline polymers are typically denser than amorphous ones Kholodovych and Welsh (2007), thus we assume here an increase in density by a factor typical for polymers of about × 1.16 resulting in the estimate of the scattering length densities above. From the weight measurements during sample preparation the ratio between polymer and phosphoric acid is approximately 1:4, i.e., one may assume that only 20% of the sample consists of polymer. The part exhibiting a clear correlation peak from the Teubner-Strey analysis of the heated sample however can be attributed to 4% only, which we interprete as the formation of small crystalline PBI domains within the strands of amorphous PBI matrix. Following this estimation with the crystal volume fraction 0.04 and the polymer fraction 0.17, we have Φpolymer − Φcryst = 0.13 left for amorphous polymer parts connecting and surrounding the crystals. The corresponding size qua diameter of the crystals is similar to the correlation length 8.6 nm from the Teubner-Strey analysis. Assuming spherical particles with r = ξ/2, this leads to a number of crystalline particles of N = 0.04/Vsphere = 2.3 × 10²¹ particles per cubic centimeter. With an average distance between the crystals of d = 8.6 nm, the maximum thickness of the connecting amorphous polymer strands can then be estimated by distributing the remaining 16% of polymer volume to thin cylinders, resulting in
The Porod part of the scattering (I1Q−p in Eq. 3 with p = 3.2 and 3.6 for the initial and tempered membrane) can be connected to large scale inhomogeneities. It can be seen in a context of gels where large scale inhomogeneities are described by a Debye-Bueche scattering function (although we do not see the Guinier region here). It is characterized by a typical length scale of the inhomogeneity, R, and can be obtained from the slope at low Q of the SANS data. Since I (Q) of SANS is measured in absolute units it can provide the relevant length scale. Just from the Porod behaviour by taking the lowest-Q data point and assuming an ideal Q−4 dependence, the following relation is used:
For the inhomogeneities we assume a contrast obtained from crystalline vs. amorphous PBI. For the concentration of crystalline PBI we assume ϕ = 0.2 × 0.04 from considerations above. So we arrive at inhomogeneities of the size of either approx. 2 μm or 400 nm before and after the first heating to elevated temperatures. The latter value also seems to be motivated by the large scale brightness change of Figure 2.
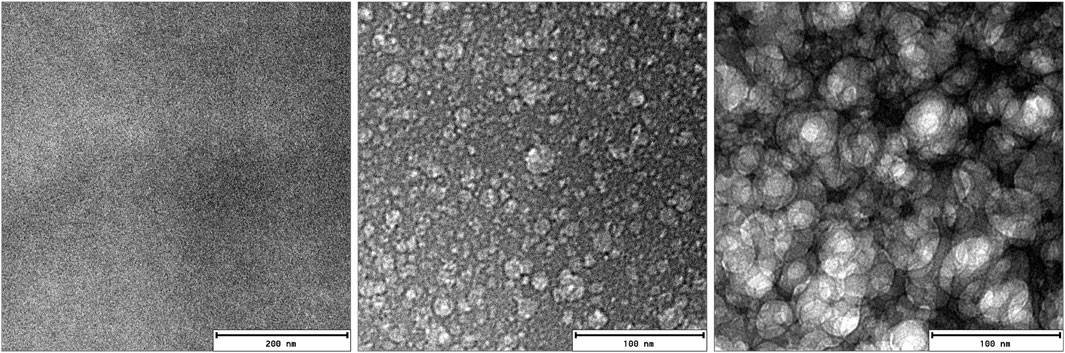
FIGURE 2. Cryo-transmission electron microscopy images (cryo-TEM) of PA-doped PBI domains on the same location at 500–1000 ms intervals each. Beam heating led to the structural contrast from the initially homogeneous sample. The middle image reveals the spots where the phosphoric acid is trapped prior the massive beam damage depicted in the third image.
The same effect of crystallite formation upon first heating of the membrane has been revealed at higher Q-values (sub-nm distances in real space) in the diffraction experiment. As one can see in Figure 1 (top right), the broad diffuse pattern at 1.6 Å−1 corresponding to 3.9 Å transforms upon heating, thus leading to the formation of a number of relatively well-defined peaks at the following Q-values: 0.5, 1, 1.25 and 1.75 Å−1. On length scales of characteristic molecular distances this indicates the higher degree of morphological ordering. This sharpening of the Bragg peaks in the sample after the first heating to 140°C reflects the formation of small PBI crystals, which are also responsible for the additional contrast in the SANS experiment with the pronounced additional correlation peak from the average distance between those semi-crystal particles. A previously heated sample doped with a higher amount of phosphoric acid is shown in Figure 1 bottom right. It demonstrates the irreversibility of the produced semi-crystalline structures. One may notice the different ratio of the coherent and incoherent contributions for these samples. However, the lower ratio in Figure 1 (top right) indicates the presence of high amount of hydrogen in the system, which is consistent with a moderate PA concentration of the sample. The Q-values of the peak positions indicated in the figures can be related to the following distances: 13.4 Å, 8.9 Å, 6.4 Å, 4.9 Å, 4.2 Å, and 3.6 Å. These distances correspond to certain inter- and intra-chain correlations, i.e., the inter-segmental distance between polymer chains as well as interatomic distances between phosphoric acid molecules appearing during dehydration of phosphoric acid (formation of pyro-phosphoric acid and water above 140°C) in accordance with the available literature information [see, e.g., References Trisno et al. (2022); Persson et al. (2018)]. The changes in the structure slow down dramatically after the first heating and main changes remains after multiple subsequent cooling and heating cycles, as shown in Figure 1 (bottom right) for a sample with an even higher content of PA, where we have observed sharper peaks at similar distances after several heating and cooling cycles. This can be considered as an evidence of irreversible thermally induced formation of a (semi-)crystalline structure during operation at elevated temperatures.
Transmission electron microscopy (TEM) has been used to highlight the structure of a swollen membrane. In real space, TEM provides a view onto the PA-swollen PBI membrane on similar length scales as SANS. However it lacks the possibility to perform thermal cycles during the measurements. Therefore only the initial structure of the PBI membrane filled with phosphoric acid could be investigated. Figure 2 shows cryo-TEM images on the very same location (although in two different magnifications) at few-milliseconds intervals. Initially there is no contrast between the PA and PBI domains and only a fully unstructured image is visible. The structural features of the membrane emerge then in subsequent images. It is obvious from this series of images that the phosphoric-acid-doped membrane inside the cryo-TEM is very sensitive to electron irradiation. At the low pressure (of 2.85 × 10⁻⁶ Pa), the vapor pressure of PA or remaining water contents might result in an evaporation at the outer parts of the membrane, making the remaining thermally more stable polymer structure appear. Pure PBI membranes show almost no structure in the TEM, as has been shown, e.g., in Ref. Holderer et al. (2015) for a similar (ABPBI) membrane.
Radiation induced damage can be exploited in cryo electron microscopy to highlight structures otherwise not visible. For example, in polymer science, Talmon’s group has used “radiation induced […] formation of a high contrast network in the specimen” due to the presence of ice layer on organic film, Talmon et al. (1986) and references therein. In the case of polymer blends, the different sensitivities of the polymeric components can result in a stronger mass loss in one component than in another, yielding a development of contrast at the start of irradiation in the electron microscope. See Michler (2008) and references therein. According to the pressure-temperature phase diagram of H3PO4, the boiling point of the phosphoric acid is at −124°C under a vacuum of 3 × 10⁻⁶ Pa which is the vacuum condition in the TEM column during a cryo-TEM experiment. Although the cryo-TEM experiment is performed at ca. −180°C, the area exposed to the electron beam may be warmer locally, inducing the beam damage in the H3PO4 sites in the PBI membrane. Thus, electron beam focussing reveals the structure of the film, presumably by PA or residual water evaporation due to local heating. The resulting larger areas where the structure surrounding the created holes emerges (see Figure 2) might be interpreted as the area where the crystalline regions can be formed in the first thermal cycle.
Figure 3 illustrates the schematic picture from these considerations for a swollen PBI membrane (left), initially in a fully amorphous state (left part of Figure 3), and after the first heating cycle with crystalline domains (right part of Figure 3). From our SANS results the microscopic picture of the PA-swollen PBI membrane can be represented by a continuous network of PBI strands with a diameter of about 3.2 nm, which is filled with PA. After the first heating cycles, about 1/5 of the PBI material forms crystalline clusters, which have an average distance from each other of about 8.6 nm and a diameter of roughly 3.2 nm. This is depicted by the sub-structures in Figure 3 (right). Neutron diffraction confirmed the increase of crystalline domains by a decrease of the width of the Bragg peaks. Also TEM images of swollen PBI membranes are consistent with this picture and the suggested structure of a swollen PBI network. The formation of crystalline domains seems to be an irreversible process, once the correlation peak is formed as shown by our neutron scattering data it stays for subsequent heating/cooling cycles.
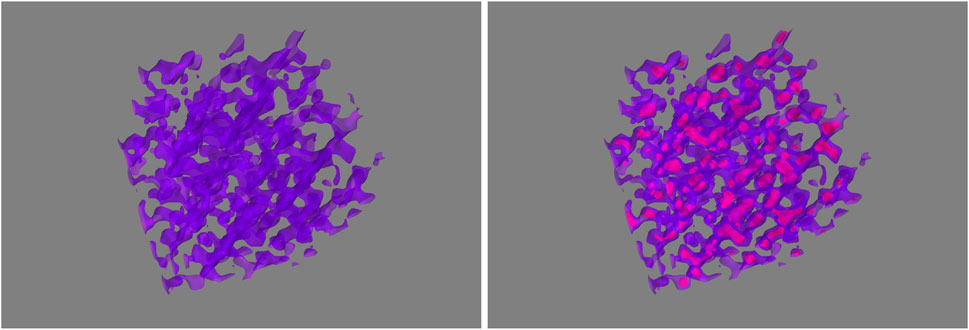
FIGURE 3. Illustration of the suggested structure of phosphoric-acid-doped PBI membrane before and after first heating. The initial PBI scaffold is shown left (PA areas are represented by the voids in polymeric structure). After the first thermal cycle crystallization most probably takes place in small domains within the initially mainly amorphous scaffold (right, with additional crystallization domains).
Structural properties of phosphoric-acid-doped PBI membranes before the first use and after the first heating to operating temperatures have been investigated on length scales from atomic distances to micrometres with different neutron scattering techniques and electron microscopy. Scattering experiments allowed to observe the nano-structure of phosphoric-acid-doped PBI membranes under temperature conditions similar to operating conditions of the high-temperature fuel cells. Deuterated phosphoric acid has been used to achieve suitable contrast.
We found out that the first heating to the operating temperature of 140°C leads to a formation of a correlation peak significantly stronger than the shoulder-like broad slope of the initial sample. We interpret this as the formation of crystalline clusters in the thicker connecting points of the PBI network, which leads to an additional contrast with a characteristic repeat distance. Thermal cycles (not all curves are shown) indicate that only during the first heating of a PBI membrane, additional crystalline structures are created, most probably in small domains of the highly swollen PBI network. This higher crystalline ordering after heating the PBI structure for the first time is an irreversible process, and it can be speculated in which way such structures influence the mechanical stability of the membrane. Analysis of the scattering invariant together with peak position and correlation length of the additional peak allowed to deduce geometrical parameters of the PBI scaffold.
By combining small angle neutron scattering and neutron diffraction in reciprocal space with cryo-TEM images in real space a consistent picture of phosphoric-acid-swollen PBI membranes for fuel cell applications could be drawn. The overall picture obtained from cryo-TEM seems to be consistent with the initial stage of the phosphoric-acid-doped PBI membrane. Additionally, electron beam damage has been used to observe the structure of the chemically and thermally stable PBI membrane under cryogenic conditions. Further studies would be required to shed a light on the mechanical influence of the formation of the crystalline domains in phosphoric-acid-doped PBI membranes for high-temperature fuel cells.
The raw data supporting the conclusion of this article will be made available by the authors, without undue reservation.
Conception and idea from OI, OH, and WL. Experiments by OI, KN, NS, and M-SA. Data evaluation and analysis by OI, OH, KN, M-SA, NS, VP, RZ, and MM. Writing of the paper by OH, OI, HF, KN, and RZ. All authors contributed to the article and approved the submitted version.
This work is based upon experiments performed at KWS-2 and DNS instruments operated by JCNS at Heinz Maier-Leibnitz Zentrum Garching, Germany. We are very thankful for allocating beamtime and providing excellent equipment. We appreciate the valuable input of Dr. Bernhard Hopfenmüller and help with the experiments. Also, we would like to thank Dr. Marina Ganeva and Prof. Dr. Dieter Richter for fruitful discussions.
The authors declare that the research was conducted in the absence of any commercial or financial relationships that could be construed as a potential conflict of interest.
All claims expressed in this article are solely those of the authors and do not necessarily represent those of their affiliated organizations, or those of the publisher, the editors and the reviewers. Any product that may be evaluated in this article, or claim that may be made by its manufacturer, is not guaranteed or endorsed by the publisher.
Abràmoff, M. D., Magalhães, P. J., and Ram, S. J. (2004). Image processing with imagej. Biophot. Int.11, 36–42.
Aili, D., Cleemann, L. N., Li, Q., Jensen, J. O., Christensena, E., and Bjerruma, N. J. (2012). Thermal curing of pbi membranes for high temperature pemfuel cells. Juornal Mater. Chem.22, 5444–5453. doi:10.1039/C2JM14774B
Aili, D., Henkensmeier, D., Martin, S., Singh, B., Hu, Y., Jensen, J. O., et al. (2020). Polybenzimidazole-based high-temperature polymer electrolyte membrane fuel cells: New insights and recent progress. Electrochem. Energy Rev.3, 793–845. doi:10.1007/s41918-020-00080-5
Arlt, T., Lüke, W., Kardjilov, N., Banhart, J., Lehnert, W., and Manke, I. (2015). Monitoring the hydrogen distribution in poly(2,5-benzimidazole)-based (ABPBI) membranes in operating high-temperature polymer electrolyte fuel cells by using H-D contrast neutron imaging. J. Power Sources299, 125–129. doi:10.1016/j.jpowsour.2015.08.094
Asensio, J. A., Borro, S., and Gomez-Romero, P. (2004). Polymer electrolyte fuel cells based on phosphoric acid-impregnated poly(2,5-benzimidazole) membranes. J. Electrochem. Soc.151, A304–A310. doi:10.1149/1.1640628
Babcock, E., Szekely, N., Konovalova, A., Lin, Y., Appavou, M. S., Mangiapia, G., et al. (2019). Using neutron methods sans and pgaa to study evolution of structure and composition of alkali-doped polybenzimidazole membranes. J. Membr. Sci.577, 12–19. doi:10.1016/j.memsci.2019.01.026
Berrod, Q., Lyonnard, S., Guillermon, A., Ollivier, J., Frick, B., Manseri, A., et al. (2015). Nanostructure and transport properties of proton conducting self-assembled perfluorinated surfactants: A bottom-up approach toward PFSA fuel cell membranes. Macromolecules48, 6166–6176. doi:10.1021/acs.macromol.5b00770
Boillat, P., Biesdorf, J., Oberholzer, P., Kaestner, A., and Schmidt, T. J. (2014). Evaluation of neutron imaging for measuring phosphoric acid distribution in high temperature pefcs. J. Electrochem Soc.161, F192–F198. doi:10.1149/2.023403jes
Conti, F., Majerus, A., Noto, V. D., Korte, C., Lehnert, W., and Stolten, D. (2012). Raman study of the polybenzimidazole-phosphoric acid interactions in membranes for fuel cells. Phys. Chem. Chem. Phys.14, 10022–10026. doi:10.1039/c2cp40553a
Di, S., Yan, L., Han By, S., Feng, Q., Xie, L., Chen, J., et al. (2012). Enhancing the high-temperature proton conductivity of phosphoric acid doped poly(2,5-benzimidazole) by preblending boron phosphate nanoparticles to the raw materials. J. Power Sources211, 161–168. doi:10.1016/j.jpowsour.2012.03.091
Eberhardt, S. H., Toulec, M., Marone, F., Stampanoni, M., Büchi, F. N., and Schmidt, T. J. (2015). Dynamic operation of ht-pefc: In-operando imaging of phosphoric acid profiles and (re)distribution. J. Electrochem Soc.162, F310–F316. doi:10.1149/2.0751503jes
Elliot, J. A., Hanna, S., Elliot, A. M. S., and Cooley, G. E. (2000). Interpretation of the small-angle X-ray scattering from swollen and oriented perfluorinated ionomer membranes. Macromolecules33, 4161–4171. doi:10.1021/ma991113+
Gaspar, A. M., Busch, S., Appavou, M. S., Haeussler, W., Georgii, R., Su, Y., et al. (2010). Using polarization analysis to separate the coherent and incoherent scattering from protein samples. Biochimica Biophysica Acta1804, 76–82. doi:10.1016/j.bbapap.2009.06.024
Glavic, A.Plot.py. direct data plotting and evaluation. Available at: https://sourceforge.net/projects/plotpy/ (Accessed June 30, 2023).
Haubold, H. G., Vad, T., Jungbluth, H., and Hiller, P. (2001). Nano structure of nafion: A saxs study. Electrochimica Acta46, 1559–1563. doi:10.1016/s0013-4686(00)00753-2
Holderer, O., Ivanova, O., Khaneft, M., Hopfenmüller, B., Lüke, W., Majerus, A., et al. (2015). Local structure and proton transport in ht-pefcs measured with neutron scattering. ECS Trans.69, 1322. doi:10.1149/ma2015-02/37/1322
Hopfenmüller, B., Zorn, R., Holderer, O., Ivanova, O., Lehnert, W., Lüke, W., et al. (2018). Fractal diffusion in high temperature polymer electrolyte fuel cell membranes. J. Chem. Phys.148, 204906. doi:10.1063/1.5018717
Idupulapati, N., Devanathan, R., and Dupuis, M. (2011). Molecular structure and transport dynamics in perfluoro sulfonyl imide membranes. J. Phys. Condens. Matter23, 234106. doi:10.1088/0953-8984/23/23/234106
Ivanova, O., Lüke, W., Majerus, A., Krutyeva, M., Szekely, N., Pyckhout-Hintzen, W., et al. (2017). Influence of morphology on physical properties of poly (2, 5-benzimidazole) membranes. J. Membr. Sci.533, 342–350. doi:10.1016/j.memsci.2017.03.015
Kholodovych, V., and Welsh, W. J. (2007). Densities of amorphous and crystalline polymers. Phys. Prop. Polym. Handb., 611–617. doi:10.1007/978-0-387-69002-5_37
Kim, H. J., Cho, S. Y., An, S. J., Eun, Y. C., Kim, J. Y., Yoon, H. K., et al. (2004). Synthesis of poly(2,5-benzimidazole) for use as a fuel-cell membrane. Macromol. Rapid Commun.25, 894–897. doi:10.1002/marc.200300288
Korte, C., Conti, F., Wackerl, J., Dams, P., Majerus, A., and Lehnert, W. (2015). Uptake of protic electrolytes by polybenzimidazole-type polymers: Absorption isotherms and electrolyte/polymer interactions. J. Appl. Electrochem.45, 857–871. doi:10.1007/s10800-015-0855-7
Korte, C., Conti, F., Wackerl, J., and Lehnert, W. (2016). “Phosphoric acid and its interactions with polybenzimidazole-type polymers,” in High temperature polymer electrolyte membrane fuel cells: Approaches, status, and perspectives. Editors J. O. Jensen, D. Aili, H. A. Hjuler, and Q. Li (Cham: Springer), 169–194.
Kreuer, K. D. (2013). “Polybenzimidazole fuel cell Technology,” in Fuel cells: Selected entries from the encyclopedia of sustainability science and Technology (New York, NY: Springer), 391–433.
Li, Q., Jensen, J. O., Savinell, R. F., and Bjerrum, N. J. (2009). High temperature proton exchange membranes based on polybenzimidazoles for fuel cells. Progr. Polym. Sci.34, 449–477. doi:10.1016/j.progpolymsci.2008.12.003
Liu, Y., Lehnert, W., Janßen, H., Samsun, R. C., and Stolten, D. (2016). A review of high-temperature polymer electrolyte membrane fuel-cell (ht-pemfc)-based auxiliary power units for diesel-powered road vehicles. J. power sources311, 91–102. doi:10.1016/j.jpowsour.2016.02.033
Maier, W., Arlt, T., Wippermann, K., Wannek, C., Manke, I., Lehnert, W., et al. (2012). Correlation of synchrotron X-ray radiography and electrochemical impedance spectroscopy for the investigation of HT-PEFCs. J. Electrochem. Soc.159, F398–F404. doi:10.1149/2.024208jes
Majerus, A. (2014). “Eigenschaften des Phosphorsäure-Polybenzimidazol-Systems in Hochtemperatur-Polymerelektrolyt-Brennstoffzellen,”. Ph.D. thesis (Juelich: Forschungszentrum Juelich Zentralbibliothek Verl.).
Michler, G. H. (2008). Problems associated with the electron microscopy of polymers. Berlin, Heidelberg: Springer, 175–183.
Moilanen, D. E., Spry, D., and Fayer, M. (2008). Water dynamics and proton transfer in nafion fuel cell membranes. Langmuir24, 3690–3698. doi:10.1021/la703358a
Page, K. A., Soles, C. L., and Runt, J. (2012). “An overview of polymer electrolyte membranes for fuel cell applications,” in Polymers for Energy storage and delivery: Polyelectrolytes for batteries and fuel cells (Washington: American chemical society), chap (Washington, DC: American Chemical Society), 147–164.
Persson, I., Trublet, M., and Klysubun, W. (2018). Structure determination of phosphoric acid and phosphate ions in aqueous solution using exafs spectroscopy and large angle x-ray scattering. J. Phys. Chem. A122, 7413–7420. doi:10.1021/acs.jpca.8b05641
Pipich, V. (2012). QtiKWS: User-friendly program for reduction, visualization, analysis and fit of SA(N)S data. Online: Jülich Centre for neutron science (JCNS). Germany: Forschungszentrum Jülich GmbH.
Radulescu, A., Pipich, V., Frielinghaus, H., and Appavou, M. S. (2012). KWS-2, the high intensity/wide Q-range small-angle neutron diffractometer for soft-matter and biology at FRM II. J. Phys. Conf. Ser.351, 012026. doi:10.1088/1742-6596/351/1/012026
Schärpf, O., and Capelmann, H. (1993). The xyz-difference method with polarized neutrons and the separation of coherent, spin incoherent and magnetic scattering cross sections in a multidetector. Phys. Status Solidi (a)135, 359–379. doi:10.1002/pssa.2211350204
Schmidt-Rohr, K., and Chen, Q. (2008). Parallel cylindrical water nanochannels in nafion fuel-cell membranes. Nat. Mater.7, 75–83. doi:10.1038/nmat2074
Schneider, C. A., Rasband, W. S., and Eliceiri, K. W. (2012). Nih image to imagej: 25 years of image analysis. Nat. methods9, 671–675. doi:10.1038/nmeth.2089
Schweika, W., and Böni, P. (2001). The instrument DNS: Polarization analysis for diffuse neutron scattering. Phys. B297, 155–159. doi:10.1016/s0921-4526(00)00858-9
Stewart, J., Deen, P., Andersen, K., Schober, H., Barthélémy, J. F., Hillier, J., et al. (2009). Disordered materials studied using neutron polarization analysis on the multi-detector spectrometer, D7. J. Appl. Crystallogr.42, 69–84. doi:10.1107/s0021889808039162
Su, Y., Nemkovskiy, K., and Demirdiş, S. (2015). Dns: Diffuse scattering neutron time-of-flight spectrometer. J. large-scale Res. Facil.1, A27–277–A34. doi:10.17815/jlsrf-1-33
Talmon, Y., Adrian, M., and Dubochet, J. (1986). Electron beam radiation damage to organic inclusions in vitreous, cubic, and hexagonal ice. J. Microsc.141, 375–384. doi:10.1111/j.1365-2818.1986.tb02730.x
Teixeira, J. (1988). Small-angle scattering by fractal systems. J. Appl. Cryst.21, 781–785. doi:10.1107/S0021889888000263
Teubner, M., and Strey, R. (1987). Origin of the scattering peak in microemulsions. J. Chem. Phys.87, 3195–3200. doi:10.1063/1.453006
Trisno, M. L. A., Dayan, A., Lee, S. J., Egert, F., Gerle, M., Kraglund, M. R., et al. (2022). Reinforced gel-state polybenzimidazole hydrogen separators for alkaline water electrolysis. Energy & Environ. Sci.15, 4362–4375. doi:10.1039/d2ee01922a
Vilciauskas, L., Tuckerman, M. E., Bester, G., Paddison, S. J., and Kreuer, K. D. (2012). The mechanism of proton conduction in phosphoric acid. Nat. Chem.4, 461–466. doi:10.1038/nchem.1329
Wang, Y., Chen, K. S., Mishler, J., Cho, S. C., and Adroher, X. C. (2011). A review of polymer electrolyte membrane fuel cells: Technology, applications, and needs on fundamental research. Appl. Energy88, 981–1007. doi:10.1016/j.apenergy.2010.09.030
Wannek, C., Konradi, I., Mergel, J., and Lehnert, W. (2009a). Redistribution of phosphoric acid in membrane electrode assemblies for high-temperature polymer electrolyte fuel cells. Intern. J. Hydrogen Energy34, 9479–9485. doi:10.1016/j.ijhydene.2009.09.076
Keywords: HT-PEFC, proton conducting membranes, PBI, membrane structure, SANS, diffraction
Citation: Ivanova O, Lüke W, Nemkovski K, Appavou M-S, Szekely NK, Pipich V, Frielinghaus H, Monkenbusch M, Zorn R, Lehnert W and Holderer O (2023) Nanocrystal formation during thermal treatment of phosphoric-acid-swollen polybenzimidazole membranes. Front. Mater. 10:1209149. doi: 10.3389/fmats.2023.1209149
Received: 20 April 2023; Accepted: 19 June 2023;
Published: 12 July 2023.
Edited by:
Liming Dai, Case Western Reserve University, United StatesReviewed by:
Oleksandr Tomchuk, Polish Academy of Sciences, PolandCopyright © 2023 Ivanova, Lüke, Nemkovski, Appavou, Szekely, Pipich, Frielinghaus, Monkenbusch, Zorn, Lehnert and Holderer. This is an open-access article distributed under the terms of the Creative Commons Attribution License (CC BY). The use, distribution or reproduction in other forums is permitted, provided the original author(s) and the copyright owner(s) are credited and that the original publication in this journal is cited, in accordance with accepted academic practice. No use, distribution or reproduction is permitted which does not comply with these terms.
*Correspondence: O. Holderer, by5ob2xkZXJlckBmei1qdWVsaWNoLmRl
†Present address: O. Ivanova, GSI Helmholtzzentrum für Schwerionenforschung GmbH Planckstraße 1, Darmstadt, Germany; K. Nemkovski, ISIS Neutron and Muon Source, Science and Technology Facilities Council (STFC) Rutherford Appleton Laboratory (RAL), Harwell Campus, Didcot, Oxon, United Kingdom
Disclaimer: All claims expressed in this article are solely those of the authors and do not necessarily represent those of their affiliated organizations, or those of the publisher, the editors and the reviewers. Any product that may be evaluated in this article or claim that may be made by its manufacturer is not guaranteed or endorsed by the publisher.
Research integrity at Frontiers
Learn more about the work of our research integrity team to safeguard the quality of each article we publish.