 Sheng Li1
- 1Engineering Research Center of Catastrophic Prophylaxis and Treatment of Road and Traffic Safety of Ministry of Education, School of Traffic and Transportation, Changsha University of Science and Technology, Changsha, China
- 2Yueyang City Highway Bridge Foundation Construction Corporation, Yueyang, China
Through a simple performance dynamic modulus test (SPT), standard rutting test, Hamburg rutting test, French rutting test and asphalt pavement analyzer rutting test, the rutting resistance of asphalt mixtures in the middle and lower courses of three semi-rigid base asphalt pavement of Beijing full-scale test track road in China was evaluated. The test results show that the rutting resistance of asphalt mixtures of the middle and lower courses can be greatly improved by using low-grade asphalt, especially 30# asphalt. The rutting resistance of SBS modified asphalt mixtures is also better. The SPT dynamic modulus test can indirectly characterize the rutting performance of the asphalt mixture. The rutting test results of a laser road detection vehicle and 3 m ruler show that the asphalt grade has a significant impact on the rutting performance of semi-rigid base asphalt pavement. Compared with 70# asphalt used in the middle and lower courses, the rutting resistance of the pavement structure can be improved by more than 20%. The result also show that the APA rutting test results can closely characterize the full-scale test track results, which is an optimal test method for evaluating the rutting performance of semi-rigid base asphalt pavement. The research results can provide a theoretical basis and reference for the rational design and rutting evaluation of semi-rigid base asphalt pavement.
Introduction
Currently, rutting is still one of the main forms of the damage of the asphalt pavement. Researchers in the field of road engineering have conducted extensive research on the rutting performance of asphalt pavement. In order to solve the problem of rutting of asphalt pavement, researchers have proposed methods from the aspects of structure and material, which include using high modulus asphalt and low-grade asphalt, optimizing the combination of the pavement structure, and the gradation of the mixture (Zhao et al., 2009; Dong et al., 2014; Li et al., 2018). But the rutting problem of asphalt pavement still exists, therefore, it is needed to combine laboratory tests or theoretical research with the field rutting performance to evaluate the rutting characteristics. In China, more than 90% of asphalt pavements use a semi-rigid base layer. How to effectively control or evaluate the rutting of semi-rigid base asphalt pavement is the focus of this research.
Guan et al. (2011), Ceng et al. (2013), and Tang et al. (2016), introduced the shear factor into the rutting prediction model for semi-rigid base asphalt pavement, and based on the basic idea of layered superposition, the rutting prediction model was verified by different mixture test results. Huang et al. (2007), Li et al. (2011), Serigos et al. (2014), and Sireesh et al. (2019) studied the influencing factors and improvement measures of rutting tests for the asphalt mixture. Through field investigation and laboratory tests, the suitable thickness of rutting test specimens, rutting contribution of different layers and the relationship between rutting and temperature of the asphalt pavement’s composite structure were put forward. Sireesh et al. (2019) proposed an optimized design method for asphalt pavement based on reliability by analyzing the influence of flexible layer thickness and elastic modulus on pavement fatigue and rutting damage. Sirin et al. (2006) obtained the anti-rutting performance of the asphalt pavement modified by SBS through the accelerated loading test of the road surface (Ziari et al., 2019). The rutting is mainly caused by the denseness of the asphalt mixture, while the unmodified asphalt mixture rutting is caused by the combination of compactness and push. Ziari et al. proposed asphalt mixture with waste rubber powder as a modifier and amorphous carbon powder as filler, which has shown good fatigue resistance and rutting resistance (Cai et al., 2017). Walubita et al. (2019) and Behnke et al. (2019) compared and evaluated the anti-rutting performance of asphalt mixture by dynamic modulus, flow value, repeated load permanent deformation, simple shearing and Hamburg rutting. Behnke et al. (2019) used the Finite Element simulation of tire-surface short-term and long-term interactions to estimate the long-term rutting performance of pavement structures (Rahman and Gassman, 2009). Rahman and Gassman (2009) developed a correlation between the laboratory measurement of subgrade soil resilience modulus and drop weight deflection tester, and studied the effect of the resilience modulus of subgrade soil on rutting by using the Mechanics-Experience Pavement Design Guide (MEPDG) (Hussan et al., 2019). Radhakrishnan et al. (2019) and Son et al. (2013) discussed the influence of different combinations of aggregate, binder, temperature and gradation on rut depth. In summary, the existing research mainly focuses on the indoor rutting test of asphalt mixture, the anti-rutting performance of the pavement structure and materials, and the rutting prediction. But there is still a lack of rutting performance inspection tools between the field and laboratory, and the relationship between laboratory testing and measured results is also not established.
At present, the rutting performance of asphalt pavement materials is mainly evaluated and determined by the laboratory test of small test pieces in the design phase. The physical engineering or test track can better reflect the actual anti-rutting performance of the pavement structure, but the test cost is large and the timeframe is long. Therefore, it is necessary to establish the relationship between laboratory tests and measured results, and to study the method for determining the rutting performance evaluation of asphalt pavement. This research combines the pavement material test, construction practice, and follow-up observation of Beijing full-scale pavement test track in the last 5 years. It also establishes the relationship between the test results of asphalt materials and asphalt mixture laboratory rutting tests and the observation results of field rutting, and determines the available laboratory test method for the scientific evaluation of rutting performance of semi-rigid base asphalt pavement. The research results can provide a theoretical basis and reference for the rational design and rutting evaluation of semi-rigid base asphalt pavement.
Pavement Structure Type and Raw Material Performance
Full-Scale Test Track Overview and Research Objects
(1) Full-Scale Test Track Overview
In 2006, Academician Sha Qinglin of the Chinese Academy of Engineering advocated the construction of a full-scale accelerated loading test track to verify and improve the existing pavement design system. The RIOHTrack project in Beijing, which was the first full-scale pavement test track in China, started construction in December 2014 and was completed on November 14, 2015. The total length of the track is about 2,038 m, and the straight section is about 504 m, a circular curve with a radius of about 130.5 m is designed on both sides, and the width of the roadbed is 12 m. The design diagram is shown in Figure 1.

FIGURE 1. Effect diagram of RIOHTrack.
According to different design concepts, service condition and stiffness combinations, 25 typical asphalt pavement structures and 13 types of cement concrete pavement typical structures have been set in the full-scale test track, as shown in Figure 2. And 25 types of asphalt pavement structural combinations that cover the structural combination type and structural layer thickness of all highway asphalt pavements in China. Besides, it also includes the typically used structural types and thickness of flexible base asphalt pavement in Europe and America.
(2) Pavement Structure and Materials of the Research Object
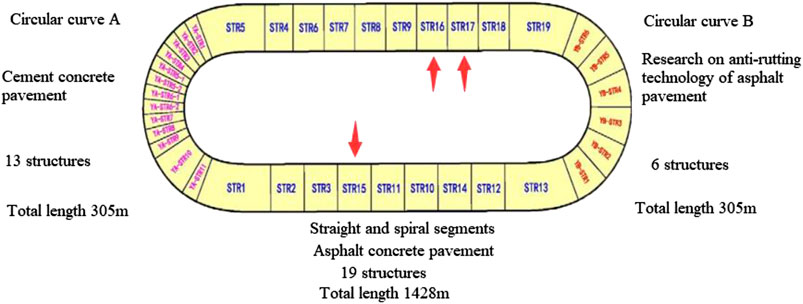
FIGURE 2. Structural layout drawing of RIOHTrack.
About 90% of China’s asphalt pavements use cement-stabilized semi-rigid bases, research has shown and confirmed that the rutting deformation of asphalt pavements mainly occurs in the middle and lower layers. The structure and materials of the middle and lower layers have a great impact on the anti-rutting ability of asphalt pavement (Dong and Peng, 2010; JTG F40-2004 Technical Specifications, 2004). So the focus of the study is to compare and analyze the rutting performance of the lower layer in the asphalt pavement, and to evaluate the impact of asphalt material on the anti-rutting performance, and then to evaluate the performance of semi-rigid base asphalt pavement through the comparison of field measured results and the indoor laboratory rutting test results. The test results are compared to determine the most suitable laboratory rutting test method for semi-rigid base asphalt pavement. Three semi-rigid base asphalt concrete pavement structures with the same straight-line segment in the full-scale test track were selected. The type and thickness of the asphalt surfacing mixture are shown in Table 1. The base layer type and thickness of Structure 2 and Structure 3 are identical, the two structures both use the 40 cm cement-stabilized semi-rigid base layer. The structure 1 adopts a 20 cm cement-stabilized semi-rigid base layer and a 44 cm graded gravel base layer, that is, the three pavement structures are in the same straight line segment and the base layer type and thickness are exactly the same. The gradation of the underlying asphalt mixture in the three pavement structures is the same. But there is a difference in the asphalt. Especially the gradation, material, and thickness of the asphalt mixture of the structure 2 and the structure 3 are completely consistent. So it can be used well to analyze the degree of influence of asphalt materials on rutting, as well as to establish the relationship between the test results of asphalt mixture indoor rutting and the observation results of physical engineering rutting.
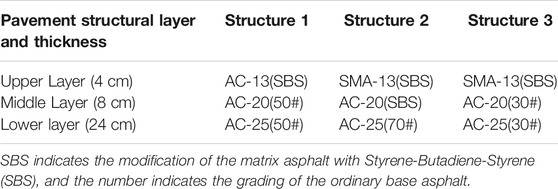
TABLE 1. Structural combination and asphalt layer thickness of semi-rigid base asphalt pavement.
Main Technical Properties of Raw Materials
(1) Asphalt Material Properties
The asphalt used is 30#, 50#, and 70# ordinary road petroleum asphalt and Styrene–Butadiene–Styrene (SBS) modified asphalt, the basic properties were tested following the “Technical Specifications for Highway Asphalt Pavement Construction” (Research Institute of Highway Ministry of Transport, 2004) of China. The results are given in Table 2, as shown in Table 2 that all materials satisfied the standard requirement.
(2) Aggregate Properties
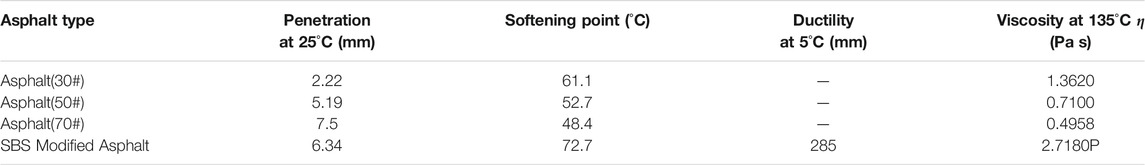
TABLE 2. Test results of main technical properties of asphalt.
Basalt and limestone are both used for the construction of the full-scale pavement test track and the aggregates used in the laboratory test. The aggregate above 4.75 mm is made of basalt, the aggregate used for the mixture of 4.75 mm and AC-20 and AC-25 is limestone. The aggregate gradation as shown in Table 3. The performance index of aggregates is tested following the method of China Highway Engineering Aggregation Test Regulations (JTG E20-2011 Standard Test, 2005), and the result shows that all the test indicators meet the requirements of the specification (JTG E42-2005 Test, 2005).
(3) The Test of Mineral Powder Technical Performance
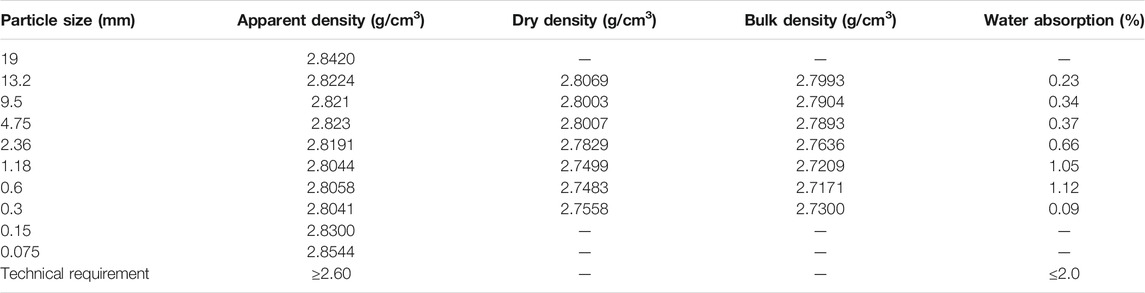
TABLE 3. Main technical performance test of aggregate.
The mineral powder used for the asphalt mixture is made of ore powder produced in Nanning, Guangxi Province of China. The apparent density of the ore powder is 2.7858 g/cm3, the percentage of the particles that are less than 0.6 mm is 100%, the percentage of those less than 0.15 less than mm is 98.6%, and the percentage of those less than 0.075 mm is 83.9%. The technical performance indexes of the mineral powder are satisfied with the requirements of the specification (JTG E42-2005 Test, 2005).
Asphalt Mixture Laboratory Rutting Test
At present, the rutting performance of asphalt pavement materials is mainly evaluated by laboratory tests. The representative test methods including the standard rutting test, the Hamburg rutting test, the French rutting test, and the asphalt pavement analyzer (APA) rutting test, etc. The indirect characterization of the rutting by testing the dynamic modulus of the asphalt mixture by a simple performance tester (SPT) test method for performance. In this study, the rutting performance of the asphalt mixture of each structural layer of the full-scale test track asphalt pavement was tested by the above test methods.
Rutting Characterization Based on Dynamic Modulus Test of SPT Asphalt Mixture
SPT can test the dynamic modulus |E*|of the asphalt mixture, and obtain the phase angle φ and the dynamic modulus combination parameter |E*|/sinφ. |E*| can be directly used as the design parameter for the design of asphalt pavement structure, as well as the evaluation for pavement performance. According to the design guide for Design of New and Rehabilitated Pavement Structures (AASHTO, 2002) and the statistical results of the NCHRP 9-19 project (NCHRP, 2002), an indicator of the |E*| and |E*|/sinφ has a good correlation with the rutting test. Since the loading speed of the first 52 cycles of the full-scale circular road is about 30 km/h, which is equivalent to the loading frequency of 5 Hz, the reference frequency used for research and analysis is 5 Hz, the reference temperature is 20°C normal temperature.
Dynamic Modulus Analysis of Asphalt Mixture
A cylindrical test piece with a height of 170 ± 2 mm and a diameter of 150 mm is formed by a Shear Gyratory Compactor. A sample with a diameter of 100 mm is drilled by a core machine. A single-sided saw is used for cutting, all the test pieces that have passed the cutting are polished. A standard test piece having a smooth upper and lower surface and a height of 150 mm was obtained. The SPT is applied to the cylindrical specimen by Haversine. The loading frequency is 10 frequencies from 0.01 to 25 Hz. The test temperature is 5, 15, 20, 30, 40, and 50°C. The entire test procedure was carried out in a closed environmental chamber. The results of the SPT dynamic modulus test of asphalt mixture at the reference temperature of 20°C and the reference frequency of 5 Hz are shown in Figure 3.
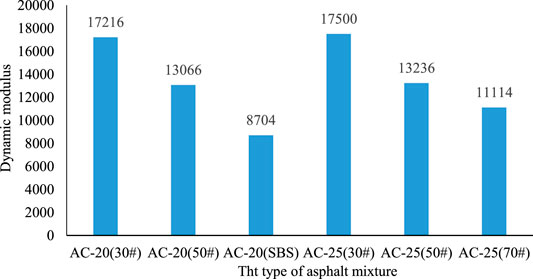
FIGURE 3. Dynamic modulus test results of the middle and lower course of asphalt mixture in each structure.
It is difficult to obtain the mechanical properties of the frequency and temperature range in laboratory tests with a short time. The experimental results are extended to obtain the dynamic modulus of the larger frequency range in the SPT-recommended strain range (70–110 με) by using the Boltzman function (Guo and Prozzi, 2009). The results are given in Figures 4 and 5.
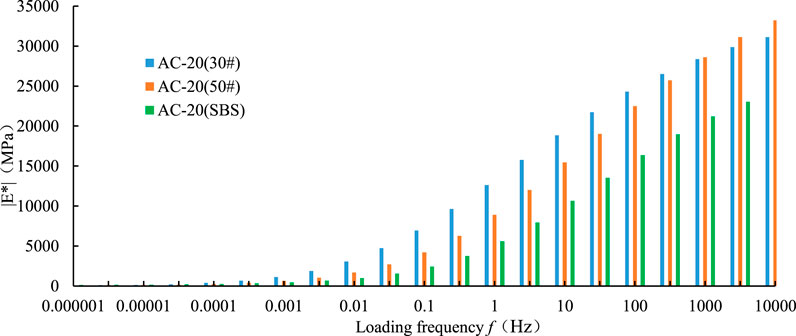
FIGURE 4. Dynamic modulus of AC-20 asphalt mixture under different loading frequencies.
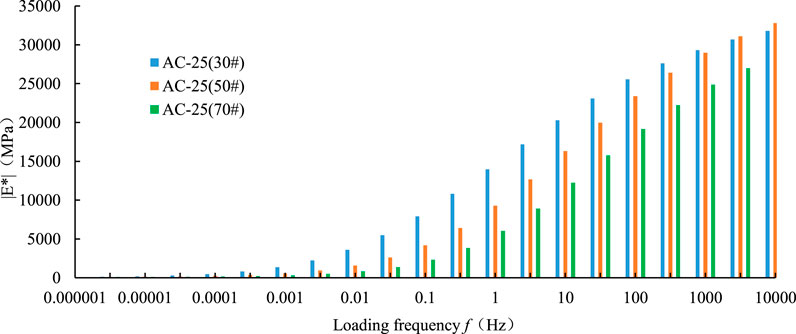
FIGURE 5. Dynamic modulus of AC-25 asphalt mixture under different loading frequencies.
It can be seen from Figures 4 and 5 that the dynamic modulus of asphalt mixture changes in almost the same way. As the loading frequency increases, the dynamic modulus generally increases. In the middle of the histogram, the dynamic modulus changes rapidly, indicating that the frequency has a great influence on the dynamic modulus at room temperature. The dynamic modulus of the asphalt mixture using 30# asphalt is higher than that of the other two asphalt mixtures, indicating that the asphalt label has a great influence on the dynamic modulus of the asphalt mixture, which can indirectly characterize the low marked asphalt as having better anti-rutting performance.
Analysis of Standard Rutting Test Results
The standard rutting test is carried out according to T0719 in the industry regulations (Kanaan et al., 2014). The test wheel is made of rubber solid tire, the thickness of the rubber layer is 15 mm, the outer diameter of the tire is 200 mm, and the wheel width is 50 mm. The test piece is prepared by the wheel mill. The test piece size is 300 mm × 300 mm × 50 mm, loading speed is 42 ± 1 time/min. The test results are shown in Figure 6.
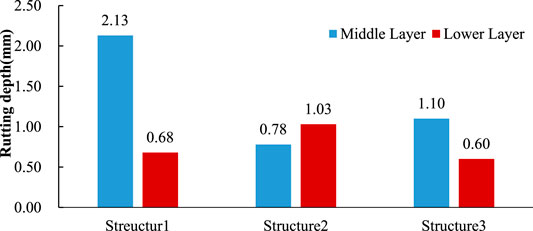
FIGURE 6. Standard rutting test results of asphalt mixtures for each pavement structures.
Analysis of Hamburg Rutting Test Results
A test piece with a size of Φ150 mm × 75 mm was formed by Shear Gyratory Compactor, and two test pieces were required for each test. The test sample is a rubber wheel with a diameter of 200 mm and a width of 47 mm, the wheel load is 700 N, the loading frequency is 20,000 times, the loading rate is 52 ± 1 times/min. The sample holding time is more than 6 h, and the test temperature is 60°C air bath. After pressing 20 times, 34 data points were collected and averaged as test results. The test results are shown in Figure 7.
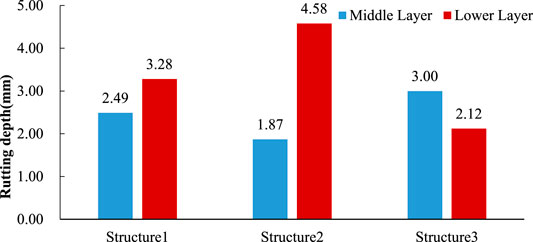
FIGURE 7. Hamburg rutting test results of asphalt mixtures for each pavement structure.
Analysis of French Rutting Test Results
The French Rutting Tester (FRT) was developed by the French LCPC. It can test two asphalt mixture pieces at the same time and load them with a vertical load of 5 kN. The width of the tires is 90 mm. The tire pressure was 600 kPa and the test loading frequency was 1 Hz. The test piece is produced according to the European standard EN12697-33:2013 (British Standard, 2013), and the test piece size of the middle layer and the lower layer asphalt mixture is 500 × 150 × 100 mm, the depth and relative deformation of the rutting loaded 3,000 times are small. The bulk density is used to calculate the quality of the test piece rather than the bulk density. Therefore, the density of the test piece is larger. The detailed test results are shown in Figure 8.
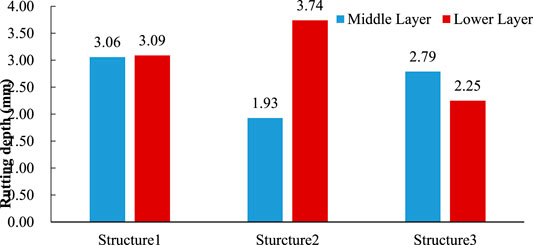
FIGURE 8. French rutting test results of asphalt mixtures for each pavement structure.
Analysis of APA Rutting Test Results
APA is an asphalt mixture pavement analyzer developed by Georgia, USA. Its load wheel applies vertical load through a rigid rubber tube (with a diameter range of 12.7–29 mm) that is pressed against the top of the test piece (inflating pressure range is 0.827–1.38 MPa). The test piece of this test adopts a cylindrical test piece, which is formed by rotary compaction, the test piece size is Φ150 mm × 75 mm, and an 8,000 round-trip load test is carried out. The wheel load speed is 0.6 m/s, and the test temperature is 60°C in the air bath. The test results are shown in Figure 9.
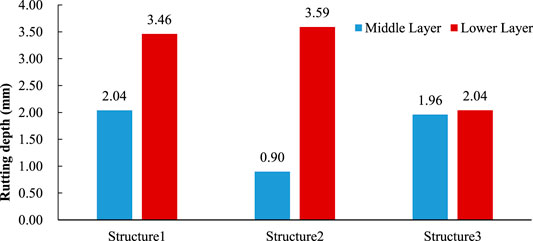
FIGURE 9. APA rutting test results of asphalt mixtures for each pavement structure (mm).
The test results in Figures 6–9 show that asphalt has a great influence on the rutting performance of asphalt mixture. Using low-grade asphalt, especially 30# asphalt can greatly improve the anti-rutting performance of the middle and lower asphalt mixture, the asphalt mixture with SBS modified asphalt has better rutting resistance.
On-Site Inspection and Evaluation of Laboratory Test Methods
To study the evolution of the diversified service performance index of asphalt pavement under long-term and heavy load conditions, Beijing's full-scale pavement test track was loaded from November 2016, and the loading test used four 10-wheel Steyr heavy trucks. The axle weight of the loader is 16 t for a single axle and is loaded for 10,000 times. There are many causes of rutting on asphalt pavements, and differences in structural combinations or material properties can lead to differences in rutting changes and levels. The research mainly focuses on the above three semi-rigid base asphalt pavements with a certain representative of asphalt and asphalt mixture grading (Espinoza-Luque et al., 2019). The laser road detection vehicle and 3 m ruler are used for on-site inspection of the rutting, comparing and analyzing the results of laboratory rutting tests and on-site test results to determine the preferred method for laboratory testing and evaluation of rutting performance of semi-rigid base asphalt pavement.
Detection and Analysis of Full-Scale Pavement Test Track Rutting
(1) Analysis of Detection Results of Laser Road Inspection Vehicles
During the research, the CICS laser road inspection vehicle carried out long-term tracking observation on the ruts of the above three semi-rigid base asphalt pavements in Beijing full-scale pavement test track. From 2016 to 2018, it is measured twice a month for a total of 48 cycles. The two measurements in the same month are averaged in the analysis, and the original 48 cycles are changed to 24 cycles, that is the monthly test result is one cycle. The relationship between the loading cycle and the measured depth of the rutting is shown in Figure 10. The measured result of the rutting depth is the rutting depth minus the zero-point calibration.
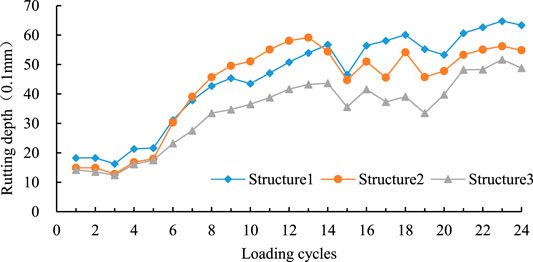
FIGURE 10. The relation curve of rutting depth with loading period.
As can be seen from Figure 10, structure 3 uses 30# asphalt for the middle layer and the lower layer, and the asphalt mixture has a higher modulus and a lower rutting level. Compare structure 1 with 2, the middle and lower layer asphalt concrete of structure 1 is made of 50# asphalt, and the middle and lower layer of structure 2 is made of 70# asphalt, although the 70# asphalt used for the middle layer of structure 2 is modified by SBS. However, the results show that the rutting of structure 2 is still significantly smaller than structure 1. It can be seen from the rutting level of the three structures of the comprehensive structure 1, structure 2 and structure 3. The low-grade asphalt has a remarkable effect on improving the anti-rutting ability of the asphalt pavement, the 70# asphalt and the mid-layer asphalt with SBS are commonly used in the middle and lower layers. Compared with the modification, such as structure 2, the anti-rutting performance of the 30# asphalt pavement structure in the middle and lower layers can be increased by more than 20% (Schram et al., 2014).
(2) Analysis of 3 m Ruler Test Results
The pavement rutting is mainly compacted rutting during the first 6 months of loading, that is the first 12 cycles. The rutting deformation is small and the change trend is not obvious. At the later of cyclical loading, to better reveal the change trend of the rut, the manual detection method using the 3 m ruler is added besides the automatic detection of the rut by the laser road detection vehicle, and the 22nd to the 48th test results of the loading cycle is shown in Figure 11.
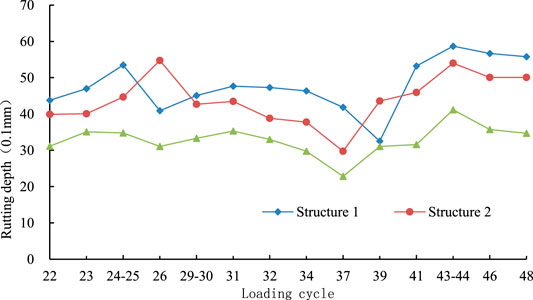
FIGURE 11. Rutting test results of 3 m ruler.
It can be seen from Figure 11 that the rutting result conducted by 3 m ruler is consistent with the result detected by the laser road detection vehicle, the pavement structure with low-grade asphalt has better rutting resistance, the rutting depth of structure 3 is smallest, and the rutting depth of the structure of 70# asphalt is maximum.
Comparison and Evaluation of Laboratory Rutting Test
Because the rutting of asphalt pavement mainly occurs in the middle and lower layers, the sum of the rutting deformation of the middle layer and lower layers can reflect the rutting condition of the asphalt pavement structure. So, the sum of the rutting deformation of the middle layer and lower layer of the asphalt mixture that was obtained from the laboratory rutting test can indirectly reflect the rutting size of each pavement structure. By comparing with the depth difference ratio of the rutting measured with the pavement structure, it can select the laboratory test method for evaluating the rutting performance of semi-rigid grass-roots asphalt road.
In order to compare with the actual measurement of the rutting in the full-scale test track, the deformations of the middle and lower layers obtained by the four laboratory rutting tests are added to characterize the rutting of each pavement structure obtained by the laboratory test indirectly. It can be seen from Figure 10 that the depth of the road rutting in the last four cycles of loading is in a relatively stable stage, so the last cycle is the CICS vehicle actual measured data of the 24th cycle and the test results of the laboratory rutting are analyzed. The sum of the rutting in the four laboratory rutting tests and the bottom rutting and the actually measured rutting of the CICS vehicle are shown in Table 4.
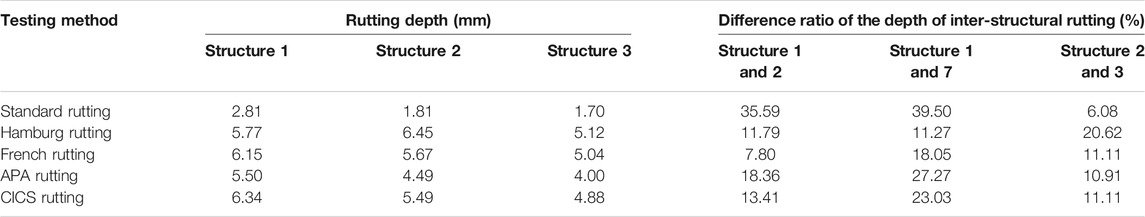
TABLE 4. Difference ratio between rutting test depth and inter-structural rutting.
It can be seen from Table 4 that the actual measured rutting depth of the CICS vehicle, the standard rutting test, the French rutting test, and the APA rutting test all show the trend of Structure 1 > Structure 2 > Structure 3. The rutting data obtained by the Hamburg rutting test is inconsistent with this trend, so there was no further comparative analysis with the measured results. Each laboratory rutting test method has different test specimens, loading methods, and standards. The paper uses direct and indirect comparative analysis methods to comprehensively evaluate the laboratory test method for the rutting performance of semi-rigid base asphalt pavements (Sel et al., 2014).
(1) Direct Comparative Analysis
In order to facilitate the direct comparison and analysis of the rutting data of the four laboratory rutting tests and the actual rutting data of the CICS vehicle. The rutting depth measured by the four laboratory rutting tests and the CICS vehicle is standardized by the study, in which the rutting depth corresponding to the structure 1 is defined as 1, and then converted to corresponding rutting depth for other structures. The specific conversion method is shown in Eq. (1). The converted rutting depth is shown in Table 5, and the rutting depth comparison chart is shown in Figure 12.
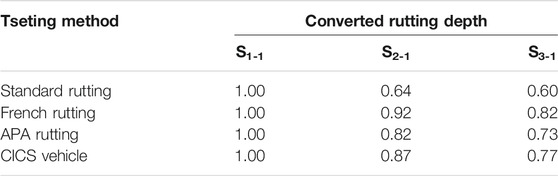
TABLE 5. Rutting depth after standardized conversion.
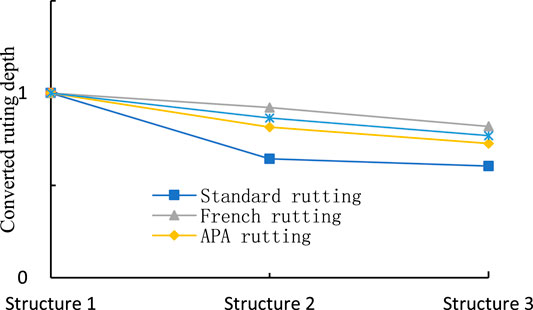
FIGURE 12. Rutting depth comparison.
It can be seen from Table 6 and Figure 12 that when the rutting data is directly compared, the images of the APA rutting test and the French rutting test are closest to the actual measured data of the CICS vehicle, followed by the standard rutting test.
(2) Indirect Analysis and Evaluation
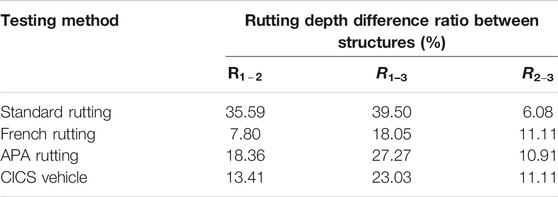
TABLE 6. Rutting difference ratio between structures.
By comparing the rutting difference ratio between the structures to evaluate the preferred laboratory test method can be evaluated indirectly. The rutting difference ratio is obtained as Eq. (2), and the results are shown in Table 6.
In the formula:
The comparison between the laboratory rutting test and the actual measured results are determined by the ratio between the rutting difference ratio of the laboratory rutting test and the field measured rutting difference ratio of the corresponding structure. The closer the ratio to 1, the more this laboratory rutting test method can better reflect the actual rutting level of the pavement structure. The closeness of the results of the laboratory rutting test to the actual results of the full-scale test track is determined by Eq. (3). The calculation results are shown in Table 7.
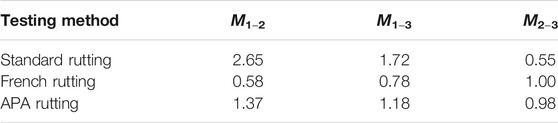
TABLE 7. Closeness between laboratory rutting test results and field test results.
In the formula: M is the degree of closeness of the laboratory rutting test result to the measured full-scale test track result;
It can be obtained by Table 7 that for structure-1 and structure-2, the order of closeness of the laboratory rutting test results to the actual rutting results of CICS vehicle is APA rutting > French rutting > standard rutting. For structures-1 and structures-3, the order of closeness of the laboratory rutting test results to the actual rutting results of CICS vehicle is: APA rutting > French rutting > standard rutting. For structure-2 and structure-3, the order of closeness of the laboratory rutting test results to the actual rutting results of CICS vehicle is French rutting > APA rutting> standard rutting. Therefore, the comprehensive order of closeness is APA rutting > French rutting > standard rutting.
The results of comprehensive direct and indirect analysis evaluation are as follows: the results of the APA rutting test are close to the actual results of the full-scale test track, the APA rutting test is the preferred testing method for evaluating the rutting performance of semi-rigid base asphalt pavements, followed by the French rutting test and the standard rutting test (Sel et al., 2014).
Conclusion
By comparing and analyzing the results of four types of indoor rutting tests with the measured rutting data of the full-scale test track in Beijing, the relationship between the semi-rigid base asphalt material, indoor asphalt mixture rutting test, and the field pavement rutting results was established. The main conclusions are as follows:
Through SPT dynamic modulus test, standard rutting test, Hamburg rutting test, French rutting test, and APA rutting test, the high temperature performance of semi-rigid base asphalt pavement asphalt mixture was evaluated. The results show that the deformation resistance of the SBS modified asphalt mixture is better than that of the base asphalt mixture, and the low-grade base asphalt mixture has better high temperature stability.
According to the principle of time-temperature superposition, the Boltzman function is used to expand the dynamic modulus of the larger frequency range. The results show that the asphalt grading has a great influence on the dynamic modulus of the asphalt mixture, and it shows that the low-grade asphalt has good rutting resistance, which is consistent with the laboratory rutting test and the on-site test results. The results indicate that the SPT dynamic modulus test can indirectly characterize the rutting performance of the asphalt mixture.
The results of the rutting test, of the laser road detection vehicle, and the 3 m ruler are consistent, the asphalt grading has a significant influence on the rutting performance of the semi-rigid base asphalt pavement. The rutting depth comparison for different asphalt grading is 70# asphalt mixture> 50# asphalt mixture> 30# asphalt mixture.
The APA rutting test method can closely represent the actual measurement results of the full-scale test track, followed by the French rutting test and Hamburg rutting, and finally the standard rutting test. It is suggested that the APA rutting test method should be used as the evaluation method of asphalt mixture high temperature stability.
Data Availability Statement
The original contributions presented in the study are included in the article/Supplementary Material, further inquiries can be directed to the corresponding authors.
Author Contributions
SL and MF conceptualization and writing/original draft preparation. MF and LX methodology. MF, LX, and KX investigation and numeral calculations; WT and HY writing-review and editing. SL funding acquisition. All authors contributed to the article and approved the submitted version.
Funding
The research was supported by the National Natural Science Foundation of China (51878076) and the National Key Research and Development Plan (2018YFB1600200) and the Natural Science Foundation of Hunan Province (2018JJ2433) and the Open Fund of Engineering Research Center of Catastrophic Prophylaxis and Treatment of Road and Traffic Safety of Ministry of Education (kfj180402).
Conflict of Interest
Author KX was employed by the company Yueyang City Highway Bridge Foundation Construction Corporation, Yueyang, China.
The remaining authors declare that the research was conducted in the absence of any commercial or financial relationships that could be construed as a potential conflict of interest.
References
Behnke, R., Wollny, I., Hartung, F., and Kaliske, M. (2019). Thermo-mechanical finite element prediction of the structural long-term response of asphalt pavements subjected to periodic traffic load:Tire-pavement interaction and rutting. Comput. Struct. 218, 9–31. doi:10.1016/j.compstruc.2019.04.003
Cai, X., Wang, D. Y., Huang, W. K., Yu, J. M., and Wan, C. (2017). Evaluation of rutting performance of asphalt mixture with driving wheel pavement analyzer. Adv. Mater. Sci. Eng. 3, 1–10. doi:10.1155/2017/6301914
Ceng, G. W., Liu, L. P., Su, K., Tang, W., and Chen, R. S. (2013). Rutting model considering shear behavior of asphalt pavement. J. Southwest Jiaot. Univ. 48 (4), 672–677. doi:10.3969/j.issn.0258-2724.2013.04.013
Dong, Y., and Peng, M. J. (2010). Study on the influence of middle course on rutting resistance of asphalt concrete pavement. J. China For. Highw. 30 (4), 108–111. doi:10.14048/j.issn.1671-2579.2010.04.065
Dong, Z. J., Xiao, G. Q., Gong, X. B., and Wang, Y. (2014). Rutting resistance analysis of structure combinations for asphalt pavement subjected to heavy loads. J. Harbin Inst. Technol. 46 (6), 72–78. doi:10.11918/j.issn.0367-6234.2014.06.014
Espinoza-Luque, A. F., Al-Qadi, I. L., Ozer, H., and Pettinari, M. (2019). Laboratory characterization of low-rolling resistance Danish stone-matrix asphalt. J. Transp. Eng. Part B-Pavements 145, 1. doi:10.1061/JPEODX.0000094
Guan, H. X., Zhang, Q. S., and Liu, J. (2011). Rutting test improving methods of asphalt mixture. J. Traffic Transport. Eng. 11 (3), 16–21. doi:10.19818/j.cnki.1671-1637.2011.03.004
Guo, R. H., and Prozzi, J. A. (2009). A statistical analysis of Hamburg wheel tracking device testing results. Road Mater. Pavement Des. 10, 327–333. doi:10.1080/14680629.2009.9690249
Huang, X. M., Fan, Y. W., Zhao, Y. L., and Yan, Q. L. (2007). Investigation and test of expressway asphalt pavement high-temperature performance. J. Highw. Transp. Res. Dev. 5, 16–20. doi:10.1007/978-3-319-42797-3_30
Hussan, S., Kamal, M. A., Hafeez, I., Farooq, D., Ahmad, N., and Khanzada, S. (2019). Statistical evaluation of factors affecting the laboratory rutting susceptibility of asphalt mixtures. Int. J. Pavement Eng. 20 (4), 402–416. doi:10.1080/10298436.2017.1299527/
JTG E20-2011 Standard Test. (2005). JTG E20-2011 standard test methods of Bitumen and Bituminous mixtures for highway engineering. Beijing: China Communication Press.
JTG E42-2005 Test. (2005). JTG E42-2005 test methods of aggregate for highway engineering. Beijing: China Communication Press.
JTG F40-2004 Technical Specifications. (2004). JTG F40-2004 technical specifications JTG F40-2004 technical specifications for construction of highway asphalt pavement. Beijing: China Communication Press.
Kanaan, A. I., Ozer, H., and Al-Qadi, I. L. (2014). Testing of fine asphalt mixtures to quantify effectiveness of asphalt binder replacement using recycled shingles. Transp. Res. Rec. 2445, 103–112. doi:10.3141/2445-12(2014)
Li, P. L., Zhang, Z. Q., Li, H. H., and Wang, B. G. (2011). Research on conditions of Hamburg wheel tracking test and evaluating indicator for asphalt mixture. J. Wuhan Univ. Technol. (Transp. Sci. Eng.) 35, 113–117. doi:10.4028/www.scientific.net/amm.178-181.1338
Li, Y., Liu, L. P., and Sun, L. J. (2018). Prediction model on rutting equivalent temperature for asphalt pavement at different depth. J. Jilin Univ. (Eng. Technol. Ed.) 48 (6), 1703–1711. doi:10.13229/j.cnki.jdxbgxb20170520
Radhakrishnan, V., Chowdari, G. S., Reddy, K. S., and Chattaraj, R. (2019). Evaluation of wheel tracking and field rutting susceptibility of dense bituminous mixes. Road Mater. Pavement Des. 20 (1), 90–109. doi:10.1080/14680629.2017.1374998
Rahman, M., and Gassman, S. (2009). Effect of resilient modulus of undisturbed subgrade soils on pavement rutting. Int. J. Geotech. Eng. 13 (2), 152–161. doi:10.1080/19386362.2017.1328773
Schram, S., Williams, R. C., and Buss, A. (2014). Reporting results from the Hamburg wheel tracking device. Transp. Res. Rec. 2446 (1), 89–98. doi:10.3141/2446-10
Sel, I., Yildirim, Y., and Ozhan, H. B. (2014). Effect of test temperature on Hamburg wheel-tracking device testing. J. Mater. Civ. Eng. 26 (8), 04014037. doi:10.1061/(asce)mt.1943-5533.0001036
Serigos, P. A., Michael, M., Jorge, A., and Prozzi, (2014). Evaluation of rut-depth accuracy and precision using different automated measurement systems. J. Test. Eval. 43, 201–211. doi:10.1520/jte20130121
Sireesh, S., Pranav, R. T., and Munwar, B. (2019). Reliability perspective on optimum design of flexible pavements for fatigue and rutting performance. J. Transp. Eng. B: Pavements 7, 145–152. doi:10.1061/JPEODX.0000108
Sirin, O., Kim, H. J., Tia, M., and Choubane, B. (2006). Comparison of rutting resistance of unmodified and SBS-modified Superpave mixtures by accelerated pavement testing. Construct. Build. Mater. 22 (3), 286–294. doi:10.1016/j.conbuildmat.2006.08.018
Son, S., Al-Qadi, I. L., and Zehr, T. G. (2013). Rutting potential of thin and durable asphalt wearing courses:Laboratory prediction and field performance. Airf. Highw. Pavement 14 (2), 1240–1253. doi:10.1061/9780784413005.105
Tang, W., Wu, X. J., and Sun, L. J. (2016). Study on multi-parameter prediction model of asphalt pavement rutting. J. China For. Highw. 36 (1), 45–49. doi:10.14048/j.issn.1671-2579.2016.01.011
Walubita, L., Fuentes, L., Lee, S., Dawd, I., and Mahmoud, E. (2019). Comparative evaluation of five HMA rutting-related laboratory test methods relative to field performance data: DM, FN, RLPD, SPST, and HWTT. Construct. Build. Mater. 215, 737–753. doi:10.1016/j.conbuildmat.2019.04.250
Zhao, L. D., Wan, J. J., Zheng, G. S., and Zhang, Y. J. (2009). Rheological study of paving performance of high modulus asphalt binders. J. Build. Mater. 22 (3), 127–134. doi:10.3969/j.issn.1007-9629.2019.01.019
Ziari, H., Divandari, H., Hajiloo, M., and Amini, A. (2019). Investigating the effect of amorphous carbon powder on the moisture sensitivity, fatigue performance and rutting resistance of rubberized asphalt concrete mixtures. Construct. Build. Mater. 217, 62–72. doi:10.1016/j.conbuildmat.2019.05.039
Keywords: road engineering, asphalt pavement, laboratory rutting test, full-scale test track (RIOHTrack), dynamic modulus
Citation: Li S, Fan M, Xu L, Tian W, Yu H and Xu K (2021) Rutting Performance of Semi-Rigid Base Pavement in RIOHTrack and Laboratory Evaluation. Front. Mater. 7:590604. doi: 10.3389/fmats.2020.590604
Received: 02 August 2020; Accepted: 20 October 2020;
Published: 05 January 2021.
Edited by:
Hui Yao, Beijing University of Technology, ChinaReviewed by:
Dongya Ren, Southwest Jiaotong University, ChinaRu Mu, Hebei University of Technology, China
Copyright © 2021 Li, Fan, Xu, Tian, Yu and Xu. This is an open-access article distributed under the terms of the Creative Commons Attribution License (CC BY). The use, distribution or reproduction in other forums is permitted, provided the original author(s) and the copyright owner(s) are credited and that the original publication in this journal is cited, in accordance with accepted academic practice. No use, distribution or reproduction is permitted which does not comply with these terms.
*Correspondence: Huanan Yu, huanan.yu@csust.edu.cn; Wendi Tian, 735017826@qq.com