 Qian-hang Sun
 Jiang-nan Li1†
 Kun Lei
95% of researchers rate our articles as excellent or good
Learn more about the work of our research integrity team to safeguard the quality of each article we publish.
Find out more
ORIGINAL RESEARCH article
Front. Mar. Sci. , 26 March 2025
Sec. Marine Pollution
Volume 12 - 2025 | https://doi.org/10.3389/fmars.2025.1527098
Nitrogen pollution in rivers has long been a significant ecological and environmental concern, and research on nitrogen pollution source tracking serves as the foundation for pollution control, playing a crucial role in quantifying different pollution sources and formulating effective mitigation strategies. This study proposes a technical framework for pollution source resolution based on the export coefficient model and microbial source tracking model. Initially, key environmental factors and their spatiotemporal characteristics were analyzed to preliminarily identify potential nitrogen pollution sources, including wastewater treatment plants, stainless steel plants, electroplating factories, chemical plants, pig farms, poultry farms, rice fields, vegetable farms, and tea plantations. Subsequently, hydrochemical and microbial metagenomic analyses were conducted to further refine the identification of nitrogen pollution sources. NMDS analysis revealed significant differences in microbial community structures among different pollution sources, facilitating effective discrimination. Additionally, co-occurrence network analysis was employed to construct microbial fingerprint maps specific to each pollution source. Finally, a Bayesian community-wide non-culture microbial source tracking method (SourceTracker) was used for quantitative pollution source apportionment. The export coefficient model estimated that point-source nitrogen loads were primarily derived from domestic wastewater, whereas non-point source nitrogen loads predominantly originated from rural domestic wastewater and agricultural cultivation. By integrating the microbial source tracking model, the primary sources of nitrogen pollution were accurately identified. During the dry season, domestic wastewater (47.3%) was the dominant contributor, including wastewater treatment plants, rural domestic sewage, stainless steel plants, and electroplating factories, with fecal and agricultural sources mainly stemming from pig farms and rice fields. In contrast, during the wet season, agricultural cultivation (20.5%) and natural soil (27.8%) were the predominant contributors, encompassing rice fields, vegetable farms, and tea plantations. This source-tracking approach provides a valuable tool for guiding precise regional pollution control and is particularly applicable in complex pollution environments.
Despite ongoing efforts by managers to control nitrogen pollution in aquatic environments and some notable improvements, nitrogen pollution remains a significant environmental challenge in river basins worldwide (Basu et al., 2022). While climate change continues to impact water resource availability, urbanization and agricultural activities are driving increased water demand and pollution. As a result, nitrogen pollution in rivers is projected to remain a serious challenge well into the 2050s (Bodirsky et al., 2014). Inputs from point sources are relatively easier to control; however, arable land remains a significant and challenging contributor to global nitrogen pollution (Gu et al., 2023). In addition, nitrogen leaching is a complex process that governs nitrogen exchange between soil and aquatic ecosystems. During periods of intense runoff, high runoff rates become a major driver of nitrogen leaching, contributing significantly to surface water pollution (Liu et al., 2023). In summary, excessive nitrogen input leads to water quality deterioration, posing serious threats to ecological integrity, sustainable development, and human health (Liu et al., 2023). Therefore, more precise and scientific traceability techniques must be adopted to develop effective pollution control strategies (Downing et al., 2021).
Traceability tools for pollutants in the aquatic environment include stable isotopes, fluorescence spectrum, microbial fingerprinting and other models (Wang et al., 2024; Gu et al., 2020; Huan et al., 2024; Li et al., 2023). Some researchers have systematically tracked nitrogen sources in complex river basins using machine learning methods based on microbial metagenomics (Zhu et al., 2024). For nitrogen pollution traceability, the most direct method is nitrogen and oxygen isotope traceability, which is mainly used for the distribution of nitrogen and oxygen isotope signature ranges to determine the source of pollution (Sun et al., 2024). Also, the contribution of each type of source was obtained by combining IsoSource (Kang et al., 2016), SIAR (Yue et al., 2015), and MixSIAR (Shu et al., 2024) models. However, the isotopic signals of different pollution sources often overlap, which poses a challenge to the accurate determination of pollutant sources in areas with complex pollution sources (Zhao et al., 2019). In addition, the fluorescence spectral index combined with the parallel factor analysis model is widely used in the traceability of organic matter in the aquatic environment, and it has a strong identification of point source pollution such as industrial and domestic wastewater, however, its sensitivity to agricultural surface source pollution is weak (Mladenov et al).
Export coefficient modeling (ECM) is a well-developed and widely used method for estimating pollution loads from nonpoint and point sources. The ECM is a well-developed and widely used method for estimating non-point and point source pollutant loads, and it can be used to more accurately assess the contribution of various sources of pollution to TN and TP loads, such as agricultural cultivation, livestock and poultry farming, aquaculture, municipal wastewater, industrial effluent, and rural wastewater, at the watershed scale (Yang and Yang, 2024). It is able to indicate the distribution and discharge of all potential sources of nitrogen pollution in the watershed, but it is not possible to accurately trace nitrogen pollution in the river, which is a “source-sink” analysis process. In recent years, microbial tracking technology has become a more efficient and accurate means of tracking pollution sources, based on the barcoding of 16S ribosomal DNA metabarcodes from different fecal, wastewater, and agricultural cultivation types, combined with a Bayesian population-wide non-culture-dependent microbial source tracking model (SourceTracker), to differentiate and quantify the contribution of these sources to watershed water bodies (Carson et al., 2024; Kelly et al., 2024; Ooi et al., 2024). Using this method to realize “sink-source” reverse traceability of nitrogen pollution in watersheds, with the potential for mutual validation with the ECM.
As a result, there is a higher demand for accurate traceability techniques to help develop pollution prevention and control measures. Based on two years of environmental statistics, land use types and microbial community monitoring datasets, a technical framework for source resolution based on ECM and microbial traceability modeling was established. This study includes the following aspects: 1) identification of priority sources of nitrogen pollution in the watershed based on the ECM model; 2) identification of microbial characteristics of nitrogen pollution sources based on the 16S amplicon and differential analysis; and 3) identification of nitrogen pollution sources and seasonal regional pollution status based on the MST and SourceTracker.
The Oujiang River is located in the south of Zhejiang Province, China. The basin ranges from 118°45′E - 121°00′E and 27°28′N - 28°48′N in China with drainage area of 18,100 km2, mainly including the Lishui City and Wenzhou City. The main river has a length 388 km and an elevation drop of 1.3 km. The average annual flow at the estuary is approximately 612 m3/s. The main tributaries of the Oujiang River are distributed in the form of dendrites. The area is dominated by in industrial and agricultural land, and urban settlements. In addition, as an important water source and sewage discharge channel in the area, it plays a pivotal role in economic development and people’s lives. In recent years, the continuous development of the economy and the acceleration of industrialization have brought more and more serious water pollution to the Oujiang River.
Water samples were collected from free-flowing reaches (FFRs) between January 13-20, 2021 and June 10-17, 2021. A total of 26 surface water samples were collected in the whole basin of the Oujiang River, including 18 from the main stream and 8 from the main tributaries (Supplementary Figure S1). In addition, water samples, manure, and soil samples from pollution sources were collected. A total of 50 enterprise factory samples, including paper mills (Pr), chemical plants (Cl), stainless steel plant (SS), electroplating factories (Plating), leather factories (Fc), Slaughterhouse (Sr), detergent factories (Dt) and breweries (Br). Additionally, a total of 50 manure samples were collected from farming production activities, including chicken (C), pig (PigM), duck (D), and goat farms (G), and additional tail water samples were collected from piggeries (PigW). Meanwhile, the tail water generated by human life was collected through the pipe network to the sewage treatment setup kind, and a total of 30 samples of tail water from sewage treatment plants (WWTPs) and 6 samples of rural domestic sewage treatment terminals (RSTT) were collected. In addition, agricultural cultivation is an important source of nitrogen pollution, and a total of six rice samples (RP), six JiaoBai samples (JBW) and six vegetable samples (V) were collected, as well as 12 natural soil samples (Soil). And 6 tea soil samples were collected in both farmland(TeaF) and hilly areas (TeaU). Meanwhile, 6 tailwater samples were collected from aquaculture plants (Ac).
The pH, water temperature (T, ˚C), electrical conductivity (EC), dissolved oxygen (DO), and oxidation-reduction potential (ORP/Eh, mV) were measured in situ using a multiparameter portable meter (HACH40d, USA) supplied by Hach Company (Loveland, CO, USA). All water samples were collected at 0.5 m below the water surface using two polyethylene bottles and preserved at 4˚C. They were then taken back to the laboratory and analyzed within 24 hours. Concentrations of chloride (Cl−), nitrate (NO3−), nitrite (NO2−), and ammonium (NH4+) were analyzed using ionchromatography (Dionex ICS-600). The δ15N-NO3− and δ18O-NO3− values were obtained using the denitrifier method, by which NO3− was converted into nitrous oxide by Pseudomonas aureofaciens, and then detected using an isotope ratio mass spectrometer (IRMS,Isoprime100, Cheadle, UK) after concentration and purification by the trace gas system (Liu et al., 2018).
The total nitrogen point sources within the study area included industrial wastewater, urban domestic sewage, and effluent from large-scale livestock and poultry farms, totaling 593 sites ((Supplementary Figure S2). Point source pollution refers to pollutants that originate from fixed discharge locations and are distributed in a point-like fashion. Generally, this includes industrial wastewater, urban domestic sewage, and emissions from large-scale livestock and poultry operations.This study calculated the total nitrogen emissions from point sources using statistical methods based on data from the 2022 Environmental Statistics, Statistical Yearbook, and the Fixed Pollution Source Automatic Monitoring Information Management Platform.Considering the loss due to evaporation, sedimentation, and other transformation processes that pollutants undergo after being discharged into water bodies, the load that ultimately impacts the water bodies differs from the initial emissions. The method of using river entry correction coefficients is employed to quantify the amount of pollutants that actually enter the river (Dumortier et al., 2019).
Using ArcGIS and BIGEMAP for point source latitude and longitude measurement correction, and based on the distance to the river combined with the National Water Environment Capacity Determination Technical Guide, the river entry coefficients for this study area were determined, as shown in Table 1.
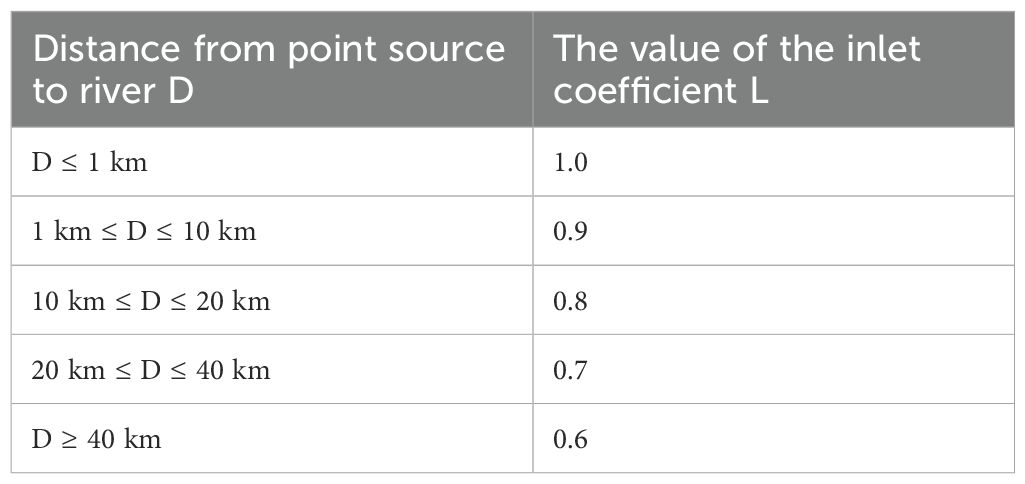
Table 1. Reference value of point source inflow coefficient of Oujiang River Basin.
Non-point source pollution originates from dispersed sources, and its emission pathways are complex, often displaying randomness over time and uncertainty in space. Generally, this includes sources such as rural domestic sewage, dispersed livestock and poultry farming, agricultural runoff, and urban stormwater runoff (Fan et al., 2024).
This study employed the modified Jones export coefficient model to calculate the load of non-point source pollution (Equation 1) (Johnes, 1996):
L is the pollutant emission load in the study area, t/a;i is the population, livestock population, and soil type in the study area, =1,2,3, ···, n; is the conversion coefficient, such as domestic sewage or fertilizer application into the river coefficient/livestock and poultry farming sheep, cattle, rabbits converted to pigs conversion ratio, etc., dimensionless; is the ith species of livestock and poultry/soil type/unit population and other export coefficients, the unit of the above three are kg/(head or only · a), t/(km2·a), kg/(person · a), mainly refer to the National Technical Guidelines on Approval of the Capacity of Water Environments, Manual on Methods and Coefficients for Accounting for Emissions from Agricultural Sources, Manual on Production and Emission Coefficients for Domestic Pollution Sources, Emission Standards for Pollutants from Livestock and Poultry Farming (DB 33/593-2005), and related watershed background literature and field research to match research results information acquisition. is the number of livestock and poultry of the ith species/area of land class/population in heads or animals, km2, and people, respectively; The second term of the equation is the rainfall runoff input pollution load calculation, is the jth field precipitation correction coefficient; is the field rainfall of the jth precipitation event affecting surface runoff, mm; is the average concentration of the jth precipitation event, mg/L; S is the runoff catchment area, km2. The values of each export coefficient are determined as shown in Table 2.
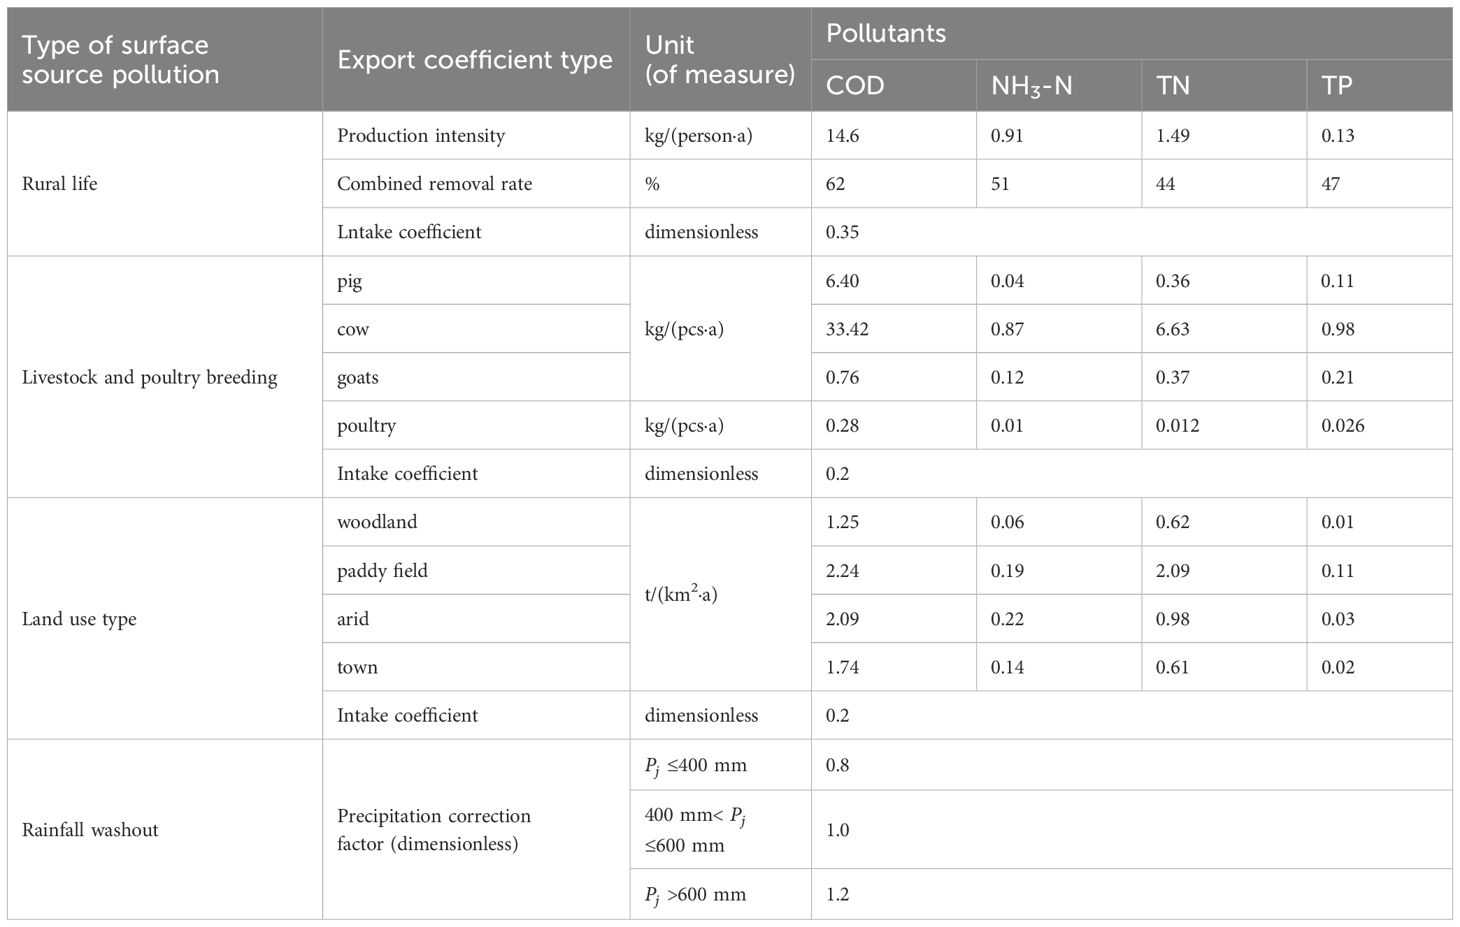
Table 2. Export coefficients of different non-point source pollutants of Oujiang River Basin.
Event Mean Concentration EMC in the above equation means the surface runoff pollution from precipitation at a site divided by the total amount of runoff under that site, calculated by the formula (Equation 2):
is the pollutant concentration in time period j, mg/L; is the runoff volume in time period j, m3.
Surface runoff from precipitation processes, especially heavy rainfall, impacts surface pollution systems by transporting pollutants, such as sediment and litter, into them (Wang et al., 2018).
The DNA from filter membrane was extracted with the Qiagen DNeasy PowerWater Kit. DNA concentration and purity were monitored on 1% agarose gels. Based on Qubit quantification, DNA was diluted to 10 ng/µL with sterile water. The V3-V4 region of the microbial 16S rRNA gene was amplified using the universal primers 341F (5′-CCTAYGGGRBGCASCAG-3′) and 806R (5′-GGACTACHVGGGTWTCTAAT-3′). An equal volume of 1X loading buffer containing GelRed® was mixed with PCR products, and electrophoresis was performed on a 2% agarose gel. Target bands (~550 bp) were excised and purified using the Qiagen Gel Extraction Kit (Qiagen, Germany). Purified amplicons were pooled in equimolar ratios and sequencing libraries were constructed using the NEBNext® Ultra™ II Q5® Master Mix (M0544) following the manufacturer’s protocol. The library quality was assessed using the Qubit® 2.0 Fluorometer and Agilent Bioanalyzer 2100 system with High Sensitivity DNA chips confirming a peak size of ~550 bp. Each PCR batch included negative and positive controls. Finally, libraries were sequenced on an Illumina NovaSeq platform, generating 250 bp paired-end reads that were merged using FLASH v1.2.11.
The 16S rRNA gene sequence data were processed by using two pipe-lines, LotuS (Hildebrand et al., 2014) and QIIME v1.9.1 as described previously. In brief, the paired-end reads were quality trimmed, merged, and clustered into operational taxonomic units (OTUs) with a threshold of ≥ 97% similarity. The reads of each OTU were classified using the Ribosomal Database Project classifier (80% confidence) based on the SILVA database v132. Quantitative analysis was performed using thespecies sequence abundance data from each sampling site. In order to standardize the uneven sequencing effort, all samples were randomly subsampled to the smallest library sizes with 32000 reads for microeukaryotic, respectively.
In the present study, bacteria from 24 fecal samples, 120 wastewater samples and 35 soil samples were defined as a potential source library and the bacteria from 36 surface water samples were defined as sink. The community-based MST analysis was performed using SourceTracker v. 1.0.1 in RStudio v. 0.99.896 with default parameters. Briefly, SourceTracker was run with the parameters of rarefaction depth 1000, burn-in 100, restart 10, alpha 0.001 and beta 0.01, which has been demonstrated to be high sensitivity, specificity and accuracy (Henry et al., 2016; Li et al., 2018). We calculated a diversity and b diversity using the ‘vegan’ package (v 2.6-4) in R. Non-metric multidimensional scaling analysis (NMDS), similarity analysis, α diversity index calculation, and mantel text analysis were performed using the R platform to determine the significance of differences in microbial community composition at different periods and the effects of environmental factors on microbial communities. Within the SPSS 22.0 platform, analyses were performed using the Kruskal-Wallis test and Spearman correlation.
Based on the data and coefficient corrections, the results shown in Figure 1. 7 indicate that in 2022, the point source emissions in the study area were primarily from urban domestic sources, amounting to 1.29×10^8 tons and accounting for 85.72% of the total. Industrial wastewater emissions were the second largest, totaling 1.63×10^7 tons and accounting for 10.79%. Emissions from other sources such as livestock and poultry farming were minimal.In the emissions of wastewater pollutants, the highest point source emissions come from domestic sources, followed by industrial sources. Among these, COD (Chemical Oxygen Demand) emissions account for the majority, totaling In the COD emissions, domestic sources contribute 96.78%, industrial sources 3.16%, and livestock and poultry farming sources 0.06%. The total NH3-N emissions across the entire watershed amount to 12,100 tons, with domestic sources accounting for 98.42%, industrial sources 1.48%, and livestock and poultry farming sources 0.10%.
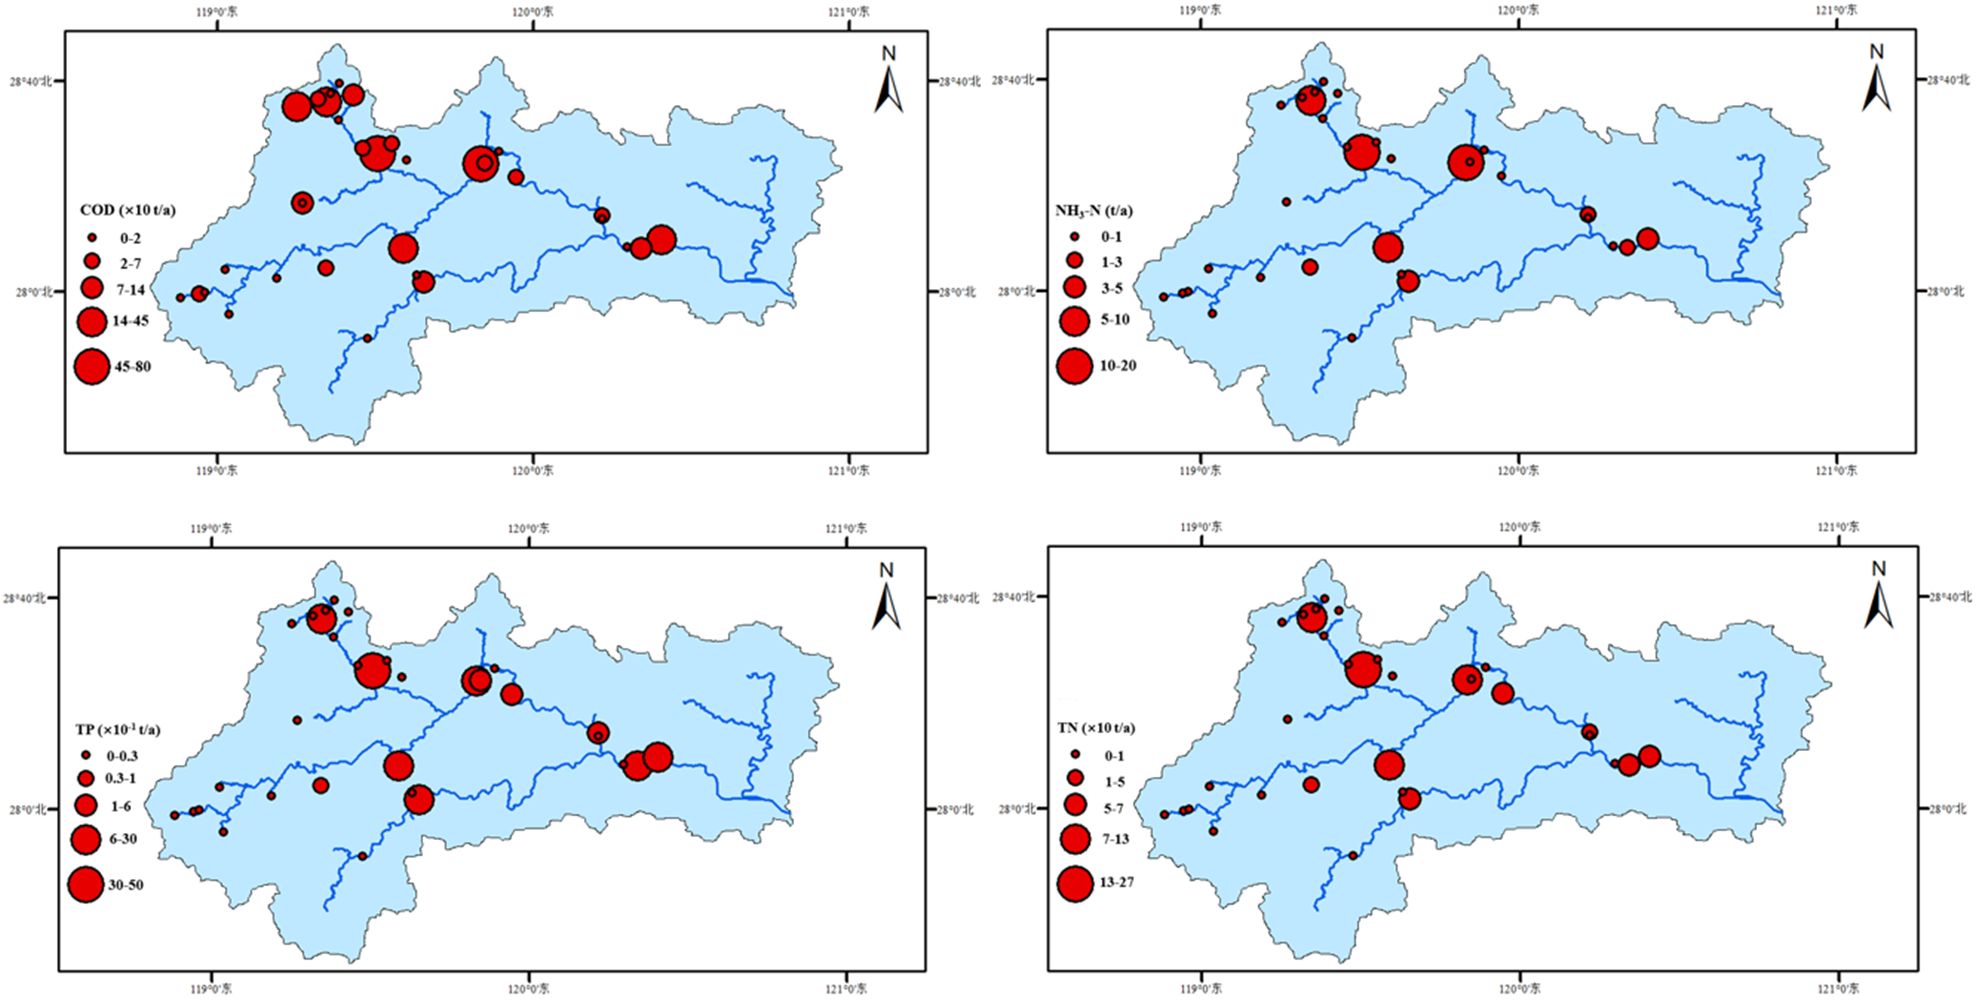
Figure 1. The spatiotemporal variation characteristics of critical point source pollution load emissions of Oujiang River Basin during 2016-2022.
The total TN (Total Nitrogen) emissions across the entire watershed amount to 2,870 tons, with domestic sources contributing 2,730 tons, accounting for 95.46%, industrial sources 127 tons, accounting for 4.42%, and livestock and poultry farming sources 3.3 tons, accounting for 0.12%. TP (Total Phosphorus) emissions are relatively lower, with domestic sources emitting 161 tons, industrial sources 2.7 tons, and livestock and poultry farming sources 0.04 tons.
According to statistics from the “Zhejiang Province Pollution Source Automatic Monitoring Information Management Platform,” the average concentrations and flow emissions data of COD, NH3-N, TN, and TP from 2016 to 2022 were used to calculate the pollution load emissions from significant industrial enterprises in the study area. The results are displayed in Figure 2. Over time, except for NH3-N, the trend of pollutant emissions has generally increased and then decreased in recent years, reaching a peak in 2019 and 2020. In contrast, NH3-N emissions have shown an overall declining trend. TN emissions peaked in 2019 and 2020 at 1834.9 and 1825.6 tons per year, respectively, with the lowest value recorded in 2016 at 170.3 tons per year. The emissions have also declined in recent years. Spatially, pollutant emissions are concentrated in the upper and middle reaches of the watershed, with tributaries primarily focused on the upper tributary, Songyin Creek. Notably, TN load emissions at some points along Songyin Creek exceed those in the main river, with the highest value recorded at 256.5 tons per year (Figure 1).
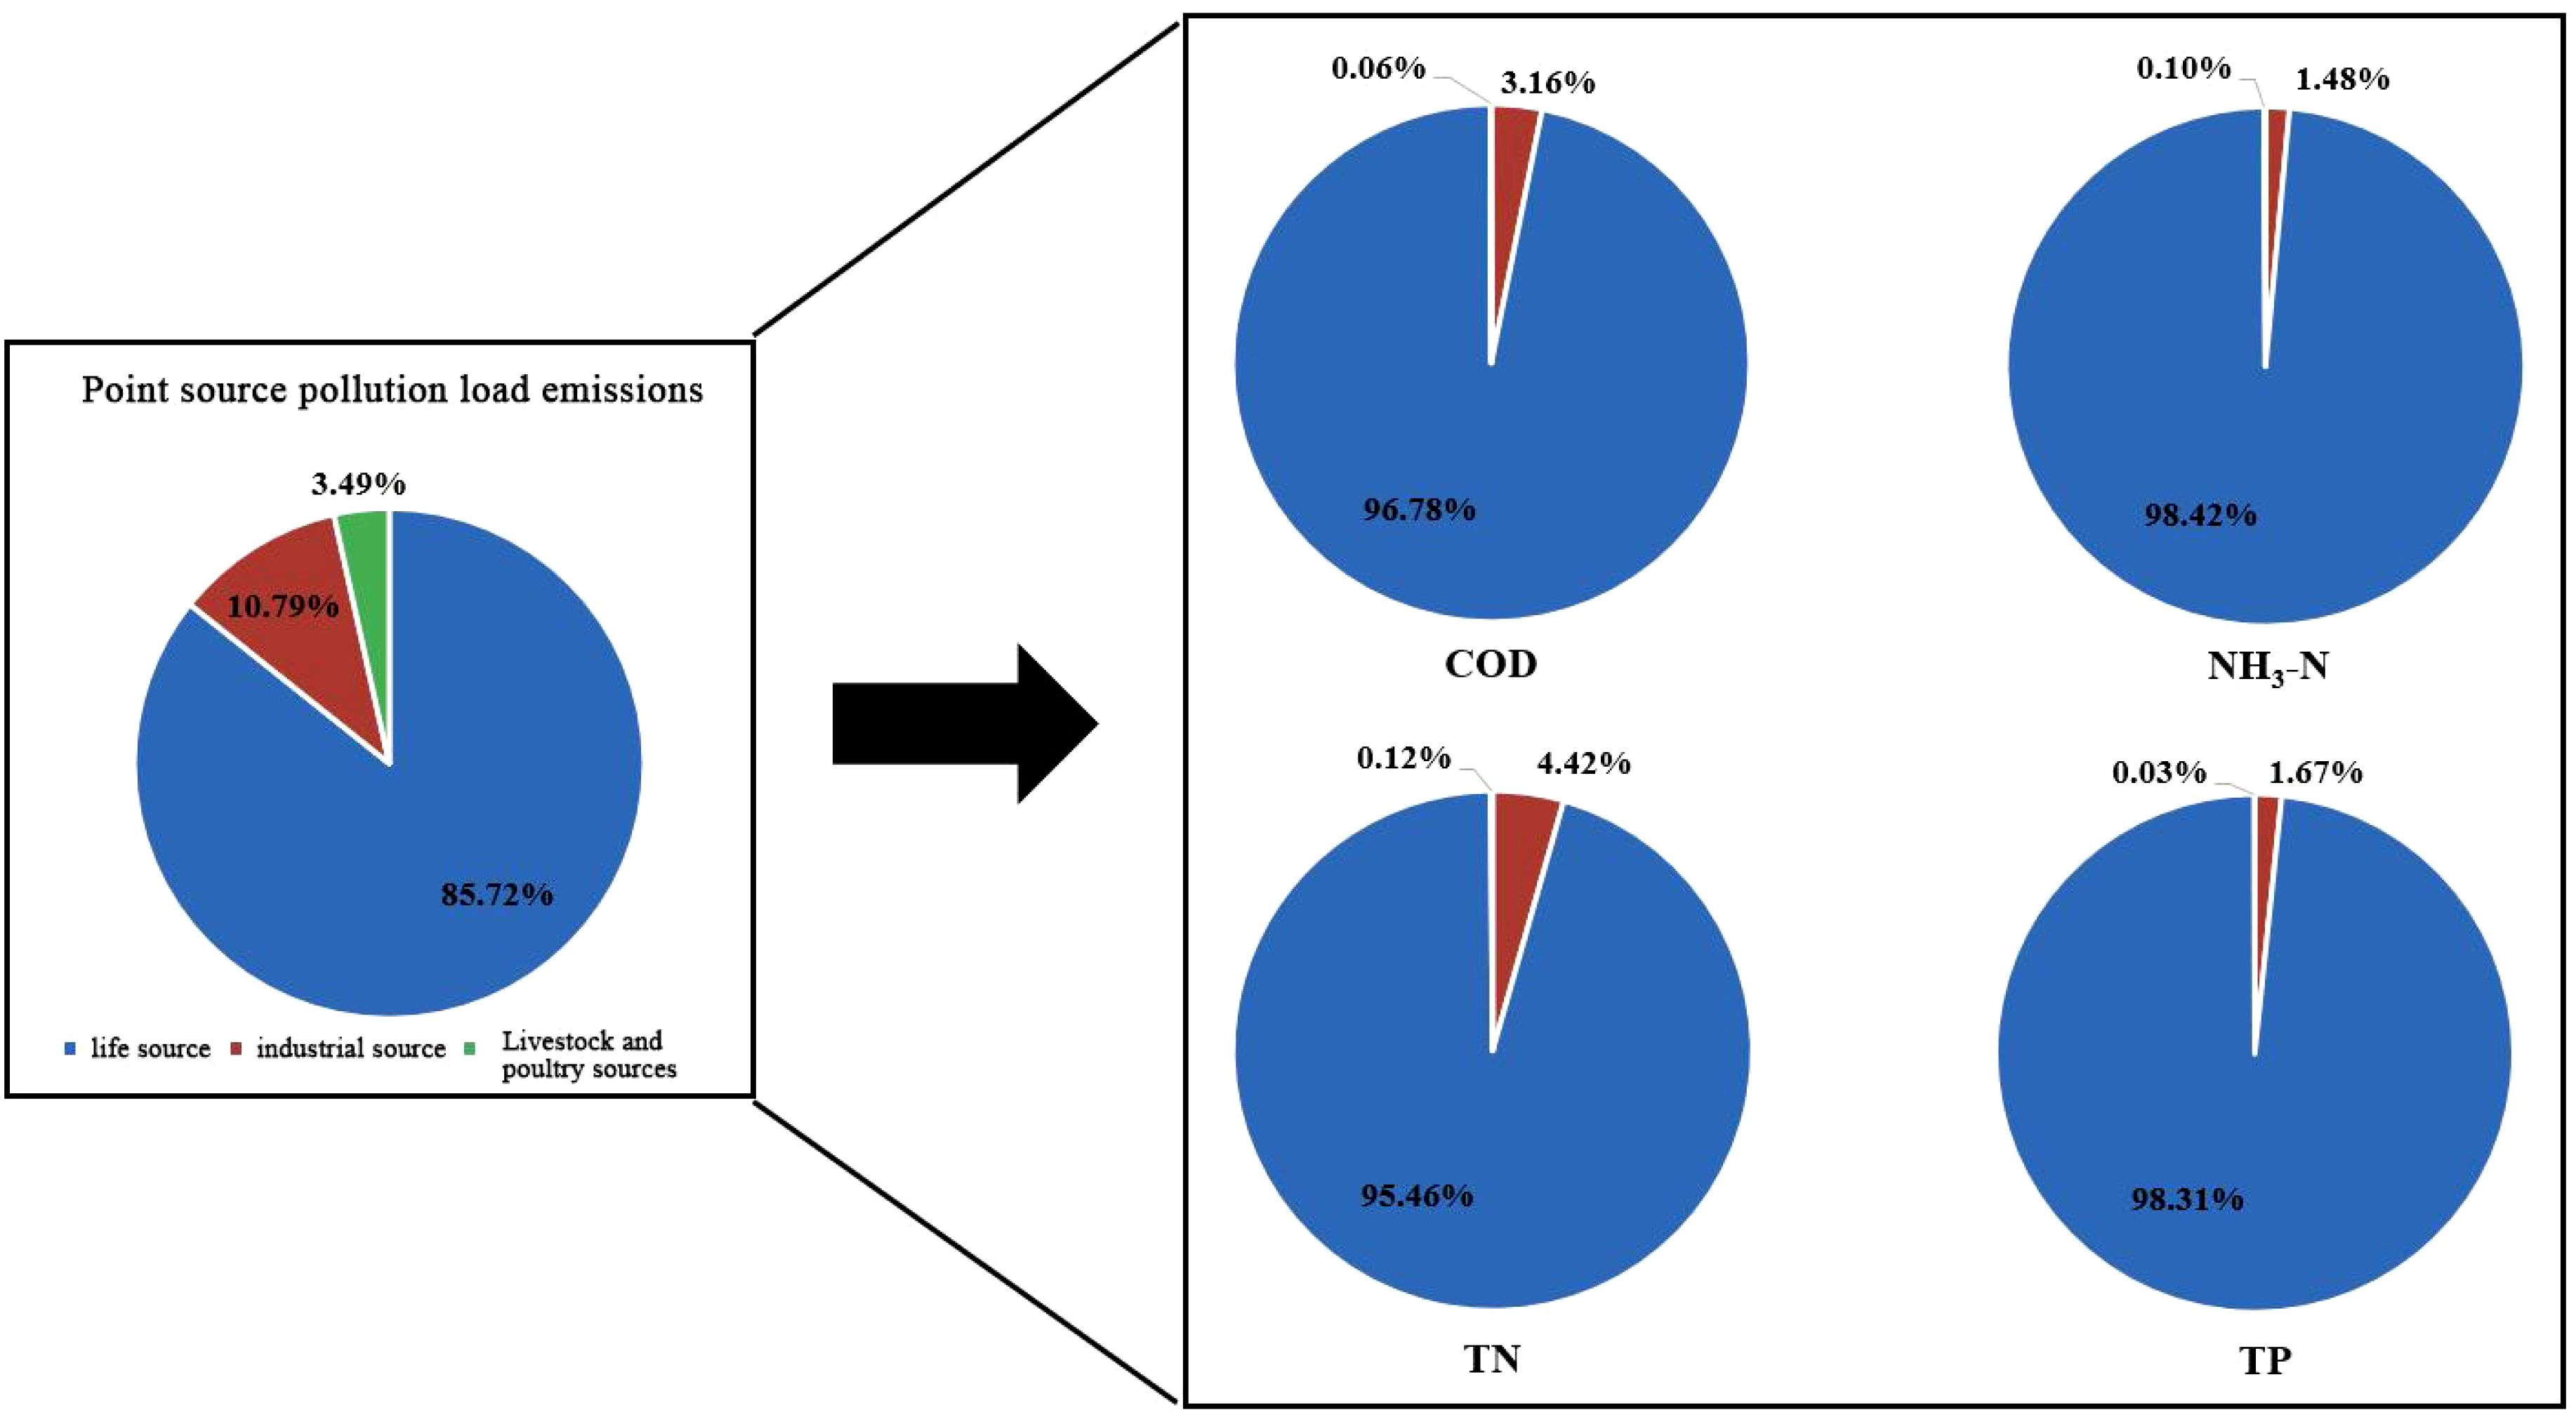
Figure 2. Proportion of point source pollution load emissions of Oujiang River Basin.
To facilitate the identification of spatial distribution characteristics of pollutants, the natural breaks method was used to reclassify the non-point source pollution load within the study area. The resulting spatial distribution is shown in Figure 3. The total annual loads of non-point source COD, NH3-N, TN, and TP are 10,689.857 tons, 535.781 tons, 2,699.555 tons, and 131.197 tons, respectively. High COD load areas are primarily located in the upstream tributaries of Songyin Creek and the mid-lower reaches of the main river, predominantly from rural domestic discharges, accounting for 54.13% of the load. The distribution characteristics of NH3-N loads are similar to those of COD, with rural domestic sources accounting for 55.36% of the NH3-N load. TN emissions are concentrated in the midstream tributaries, where, as previously mentioned, various types of agricultural pollutants have significant contributions. These midstream tributaries are covered with various types of forests, such as forest lands, open woodlands, shrub lands, and forests with varying degrees of cover. The load entering the river from these sources accounts for 82.01% of the total, while rural domestic sources contribute a smaller proportion, at 15.52%. This indicates that the amount of TN entering the river is heavily influenced by rainfall runoff, with TN wash-off amounting to 20.723 tons per year. This may be associated with relatively high background concentrations of TN in the study area, as analyzed in section 2.2.1, where TN concentrations have been high across different years. This underscores the necessity of establishing regulatory limits for TN loads in the study area. The TP load in the study area ranges from 0.147 to 6.323 tons per year, with the main type of pollution source being agricultural activities. The proportions of the other two types of non-point source pollution are relatively equal.
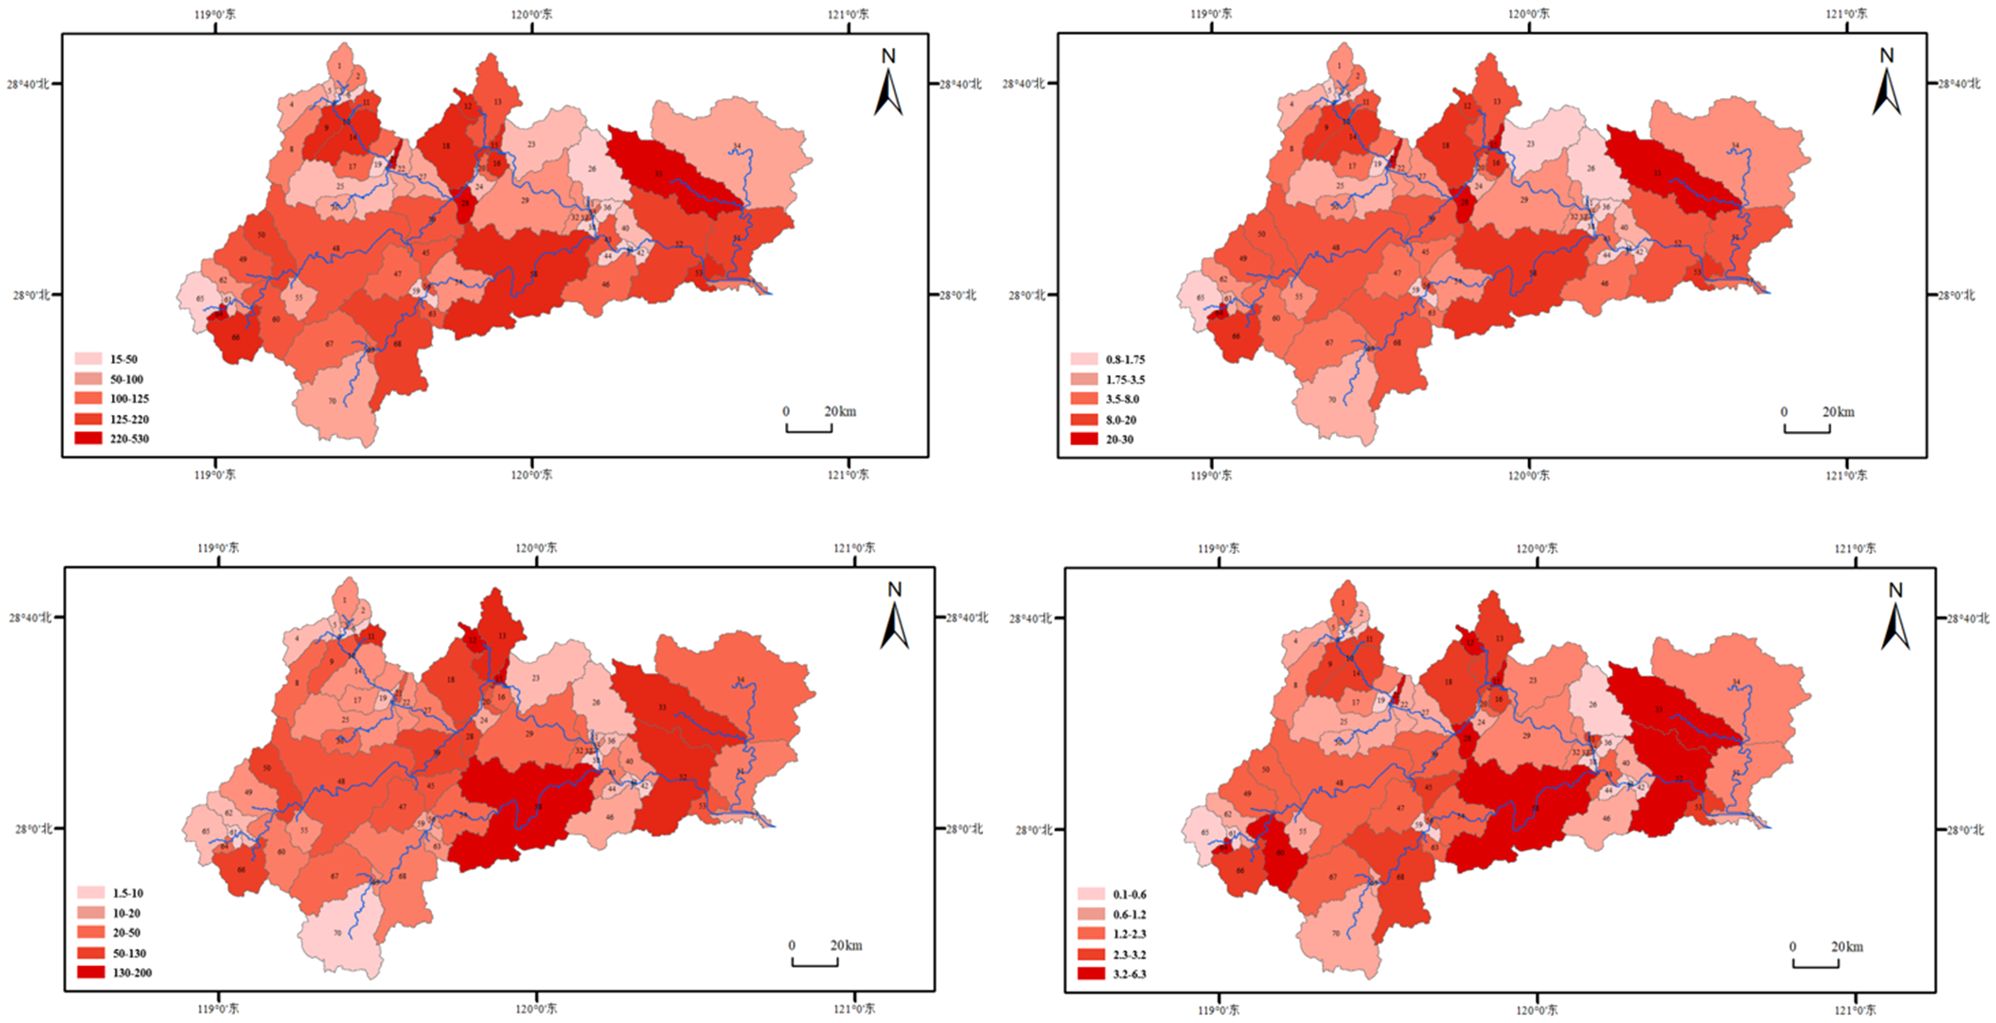
Figure 3. Spatial distribution of pollutants inflow loads of Oujiang River Basin.
Based on the calculation results of the export coefficient model, potential nitrogen pollution sources were screened out to provide scientific basis for further MST of nitrogen pollution sources.
The results of total nitrogen, ammonia nitrogen and nitrate nitrogen concentrations measured in the source wastewater are shown in Figure 4. TN concentrations in the WWTP effluent ranged from 6.25 to 12.3 mg/L, with an average concentration of 8.98 mg/L; NO3-N concentrations ranged from 0.14 to 8.45 mg/L, with an average concentration of 4.62 mg/L; NH3-N concentrations ranged from 0.04 to 0.334 mg/L, with an average concentration of 0.03 mg/L. TN concentrations in the RSTT effluent ranged from 10.3 to 20.5 mg/L, with an average concentration of 16.4 mg/L; NO3-N concentrations ranged from 0.9 to 3.08 mg/L, with an average concentration of 1.99 mg/L; NH3-N concentrations ranged from 8.92 to 18.78 mg/L, with an average concentration of 13.85 mg/L. In addition, the average concentration of total nitrogen in the effluents of enterprises in the sectoral industries is high. For example, the stainless steel industry has a total nitrogen concentration of 12.4 mg/L, the electroplating industry has a total nitrogen concentration of 28.4 mg/L, the brewery has a total nitrogen concentration of 11.5 mg/L, the slaughterhouse has a total nitrogen concentration of 30.2 mg/L, and the chemical industry has a total nitrogen concentration of 55.05 mg/L. However, the total nitrogen concentration of the tailwater from the washing industry (0.47 mg/L) is low. The total nitrogen concentration of 7.990 mg/L in the tailwater of the agricultural crop Zizania field is a significant source that cannot be ignored. It is worth noting that livestock farming, which is an important human economic activity, should be given priority attention as the total nitrogen concentration in the tailwater of pig farms reached 526 mg/L.
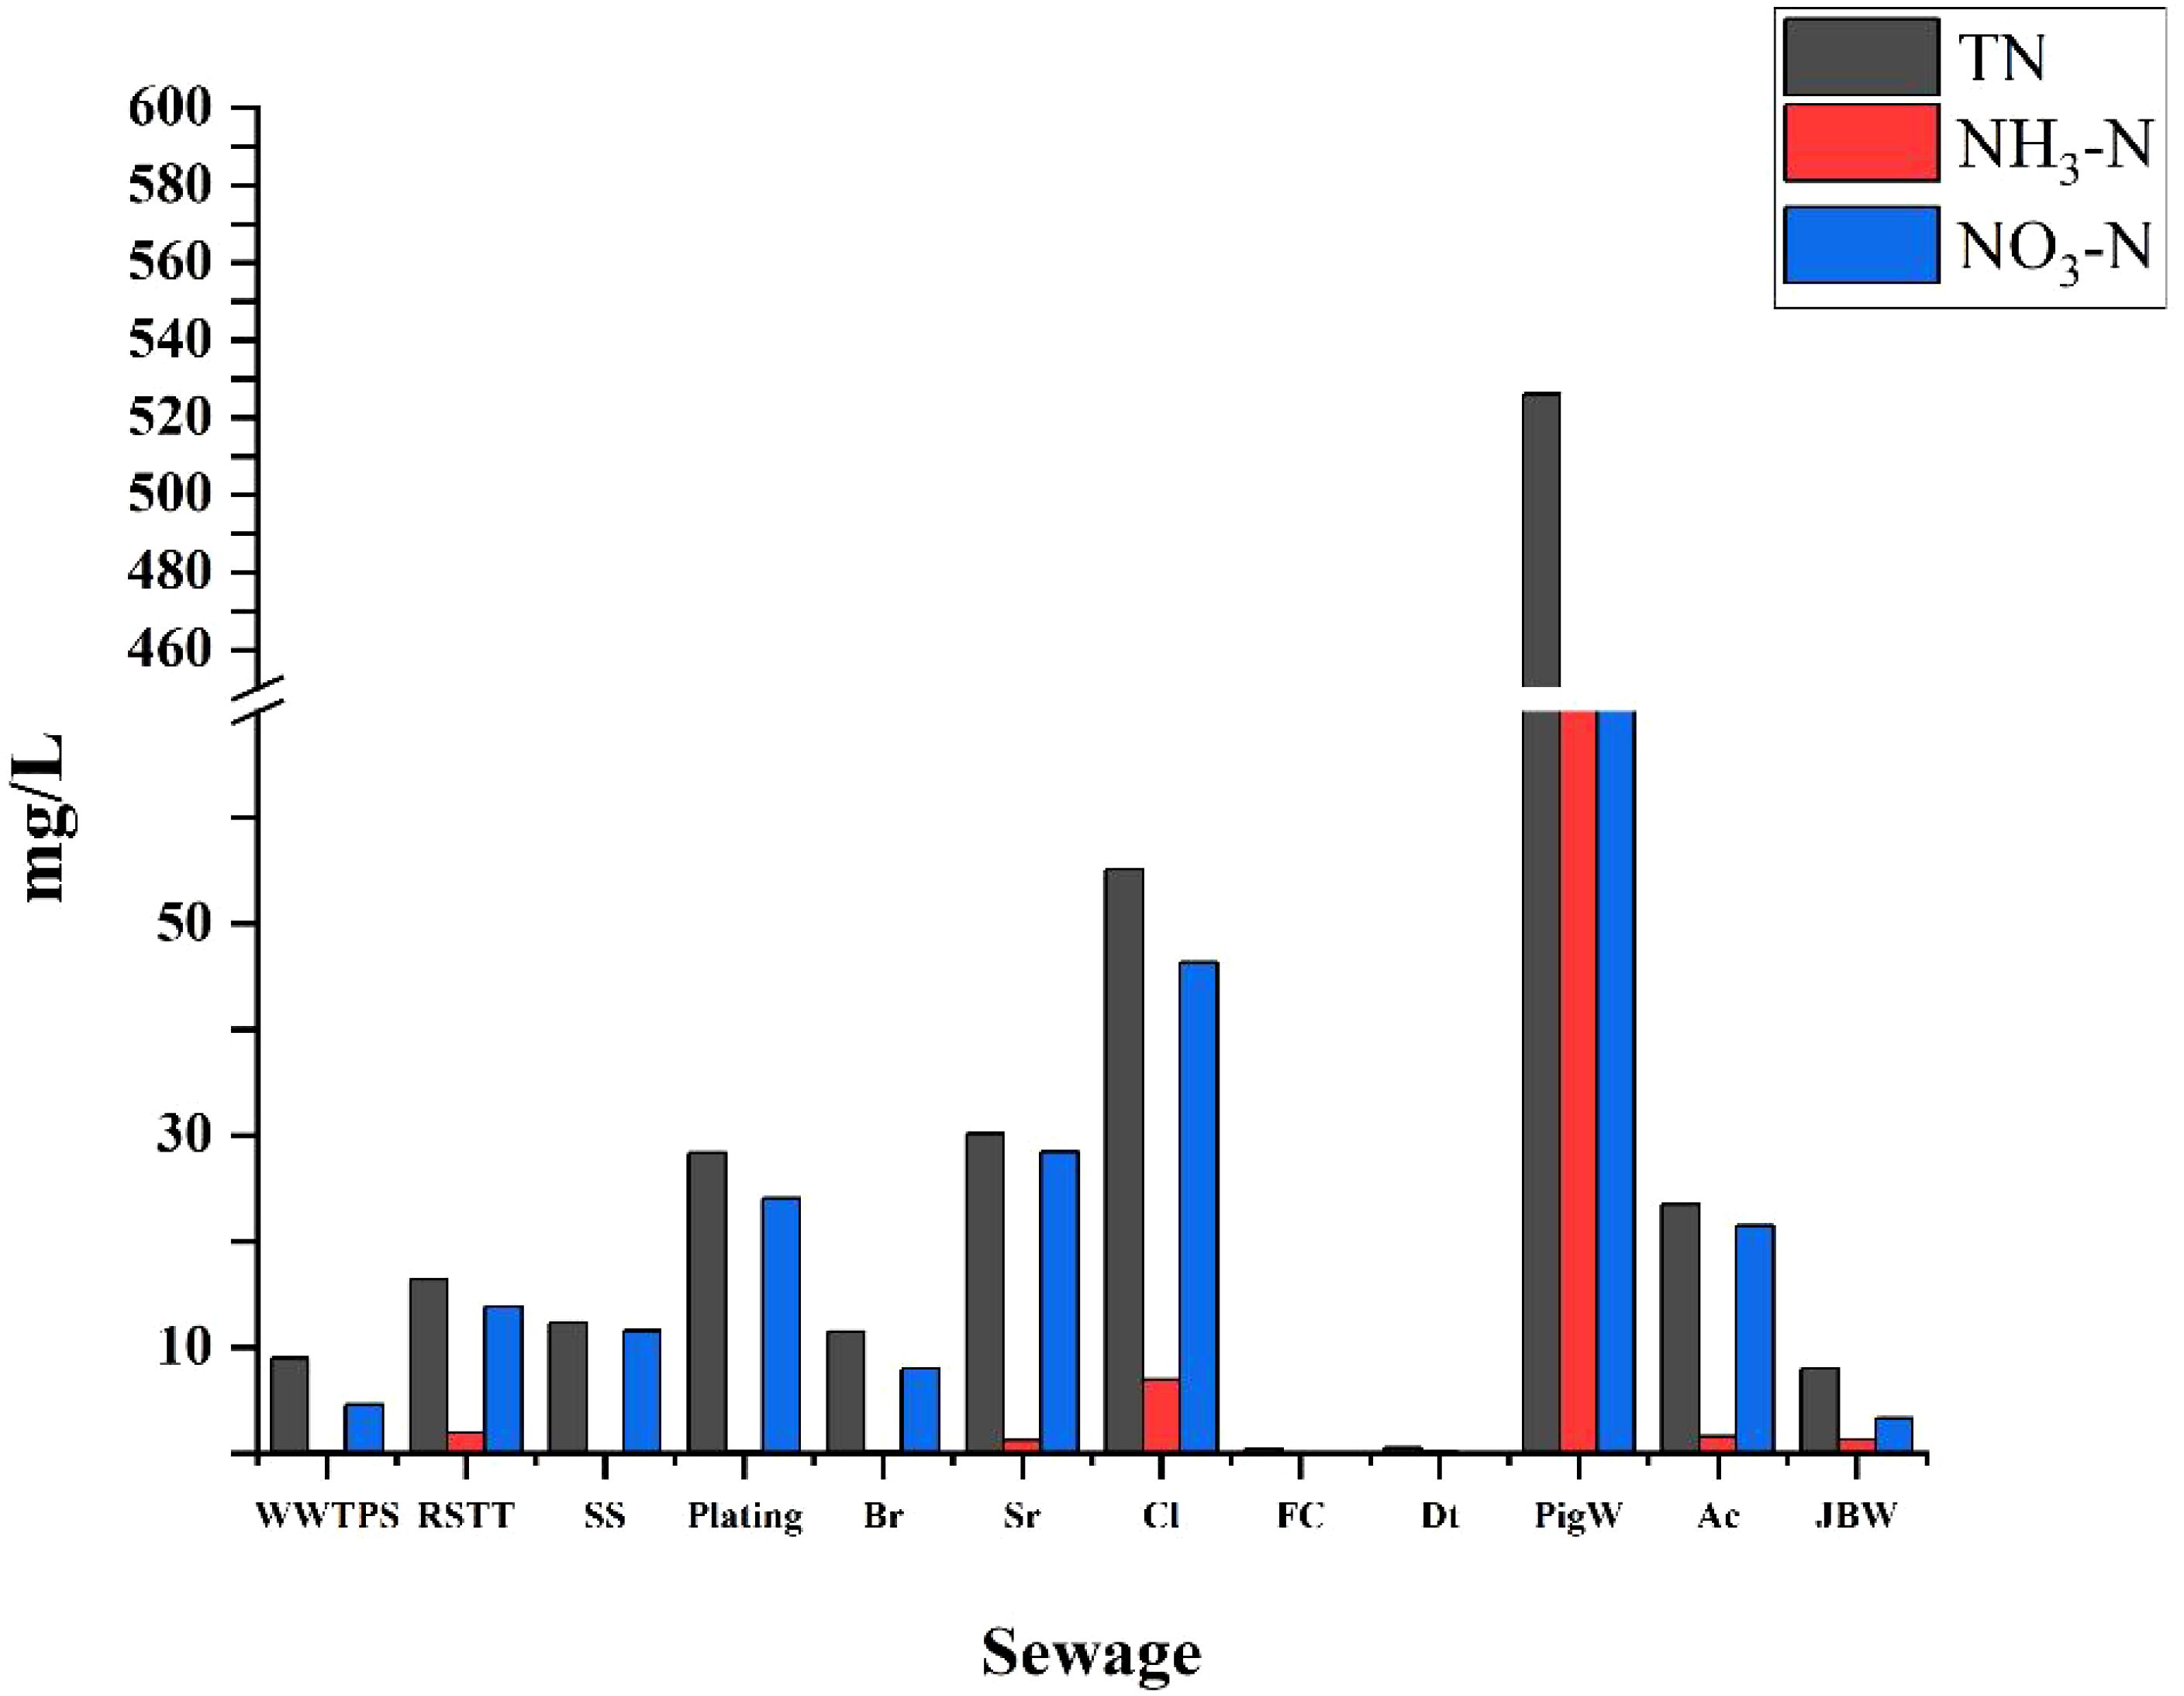
Figure 4. Nitrogen concentration of different forms in pollution sources.
The rarefaction curves tended to approach a saturation plateau, indicating that the sequencing depths were adequate for subsequent analysis. Differences in microbial abundance and diversity were found in end elements of different nitrogen pollution sources. According to chao1 and Shannon’s index showed Figure 5 that the species richness and diversity of agricultural cultivation sources were significantly higher than that of corporate and fecal sources, with rice cultivation having the highest richness and diversity index. Tea cultivation has higher species richness and diversity of microbial communities in hilly areas than in farmland areas. As a heavily cultivated crop in the study area, Zizania latifolia, which requires a large amount of water for irrigation, has a relatively low microbial abundance compared to other cultivated crops. Notably, among the corporate sources, the highest species richness and diversity indices were found in rural domestic wastewater treatment terminals and the lowest in slaughterhouses. Cluster analysis showed that the differences in microbial community structure were significant at the OTU level, which could clearly distinguish different sources of nitrogen pollution and provide an application basis for microbial fingerprinting traceability (Figure 6). The two-dimensional distribution and clustering of the samples in the MNDS space showed that there were significant differences in the microbial community structure of feces, sewage, agricultural cultivation, and natural soil. Manure sources, particularly, showed greater dispersion and were able to clearly differentiate between chicken, duck, pig, and goats manure. In addition, different types of agricultural cultivation and natural soils have a significant degree of separation, able to significantly mountain tea, farmland tea, watercress on wild rice, wild rice soil, rice, vegetables and natural soils. The high degree of similarity in the microbial communities of the effluent sources of the enterprises may be due to the fact that the enterprises in the study area have well-established effluent treatment terminals and use similar tailwater treatment processes.
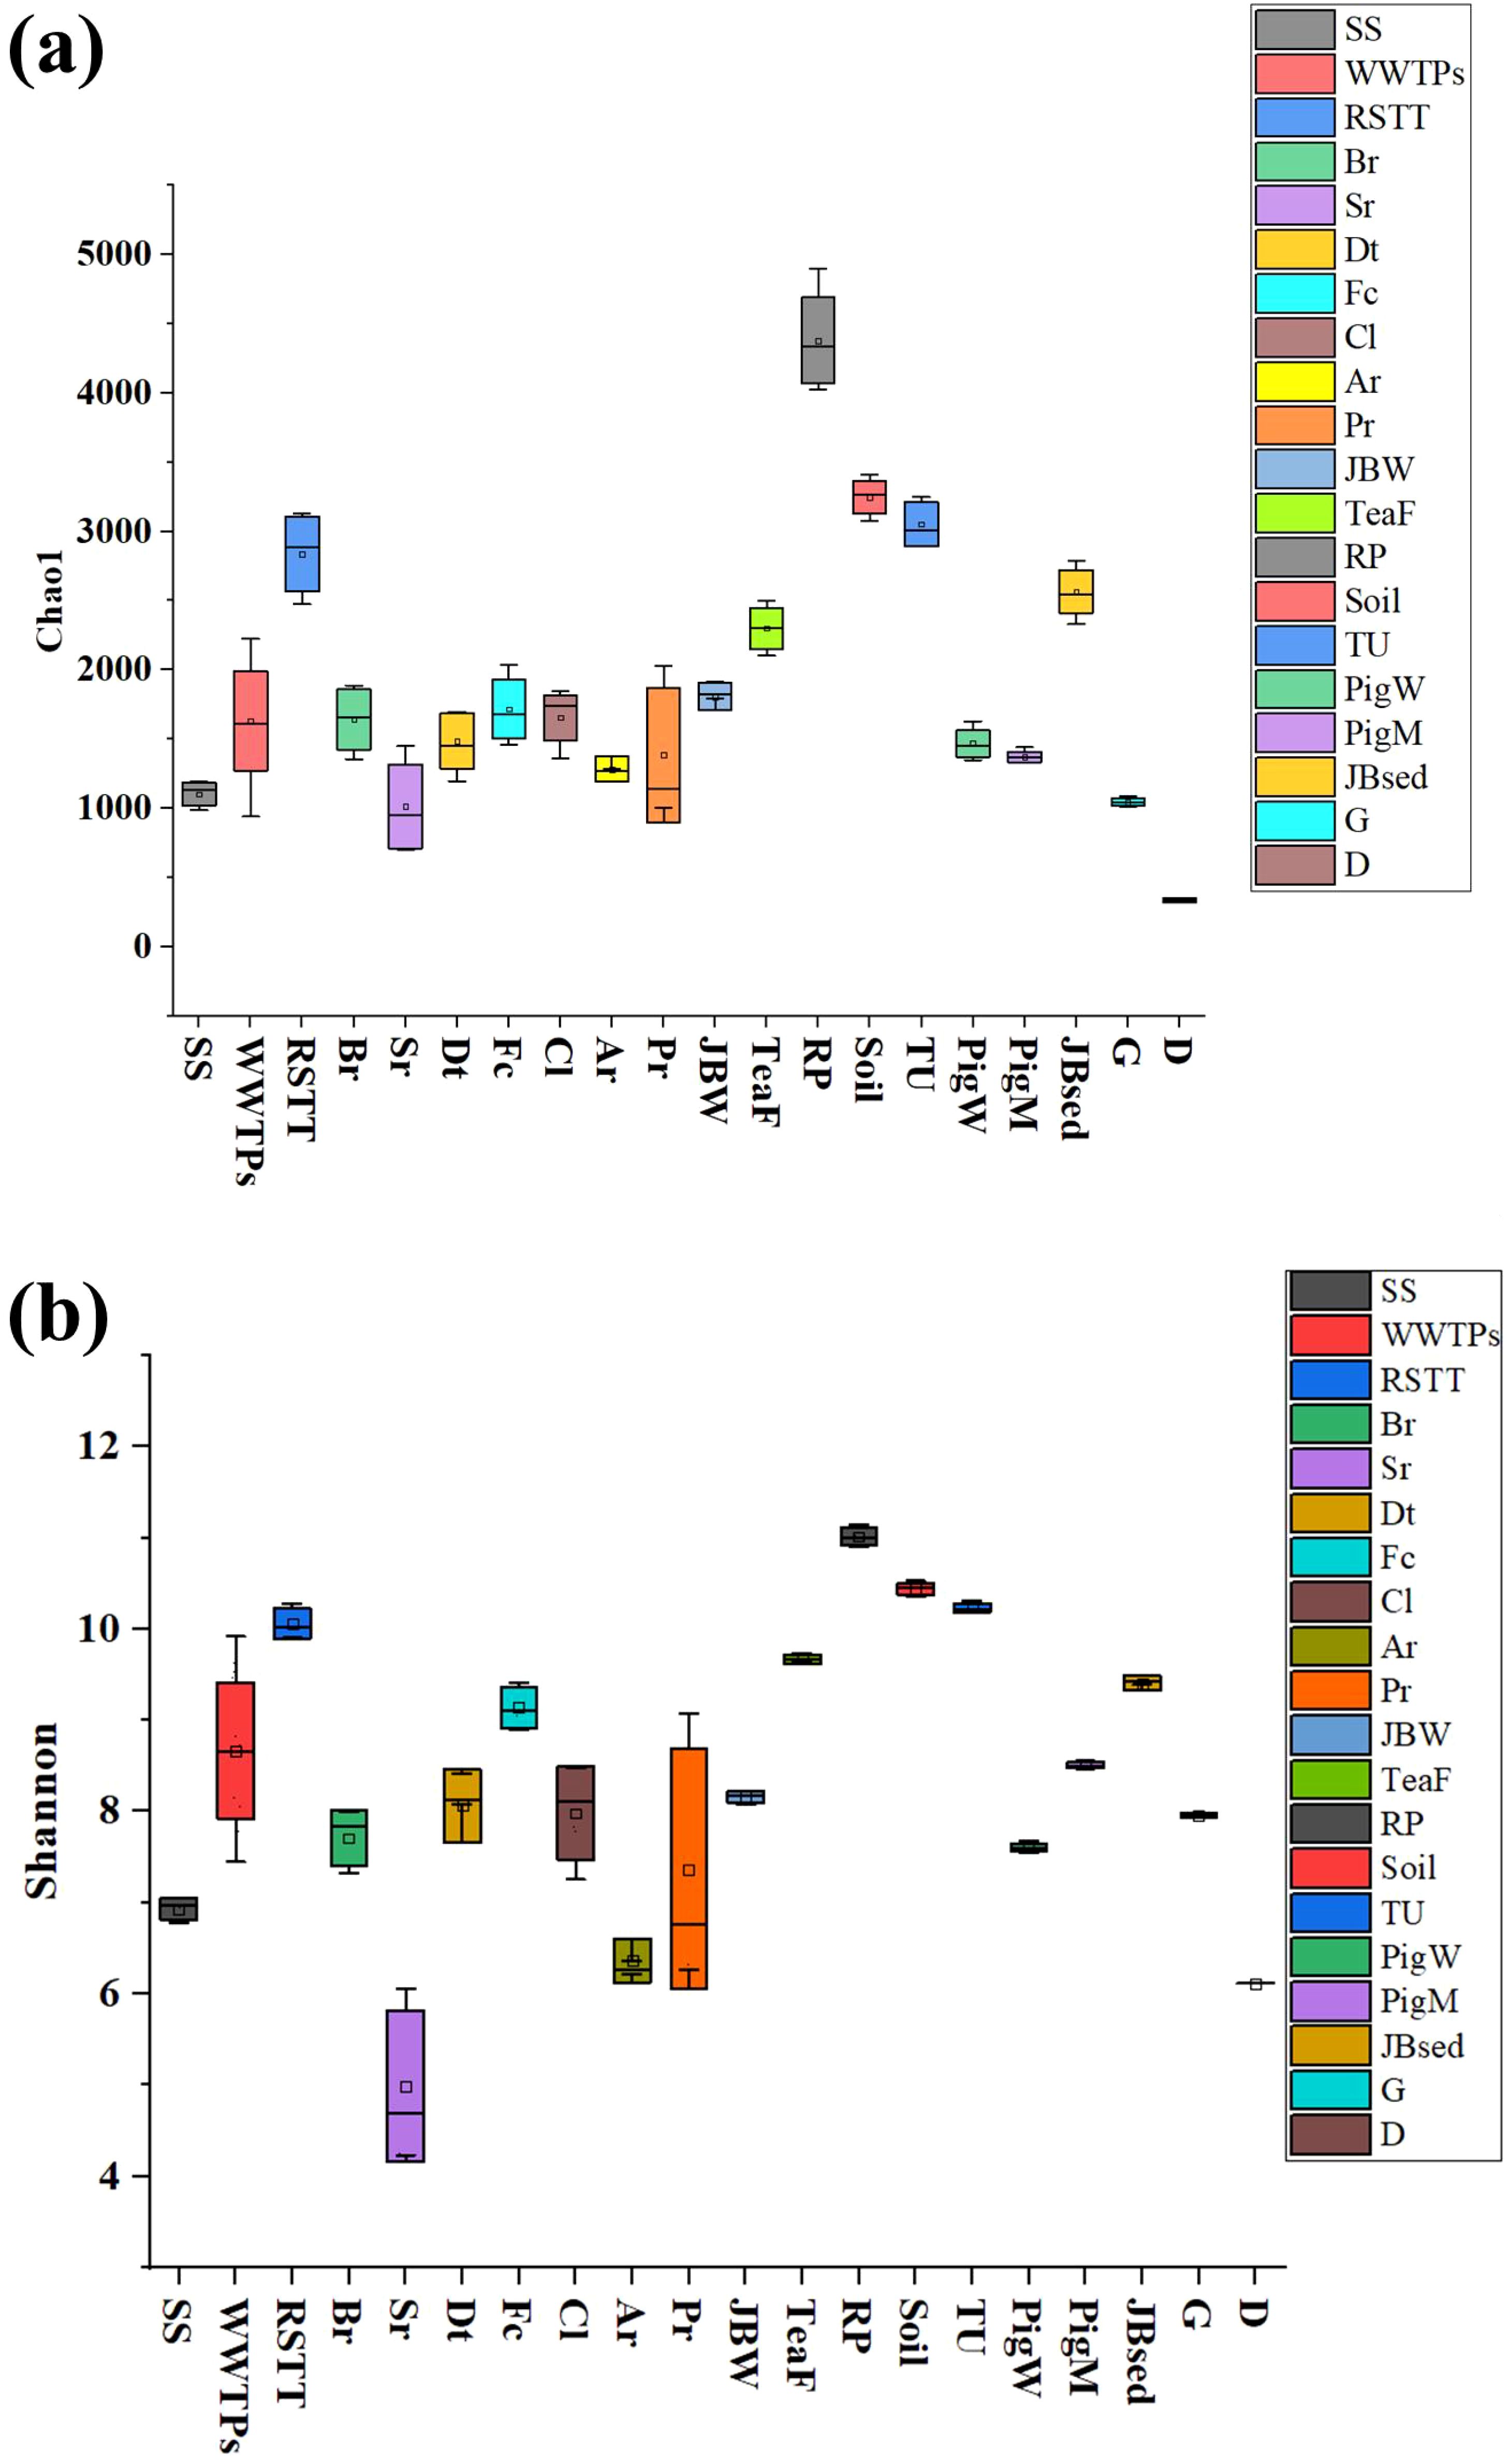
Figure 5. Pollution source richness index (a) and diversity index (b).
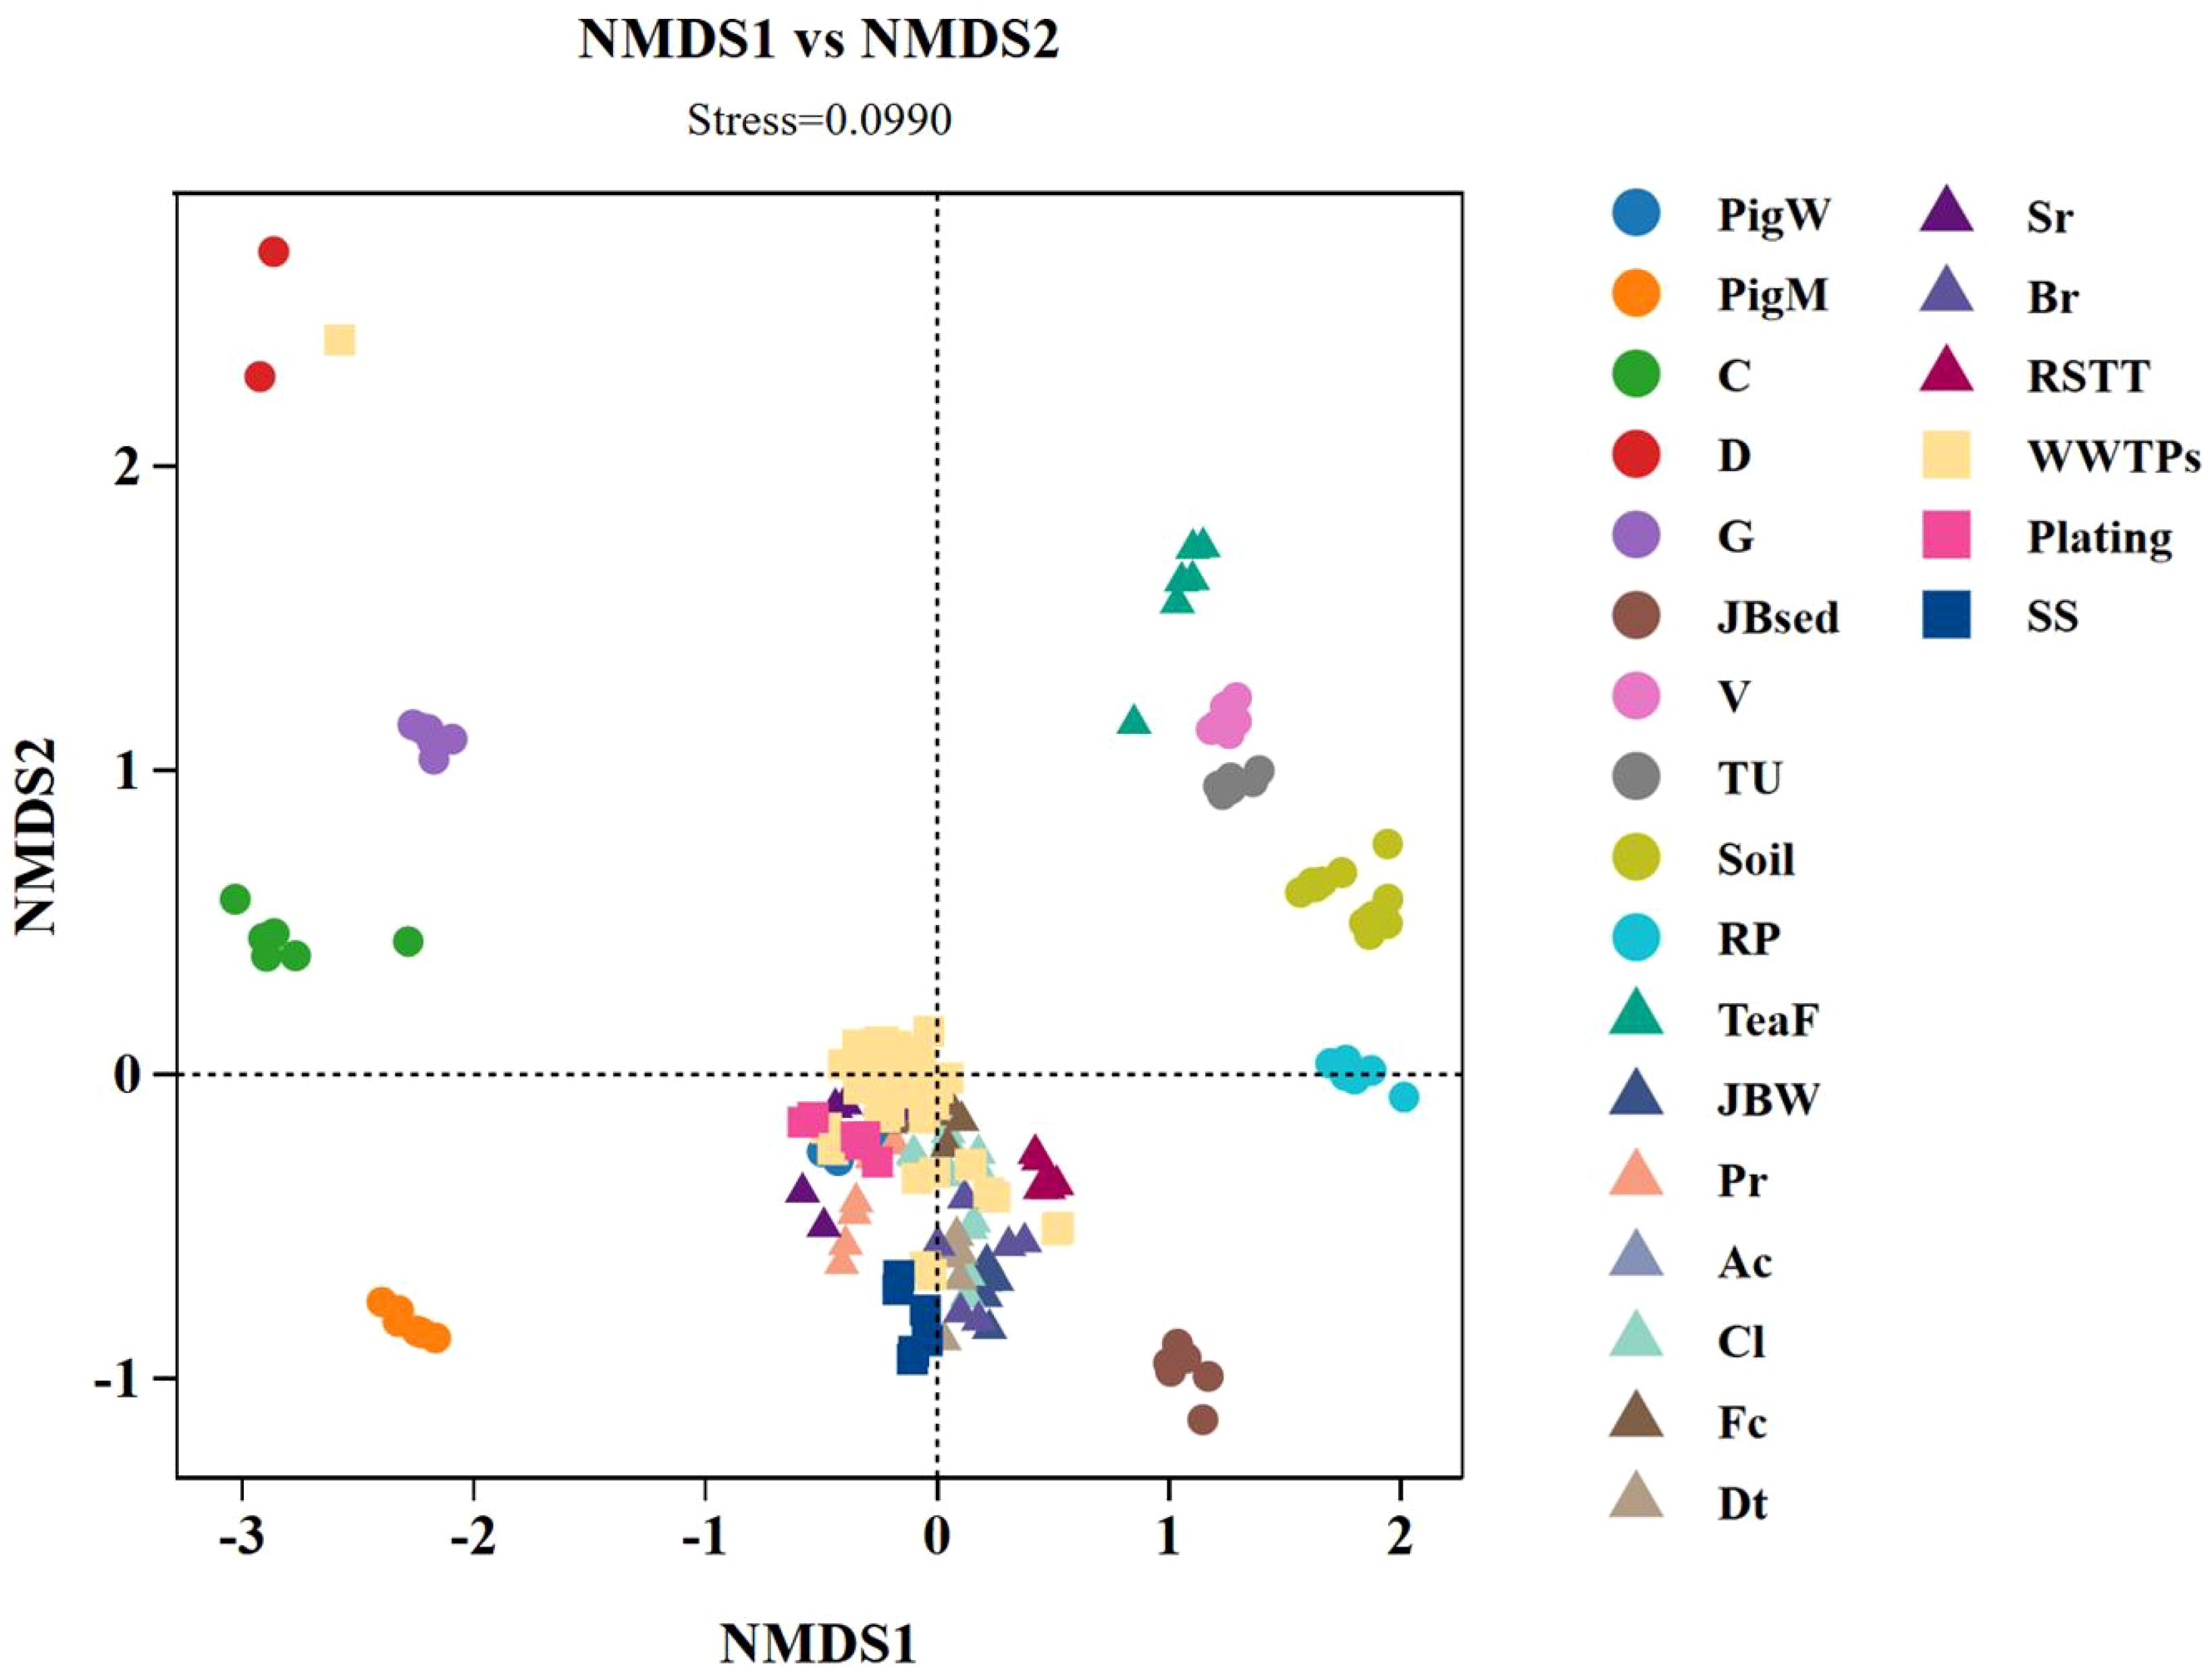
Figure 6. β-diversity of bacterial samples from all pollution sources.
Overall, 211558 OTUs were obtained from 180 samples by 16S rRNA gene amplicon sequencing, respectively. As shown in Figure 1a, Seven typical sources of pollution are included. At the phylum level, all contaminants consisted mainly of Proteobacteria, Firmicutes, Bacteroidota, Actinobacteriota and Acidobacteriota, with relative abundances greater than 50% (Figure 7a). At the genus level, there were significant differences in the composition of the flora from different sources of contamination (Figure 7b). Among the source categories of corporate plant pollution, the dominant genera in stainless steel plants are Rhodobacter (26.19%) and Brachymonas (17.8%). The advantageous bacterial genera of the brewery is Aquicella (13.63%).The advantageous microbial community of slaughterhouses is Leeia (26.20%). The excellent microbial community of the synthetic leather factory is unclassified_Anaerolineae (12.57%) and Nitrospira (5.61%). The advantageous microbial communities of cleaning agents, soap, and toothpaste factories are uncultured_soil_bacterium (7.49%). The excellent microbial community of leather substrate factory is Hydrogenophaga (5.77%). The advantageous microbial community of the paper mill is unclassified_Saccharimon (16.34%). The advantageous microbial community of electroplating enterprises is unclassified_Gemmatimo (2.06%).
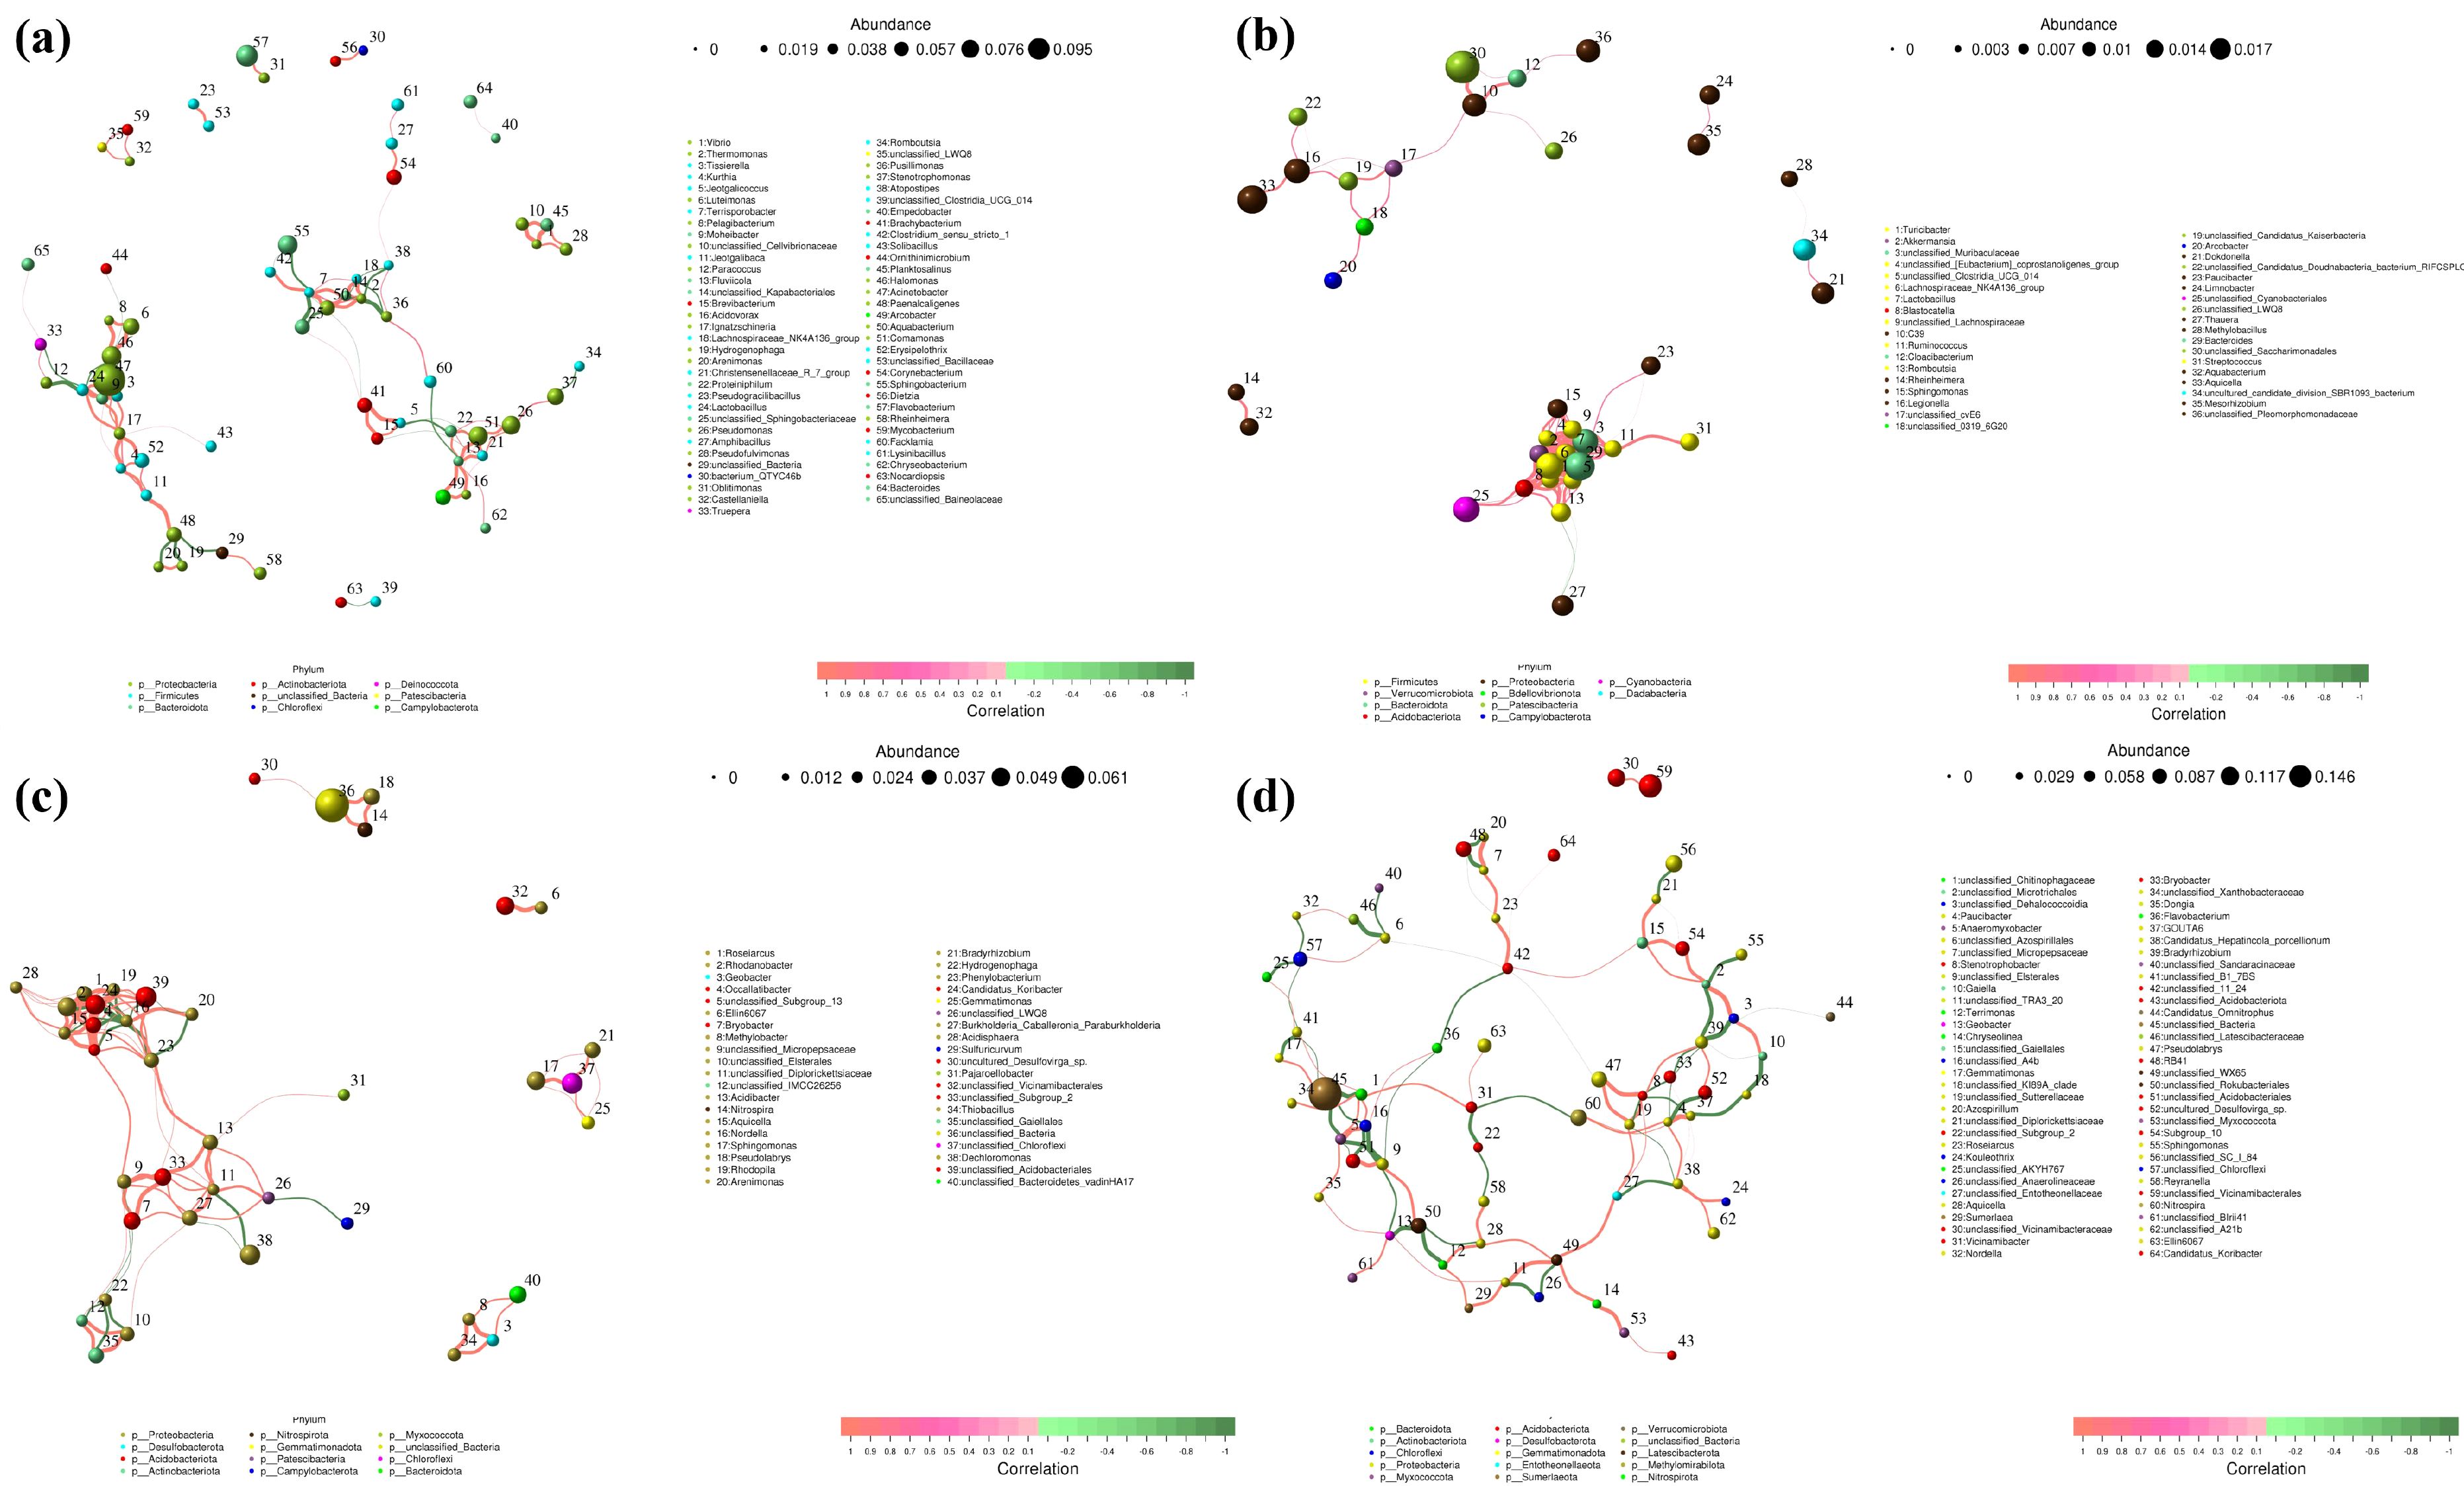
Figure 7. Pollution source co-occurrence network (a) Manure; (b) Sewage; (c) Agriculture and (d) Soil.
The dominant bacterial group in the wastewater of pig farms is Comamonas (3.62%), and Acinetobacter (20.27%) is present in the manure. The dominant microbial community in chicken manure is Acinetobacter (19.73%). The dominant bacterial group in chicken manure is Acinetobacter (18.30%), in sheep manure is Halomonas (7.76%), and in duck manure is Brachybacterium (12.70%). The dominant microbial community in aquaculture effluent is hgcI_clade (8.45%) and Limnohabitans (11.49%). The composition characteristics of fecal microbiota differ from the dominant microbial community of chicken manure samples collected in the Chaohu Lake Basin in other studies (chicken manure, Escherichia-Shigella), while pig manure samples are similar (pig manure, Acinetobacter) (Qi et al., 2023). Indicating regional differences in microbial community characteristics.
The dominant microbial community in natural soil is unclassified_Bacteria (11.38%~13.86%) and unclassified_Vicinamibacter (4.63%~5.34%). The dominant microbial communities in tea, rice, and vegetables are unclassified_Bacteria (5.52%~5.96%). The dominant bacterial community in the tail water of Jiaobai field is hgcI_clade (10.16%), and the dominant bacterial community in the sediment is uncultured_soil_bacterium (4.40%). The dominant microbial communities in sewage treatment plants are mainly Methylophilus, Lachnospiraceae_NK4A13 Bacteroides, and Bacteroides.
Pollution sources can be categorized into four major groups: Manure, Sewage, Agricultural Planting, and Soil. Additionally, we further distinguished specific pollution sources within these four categories. Using contribution networks, we elucidated the direct and indirect interactions among coexisting microbial taxa in environmental samples, documenting the co-occurrence patterns within complex and diverse communities. Based on this, we constructed a microbial fingerprinting map for each pollution source.
The MENs of Manure, Sewage, Agricultural planting and Soil were composed of 45 nodes with 100 edges, 36 nodes with 100 edges, 40 nodes with 105 edges, 40 nodes with 100 edges, and 64 nodes with 100 edges, respectively. Figure 8 provides a comprehensive visualization of the interaction network between genera, providing a deeper understanding of the complex relationships between microorganisms and bacteria. Noteworthy genera such as Acinetobacter, Flavobacterium and Halomonas emerged as key nodes within the network, exhibiting prominence in terms of their connectivity. Central nodes including Fluviicola, Ignatzschineria and Terrisporobacter displayed extensive interactions with numerous other nodes, underscoring their pivotal roles and contributions to the microbial ecosystem. In the sewage network, Lachnospiraceae NK4A136_group and Bacteroides are key nodes with strong interaction relationships with other nodes. Bacteroides, Aquicella, Lachnospiraceae_NK4A136_group, was a key strain in Natural Soil and Agricultural Planting networks, although there are similarities between the two networks, certain differences have still been found. Candidats_Hepatincola, a slow growing rhizobium, interacts with more nodes in the natural soil network to form complex relationships. Compared with agricultural planting, it has more nodes, and agricultural planting activities reduce the number of nodes involved in microbial community interactions in natural soil. Phenylobacterium, Nordella, Roseiarcus interacts with more nodes in agricultural planting networks. We constructed fingerprint profiles of microbial taxa based on co-occurrence networks. The fecal source contained 65 genera, the wastewater source included 36 genera, the agricultural cultivation source comprised 40 genera, and the soil source contained 64 genera. Different pollution sources exhibited distinct microbial profiles, providing essential data support for subsequent source tracking.
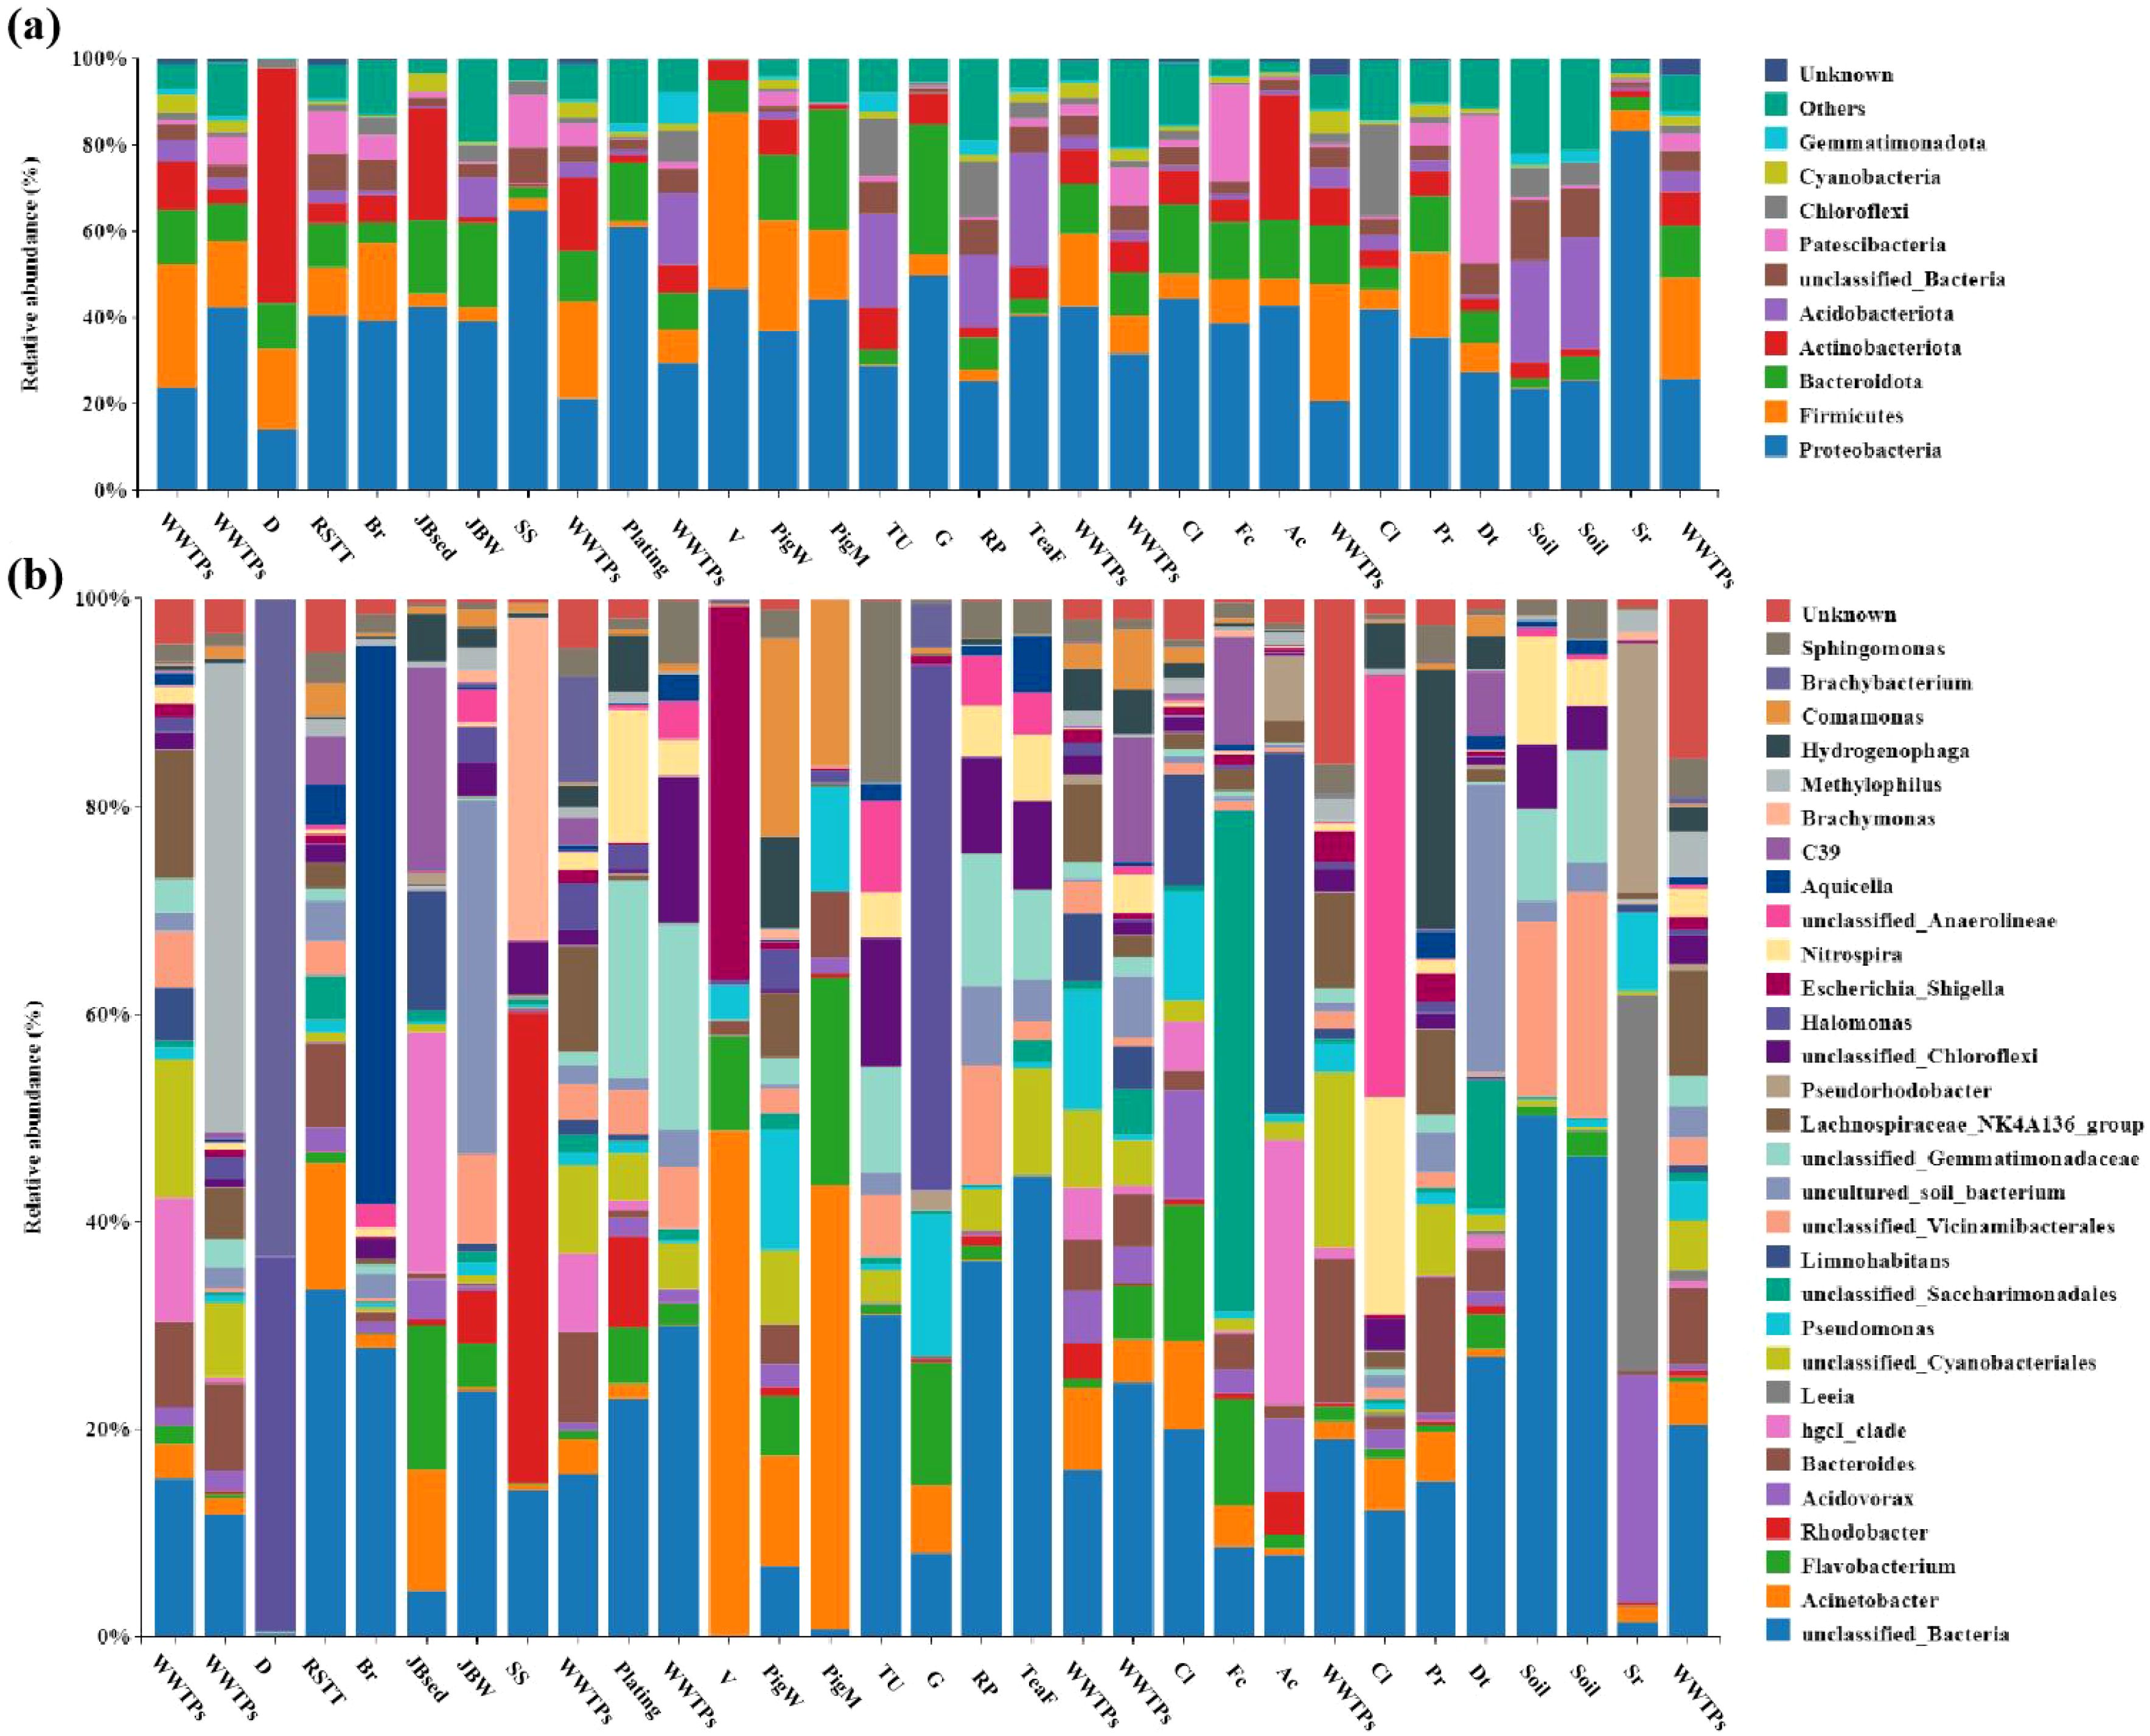
Figure 8. Microbial community composition of all sampling points in the pollution source, at phylum level (a) and genus level (b).
We have calculated the co-occurrence networks for all pollution sources (Supplementary Figures S3-S23) and generated microbial fingerprint profiles for different pollution sources, revealing distinct variations among them (Figure 9). The number of bacterial genera varied across different pollution sources, with wastewater sources containing relatively fewer genera (36–63) compared to soil sources (63–75) and fecal sources (70–75). Specifically, wastewater treatment plant (WWTP) sources harbored 50 genera, primarily including Akkermansia and Sulfurimonas. Rural sewage treatment terminal (RSTT) sources contained 60 genera, with dominant taxa such as Dechloromonas and Haemophilus. Chemical industry (Cl) sources had 63 genera, including Nitrospira and Thauera, while stainless steel plant (SS) sources featured 54 genera, with Brachymonas and Xanthobacter as the main taxa. Similarly, paper mill (Pr) sources contained 59 genera (Alistipes, Kaistia), electroplating industry (Plating) sources had 57 genera (Dokdonella, Mesorhizobium), and leather industry (Fc) sources exhibited 46 genera (Aquicella, Polynucleobacter). The detergent industry (Dt) sources had 57 genera (Paucibacter, Blautia), while the brewery (Br) sources harbored only 35 genera, including Legionella and Enterococcus. The slaughterhouse (Sr) sources contained 50 genera (Romboutsia, Leeia), aquaculture (Ar) sources had 66 genera (Limnohabitans, Leifsonia), pig farm wastewater (PigW) sources had 58 genera (Turicibacter, Bacillus), and pig manure (PigM) sources exhibited 70 genera (Arcobacter, Comamonas). Among fecal sources, chicken manure (C) sources contained 71 genera (Acinetobacter, Shigella), while goat manure (G) sources had the highest diversity with 75 genera (Halomonas, Sphingobacterium). Tea plantation soil in hilly areas (TU) sources also contained 75 genera (RB41, Bryobacter), while tea plantation farmland (TeaF) sources had 63 genera (Occallatibacter, Puia). In agricultural sources, rice paddy (RP) sources exhibited 75 genera (Vibrio, MND1), water bamboo sediment (JBsed) sources had 65 genera (Dechloromonas, Methylobacter), and water bamboo wastewater (JBW) sources contained 58 genera (Flavobacterium, Rhodoluna). The vegetable farmland (V) sources had 74 genera (Pedobacter, Nitrosospira). These unique microbial fingerprint profiles provide an effective means of distinguishing different pollution sources, offering a robust tool for microbial source tracking of nitrogen pollution in river systems.
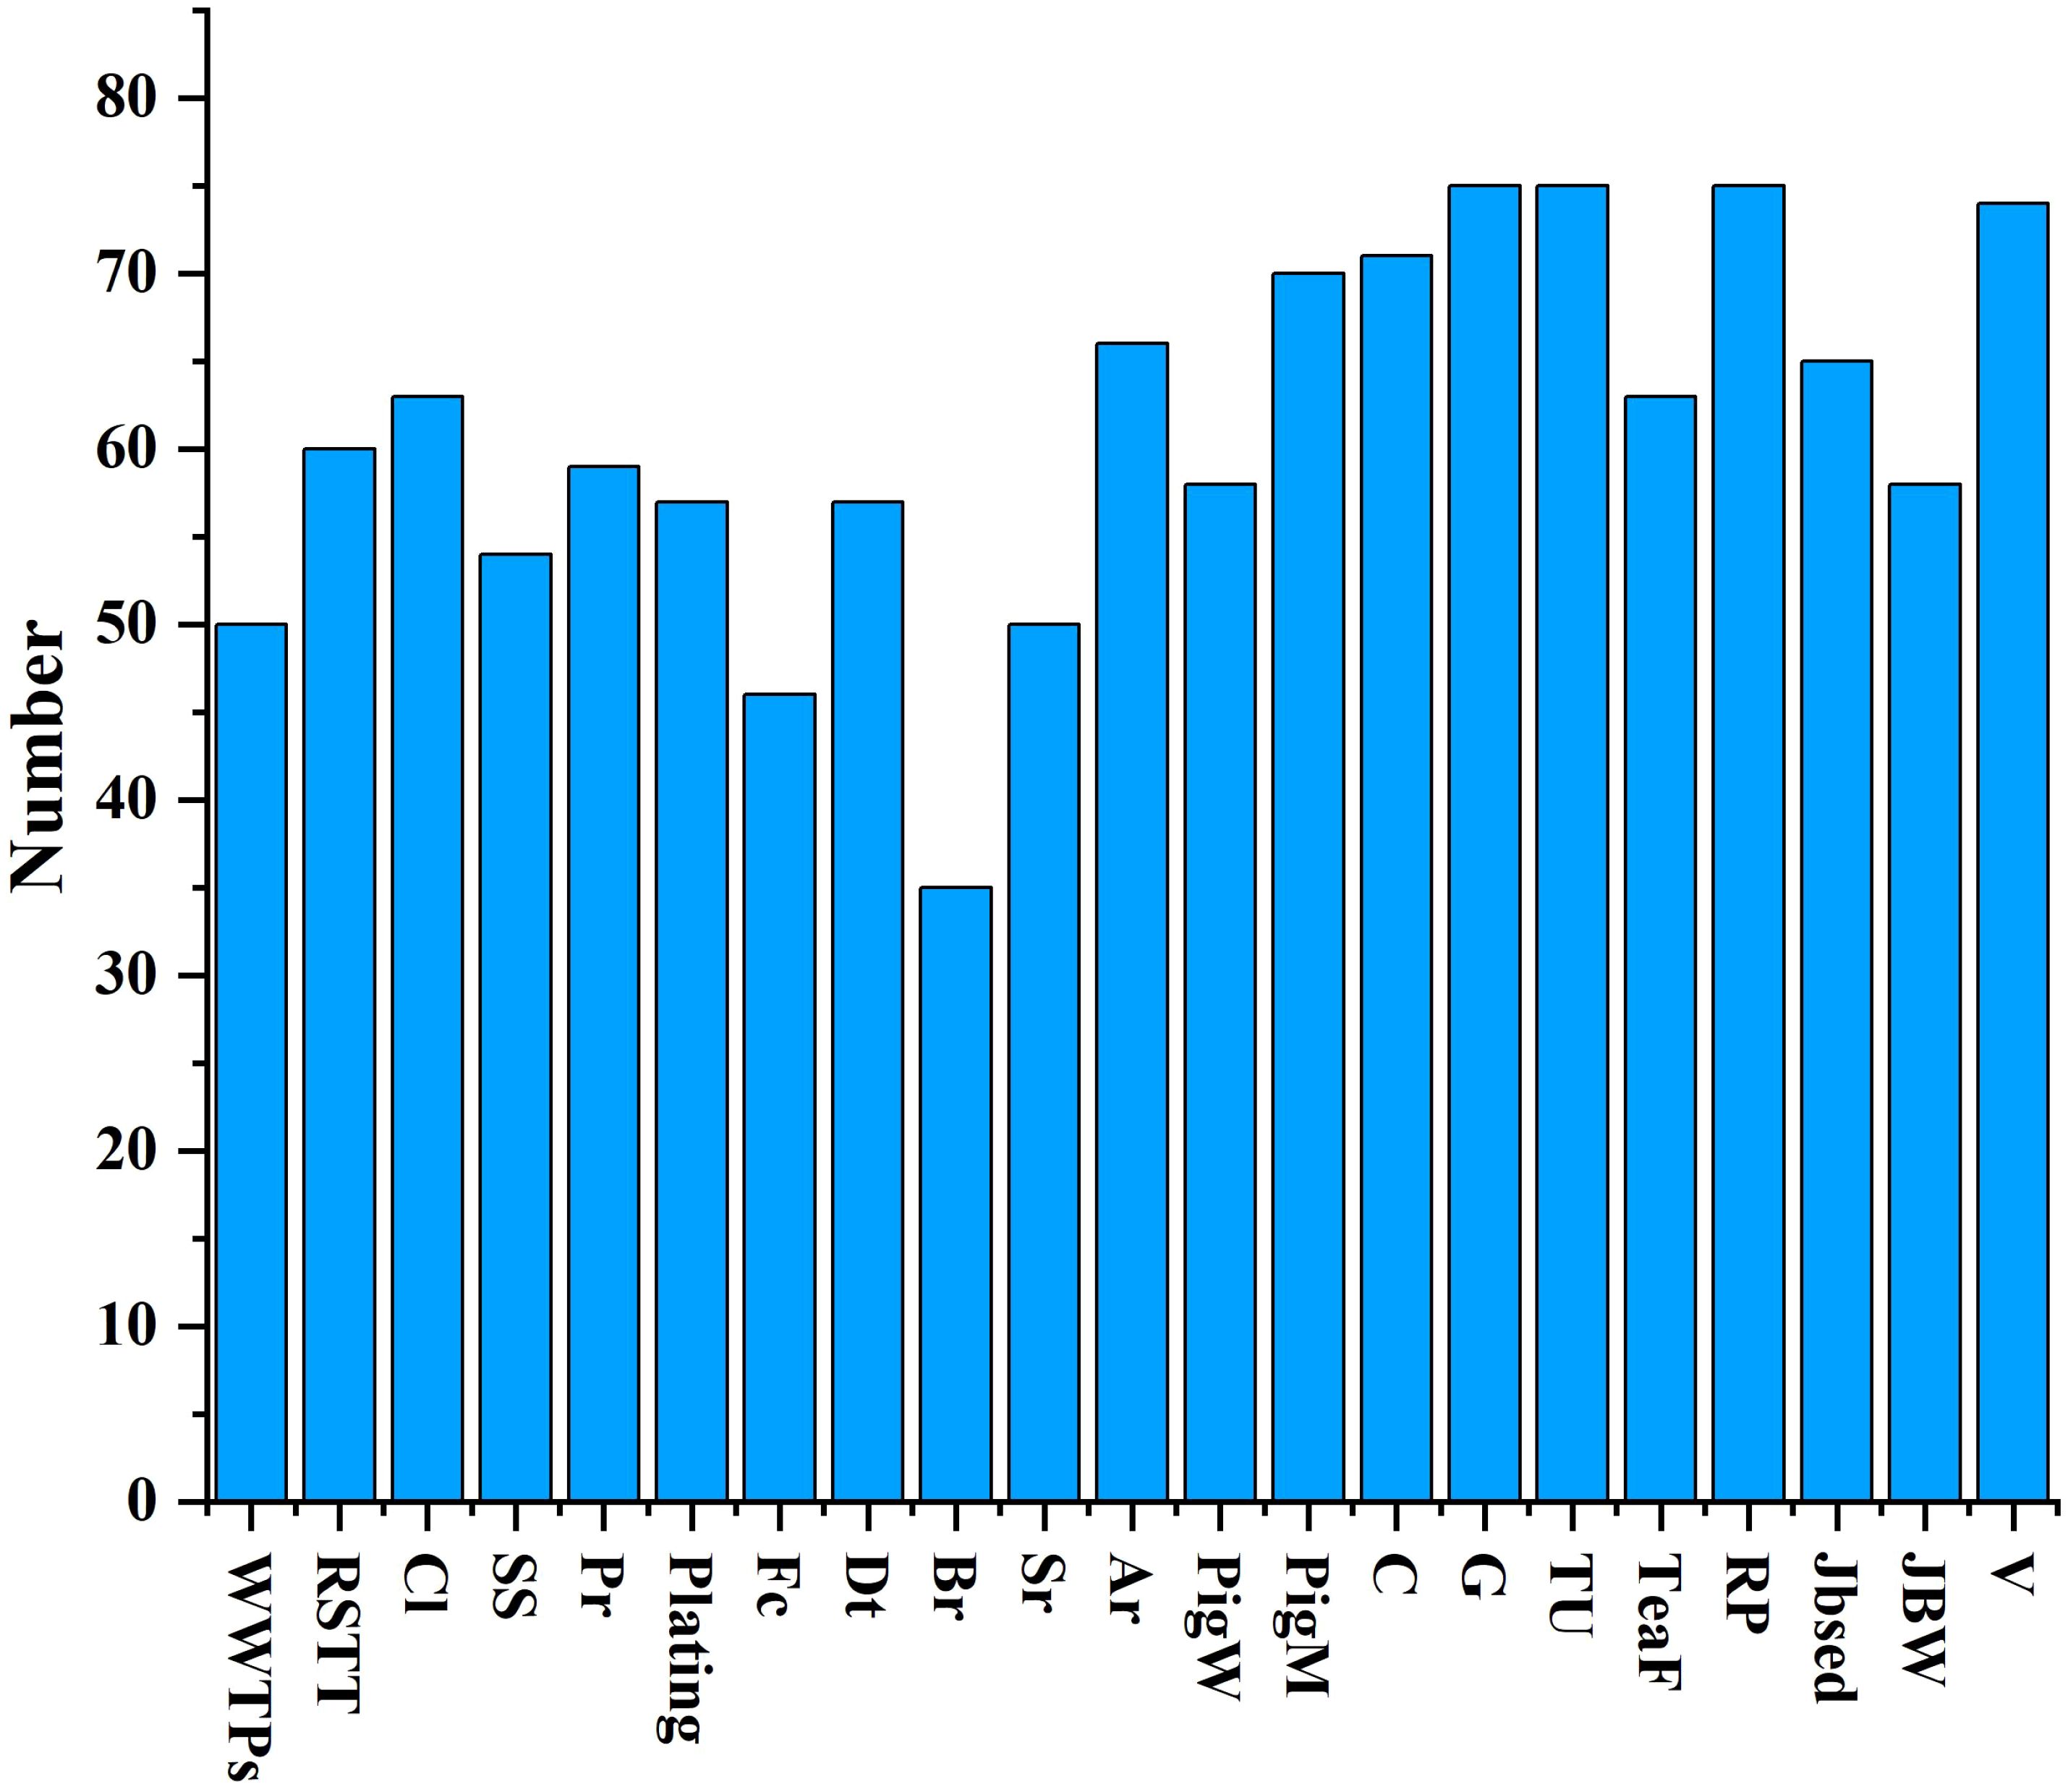
Figure 9. Genus abundance in microbial fingerprint profiles of pollution sources.
The machine learning classification program SourceTracker v1.0.1 was used to identify potential major input sources of bacterial communities associated with Nitrogen sources present in surface water. During the dry season, the proportion of nitrogen-contaminated surface water from Sewage sources is 47.3% (Figures 10a, b), from Manure sources 16.6%, from Agricultural sources is 8.5% and from natural Soil sources is 15.3%. However, there is a marked variation in the wet season, with a significantly higher proportion of contributions from agricultural (20.5%) and natural soil sources (27.8%). The percentage of Sewage sources is 22.6%, despite relatively high water use in the summer months. SourceTracker might underestimate the impact of unidentified sources, particularly for receivers with additional unknown sources. Environmental features that were not considered in the source tracing process, such as the effects of amoebae in sediments and the hydraulic relationship between streams and sediments, are designated as “unknown” (Chen et al., 2023). Previous studies found that SourceTracker could effectively predict manure sources in lakes when considering native taxa, and a higher level of false positive predictions occurred when not considering native taxa (Brown et al., 2019). Moreover, SourceTracker shows good pollution identification and distribution capabilities for different types of industrial pollution sources (Peng et al., 2024). Some studies have shown that agricultural areas can also experience fecal contamination, making it a major source of nitrogen pollution (Zimmer-Faust et al., 2025). In addition, long-term fertilizer application will change soil properties, and transport and leaching during rainfall will contribute agricultural sources that can be well calculated by the sourcetracker model (Zhang et al., 2024). Thus, microbial traceability is able to quantify the contribution of pollution sources well in watersheds with multiple complex nitrogen pollution sources. The inability of nitrogen and oxygen isotopes to differentiate between sewage and fecal sources was solved to improve the efficiency and accuracy of traceability.
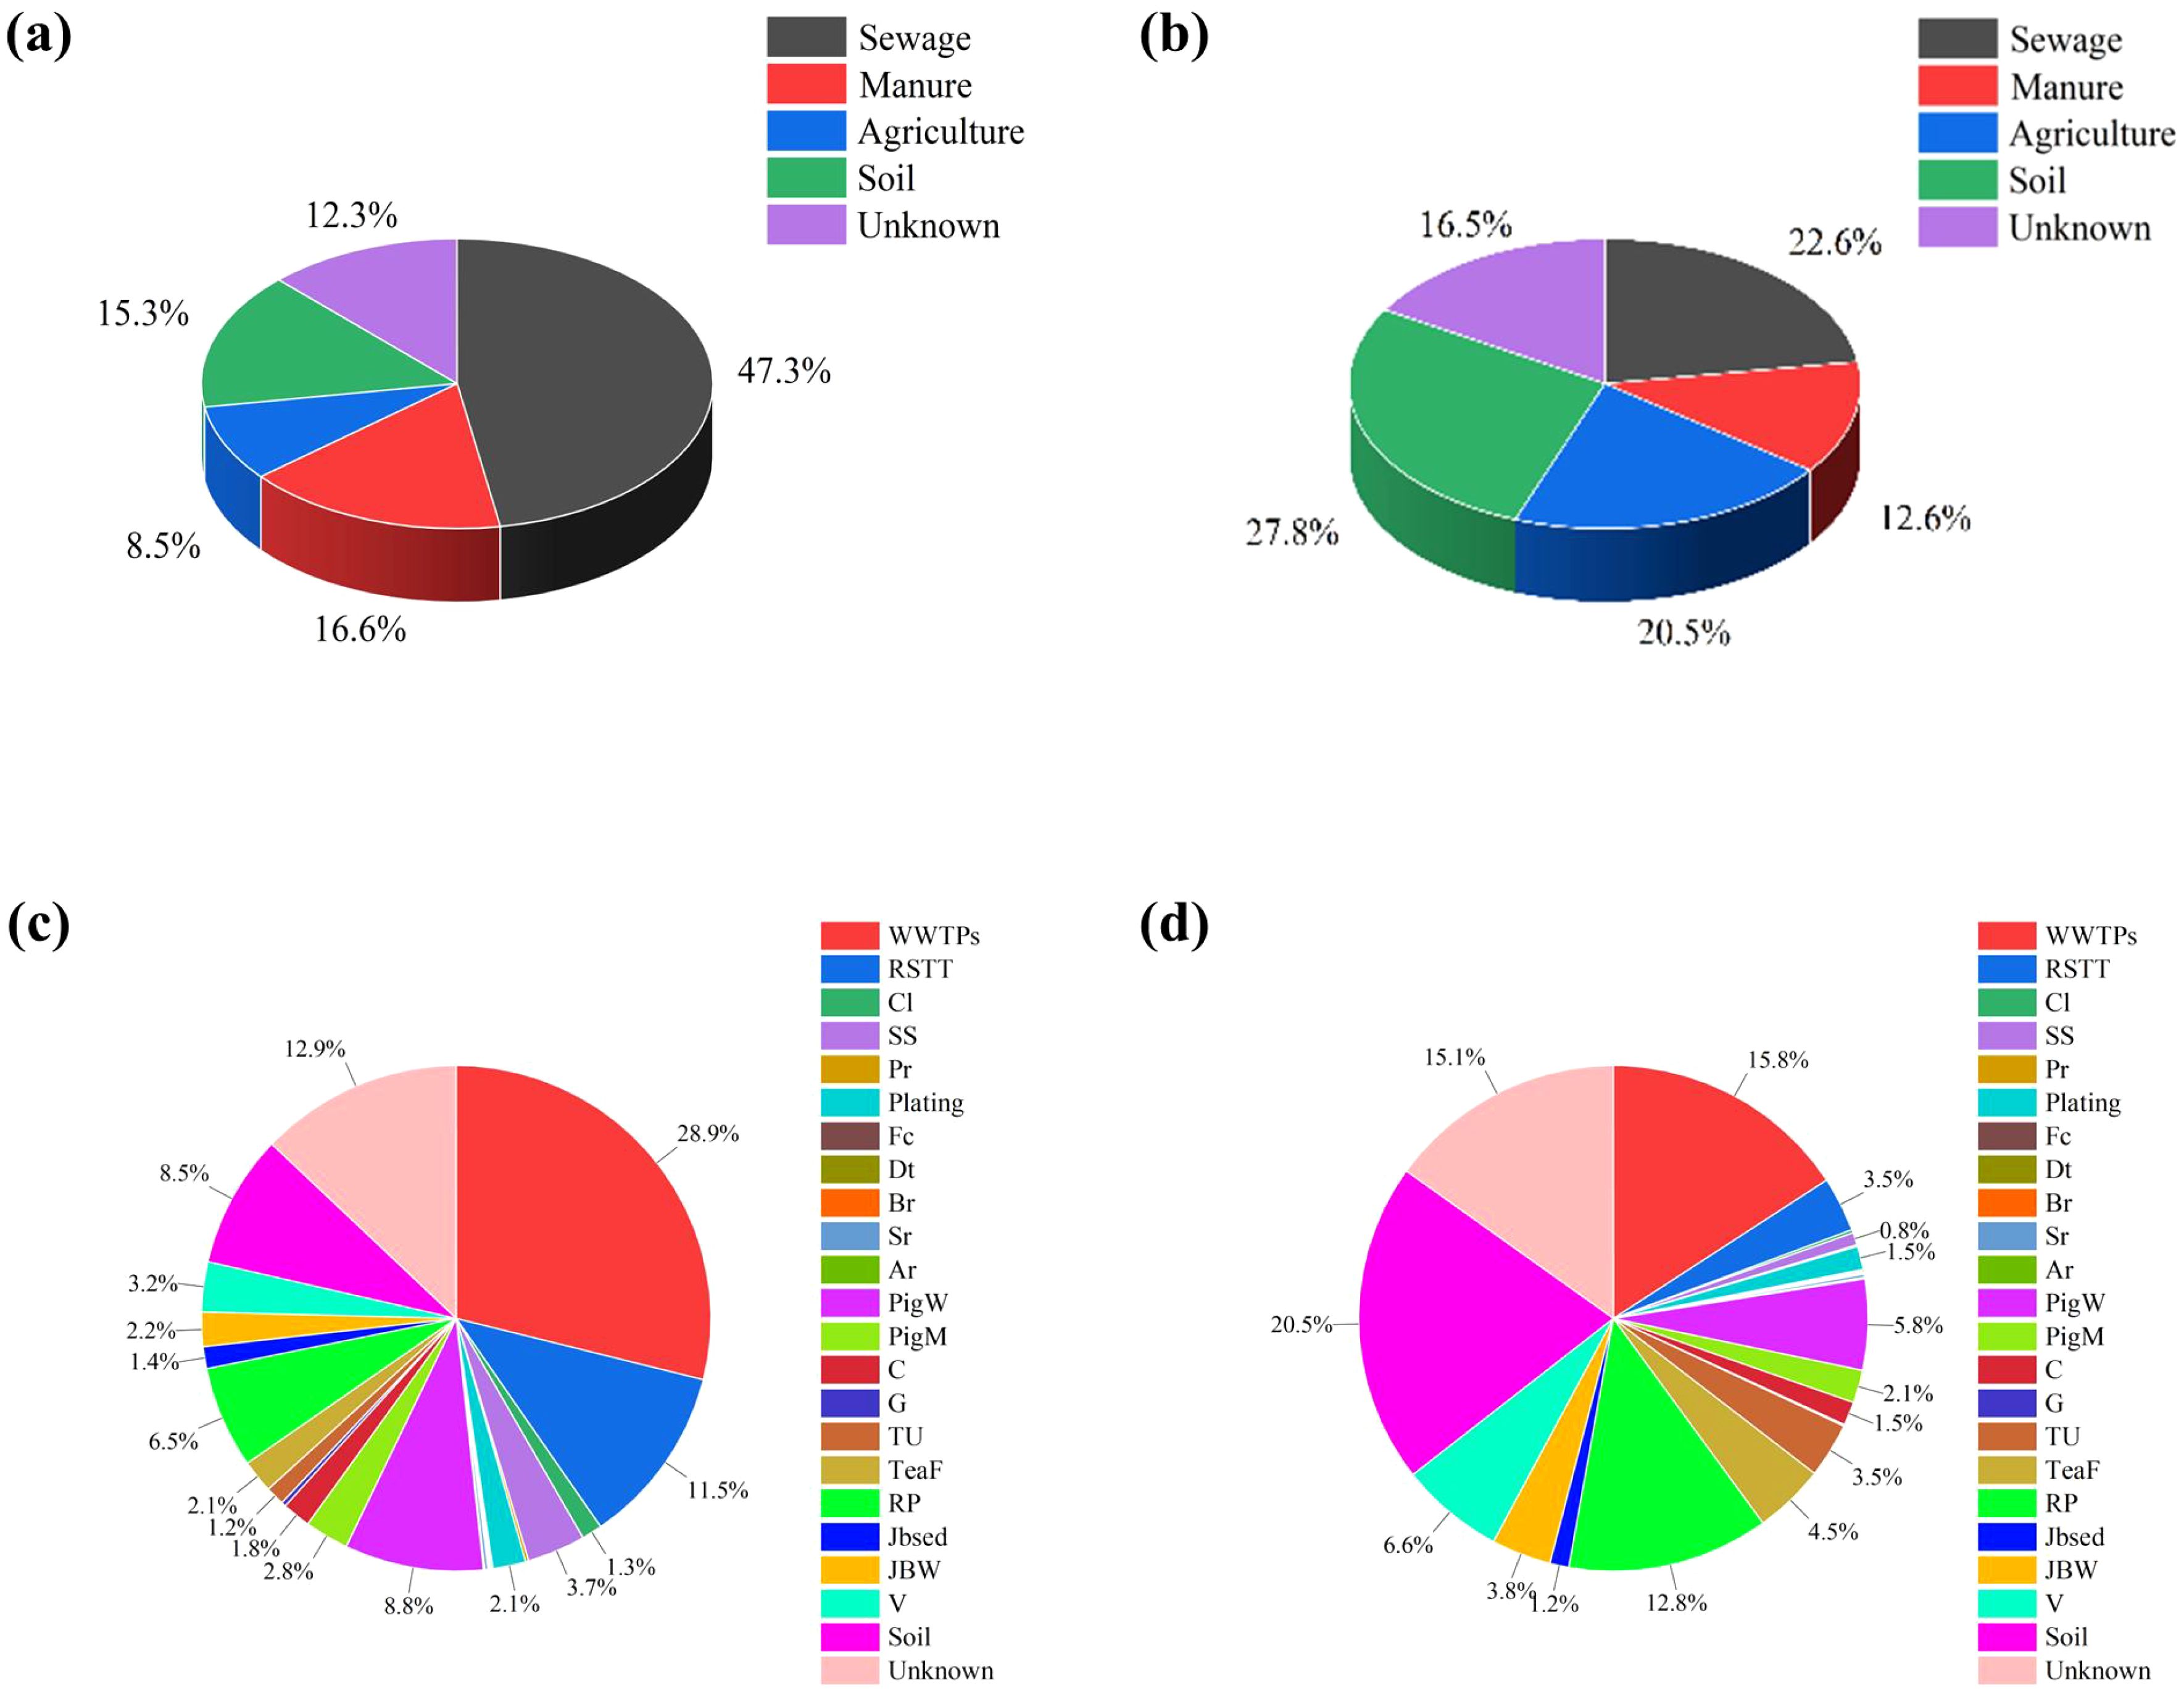
Figure 10. Sourcetracker calculates the contribution rate of each pollution source. (a, c) dry season and (b, d) wet season.
Overall, microbial tracing models have better potential for identifying nitrogen pollution sources, and can identify more pollution sources compared to nitrogen oxygen isotope tracing methods. The microbiological tracing results indicate that industrial wastewater from aquaculture, machinery, chemical, textile and other industries is the main source of surface water pollution in the region. These results indicate that the export coefficient model (ECM) can serve as a screening process before microbial traceability, eliminating irrelevant sources and improving traceability efficiency. In addition, Huang et al. (2024) proposed a novel microbial source tracking tool, SourceID-NMF, which uses algorithms to identify microbial sources contributing to target samples. In future research, it can be compared with the SourceTracker model to optimize a more precise source-tracking method.
The Export Coefficient Model (ECM) provides qualitative information on potential nitrogen pollution sources; however, it does not account for the processes by which nitrogen pollutants enter river systems and is therefore unable to achieve reverse tracking of nitrogen pollution within water bodies. The microbial source tracking (MST) model, based on the biological characteristics of pollution sources, can complement and validate ECM results, thereby enhancing the accuracy of pollution source identification. In this study, ECM was employed to estimate the total nitrogen point sources within the Oujiang River Basin, including industrial wastewater, urban domestic sewage, and effluents from large-scale livestock and poultry farms, identifying a total of 593 potential pollution sources. Additionally, the total non-point source nitrogen contribution was estimated at 2699.555 tons per year. Through hydrochemical analysis combined with co-occurrence network modeling, microbial fingerprint profiles of 22 nitrogen pollution sources were constructed. Non-metric multidimensional scaling (NMDS) analysis demonstrated significant differences in microbial community structures among different pollution sources. Furthermore, during both the dry and wet seasons, water samples were collected from 26 sites, spanning from upstream to the estuary, as well as key tributaries within the basin. The SourceTracker Bayesian model was utilized to quantify the contribution of specific pollution sources and to compare pollution source variations across hydrological periods. This traceability framework provides a more efficient and accurate method for precisely identifying surface water nitrogen pollution sources and managing water quality under the influence of multiple pollution inputs. It can be applied to monitor anthropogenic nitrogen inputs and assess the effectiveness of management strategies.
The original contributions presented in the study are included in the article/Supplementary Material, further inquiries can be directed to the corresponding author/s.
QS: Conceptualization, Data curation, Formal Analysis, Writing – original draft, Writing – review & editing. JL: Conceptualization, Investigation, Methodology, Writing – original draft, Writing – review & editing. CZ: Investigation, Resources, Writing – review & editing. KL: Funding acquisition, Writing – review & editing. WJ: Funding acquisition, Investigation, Project administration, Writing – review & editing.
The author(s) declare that financial support was received for the research and/or publication of this article. Lishui Ecological and Environmental Monitoring Center of Zhejiang Province. Lishui City Key R&D Program Projects.(2023zdyf03).
The authors declare that the research was conducted in the absence of any commercial or financial relationships that could be construed as a potential conflict of interest.
The author(s) declare that no Generative AI was used in the creation of this manuscript.
All claims expressed in this article are solely those of the authors and do not necessarily represent those of their affiliated organizations, or those of the publisher, the editors and the reviewers. Any product that may be evaluated in this article, or claim that may be made by its manufacturer, is not guaranteed or endorsed by the publisher.
The Supplementary Material for this article can be found online at: https://www.frontiersin.org/articles/10.3389/fmars.2025.1527098/full#supplementary-material
Basu N. B., Van Meter K. J., Byrnes D. K., Van Cappellen P., Brouwer R., Jacobsen B. H., et al. (2022). Managing nitrogen legacies to accelerate water quality improvement. Nat. Geosci. 15, 97–105. doi: 10.1038/s41561-021-00889-9
Bodirsky B. L., Popp A., Lotze-Campen H., Dietrich J. P., Rolinski S., Weindl I., et al. (2014). Reactive nitrogen requirements to feed the world in 2050 and potential to mitigate nitrogen pollution. Nat. Commun. 5. doi: 10.1038/ncomms4858
Brown C. M., Mathai P. P., Loesekann T., Staley C., Sadowsky M. J. (2019). Influence of library composition on source tracker predictions for community-based microbial source tracking. Environ. Sci. Technol. 53, 60–68. doi: 10.1021/acs.est.8b04707
Carson L. R., Goodman C., van Duin B., Neumann N. F. (2024). Application of a microbial and pathogen source tracking toolbox to identify infrastructure problems in stormwater drainage networks: a case study. Microbiol. Spectr. 12. doi: 10.1128/spectrum.00337-24
Chen J. P., Chen H. Y., Liu C., Huan H., Teng Y. G. (2023). Evaluation of FEAST for metagenomics-based source tracking of antibiotic resistance genes. J. Hazardous Materials 442. doi: 10.1016/j.jhazmat.2022.130116
Downing J. A., Polasky S., Olmstead S. M., Newbold S. C. (2021). Protecting local water quality has global benefits. Nat. Commun. 12. doi: 10.1038/s41467-021-22836-3
Dumortier P., Aubinet M., Lebeau F., Naiken A., Heinesch B. (2019). Point source emission estimation using eddy covariance: Validation using an artificial source experiment. Agric. For. Meteorology 266, 148–156. doi: 10.1016/j.agrformet.2018.12.012
Fan H. X., Huang Z. L., Feng C. L., Wu Z. J., Tian Y. X., Ma F. F., et al. (2024). Functional keystone taxa promote N and P removal of the constructed wetland to mitigate agricultural nonpoint source pollution. Sci. Total Environ. 912. doi: 1016/j.scitotenv.2023.169155
Gu B. J., Zhang X. M., Lam S. K., Yu Y. L., van Grinsven H. J. M., Zhang S. H., et al. (2023). Cost-effective mitigation of nitrogen pollution from global croplands. Nature 613. doi: 10.1038/s41586-022-05481-8
Gu J. F., Zhang W. L., Li Y., Niu L. H., Wang L. F., Zhang H. J. (2020). Source identification of phosphorus in the river-lake interconnected system using microbial community fingerprints. Environ. Res. 186. doi: 10.1016/j.envres.2020.109498
Henry R., Schang C., Coutts S., Kolotelo P., Prosser T., Crosbie N., et al. (2016). Into the deep: Evaluation of SourceTracker for assessment of faecal contamination of coastal waters. Water Res. 93, 242–253. doi: 10.1016/j.watres.2016.02.029
Hildebrand F., Tadeo R., Voigt A. Y., Bork P., Raes J. (2014). LotuS: an efficient and user-friendly OTU processing pipeline. Microbiome. 2, 30. doi: 10.1186/2049-2618-2-30
Huan J., Yuan J. L., Zhang H., Xu X. E., Shi B., Zheng Y. C., et al. (2024). Identification of agricultural surface source pollution in plain river network areas based on 3D-EEMs and convolutional neural networks. Water Sci. Technol. 89, 1961–1980. doi: 10.2166/wst.2024.122
Huang Z. Y., Cai D. H., Sun Y. N. (2024). owards more accurate microbial source tracking via non-negative matrix factorization (NMF). Bioinformatics 40, i68–i78. doi: 10.1093/bioinformatics/btae227
Johnes P. J. (1996). Evaluation and management of the impact of land use change on the nitrogen and phosphorus load delivered to surface waters: The export coefficient modelling approach. J. Hydrology 183, 323–349. doi: 10.1016/0022-1694(95)02951-6
Kang P., Xu S., Yu S. (2016). Analysis of influence of underground reservoir on nitrogen distribution through tracing of isotope source. Water Resour. Prot. 32, 79.
Kelly L. T., Sissons J., Thompson L., Pearman J. K. (2024). Faecal source apportionment using molecular methods: A proof of concept using the FEAST algorithm. Water Res. 266. doi: 10.1016/j.watres.2024.122365
Li J. N., Sun Q. H., Lei K., Cui L., Lv X. B. (2023). Using dual stable isotopes method for nitrate sources identification in Cao-E River Basin, Eastern China. Front. Environ. Sci. 11. doi: 10.3389/fenvs.2023.1200481
Li L. G., Yin X. L., Zhang T. (2018). Tracking antibiotic resistance gene pollution from different sources using machine-learning classification. Microbiome 6. doi: 10.1186/s40168-018-0480-x
Liu J., Shen Z., Yan T., Yang Y. (2018). Source identification and impact of landscape pattern on riverine nitrogen pollution in a typical urbanized watershed, Beijing, China. Sci. Total Environ. 628-629, 1296–1307. doi: 10.1016/j.scitotenv.2018.02.161
Liu X. J., Zhang Y., Xiao T. Q., Li P., Zhang L., Liu Y. Q., et al. (2023). Runoff velocity controls soil nitrogen leaching in subtropical restored forest in southern China. For. Ecol. Manage. 548. doi: 10.1016/j.foreco.2023.121412
Mladenov N., Sanfilippo S., Panduro L., Pascua C., Arteaga A., Pietruschka B. (2024). Tracking performance and disturbance in decentralized wastewater treatment systems with fluorescence spectroscopy. Environ. Science-Water Res. Technol. 10, 1506–1516. doi: 10.1039/d3ew00671a
Ooi Q. E., Nguyen C. T. T., Laloo A. E., Koh Y. Z., Swarup S. (2024). Soil-sediment connectivity through Bayesian source tracking in an urban naturalised waterway via microbial and isotopic markers. Sci. Total Environ. 949. doi: 10.1016/j.scitotenv.2024.175152
Peng Y. J., Liu L. L., Wang X., Teng G. L., Fu A. Q., Wang Z. P. (2024). Source apportionment based on EEM-PARAFAC combined with microbial tracing model and its implication in complex pollution area, Wujin District, China. Environ. pollut. 346. doi: 10.1016/j.envpol.2024.123596
Qi Z., Zhao X., Sang J., He Z., Fu D., Yue Z., et al. (2023). Tracking fecal contamination in the Chaohu Lake basin based on 16S rDNA sequencing. J. Agro-Environment Sci. 42, 1128–1138.
Shu L. L., Chen W. L., Liu Y. L., Shang X., Yang Y., Dahlgren R. A., et al. (2024). Riverine nitrate source identification combining δ15N/δ18O-NO3-with Δ17O-NO3- and a nitrification15N-enrichment factor in a drinking water source region. Sci. Total Environ. 918. doi: 10.1016/j.scitotenv.2024.170617
Sun Q. H., Li J. N., Zhou C. H., Jiang W. J., Lei K. (2024). The influence of river basin nitrogen pollution sources and their transport on microbial community structure. Front. Mar. Sci. 11. doi: 10.3389/fmars.2024.1459186
Wang G., Gao H., Long B., Wu J. (2024). Research progress on nitrate isotope coupled multi-tracer tracing groundwater nitrate pollution. Chin. J. Appl. Ecology. 4, 35.
Wang Y., Bian J. M., Zhao Y. S., Tang J., Jia Z. (2018). Assessment of future climate change impacts on nonpoint source pollution in snowmelt period for a cold area using SWAT. Sci. Rep. 8. doi: 10.1038/s41598-018-20818-y
Yang M., Yang Z. M. (2024). Pollutant transport model with large time-scale and estimation of land-use export coefficients at a watershed level. Water Environ. Res. 96. doi: 10.1002/wer.11031
Yue F. J., Li S. L., Hu J. (2015). “The contribution of nitrate sources in Liao Rivers, China, based on isotopic fractionation and Bayesian mixing model,” in 11th International Symposium on Applied Isotope Geochemistry (AIG), vol. 13. (French Geol Survey, Orleans, France), 16–20.
Zhang Y., Zhang Y. T., Xie J., Yuan C. L., Zhu D., Shi X. J. (2024). Vertical migration and leaching behavior of antibiotic resistance genes in soil during rainfall: Impact by long-term fertilization. Water Res. 267. doi: 10.1016/j.watres.2024.122508
Zhao Y. Y., Zheng B. H., Jia H. F., Chen Z. X. (2019). Determination sources of nitrates into the Three Gorges Reservoir using nitrogen and oxygen isotopes. Sci. Total Environ. 687, 128–136. doi: 10.1016/j.scitotenv.2019.06.073
Zhu Z., Ding J., Du R., Zhang Z., Guo J., Li X., et al. (2024). Systematic tracking of nitrogen sources in complex river catchments: Machine learning approach based on microbial metagenomics. Water Res. 253, 121255. doi: 10.1016/j.watres.2024.121255
Keywords: nitrogen pollution, export coefficient models, microbial source tracking, nitrogen source analysis, source tracker model
Citation: Sun Q-h, Li J-n, Zhou C-h, Lei K and Jiang W-j (2025) Source analysis of nitrogen pollution in basin by export coefficient modeling and microbial source tracking with mutual verification. Front. Mar. Sci. 12:1527098. doi: 10.3389/fmars.2025.1527098
Received: 13 November 2024; Accepted: 25 February 2025;
Published: 26 March 2025.
Edited by:
Ram Kumar, Central University of Bihar, IndiaReviewed by:
Hongxia Ming, National Marine Environmental Monitoring Center, ChinaCopyright © 2025 Sun, Li, Zhou, Lei and Jiang. This is an open-access article distributed under the terms of the Creative Commons Attribution License (CC BY). The use, distribution or reproduction in other forums is permitted, provided the original author(s) and the copyright owner(s) are credited and that the original publication in this journal is cited, in accordance with accepted academic practice. No use, distribution or reproduction is permitted which does not comply with these terms.
*Correspondence: Wei-jun Jiang, MTk5MDU3ODAzMDNAMTYzLmNvbQ==; Kun Lei, bGVpa3VuMTk3M2NyYWVzQDE2My5jb20=
†These authors have contributed equally to this work
Disclaimer: All claims expressed in this article are solely those of the authors and do not necessarily represent those of their affiliated organizations, or those of the publisher, the editors and the reviewers. Any product that may be evaluated in this article or claim that may be made by its manufacturer is not guaranteed or endorsed by the publisher.
Research integrity at Frontiers
Learn more about the work of our research integrity team to safeguard the quality of each article we publish.