 Xing Du
 Yongfu Sun3
 Wanqing Chi
94% of researchers rate our articles as excellent or good
Learn more about the work of our research integrity team to safeguard the quality of each article we publish.
Find out more
ORIGINAL RESEARCH article
Front. Mar. Sci. , 26 February 2025
Sec. Marine Conservation and Sustainability
Volume 12 - 2025 | https://doi.org/10.3389/fmars.2025.1518679
This article is part of the Research Topic Novel Approaches of Marine Geotechnical Engineering: Risk and Reliability of Marine Infrastructures View all 4 articles
With the increasing global exploration of marine resources, ensuring the stability of submarine pipelines under adverse conditions—such as strong ocean waves and seismic events—remains a significant challenge. This study focuses on buried pipelines in seabed sediments, which are particularly vulnerable to sediment liquefaction caused by dynamic loading, posing a serious threat to pipeline safety. This study proposes an approach that integrates finite element analysis with machine learning. The approach begins with finite element methods for comprehensive simulations, using the high-quality data generated to enable rapid and accurate prediction of liquefaction under wave-current interactions. The results demonstrate that submarine pipelines significantly affect the direction and extent of sediment liquefaction, with the sides of the pipelines being more prone to liquefaction compared to the tops and bottoms. The pipelines also have a stabilizing effect on surrounding seabed sediments. Moreover, the integrated model improves assessment speed without compromising accuracy, effectively addressing the need for rapid liquefaction analysis over large areas and multiple points. This study provides valuable theoretical and practical insights for marine engineering by confirming the stabilizing effect of pipelines on adjacent sediments.
Submarine pipelines are critical infrastructure for transporting essential resources such as crude oil and natural gas, linking terrestrial and marine environments. As offshore resource exploration expands, submarine pipelines face stability challenges posed by natural phenomena like extreme ocean waves and seismic activities (Seed and Rahman, 1978; Ye and Lu, 2022). Seabed sediment liquefaction remains a major threat to pipeline stability, with numerous historical cases of pipeline failures attributed to this issue. These events highlight the urgent need for precise and rapid assessment of the liquefaction behavior of submarine pipelines and surrounding sediments.
The stability of submarine pipelines is influenced by various factors including seabed scouring, ocean wave actions, seismic wave impacts, and human activities. Extensive research has been conducted to understand the process and mechanism of seabed scouring near submarine pipelines under the influence of ocean waves and currents (Cheng and Liu, 1986; Gao and Wu, 2006; Myrhaug et al., 2009; An et al., 2011; Kiziloz et al., 2013; Larsen et al., 2016). The mechanism involves the interaction of wave and current forces with the seabed, which generates pressure gradients and sediment transport, leading to localized erosion and the formation of scour pits around the pipeline. Regarding the dynamics of ocean wave-induced pipeline responses, research methods have included analytical solutions, numerical simulations, and laboratory wave flume tests. These studies primarily focused on wave and current-induced pore pressure, effective stress in seabed soil, seepage force (Cheng and Liu, 1986) and buoyancy of the pipeline (Magda, 1997). Beyond the impacts of seabed scouring, exploring the response of pore pressure and effective stress in the seabed foundation to ocean waves around marine pipelines has emerged as a significant research theme.
Initially, seabed soils were predominantly modeled as elastic bodies. Jeng and Cheng (Jeng and Cheng, 2000) developed an analytical solution to comprehend wave-induced pore pressure around pipelines buried in poro-elastic seabed soils. Subsequent studies by Wang et al. (2000) and Jeng (2001) delved into wave-induced pore pressure around pipelines buried in anisotropic or nonhomogeneous seabed. Moreover, the impact of nonlinear waves and soil-pipeline contact effects on pipeline dynamics were examined (Gao et al., 2003; Gao and Wu, 2006). Recent investigations by Zhou et al. (2013) focused on the dynamics of pipelines buried in single or multi-layer seabed.
Apart from poro-elastic seabed soils, loosely deposited seabed materials are also prevalent in marine environments. Under ocean wave loading, pore pressure within such soils can significantly increase, leading to soil liquefaction. Early research explored wave-induced liquefaction around pipelines buried in loosely deposited seabed soils using empirical-based soil models like those proposed by Seed (Seed and Rahman, 1978; Martin and Bolton Seed, 1983). Recently, based on the FSSI-CAS model (Ye and He, 2021; Ye and Lu, 2022), scholars have conducted a detailed study on the response of submarine pipelines to waves and earthquakes, explored the differences in the response of different pipeline types to wave action, and analyzed the wave dynamics process in detail. Through the above numerical study and model test validation, the demand for liquefaction problems around submarine pipelines under wave action is basically satisfied, and accurate research progress has been achieved.
Traditional numerical simulation methods, such as finite element analysis, have significantly contributed to accurately simulating wave-induced liquefaction problems and resolving related challenges (Jeng and Cheng, 2000; Ye et al., 2012, 2015), demonstrating high accuracy and a clear representation of physical mechanisms. However, these approaches often suffer from lengthy computation times and low efficiency, making them unsuitable for meeting the rapid response requirements of marine engineering safety protection. These limitations hinder rapid assessments for marine engineering safety, especially under extreme weather conditions or emergencies. Recent developments in artificial intelligence have demonstrated potential for rapid data prediction and nonlinear analysis across various geoscience domains, including geological hazards (Mousavi et al., 2020; Stanley et al., 2020; Zennaro et al., 2021), remote sensing (Pouyan et al., 2021; Casagli et al., 2023), and geophysical exploration (Du et al., 2023a, 2023b). Among these, geological hazards encompass various phenomena such as landslides, earthquakes, and floods, and sediment liquefaction induced by waves is also a common geological hazard. AI-based methods provide new opportunities for addressing these challenges, offering capabilities for nonlinear analysis and rapid data-driven prediction (Du et al., 2023b). Given machine learning models’ data-driven nature and their capability to accurately predict by learning data features through training and backpropagation, exploring rapid prediction of wave-induced liquefaction risk areas using AI models is feasible.
To address these challenges, this study proposes an innovative approach that integrates finite element analysis with machine learning techniques. By generating high-quality datasets through detailed finite element simulations of liquefaction risks and training machine learning models on these datasets, this research aims to achieve rapid and accurate predictions of the liquefaction behavior of submarine pipelines and surrounding sediments. This approach significantly reduces assessment time while maintaining high predictive accuracy, providing an efficient tool for liquefaction risk assessment in marine engineering. The findings not only support safety assessments and disaster prevention for submarine pipelines but also offer new perspectives and methodologies for research in the field of marine engineering.
In this research, we introduce a cutting-edge method that combines the strengths of finite element analysis (FEA) and machine learning (ML) to forecast the liquefaction behavior of submarine pipelines and the sediments swiftly and precisely around them, influenced by wave-current dynamics (Figure 1). The research methodology unfolds through a series of meticulously designed steps, outlined as follows: (1) Coupled Numerical Model Selection: We select an advanced finite element software (FSSI-CAS) that simulates the intricate interplay between the pipelines, seabed sediments, and hydrodynamic forces accurately; (2) Dataset Creation: We define a wide array of environmental conditions to compile an exhaustive dataset that mirrors the liquefaction responses across all conceivable hydrodynamic settings; (3) Machine Learning Model: The dataset is then used to train an ML model, employing algorithms adept at uncovering patterns that predict sediment liquefaction; (4) Performance Evaluation: We assess the ML model’s accuracy with metrics such as Mean Absolute Error (MAE) and Root Mean Squared Error (RMSE), confirming its reliability for real-world applications.
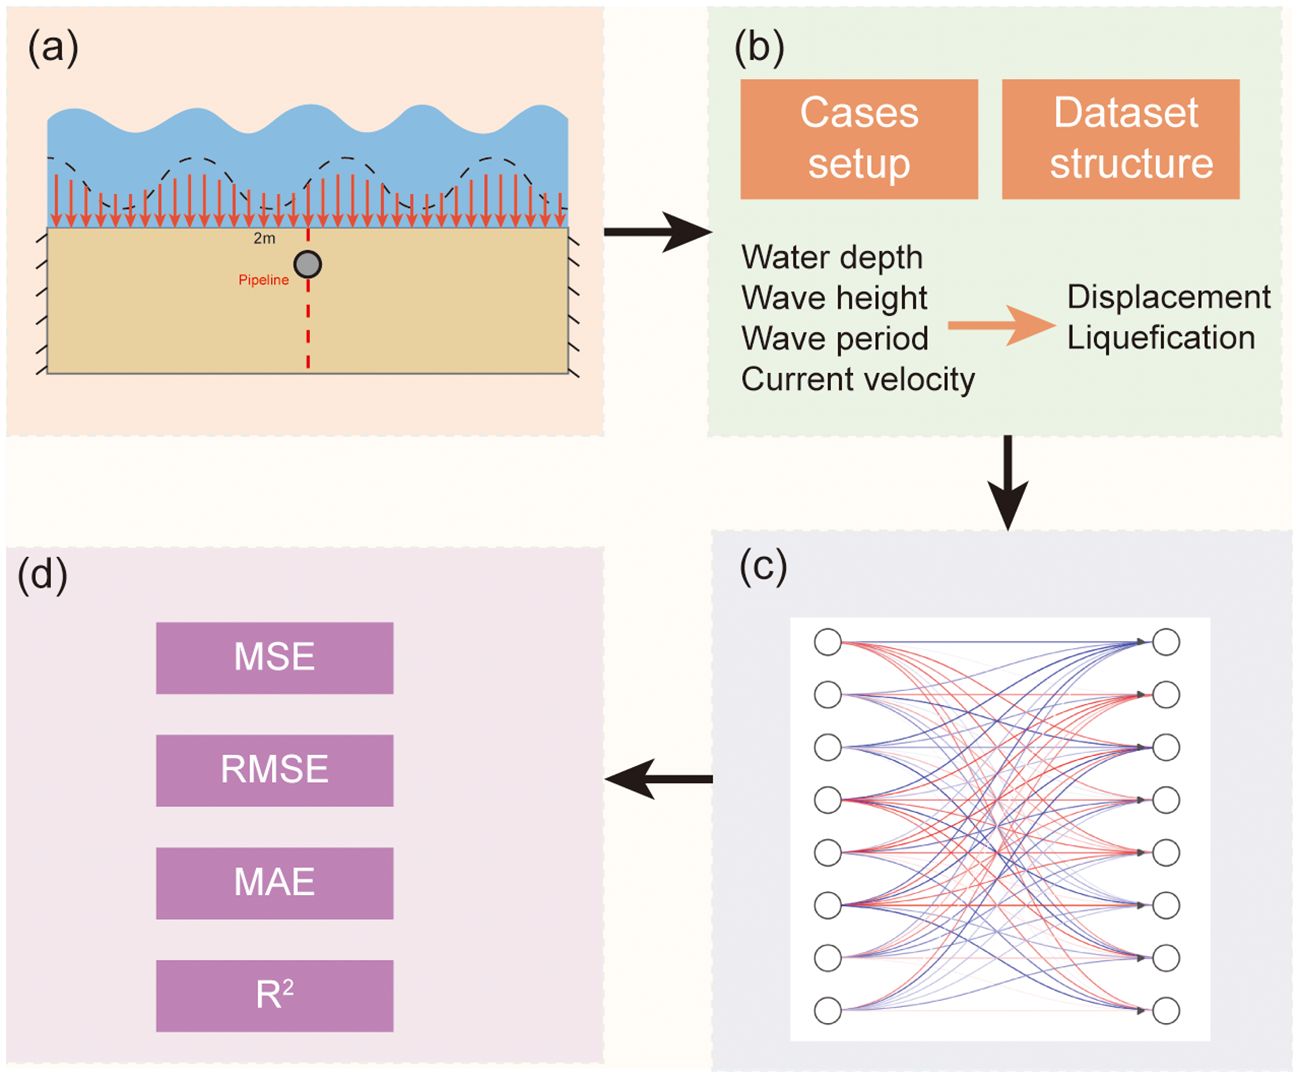
Figure 1. Overview of finite element-machine learning based liquefaction analysis process around wave-induced pipelines. (a) Coupled Numerical Model; (b) Dataset Creation; (c) Performance evaluation; (d) Machine learning Model.
In marine environments, the dynamic interaction among pipelines, seabed foundations, and overlying seawater constitutes a complex integrated system, significantly influenced by environmental forces such as oceanic and seismic waves. To decipher the intricate interactions among fluids, marine structures, and their seabed foundations, a sophisticated numerical model, FSSI-CAS, has been developed by Jeng et al. (2013) and Ye et al. (2013). These models specifically address the challenges associated with fluid-structure-seabed foundation interactions. Within FSSI-CAS, the VARANS equation (Hsu et al., 2002) is utilized to simulate wave motion and porous flow in the seabed, employing the finite difference method (FDM) for resolution. Concurrently, the dynamic behavior of offshore structures and their foundations is depicted through the dynamic Biot’s equation, also known as the ‘u-p’ approximation (Zienkiewicz et al., 1980), seamlessly integrated into a finite element method framework. A unique coupling algorithm was formulated to merge these governing equations, resulting in a cohesive numerical model adept at exploring fluid-structure-seabed interactions (FSSI-CAS). Ye et al. (2012, 2013) and Zienkiewicz et al. (1999) provide further elaboration on the methodologies for solving the VARANS equation and dynamic Biot’s equation. In this study, the generalized plastic soil model Pastor–Zienkiewicz Mark III (PZIII thereafter), which was initially established by Zienkiewicz and Mróz (1984) based on the generalized plasticity theory, is used to describe the complicated behaviors of the surrounding seabed soil of buried pipelines under the action of waves.
Although FSSI-CAS effectively addresses fluid-structure-seabed interactions, it has limitations regarding displacement continuity at the fluid-structure interface. Nonetheless, the model’s validity has been reinforced through comparisons with analytical solutions, wave flume tests, and centrifuge experiments (Ye et al., 2015; Ye and He, 2021; Ye and Lu, 2022). Its applicability has been demonstrated in assessing the dynamics of breakwaters and their seabed foundations under different ocean wave scenarios, including regular and breaking waves (He et al., 2018), tsunamis, and seismic waves (Zhang et al., 2019), illustrating the model’s relevance in wave-induced pipeline dynamics research.
Following the validation of its accuracy and robustness, it’s evident that the FSSI-CAS software is exceptionally suited for research into the interactions under wave-current-seabed sediment-pipeline conditions. This suitability underscores the model’s potential in facilitating a deeper understanding of the complex dynamics at play in marine environments, particularly in the study of interactions that involve wave and current forces, seabed sediments, and pipelines.
The FSSI-CAS model consists of two main components: hydrodynamic calculations and sediment response modeling. The hydrodynamic component simulates water movement and pressures acting on sediments and submarine structures, while the sediment response component models seabed behavior under these dynamic conditions using sophisticated constitutive models. Foundational studies by Ye et al. (2012, 2013, 2015, 2022) and Zhang et al. (2019), which provide a solid scientific foundation and enhance the model’s credibility in simulating fluid-structure-seabed interactions. In the ensuing computational model setup, we also focus on two components: sediment constitutive model parameters and hydrodynamic parameters.
As illustrated in Figure 2, our computational domain covers a seabed area of 50 m in length and 20 m in depth, with the water column above extending to 9 m. At the seabed’s center lies a submarine pipeline with a diameter of 560 mm, elevated 2 m from the seabed. The domain’s boundaries are defined to mimic real-world constraints: the left and right boundaries are fixed in the x direction, the top boundary simulates the hydrodynamic interface, and the bottom boundary is anchored in the x and z directions, encapsulating the seabed substrate. This seabed is porous, maintaining a constant effective stress of zero at its surface, independent of the water depth.
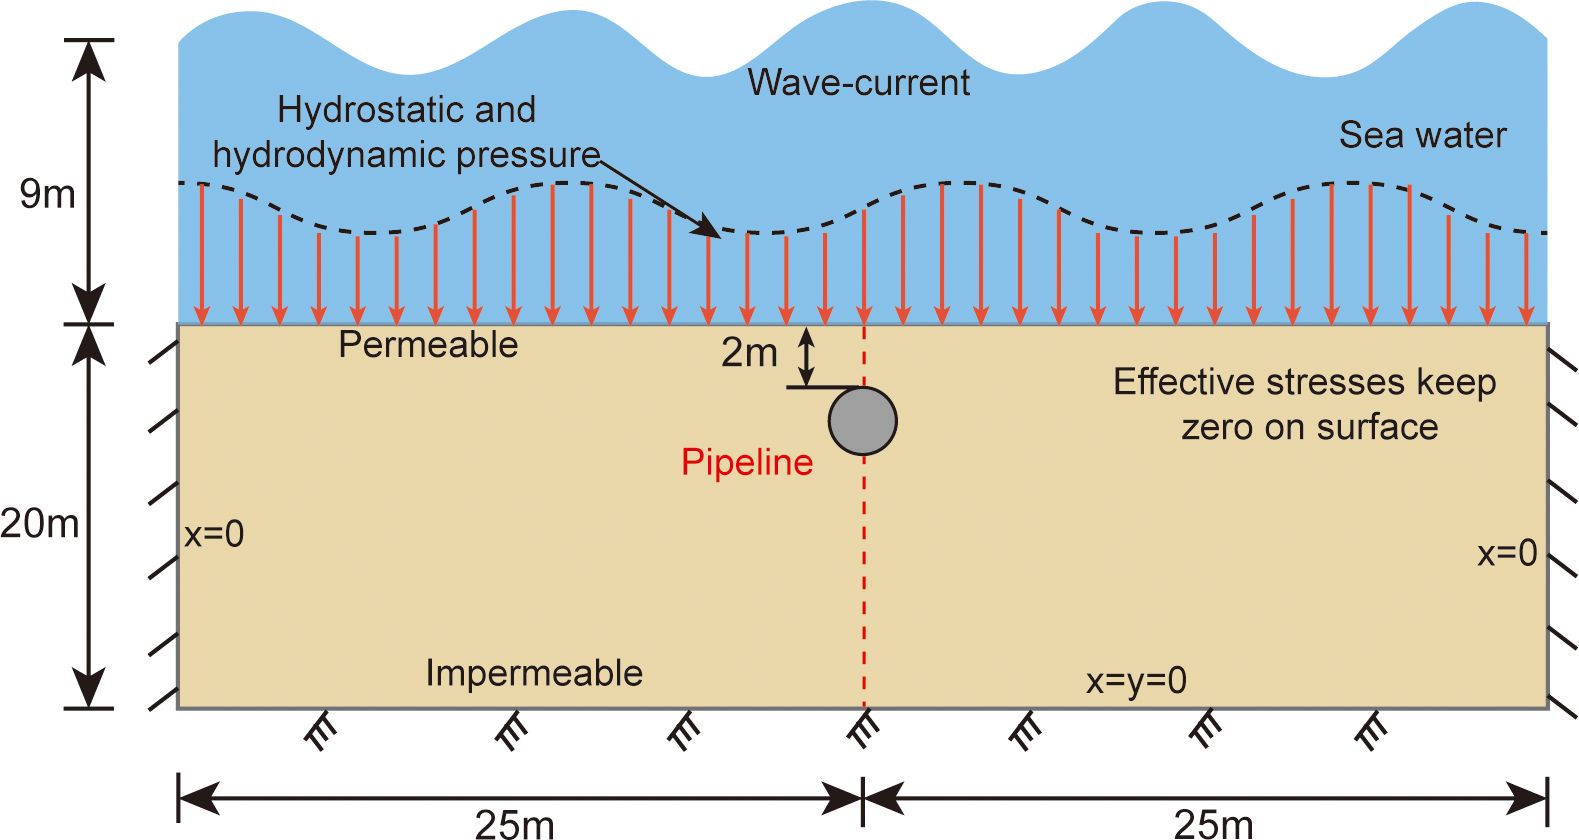
Figure 2. Schematic diagram of the pipeline-seabed-wave (current) system used in computation.
The model simulates operational conditions by subjecting crude oil inside the pipeline to a pressure of 10 MPa, and the pipeline itself is modeled as an impermeable rigid steel ring with a 2 cm wall thickness. The computational setup employs a mesh grid system with 21,464 four-node elements, optimized spatially around the pipeline. The mesh is finely detailed with a thickness of 2 cm near the pipeline to accurately capture interactions with surrounding sediments. In regions farther from the pipeline or below its burial depth, the mesh size increases to 0.3m × 0.2m, while above the pipeline, it is adjusted to 0.3m x 0.1m, balancing computational efficiency with the need for precision. This approach aligns with established practices in submarine pipeline simulations (Ye and He, 2021; Ye and Lu, 2022), ensuring reliable and accurate modeling outcomes as illustrated in Figure 3, which achieved good results, demonstrating the feasibility of our mesh division approach.
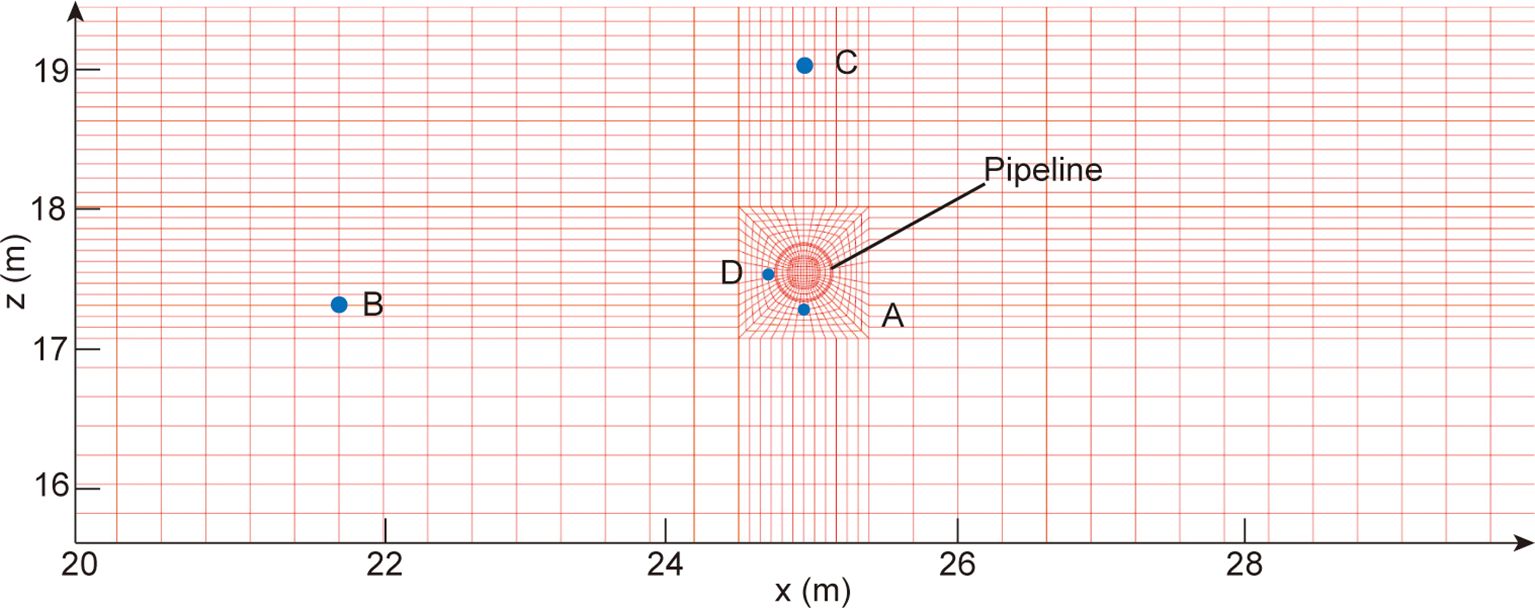
Figure 3. Generated mesh for the pipeline and seabed foundation in computation.
The sediment dynamics around the pipeline are examined at four strategic points, as shown in Figure 3: Point A, located directly beneath the pipeline, monitors liquefaction due to the dynamic load and weight of the pipeline. Point B, positioned away from the pipeline, assesses the general seabed response to wave-current interactions. Point C, directly above the pipeline, detects potential liquefaction from the top, while Point D, situated laterally near the pipeline, studies the spread of liquefaction around the pipeline. This configuration provides a comprehensive analysis of localized and overall sediment dynamics under varying conditions.
Table 1 lists the seabed soil parameters based on the PZIII model, derived from in-situ sampling and geomechanical testing conducted by the First Institute of Oceanography, Ministry of Natural Resources. The constitutive model parameters, established through statistical analysis across different water depths, reflect variations in aquatic environments. Setting these parameters in the PZIII model allows for accurate calculation of the dynamic response of seafloor sediments in the study area.
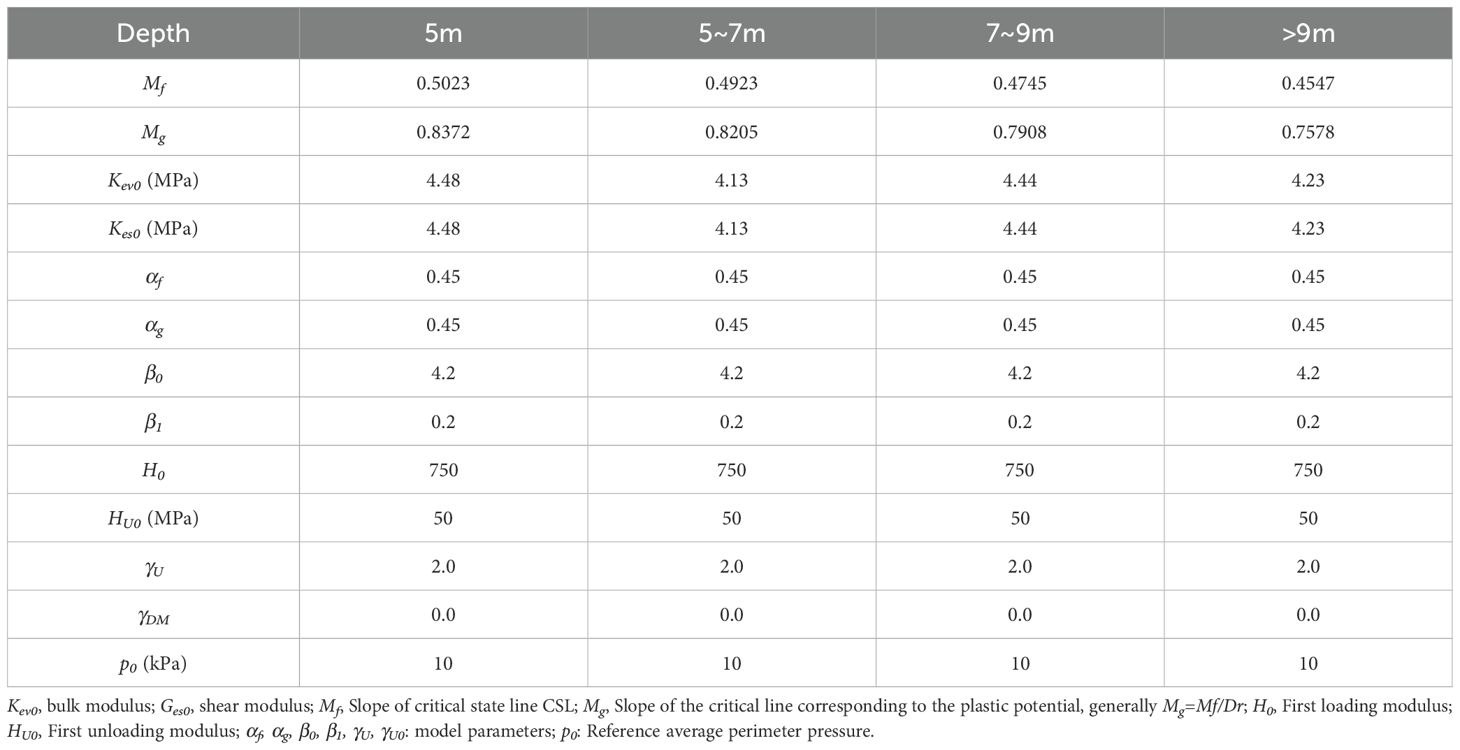
Table 1. Model parameters of seabed soil in the Yellow River Estuary for PZIII in analysis.
The effectiveness of machine learning (ML) relies heavily on the quality and diversity of the dataset, which allows for precise predictions within the known data range but may struggle with extrapolation beyond it. To create a comprehensive dataset for ML, covering all plausible scenarios of wave-induced liquefaction in the study area, careful planning of the data composition is essential.
Our focus is on the Yellow River Estuary in China, a region marked by its significant silt sedimentation on the seabed and strong hydrodynamic forces, rendering it prone to wave-induced liquefaction. The configurations for our case studies are detailed in Table 2. Liquefaction events are predominantly observed within a seabed depth range of 5 m to 15 m. To address this, our dataset includes calculation scenarios at 2-meter depth intervals within this specified range. The hydrodynamic data, including wave heights and current speeds, are derived from extensive long-term observational records, incorporating instances exceeding the centennial extreme values to ensure a robust dataset. For each depth, wave periods are meticulously aligned with empirical data through a fitting process. This strategy was designed to ensure that our dataset for machine learning encompasses a comprehensive and uniform distribution of wave heights, covering beyond the expected maximum and minimum conditions observed in the field. The uniform interval of 0.5 m within the usual range of wave heights allows for systematic coverage and computational efficiency, while the additional 0.2 m intervals at the extremes ensure that our model is robust against unusual and extreme conditions. The calculation of the hydrodynamic conditions in Table 2 allows us to perform an overlay calculation of the potential conditions in the study area, which also constitutes the hydrodynamic calculation part of the FSSI-CAS model. The setup and calculation of this working condition helps to subsequently build the machine learning model dataset.
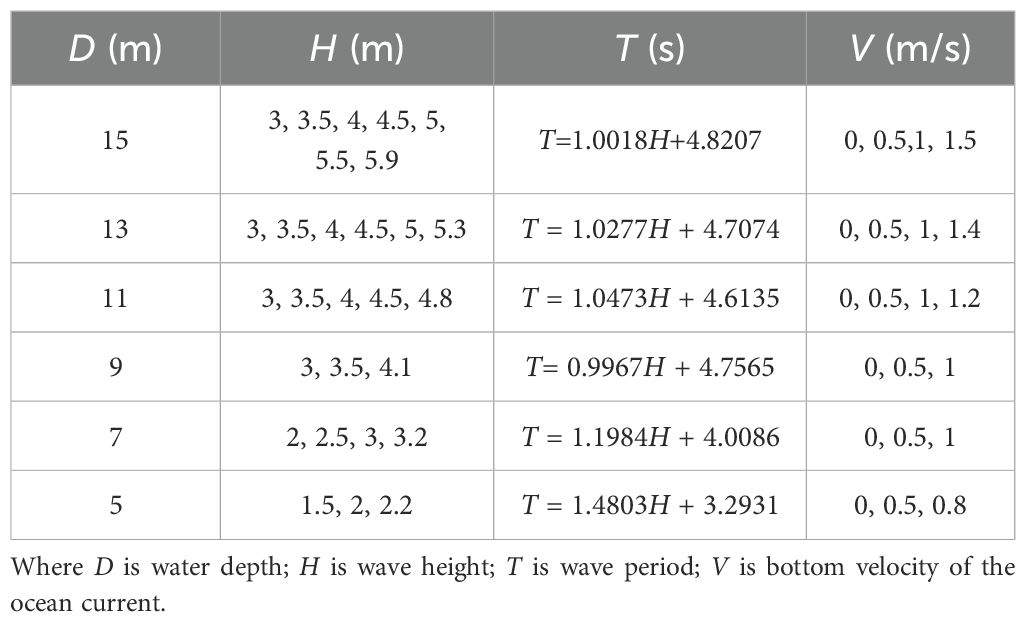
Table 2. Calculation cases of liquefaction of submarine pipeline and surrounding sediments under wave-current coupling (buried depth=2m, pipeline diameter=560mm).
Following the completion of finite element simulations, we obtain critical data such as displacement, stress, pore pressure, and liquefaction depth for both the pipeline and its adjacent sediments, articulated as time-dependent functions. The selection of input and output parameters for the machine learning dataset is a pivotal next step, guided by two principal considerations: (1) Physical Correlation: A discernible physical relationship must exist between the chosen input and output parameters, ensuring the relevance and predictability of the machine learning model; (2) Marine Engineering Requirements: The output parameters should directly relate to marine engineering needs, specifically addressing the consequences of wave-induced liquefaction on submarine pipelines.
As seen in Table 3, the input parameters consist of water depth (D), wave height (H), wave period (T), bottom flow velocity (V), bulk modulus (Kev0), shear modulus (Ges0), slope of the critical state line CSL (Mf), and slope of the critical line corresponding to plastic potential (Mg). On the other hand, the output parameters encompass x-direction displacement beneath the pipeline (dis_x_b), z-direction displacement beneath the pipeline (dis_z_b), liquefaction potential beneath the pipeline (Lp_b), seabed liquefaction depth (Ld), liquefaction depth above the pipeline (Ld_a), x-direction displacement on the pipeline’s side (dis_x_s), z-direction displacement on the pipeline’s side (dis_z_s), and liquefaction potential on the pipeline’s side (Lp_s). The output dataset primarily focuses on the displacement and liquefaction conditions near the pipeline’s bottom and at a distance from it. This approach allows us to capture both the response of the area around the pipeline to wave-induced effects and the impact of wave action on the seabed unaffected by the pipeline.
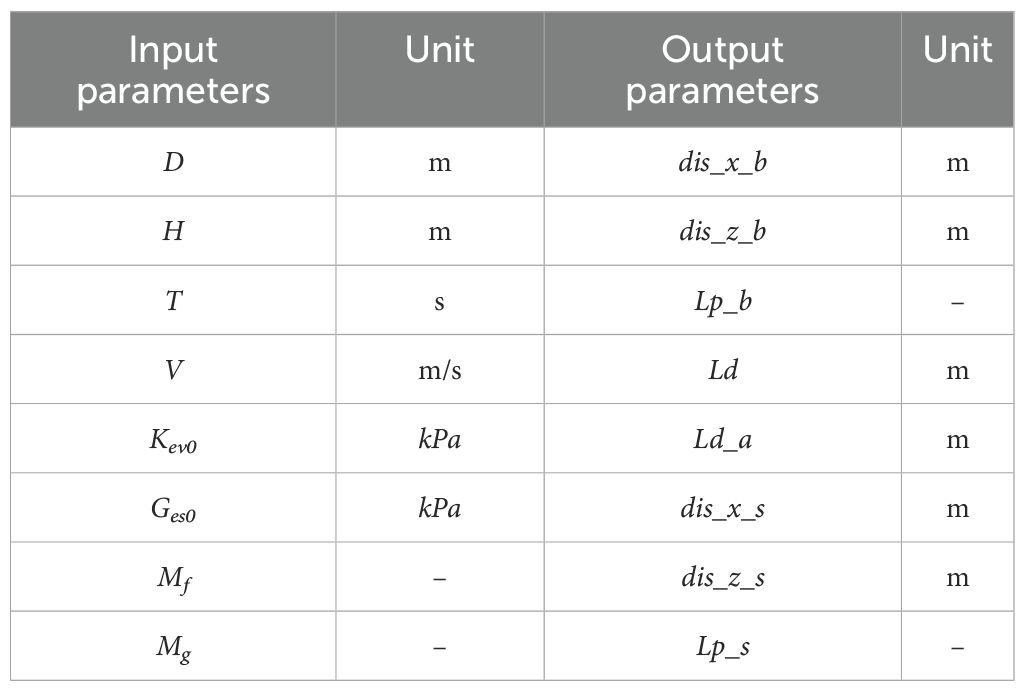
Table 3. Calculation cases of liquefaction of submarine pipeline and surrounding sediments under wave-current coupling.
Regarding liquefaction potential, earlier studies (Ye et al., 2015; Ye and Lu, 2022) introduced an effective stress-based equation to evaluate residual liquefaction in loose seabed soils. A parameter, residual liquefaction potential (Lp), is defined to describe liquefaction under cyclic loading (where negative values indicate compression):
where is the amount of loss of vertical effective stress due to waves, is the initial vertical effective stress, and C is the cohesive force in consolidated undrained conditions, is a material coefficient.
Research indicates that Lp does not need to reach exactly 1 for liquefaction to occur, and liquefaction begins when it approaches 1. Considering the results of previous studies (Ye, 2012; Ye et al., 2012, 2015) and the liquefaction characteristics of the present study area, it can be concluded that liquefaction occurs when Lp is greater than 0.86. This threshold facilitates accurate predictions of both displacement and liquefaction tendencies of a pipeline buried at a depth of 2 m, under the influence of wave-current interactions. Liquefaction events are quantitatively distinguished as ‘1’ (for liquefaction) and ‘0’ (for non-liquefaction), offering a clear binary representation for model training purposes.
Decision trees, introduced by Hunt et al. (1966), are robust non-parametric supervised learning methods used for classification and regression. The structure recursively partitions the input space, with nodes representing decisions based on individual features and leaves denoting outcomes. This straightforward architecture makes decision trees intuitive, allowing easy visualization of decision processes.
In the context of regression, decision trees forecast a continuous value, adeptly capturing complex, non-linear relationships between variables. Our research employs decision tree regression to articulate the dynamics of seabed sediment liquefaction influenced by wave action - a critical factor affecting underwater pipeline stability. The method’s strength lies in its versatility with heterogeneous datasets and its proficiency in delineating complex interactions among various variables impacting liquefaction. By segmenting the dataset into smaller, feature-based subsets, the decision tree regression illuminates the fundamental mechanisms at play, providing nuanced insights into the sediment behavior under diverse wave conditions. The minimal need for data preprocessing, coupled with its capacity to model non-linear relationships, renders decision tree regression an exemplary choice for investigating the multifaceted nature of seabed sediment liquefaction.
In this study, the decision tree model was selected due to its robustness in handling complex, non-linear data relationships which are typical in wave-induced liquefaction scenarios. Decision trees provide clear, interpretable decision paths and rules, which are crucial for understanding the intricate patterns and influences in seabed dynamics. This model excels in situations with heterogeneous data and provides intuitive insights into how different environmental factors impact liquefaction, making it particularly suitable for our study focused on submarine pipeline environments under varied marine conditions.
Data normalization is a pivotal preprocessing step designed to adjust the scale of data features to a uniform range, commonly between 0 to 1 or -1 to 1. This procedure addresses the challenge posed by machine learning algorithms’ sensitivity to feature scales and units. By normalizing data, we ensure equitable feature representation, eliminating biases that could arise from disparate numerical scales.
In our study, we employ the Min-Max Scaling technique for normalization. This approach rescales the numerical features to a pre-defined range, often [0, 1] or [-1, 1], facilitating consistent scale across all features. This uniformity is crucial for both training the model efficiently and ensuring accurate feature comparison. The formula for Min-Max Scaling is given by:
For a given original feature X, to normalize it to a specified range [a, b], you can use the following formula to calculate the normalized value X’:
where is the normalized feature value; X is the original feature value; min(X) is the minimum value of the original feature; max(X) is the maximum value of the original feature; a and b are the specified normalization range, typically [0, 1] or [-1, 1].
To validate the model’s efficacy on novel data, we partition the dataset into training and testing subsets, adopting an 80%-20% split ratio. This division allocates 80% of the dataset for model training, with the remaining 20% reserved for testing. Based on the experimental conditions described in Table 2, the dataset comprises a total of 74 samples. This split allocates 60 samples for training and 14 samples for testing. Such a split is critical to prevent the model from accessing the test data during training, thus enabling an accurate assessment of the model’s predictive performance on unseen data. While we utilize an 80%-20% split based on standard practice, it’s important to note that this ratio is flexible. Depending on the dataset size and specific project goals, alternative ratios like 70%-30% or 60%-40% might also be appropriate.
Due to the limited size of our dataset, to maximize the effective use of our data, we only divided the data into train and test datasets, foregoing a separate validation dataset. During the model training phase, we employed cross-validation techniques to validate the consistency and robustness of our predictive model. This approach helped mitigate the risks associated with overfitting and provided a reliable estimate of model performance. Furthermore, the application of cross-validation ensures that even with a smaller dataset, the assessment of the model is comprehensive and accurate, enhancing the model’s usability and reliability in practical applications.
Upon defining the train and test datasets, our project proceeds with the decision tree technique for model development. This method involves training the decision tree model using 80% of the data, followed by evaluating its predictive accuracy using the independent test dataset. In this study, multiple classical machine learning algorithms, including MLP and SVM, were tested and compared. Decision tree was ultimately selected due to its superior predictive accuracy, which met the precision requirements of this research and outperformed other tested algorithms. As depicted in Figure 4, our predictive model incorporates eight input parameters and eight output parameters, enabling it to forecast pipeline displacement, seabed liquefaction, and liquefaction phenomena adjacent to the pipeline under the influence of wave-current dynamics.

Figure 4. Schematic structure of the liquefaction model for submarine pipelines and surrounding sediments under wave-current coupling effects.
To assess the precision of the Decision Tree model’s forecasts, we utilized four evaluation indicators: Mean Squared Error (MSE), Mean Absolute Error (MAE), Root Mean Squared Error (RMSE), and R-squared (R2). These indicators offer a detailed insight into the model’s efficacy concerning forecast precision and the extent of errors. In our research, actual value refers to the outcomes obtained from finite element model simulations, which are employed as a benchmark to validate the predictions made by the machine learning model. These values are derived from detailed simulations using the FSSI-CAS model, known for its accuracy in replicating marine sediment behavior under dynamic loading conditions, thus providing a reliable basis for evaluating our predictive model’s performance. Here is an explanation of each evaluation indicator along with their specific formulas:
Mean Squared Error (MSE): MSE evaluates the average of the squares of the differences between the forecasted and actual values. It is a common metric in regression analyses for assessing forecast error. A model is deemed more effective with a lower MSE. The MSE is calculated as follows:
where y_pred represents the predicted value, y_true denotes the actual value, and n is the count of data points.
Mean Absolute Error (MAE): MAE computes the average of the absolute differences between the forecasted and actual values. This metric offers a straightforward interpretation of the magnitude of forecast error. A lower MAE suggests a more accurate model. The MAE formula is:
where y_pred is the predicted value, y_true is the actual value, and n represents the count of data points.
Root Mean Squared Error (RMSE): RMSE is derived by taking the square root of the Mean Squared Error, providing a prediction error estimate in the same units as the actual values. An improved model performance is indicated by a lower RMSE. The RMSE formula is:
R-squared (R2): R2, or the coefficient of determination, quantifies the fraction of variance in the actual values that the model’s forecasts can explain. It serves as an indicator of the model’s fit quality. A R2 value nearing 1 denotes a more effective model. The R2 is calculated as:
where y_pred is the predicted value, y_true is the actual value, y_mean is the average of the actual values, and the sums run across all data points.
The adoption of a diverse set of performance metrics is crucial for a comprehensive evaluation of our predictive model. These metrics each play a distinct role: MSE and RMSE provide insights into the average and the square root of the squared errors respectively, emphasizing the impact of large errors more significantly than MAE, which quantifies average errors linearly. R2 assesses the proportion of variance in the dependent variable that is predictable from the independent variables, offering a measure of how well unseen samples are likely to be predicted by the model. This multi-metric approach ensures robustness in performance validation, catering to the varied conditions and complexities involved in wave-induced liquefaction of seabed sediments.
Our comprehensive analysis, underpinned by a finite element numerical model and detailed case studies, explores the dynamic responses of seabed sediments to wave action from multiple vantage points. Initial investigations focused on a scenario with a water depth of 9 m, wave height of 3 m, and a current velocity of 0 m/s, aimed at assessing time-response characteristics at strategic locations. This was followed by an examination of a case with a water depth of 9 m, wave height of 3.5 m, and a current velocity of 0.25 m/s, to understand the temporal distribution patterns of dynamic seabed parameters. Lastly, we scrutinized the predictive accuracy of our machine learning model against empirical data.
As shown in Figure 5, after 400 seconds of wave action, liquefaction occurred at locations within 18 m of the seabed depth and on both sides of the pipeline, with a reduced liquefaction depth near the pipeline, and no liquefaction observed at positions immediately adjacent to the top and bottom of the pipeline. The liquefaction depth further from the pipeline, defined as the Seabed Liquefaction Depth (LD), was notably less than that above the pipeline (Liquefaction Depth Above, LDA), indicating the significant influence of the pipeline on nearby seabed sediments. This suggests that the presence of the seabed pipeline acts to suppress the imprinting effect on surrounding sediments by reducing their liquefaction depth. Further analysis was conducted by examining the time-history curves of four characteristic points for more detailed insights.
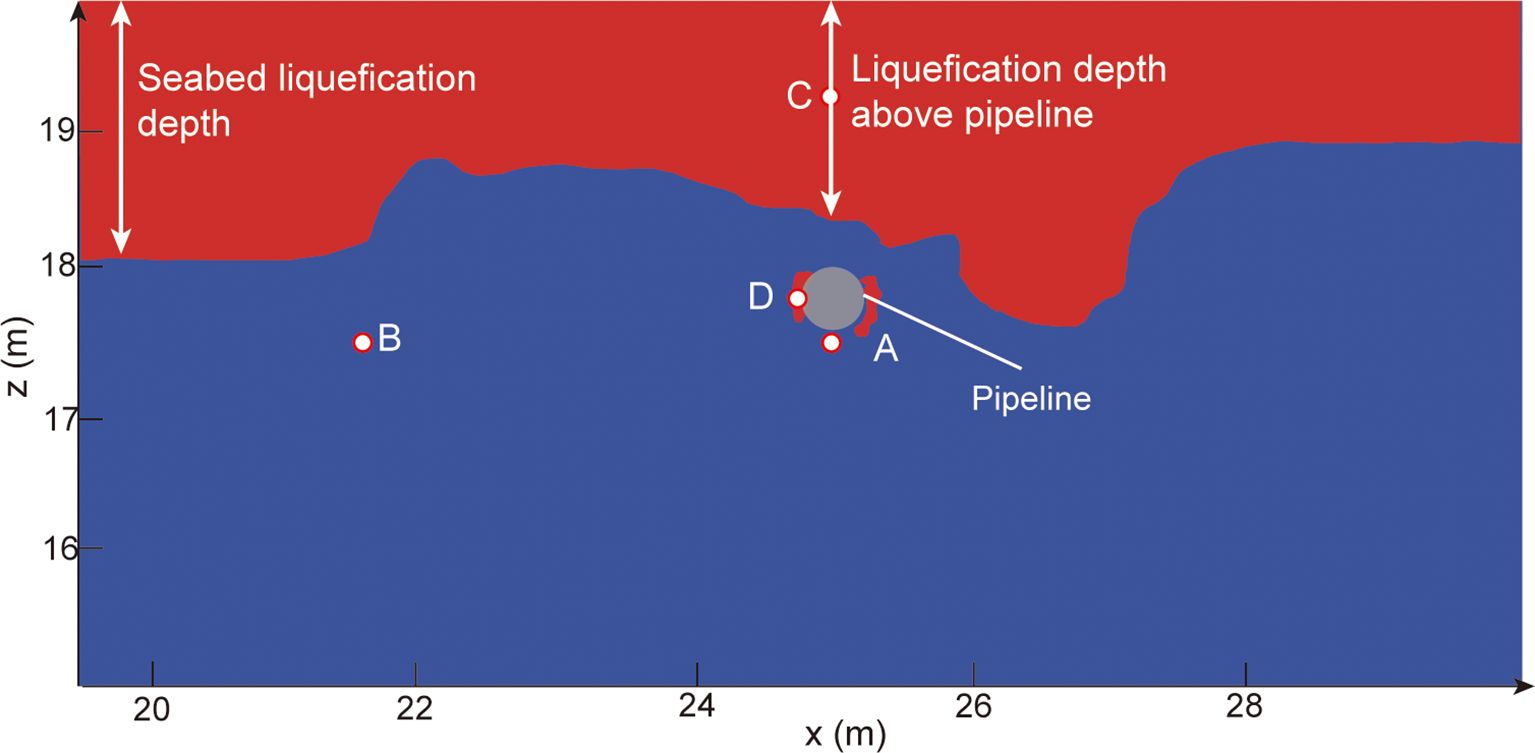
Figure 5. Liquefaction distribution of seabed pipeline and surrounding sediments when wave height is 3 m, wave period is 7.75 s, and flow velocity is 0 m/s. Point A is sediment directly beneath the pipeline; Point B is the seabed unaffected by the pipeline (sharing the same seafloor depth as Point A); Point C is the location directly above the pipeline at a distant location; Point D is located adjacent to the side of the pipeline.
Detailed insights were further gleaned from time-history analyses at four research points:
Displacement (Figure 6a): Displacement at point C was significantly larger compared to points A, B, and D, highlighting the influence of sediment depth and proximity to the pipeline on displacement magnitude. The pipeline evidently restricts sediment movement, particularly close to its structure.
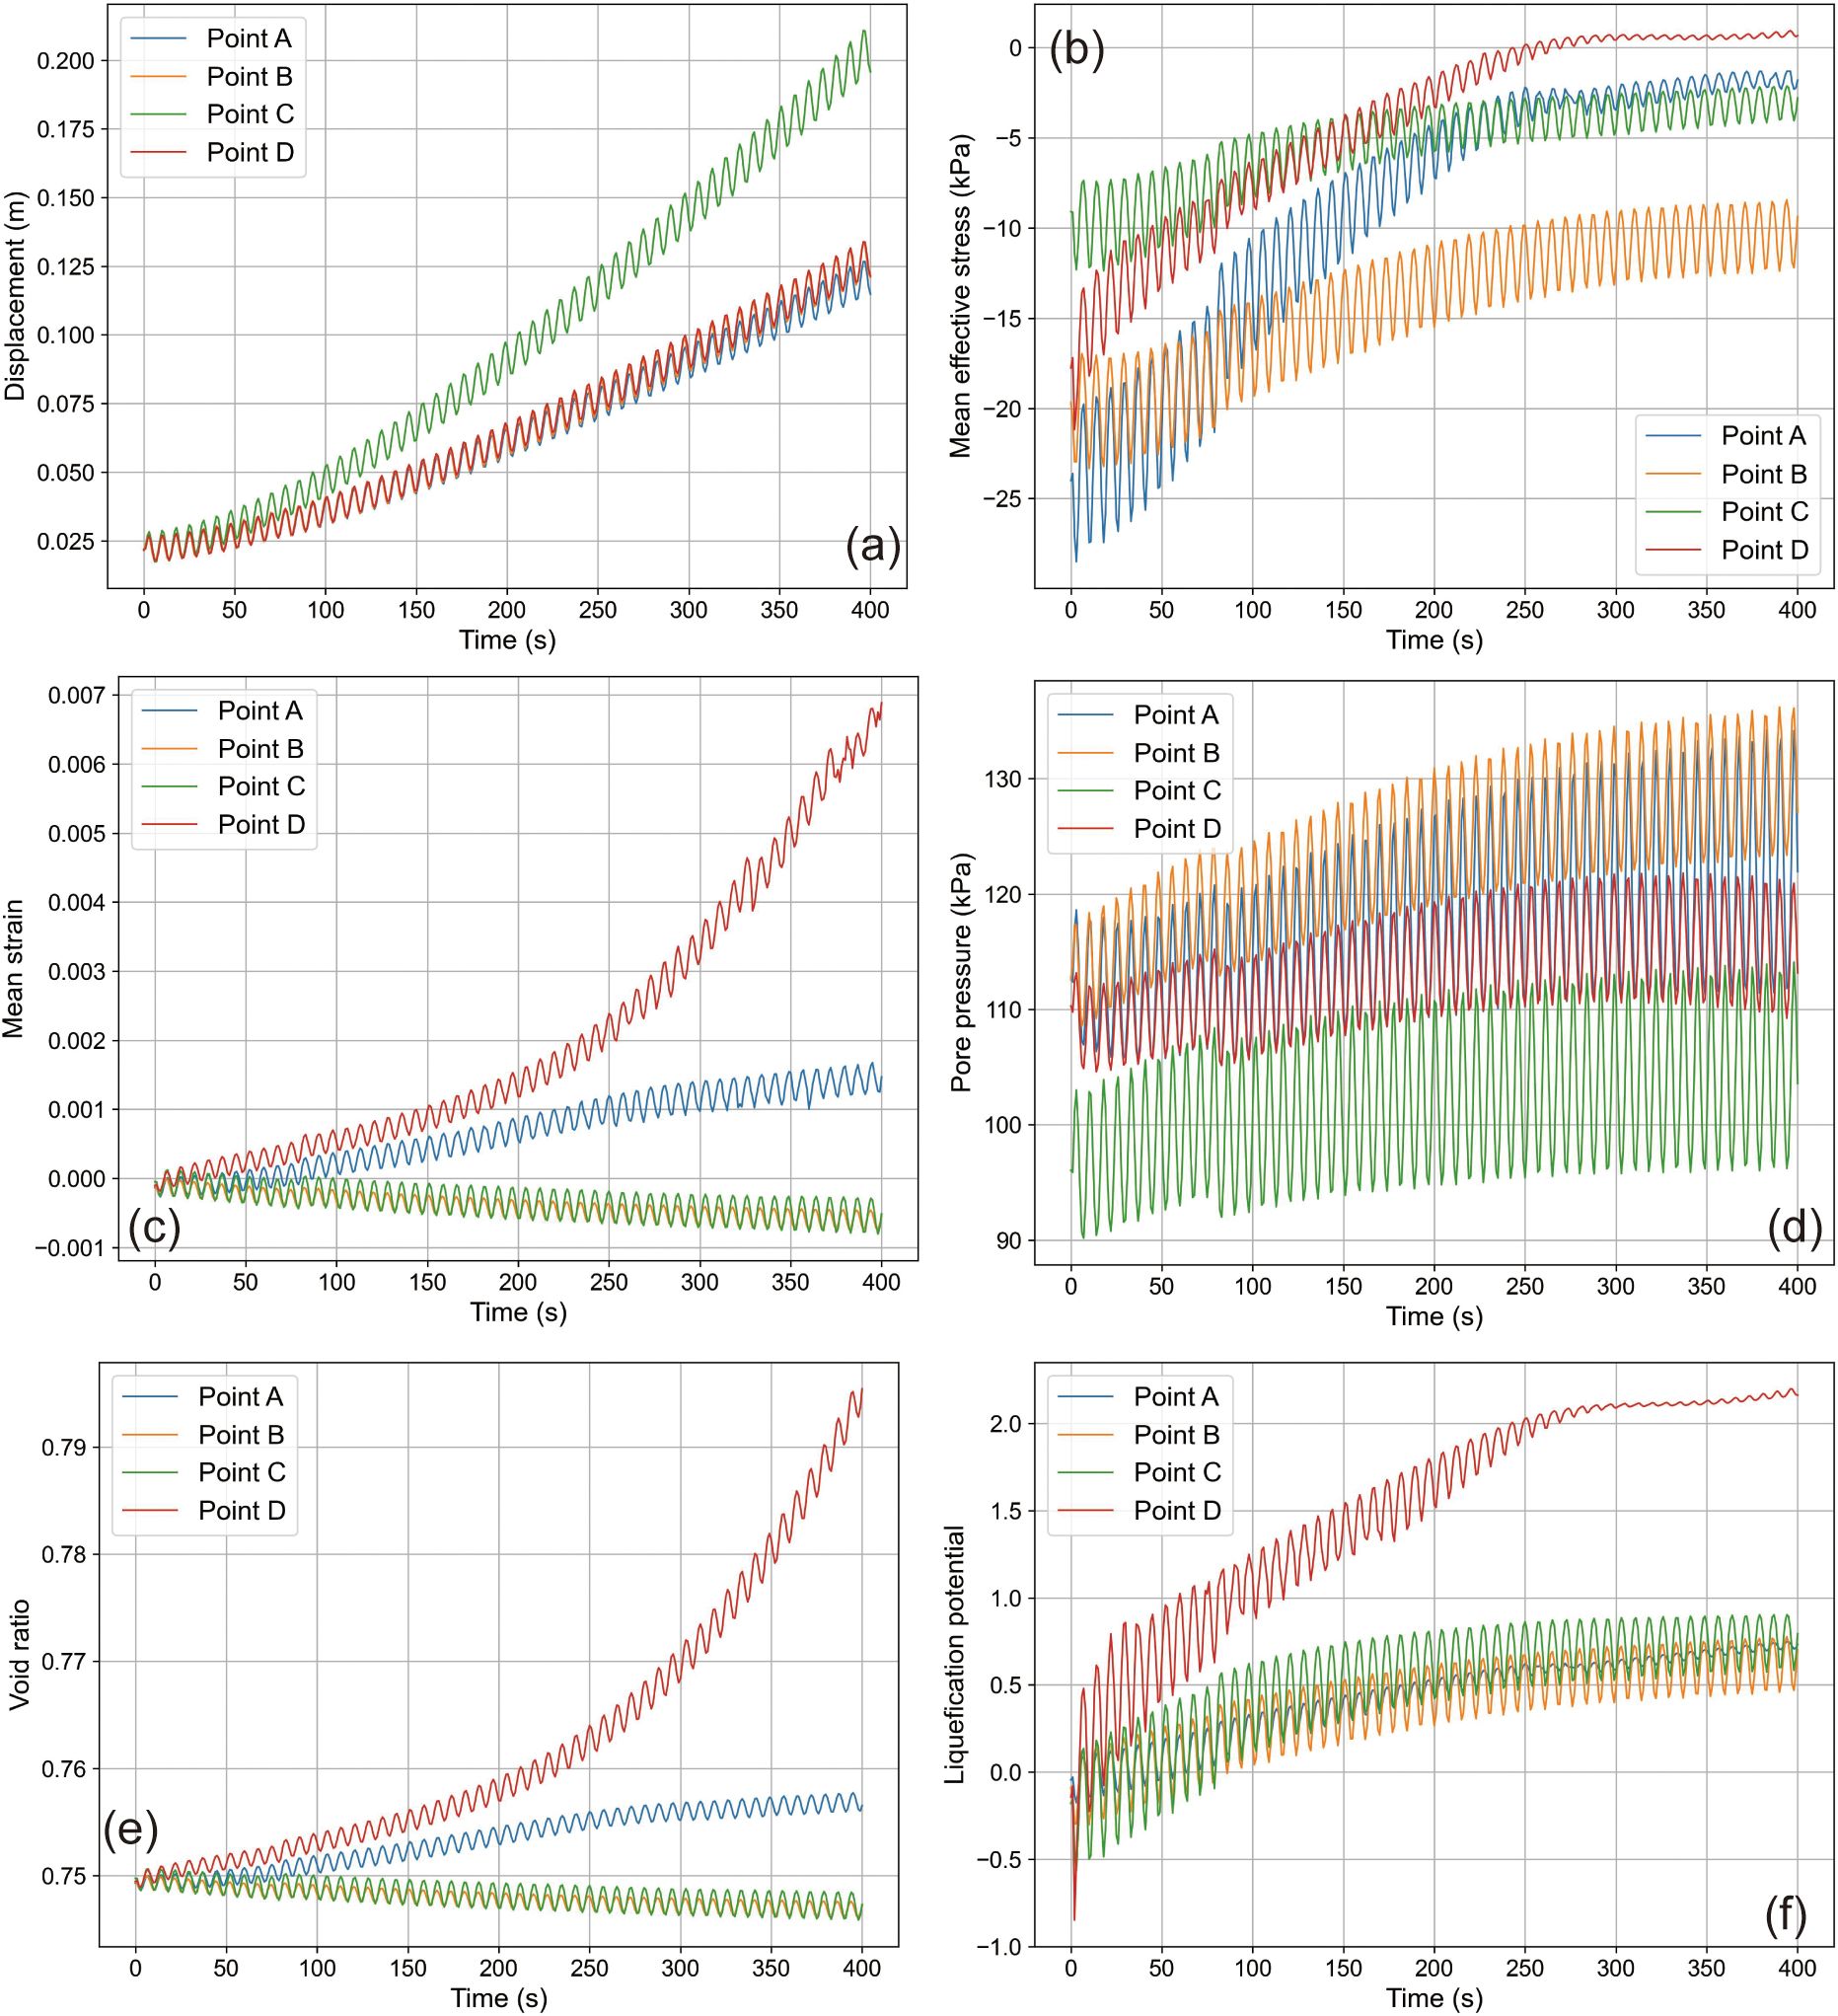
Figure 6. Variation of dynamic parameters at different characteristic points on the seabed under the action of waves over time. (a) is displacement; (b) is mean effective stress; (c) is mean strain; (d) is pore pressure; (e) is void ratio; (f) is liquefication potential.
Effective Stress (Figure 6b): Initial effective stresses at points A and B were similar, diverging over time as point A experienced a rapid stress reduction, indicating its proximity to the liquefaction zone. Conversely, point B’s stress decreased more gradually, remaining outside the liquefaction threshold. The rapid stress decline at point D to zero underscored its immediate liquefaction.
Strain and Porosity Ratio (Figures 6c, e): These parameters increased over time at point A, reflecting tension in the sediments around the pipeline. Points B and C, further from the pipeline, showed a compaction trend due to cyclic wave loading, while point D exhibited rapid strain and porosity increases, signifying severe sediment liquefaction.
Pore Pressure and Liquefaction Potential (Figures 6d, f): Points A and B, sharing the same burial depth, began with equivalent pore pressures. However, the pipeline’s influence moderated point A’s pressure increase compared to point B. Point C reached a higher liquefaction potential indicative of ongoing sediment liquefaction, while point D demonstrated a swift pore pressure accumulation and a significant increase in liquefaction potential, indicating rapid and severe liquefaction.
In summary, our findings confirm the stabilizing effect of pipelines on surrounding sediments, which reduces displacement and decreases liquefaction susceptibility. Notably, sediments at the sides of the pipeline are more prone to liquefaction than those directly above or below. This study highlights the complex interactions between seabed sediment behavior and marine infrastructure under wave action, providing valuable insights for submarine pipeline design and maintenance.
To elucidate the dynamics of seabed sediment behavior and pipeline stability under specific hydrodynamic conditions, a detailed case analysis was conducted. The selected scenario—characterized by a water depth of 9 m, wave height of 3.5 m, and current velocity of 0.25 m/s over a duration of 500 s—was carefully chosen to reveal the temporal responses of seabed pipelines and adjacent sediments to wave action. This analysis aimed to provide a deeper understanding of the mechanisms driving sediment displacement, pore pressure variations, and liquefaction processes.
In terms of displacement (Figure 7), our observations revealed a progressive increase in sediment movement from the initial state, where only static water column pressure was present, to significant displacements recorded at various stages of the simulation. Notably, by 200 seconds, a gradual displacement began manifesting from the seabed surface to deeper layers, attributed to the synergistic effects of waves and currents, culminating in a displacement of approximately 0.1 m near the pipeline. This displacement intensified over time, reaching about 0.2 m by 400 s, and further escalating to 0.6 m at the surface layer and 0.3 m around the pipeline by the 500-second mark. These findings underscore the profound impact of prolonged hydrodynamic forces on seabed sediment displacement, highlighting the critical role of wave and current interactions in altering seabed stability.
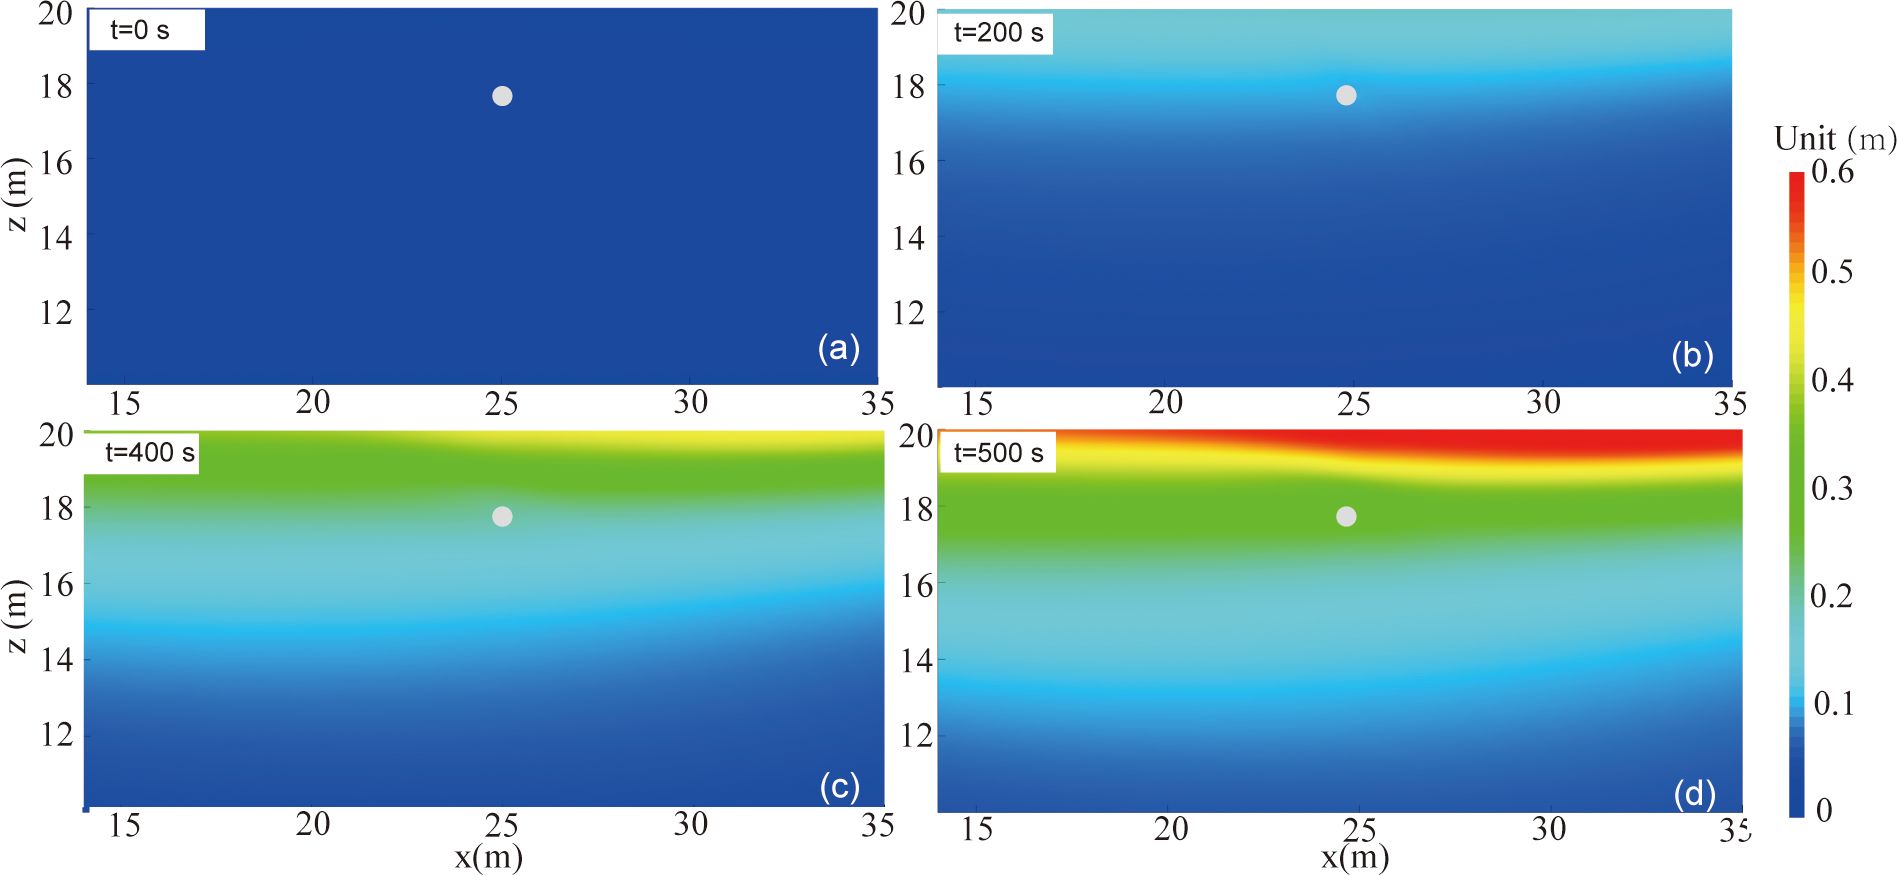
Figure 7. Distribution of seabed displacement at characteristic moments under wave action. (a) is at 0 s; (b) is at 200 s; (c) is at 400 s; (d) is at 500 s.
The analysis of pore pressure within the seabed sediments unveiled a gradual accumulation over time, a consequence of sustained hydrodynamic action (Figure 8). Intriguingly, an annular zone exhibiting reduced pore pressure was observed around the pipeline, contrasting with the adjacent sediments at the same burial depth. This phenomenon indicates the suppressive effect of the pipeline’s burial on the dynamic response and liquefaction susceptibility of seabed sediments, suggesting a stabilizing influence exerted by the pipeline on the surrounding sedimentary environment.
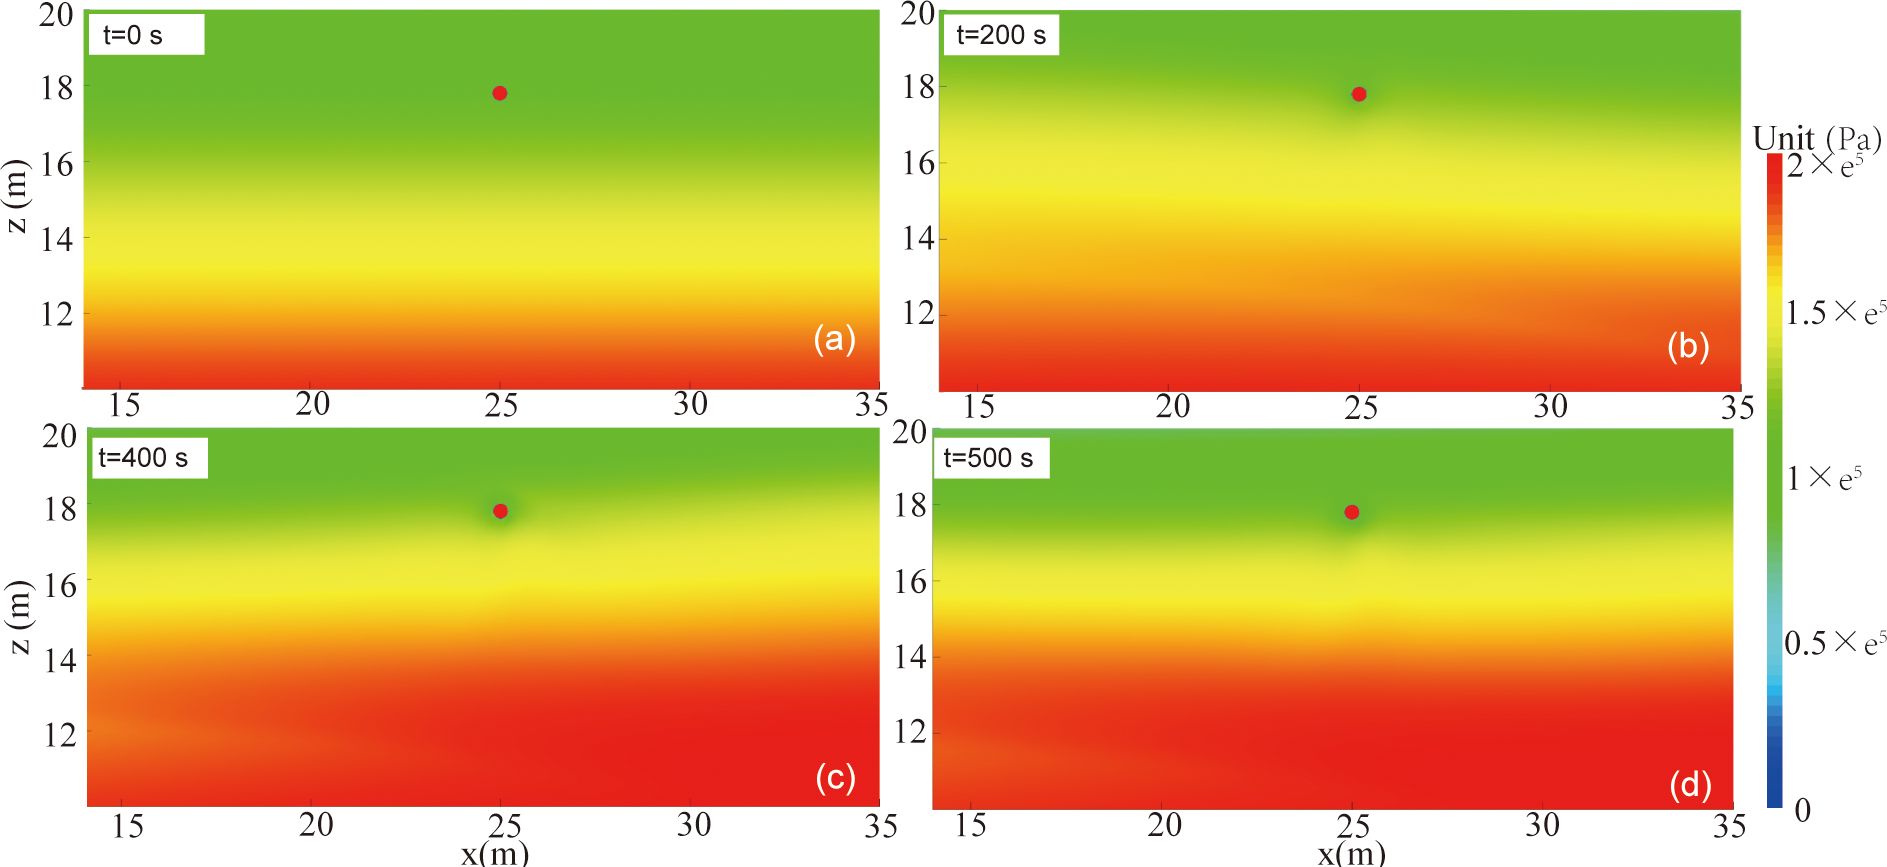
Figure 8. Distribution of seabed pore pressure at characteristic moments under wave action. (a) is at 0 s; (b) is at 200 s; (c) is at 400 s; (d) is at 500 s.
Observations from Figure 9 indicate that the seabed is in a non-liquefied state at the initial moment. With the increase in time under hydrodynamic action, lateral liquefaction around the pipeline occurs first at 200 s. By 400 s, liquefaction near the seabed extends to nearly 2 m, with the liquefied zones on both sides of the pipeline becoming more pronounced. By 500 s, liquefaction exceeds 2 m in depth, but non-liquefied regions are observed immediately adjacent above and below the pipeline, demonstrating the stabilizing effect of the seabed pipeline on the nearby surrounding sediments.
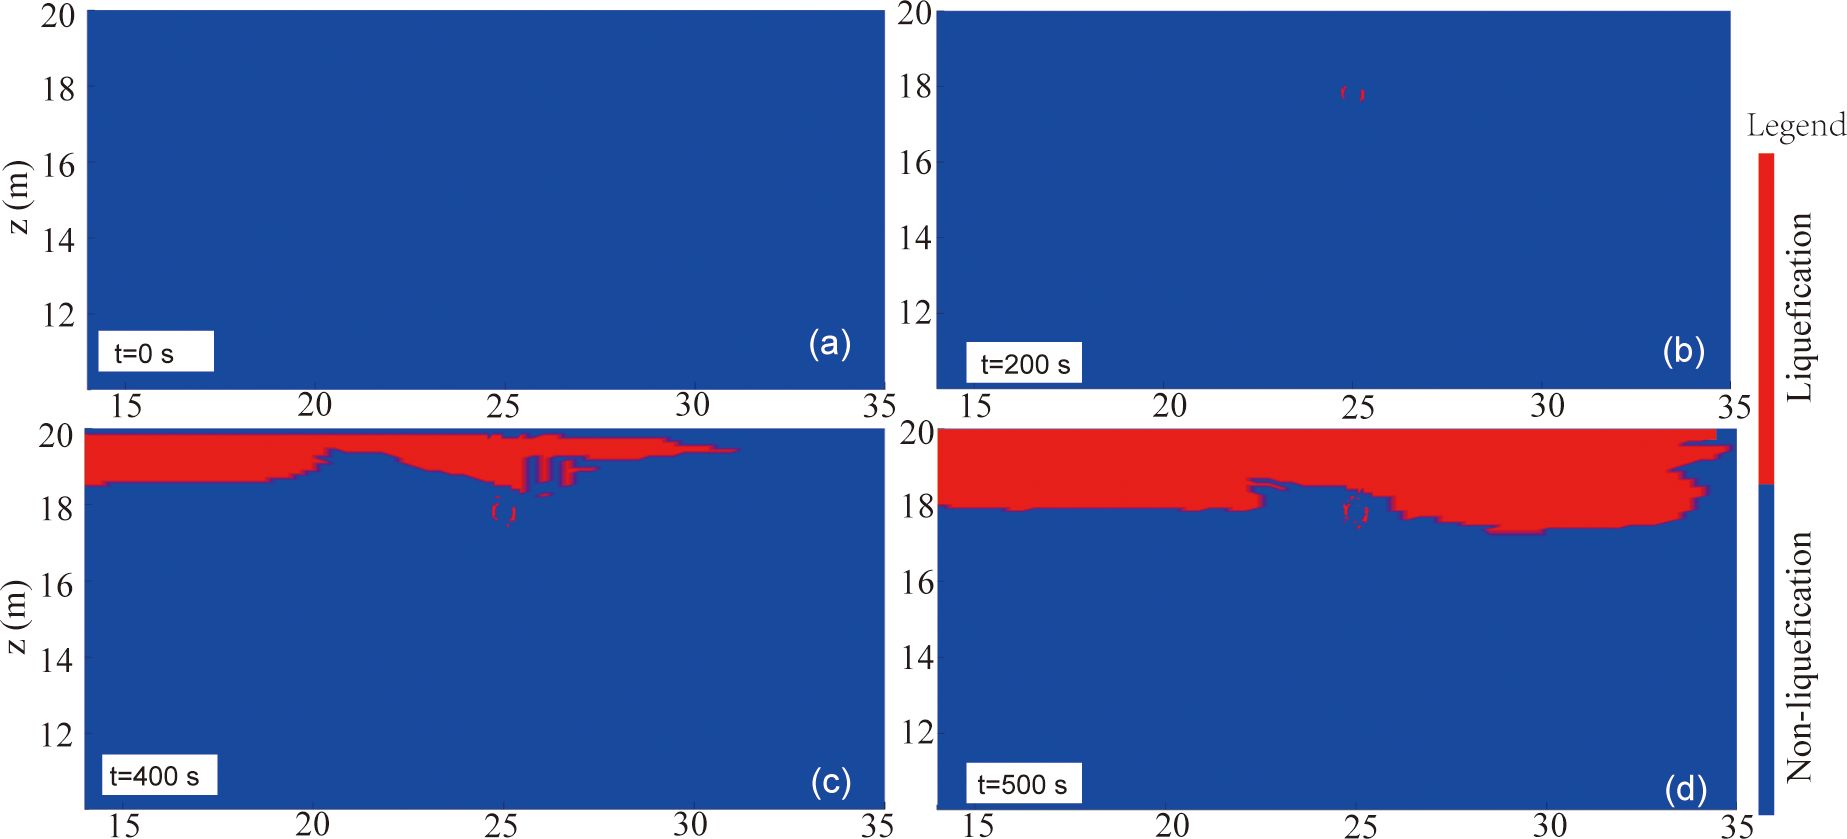
Figure 9. Distribution of seabed liquefaction at characteristic moments under wave action. (a) is at 0 s; (b) is at 200 s; (c) is at 400 s; (d) is at 500 s.
The analysis demonstrates the predictive accuracy of our model regarding the response of submarine pipelines and their adjacent sediments to wave-current interactions, as shown in Figure 10. The alignment of the model’s predictions with actual observations is noteworthy, with several instances of direct correlation, emphasizing the precision of our liquefaction prediction model.
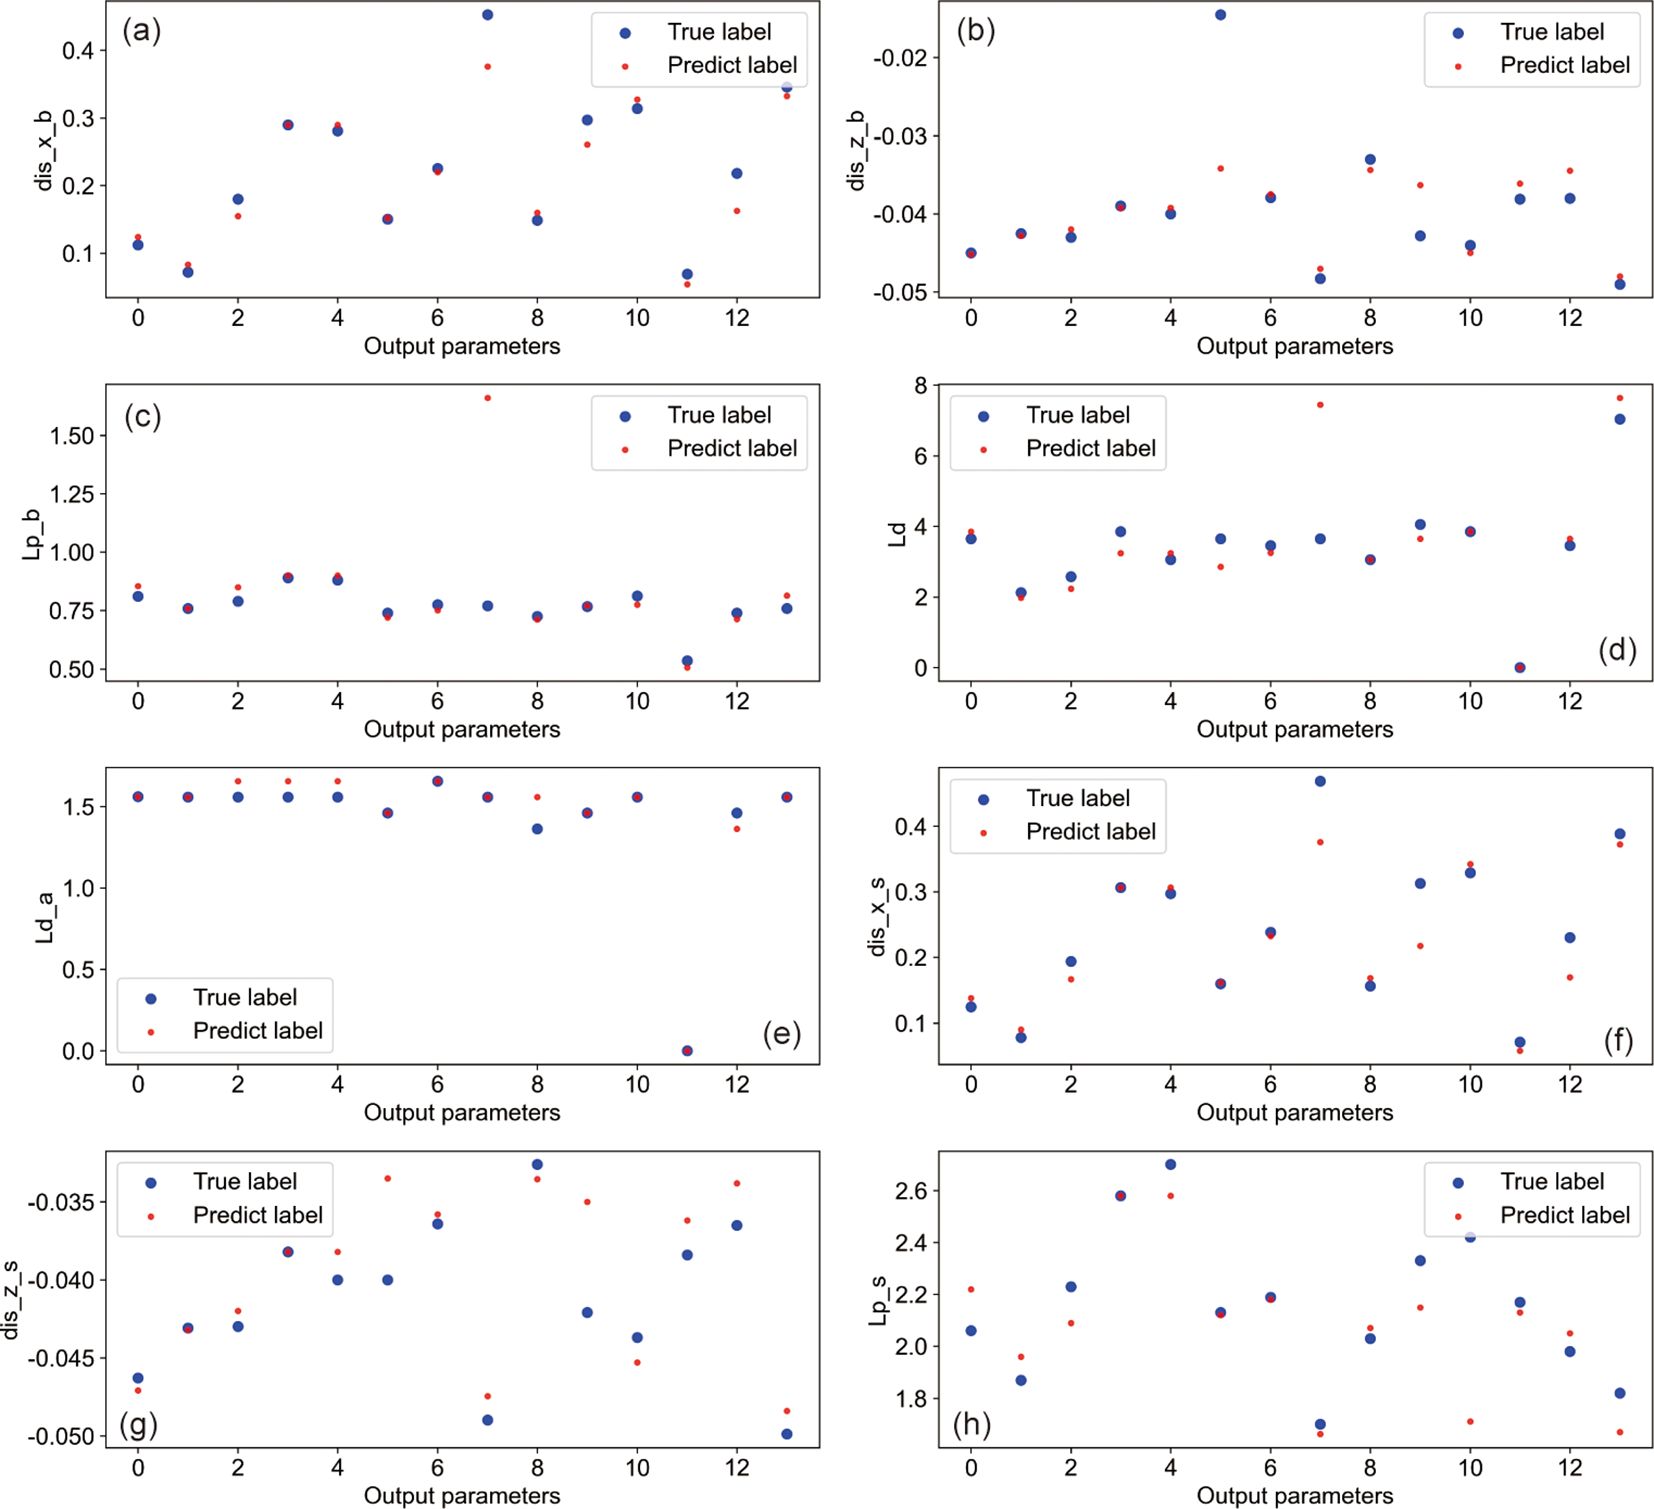
Figure 10. Comparison of predicted values and actual values for different output parameters. Subplots (a–h) represent, respectively, the x-direction displacement below the pipeline, z-direction displacement below the pipeline, liquefaction potential below the pipeline, seabed liquefaction depth, liquefaction depth above the pipeline, x-direction displacement on the side of the pipeline, z-direction displacement on the side of the pipeline, and lateral liquefaction potential of the pipeline.
To conduct a more nuanced analysis of the predictive accuracy, we employed a suite of evaluation metrics, namely the mean square error (MSE), root mean square error (RMSE), mean absolute error (MAE), and the coefficient of determination (R2). When these metrics are collectively considered, as depicted in Figure 11, the predictive performance for parameters such as the x-direction displacement beneath the pipeline, the liquefaction depth above the pipeline, and the x- and z-direction displacements at the lateral sides of the pipeline, emerges as notably superior. These parameters are ranked highest across all four-evaluation metrics, underscoring the model’s high level of predictive accuracy.
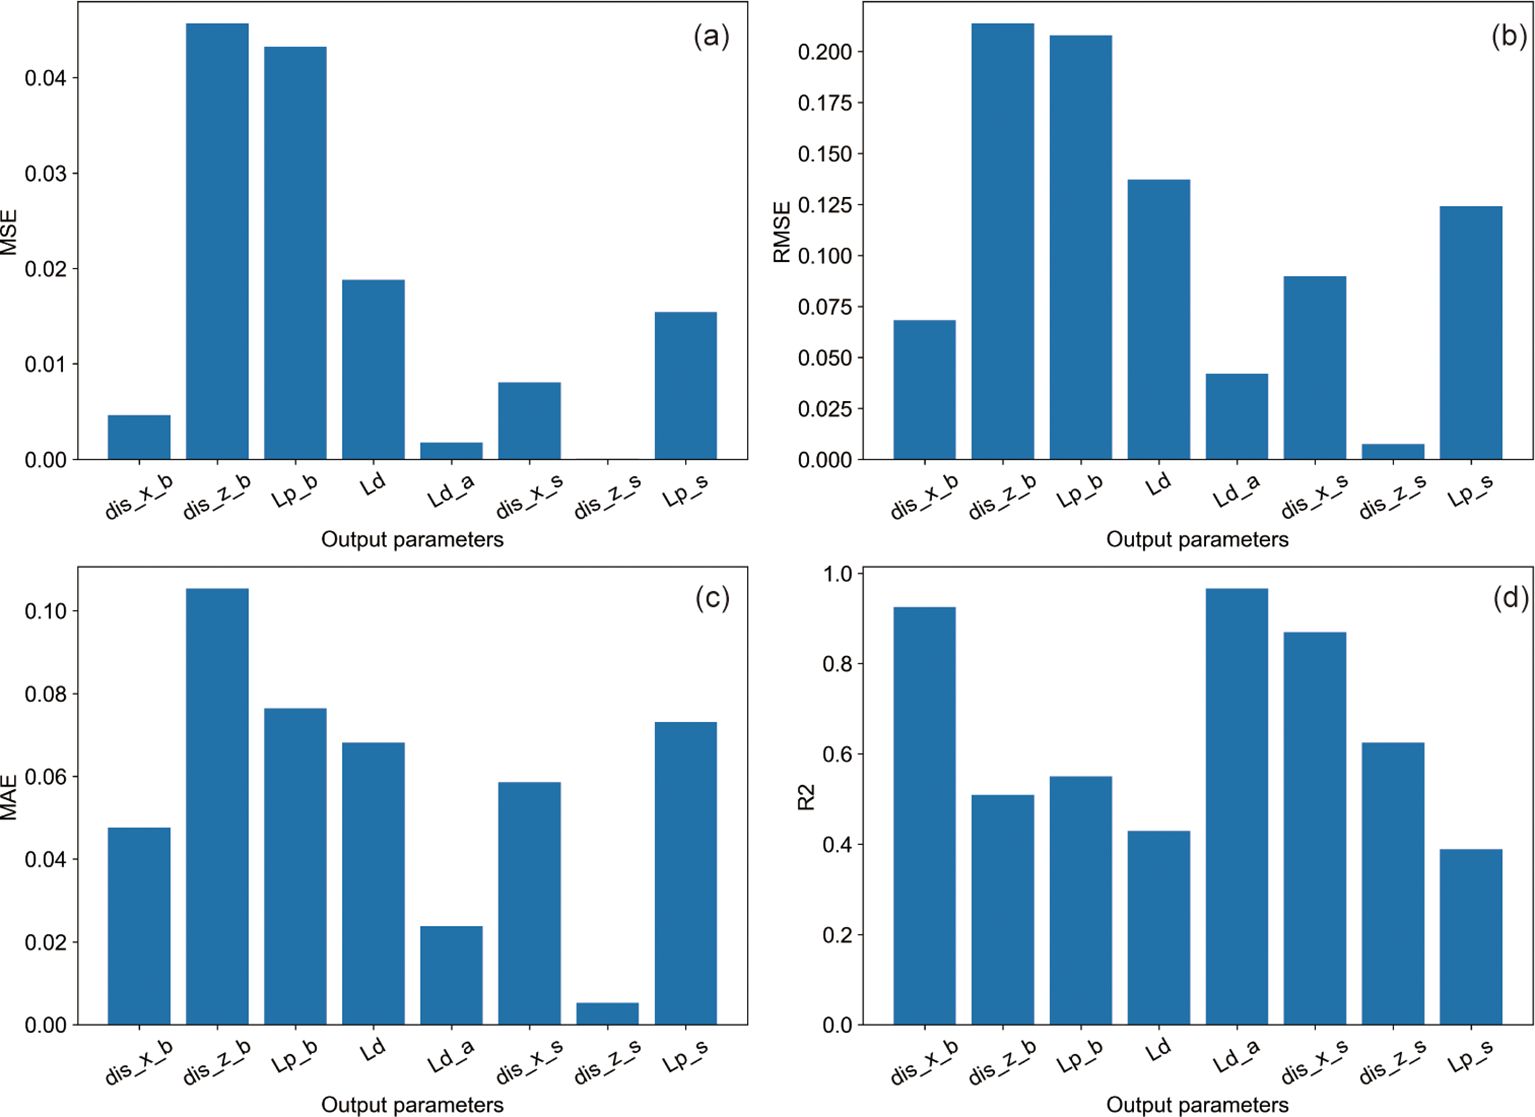
Figure 11. Statistical analysis of model prediction results. Where (a–d) represent MSE, RMSE, MAE, and R2 statistical values, respectively.
Conversely, the remaining four output parameters exhibit marginally lower predictive values, underscoring the variability in predictive accuracy across different parameters. Despite this, the error metrics for all outputs remain within acceptable thresholds, with MSE values below 0.05 and MAE values under 0.1. This evidences that the model delivers high accuracy across all evaluated output parameters, albeit with slight variations among them. Overall, this model adequately meets the accuracy requirements for assessing the response of submarine pipelines and the liquefaction of surrounding sediments under the combined action of waves and currents, providing a robust tool for understanding and mitigating geohazards in marine engineering contexts.
The findings reveal that submarine pipelines markedly influence the dynamic behavior of adjacent sediments, particularly in the distribution of liquefaction. As illustrated in Figure 5, sediments adjacent to the sides of the pipeline (e.g., Point D in Figure 5) exhibit the greatest liquefaction potential, whereas sediments directly above (e.g., Point C) and below the pipeline (e.g., Point A) are less prone to liquefaction. The adjacent sides of the pipeline correspond to the regions where stress concentration and dynamic responses due to wave action are most pronounced. This trend may be attributed to the wave motion direction assumed in the analyses and the impact of the submarine pipeline on stress distribution. The structure of the pipeline acts as a support, reducing sediment displacement and stress concentration due to wave-current dynamics, notably around the pipeline’s upper and lower sections.
Experiments and model predictions corroborate the submarine pipeline’s stabilizing influence on nearby sediments, which diminishes pore pressure buildup and, consequently, liquefaction depth. This effect appears linked to sediment density and the pipeline’s dimensions and mass, enhancing near-pipeline sediments’ resistance to liquefaction. Supporting this observation, prior research (Ye and He, 2021; Ye and Lu, 2022) identified non-liquefied zones adjacent to submarine pipelines under wave action, corroborating our findings and extending their reliability and applicability. These insights underscore the necessity for submarine pipeline designs to account for their effects on sediments’ dynamic responses, aiming to bolster both pipeline and environmental stability and safety.
In summary, submarine pipelines significantly influence the wave-induced dynamic response of surrounding sediments. Through reasonable design and engineering measures, the risk of liquefaction can be minimized, ensuring the long-term stability and reliability of the pipeline system. This has important implications for the planning, design, and maintenance of submarine pipeline projects, especially in areas with a high potential risk of liquefaction.
The machine learning model introduced in this study is pivotal for the swift prediction of regional liquefaction risks, offering a substantial leap in early warning capabilities and decision-making support against liquefaction threats. This model enables rapid, precise forecasts of liquefaction potential and the behavior of submarine pipelines and their adjacent sediments under specific hydrodynamic scenarios, markedly improving response times to potential hazards. For example, as summarized in Table 4, while traditional finite element numerical methods might take roughly 50 days to analyze 74 calculation points, our machine learning model can deliver predictions in just 5 seconds, with a mean absolute error (MAE) below 0.1. This corresponds to a prediction accuracy exceeding 95%, which is comparable to the accuracy of traditional numerical methods (typically above 98%), while significantly reducing computational time. This dramatic improvement in computational efficiency highlights the model’s practical advantages in time-sensitive scenarios, such as marine engineering projects in areas prone to severe weather conditions. Furthermore, Table 4 also demonstrates the reduced complexity and lower user requirements of our model, as it only requires eight input parameters for operation, making it more accessible to non-specialist users.
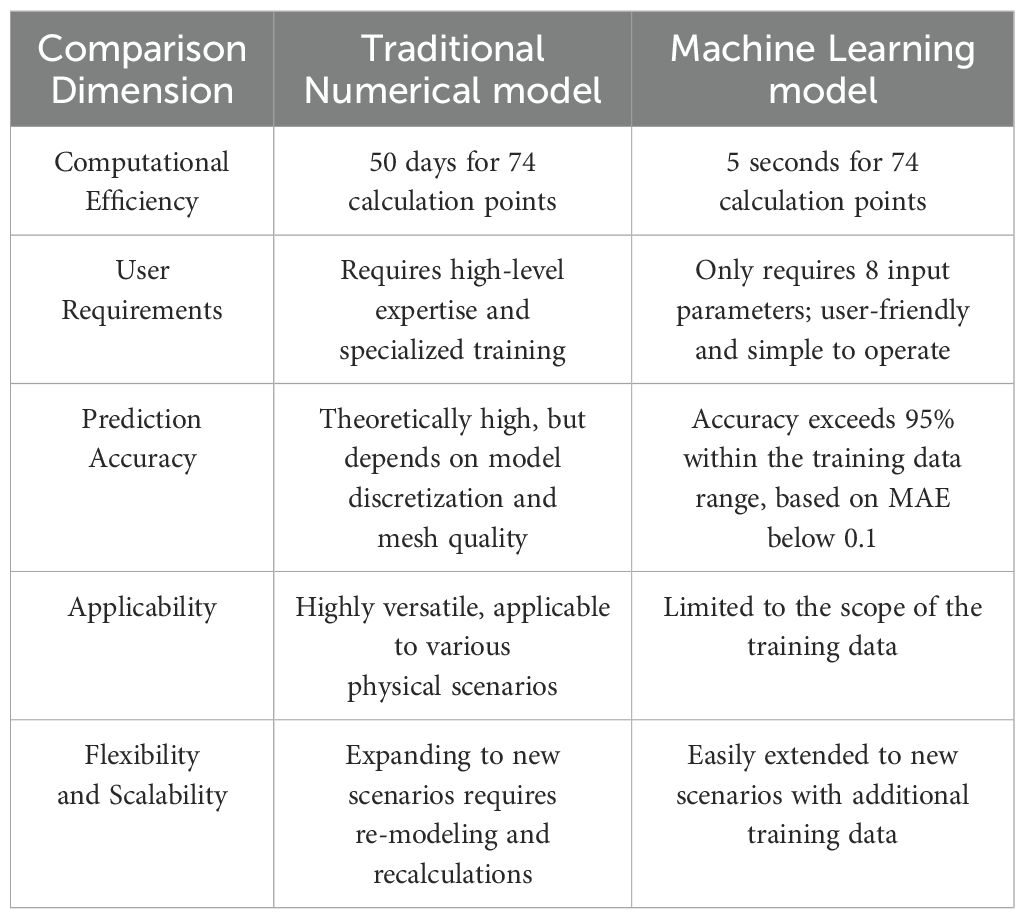
Table 4. Comparison between traditional numerical model and machine learning model.
In addition to computational efficiency, the machine learning model simplifies the prediction process. Unlike traditional numerical methods, which require high-level expertise and comprehensive training, our model only requires eight input parameters, significantly lowering the complexity and expertise needed for operation (Table 4). This makes the model more accessible to engineers without extensive computational modeling backgrounds. However, the primary limitation of this approach is its reliance on data-driven models, which lack universally applicable physical laws, thus confining their prediction accuracy to the scope of the training data. To mitigate this, the study meticulously crafted numerous calculation cases for a specific region to ensure comprehensive coverage of all conceivable hydrodynamic conditions, allowing the model to be effectively utilized within this specific context.
While traditional numerical methods offer versatility and applicability to a wide range of physical scenarios, our machine learning approach demonstrates unique advantages in terms of computational speed, ease of use, and scalability to new datasets. The methodology of creating datasets from extensive numerical analyses, combined with machine learning training for rapid forecasting, offers a valuable blueprint for addressing similar geohazard challenges. Future research could focus on enhancing the model’s precision, broadening its applicability to other regions, and developing hybrid models that integrate physical principles with machine learning. Such advancements could yield a more robust and accurate decision-support system for submarine pipeline projects and the management of marine resources.
This study has achieved preliminary results in the prediction of wave-induced liquefaction of submarine pipelines and their surrounding sediments, demonstrating innovative applications in this field by integrating finite element methods with machine learning techniques. Nevertheless, the depth and breadth of the research still require further expansion. Firstly, the current machine learning model relies on a limited dataset, which constrains its predictive generalization capability and accuracy. Future research could enhance the model’s generalization ability and predictive accuracy by collecting more comprehensive experimental data and numerical simulation results under various hydrodynamic conditions. Additionally, considering the complexity and variability of the submarine environment, incorporating more influencing factors such as seabed soil characteristics, depth variations, and human activities into the model training will be key to improving the model’s comprehensive predictive capability. Moreover, comparing and analyzing the accuracy of the same wave-induced liquefaction dataset across different machine learning models will also be a focus of our subsequent research.
Secondly, the current model primarily focuses on wave-induced liquefaction phenomena within a specific area. Future research could explore the applicability of the model under different geological and hydrodynamic conditions to further validate and optimize the model’s universality and robustness. Given the black-box nature of machine learning models, investigating how to enhance the interoperability of the model is also an important direction for future work. This would not only ensure accuracy in predictions but also provide deeper insights and understanding for engineering decision-making.
Lastly, with the rapid development of artificial intelligence technology, exploring more advanced machine learning algorithms, such as deep learning and physical information neural networks for the application in submarine pipeline liquefaction risk assessment, could lead to a significant improvement in predictive performance. These advanced algorithms have the capacity to process larger datasets and capture more complex nonlinear relationships, providing more accurate and real-time risk assessment tools for marine engineering. Besides, future research will focus on extending our current models to include the prediction of time series data for wave-induced liquefaction. Recognizing the importance of not only determining the final state and depth of liquefaction but also understanding the variation of intermediate variables over time, our next phase of research will aim to develop a comprehensive dataset that captures these temporal dynamics. This advancement will allow for a more detailed exploration of the changing physical properties and behaviors of seabed sediments under dynamic wave conditions, thereby enhancing our understanding of the underlying mechanisms and improving predictive accuracies.
In summary, future work will focus on expanding and deepening the application scope of machine learning models, enhancing model accuracy and interpretability, and exploring new algorithms and time series datasets in the prediction of submarine pipeline liquefaction. These efforts will not only provide more reliable technical support for the safety management and disaster prevention of marine engineering but also promote further development and application of machine learning technology in the field of marine engineering.
This study comprehensively applied a combination of finite element methods and machine learning techniques to investigate the liquefaction response of submarine pipelines and their surrounding sediments under the action of wave-current coupling. The research method combines the accuracy of finite element methods with the efficiency of machine learning, resulting in a rapid prediction model for the liquefaction response of submarine pipelines and surrounding sediments under wave-current coupling. This model can quickly predict the liquefaction conditions at multiple regional points, leading to the following main conclusions:
1. The impact of submarine pipelines on sediment liquefaction exhibits significant directionality and positional differences. The research indicates that liquefaction is most pronounced on the sides of the pipeline perpendicular to the direction of wave-current incidence, while the top and bottom ends of the pipeline are less likely to liquefy. This phenomenon reveals the substantial stabilizing effect of submarine pipelines on the surrounding sediments, which suppresses liquefaction to some extent by reducing displacement, decreasing pore pressure accumulation, and mitigating the reduction in effective stress.
2. This study successfully constructed a machine learning model trained with datasets established from finite element results, capable of quickly and accurately predicting wave-induced liquefaction problems. By comparing the model’s predictions with the finite element analysis results, an average absolute error (MAE) of less than 0.1 was found, demonstrating the high accuracy and reliability of the machine learning model in predicting wave-induced liquefaction.
3. This study demonstrates that the machine learning model achieves favorable prediction performance for wave-induced liquefaction around submarine pipelines. By providing predictions within an extremely short timeframe, the model enables timely risk assessments and decision support for engineering personnel dealing with complex hydrodynamic conditions. However, the applicability of the model remains constrained to the range covered by its training data, and its prediction accuracy may diminish for scenarios beyond this range.
The datasets presented in this study can be found in online repositories. The names of the repository/repositories and accession number(s) can be found below: https://doi.org/10.5281/zenodo.11910960.
XD: Data curation, Funding acquisition, Methodology, Resources, Validation, Writing – original draft, Writing – review & editing. YFS: Validation, Writing – review & editing. YPS: Resources, Writing – review & editing. WC: Writing – review & editing. ZX: Writing – review & editing, Validation. XZ: Writing – review & editing. DW: Writing – review & editing, Methodology.
The author(s) declare that financial support was received for the research, authorship, and/or publication of this article. The authors are grateful to the funding support from The National Natural Science Foundation of China under contract NO. 42102326; the Basic Scientific Fund for National Public Research Institutes of China under contract NO. 2022Q05; National Key R&D Program of China (Grant No.2022YFC2803800); The National Natural Science Foundation of China under contract NO. 41876066.
The authors declare that the research was conducted in the absence of any commercial or financial relationships that could be construed as a potential conflict of interest.
The author(s) declare that no Generative AI was used in the creation of this manuscript.
All claims expressed in this article are solely those of the authors and do not necessarily represent those of their affiliated organizations, or those of the publisher, the editors and the reviewers. Any product that may be evaluated in this article, or claim that may be made by its manufacturer, is not guaranteed or endorsed by the publisher.
An H., Cheng L., Zhao M. (2011). Numerical simulation of a partially buried pipeline in a permeable seabed subject to combined oscillatory flow and steady current. Ocean Eng. 38, 1225–1236. doi: 10.1016/j.oceaneng.2011.05.010
Casagli N., Intrieri E., Tofani V., Gigli G., Raspini F. (2023). Landslide detection, monitoring and prediction with remote-sensing techniques. Nat. Rev. Earth Environ. 4, 51–64. doi: 10.1038/s43017-022-00373-x
Cheng A. H.-D., Liu P. L.-F. (1986). Seepage force on a pipeline buried in a poroelastic seabed under wave loadings. Appl. Ocean Res. 8, 22–32. doi: 10.1016/S0141-1187(86)80027-X
Du X., Sun Y., Song Y., Sun H., Yang L. (2023a). A comparative study of different CNN models and transfer learning effect for underwater object classification in side-scan sonar images. Remote Sens. 15, 593. doi: 10.3390/rs15030593
Du X., Sun Y., Song Y., Yu Y., Zhou Q. (2023b). Neural network models for seabed stability: a deep learning approach to wave-induced pore pressure prediction. Front. Mar. Sci. 10. doi: 10.3389/fmars.2023.1322534
Gao F. P., Jeng D. S., Sekiguchi H. (2003). Numerical study on the interaction between non-linear wave, buried pipeline and non-homogenous porous seabed. Comput. Geotechnics 30, 535–547. doi: 10.1016/S0266-352X(03)00053-3
Gao F.-P., Wu Y.-X. (2006). Non-linear wave-induced transient response of soil around a trenched pipeline. Ocean Eng. 33, 311–330. doi: 10.1016/j.oceaneng.2005.05.008
He K., Huang T., Ye J. (2018). Stability analysis of a composite breakwater at Yantai port, China: An application of FSSI-CAS-2D. Ocean Eng. 168, 95–107. doi: 10.1016/j.oceaneng.2018.09.004
Hsu T.-J., Sakakiyama T., Liu P. L.-F. (2002). A numerical model for wave motions and turbulence flows in front of a composite breakwater. Coast. Eng. 46, 25–50. doi: 10.1016/S0378-3839(02)00045-5
Hunt E. B., Marin J., Stone P. J. (1966). Experiments in induction (Oxford, England: Academic Press).
Jeng D. S. (2001). Numerical modeling for wave–seabed–pipe interaction in a non-homogeneous porous seabed. Soil Dynamics Earthquake Eng. 21, 699–712. doi: 10.1016/S0267-7261(01)00043-4
Jeng D.-S., Cheng L. (2000). Wave-induced seabed instability around a buried pipeline in a poro-elastic seabed. Ocean Eng. 27, 127–146. doi: 10.1016/S0029-8018(98)00046-8
Jeng D.-S., Ye J.-H., Zhang J.-S., Liu P. L.-F. (2013). An integrated model for the wave-induced seabed response around marine structures: Model verifications and applications. Coast. Eng. 72, 1–19. doi: 10.1016/j.coastaleng.2012.08.006
Kiziloz B., Çevik E., Yüksel Y. (2013). Scour below submarine pipelines under irregular wave attack. Coast. Eng. 79, 1–8. doi: 10.1016/j.coastaleng.2013.04.001
Larsen B. E., Fuhrman D. R., Sumer B. M. (2016). Simulation of wave-plus-current scour beneath submarine pipelines. J. Waterway Port Coastal Ocean Eng. 142, 04016003. doi: 10.1061/(ASCE)WW.1943-5460.0000338
Magda W. (1997). Wave-induced uplift force on a submarine pipeline buried in a compressible seabed. Ocean Eng. 24, 551–576. doi: 10.1016/S0029-8018(96)00031-5
Martin P. P., Bolton Seed H. (1983). One-dimensional dynamic ground response analyses: J geotech engng div ASCE, V108, NGT7, July 1982, P935–952. Int. J. Rock Mechanics Min. Sci. Geomechanics Abstracts 20, A9. doi: 10.1016/0148-9062(83)91690-X
Mousavi S. M., Ellsworth W., Weiqiang Z., Chuang L., Beroza G. (2020). Earthquake transformer—an attentive deep-learning model for simultaneous earthquake detection and phase picking. Nat. Commun. 11, 3952. doi: 10.1038/s41467-020-17591-w
Myrhaug D., Ong M. C., Fien H., Gjengedal C., Leira B. J. (2009). Scour below pipelines and around vertical piles due to second-order random waves plus a current. Ocean Eng. 36, 605–616. doi: 10.1016/j.oceaneng.2009.02.007
Pouyan S., Pourghasemi H. R., Bordbar M., Rahmanian S., Clague J. J. (2021). A multi-hazard map-based flooding, gully erosion, forest fires, and earthquakes in Iran. Sci. Rep. 11, 14889. doi: 10.1038/s41598-021-94266-6
Seed H. B., Rahman M. S. (1978). Wave-induced pore pressure in relation to ocean floor stability of cohesionless soils. Mar. Geotechnology 3, 123–150. doi: 10.1080/10641197809379798
Stanley T. A., Kirschbaum D. B., Sobieszczyk S., Jasinski M. F., Borak J. S., Slaughter S. L. (2020). Building a landslide hazard indicator with machine learning and land surface models. Environ. Model. Software 129, 104692. doi: 10.1016/j.envsoft.2020.104692
Wang X., Jeng D. S., Lin Y. S. (2000). Effects of a cover layer on wave-induced pore pressure around a buried pipe in an anisotropic seabed. Ocean Eng. 27, 823–839. doi: 10.1016/S0029-8018(99)00012-8
Ye J. (2012). 3D liquefaction criteria for seabed considering the cohesion and friction of soil. Appl. Ocean Res. 37, 111–119. doi: 10.1016/j.apor.2012.04.004
Ye J., He K. (2021). Dynamics of a pipeline buried in loosely deposited seabed to nonlinear wave & current. Ocean Eng. 232, 109127. doi: 10.1016/j.oceaneng.2021.109127
Ye J., Jeng D., Chan A. H. C. (2012). Consolidation and dynamics of 3D unsaturated porous seabed under rigid caisson breakwater loaded by hydrostatic pressure and wave. Sci. China Technol. Sci. 55, 2362–2376. doi: 10.1007/s11431-012-4888-4
Ye J., Jeng D., Wang R., Zhu C. (2013). A 3-D semi-coupled numerical model for fluid–structures–seabed-interaction (FSSI-CAS 3D): Model and verification. J. Fluids Structures 40, 148–162. doi: 10.1016/j.jfluidstructs.2013.03.017
Ye J., Jeng D., Wang R., Zhu C. (2015). Numerical simulation of the wave-induced dynamic response of poro-elastoplastic seabed foundations and a composite breakwater. Appl. Math. Model. 39, 322–347. doi: 10.1016/j.apm.2014.05.031
Ye J., Lu Q. (2022). Seismic dynamics of a pipeline shallowly buried in loosely deposited seabed foundation. Ocean Eng. 243, 110194. doi: 10.1016/j.oceaneng.2021.110194
Zennaro F., Furlan E., Simeoni C., Torresan S., Aslan S., Critto A., et al. (2021). Exploring machine learning potential for climate change risk assessment. Earth-Science Rev. 220, 103752. doi: 10.1016/j.earscirev.2021.103752
Zhang Y., Ye J., He K., Chen S. (2019). Seismic dynamics of pipeline buried in dense seabed foundation. JMSE 7, 190. doi: 10.3390/jmse7060190
Zhou X.-L., Jeng D.-S., Yan Y.-G., Wang J.-H. (2013). Wave-induced multi-layered seabed response around a buried pipeline. Ocean Eng. 72, 195–208. doi: 10.1016/j.oceaneng.2013.06.031
Zienkiewicz O. C., Chan A. H. C., Pastor M., Schrefler B. A., Shiomi T. (1999). Computational Geomechanics with Special Reference to Earthquake Engineering (Chichester, UK: John Wiley and Sons).
Zienkiewicz O. C., Chang C. T., Bettess P. (1980). Drained, undrained, consolidating and dynamic behaviour assumptions in soils. Géotechnique 30, 385–395. doi: 10.1680/geot.1980.30.4.385
Keywords: submarine pipelines, sediment liquefaction, finite element analysis, machine learning, wave-current coupling
Citation: Du X, Sun Y, Song Y, Chi W, Xiu Z, Zhao X and Wang D (2025) A novel strategy for fast liquefaction detection around marine pipelines: a finite element-machine learning approach. Front. Mar. Sci. 12:1518679. doi: 10.3389/fmars.2025.1518679
Received: 28 October 2024; Accepted: 10 February 2025;
Published: 26 February 2025.
Edited by:
Yakun Guo, University of Bradford, United KingdomReviewed by:
Jingjie Wei, Missouri University of Science and Technology, United StatesCopyright © 2025 Du, Sun, Song, Chi, Xiu, Zhao and Wang. This is an open-access article distributed under the terms of the Creative Commons Attribution License (CC BY). The use, distribution or reproduction in other forums is permitted, provided the original author(s) and the copyright owner(s) are credited and that the original publication in this journal is cited, in accordance with accepted academic practice. No use, distribution or reproduction is permitted which does not comply with these terms.
*Correspondence: Yupeng Song, c29uZ3l1cGVuZ0BmaW8ub3JnLmNu; Dong Wang, ZG9uZ3dhbmdAb3VjLmVkdS5jbg==
Disclaimer: All claims expressed in this article are solely those of the authors and do not necessarily represent those of their affiliated organizations, or those of the publisher, the editors and the reviewers. Any product that may be evaluated in this article or claim that may be made by its manufacturer is not guaranteed or endorsed by the publisher.
Research integrity at Frontiers
Learn more about the work of our research integrity team to safeguard the quality of each article we publish.