 Peixiao Mao
 Judith M. Schicks
 Mengdi Pan
 Nengyou Wu
95% of researchers rate our articles as excellent or good
Learn more about the work of our research integrity team to safeguard the quality of each article we publish.
Find out more
ORIGINAL RESEARCH article
Front. Mar. Sci. , 11 February 2025
Sec. Marine Biogeochemistry
Volume 12 - 2025 | https://doi.org/10.3389/fmars.2025.1510050
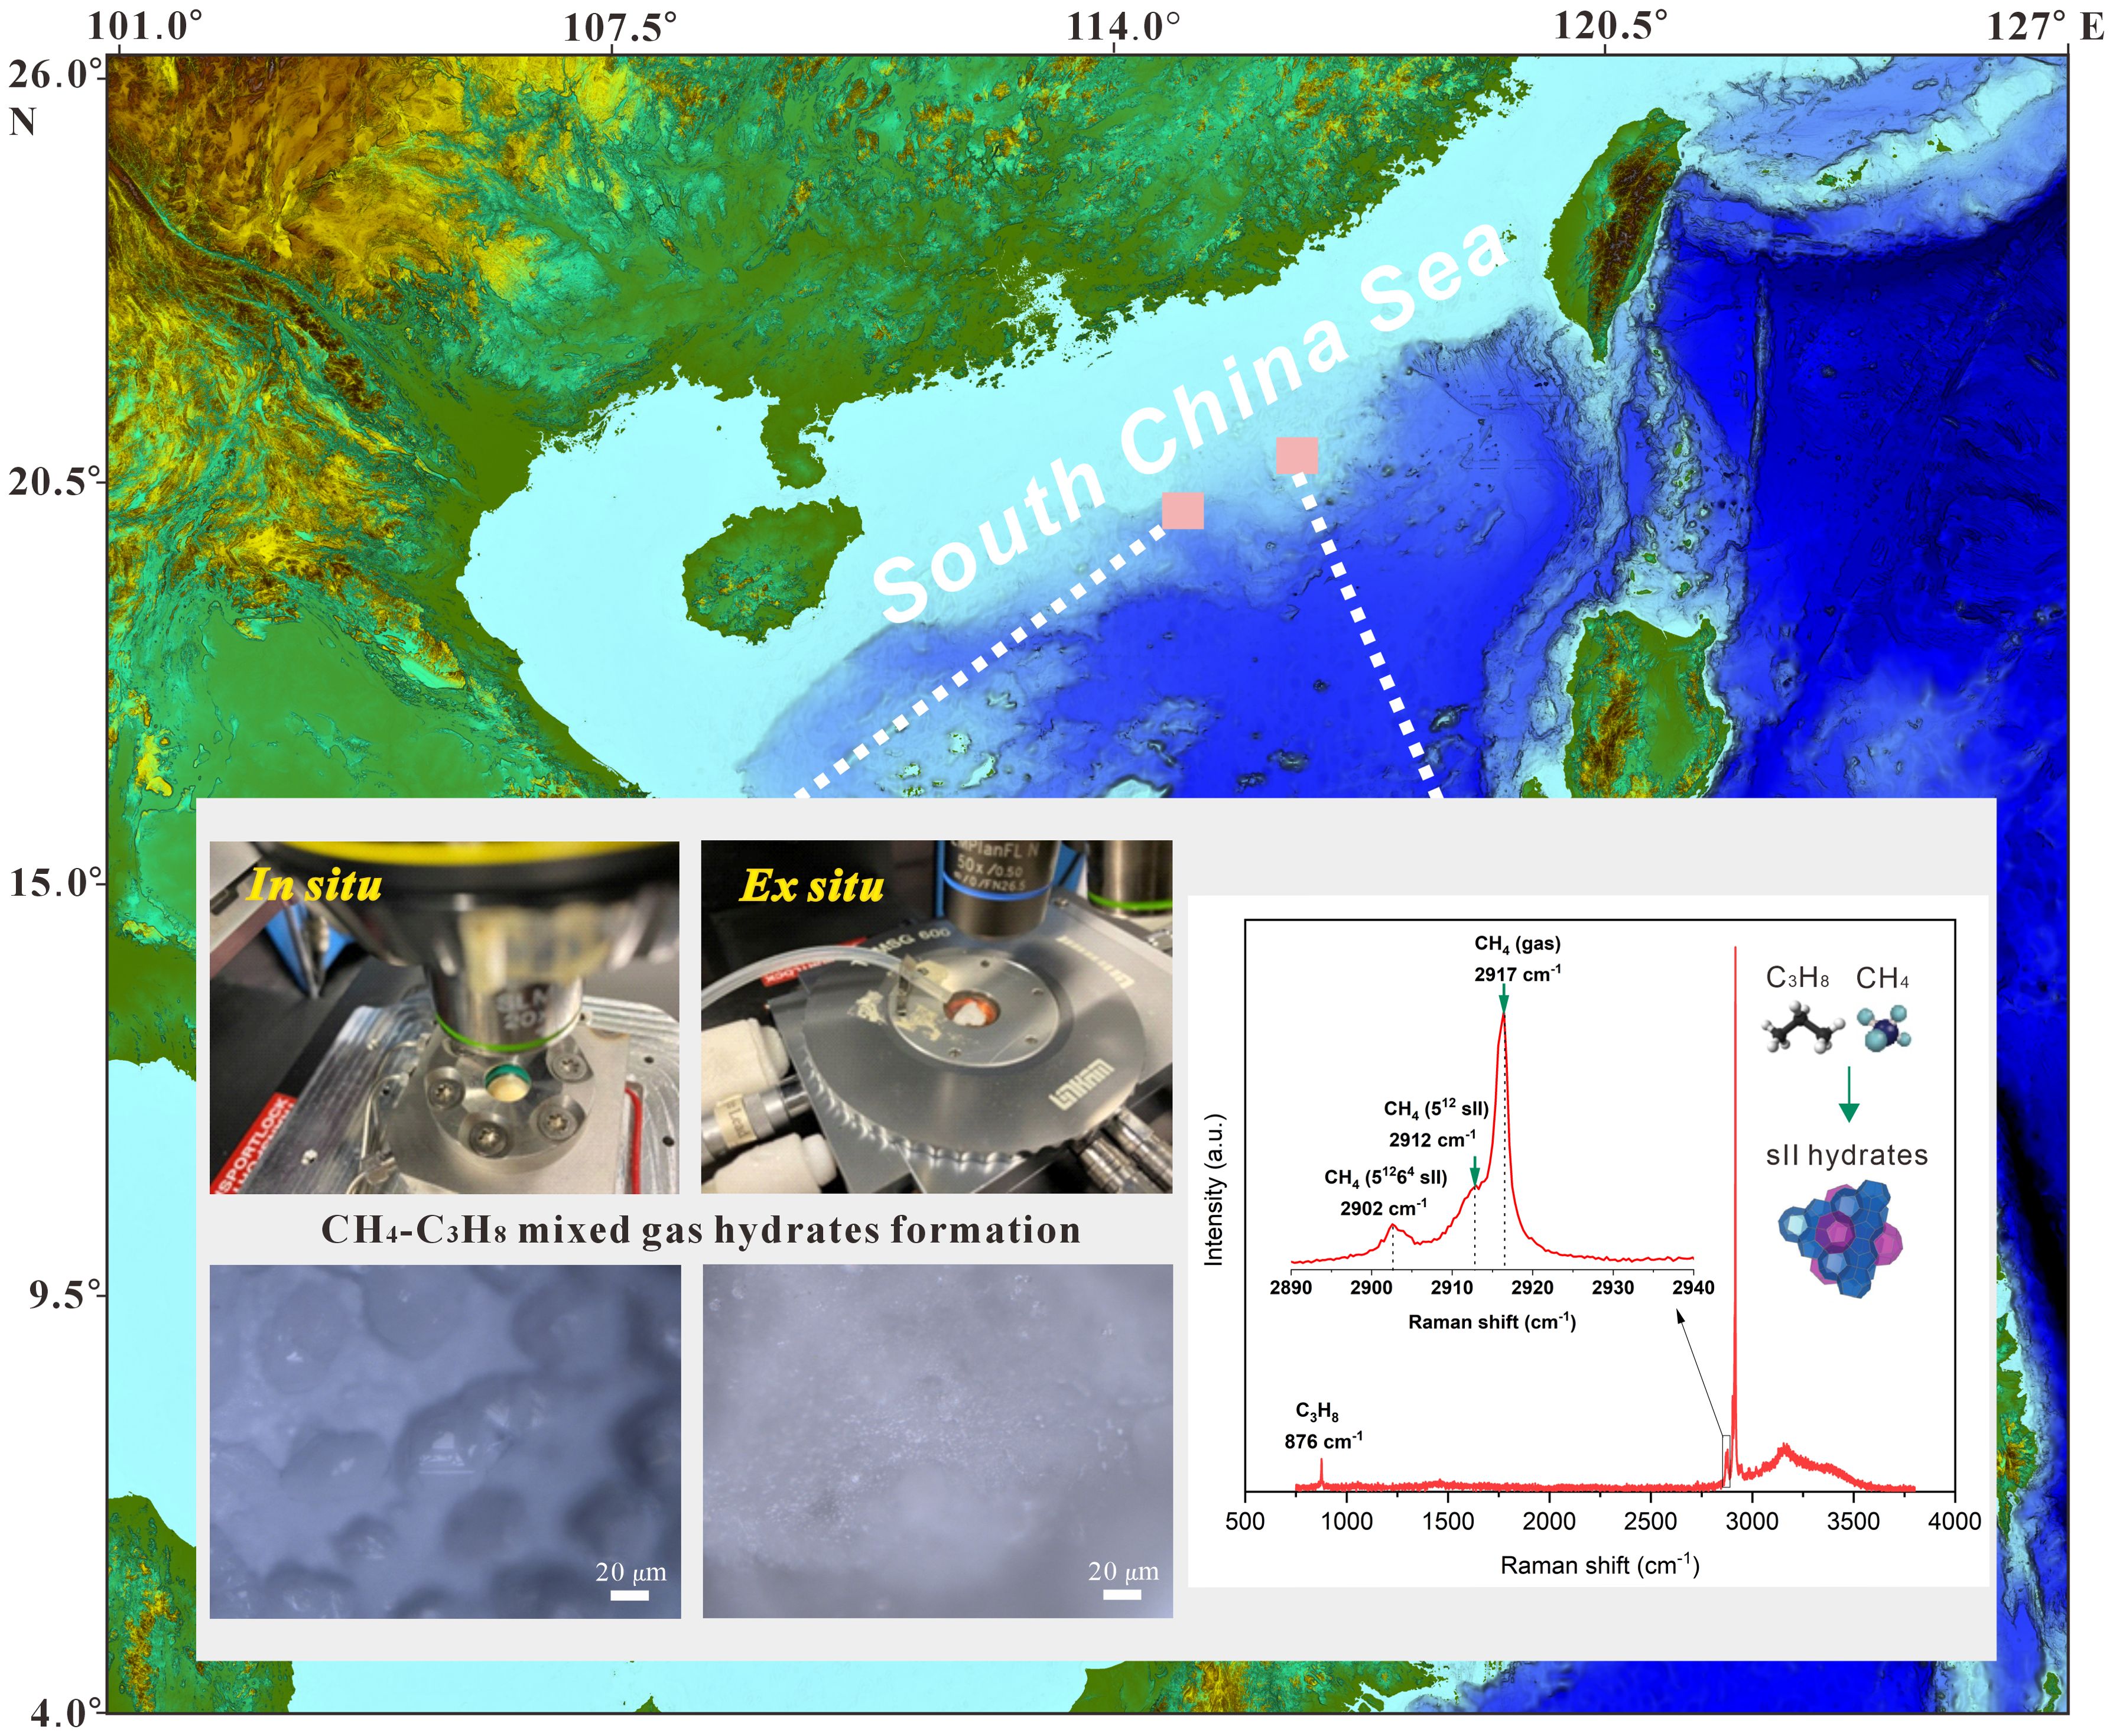
CH4-C3H8 mixed gas hydrates are widely distributed in deep-sea weakly-consolidated muddy sediments of the South China Sea, enriched with biological clastics like foraminifera-rich sand. However, the role of complex mineral composition of mud and foraminifera-rich sand on the formation of these natural gas hydrates remains unclear. This study employed five natural sediments from the South China Sea, i.e., foraminifera-rich sand, a mixture of mud and foraminifera-rich sand, and three different mud samples, to reveal their effects on CH4-C3H8 mixed gas hydrate formation. Gas hydrates were formed from water and a constant-feed gas composition containing 96 mol% CH4 and 4 mol% C3H8. The formation process was continuously observed using microscopic observation and in situ Raman spectroscopy. Additional ex situ Raman measurements were also conducted jointly. The results show that only structure II gas hydrates were formed with two crystal morphologies in these sediments, showing no significant differences in gas composition or large-to-small cavity ratio. The concentration of CH4 and C3H8 in the mixed gas hydrates almost did not vary over time in clean foraminifera-rich sand or mud. In a mixture of mud and foraminifera-rich sand, CH4 was preferentially encased into the hydrate cavities at the initial formation stage, while the encasement of C3H8 increased during the ongoing formation process. Not all small 512 cages and large 51264 cages were filled with CH4 during the euhedral hydrate crystals formation. Foraminifera-rich sand, large quartz particles, illite, and kaolinite positively influence the encasement of CH4 into hydrate cavities. These findings provide insights into how marine sediment composition influences gas hydrate formation and their implications for marine ecosystem functioning and structure.
Graphical Abstract.
● Natural marine muddy sediments obtained from the South China Sea were studied.
● Both ex situ and in situ Raman experiments were performed.
● Two morphologies of hydrate crystals in different sediments were observed and evaluated.
● CH4 and C3H8 content and cage occupancy in hydrates vary across different sediments.
● CH4 and C3H8 encasement in hydrate cavities varies over time in a mixture of mud and foraminifera-rich sand.
Natural gas hydrates are ice-like crystalline compounds formed by water and gas molecules at high pressure and low temperature conditions (von Stackelberg and Müller, 1954; Sloan, 2003). Three structure types of gas hydrates, including the cubic structures I and II (sI and sII) and the hexagonal structure (sH), were identified in marine sediments (e.g. Davidson et al. (1986); Sassen and MacDonald (1994)). Small guest molecules such as CH4, CO2 or H2S form structure I hydrates, whereas the presence of larger hydrocarbon molecules (≥ C3) results in the formation of structure II or structure H hydrates (Sloan and Koh, 2008). Almost all natural gas hydrate deposits contain certain amounts of other gases besides CH4 (Milkov, 2005; Beeskow-Strauch et al., 2011; Abbasov et al., 2016), which in some cases has resulted in the coexistence of gas hydrate phases with different compositions and/or structures. The coexistence of different structures of gas hydrates was confirmed in the Gulf of Mexico (Klapp et al., 2010), the Cascadia margin (Lu et al., 2007), the middle-upper continental slope of Sabah (Paganoni et al., 2016), the South China Sea (Wei et al., 2018; Qian et al., 2018; Liang et al., 2019; Zhang et al., 2019; Wei et al., 2021), and Lake Baikal (Kida et al., 2006, 2009). Understanding the crystalline structure and gas composition of gas hydrates in marine sediments is crucial for assessing their impact on marine ecosystem functioning and global carbon storage.
Mixed gas hydrate consisting of CH4 and C3H8 is a significant hydrate type found in deep-sea sediments, also in the South China Sea (Yang et al., 2017a; Zhang et al., 2019). An increasing number of studies have been conducted on the crystalline structure of this mixed gas hydrate. Several studies found the coexistence of sI and sII gas hydrates formed from a feed gas mixture containing CH4 and C3H8 (Aladko et al., 2002; Uchida et al., 2004; Hester et al., 2007; de Menezes et al., 2019; Klapproth et al., 2019; Cai et al., 2022), but others demonstrated that only sII hydrates were observed (Maeda, 2016; Tang et al., 2018; Truong-Lam et al., 2020). The above-mentioned controversial statements might be related to the varying formation time (Du et al., 2023), pressure, and temperature conditions (Aladko et al., 2002; Schicks et al., 2006), gas supply conditions (Uchida et al., 2004; Hester et al., 2007; Klapproth et al., 2019) as well as their phase states (Cai et al., 2022). Cage occupancy and gas composition of CH4-C3H8 mixed gas hydrates during the formation were also extensively investigated. It was shown that C3H8 accumulates in the hydrate phase and that the C3H8 content in the resulting hydrate phase is 5-10 times higher than that in the feed gas phase (Schicks and Luzi-Helbing, 2015; Medvedev et al., 2015; Du et al., 2023). CH4 occupied the cages of both types (Ripmeester and Ratcliffe, 1988; Susilo et al., 2008; Du et al., 2023), and the order of gas enclathration is CH4 in 512 ≫ CH4 in 51264 and C3H8 in 51264 as the formation of CH4-C3H8 mixed hydrate proceeds (Schicks and Luzi-Helbing, 2013; Truong-Lam et al., 2020). Susilo et al. (2008) demonstrated that CH4 enters the large cage only when its content in the gas phase is 95% or higher, and the occupancy of CH4 in both small and large cages is closely related to temperature. Moreover, Hoshikawa et al. (2018) confirmed that C3H8 completely occupied the large 51264 cages when the CH4-to-C3H8 ratio reaches 2:1 in the feed gas phase. Above studies revealed the microscopic view of CH4-C3H8 mixed gas hydrates formation process and showed that C3H8 plays an essential role. However, most of the current research lacks investigations involving natural sediments. Factors such as sediments surface characteristics, mineralogical changes, particle size and the uneven distribution of particle size in natural sediments jointly affect the formation of gas hydrates (Heeschen et al., 2016; Kumari et al., 2021a, b). It is uncertain which of the above conclusions is consistent with the actual formation of CH4-C3H8 mixed gas hydrates in natural sediments.
The mineral content, grain size and lithology are crucial in natural gas hydrate formation (Xie et al., 2024). Gas hydrate saturation is usually higher in coarse-grained sediments, mainly composed of 98.5% quartz, compared to fine-grained sediments such as muds (Lu et al., 2004, 2004, 2008). However, the current perspectives on how the particle size of coarse-grained sediments affects gas hydrate formation kinetics are inconsistent (Qin et al., 2021). These discrepancies mainly result from the influences of capillary forces and specific surface area on fluid flow (Hills et al., 1996; Duan et al., 2011). Apart from coarse-grained sediments, marine muddy sediments are capable of storing a tremendous amount of gas hydrates (Terzariol et al., 2020; Zhang et al., 2020). Clay particles, often being a key component of muds, are primarily consisting of montmorillonite, illite, kaolinite or chlorite, which inevitably affect the formation of natural gas hydrates (Peng et al., 2020). Clay particles, especially illite, improved the water conversion rate (Feng et al., 2023). In mixtures of mud and coarse-grained sediments, it could be shown that the initial hydrate growth was significantly faster in quartz sand containing kaolin compared to Bentheim sandstone and pure quartz sand (Bello-Palacios et al., 2021). Other studies showed that methane hydrate formation is hindered by silica sand but promoted by bentonite clay (Riestenberg et al., 2003; Saw et al., 2015). In contrast, Kumar et al. (2015) found that high clay content in sediments reduces void spaces, hampers mass transfer of hydrate-forming gases, and slows down water-to-hydrate conversion. However, recent studies mainly focus on CH4 hydrates and they predominantly utilize artificial sediment samples, which may diverge significantly from natural sediments. Significantly, natural deep-sea sediments, such as those found in the Indian Ocean, Blake Ridge, Northwest Atlantic, the Limpopo Corridor, and the South China Sea, contain numerous biological shells like foraminifera-rich sand (Zhang et al., 2018, 2020; Bai et al., 2022; Lopes et al., 2023). Muddy reservoirs rich in foraminifera-rich sand typically exhibit high hydrate saturation, as many foraminifera feature empty chambers and larger particle sizes compared to regular sand particles (Yang et al., 2017b; Li et al., 2019; Wang et al., 2021; Bai et al., 2022). Foraminifera-rich sand is a special but widely distributed kind of sedimentary particle. However, what role does the complex mineral composition of mud and foraminifera-rich sand play on the formation of CH4-C3H8 mixed gas hydrates remain unrevealed.
In this study, we investigated the formation process of CH4-C3H8 mixed gas hydrates in natural marine mud and foraminifera-rich sand from the South China Sea by ex situ and in situ Raman spectroscopic measurements. The morphology, crystalline structure, gas composition and large-to-small cavity ratio of CH4-C3H8 mixed gas hydrates in different sediments were compared and the effects of sediment properties on the formation process were revealed. The results of these experiments enhance our understanding of how the interactions of mud and foraminifera-rich sand with gas hydrates impact the marine ecosystem, offering valuable knowledge for the development of effective strategies for carbon storage.
Raman spectroscopy is a molecular spectroscopic technique that utilizes the interaction of light with matter to gain insight into a structure or properties of a material. For all Raman spectroscopic measurements in this study, we used a LabRAM HR Evolution dispersive Raman spectrometer from Horiba Scientific coupled to an open microscope Olympus BXFM. The Raman spectrometer is equipped with two gratings 1800 grooves/mm and 600 grooves/mm. The used laser source was a frequency-doubled Nd: YAG solid-state laser with an output power of 100 mW (max. ∼ 48 mW at the sample surface) working at 532 nm. With a focal length of 800 mm, this spectrometer achieves a maximum spectral resolution (grating 1800 grooves/mm) of 0.5 cm−1. A motorized pinhole in the analyzing beam path enables to define the analyzed volume in z-direction. For the measurements, a confocal pinhole of 100 µm was chosen. For this study, we used a long-working distance objective (Olympus LMplanFLN 20×, NA = 0.4) that has an optimum spatial resolution of 1.6 μm in planar and 6.2 μm in the z direction. With this confocal system, it is possible to analyze defined areas of hydrate crystals not only in the x-y direction, but also in the z direction. Acquisition times of 6 s and three average exposures were defined during the measurements for obtaining a good signal-to-noise ratio for the Raman spectra. For the calibration of the Raman spectrometer with regard to the position of the Raman bands, a silicon chip was used. The composition of hydrate phase can be well determined using Raman spectroscopy, as shown in Table 1. The Raman bands at 2917 cm-1 and 869 cm-1 are assigned to CH4 molecules and C3H8 molecules in the gas phase, respectively (Pan et al., 2023). However, the position of the Raman bands for CH4 in the gas phase and CH4 enclosed in the 512 cages of hydrate phase are relatively close to each other as shown in Figure 1B. In addition, the inclusion of the CH4 molecules into the hydrate structure results in a significant broadening of the Raman band compared to the Raman band of the gaseous CH4. Both aspects result in an overlap of the Raman bands, which can distort semi-quantitative evaluation, especially at low intensities. This problem cannot be completely solved even by using a confocal system for the in situ measurements and must be taken into account in the analysis and interpretation of the data (Pan et al., 2023). Therefore, to obtain accurate information on CH4-C3H8 mixed gas hydrate in natural marine sediments, we jointly employed in situ Raman spectroscopic investigations and ex situ Raman spectroscopic measurements, which help exclude the effects of the gas phase for further analysis.
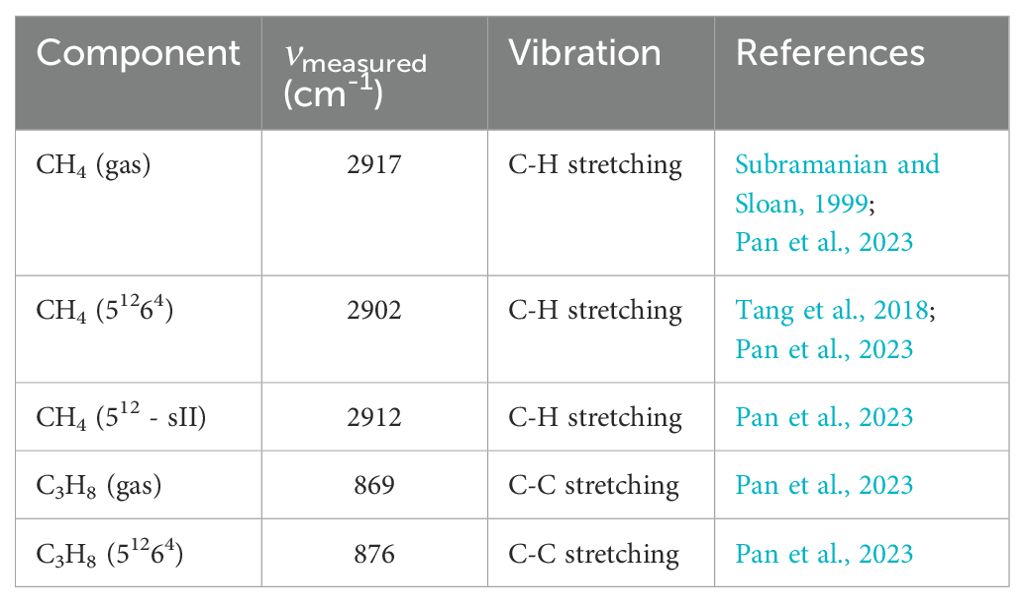
Table 1. Raman bands and assignments for the studied components in gas and hydrate phases.
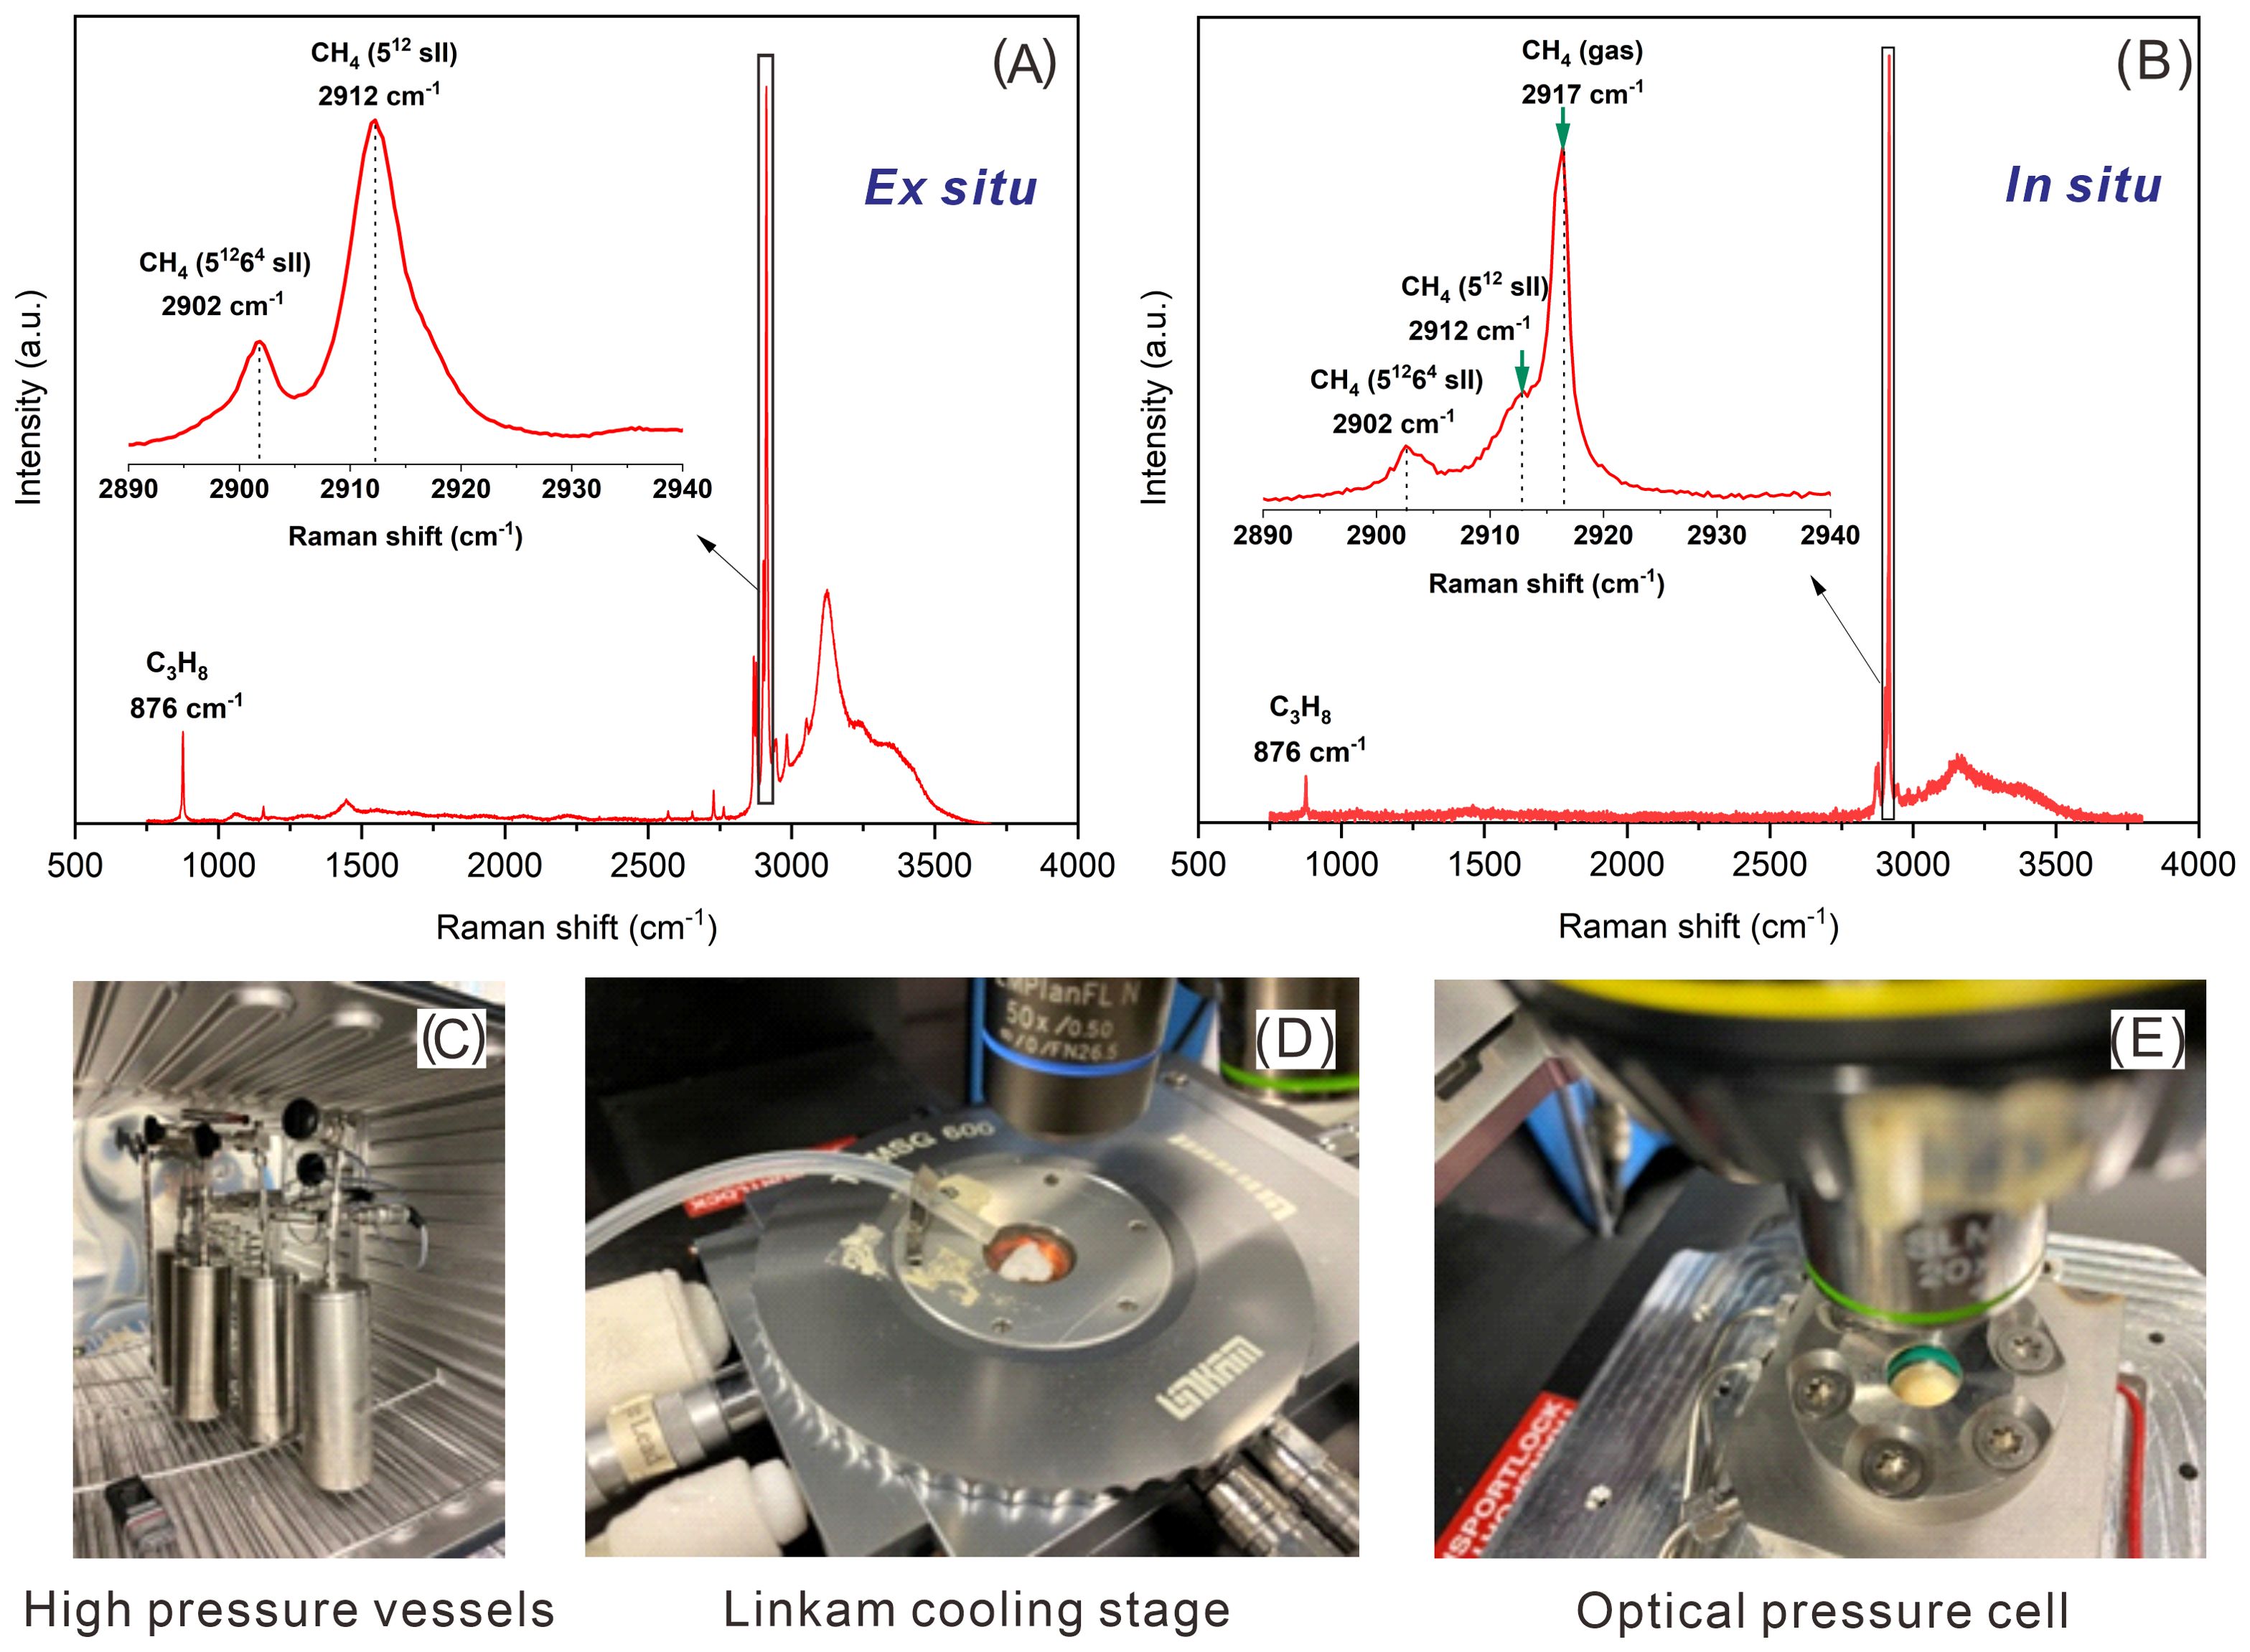
Figure 1. (A) Raman spectra obtained from ex situ Raman measurements showing C-C stretching vibrations for C3H8 molecules encased in the (51264) cavities at 876 cm-1, those of CH4 molecules encased in the large (51264) cavities (2902 cm-1), and in the small (512) cavities (2912 cm-1) of sII hydrates. (B) Raman spectra obtained from in situ Raman measurements showing C-C stretching vibrations for C3H8 molecules encased in hydrate cavities at 876 cm-1, CH4 molecules encased in the large (51264) cavities at 2902 cm-1, and in the small (512) cavities at 2912 cm-1, as well as the CH4 molecule in the gas phase at 2917 cm-1. (C) Gas hydrates are formed with natural sediments in high pressure vessels. (D) The Linkam cooling stage with samples used for ex situ Raman measurements. (E) The customized optical pressure cell with samples for in situ Raman measurements.
A major advantage of in situ Raman measurements is the observation of a time-resolved formation process of gas hydrates. Here, an optical pressure cell was used for in situ analysis (Figure 1E). This sample cell is made from Hastelloy with an inner sample space volume of about 550 μl. It can be run in a temperature range between 263 K and 295 K and a pressure range between 0.1 MPa and 10 MPa. The pressure is regulated with an ER 3000 pressure regulator with a precision of 2% rel. The real-time pressure inside the vessel can be continuously monitored by an additional pressure sensor located at the pressure vessel using catmanEasy V4.2.2 software. The bottom of the cell body is used for cooling with a Peltier cooler. The temperature of cell can be adjusted with a precision of 0.1 K. A transparent quartz window with a diameter 18 mm supports microscopic observation of the processes in the sample chamber and in situ Raman spectroscopic investigations. Further details of the Raman spectrometer and the pressure cell for in situ investigations of micro-scale processes in gas hydrates are described in Schicks et al. (2020).
The ex situ Raman observation is only possible after gas hydrates formed and recovered from the high-pressure vessel (Figure 1C) and transported to a Linkam cooling stage (Figure 1D), which allows for retaining the gas hydrate samples at the target temperature (T = 173.15 K) using liquid nitrogen for cooling.
There are abundant gas hydrate resources in the northern continental slope of the South China Sea (Zhang et al., 2020). Since 2007, a number of gas hydrate drilling projects have been carried out in the South China Sea by Guangzhou Marine Geological Survey (GMGS) of the China Geological Survey and a large number of gas hydrate samples have been recovered. The analysis of the gained data confirmed that the hydrate-bearing reservoirs are located at the interfluve of a long-slope-migrating submarine canyons and characterized by silty clay and clayey silt (Wang et al., 2023). Foraminifera fossils were commonly found in the gas hydrate-bearing reservoirs in the South China Sea (Zhang et al., 2020; Wang et al., 2020). In this study, five unconsolidated sediments from different burial depths were investigated (Table 2; Figure 2): In 2019, the China Geological Survey collected Sediments 1, 2, 3, and 5 at depths of 0-360 cm below the seafloor from potential hydrate-bearing areas in the Dongsha region of the South China Sea (Figures 2B–E). Sediment 1 (Figure 2B), from a depth of 40-46 cm below the seafloor, is composed of clean foraminifera-rich sand. Sediment 2 (Figure 2C), from a depth of 50-52 cm below the seafloor, consists of a mixture of foraminifera-rich sand and mud. Sediment 3 (345-360 cm below the seafloor, Figure 2D) and Sediment 5 (0-100 cm below the seafloor, Figure 2E) are made up of silt and clay. Additionally, Sediment 4 (Figure 2A), composed of silt and clay, was collected in 2016 from the Shenhu area of the South China Sea, near the hydrate-bearing layer, at a depth of 140.25 m.
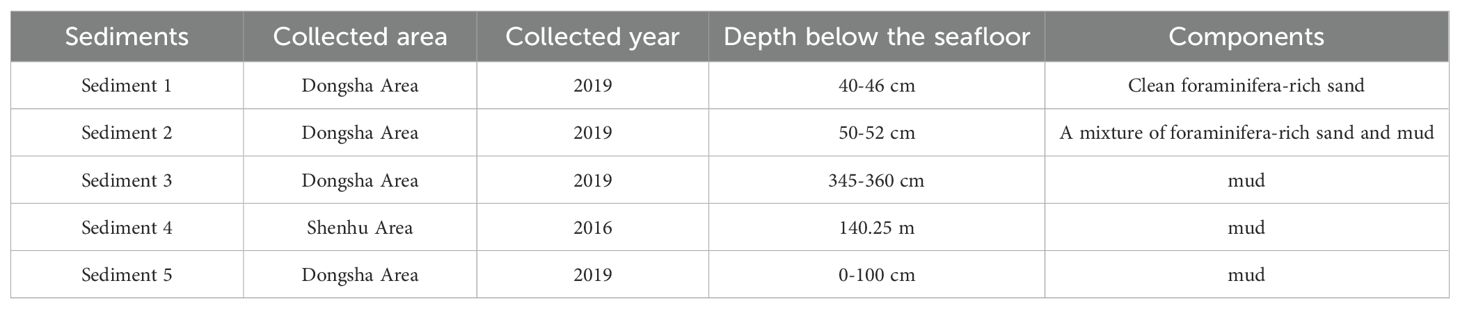
Table 2. Information of five sediments.
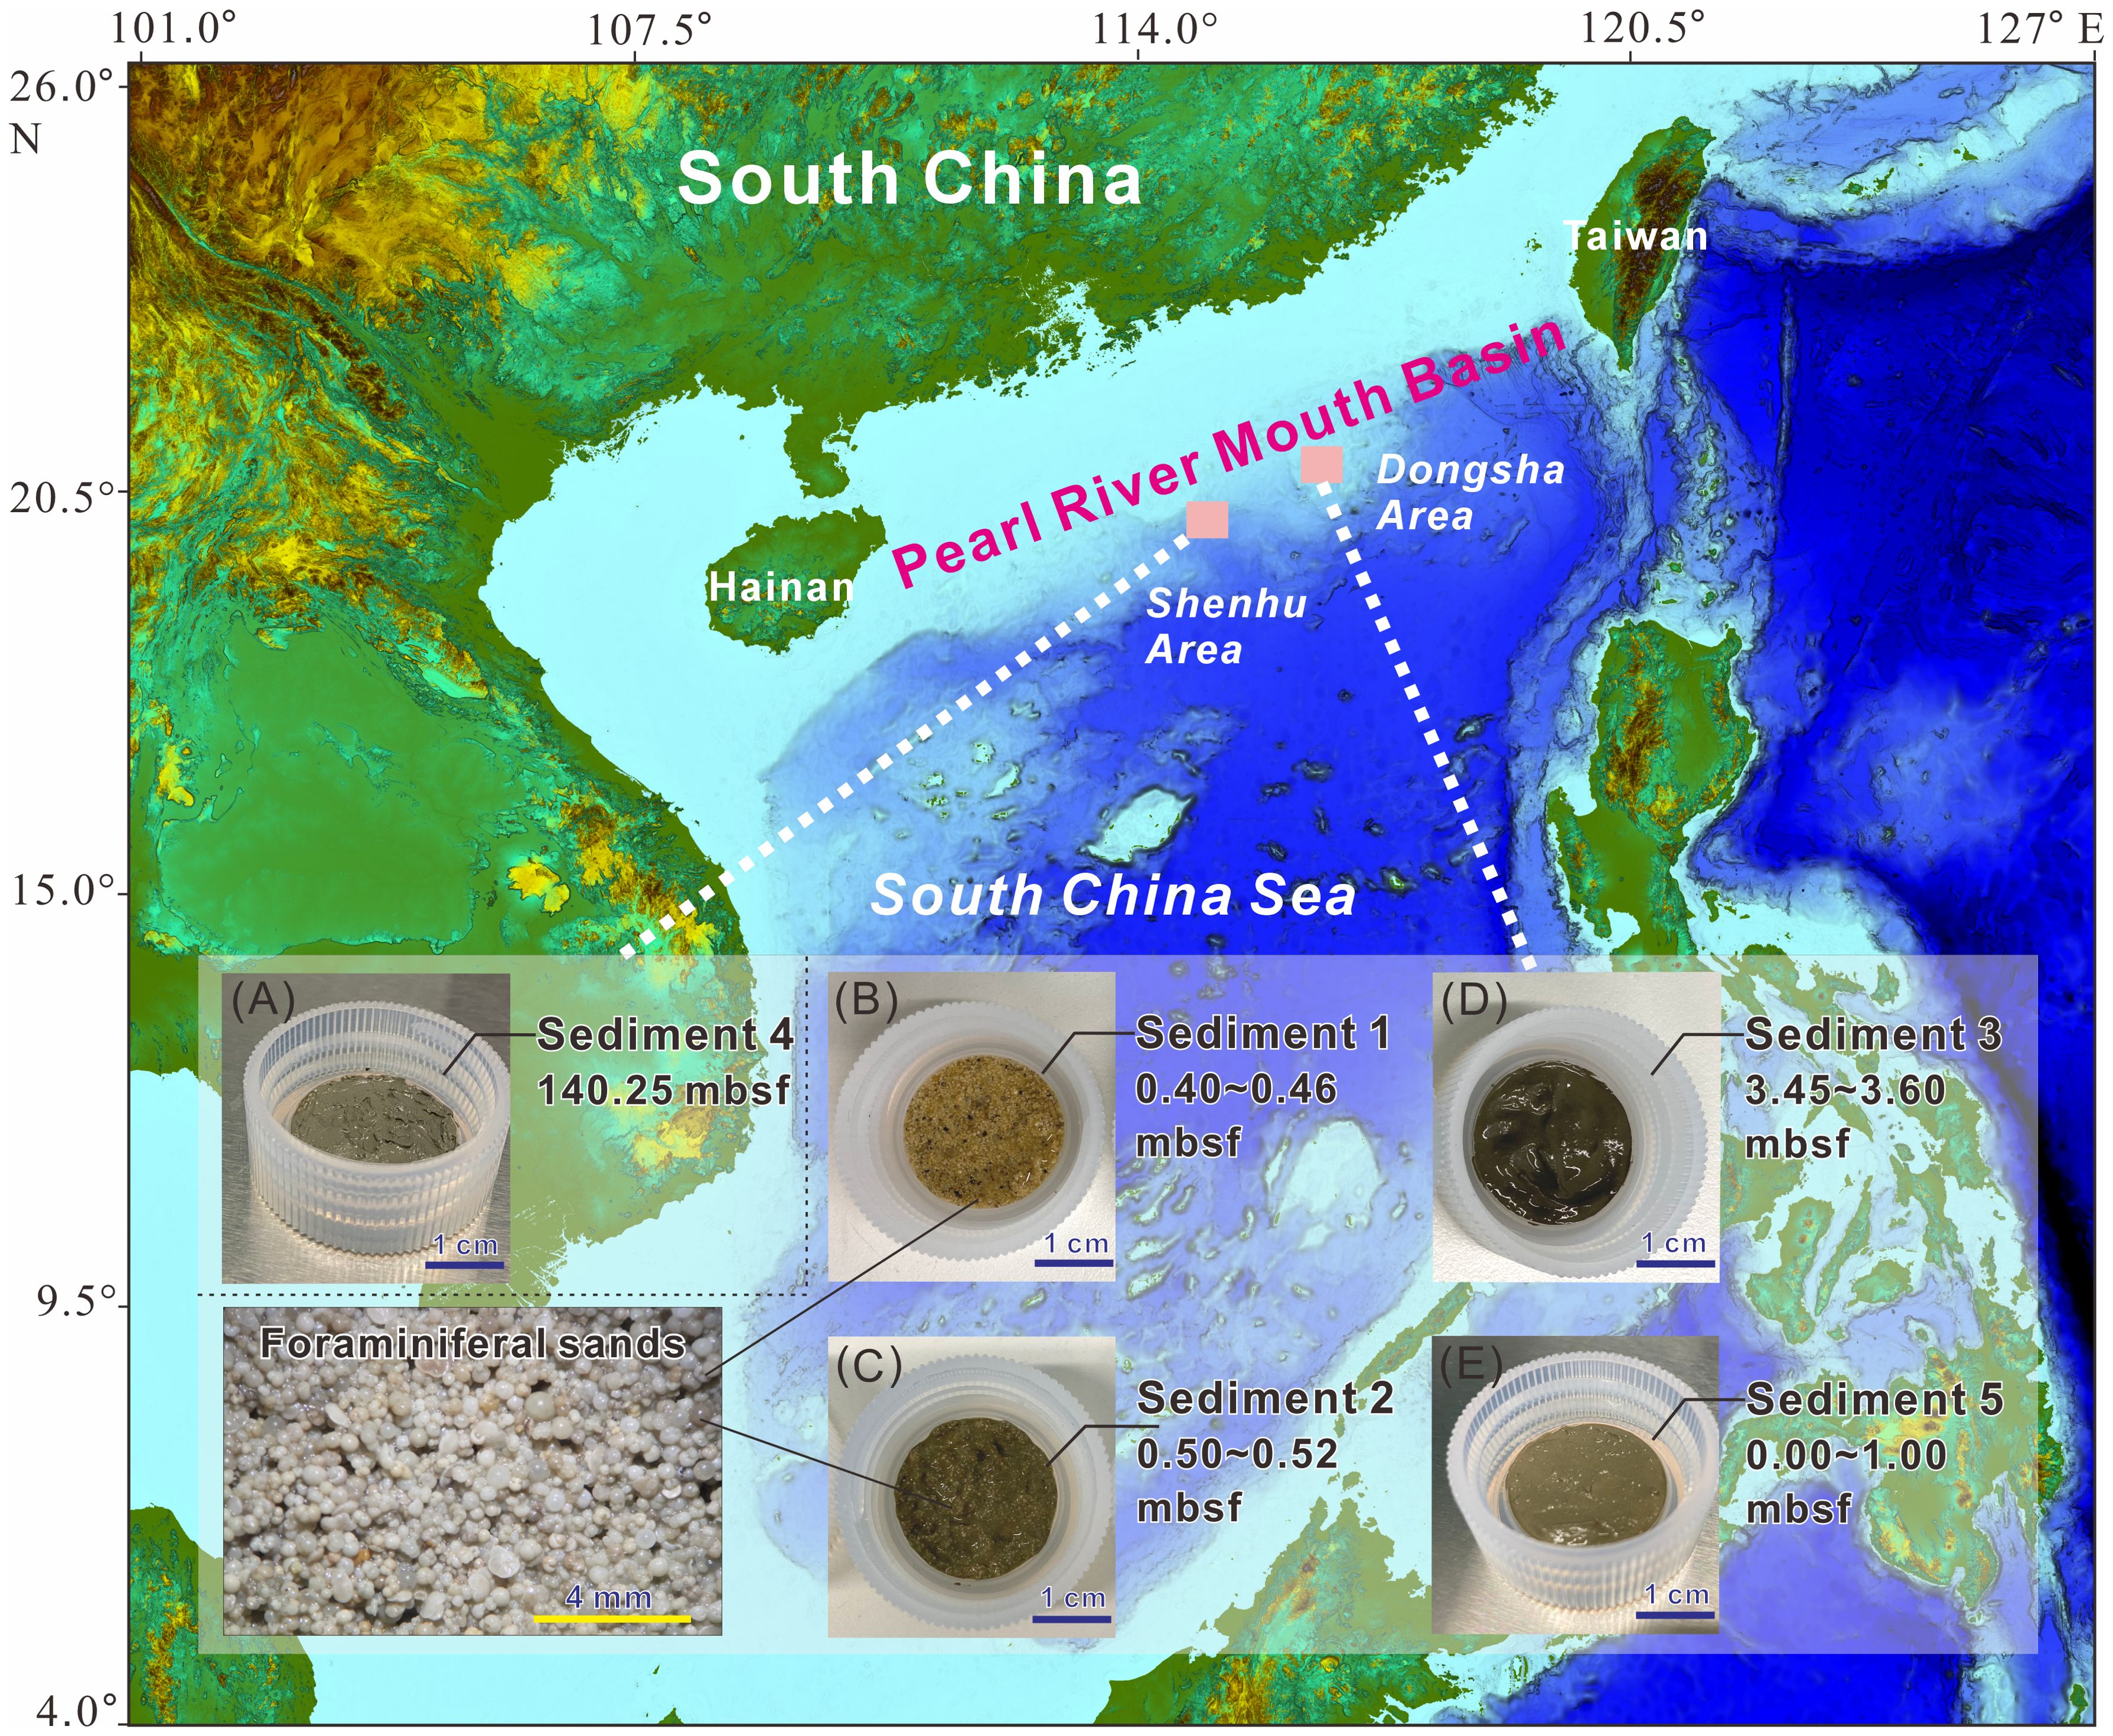
Figure 2. Sediment 1: Clean foraminifera-rich sand (B); Sediment 2: Mud and foraminifera-rich sand mix (C); Sediment 3: mud (D); Sediment 5: mud (E); Sediment 4: mud (A) from the South China Sea (mbsf: meters below sea floor). The enlarged image is a photograph of foraminifera taken under a microscope. High-resolution images of the sediments are presented in Supplementary Figure S1 in the Supplementary Materials.
The analysis of mineral composition and particle size were carried out at Qingdao Institute of Marine Geology, China Geological Survey. Particle size and mineral composition of sediments were analyzed using a Mastersizer 2000 laser diffraction particle size analyzer and a D/Max 2500 X-ray diffractometer, respectively. The detailed particle size distribution of five sediments is shown in Supplementary Figure S2 in the Supplementary Materials. According to the division of sediments by Krumbein, 1934, 1936 (i.e. sand: < 4Φ; siltstone: 4-8 Φ; clay: > 8Φ), the results of particle size analysis of the sediment samples indicated that Sediment 1 mainly consists of sand and silt (Figure 3A). Sediment 2 mainly consists of silt, and small amounts of sand and clay. Sediment 3, Sediment 4 and Sediment 5 mainly consist of silt and clay, and small amounts of sand. Please note that Sediment 3 has a sand content of about 4% which is slightly higher as compared to Sediments 4 and 5. Accordingly, sediment 1 is named as clean foraminifera-rich sand. Sediment 2 is named as a mixture of foraminifera-rich sand and mud. Sediments 3-5 are named as mud. Moreover, the detailed mineral composition is presented specifically in Figures 3B, C.
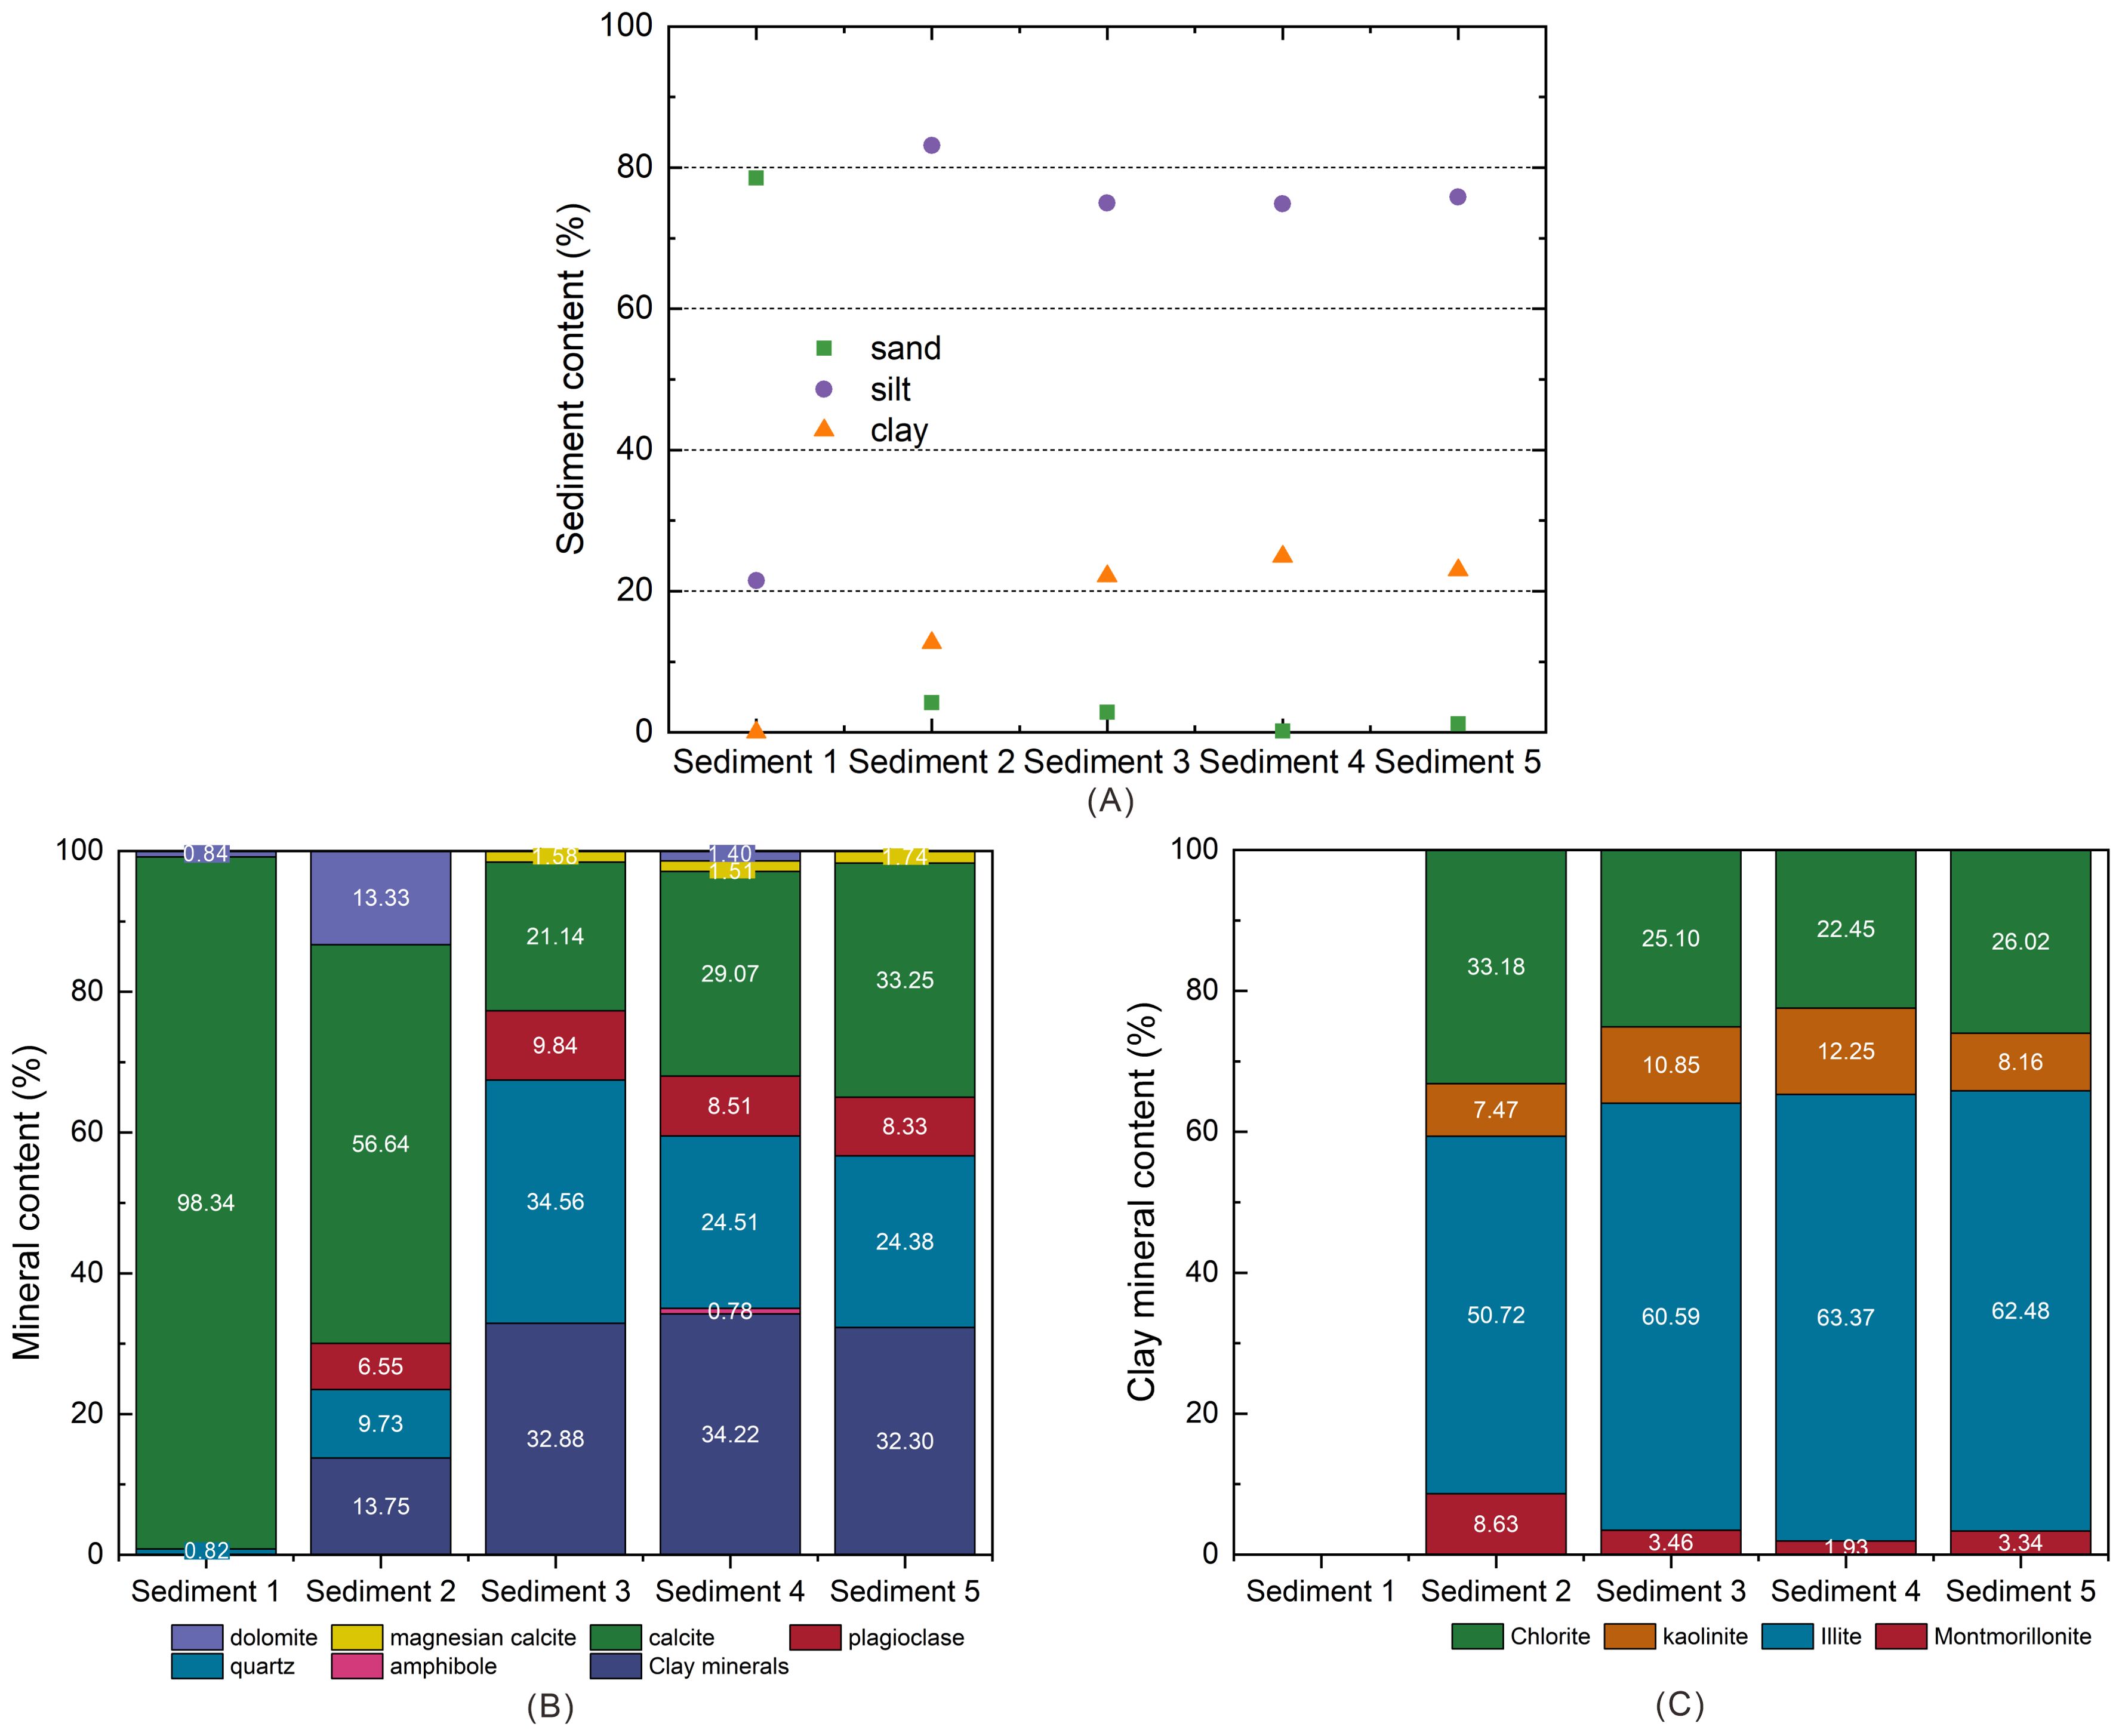
Figure 3. (A) Sand, silt, and clay content, (B) mineral content; and (C) clay mineral content of five natural marine sediments.
Gas hydrates were formed using a synthetic and certified gas mixture ordered from Riessner-Gase in Germany. Nevertheless, the composition of the gas mixture in the cylinder is supposed to change over time, therefore the exact gas composition was measured before and during each experimental run. The vapor phase composition before stated experiments is about 96 mol% CH4 and 4 mol% C3H8 by calculating the average value from the integrated intensities of obtained Raman bands (Supplementary Table S1 in the Supplementary Materials). This gas phase composition referenced the actual gas phase composition of natural gas in the South China Sea (Ye et al., 2019).
Before the ex situ Raman measurements, five different sediment samples with the same water-to-sediment weight ratio (1.4: 1) were placed in high-pressure vessels (Figure 1C). This value was chosen to closely reflect the actual conditions of seafloor sediments being in a saturated water state. Detailed weight of sediments and water, as well as dry conditions and the calculation process are listed and presented in Supplementary Table S2 in the Supplementary Materials. The pressure vessels were pressurized to ~10 MPa with the CH4-C3H8 mixture and placed in the cooling freezer (temperature cycling between 272 K and 274 K). The pressure and temperature changes in the vessels were continuously recorded. After 10-13 weeks, no changes in pressure were detected. At this stage, we assumed that the water was completely converted into gas hydrates. The formed gas hydrates were recovered and transported into the Linkam cooling stage maintained at 173.15 K (Figure 1D) and placed under the microscope of the Raman spectrometer. During the ex situ Raman spectroscopic measurements, the laser beam was focused on the surface of different hydrate crystals formed in the natural sediments. For each run with a specific sediment, at least seven different hydrate crystals were analyzed to determine the hydrate composition and respective cage occupancy, minimizing data variability and accounting for sample inhomogeneity.
As for the in situ Raman measurements, sediments with the same water-to-sediment weight ratio (1.4: 1) were put into the optical pressure cell (Figure 1E). Detailed weight of sediments and water, as well as dry conditions and the calculation process are also listed in Supplementary Table S2 in the Supplementary Materials. After sealing the optical pressure cell, a continuous feed gas flow of 1 ml/min was operated. According to the calculation results of CSMHYD, the equilibrium conditions of CH4-C3H8 gas hydrates are at 5 MPa and 287.05 K. Therefore, in situ microscopic observations were performed at the conditions of 5 MPa and 278.15 K. During the continuous in situ observations, the surfaces of the selected hydrate crystals were analyzed focusing the laser beam at a fixed spot for ~5 days until the hydrate composition did not show further changes. On the last day, euhedral hydrate crystals with a clear shape were purposefully measured because they are considered as stable crystals.
In this study, four in situ Raman measurements and two ex situ Raman measurements were conducted for each sample to ensure the credibility of the data.
The molar composition in the gas and hydrate phases were calculated from Raman spectra on a semi-quantitative basis. The calculation method was used as described in Beeskow-Strauch et al. (2011). The molar fraction of one component in a mixed system can be calculated using the following simplified Equation 1, based on Placzek’s ratio method (Placzek, 1934), because the integrated intensities of the Raman bands of the components are proportional to the number of molecules presented in the sample.
where Xa, Aa, , and are, the molar fraction of component a, the integrated intensity of the Raman band of component a, the Raman scattering cross-section factor of component a and instrumental efficiency, respectively. The index i and Σ represent the appropriate values for all species present in the sample and their sum, respectively.
The Raman band areas were corrected with wavelength-independent cross-section factors. The cross-section factors is assumed not to change with pressure, cage type, or the overall composition of the phases (Schrötter and Klöckner, 1979; Schrader, 1995; Burke, 2001). In this study, the relative Raman scattering cross-section factors employed are 8.55 () and 1.60 () for CH4 and C3H8, respectively (Schrader, 1995; Burke, 2001).
The calculation of the large-to-small cavity ratio was obtained from Raman measurements using Equation 2. It considers that CH4 occupies both small 512 and large 51264 cavities of sII hydrate, whereas C3H8 exclusively occupies the large 51264 cavities.
where A represents the integrated intensity of a specific Raman band obtained from the Raman spectrum.
We acquired the morphology of gas hydrates using the microscope coupled in the Raman spectrometer system through both in situ and ex situ observations (Figure 4). A series of snapshots were taken using a digital camera mounted on the confocal microscope, to systematically study the morphological changes of the hydrate crystals during the experimental period. Figure 4A shows stable hydrate crystals formed in different sediments at t = 5 days under 5 MPa and 278.15 K, as measured by in situ Raman measurement. The changes in surface morphology during the formation process, obtained from in situ Raman measurements, are shown in Supplementary Figure S3 in the Supplementary Materials. Figure 4B presents stable hydrate crystals measured by ex situ measurement at 173.15 K and ambient pressure. It is important to note that the substances shown in Figure 4 are all hydrate crystals, with the sediment beneath the hydrate crystals.
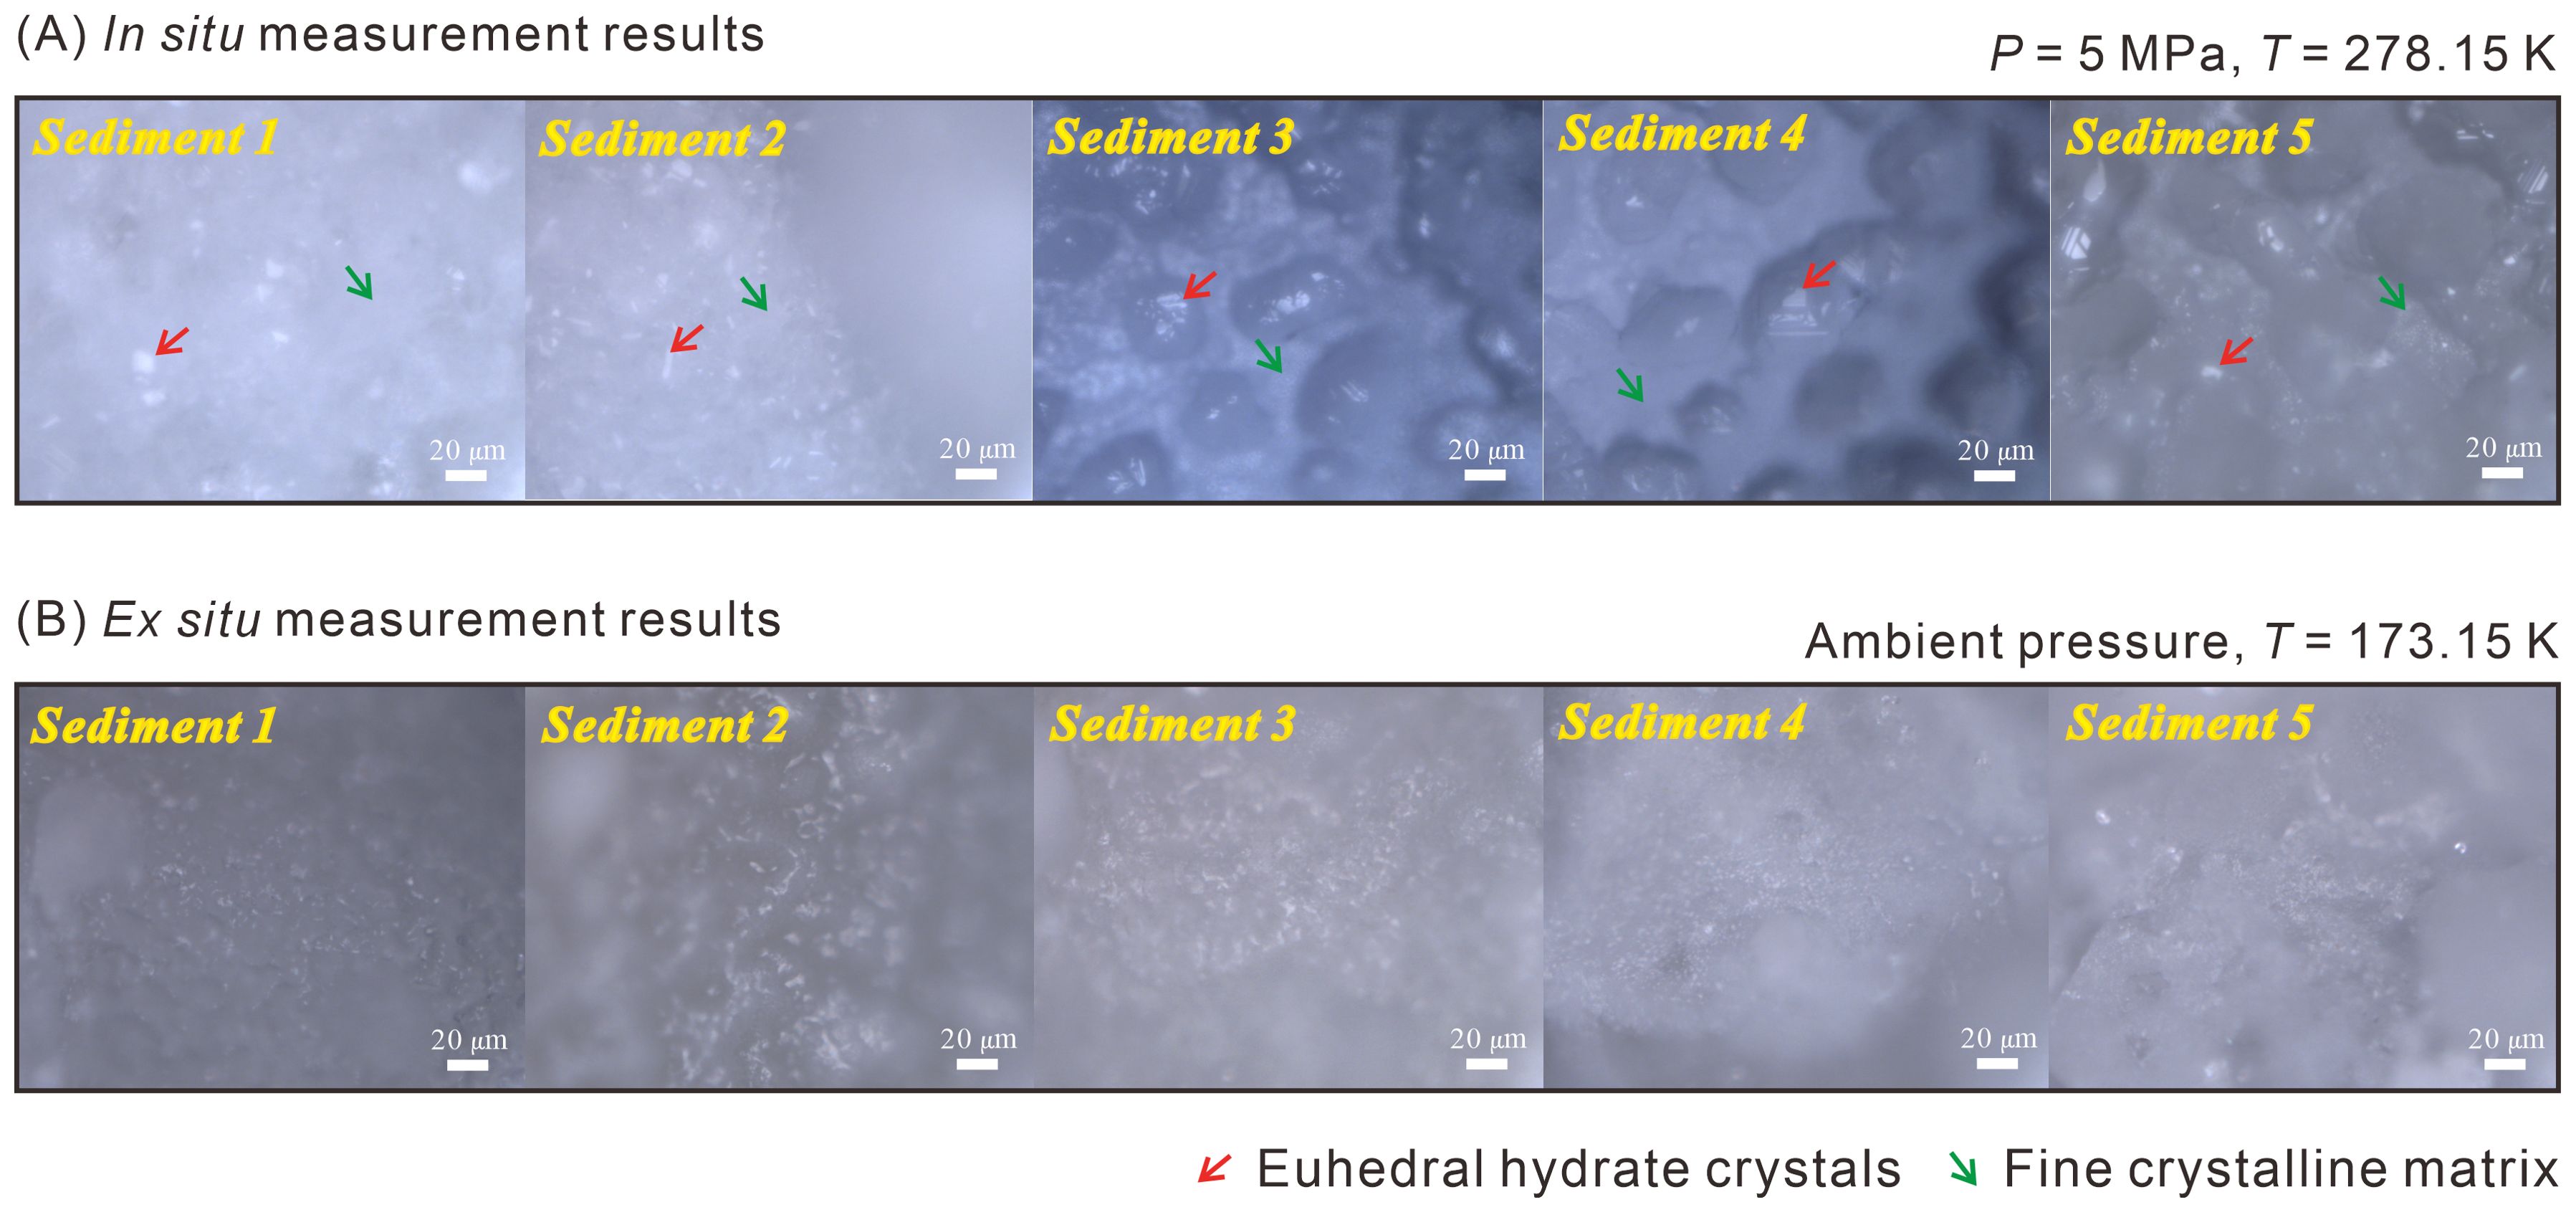
Figure 4. Morphology of stable hydrate crystals in Sediments 1-5 measured by (A) in situ measurements at 5 MPa and 278.15 K (euhedral hydrate crystals are pointed by red arrows, and the fine crystalline matrix is indicated by green arrows) and (B) ex situ measurements at 173.15 K and ambient pressure.
As the hydrate formation progresses, the size and shape of the euhedral hydrate crystals gradually increase (Supplementary Figure S3). There are two morphologies of hydrate crystals, including euhedral hydrate crystals (pointed by red arrows) and fine crystalline matrix (indicated by green arrows), appearing in the same sediments (Figure 4A, Supplementary Figure S3). However, the differences in gas composition and large-to-small cavity ratio of these two hydrate crystal types are not apparent during the hydrate formation, as shown in Supplementary Figure S4 in the Supplementary Materials. Another important observation is that the crystals formed in the sediments are less well-structured and sharp-edged as those formed by pure water and gas, as reported by Pan et al. (2023). This phenomenon indicates that the sediments show a significant effect on the morphology of CH4-C3H8 mixed gas hydrates.
It is worth noting that the morphology of hydrate crystals in different sediments appears indefinite which was the same when the ex situ Raman observations were employed (Figure 4B). In the ex situ Raman observations, a further effect complicated the analyses: since each measurement required a specific duration, the accumulation of condensed moisture on the surface of the samples significantly interfered with the Raman signals after a period of monitoring, thereby limiting the quality of the collected data and hindering further ex situ analysis. With the use of in situ Raman measurement device, the entire observation process was unaffected by environmental factors, enabling a clear determination the hydrate crystals morphology (Figure 4A, Supplementary Figure S3). Above phenomena directly demonstrate that in situ Raman measurements provide a relatively realistic morphology, which encourages the employment of this method to accurately observe gas hydrates formation in sediments at the microscopic level.
For a gas mixture containing C3H8 as well as CH4, the thermodynamically stable gas hydrate phase is a sII CH4-C3H8 mixed hydrate. Since the C3H8 molecule is too large to fit into a cage of the sI hydrate structure, only a simple sI CH4 hydrate could possibly form as a coexisting, metastable phase (Schicks et al., 2006). However, our in situ Raman spectroscopic analysis indicates that the structure of CH4-C3H8 mixed gas hydrates maintained throughout the formation process (Figure 5). Both, the Raman band at 876 cm-1 (corresponding to C3H8 encased into the large 51264 cavities of the sII hydrates) and the Raman bands at 2902 cm-1 and 2912 cm-1 (corresponding to CH4 encased into the 51264 and 512 cavities) indicate that a sII CH4-C3H8 mixed hydrate has formed. The Raman bands for the CH4 support this conclusion in two ways: 1) The positions of the bands are at 2902 cm-1 for CH4 encased in the 51264 cages and at 2912 cm-1 for CH4 encased in the 512 cages. For structure I hydrates, the positions for the Raman bands are at slightly higher wavenumbers, namely 2905 cm-1 for CH4 encased in the 51262 cages and 2915 cm-1 for CH4 encased in the 512 cages (Cai et al., 2022; Pan et al., 2023; Naeiji et al., 2023). 2) The ratios of the bands: for sI hydrates, the ratio of the integrated intensities of the Raman bands approaches 3:1 and thus corresponds to the ratio of the 51262 cages to the 512 cages in an sI hydrate (Cai et al., 2022). As shown in Figures 6 and 7, the quantity of CH4 in the large 51264 cavities was noticeably lower than that in the small 512 cavities. This supports the conclusion that only structure II hydrates were formed during the formation process in different sediments, with no coexisting structure I hydrate phase. The ex situ Raman measurement results also show that the crystallographic structure of completely formed hydrates in natural sediments was structure II, as shown in Figure 1A.
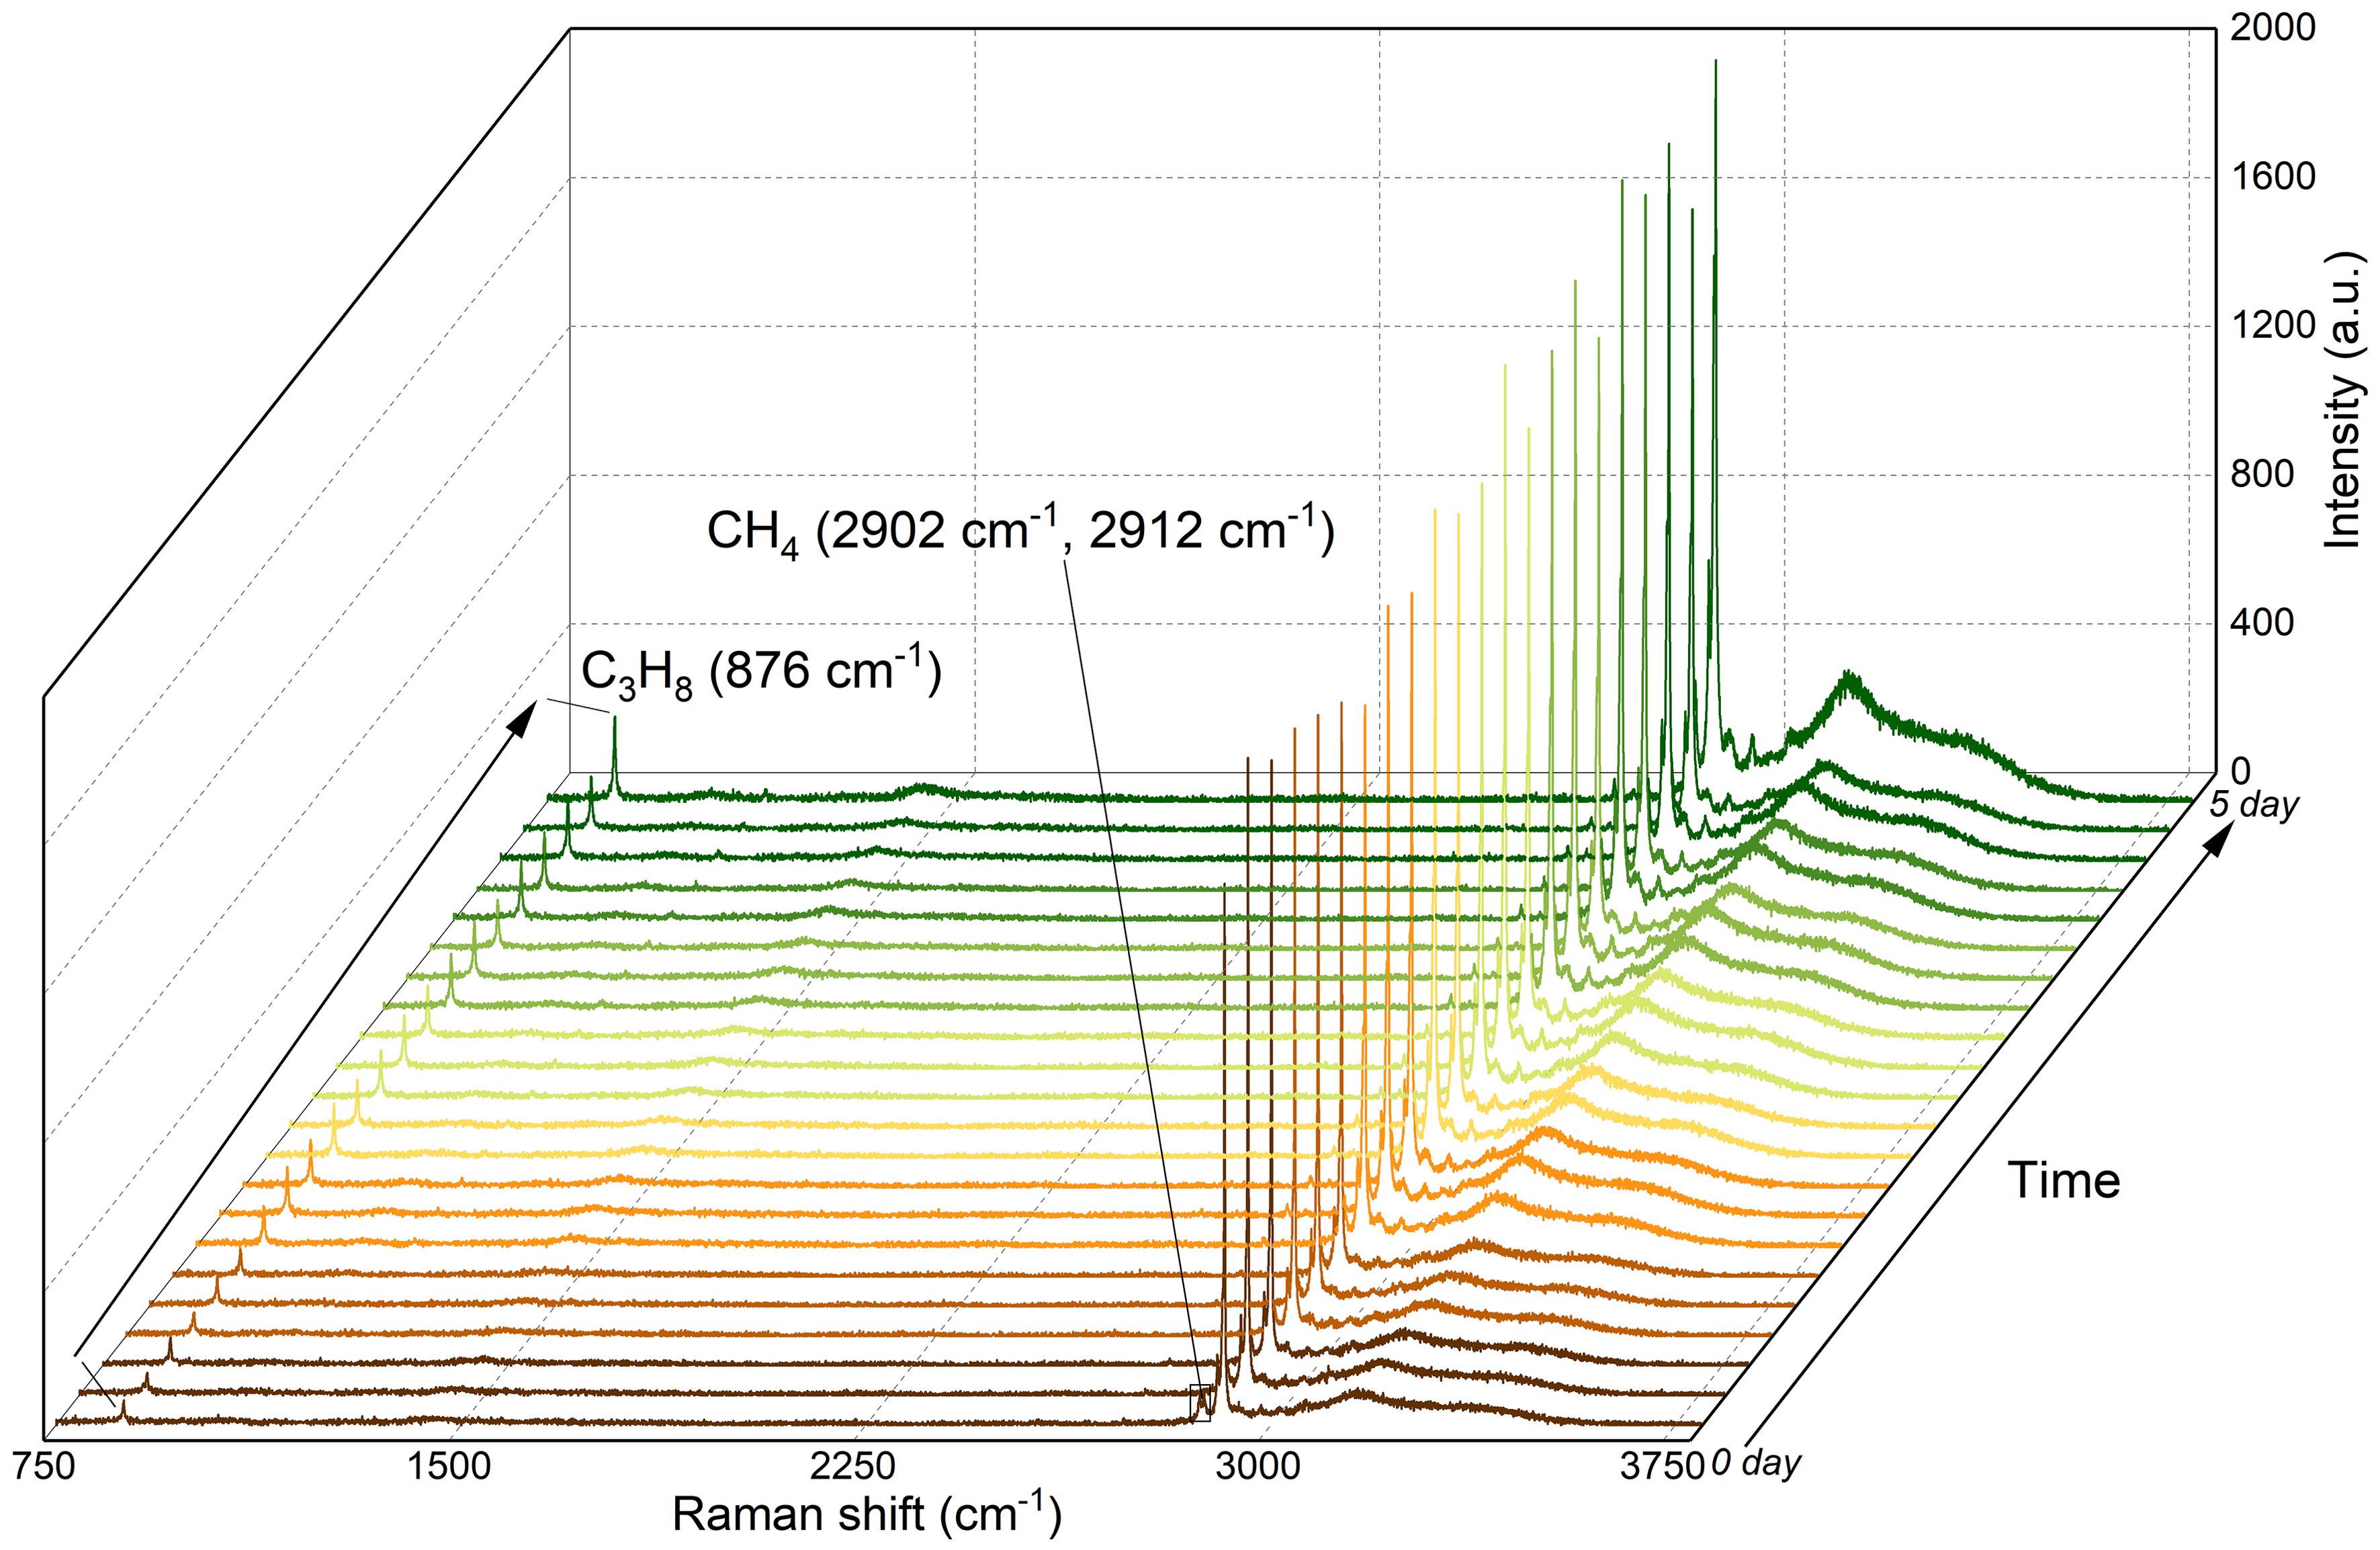
Figure 5. In situ Raman spectra of CH4/C3H8 mixed gas hydrates in Sediment 1 during formation at 5 MPa and 278.15 K over 5 days.
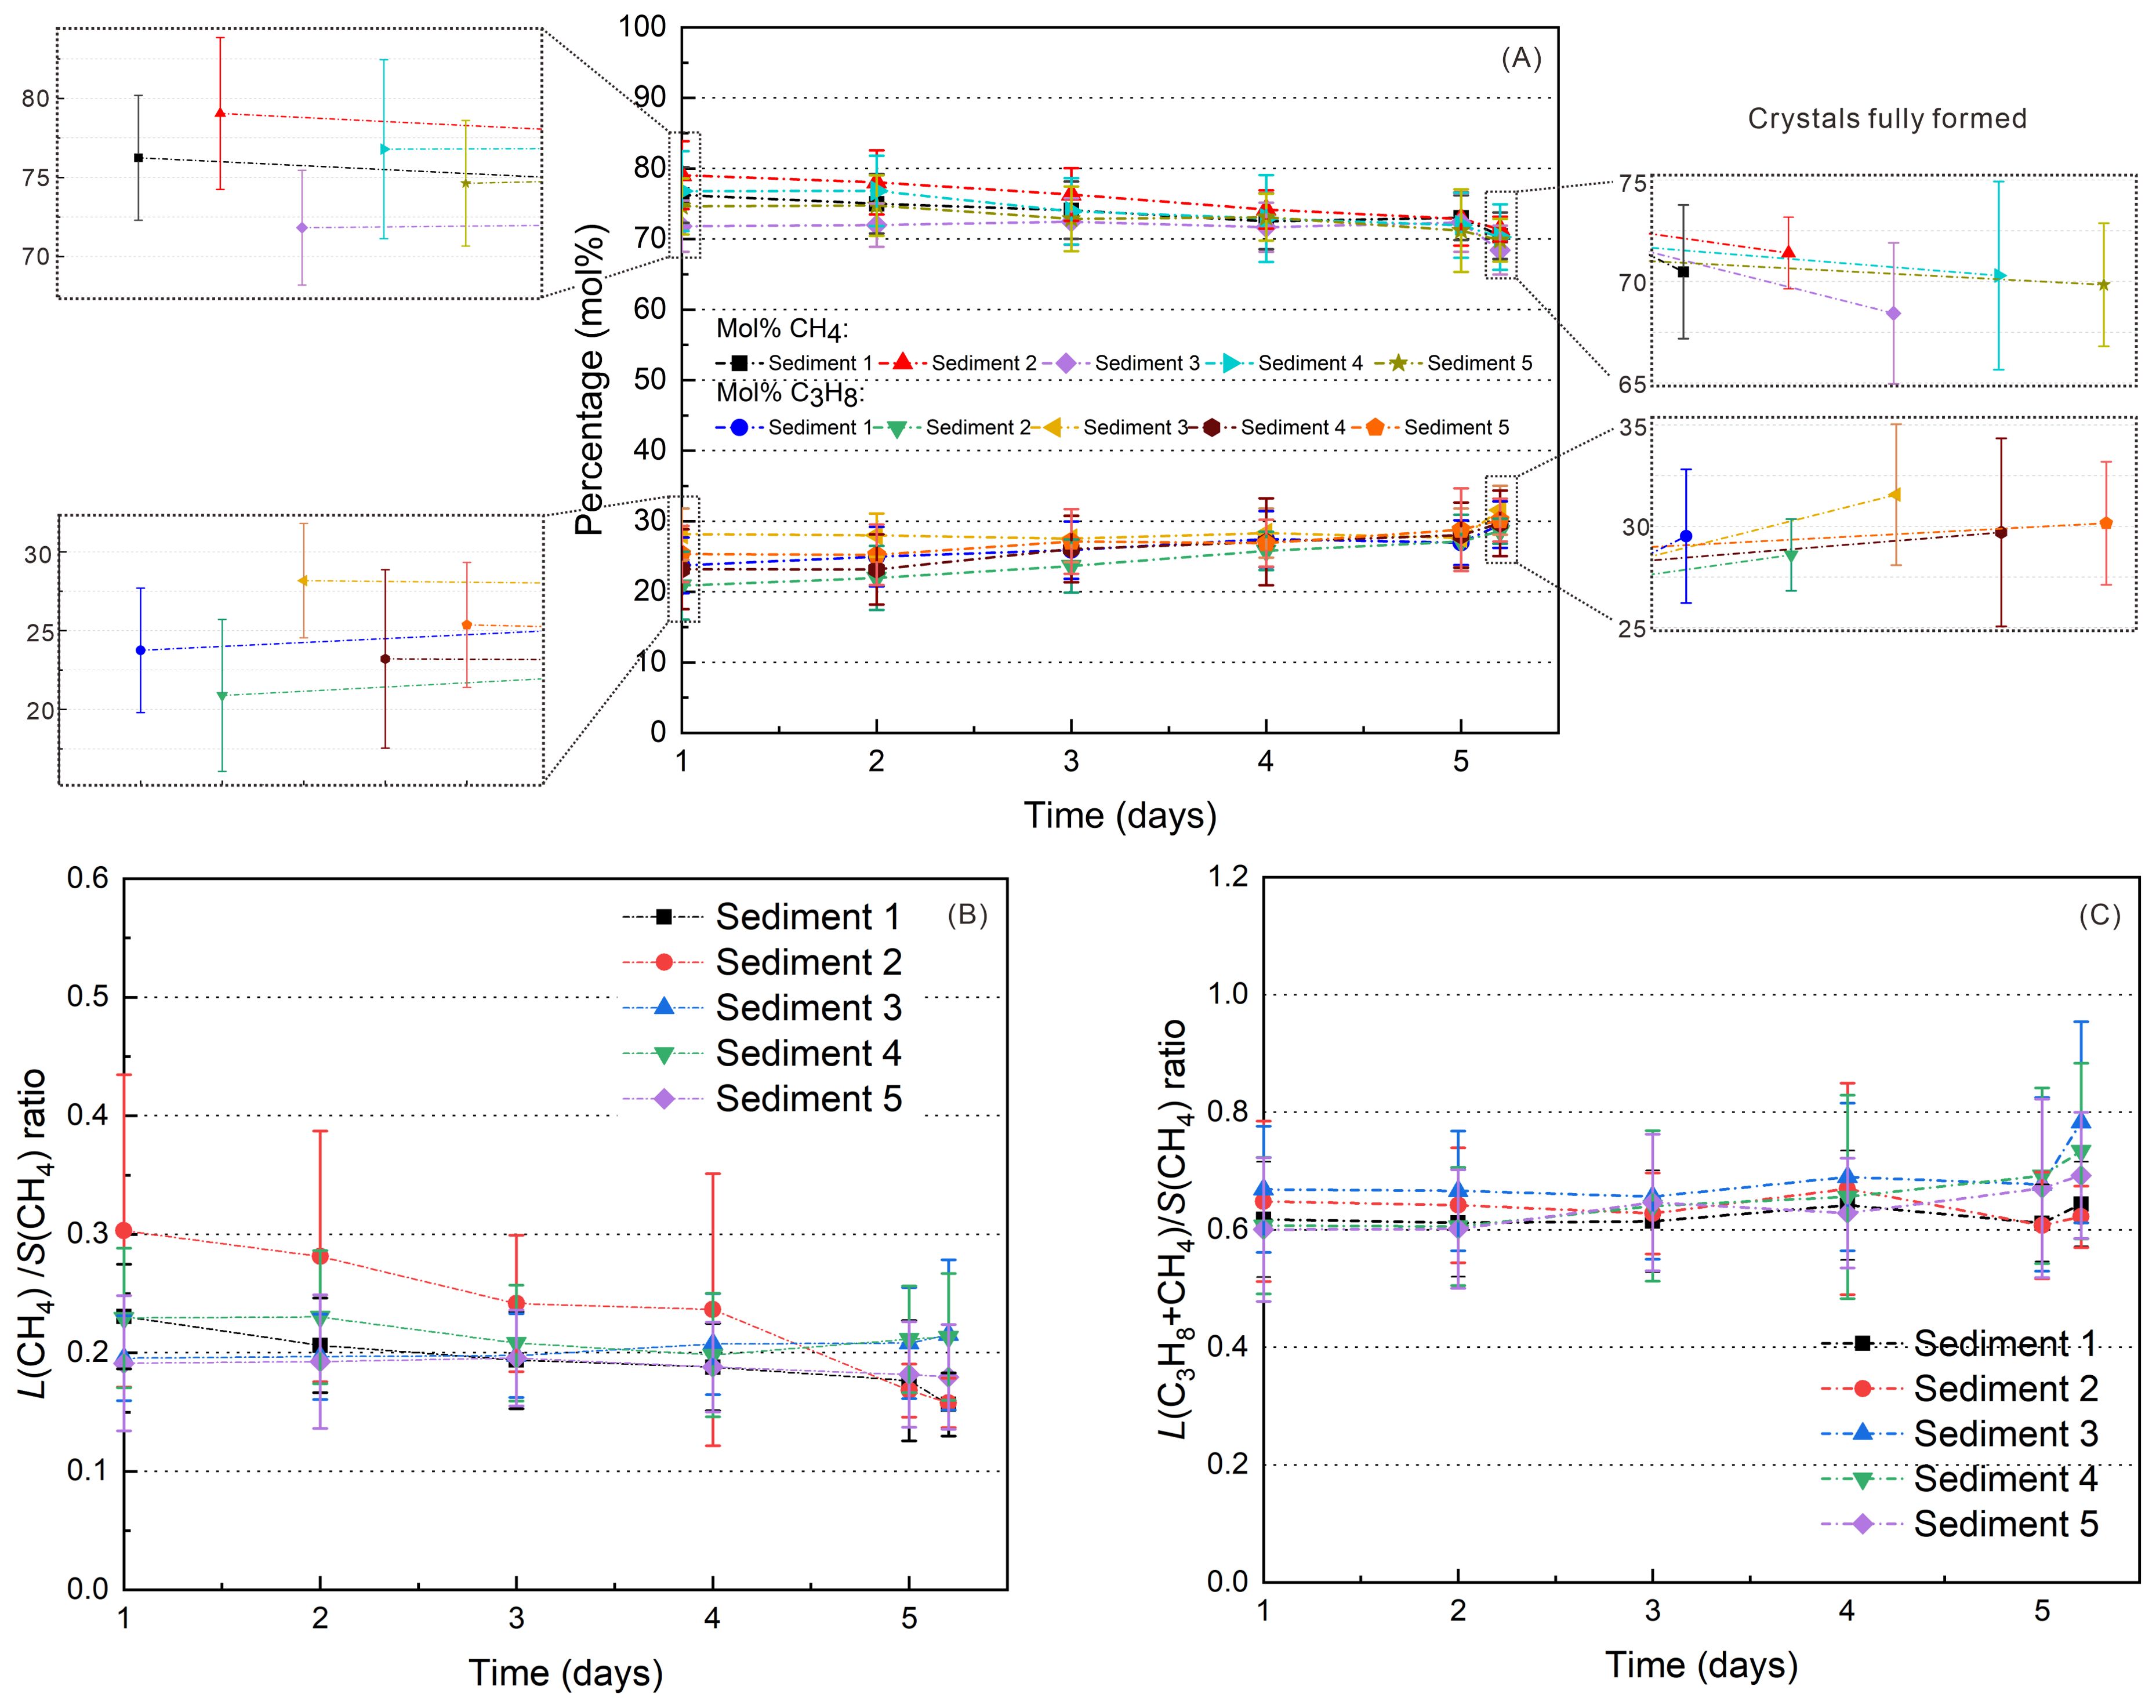
Figure 6. (A) Variations in the gas hydrate composition (mol%) throughout the formation process based on in situ Raman measurements of different hydrate crystals, (B) large-to-small cavity ratio for CH4 molecules; and (C) large-to-small cavity ratio for both CH4 and C3H8 molecules in the hydrate phase, as determined by in situ Raman measurements. The formation process was maintained at 5 MPa and 278.15 K.
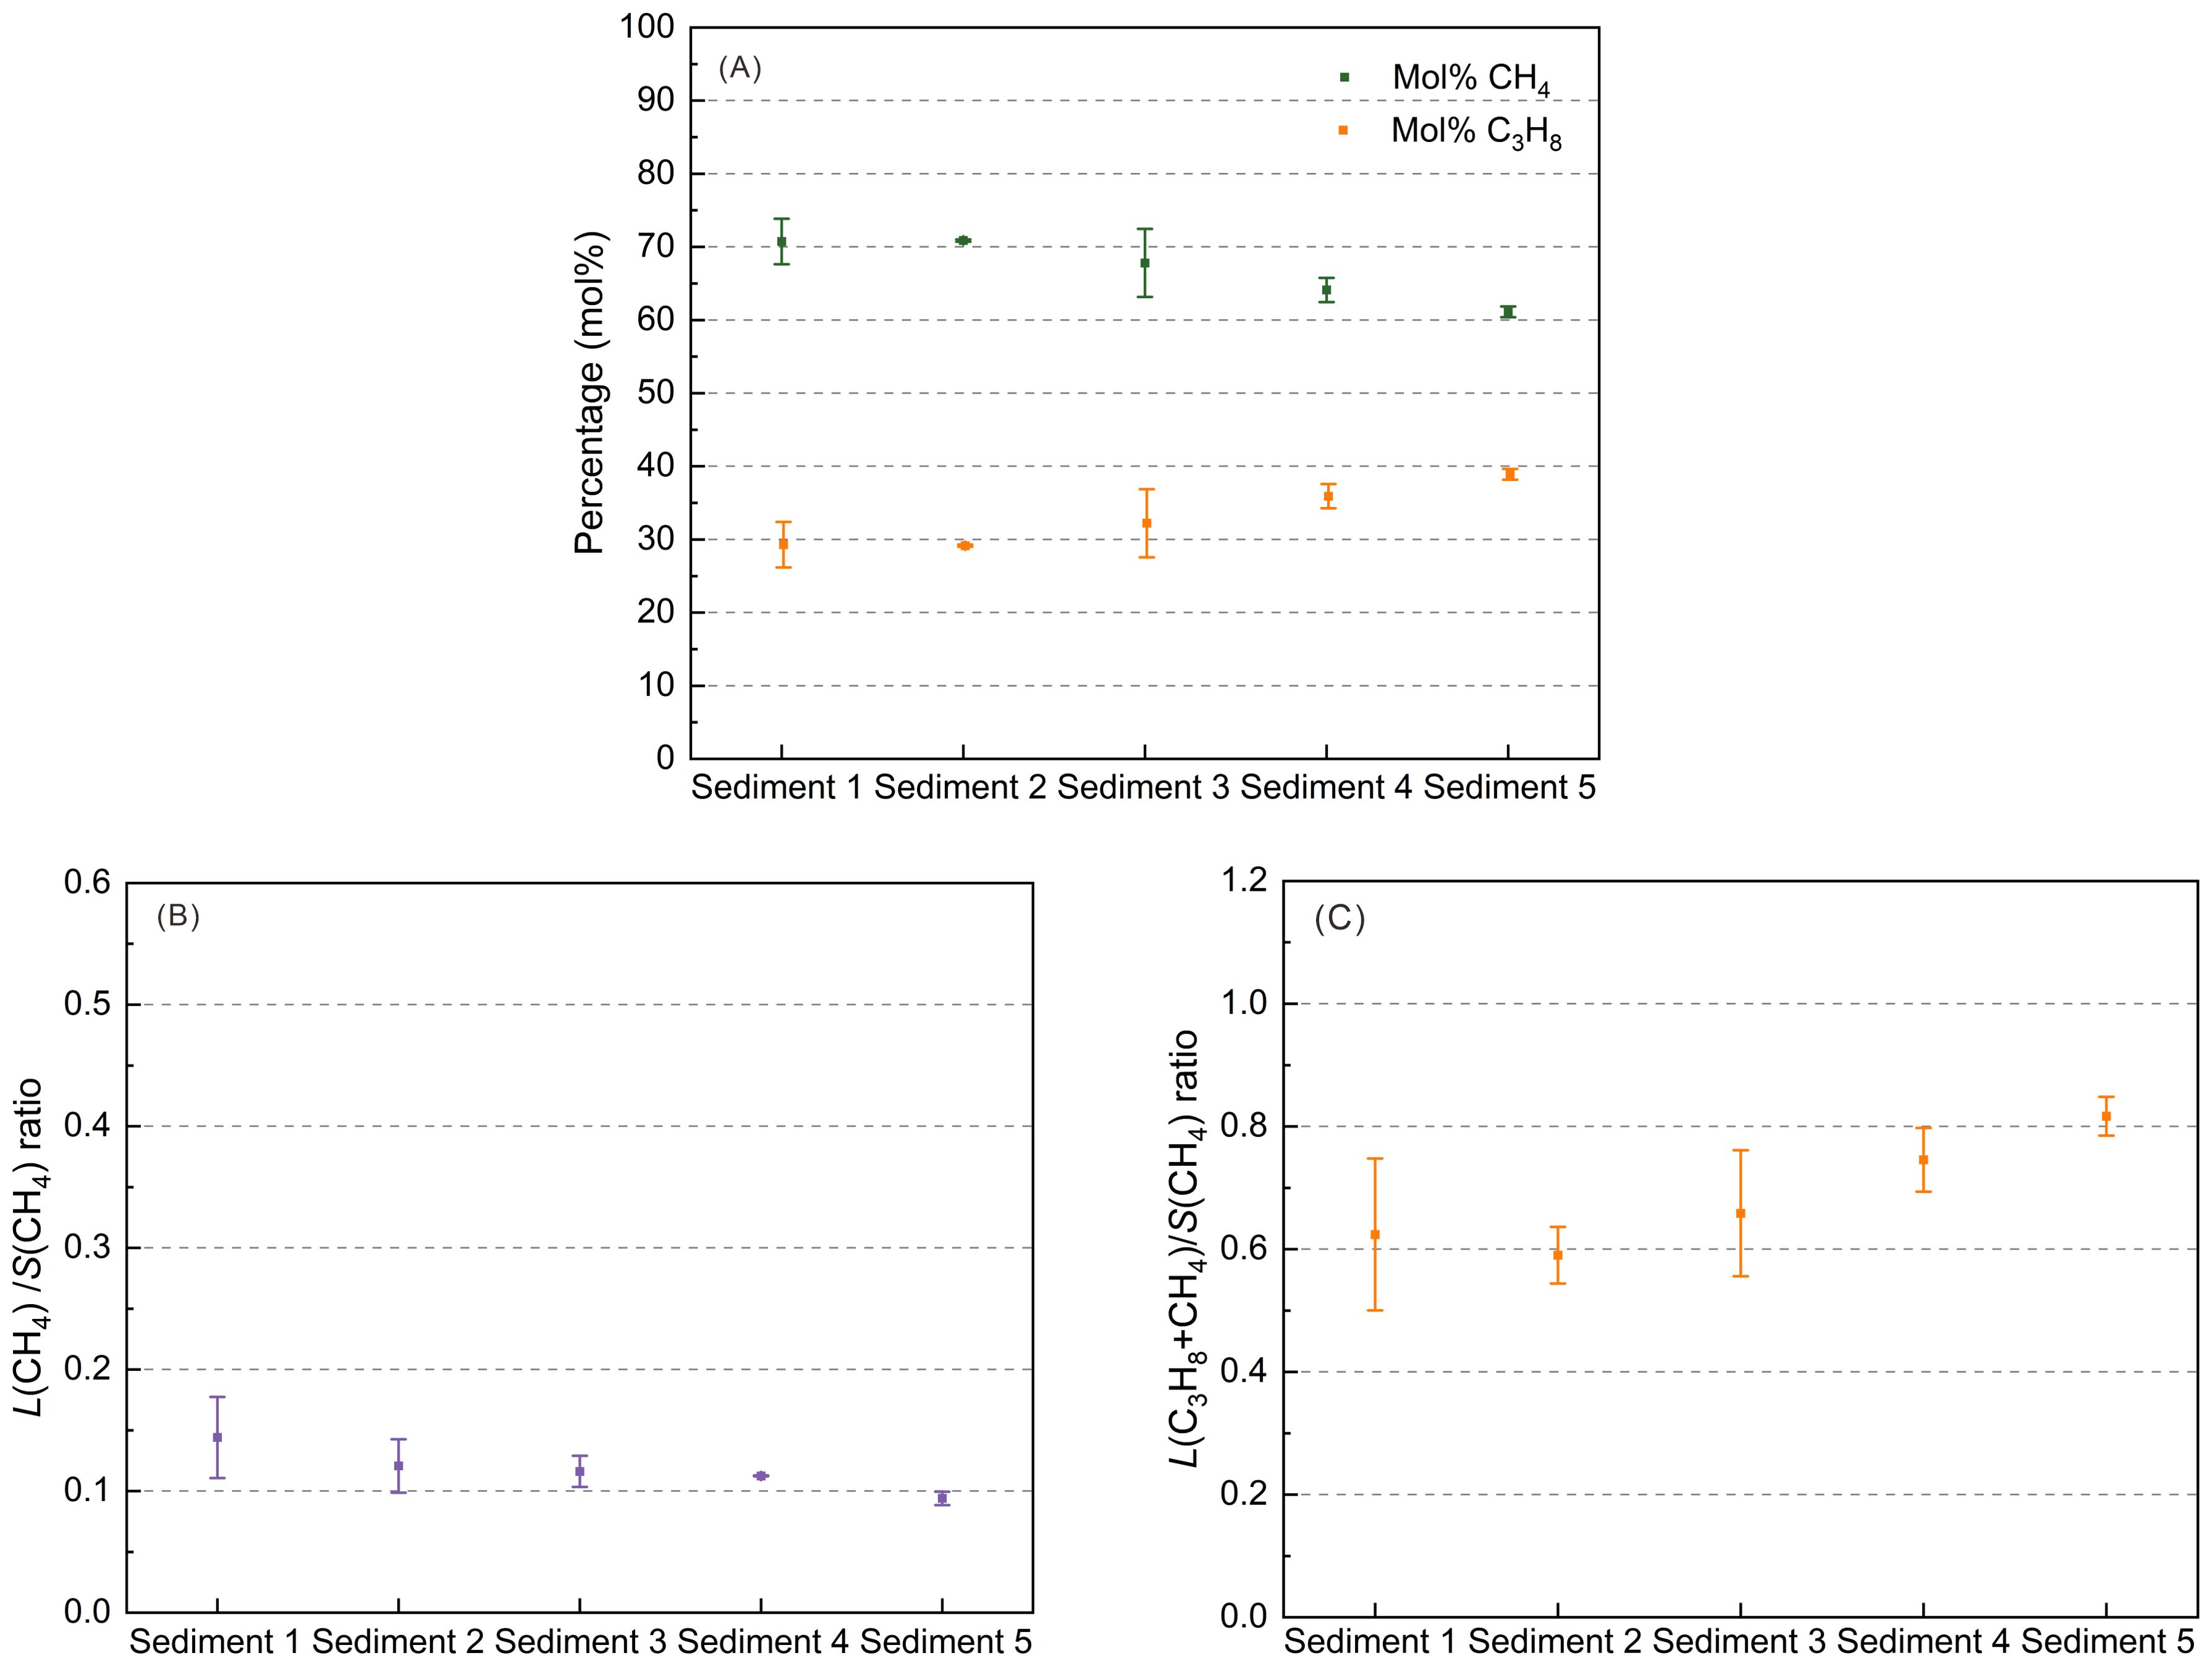
Figure 7. (A) Variations in the gas hydrate composition (mol%) during the formation process, based on ex situ Raman measurements of specific hydrate crystals at ambient pressure and 173.15 K; (B) large-to-small cavity ratio for CH4 molecules in the hydrate phase; and (C) large-to-small cavity ratio for both CH4 and C3H8 molecules in the hydrate phase.
The observation that only structure II hydrates formed throughout the whole process is identical to studies conducted by Schicks and Luzi-Helbing (2013); Maeda (2016); Tang et al. (2018) and Truong-Lam et al. (2020). They observed that a small amount of C3H8 in a gas mixture is sufficient to form structure II gas hydrates. Even if a mixture of structure I and structure II hydrates forms in the initial stage of the hydrate formation process, the formed structure I hydrates quickly transform to thermodynamically stable structure II hydrates during consequent reactions (Du et al., 2023). However, our results differ from those reported by Aladko et al. (2002); Uchida et al. (2004); Hester et al. (2007); de Menezes et al. (2019); Klapproth et al. (2019) and Cai et al. (2022), who observed the formation of a mixture of structure I/structure II hydrates from a feed gas mixture containing CH4 and C3H8. Uchida et al. (2004); Hester et al. (2007) and Klapproth et al. (2019) attributed the coexistence of structure I and structure II hydrates to the decreasing concentration of gaseous C3H8 during the hydrate formation. In our experiments, we employed an open system with a constant feed gas flow, avoiding a depletion of the structure II-forming hydrocarbon. Moreover, the formation of a possible kinetically favored but meta-stable structure I hydrate phase, as it was observed in previous studies (e.g. Schicks et al., 2006), was not observed, even though the pressure and temperature conditions chosen in this study were within the stability range of simple CH4 hydrates.
Gas composition and large-to-small cavity ratio of gas hydrates during the formation process were obtained by in situ Raman measurements. Figure 6 presents the time-dependent overview of the daily average results of the composition of the hydrate-bound gas molecules and large-to-small cavity ratio of CH4-C3H8 mixed gas hydrates during the formation process. The daily average results for each sediment are shown separately in Supplementary Figure S5 in the Supplementary Materials. Detailed test results of four replicates are attached to the Supplementary Figure S6 in the Supplementary Materials.
The composition of the gas hydrate phase varies slightly during hydrate formation in the presence of Sediment 2 (Figure 6A, Supplementary Figure S5). For this system, CH4 was easily and quickly trapped into the cages during the initial formation period. Thereafter, the concentration of CH4 in hydrate crystals gradually decreases and the content of C3H8 gradually increased as hydrate crystallization progressed. The relative CH4 concentration decreased from around 75~85 mol% to about 70 mol% whereas the C3H8 content increased from around 15~25 mol% to about 30 mol% during the euhedral hydrate crystals formation. In the other systems, the fluctuations in the composition of the hydrate phase show not such a clear trend. Above difference may be related to the coexisting presence of a large amount of coarse foraminifera-rich sand and fine-grained clayey particles in Sediment 2. The strong heterogeneity results in variations in the adsorption rate and content of CH4 and C3H8 during hydrate formation. However, regardless of the sediment type, all gas hydrates show an enrichment of C3H8 (above 25 mol%) compared to the feed gas phase, which contains only 4 mol% C3H8. This behavior has been reported before (Schicks and Luzi-Helbing, 2015; Medvedev et al., 2015; Du et al., 2023) and might be attributed to a higher stabilizing effect of C3H8 in the large 51264 cage of structure II hydrates.
Since structure II hydrates consist of 16 small 512 and 8 large 51264 cages, the ratio of large to small cages would be 0.5 if all cages were occupied. Looking at the large-to-small cavity ratio for CH4 (i.e., L(CH4)/S(CH4) ratio) in Figure 6B, it varies between 0.1 and 0.45, indicating that only a small portion of the large 51264 cages is occupied by CH4. Considering the L(C3H8+CH4)/S(CH4) ratio, the values mainly vary between 0.5 and 0.95. This indicates that C3H8 was preferentially incorporated in the large 51264 cages, due to its size and higher guest-to-cavity ratio which helps stabilizing the large cavities better than CH4 molecule (Du et al., 2023). However, since the large-to-small cages ratio is also above 0.5 (Figure 6C), particularly at the end of the experiments, it also shows that not all small 512 cages in the mixed gas hydrates are filled with CH4. The L(CH4)/S(CH4) ratio in Sediment 1 slightly decreases over time (Figure 6B, Supplementary Figure S5). According to the change in the composition of the gas hydrate phase in the presence of Sediment 2, the L(CH4)/S(CH4) ratio also decreases over time, which at first glance indicates that the CH4 is replaced by C3H8, probably as a result of restructuring processes during formation. This may also explain why the L(C3H8+CH4)/S(CH4) ratio in Sediment 2 remains unchanged, which contrasts from the evolution pattern of the C3H8 composition (Figure 6A). However, the increasing encasement of C3H8 into the 51264 cavities does not necessarily indicate an exchange of CH4. In previous studies (Schicks and Luzi-Helbing, 2015), we were able to demonstrate that CH4-filled 512 cavities are preferred formed at initial stages of hydrate formation before the large 51264 cavities form. Initially, these large 51264 cavities are filled with CH4, but with time, they are preferentially filled with C3H8. This preferential and disproportionate new formation of large 51264 cavities encasing C3H8, with simultaneous stagnation or slow increase of the number of the 51264 cavities occupied with CH4 and a new formation of small, CH4 occupied 512 cages, could also explain the observed changes in composition and cage occupancy. For Sediment 3, Sediment 4 and Sediment 5, the L(CH4)/S(CH4) ratio is unchanged. The evolution pattern of L(C3H8+CH4)/S(CH4) ratio in the Sediment 1, Sediment 3, Sediment 4 and Sediment 5 is consistent with the variation of C3H8 content of the CH4-C3H8 mixed gas hydrates (Figure 6C, Supplementary Figure S5).
In addition to the in situ Raman measurements, the effect of sediments on CH4-C3H8 mixed gas hydrates was also investigated by applying ex situ Raman measurements. Figure 7 shows the average gas composition in the hydrate phase and the large-to-small cavity ratio of the CH4-C3H8 mixed gas hydrates crystals in different sediments. The hydrate-bearing sediment samples were recovered from the pressure cells after 10-13 weeks. The detailed test results are shown in Supplementary Figure S7 in the Supplementary Materials.
The CH4 amount in the formed hydrate crystals in five sediments vary between 60 mol% and 75 mol% (Figure 7A). Accordingly, the C3H8 concentration varies between 25 mol% and 40 mol%. The fraction of CH4 in the hydrate phase in sediments 1 and 2 is about 70 mol% and the fraction of C3H8 is correspondingly 30 mol%, which is in the same range as that for the in situ experiments. However, the gas hydrate phases formed ex situ in Sediments 4 and 5 showed lower contents of CH4 and corresponding higher contents of C3H8 compared to those formed in situ in Sediments 4 and 5. This could be due to the fact that the hydrate formation process in the in situ measurements was only observed over five days, whereas the hydrate formation in the ex situ measurements took place over 10-13 weeks and thus the ex situ experiments probably came closer to the equilibrium state.
The CH4 amount of CH4-C3H8 mixed gas hydrates in foraminifera-rich sand and a mixture of mud and foraminifera-rich sand (i.e., Sediment 1 and Sediment 2) are slightly higher than that in Sediment 4 and Sediment 5 (Figure 7A). Accordingly, the C3H8 amount in Sediment 1 and Sediment 2 are lower than that in the Sediment 4 and Sediment 5. A possible explanation for these phenomena could be that foraminifera-rich sand (calcite) promotes the CH4 enrichment in the hydrate phase, as shown in Figures 3A, B. Interestingly, the values for CH4 and C3H8 for Sediment 1, Sediment 2 and Sediment 4 are in the error bar of the values for Sediment 3. The main reason maybe contributed to the wide particle size distribution and high heterogeneity of Sediment 3. This heterogeneity could possibly lead to the sediment composition varying slightly in terms of particle size during the experiments, thereby influencing the results, e.g. that the slightly higher presence of quartz with large particle size in mud promote the CH4 adsorption.
The CH4 content and C3H8 content of gas hydrates in different muds, i.e., Sediments 3-5, differ from those in Sediments 1 and 2, but also from each other. The amount of CH4 in the mixed gas hydrates in Sediment 3 and Sediment 4 is higher than that in Sediments 5 (Figure 7A). The quartz content in Sediments 4 and 5 are the same (Figure 3B), ruling out the impact of quartz on the difference. However, compared with Sediment 5, the amount of kaolinite and illite are slightly higher in Sediment 4 (Figure 3C). A high amount of kaolinite and illite lead to a higher liquid water phase in the sediments and implies a better CH4 dissolution (de Menezes et al., 2019; Kumari et al., 2021a). Therefore, the CH4 amount of CH4-C3H8 mixed gas hydrates in Sediment 4 is higher than that in Sediments 5. It should be noted that the presence of montmorillonite-based bentonite clay thermodynamically promotes CH4 to form gas hydrates (Saw et al., 2015), and montmorillonite is prone to hydration expansion (Wang et al., 2022). However, the amount of montmorillonite in Sediments 3-5 is quite low and the same. Therefore, we assume that the influence of montmorillonite on CH4 adsorption of CH4-C3H8 mixed gas hydrates in mud is limited. For Sediment 3 and Sediment 5, the clay content is the same (Figure 3B), and the clay composition is also similar (Figure 3C). The significant difference is that Sediment 3 has a wider particle size distribution (Supplementary Figure S2 in the Supplementary Materials) and a high content of quartz. It is speculated that the quartz particles in Sediment 3 are large (greater than 4Φ). Accordingly, the comparison between Sediments 3 and 5 indicates that quartz with large particle size is helpful for the adsorption of CH4.
In different sediments, the L(CH4)/S(CH4) ratio ranges from 0.08 to 0.18 (Figure 7B), whereby Sediment 5 exhibits the lowest L(CH4)/S(CH4) ratio. The low ratios indicate that only a small portion of the large 51264 cages is occupied by CH4. Compared to the in situ samples, all L(CH4)/S(CH4) ratios show lower values, suggesting that -due to the longer reaction time for the experiments – the systems are more or less approaching an “equilibrium state”.
The L(C3H8+CH4)/S(CH4) ratio of CH4/C3H8 mixed gas hydrates in different sediments is between 0.50~0.90 (Figure 7C). This also shows that not all small 512 cages in the mixed gas hydrates in different sediments are filled with CH4. A relatively higher L(C3H8+CH4)/S(CH4) ratio is obtained in Sediment 5. The trend of differences in the L(C3H8+CH4)/S(CH4) ratio of CH4-C3H8 mixed gas hydrates in different sediments is consistent with the trend of differences in the C3H8 content of hydrates in different sediments. A possible explanation could be that foraminifera-rich sand, quartz with large size particles, illite and kaolinite may negatively affect the adsorption of C3H8. This also implies that the effects of sediments on the L(C3H8+CH4)/S(CH4) ratio is consistent with the effects on the C3H8 content.
In this study, we investigated the formation of CH4-C3H8 mixed gas hydrates in five different natural marine sediments from the South China Sea using both in situ and ex situ Raman measurements. The morphology, crystalline structure, gas composition, and large-to-small cavity ratios of the CH4-C3H8 mixed gas hydrates were determined. The following results were obtained:
1. In all five natural sediments analyzed, the resulting CH4-C3H8 mixed gas hydrates was exclusively structure II. Two distinct morphologies of hydrate crystals were observed across different sediments, but no significant differences were noted in gas composition or large-to-small cavity ratios. Notably, euhedral hydrate crystals formed within sediments appeared less well-structured and sharp-edged characteristic of those formed in systems of pure water and gas.
2. In clean foraminifera-rich sand or mud, the gas composition and L(C3H8+CH4)/S(CH4) ratio in the mixed gas hydrates almost don’t vary with time. In the mixture of foraminifera-rich sand and mud, CH4 initially occupied the hydrate cavities, with C3H8 gradually incorporating into the lattice, increasing from 15~25 mol% to around 30 mol% as crystallization progressed. The L(CH4)/S(CH4) ratio slightly decreases over time, while the L(C3H8+CH4)/S(CH4) ratio remains unchanged. The increasing encasement of C3H8 into the 51264 cavities does not necessarily indicate an exchange of CH4.
3. The amounts of CH4 and C3H8 encased in the hydrate phase varied with the sediments, with CH4 concentrations ranging from 60 mol% to 75 mol% and C3H8 concentrations from 25 mol% to 40 mol%. The L(CH4)/S(CH4) ratio, ranging from 0.08 to 0.18, and the L(C3H8+CH4)/S(CH4) ratio, ranging from 0.50 to 0.90, suggest that not all small 512 cages and large 51264 cages in mixed gas hydrates were fully occupied by CH4. Foraminifera-rich sand, quartz with large size particles, illite and kaolinite showed a positive influence on CH4 adsorption when CH4-C3H8 mixed gas hydrates were formed in natural sediments.
Our findings show that the presence of sediment particles not only influenced gas composition but also impacted the large-to-small cavity ratio and crystallization patterns, indicating the sediment’s role in altering hydrate formation behavior. These results highlight both expected outcomes, such as the selective incorporation of C3H8 and CH4 into hydrate cavities, and some unexpected observations, such as the variation in the crystalline morphology of hydrate crystals formed in sedimentary systems. These observations offer valuable insights into the interaction between sediments and CH4-C3H8 mixed gas hydrates formation in natural marine environments, providing deeper insights into the role of marine sediments in global carbon storage, as well as their impacts on marine ecosystem functioning and structure. However, this article primarily discusses the mineral effects of sediments on CH4-C3H8 mixed gas hydrates. Future research will address the effects of salinity, sediment physical properties, and other factors on the formation process.
The raw data supporting the conclusions of this article will be made available by the authors, without undue reservation.
PM: Conceptualization, Data curation, Funding acquisition, Resources, Writing – original draft. JS: Conceptualization, Methodology, Supervision, Writing – review & editing. MP: Methodology, Writing – review & editing. NW: Funding acquisition, Writing – review & editing.
The author(s) declare that financial support was received for the research, authorship, and/or publication of this article. This work was supported by the Postdoctoral Fellowship Program of CPSF (grant number: GZB20230682), the China Postdoctoral Science Foundation (grant number: 2023M743295), the Marine S&T Fund of Shandong Province for Laoshan Laboratory (No.2021QNLM020002), the China Scholarship Council (grant number: 202008110273), the National Natural Science Foundation of China (grant numbers: 42076217, 42106076), and Laoshan Laboratory (grant number: LSKJ202203503).
We acknowledge Erik Spangenberg, Ronny Giese, and Parisa Naeiji at GFZ for their valuable support during this research. Additionally, we are grateful to Qingdao Institute of Marine Geology for their support in the utilization and testing of sediments samples.
The authors declare that the research was conducted in the absence of any commercial or financial relationships that could be construed as a potential conflict of interest.
The author(s) declare that no Generative AI was used in the creation of this manuscript.
All claims expressed in this article are solely those of the authors and do not necessarily represent those of their affiliated organizations, or those of the publisher, the editors and the reviewers. Any product that may be evaluated in this article, or claim that may be made by its manufacturer, is not guaranteed or endorsed by the publisher.
The Supplementary Material for this article can be found online at: https://www.frontiersin.org/articles/10.3389/fmars.2025.1510050/full#supplementary-material
Abbasov A., Merey S., Parlaktuna M. (2016). Experimental investigation of carbon dioxide injection effects on methane-propane-carbon dioxide mixture hydrates. J. Nat. Gas Sci. Eng. 34, 1148–1158. doi: 10.1016/j.jngse.2016.07.065
Aladko E. Y., Dyadin Y. A., Manakov A. Y., Zhurko F. V., Larionov E. G. (2002). Phase diagrams of the ternary gas hydrate forming systems at high pressures. Part 1. propane-methane-water system. J. Supramol. Chem. 2, 369–376. doi: 10.1016/S1472-7862(03)00061-3
Bai C., Su P., Su X., Cui H., Shang W., Han S., et al. (2022). Characterization of the sediments in a gas hydrate reservoir in the northern South China Sea: Implications for gas hydrate accumulation. Mar. Geol. 453, 106912. doi: 10.1016/j.margeo.2022.106912
Beeskow-Strauch B., Schicks J. M., Spangenberg E., Erzinger J. (2011). The influence of SO2 and NO2 impurities on CO2 gas hydrate formation and stability. Chem. Eur. J. 17, 4376–4384. doi: 10.1002/chem.201003262
Bello-Palacios A., Almenningen S., Fotland P., Ersland G. (2021). Experimental and numerical analysis of the effects of clay content on CH 4 hydrate formation in sand. Energy Fuels 35, 9836–9846. doi: 10.1021/acs.energyfuels.1c00549
Burke E. A. J. (2001). Raman microspectrometry of fluid inclusions. Lithos, fluid Inclusions: Phase relationships-methods-applications. A special issue honour Jacques Touret 55, 139–158. doi: 10.1016/S0024-4937(00)00043-8
Cai W., Zhan L., Huang X., Lu H. (2022). Raman micro-imaging of the coexistence of sI and sII hydrates formed from a mixed methane-propane gas in a confined space. Acta Geol. Sin. Engl. Ed. 96, 674–679. doi: 10.1111/1755-6724.14929
Davidson D. W., Garg S. K., Gough S. R., Handa Y. P., Ratcliffe C. I., Ripmeester J. A., et al. (1986). Laboratory analysis of a naturally occurring gas hydrate from sediment of the Gulf of Mexico. Geochim. Cosmochim. Acta 50, 619–623. doi: 10.1016/0016-7037(86)90110-9
de Menezes D.É.S., Sum A. K., Desmedt A., Pessôa Filho P., de A., Robustillo Fuentes M. D. (2019). Coexistence of sI and sII in methane-propane hydrate former systems at high pressures. Chem. Eng. Sci. 208, 115149. doi: 10.1016/j.ces.2019.08.007
Du S., Han X., Cai W., Zhu J., Ma X., Han S., et al. (2023). Formation of the structure-II gas hydrate from low-concentration propane mixed with methane. Chin. J. Chem. Eng. 58, 306–314. doi: 10.1016/j.cjche.2022.10.014
Duan Z., Li D., Chen Y., Sun R. (2011). The influence of temperature, pressure, salinity and capillary force on the formation of methane hydrate. Geosci. Front. 2, 125–135. doi: 10.1016/j.gsf.2011.03.009
Feng Y., Qu A., Han Y., Shi C., Liu Y., Zhang L., et al. (2023). Effect of gas hydrate formation and dissociation on porous media structure with clay particles. Appl. Energy 349, 121694. doi: 10.1016/j.apenergy.2023.121694
Heeschen K. U., Schicks J. M., Oeltzschner G. (2016). The promoting effect of natural sand on methane hydrate formation: Grain sizes and mineral composition. Fuel 181, 139–147. doi: 10.1016/j.fuel.2016.04.017
Hester K. C., Dunk R. M., Walz P. M., Peltzer E. T., Sloan E. D., Brewer P. G. (2007). Direct measurements of multi-component hydrates on the seafloor: Pathways to growth. Fluid Phase Equilibria Properties Phase Equilibria Prod. Process Design 261, 396–406. doi: 10.1016/j.fluid.2007.07.053
Hills B. P., Manning C. E., Ridge Y., Brocklehurst T. (1996). NMR Water Relaxation, Water activity and bacterial survival in porous media. J. Sci. Food Agric. 71, 185–194. doi: 10.1002/(SICI)1097-0010(199606)71:2<185::AID-JSFA567>3.0.CO;2-5
Hoshikawa A., Matsukawa T., Ishigaki T. (2018). Evaluation of filling rate of methane in methane-propane hydrate by neutron powder diffraction. Phys. B Condens. Matter 551, 274–277. doi: 10.1016/j.physb.2017.11.065
Kida M., Hachikubo A., Sakagami H., Minami H., Krylov A., Yamashita S., et al. (2009). Natural gas hydrates with locally different cage occupancies and hydration numbers in Lake Baikal. Geochem. Geophys. Geosys. 10, Q05003. doi: 10.1029/2009GC002473
Kida M., Khlystov O., Zemskaya T., Takahashi N., Minami H., Sakagami H., et al. (2006). Coexistence of structure I and II gas hydrates in Lake Baikal suggesting gas sources from microbial and thermogenic origin. Geophys. Res. Lett. 33, L24603. doi: 10.1029/2006GL028296
Klapp S. A., Murshed M. M., Pape T., Klein H., Bohrmann G., Brewer P. G., et al. (2010). Mixed gas hydrate structures at the Chapopote Knoll, southern Gulf of Mexico. Earth Planet. Sci. Lett. 299, 207–217. doi: 10.1016/j.epsl.2010.09.001
Klapproth A., Piltz R. O., Kennedy S. J., Kozielski K. A. (2019). Kinetics of sII and mixed sI/sII, gas hydrate growth for a methane/propane mixture using neutron diffraction. J. Phys. Chem. C 123, 2703–2715. doi: 10.1021/acs.jpcc.8b06693
Krumbein W. (1936). Application of logarithmic moments to size frequency distributions of sediments. J Sediment Petrol. 6 (1), 35–47.
Kumar A., Sakpal T., Roy S., Kumar R. (2015). Methane hydrate formation in a test sediment of sand and clay at various levels of water saturation. Can. J. Chem. 93, 874–881. doi: 10.1139/cjc-2014-0537
Kumari A., Balomajumder C., Arora A., Dixit G., Gomari S. R. (2021a). Physio-chemical and mineralogical characteristics of gas hydrate-bearing sediments of the Kerala-Konkan, Krishna-Godavari, and Mahanadi Basins. J. Mar. Sci. Eng. 9, 808. doi: 10.3390/jmse9080808
Kumari A., Khan S. H., Majumder C. B., Arora A., Dixit G. (2021b). Physio-chemical and mineralogical analysis of gas hydrate bearing sediments of Andaman Basin. Mar. Geophys. Res. 42, 2. doi: 10.1007/s11001-020-09423-9
Li J., Lu J., Kang D., Ning F., Lu H., Kuang Z., et al. (2019). Lithological characteristics and hydrocarbon gas sources of gas hydrate-bearing sediments in the Shenhu area, South China Sea: Implications from the W01B and W02B sites. Mar. Geol. 408, 36–47. doi: 10.1016/j.margeo.2018.10.013
Liang J., Zhang W., Lu J., Wei J., Kuang Z., He Y. (2019). Geological occurrence and accumulation mechanism of natural gas hydrates in the eastern Qiongdongnan Basin of the South China Sea: Insights from site GMGS5-W9-2018. Mar. Geol. 418, 106042. doi: 10.1016/j.margeo.2019.106042
Lopes U., Babonneau N., Fierens R., Revillon S., Raisson F., Miramontes E., et al. (2023). Foraminiferal sandy contourite of the Limpopo Corridor (Mozambique margin): Facies characterization and paleoceanographic record. Mar. Geol. 459, 107031. doi: 10.1016/j.margeo.2023.107031
Lu H., Seo Y., Lee J., Moudrakovski I., Ripmeester J. A., Chapman N. R., et al. (2007). Complex gas hydrate from the Cascadia margin. Nature 445, 303–306. doi: 10.1038/nature05463
Lu H., Wright F., Okui T., Dallimore S., Zheng J., Ripmeester J. (2004). “Sediment control on hydrate occurrence in natural sediments–from experimental results,” in AAPG HEDBERG RESEARCH CONFERENCE: Gas Hydrates: Energy Resource Potential and Associated Geologic Hazards, September 12-16, 2004, Vancouver, BC, Canada.
Lu H., Zeng H., Ripmeester J., Kawasaki T., Fujii T., Nakamizu M. (2008). “Sediment control on the saturation level of gas hydrate in nature environments,” in Proceedings of the 6th International Conference on Gas Hydrates (ICGH 2008), Vancouver, British Columbia, CANADA, July 6-10.
Maeda N. (2016). Nucleation curves of methane-propane mixed gas hydrates in the presence of a stainless steel wall. Fluid Phase Equilibria 413, 142–147. doi: 10.1016/j.fluid.2015.12.011
Medvedev V. I., Gushchin P. A., Yakushev V. S., Semenov A. P. (2015). Study of the effect of the degree of overcooling during the formation of hydrates of a methane-propane gas mixture on the equilibrium conditions of their decomposition. Chem. Technol. Fuels Oils 51, 470–479. doi: 10.1007/s10553-015-0627-4
Milkov A. V. (2005). Molecular and stable isotope compositions of natural gas hydrates: A revised global dataset and basic interpretations in the context of geological settings. Organ. Geochem. 36, 681–702. doi: 10.1016/j.orggeochem.2005.01.010
Naeiji P., Pan M., Luzi-Helbing M., Alavi S., Schicks J. M. (2023). Experimental and simulation study for the dissociation behavior of gas hydrates-Part I: CH4 hydrates. Energy Fuels. 37 (6), 4484–4496. doi: 10.1021/acs.energyfuels.2c03984
Paganoni M., Cartwright J. A., Foschi M., Shipp R. C., Van Rensbergen P. (2016). Structure II gas hydrates found below the bottom-simulating reflector. Geophys. Res. Lett. 43, 5696–5706. doi: 10.1002/2016GL069452
Pan M., Naeiji P., Schicks J. M. (2023). Experimental and simulation study for the dissociation behavior of gas hydrates-Part II: sII mixed gas hydrates. Energy Fuels. 37 (6), 4497–4514. doi: 10.1021/acs.energyfuels.2c03985
Peng C., Wang G., Qin L., Luo S., Min F., Zhu X. (2020). Molecular dynamics simulation of NH4-montmorillonite interlayer hydration: Structure, energetics, and dynamics. Appl. Clay Sci. 195, 105657. doi: 10.1016/j.clay.2020.105657
Placzek G. (1934). Handbuch der Radiologie Vol. 6. Ed. Marx E. (Leipzig: Akad. Verlagsgesellschaft).
Qian J., Wang X., Collett T. S., Guo Y., Kang D., Jin J. (2018). Downhole log evidence for the coexistence of structure II gas hydrate and free gas below the bottom simulating reflector in the South China Sea. Mar. Pet. Geol. 98, 662–674. doi: 10.1016/j.marpetgeo.2018.09.024
Qin Y., Pan Z., Liu Z., Shang L., Zhou L. (2021). Influence of the particle size of porous media on the formation of natural gas hydrate: A review. Energy Fuels 35, 11640–11664. doi: 10.1021/acs.energyfuels.1c00936
Riestenberg D., West O., Lee S., McCallum S., Phelps T. J. (2003). Sediment surface effects on methane hydrate formation and dissociation. Mar. Geol. 198, 181–190. doi: 10.1016/S0025-3227(03)00100-2
Ripmeester J. A., Ratcliffe C. I. (1988). Low-temperature cross-polarization/magic angle spinning carbon-13 NMR of solid methane hydrates: structure, cage occupancy, and hydration number. J. Phys. Chem. 92, 337–339. doi: 10.1021/j100313a018
Sassen R., MacDonald I. R. (1994). Evidence of structure H hydrate, Gulf of Mexico continental slope. Org. Geochem. 22, 1029–1032. doi: 10.1016/0146-6380(94)90036-1
Saw V. K., Udayabhanu G., Mandal A., Laik S. (2015). Methane hydrate formation and dissociation in the presence of silica sand and bentonite clay. Oil Gas Sci. Technol. -Rev. D’IFP Energ. Nouv. 70, 1087–1099. doi: 10.2516/ogst/2013200
Schicks J. M., Luzi-Helbing M. (2013). Cage occupancy and structural changes during hydrate formation from initial stages to resulting hydrate phase. Spectrochim. Acta A. Mol. Biomol. Spectrosc. 115, 528–536. doi: 10.1016/j.saa.2013.06.065
Schicks J. M., Luzi-Helbing M. (2015). Kinetic and thermodynamic aspects of clathrate hydrate nucleation and growth. J. Chem. Eng. Data 60, 269–277. doi: 10.1021/je5005593
Schicks J. M., Naumann R., Erzinger J., Hester K. C., Koh C. A., Sloan E. D. (2006). Phase transitions in mixed gas hydrates: experimental observations versus calculated data. J. Phys. Chem. B 110, 11468–11474. doi: 10.1021/jp0612580
Schicks J. M., Pan M., Giese R., Poser M., Ismail N. A., Luzi-Helbing M., et al. (2020). A new high-pressure cell for systematic in situ investigations of micro-scale processes in gas hydrates using confocal micro-Raman spectroscopy. Rev. Sci. Instrum. 91, 115103. doi: 10.1063/5.0013138
Schrader B. (1995). Infrared and Raman spectroscopy: Methods and applications (Weinheim: VCH Verlagsgesellschaft mbH). doi: 10.1002/9783527615438
Schrötter H. W., Klöckner H. W. (1979). “Raman scattering cross sections in gases and liquids,” in Raman Spectroscopy of Gases and Liquids, Topics in Current Physics. Ed. Weber A. (Springer Berlin Heidelberg, Berlin, Heidelberg), 123–166. doi: 10.1007/978-3-642-81279-8_4
Sloan E. D. (2003). Fundamental principles and applications of natural gas hydrates. Nature 426, 353–359. doi: 10.1038/nature02135
Sloan E. D., Koh C. A. (2008). Clathrate hydrates of natural gases (Boca Raton: CRC Press). doi: 10.1201/9781420008494
Subramanian S., Sloan E. D. (1999). Molecular measurements of methane hydrate formation. Fluid Phase Equilibria 158-160, 813–820. doi: 10.1016/S0378-3812(99)00134-X
Susilo R., Alavi S., Ripmeester J., Englezos P. (2008). Tuning methane content in gas hydrates via thermodynamic modeling and molecular dynamics simulation. Fluid Phase Equilibria 263, 6–17. doi: 10.1016/j.fluid.2007.09.015
Tang C., Zhou X., Li D., Zhao X., Liang D. (2018). In situ Raman investigation on mixed CH4/C3H8 hydrate dissociation in the presence of polyvinylpyrrolidone. Fuel 214, 505–511. doi: 10.1016/j.fuel.2017.11.063
Terzariol M., Park J., Castro G. M., Santamarina J. C. (2020). Methane hydrate-bearing sediments: Pore habit and implications. Mar. Pet. Geol. 116, 104302. doi: 10.1016/j.marpetgeo.2020.104302
Truong-Lam H. S., Seo S., Kim S., Seo Y., Lee J. D. (2020). In Situ Raman Study of the formation and dissociation kinetics of methane and methane/propane hydrates. Energy Fuels 34, 6288–6297. doi: 10.1021/acs.energyfuels.0c00813
Uchida T., Moriwaki M., Takeya S., Ikeda I. Y., Ohmura R., Nagao J., et al. (2004). Two-step formation of methane-propane mixed gas hydrates in a batch-type reactor. AIChE J. 50, 518–523. doi: 10.1002/aic.10045
von Stackelberg M., Müller H. R. (1954). Feste gashydrate II. Struktur und Raumchemie. Z Elektrochem 58, 25–39. doi: 10.1002/bbpc.19540580105
Wang X., Kneller B., Sun Q. (2023). Sediment waves control origins of submarine canyons. Geology 51, 310–314. doi: 10.1130/G50642.1
Wang D., Ning F., Lu J., Lu H., Kang D., Xie Y., et al. (2021). Reservoir characteristics and critical influencing factors on gas hydrate accumulations in the Shenhu area, South China Sea. Mar. Pet. Geol. 133, 105238. doi: 10.1016/j.marpetgeo.2021.105238
Wang X., Sun Y., Peng S., Wang Y., Li S. (2022). Effect of pore water on the depressurization of gas hydrate in clayey silt sediments. J. Nat. Gas Sci. Eng. 108, 104836. doi: 10.1016/j.jngse.2022.104836
Wang X., Wang Y., Tan M., Cai F. (2020). Deep-water deposition in response to sea-level fluctuations in the past 30 kyr on the northern margin of the South China Sea. Deep Sea Res. Part Oceanogr. Res. Pap. 163, 103317. doi: 10.1016/j.dsr.2020.103317
Wei J., Fang Y., Lu H., Lu H., Lu J., Liang J., et al. (2018). Distribution and characteristics of natural gas hydrates in the Shenhu Sea Area, South China Sea. Mar. Pet. Geol. 98, 622–628. doi: 10.1016/j.marpetgeo.2018.07.028
Wei J., Wu T., Zhu L., Fang Y., Liang J., Lu H., et al. (2021). Mixed gas sources induced co-existence of sI and sII gas hydrates in the Qiongdongnan Basin, South China Sea. Mar. Pet. Geol. 128, 105024. doi: 10.1016/j.marpetgeo.2021.105024
Xie Y., Cheng L., Feng J., Zheng T., Zhu Y., Zeng X., et al. (2024). Kinetics behaviors of CH4 hydrate formation in porous sediments: Non-unidirectional influence of sediment particle size on hydrate formation. Energy 289, 130021. doi: 10.1016/j.energy.2023.130021
Yang S. X., Lei Y., Liang J. Q., Holland M., Schultheiss P., Lu J. A., et al. (2017a). “Concentrated gas hydrate in the Shenhu area, South China Sea: results from drilling expeditions GMGS3 & GMGS4,” in Proceedings of 9th International Conference on Gas Hydrates, June 25-30, 2017, Cenver, Colorado, USA. 25–30.
Yang S. X., Liang J. Q., Lu J. A., Qu C. W., Liu B. (2017b). New understandings on the characteristics and controlling factors of gas hydrate reservoirs in the Shenhu area on the northern slope of the South China Sea. Earth Sci. Front. 24, 1–14. doi: 10.13745/j.esf.yx.2016-12-43
Ye J., Wei J., Liang J., Lu J., Lu H., Zhang W. (2019). Complex gas hydrate system in a gas chimney, South China Sea. Mar. Petrol. Geol. 104, 29–39. doi: 10.1016/j.marpetgeo.2019.03.023
Zhang W., Liang J., Wei J., Lu J., Su P., Lin L., et al. (2020). Geological and geophysical features of and controls on occurrence and accumulation of gas hydrates in the first offshore gas-hydrate production test region in the Shenhu area, Northern South China Sea. Mar. Pet. Geol. 114, 104191. doi: 10.1016/j.marpetgeo.2019.104191
Zhang W., Liang J., Wei J., Su P., Lin L., Huang W. (2019). Origin of natural gases and associated gas hydrates in the Shenhu area, northern South China Sea: Results from the China gas hydrate drilling expeditions. J. Asian Earth Sci. 183, 103953. doi: 10.1016/j.jseaes.2019.103953
Keywords: CH4-C3H8 mixed gas hydrates, formation process, Raman spectroscopy, foraminifera-rich sand, mud particles
Citation: Mao P, Schicks JM, Pan M and Wu N (2025) CH4-C3H8 mixed gas hydrates formation in marine mud and foraminifera-rich sand from the South China Sea: an experimental approach. Front. Mar. Sci. 12:1510050. doi: 10.3389/fmars.2025.1510050
Received: 16 October 2024; Accepted: 22 January 2025;
Published: 11 February 2025.
Edited by:
Luigi Jovane, University of São Paulo, BrazilReviewed by:
Hongrui Zhang, Tongji University, ChinaCopyright © 2025 Mao, Schicks, Pan and Wu. This is an open-access article distributed under the terms of the Creative Commons Attribution License (CC BY). The use, distribution or reproduction in other forums is permitted, provided the original author(s) and the copyright owner(s) are credited and that the original publication in this journal is cited, in accordance with accepted academic practice. No use, distribution or reproduction is permitted which does not comply with these terms.
*Correspondence: Judith M. Schicks, c2NoaWNrQGdmei1wb3RzZGFtLmRl
Disclaimer: All claims expressed in this article are solely those of the authors and do not necessarily represent those of their affiliated organizations, or those of the publisher, the editors and the reviewers. Any product that may be evaluated in this article or claim that may be made by its manufacturer is not guaranteed or endorsed by the publisher.
Research integrity at Frontiers
Learn more about the work of our research integrity team to safeguard the quality of each article we publish.