- 1School of Information Science and Technology, Taishan University, Tai’an, China
- 2Institute of Environmental Studies, University of Karachi, Karachi, Pakistan
- 3Independent Researcher, Osaka, Japan
- 4Institute for Space-Earth Environmental Research (ISEE), Nagoya University, Nagoya, Japan
- 5Key Laboratory of Lake and Watershed Science for Water Security, Nanjing Institute of Geography and Limnology, Chinese Academy of Sciences, Nanjing, China
- 6School of Marine Sciences, Nanjing University of Information Science & Technology, Nanjing, China
The spatiotemporal variability of chlorophyll-a (Chl-a) in the Arabian Sea (AS) and Persian Gulf (PG) has been widely studied, but long-term trends and influencing factors remain less understood due to data gaps. This study investigates Chl-a variability and trends from 2001 to 2019 using reconstructed MODIS-Terra monthly Chl-a and sea surface temperature (SST) data, employing the Data Interpolating Empirical Orthogonal Functions (DINEOF) method for high-accuracy reconstruction. Results reveal pronounced seasonal variability, with Chl-a peaks exceeding 3 mg m-3 during southwestern monsoons and ranging between 1–3 mg m-3 during northeastern monsoons, with the lowest levels in transitional months. Spatially, the highest Chl-a concentrations were observed in the western and northeastern AS, influenced by summer southwestern (SW) and winter northeastern (NE) monsoons. Trend analysis using Sen’s slope and the Mann-Kendall test indicates significant Chl-a declines (-0.002 to 0) along ASPG coasts, with slight increases (~0.005) in the southeastern AS and southern PG. Rising SST anomalies (SST_A) correlated with reduced Chl-a anomalies (Chl-a_A) in the western AS, while increased wind anomalies (Wind_A) enhanced Chl-a_A in the western AS but decreased it in the southern PG. These findings enhance our understanding of the complex environmental dynamics shaping the ASPG ecosystems.
1 Introduction
Chlorophyll-a (Chl-a) concentration serves as a key bioindicator of phytoplankton biomass and marine productivity, making it crucial for monitoring the health of marine ecosystems. The Arabian Sea (AS) and Persian Gulf (PG) is recogonized as one of the most productive regions in the world (Sathyendranath et al., 1996). Understanding Chl-a variability and trends over the AS and PG (ASPG) is crucial for predicting marine ecosystem health, managing fisheries sustainably, and providing early warnings for harmful algal blooms. Satellite remote sensing has proven to be an effective tool for examining the spatiotemporal dynamics of Chl-a in the ASPG (Goes et al., 2005; Prakash et al., 2012; Moradi, 2020; Sarma et al., 2012; Jayaram et al., 2018; Moradi and Moradi, 2020; Bordbar et al., 2024), thanks to its broad coverage and real-time observation capabilities.
Previous research in these areas has revealed distinct seasonal and interannual patterns in Chl-a variability, which are often associated with factors such as sea surface temperatures (SST), monsoonal winds, upwelling events, and large-scale climate phenomena like the Indian Ocean Dipole and El Niño (Jayaram et al., 2018; Nezlin et al., 2007; Sarma et al., 2012; Seelanki et al., 2022). Furthermore, some studies have reported trends in Chl-a that either increase or decrease over different time periods, typically related to changes in SST, monsoonal winds, and sea level anomalies (Prakash et al., 2012; Goes et al., 2005; Prasanna Kumar et al., 2010). However, many of these studies in the ASPG region have been limited by their relatively short time frames or their focus on specific regional areas, which may restrict the generalizability of their findings. Expanding research to cover longer time periods and broader regions could provide a more comprehensive understanding of Chl-a variability and its underlying drivers. Additionally, it has been observed that satellite-derived products in the ASPG are often affected by suboptimal conditions, such as sun-glint and cloud cover. These factors can lead to gaps in the satellite-derived geographical data, which may result in incomplete information for subsequent analyses.
Data Interpolating Empirical Orthogonal Function (DINEOF) has emerged as a powerful method for reconstructing missing geophysical data, such as SST and Chl-a. Compared to traditional methods like linear interpolation and optimal interpolation, DINEOF offers significant advantages, including faster computation, parameter-free processing, and the ability to handle multiple correlated data types without prior de-correlation scales (Miles and He, 2010). These attributes make DINEOF particularly suitable for oceanographic applications where satellite observations are often hindered by clouds, sun-glint, and aerosols, leading to data gaps. Despite alternatives like machine learning showing promise, it often requires extensive in-situ data for training, which limits their scalability, particularly in regions like the ASPG. DINEOF has demonstrated success in various marine environments worldwide, including the South Atlantic Bight, the coastal Gulf of Alaska, the Gulf of Maine, the Gulf of Mexico, as well as the Sargasso Sea, and is currently employed in global ocean color products by NOAA (Li and He, 2014; Shropshire et al., 2016; Liu and Wang, 2018). However, in the ASPG region, the application of DINEOF is still underexplored, with issues such as limited studies on its efficacy and its primary focus on Chl-a reconstruction (Jayaram et al., 2018), highlighting the need for further research to assess its potential in filling satellite-derived data gaps across different oceanographic parameters.
This study has two primary objectives: (1) to investigate long-term trends and associated spatiotemporal variability in Chl-a from 2001 to 2019 across the ASPG, and (2) to assess the influence of SST and wind on Chl-a variability and trends. To achieve these goals, DINEOF was employed to reconstruct missing MODIS-Terra Chl-a and SST data over the study period. Subsequently, we investigated the monthly Chl-a variability and conducted a trend analysis across the entire ASPG. Additionally, we investigated the correlation between Chl-a anomalies (Chl-a_A) and SST anomalies (SST_A), as well as between Chl-a_A and wind anomalies (wind_A), providing deeper insights into the environmental drivers of marine productivity in the ASPG.
2 Data and methods
2.1 Study area and its subregions
The AS and PG, both located in the northwestern Indian Ocean (Figure 1), exhibit distinct oceanic and atmospheric processes that are critical for regional climate regulation and marine productivity. The AS, spanning 5°N to 25°N and 55°E to 77°E, is characterized by monsoon-driven ocean dynamics, influenced by the seasonal reversal of monsoon winds and the region’s unique geography. These winds generate variations in mixed layer depth, thermocline shifts, and nutrient upwelling, particularly along the coasts of Somalia and Oman during the Southwestern Monsoon, resulting in high phytoplankton biomass and biological productivity (Goes et al., 2005; Khan et al., 2023; Wiggert et al., 2005; Prasanna Kumar et al., 2010). Additional factors influencing biological activity include wind mixing, Ekman pumping, mesoscale eddies, and large-scale climate events like the Indian Ocean Dipole (IOD) and El Niño, which impact both phytoplankton blooms and surface biomass distribution (Seelanki et al., 2022; Keerthi et al., 2013; Shafeeque et al., 2021). In contrast, the PG, situated between 24°N and 30°N and 48°E to 57°E, is a shallow, semi-enclosed sea marked by extreme salinity, temperatures, and limited water exchange. Despite these harsh conditions, it sustains a productive ecosystem, influenced by seasonal wind stress, tidal turbulence, and human activities such as coastal development and pollution (Swift and Bower, 2003; Moradi and Moradi, 2020; Khan et al., 2019). Understanding the differing productivity patterns of the ASPG is vital for assessing long-term environmental changes and the broader impact of climate change on these ecosystems.

Figure 1. A bathymetry map of the ASPG region, showing the distribution of 21 stations across seven zones. Each station, represented by a filled triangle, is assigned to a specific zone. Z1 through Z7 represent zones 1 to 7, respectively, while S1, S2, and S3 represent stations 1, 2, and 3 within each zone. The yellow unfilled circles indicate the stations selected for calculating the upwelling index.
The study area was divided into seven zones, each containing three stations strategically positioned based on geographical and oceanographic significance (Figure 1). Zone 1, along the Pakistan coastline, is crucial for its upwelling, supporting rich fisheries in the northern AS. Zone 2, along the Indian coast, is influenced by monsoons driving nutrient inflow and boosting productivity. Zone 3, near Oman, is shaped by Arabian coastal currents, while Zone 4, along southern India, is affected by monsoon-driven currents impacting nutrient dynamics. Zone 5, off Yemen, benefits from upwelling, supporting marine biodiversity. Zone 6, in the equatorial region, experiences equatorial currents and upwelling influencing Chl-a variability. Zone 7, the PG, is notable for its unique hydrological conditions and proximity to oil-producing nations. This division enabled a region-specific analysis of the factors driving Chl-a dynamics, offering insights into how geographic and climatic factors influence marine productivity across the ASPG.
2.2 Satellite data and preprocessing
The monthly composite Level-3 MODIS-Terra (hereafter referred to as MODIS) Chl-a and SST data, with a 4 km spatial resolution for 2001–2019, were obtained from NASA’s Ocean Biology Processing Group (https://oceancolor.gsfc.nasa.gov/). MODIS-Terra data were selected over MODIS-Aqua due to their longer temporal coverage. A comparison of the accuracy between MODIS-Terra and MODIS-Aqua data was conducted in our subsequent research, revealing consistent seasonal variability and trends in Chl-a across the ASPG, thus confirming the reliability of MODIS-Terra for this study.
Due to factors such as cloud cover, sun glint, and other atmospheric issues, the ASPG region experiences significant gaps in the data, particularly during the summer monsoon season. For instance, a previous study reported that the missing data rate for MODIS-Aqua daily Chl-a between 2020 and 2021 fluctuated significantly in the northern AS, with an overall rate ranging from 65% to 100% (Yan et al., 2023). These data gaps can result in the loss of important local information. Therefore, it is essential to reconstruct missing Chl-a and SST data. In this study, the DINEOF method was employed to fill in the missing data over the ASPG (Section 2.4 below). Before reconstruction, all Chl-a and SST data were filtered, and images with more than 95% cloud coverage were discarded to maintain accuracy. Additionally, Chl-a data were log-transformed before reconstruction to meet DINEOF’s assumption of normality, given the wide range of Chl-a values.
Once the data were reconstructed, the MODIS Chl-a and SST values at each station were obtained by averaging values from a 3 × 3 window centered on the station’s location. To eliminate the seasonal cycle influence, the long-term monthly mean for each month across all years was subtracted from the corresponding monthly time series. This process generated monthly anomalies of Chl-a and SST for each station, which were then used to compute Chl-a_A and SST_A trends over the entire study period. Furthermore, correlation statistics were calculated for the time series of Chl-a_A and SST_A at each station to quantitatively analyze the relationship between these anomalies.
2.3 Reanalysis data and preprocessing
From 2001 to 2019, weekly wind data at a spatial resolution of 0.12° × 0.12° and a height of 10 meters above the surface were obtained from the European Centre for Medium-Range Weather Forecasts (ECMWF) Interim Reanalysis (ERA-Interim). To represent monthly climatological patterns, these weekly wind data were averaged for each of the 12 months, spanning from January 2001 to December 2019. ERA-Interim is a global atmospheric reanalysis product that combines model-based predictions with observations from various sources to provide a consistent, comprehensive estimate of numerous atmospheric and oceanic parameters. Furthermore, the wind data were used to compute the Ekman transport components for each month during the study period, based on the formulas provided by Kok et al. (2017) in Equations 1, 2.
where u corresponds to the wind coming from the west (with positive values indicating eastward wind) and v corresponds to the wind coming from the south (with positive values indicating northward wind). The parameter ρair represents the density of air, valued at 1.22 kg m-3, while ρwater represents the density of water, valued at 1025 kg m-3. Additionally, c is the drag coefficient, and f is the Coriolis parameter. The calculated components of Ekman transport, ETx and ETy, were used to generate monthly plots of Ekman transport, providing a visual representation of its variability over time.
The analysis of Ekman transport is critical for understanding upwelling processes. This involves decomposing the movement of water masses into perpendicular components to calculate the Coastal Upwelling Index (CUI). Specifically, a “coast angle” is formed between a northward vector and the landward side of the shoreline, which is determined through geometric measurements at each coastal station. Using geometric tools, these angles are measured and incorporated into the computation of the CUI. Specifically, θ represents the angle perpendicular to the oceanward unit vector relative to the mean shoreline location. The CUI quantifies coastal upwelling by factoring in the strength and direction of Ekman transport in relation to the coastline. In this study, the study area is divided into eight stations (as shown in Figure 1) to assess the upwelling intensity across the region. The effective angles of the coastline are calculated by averaging the angles of arbitrary coastal lines with respect to the equator at each of the eight coastal stations. The formulas used for CUI calculation is provided in Equations 3 (Kok et al., 2017).
where ϕ represents the angle between the coastline and the equator. According to the definition of CUI, a positive CUI indicates regions where upwelling conditions are favorable, while a negative CUI suggests that upwelling is unfavorable.
2.4 DINEOF reconstruction
DINEOF was employed to reconstruct missing data in the MODIS Chl-a and SST datasets over the ASPG from 2001 to 2019. We utilized the DINEOF 3.0 package (Alvera-Azcárate et al., 2005; Beckers and Rixen, 2003), available for download from the GeoHydrodynamics and Environment Research (GHER) website. The reconstruction process followed these key steps:
1. Each dataset was organized into a 3D matrix (y × x × t), where y and x represent the latitude and longitude dimensions of each image, and t is the total number of images, ensuring that y×x> t. For Chl-a data, the natural logarithm was applied to prevent negative values during reconstruction, while raw SST data were used without transformation.
2. The mean value across both spatial and temporal dimensions was subtracted from the matrix, and missing data points were initialized to zero to minimize bias in the initial guess.
3. Iterative singular value decomposition (SVD) (Toumazou and Cretaux, 2001) and cross-validation using 3% of randomly selected valid data were employed to identify the optimal empirical orthogonal function (EOF) modes.
4. The optimal EOF modes were then used to reconstruct the entire dataset. For further details on the DINEOF methodology, see Alvera-Azcárate et al. (2005) and Beckers and Rixen (2003).
To verify the accuracy of the DINEOF reconstruction, we randomly selected 1% of the valid pixels from the original Chl-a and SST datasets, treating them as “missing values” (Yang et al., 2021). The remaining valid pixels were left unchanged to ensure that only invalid pixels were involved in the reconstruction process. After performing the DINEOF method, the reconstructed values for the 1% of randomly selected pixels were compared with their original values to evaluate the accuracy of the reconstruction.
2.5 Trend calculation
The Mann-Kendall test and Sen’s slope trend analysis are widely employed to assess the magnitude and significance of trends in Chl-a and SST using long-term satellite-derived datasets. The Mann-Kendall test is a non-parametric statistical method used to identify trends in time series data and is based on the variance of the data (Solidoro et al., 2009). Sen’s slope (Sen, 1968), another non-parametric method, estimates the magnitude of monotonic trends over time and detects their presence at a chosen significance level. Non-parametric tests, such as these, offer higher statistical power when dealing with non-normally distributed data, which is often the case for Chl-a, and are resistant to the influence of outliers. In this study, a significance level of 95% was used to determine trend significance. Both the Mann-Kendall test and Sen’s slope were calculated using MATLAB.
To further investigate relationships among Chl-a_A, SST_A, and Wind_A, Pearson’s correlation coefficients (r) were calculated, and their significance was tested using Student’s t-test at a 5% significance level (p < 0.05). Regression analyses were also conducted for each variable pair, with statistical performance evaluated through slope, coefficient of determination (R²), bias, and root mean square error (RMSE).
3 Results
3.1 DINEOF reconstruction and validation for Chl-a and SST
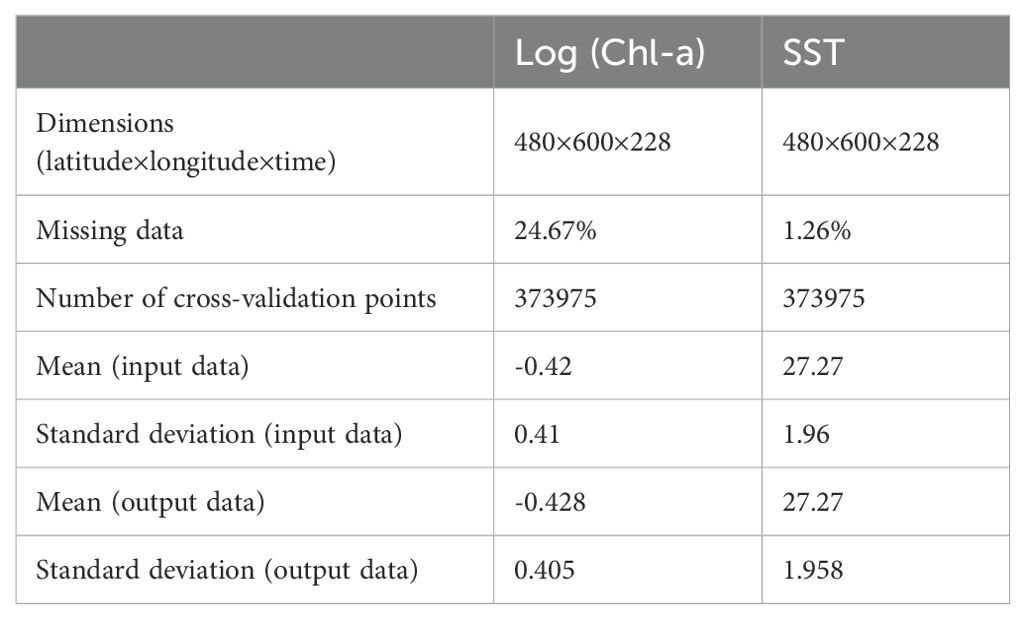
MODIS monthly log-transformed Chl-a and linear SST data from 2001 to 2019 were reconstructed using the DINEOF technique. The reconstruction statistics are presented in Table 1, where the missing data rates for Chl-a and SST are 24.67% and 1.26%, respectively. This highlights the critical role of DINEOF in reconstructing Chl-a data, which has a significantly higher missing data rate. Additionally, the means of the input and output data for both Chl-a (-0.42 for input and -0.428 for output) and SST (27.27 for both input and output) are almost identical. Similarly, the standard deviations for input and output data are very close for both Chl-a (0.41 for input and 0.405 for output) and SST (1.96 for input and 1.958 for output). These similarities indicate that the distribution of the reconstructed Chl-a and SST data closely matches that of the original data, suggesting a high accuracy of the reconstruction.
To evaluate the quality of the reconstructed data, we selected one image of the reconstructed Chl-a from August and one image of the reconstructed SST from June for comparison with the original SST and Chl-a images (see Figure 2). The original images exhibited numerous spatial gaps, particularly in the Chl-a data. In contrast, the reconstructed images were more continuous and displayed a more coherent spatial distribution.
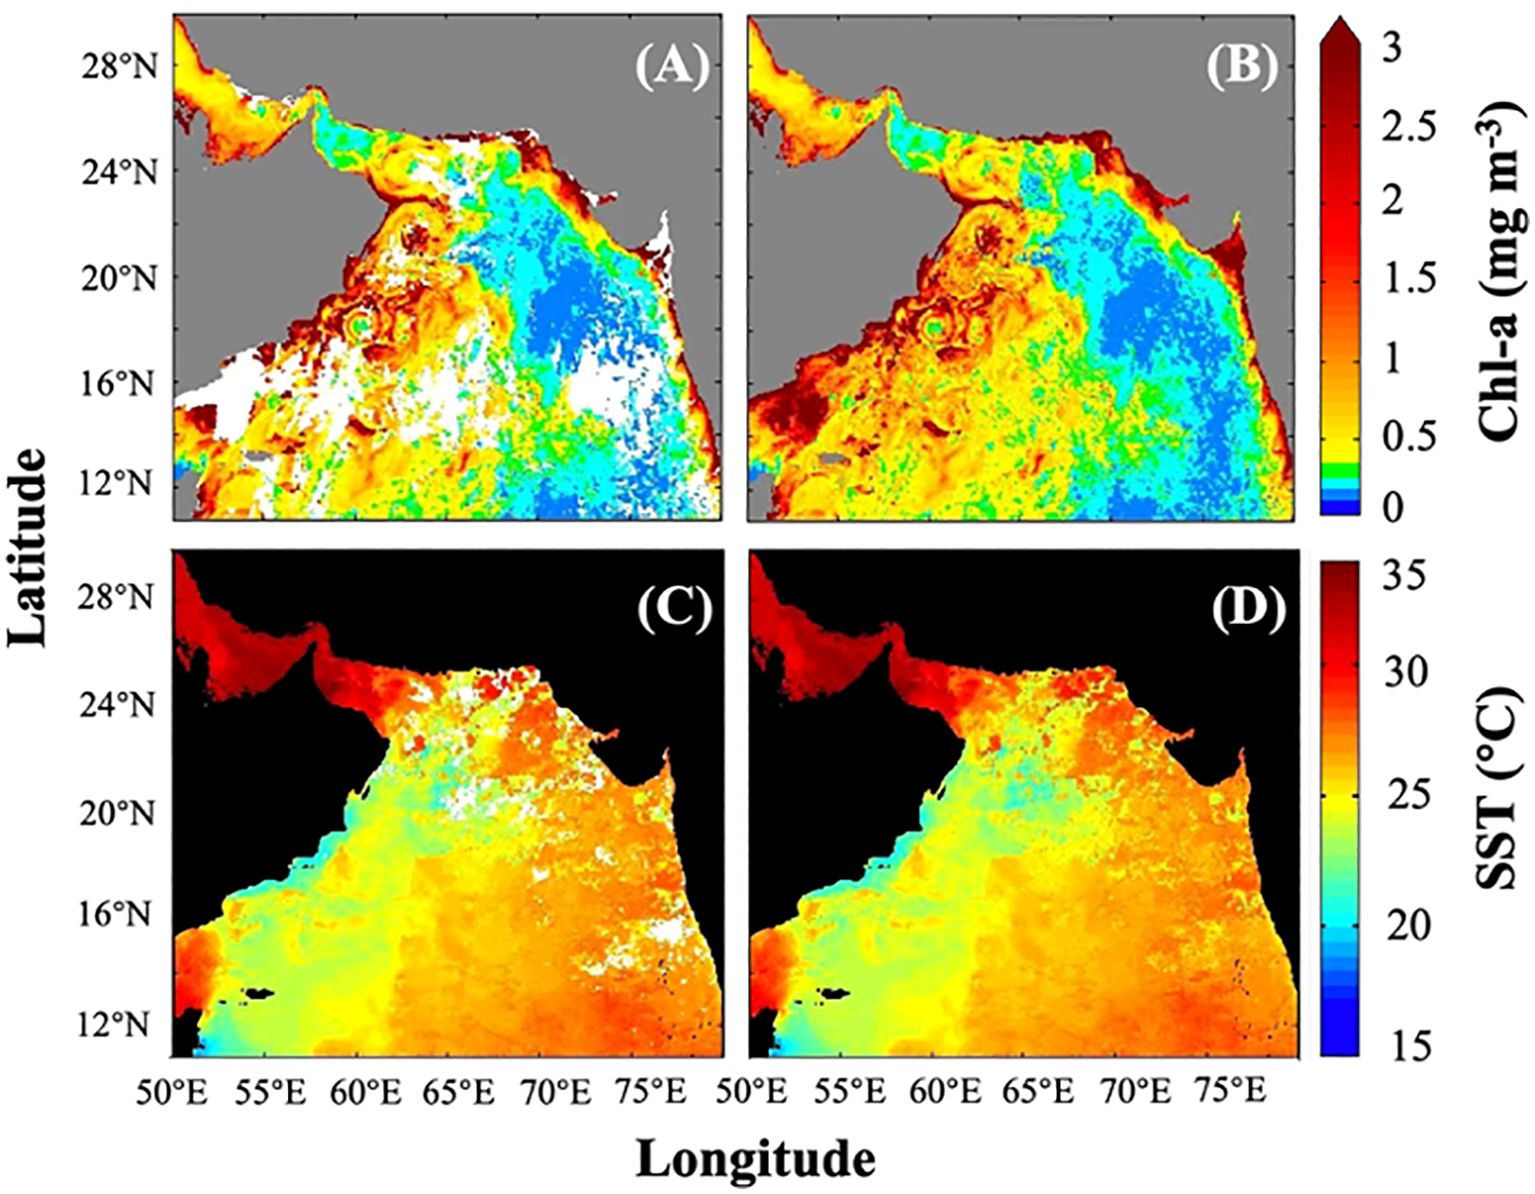
Figure 2. MODIS Chl-a in August and MODIS SST in June: (A, C) original cloudy data, and (B, D) data reconstructed using the DINEOF method.
We further conducted a cross-validation of the reconstructed Chl-a and SST data using the method described earlier. The results of the comparison between the reconstructed and original Chl-a/SST data are presented in the density plots shown in Figure 3. Both reconstructions showed strong correlations with the original data, as evidenced by favorable metrics: slope (0.86 for Chl-a, 0.95 for SST), R² (0.84 for Chl-a, 0.96 for SST), bias (0.002 for Chl-a, 0.04 for SST), and RMSE (0.16 for Chl-a, 1.52 for SST). Additionally, the density plots, which represent the number of data points within each 4 km × 4 km grid bin, show an increasing trend towards the 1:1 line. This suggests that the data reconstructed using the DINEOF method are both accurate and reliable.
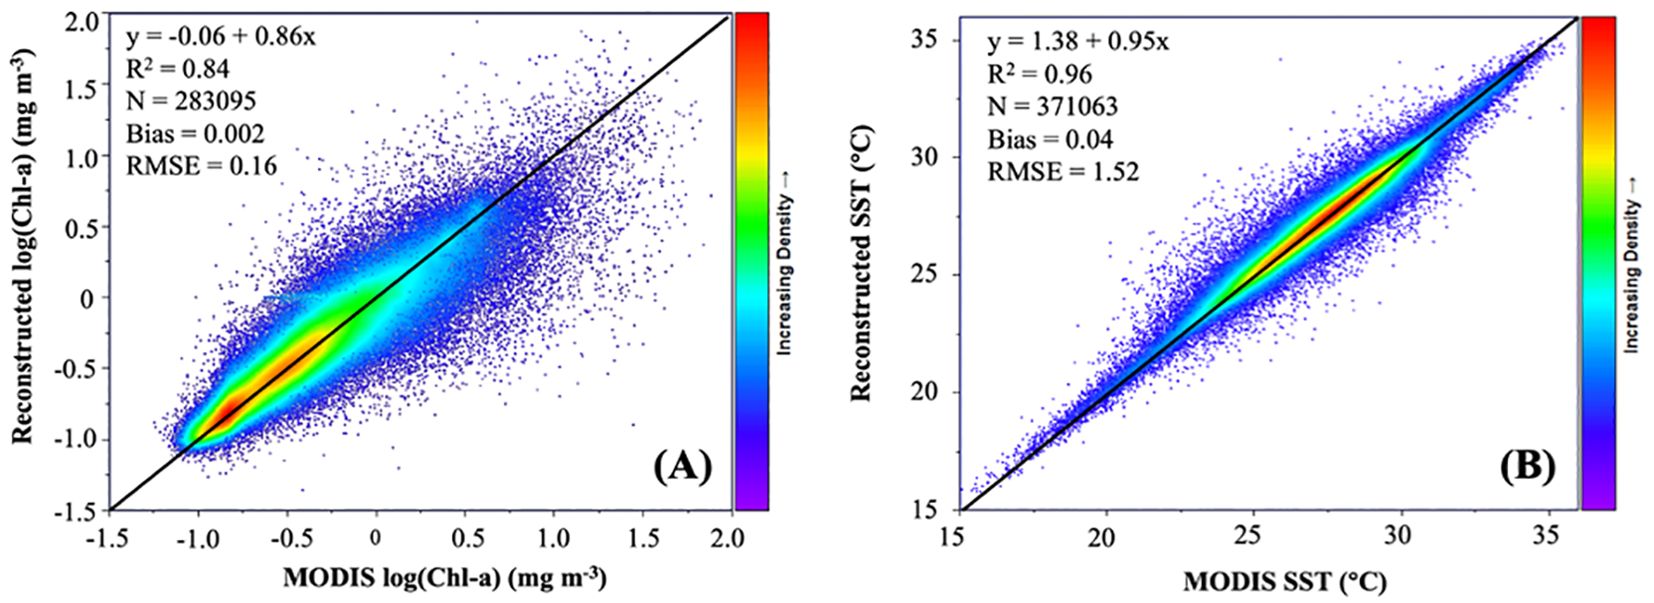
Figure 3. Density plots: (A) log(Chl-a) (reconstructed) vs Chl-a (original) and (B) SST (reconstructed) vs SST (original). The black solid lines are the 1:1 line.
3.2 Monthly climatology of Chl-a in the ASPG
Based on the reconstructed data, the interannual monthly climatology of Chl-a from 2001 to 2019 was generated. Hovmöller diagram (Figure 4) displays monthly Chl-a time series along latitudinal sections at 17°N, 21°N, and 25°N, as well as longitudinal sections at 61°E, 64°E, and 67°E. The interannual variability of Chl-a across both latitudinal and longitudinal gradients is further detailed in the Supplementary Materials (Supplementary Figures 1, 2). This study focuses on the monthly variability of Chl-a, with all plots in Figure 4 consistently capturing the well-established seasonal cycle in the ASPG. Chl-a concentrations peak during summer, with a secondary peak in winter, and reach their lowest levels during the transitional months. Spatially, the highest concentrations are observed near the western and northern coastlines. This seasonal cycle is driven primarily by the SW monsoon during summer and the NE monsoon in winter.
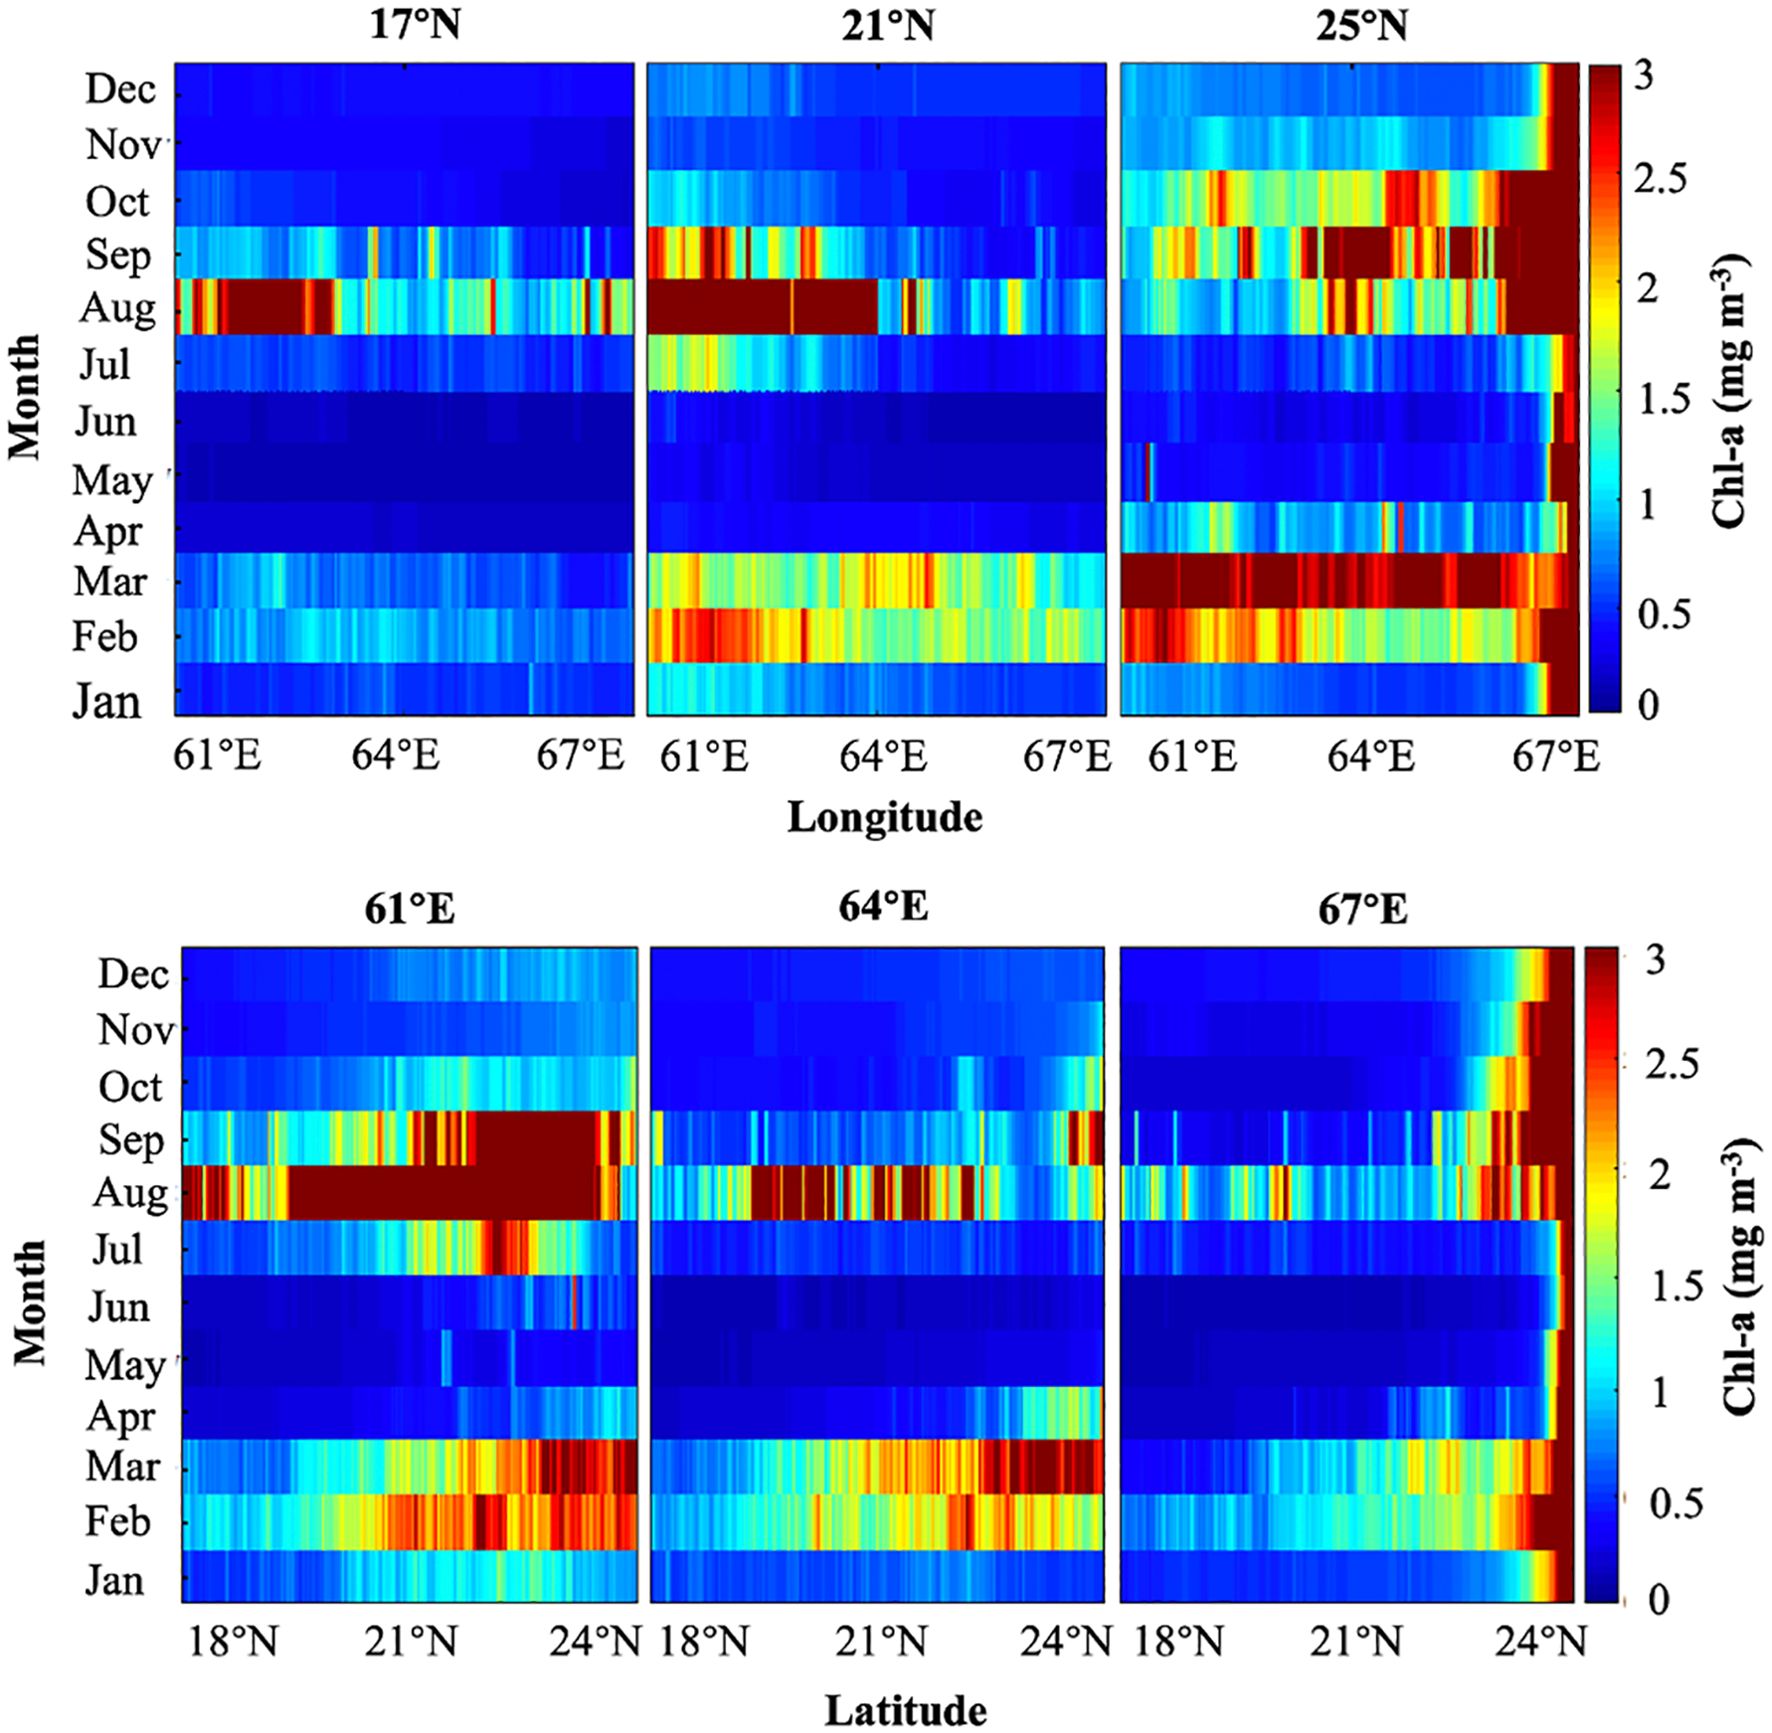
Figure 4. A Hovmöller diagram illustrating the monthly variability of reconstructed MODIS Chl-a from January to December at 17°N, 21°N, and 25°N, as well as at 61°E, 64°E, and 67°E.
Along the latitudinal sections, chlorophyll-a (Chl-a) exhibited two annual peaks: a major peak in summer and a minor peak in winter (Figure 4). At 17°N, which is closer to the equator, Chl-a concentrations remain consistently lower throughout the year. Nevertheless, two distinct peaks are observed, one in summer (August and September) and the other in winter (February and March). As latitude increases to 21°N, Chl-a concentrations rise significantly during both seasons, with the summer peak occurring between July and September and the winter peak between February and March. Further north at 25°N, a coastal region forming the northern boundary of the AS, Chl-a levels remain high and productive throughout most of the year, with pronounced peaks during the summer (August to October) and winter (February to March). Additionally, Chl-a concentrations increase gradually with longitude. Overall, the AS is heavily influenced by monsoonal dynamics, impacting both coastal regions and open ocean waters.
Similarly, along the longitudinal sections, Chl-a exhibited two seasonal peaks, with the exception of the northeastern region (Figure 4). At 61°E, closer to the western coast, Chl-a levels remain consistently higher throughout the year, particularly in the northern regions. Two seasonal peaks are apparent, occurring during summer (July to September) and winter (February to March). At 64°E, while the temporal and spatial patterns of Chl-a are similar, the overall concentration is slightly lower. Moving further east to 67°E, distinct spatial and temporal distribution patterns emerge. Specifically, between 21°N and 23°N, Chl-a exhibits two peaks in summer (August) and winter (February), while between 23°N and 24°N, Chl-a increases markedly and remains elevated throughout the year. These spatial variations highlight the complex interplay between monsoonal forces and the unique oceanographic characteristics of different regions within the AS.
3.3 Long-term trends of Chl-a associated with SST and wind
To analyze long-term trends in Chl-a and SST, the interannual monthly anomaly data were used to compute Sen’s slope for each pixel, where positive and negative values indicate increasing and decreasing trends, respectively, and a value of zero denotes no trend. The statistical significance of Sen’s slope was assessed using the Mann-Kendall (MK) test, with results coded as 1 for significant trends and 0 for non-significant trends. Non-significant Sen’s slope values were masked, indicated by white areas. The spatial distributions of Sen’s slope, along with the MK test results for Chl-a_A and SST_A, are illustrated in Figures 5A, B, respectively.
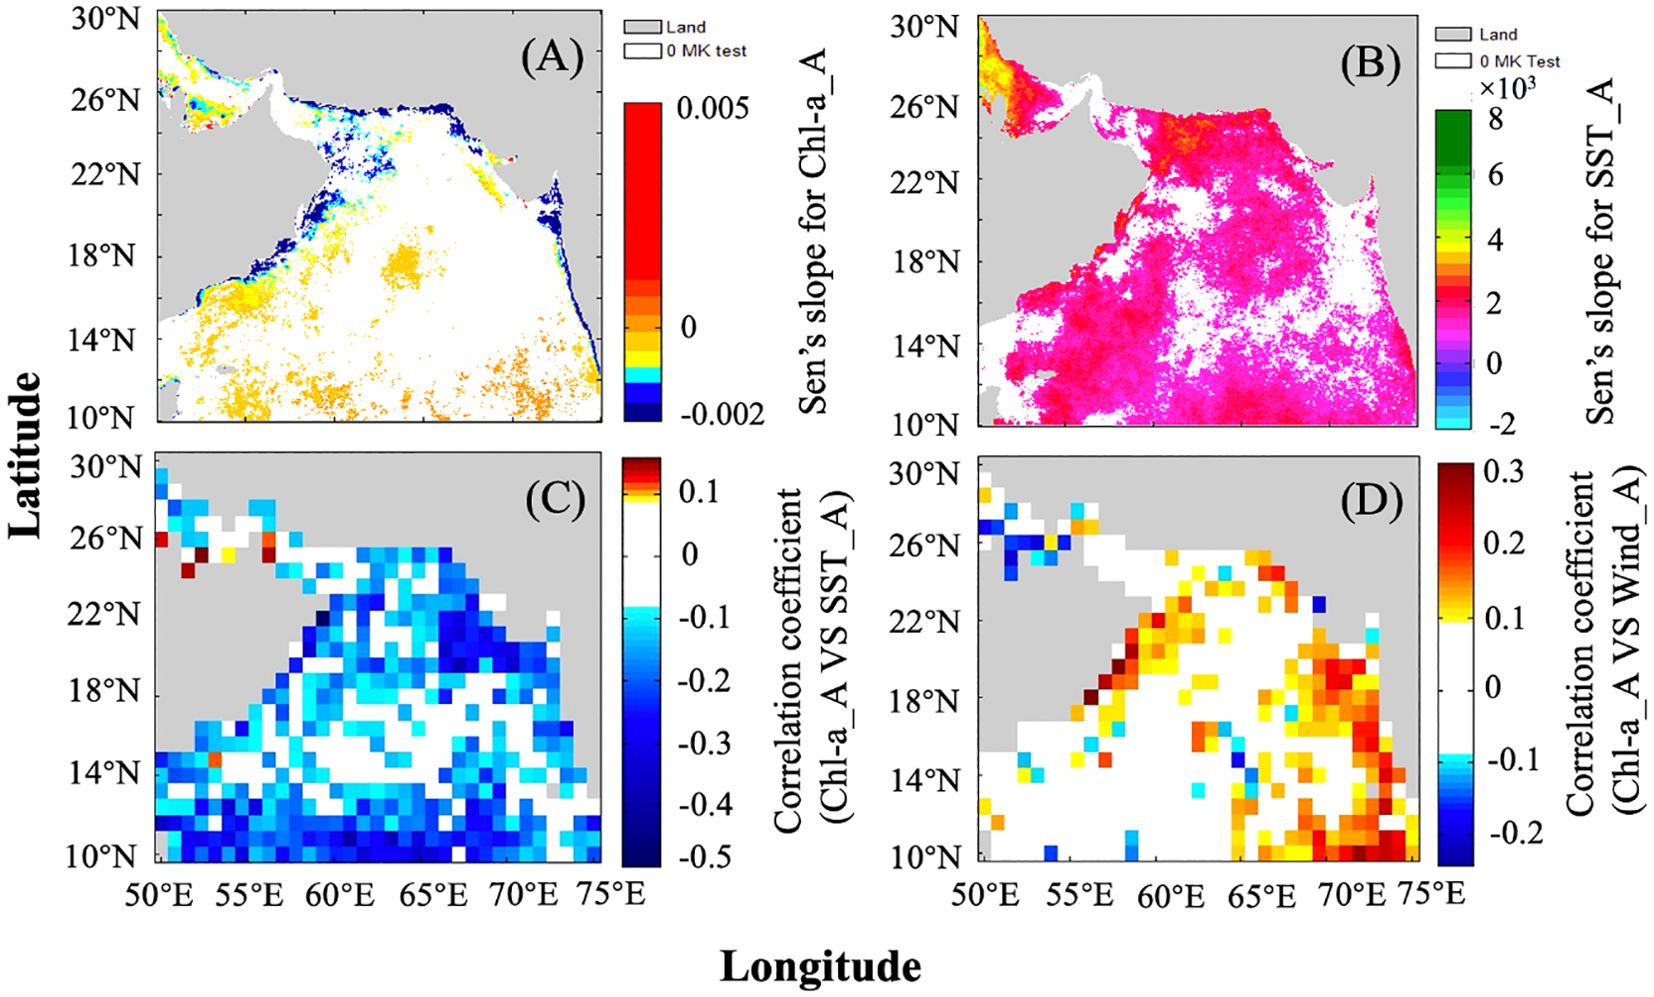
Figure 5. Spatial distributions of Sen’s slopes and MK-test results for (A) Chl-a_A and (B) SST_A over the ASPG from 2001 to 2019, along with the spatial distributions of r values between (C) Chl-a_A and SST_A, as well as (D) Chl-a and Wind_A over the same period.
The Sen’s slope values for Chl-a_A with statistically significant MK-test results were primarily concentrated in the coastal areas of the ASPG. Most values were negative across the entire ASPG, indicating a declining trend in Chl-a levels. In the AS, the lowest Sen’s slope values were observed along the Arabian coasts, gradually increasing towards open sea waters, with some positive values in the southeastern region. In contrast, in the PG, Sen’s slope values increased from the northern to the southern coasts. For SST_A, Sen’s slope values with significant MK-test results were widespread across the ASPG, with all values being positive, reflecting a rising trend in SST. In the AS, larger Sen’s slope values were observed along the Arabian coasts, decreasing towards open sea waters. In the PG, the highest Sen’s slope values were found in the northwestern region, diminishing towards the southern part of the gulf. The detailed statistical summaries of Sen’s slope values for both Chl-a_A and SST_A are presented in the Supplementary Materials (Supplementary Table 1).
For the 21 selected stations shown in Figure 1, significant Sen’s slope values were identified at only four stations: Z3-S1 (open sea waters near the Oman coast), Z5-S2 (open sea waters near the Yemen coast), Z5-S3 (coastal waters near the Oman coast), and Z7-S2 (southern PG). The Sen’s slope values for these stations are detailed in the Supplementary Materials (Supplementary Table 2). Additionally, Sen’s slope values for SST_A and Wind anomalies (Wind_A) were calculated for these stations, as they are two key factors influencing Chl-a variability. The calculation of Wind_A followed the same methodology used for Chl-a_A and SST_A. As shown in Supplementary Table S2, all four stations exhibited a decreasing trend in Chl-a_A. The trends for SST_A were significantly positive at Z3-S1, Z5-S2, and Z5-S3, but there was no significant trend at Z7-S2. For Wind_A, significant positive trends were observed at Z5-S2 and Z7-S2, while no significant trends were found at Z3-S1 and Z5-S3. These results highlight the complex interplay between Chl-a, SST, and wind patterns across different regions of the ASPG.
To assess the impact of SST and wind on the long-term trends of Chl-a, correlation coefficients (r) between Chl-a_A and SST_A, as well as Chl-a_A and Wind_A, were calculated for each pixel (Figures 5C, D). The r values between Chl-a_A and SST_A were predominantly negative across the ASPG, indicating an inverse relationship between these variables, with a few positive values in the southern PG suggesting localized positive correlations. Additionally, the majority of these correlations were statistically significant throughout the ASPG. In contrast, the r values between Chl-a_A and Wind_A were mostly positive in the AS, signifying a positive correlation, while in the PG, the r values were generally negative. Significant correlations between Chl-a_A and Wind_A were primarily observed along the Oman coast, northeastern Arabian coast, and western Indian coast in the AS, as well as in the southern PG. The detailed statistical summaries of r values between Chl-a_A and SST_A, as well as Chl-a_A and Wind_A are presented in the Supplementary Materials (Supplementary Table 3).
Since significant trends in Chl-a_A were only detected at four stations—Z3-S1, Z5-S2, Z5-S3, and Z7-S2—the time series of Chl-a_A, SST_A, and Wind_A were extracted for these locations to further examine temporal variability and the correlations between Chl-a_A and SST_A, as well as Chl-a_A and Wind_A. A detailed statistical summary of these correlations, covering the entire study period, the southwestern monsoons, the northeastern monsoons, and the transitional months (pre- and post-southwestern monsoons), is presented in Table 2. At Z3-S1, no significant correlations between Chl-a_A and either SST_A or Wind_A were observed for any time frame. At Z5-S2, two significant correlations were found between Chl-a_A and Wind_A: one positive correlation for the entire study period and the other positive correlation during the northeastern monsoons. At Z5-S3, three significant correlations were identified between Chl-a_A and SST_A—one for the entire study period, one for the northeastern monsoons, and another during the transitional months. At Z7-S2, two significant correlations emerged between Chl-a_A and Wind_A: one for the entire study period and the other during the southwestern monsoons. These results underscore the regional differences in the relationships between Chl-a_A and SST_A, as well as Chl-a_A and Wind_A.
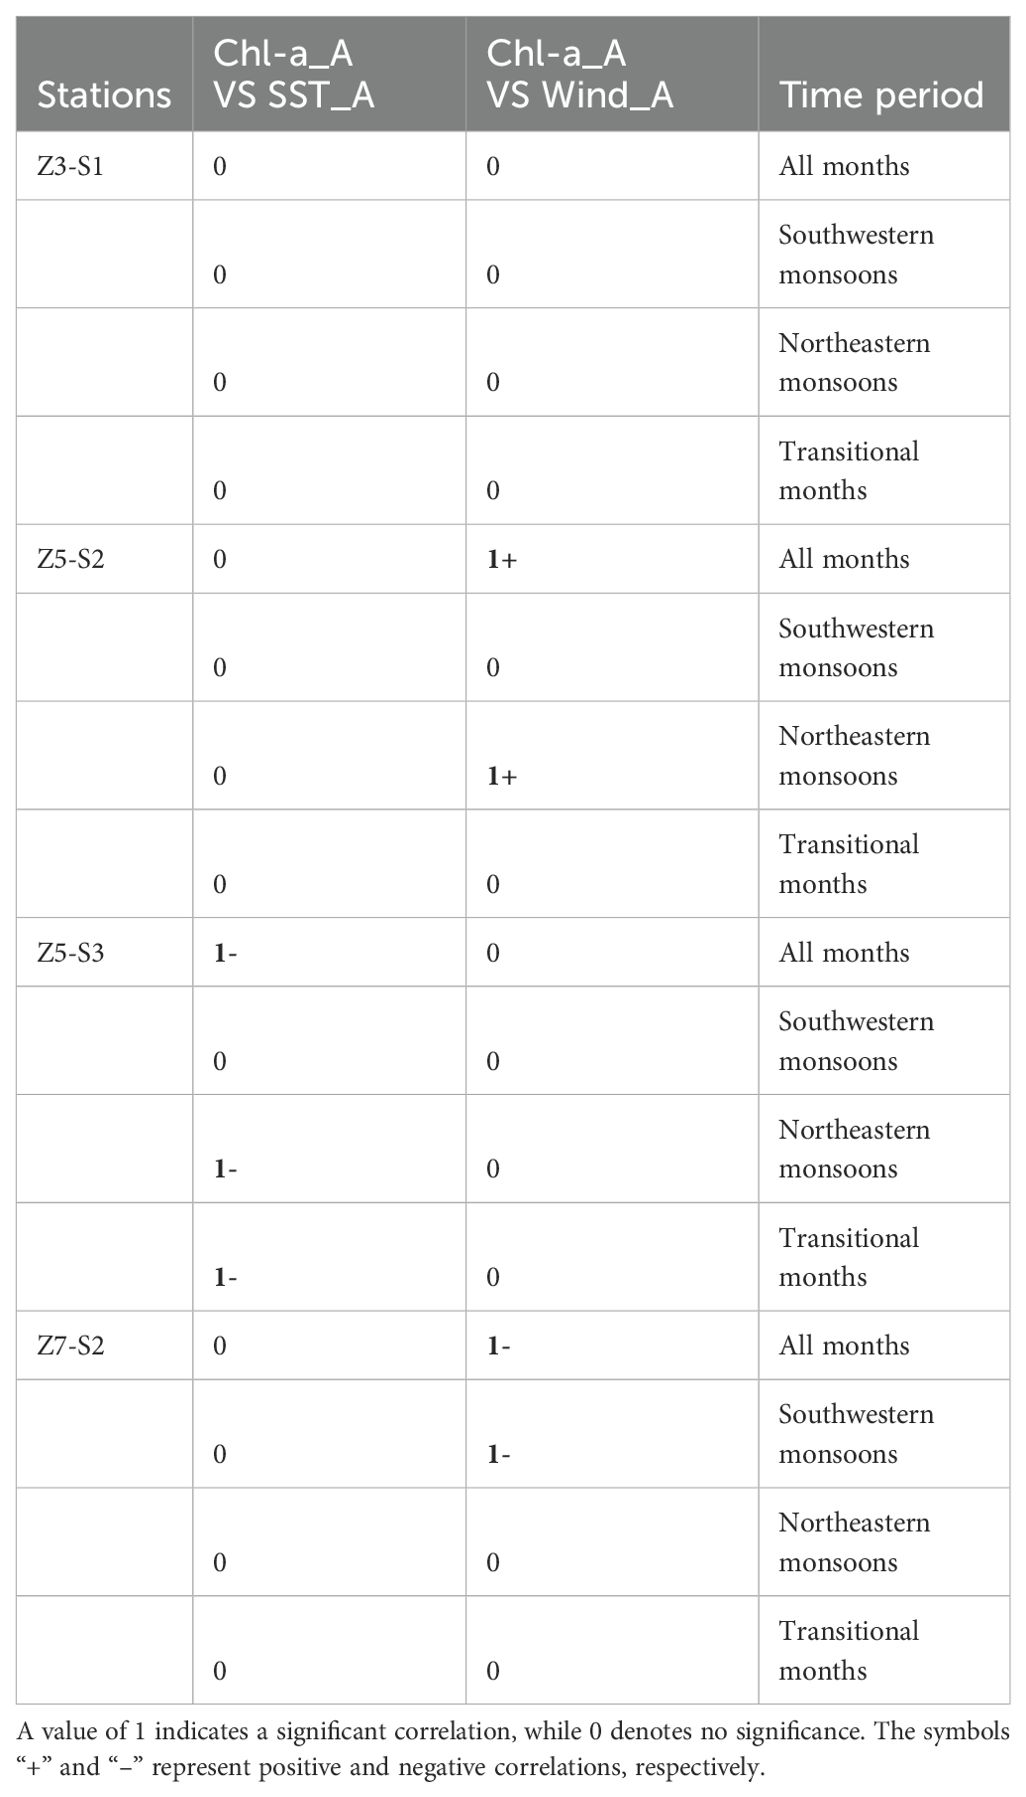
Table 2. Statistical summary of the significance of r values between Chl-a_A and SST_A, as well as Chl-a_A and Wind_A, at the four stations for the entire study period, southwestern monsoon seasons, northeastern monsoon seasons, and transitional months from 2001 to 2019.
The time series of Chl-a_A, SST_A, and Wind_A at four stations (Z3-S1, Z5-S2, Z5-S3, and Z7-S2) are presented in Figure 6. The coefficient of variation (CV) was used to quantify variability, revealing the highest Chl-a_A variation at Z5-S3 (6.50E+16), followed by Z5-S2 (-1.77E+16), Z3-S1 (-1.47E+16), and Z7-S2 (-3.49E+15). SST_A variation was highest at Z5-S3 (-4.24E+15), followed by Z3-S1 (-2.54E+15), Z7-S2 (-1.34E+15), and Z5-S2 (1.04E+15). Wind_A exhibited the most variation at Z3-S1 (6246.99), followed by Z7-S2 (152.20), Z5-S2 (-93.41), and Z5-S3 (-93.41). Due to the low spatial resolution of wind data, Z5-S2 and Z5-S3 shared the same dataset. Large Chl-a_A outliers were observed at Z3-S1 (e.g., August 2003, February 2017), Z5-S2 (e.g., September 2001, February 2008), and Z5-S3 (e.g., August 2002, 2009, 2017). Although not fully explored, some anomalies were linked to specific oceanographic events. For example, the high Chl-a_A value in August 2003 coincided with a cold-core eddy near the Somali coast, which likely contributed to elevated Chl-a_A concentrations during this period (Prakash et al., 2012). These findings highlight the complex dynamics influencing Chl-a_A variability.
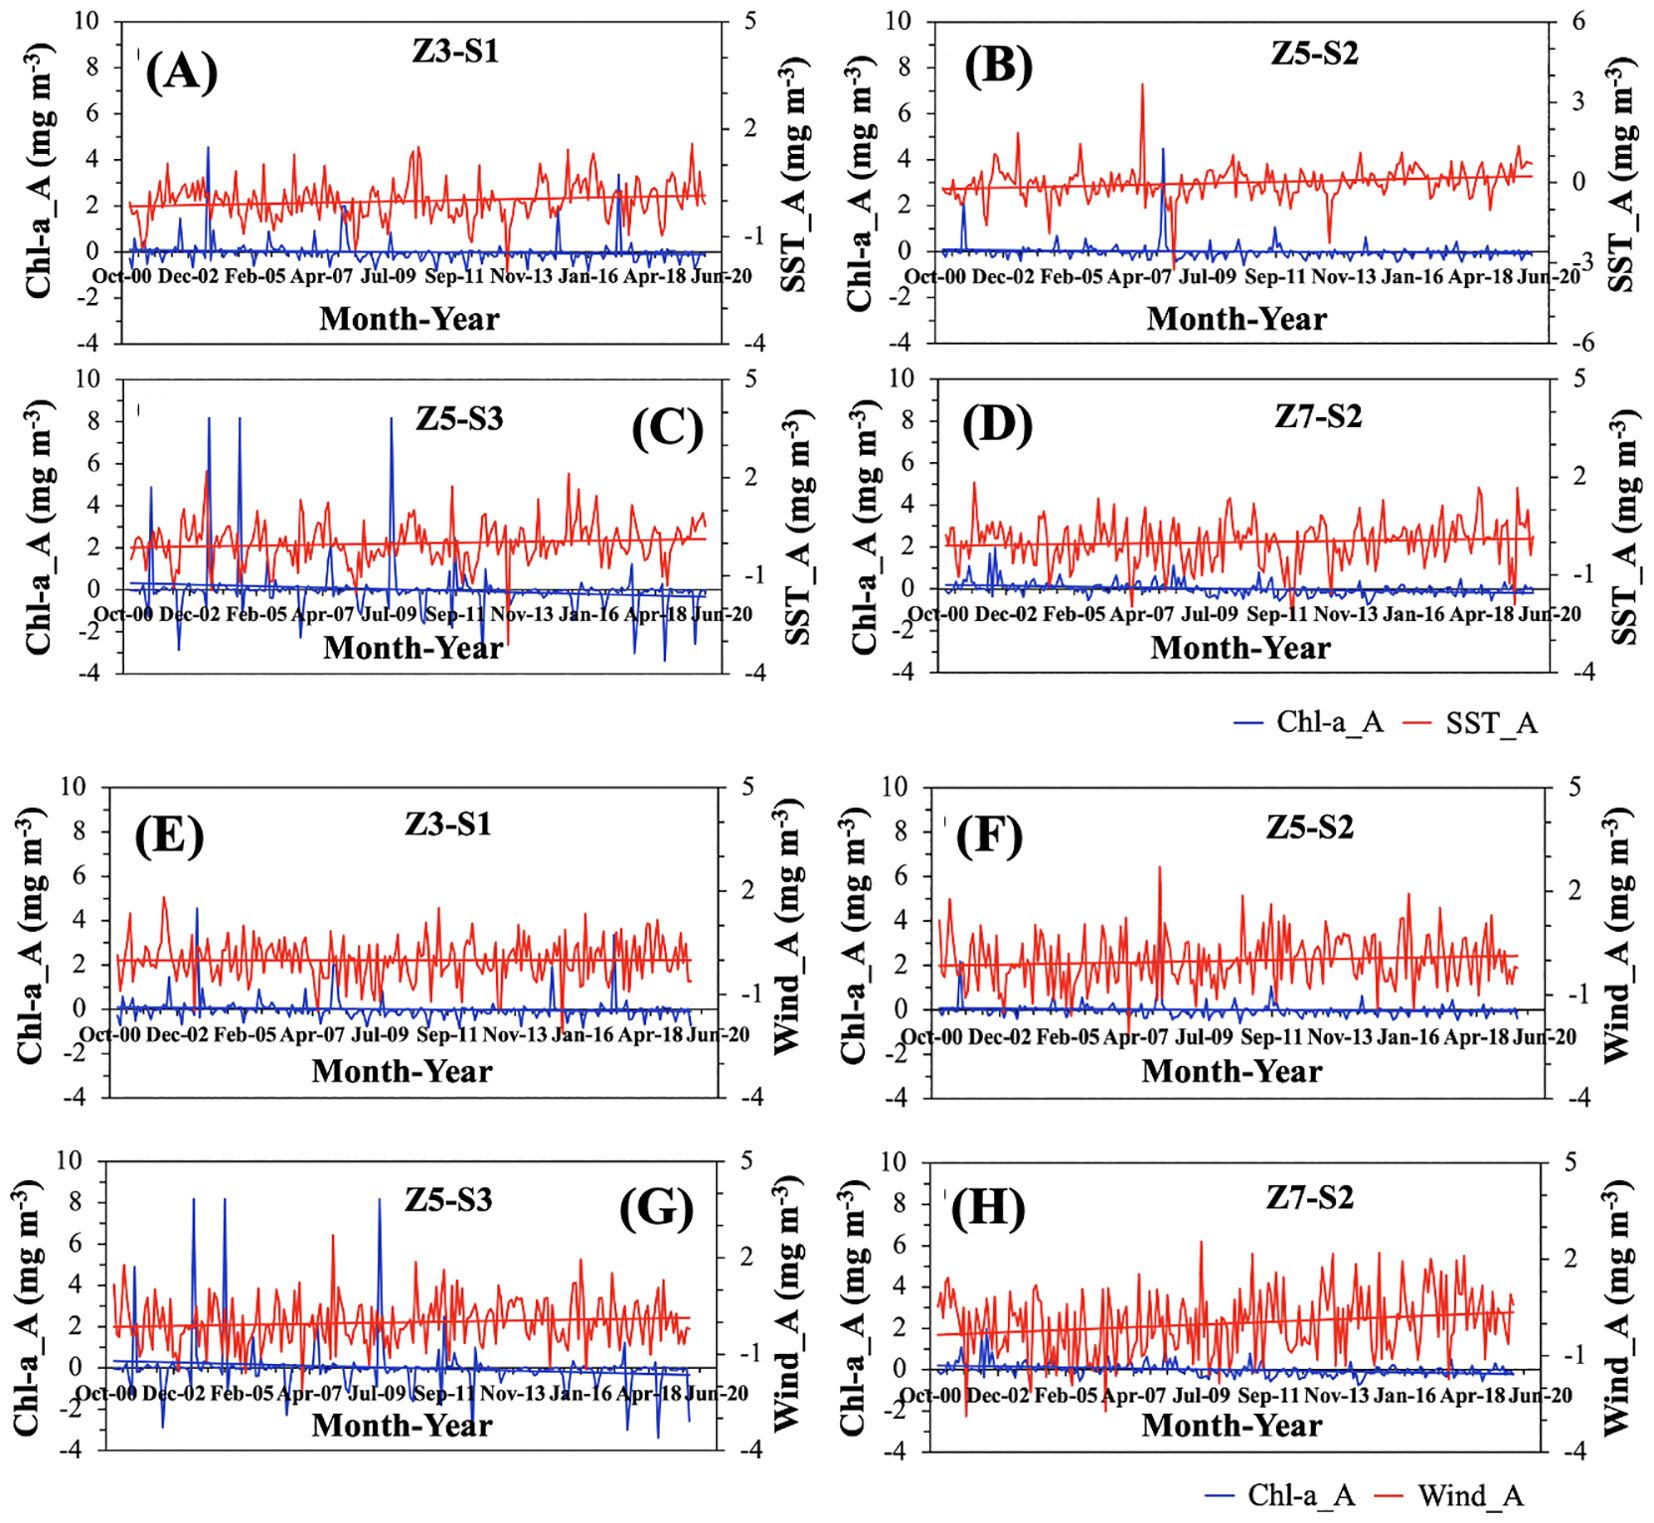
Figure 6. Time series of Chl-a_A and SST_A at four stations—(A) Z3-S1, (B) Z5-S2, (C) Z5-S3, and (D) Z7-S2—spanning the period from January 2001 to December 2019 are shown. The blue and red lines represent the respective trendlines for Chl-a_A and SST_A. Similarly, time series of Chl-a_A and Wind_A at the same four stations—(E) Z3-S1, (F) Z5-S2, (G) Z5-S3, and (H) Z7-S2—are presented for the same period, with blue and red lines depicting the trendlines for Chl-a_A and Wind_A, respectively.
4 Discussion
4.1 Advantages of using the DINEOF to fill in the data gaps
In this study, the DINEOF method was employed to reconstruct MODIS datasets of Chl-a and SST over the ASPG from 2001 to 2019. The primary source of missing data in the original datasets was adverse weather conditions, such as cloud cover and rainfall. Specifically, 24.67% of the Chl-a data and 1.26% of the SST data were missing, as shown in Table 1. The relatively high percentage of missing Chl-a data underscores the significance of applying DINEOF for accurate reconstruction in this region. The comparison between the original and reconstructed datasets demonstrated that the mean and standard deviation values were closely aligned (Table 1), confirming the precision and reliability of the DINEOF reconstruction. Additionally, visual comparisons of the original and reconstructed Chl-a and SST data for specific dates, illustrated in Figures 2, 3, reveal smooth and plausible patterns in the reconstructed outputs. Further validation, through cross-correlation analysis (Figure 4), shows strong agreement between the reconstructed and original datasets for both Chl-a and SST, reinforcing the robustness of the reconstruction method. In future research, we aim to integrate field observations to further enhance the validation of our reconstructed data.
To the best of our knowledge, only a limited number of studies have utilized the DINEOF method to reconstruct satellite-derived Chl-a datasets in specific regions like the AS or PG. Even fewer have applied DINEOF to simultaneously reconstruct both Chl-a and SST datasets over the entire ASPG. For instance, Jayaram et al. (2018) employed DINEOF to reconstruct MODIS-Aqua Chl-a data over the AS for the period 2002–2015. This study primarily investigated the seasonal and interannual variability of Chl-a, highlighting the method’s utility in regions with frequent data gaps due to cloud cover. Similarly, Huang et al. (2022) used DINEOF to reconstruct Chl-a datasets from the Ocean Colour Climate Change Initiative (OC-CCI) by the European Space Agency (ESA) over the AS from 1998 to 2017. In contrast, Khan et al. (2019) and Khan et al. (2022) extended the application of DINEOF by reconstructing both MODIS-Terra monthly Chl-a and SST datasets from 2001 to 2017. Their studies analyzed the seasonal variability and explored the correlations between Chl-a and SST over the entire study area. However, while they provided valuable insights into the seasonal dynamics of Chl-a and SST, their work did not examine the long-term trends in Chl-a.
In light of these gaps, the present study offers a more comprehensive approach by not only reconstructing both Chl-a and SST datasets using DINEOF but also performing an in-depth analysis of the spatio-temporal variability and long-term trends of Chl-a across the entire ASPG from 2001 to 2019. This extended temporal range allows us to assess the potential impacts of climate variability and oceanographic changes on Chl-a dynamics in the region. Additionally, by reconstructing both Chl-a and SST, we are able to investigate their interactions and correlations over time, providing a more holistic view of the region’s marine ecosystem dynamics. Our study contributes to the broader field of oceanography by demonstrating the effectiveness of DINEOF in reconstructing multi-variable datasets and its potential application in other regions where satellite data is frequently compromised by missing observations.
4.2 Impact of SST and wind on the spatiotemporal variability of Chl-a
The seasonal variability of Chl-a, as revealed in Figure 4, aligns with findings from previous studies (Lévy et al., 2007; Sarma et al., 2012; Piontkovski et al., 2013; Jayaram et al., 2018; Khan et al., 2022), where monsoon-driven wind reversals were identified as the main drivers of phytoplankton blooms. These wind shifts significantly impact mixed-layer dynamics and promote upwelling, bringing nutrient-rich waters from the deeper ocean to the surface, which fuels phytoplankton growth during both the SW and NE monsoon seasons (Goes et al., 2005; Jayaram et al., 2018). This is further supported by the monthly climatology of wind patterns from 2001 to 2019 (Figure 7), which reveals stronger southwestern winds during the SW monsoon and weaker northeastern winds during the NE monsoon, with the weakest winds observed during the transitional periods.
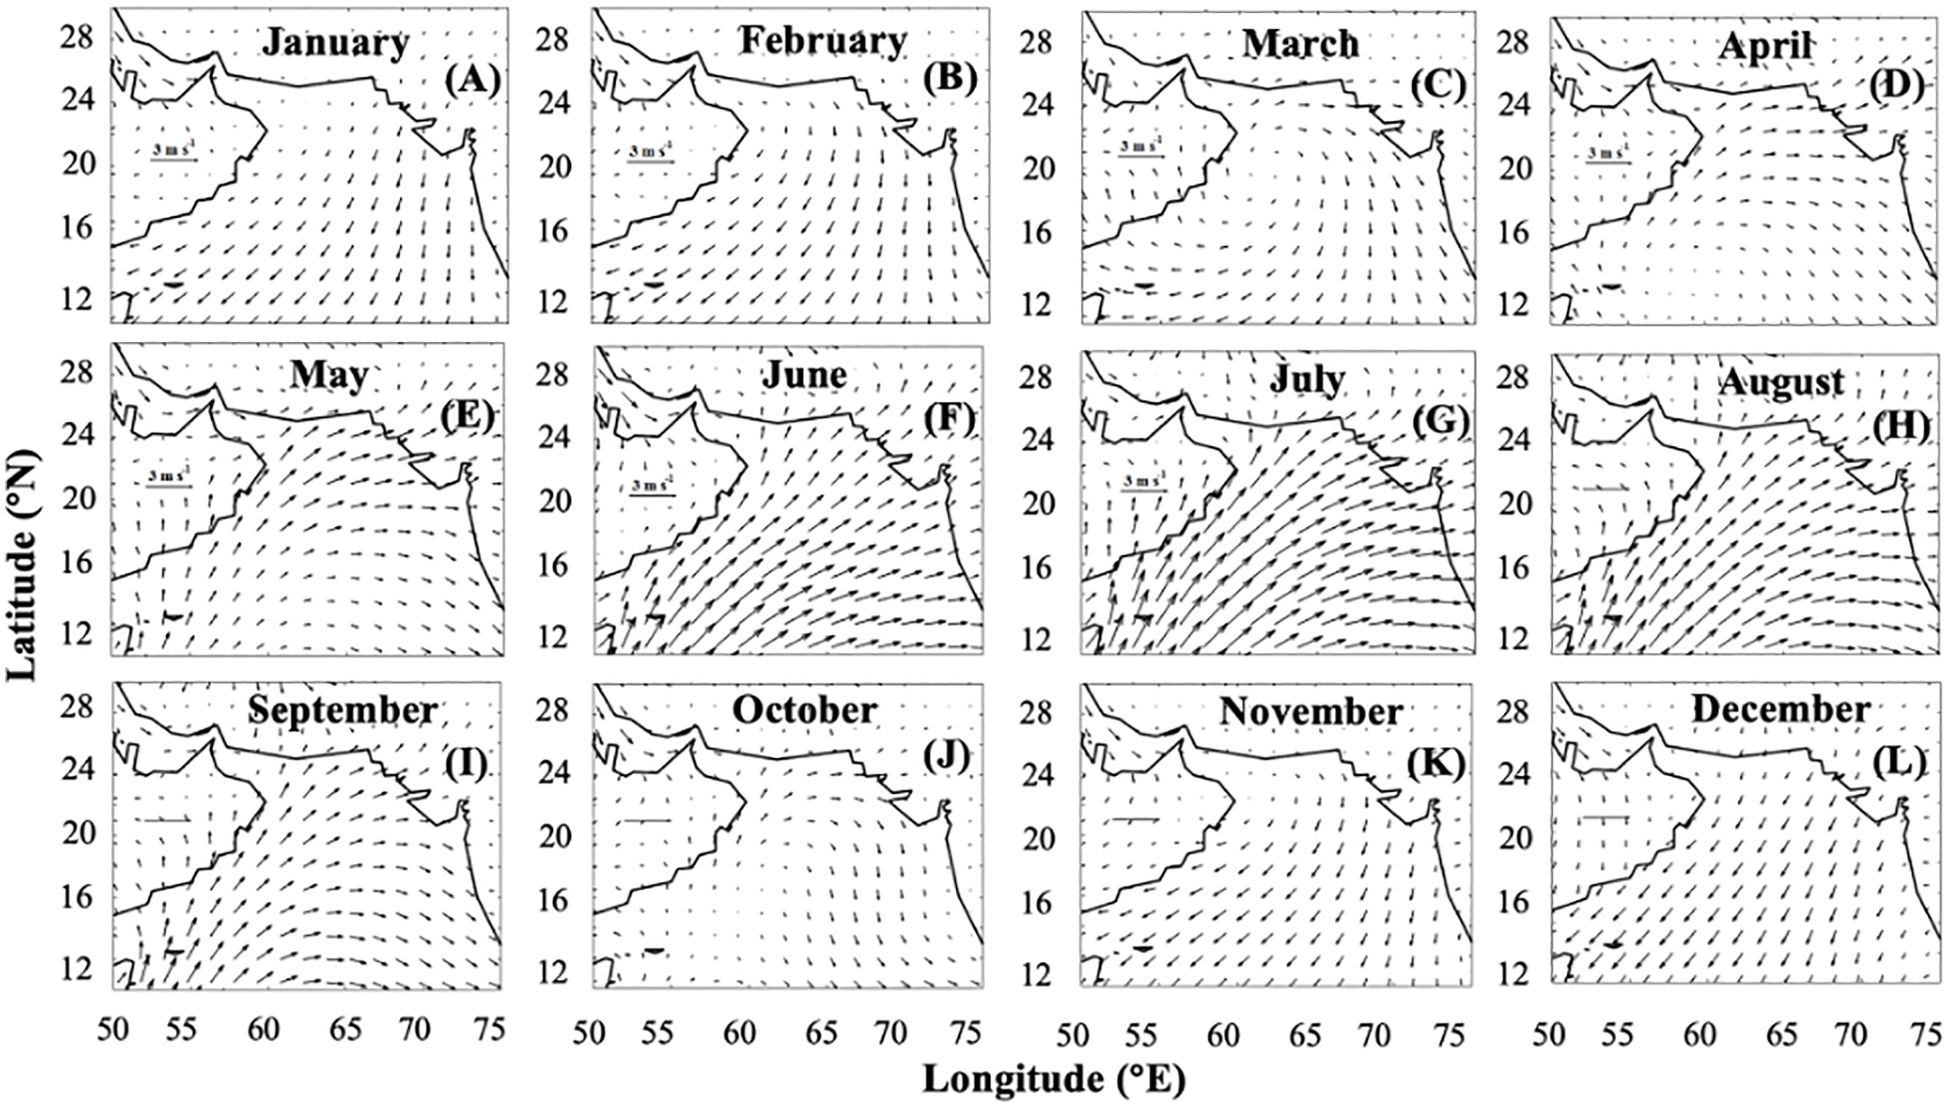
Figure 7. Monthly climatology of wind vectors over the ASPG from January to December (A–L). Vectors in all panels have the same scaling to allow for direct comparison of wind intensity across different months. Quantitative values of wind speeds are also provided for reference.
Ekman transport, derived from wind data, exhibits distinct seasonal variability across the ASPG, as illustrated in the Supplementary Materials (Supplementary Figure 3). In the AS, it peaks during the summer monsoon, driving surface water offshore and promoting upwelling, with a maximum value of approximately 2 m³ s-1 m-1 in July. In winter, the transport shifts southeast, resulting in downwelling. In contrast, Ekman transport in the PG remains minimal throughout the year, with the highest values observed in June, directed northeast.
To further investigate upwelling dynamics, an upwelling index was calculated using wind vectors at eight coastal stations (Figure 1). These coastal stations were strategically selected for their proximity to known upwelling regions, such as Kochi, Duqm, and Qishn, which are significantly influenced by seasonal monsoonal winds. Additional stations were chosen based on their alignment with nearshore data points within each zone to ensure comprehensive coverage. Spanning a wide latitudinal range across the ASPG, these stations provide a thorough spatial representation of upwelling zones. This selection forms a robust foundation for analyzing upwelling dynamics and their influence on regional Chl-a variability.
The time series of the monthly upwelling indices (Figure 8) reveals that upwelling was most pronounced along the western and southeastern coasts of the AS (Duqam, Qishn, Kochi), followed by the northern PG (Bandar Bushehr) and northeastern AS (Karachi) during the SW monsoon. Higher Chl-a concentrations in the western and northern AS (Figure 4) suggest that upwelling is a key driver of Chl-a variability in these regions during the SW monsoon. Notably, the monthly Chl-a data for the southeastern AS and northern PG are not depicted in Figure 4. However, a prior study by Khan et al. (2019) reported elevated Chl-a levels in the southeastern AS during the SW monsoon, whereas the northern PG did not exhibit similar increases during this period; instead, higher Chl-a concentrations were noted during the NW monsoon. This discrepancy suggests that the effects of upwelling on Chl-a variability differ between the AS and PG.
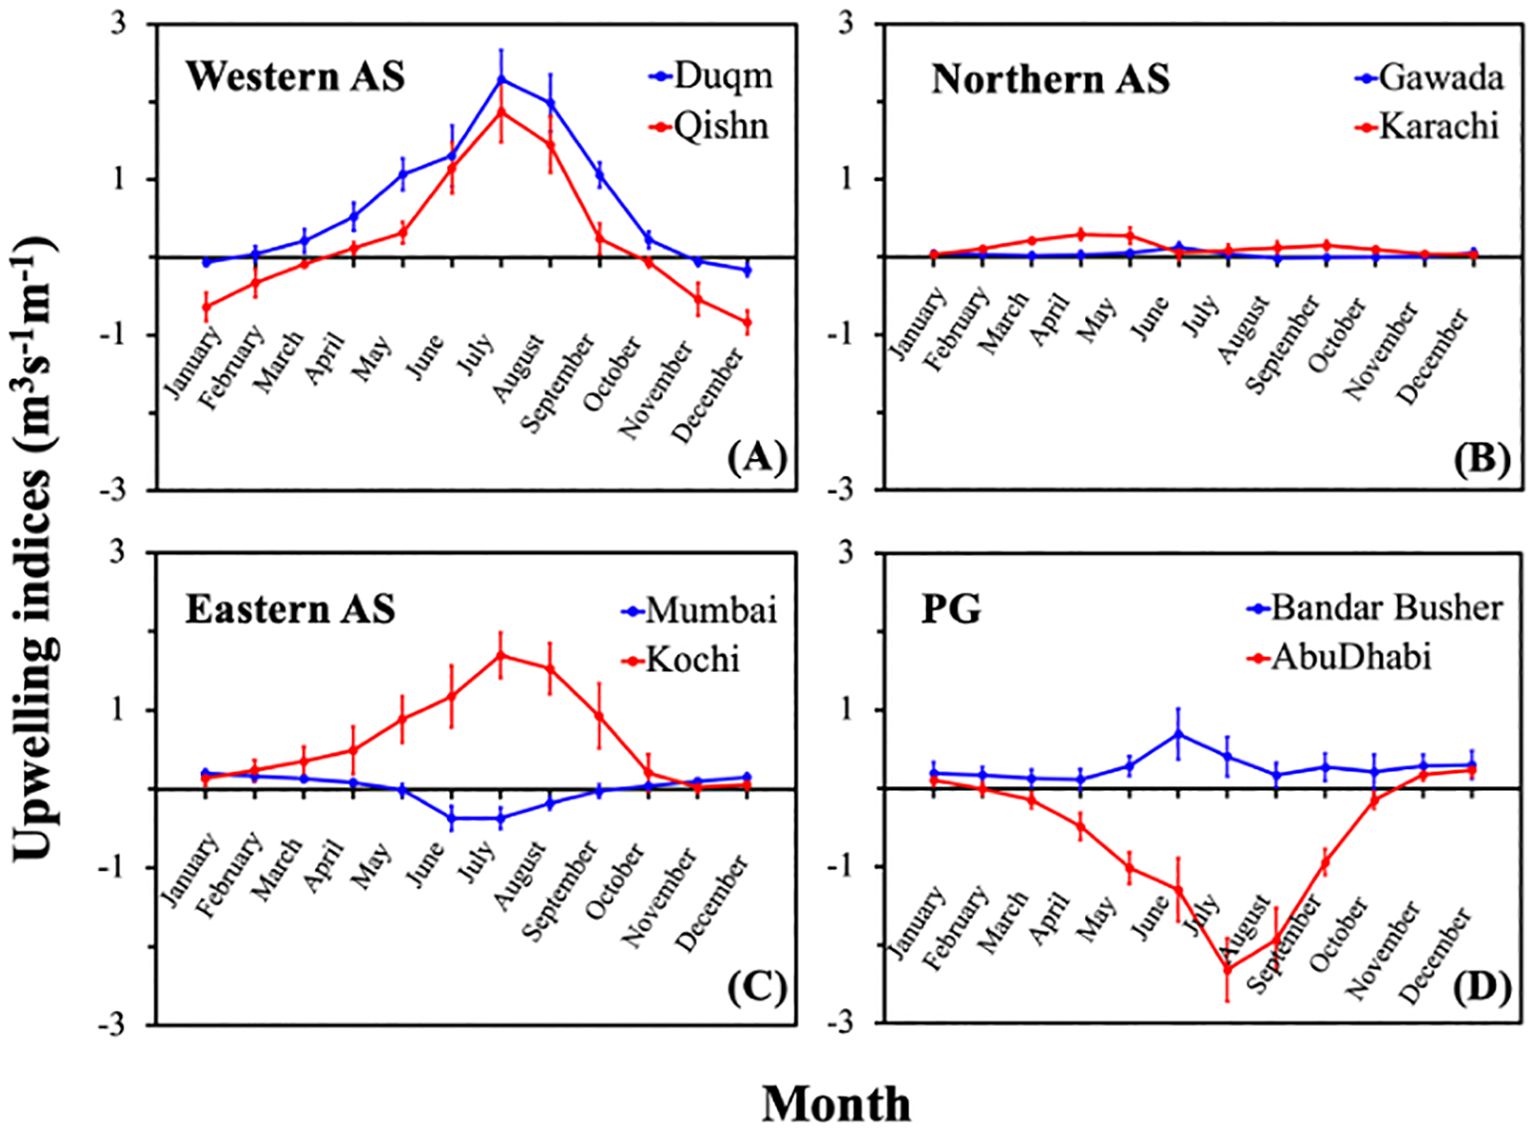
Figure 8. Time series of monthly averaged coastal upwelling indices from 2001 to 2019 for (A) Duqm and Qishn stations along the western AS coast, (B) Gawada and Karachi stations along the northern AS stations, (C) Mumbai and Kochi stations along the eastern AS stations, and (D) Bandar Busher and Abu Dhabi stations along the PG coast. Error bars in each plot represent one standard deviation.
We also observed that the timing of Chl-a peaks varies across different regions of the AS (Figure 4). A previous study by Jayaram et al. (2018) reported that the northern AS was more productive during the winter monsoon, while the southern coastal regions were less productive, and vice versa. Our findings refine this observation, indicating that the southwestern AS is more productive during the summer monsoon, with reduced productivity in the northern coastal regions, except for the northeastern area. Their study also identified intra-seasonal variability, with a primary productivity peak during the onset phase of the summer monsoon and a secondary peak during the withdrawal phase in the northern AS, in addition to a single dominant peak during the winter monsoon, based on Wavelet analysis. In contrast, our results show that the timing of Chl-a peaks varies across regions in both summer and winter in the northern AS. This regional variability aligns with the findings of Lévy et al. (2007), who similarly reported that the timing of peak productivity differs between regions within the northern AS, due to differences in local physical and oceanographic processes. These variations highlight the intricate relationship between large-scale monsoon patterns and local environmental conditions, showing that a detailed, region-specific analysis is essential for a complete understanding of Chl-a variability in this area.
Additionally, we examined the influence of SST on the spatiotemporal variability of Chl-a in the ASPG in our previous research. Khan et al. (2019) applied the DINEOF method to reconstruct monthly MODIS-Terra Chl-a and SST data from 2001 to 2017, revealing that the majority of the study area (96%) exhibited a significantly negative correlation between SST and Chl-a. Only a small portion (4%), including certain coastal areas, the PG, and parts of the southeastern AS, showed a significant positive correlation. This negative correlation is primarily driven by wind-induced upwelling, where cooler, nutrient-rich water is brought to the surface, resulting in higher Chl-a concentrations (Goes et al., 2005). Building on this, in our recent study (Khan et al., 2022), we utilized the same reconstructed MODIS-Terra Chl-a and SST datasets and found that regions with elevated Chl-a were associated with lower SST and strong Ekman transport, further validating the connection between upwelling and the negative correlation between Chl-a and SST. Our findings suggest that both SST and wind are key factors influencing the seasonal variability of Chl-a in the ASPG, with upwelling playing a critical role in regulating surface productivity in response to local wind patterns.
4.3 Influence of SST_A and wind_A trends on the Chl-a_A trend
Previous studies have revealed conflicting trends in Chl-a for the AS. Goes et al. (2005) reported a more than 350% increase in Chl-a off the Somali coast during the summer, attributed to the strengthening of southwestern monsoon winds. In contrast, Prasanna Kumar et al. (2010) observed a weak basin-wide increasing trend in the monthly Chl-a during September-October and the winter monsoon, but a decreasing trend during the summer monsoon from 1997 to 2007. They linked the Chl-a increase in September-October to dust-induced iron fertilization, which enhanced productivity when sufficient nitrate accumulated in the upper ocean. During winter, intensified evaporative cooling, driven by stronger winds, promoted convective mixing and the upward transport of nutrients from deeper layers, further supported by increased dust deposition, which together explained the Chl-a increase. Prakash et al. (2012) found an increasing Chl-a trend from 1997 to 2003, similar to Goes et al. (2005), but attributed it to a cold-core eddy in 2003, which enhanced Chl-a. However, from 2004 to 2010, they observed a decline in Chl-a off the Somali coast, suggesting that SLA, rather than SST or wind, were likely the main drivers. These studies highlight the spatial and temporal variability in Chl-a trends across the AS. Given the significant seasonal-to-interannual variability in this region, identifying long-term, climate-driven trends requires an extended dataset of at least a decade or more (McClain, 2009). Therefore, we used two decades of Chl-a data in this study. We also found a decreasing trend in the western AS (Figure 5A), consistent with Prakash et al. (2012).
Our results for the Persian Gulf align with previous studies, but with some differences. Moradi (2020) reported a mostly decreasing trend in annual Chl-a from 2002 to 2018 across the Persian Gulf, except for small areas in the southern and central regions, while SST showed an increasing trend throughout the Gulf, with the exception of the Strait of Hormuz. In contrast, we found non-significant trends in Chl-a in the central Persian Gulf and similarly non-significant trends in SST in the Strait of Hormuz (Figure 5B). Bordbar et al. (2024) observed an increasing SST trend in the entire Persian Gulf from 2003 to 2021, which differs slightly from our findings. This discrepancy could be attributed to differences in datasets or trend calculation methods. Regarding the correlation between Chl-a and SST, Bordbar et al. (2024) found an inverse relationship between SST and Chl-a throughout the Gulf, except in the southern region, which is consistent with our results (Figure 5C). Concerning surface winds, the northwesterly Shamal wind, prevalent year-round in the Persian Gulf (Perrone, 1979; Pous et al., 2013; Yu et al., 2016), has shown a positive trend over the past decades (Aboobacker and Shanas, 2018), consistent with the increasing wind trend observed at station Z7-S2 (Supplementary Table 2). Moreover, as Chl-a_A at Z7-S2 exhibited a decreasing trend (Supplementary Table 2), this led to a negative correlation between Chl-a_A and Wind_A at this station (Figure 5D).
5 Conclusion
In this study, we conducted a comprehensive analysis of the spatiotemporal variability and long-term trends of Chl-a across the ASPG using reconstructed MODIS monthly Chl-a and SST data from 2001 to 2019. The validation of the reconstructed dataset confirmed its high accuracy and reliability, ensuring the robustness of our findings. Our analysis revealed significant seasonal variability in Chl-a, with distinct regional differences. Generally, a pronounced Chl-a peak occurred in summer, followed by a secondary peak in winter, with the lowest levels observed during the transitional months. Chl-a concentrations were highest in the western and northeastern Arabian Sea. This seasonal pattern is primarily driven by the SW monsoon in summer and the NE monsoon in winter. Additionally, we observed regional variability in the timing of Chl-a peaks in both summer and winter, likely due to differences in local physical and oceanographic processes, such as wind patterns, vertical mixing, and nutrient availability.
Over the two decades from 2001 to 2019, Chl-a_A exhibited a significant decreasing trend along the coasts of the ASPG, with only small areas showing increasing trend in the southeastern AS and southern PG. At the regional level, an analysis of 21 stations identified significant Chl-a trends at four locations: Z3-S1, Z5-S2, and Z5-S3 in the western AS, and Z7-S2 in the southern PG. Correlation analysis revealed predominantly negative correlations between Chl-a_A and SST_A in the western AS, while correlations between Chl-a_A and Wind_A were positive in the western AS and negative in the southern PG. Significant correlations were found in specific cases: For Z5-S2, we observed a significant positive correlation between Chl-a_A and Wind_A throughout the study period and during the northeastern monsoon. For Z5-S3, significant negative correlations between Chl-a_A and SST_A were found over the entire study period, during the northeastern monsoon, and the transitional monsoons. Similarly, Z7-S2 exhibited significant negative correlations between Chl-a_A and SST_A over the entire period and during the southwestern monsoon. These three stations also displayed significant positive trends in both SST_A and Wind_A.
This research advances our understanding of the complex dynamics of marine ecosystems in the ASPG, shaped by both local physical processes and broader climate variability. Future studies should investigate additional factors, such as sea level anomalies (SLA), wind stress curl (curlτ), and the horizontal (u) and vertical (v) components of wind vectors, and their influence on Chl-a trends, as well as explore the underlying mechanisms driving these changes. Such research will deepen our knowledge of marine productivity trends in the ASPG and their broader ecological implications.
Data availability statement
The raw data supporting the conclusions of this article will be made available by the authors, without undue reservation.
Author contributions
MY: Conceptualization, Data curation, Formal analysis, Funding acquisition, Investigation, Methodology, Project administration, Resources, Software, Supervision, Validation, Visualization, Writing – original draft, Writing – review & editing. FK: Conceptualization, Data curation, Formal analysis, Investigation, Methodology, Software, Validation, Visualization, Writing – review & editing. HF: Writing – review & editing. EM: Formal analysis, Writing – review & editing. JI: Writing – review & editing. DL: Funding acquisition, Project administration, Writing – review & editing. SW: Project administration, Writing – review & editing.
Funding
The author(s) declare financial support was received for the research, authorship, and/or publication of this article. This research was funded by the Natural Science Foundation of Shandong Province, China, (Grant #ZR202211290173), the Scientific Startup Foundation for Doctors of Taishan University (Grant #Y-03-2022016), and the Youth Innovation Promotion Association of the Chinese Academy of Sciences (Grant #2021313).
Acknowledgments
The authors express our sincere gratitude to the data service provided by the NASA’s Ocean Biology Processing Group (OBPG), and the European Centre for Medium-Range Weather Forecasts (ECMWF) Interim Reanalysis (ERA-Interim).
Conflict of interest
The authors declare that the research was conducted in the absence of any commercial or financial relationships that could be construed as a potential conflict of interest.
Generative AI statement
The author(s) declare that no Generative AI was used in the creation of this manuscript.
Publisher’s note
All claims expressed in this article are solely those of the authors and do not necessarily represent those of their affiliated organizations, or those of the publisher, the editors and the reviewers. Any product that may be evaluated in this article, or claim that may be made by its manufacturer, is not guaranteed or endorsed by the publisher.
Supplementary material
The Supplementary Material for this article can be found online at: https://www.frontiersin.org/articles/10.3389/fmars.2024.1520775/full#supplementary-material
References
Aboobacker V. M., Shanas P. R. (2018). The climatology of shamals in the Arabian Sea-Part 1: Surface winds. Int. J. Clim. 38, 4405–4416.
Alvera-Azcárate A., Barth A., Rixen M., Beckers J. M. (2005). Reconstruction of incomplete oceanographic datasets using Empirical Orthogonal Functions: Applications to the Adriatic Sea. Ocean Model. 9, 325–346. doi: 10.1016/j.ocemod.2004.08.001
Beckers I. M., Rixen M. (2003). EOF calculations and data filling from incomplete oceanographic datasets. J. Atmos. Ocean Technol. 20, 1839–1856. doi: 10.1175/1520-0426(2003)020<1839:ECADFF>2.0.CO;2
Bordbar M. H., Nasrolahi A., Lorenz M., Moghaddam S., Burchard H. (2024). The Persian Gulf and Oman Sea: Climate variability and trends inferred from satellite observations. Estuarine Coast. Shelf Sci. 296, 108588. doi: 10.1016/j.ecss.2023.108588
Goes J. I., Thoppil P. G., do R. Gomes H., Fasullo J. T. (2005). Warming of the eurasian landmass is making the Arabian sea more productive. Science 308, 545–548. doi: 10.1126/science.1106610
Huang K., Xue H., Chai F., Wang D., Xiu P., Xie Q., et al. (2022). Inter-annual variability of biogeography-based phytoplankton seasonality in the Arabian Sea during 1998-2017. Deep Sea Res. Part II: Top. Stud. Oceanogr. 200, 105096.
Jayaram C., Priyadarshi N., Kumar J. P., Udaya Bhaskar T. V. S., Raju D., Kochuparampil A. J. (2018). Analysis of gap-free chlorophyll-a data from MODIS in Arabian Sea, reconstructed using DINEOF. Int. J. Remote Sens. 39, 7506–7522. doi: 10.1080/01431161.2018.1471540
Keerthi M. G., Lengaigne M., Vialard J., de Boyer Montégut C., Muraleedharan P. M. (2013). Interannual variability of the Tropical Indian Ocean mixed layer depth. Clim. Dyn. 40, 743–759. doi: 10.1007/s00382-012-1411-2
Khan F. A., Khan T. M. A., Udin R. M. G. (2019). Satellite based Monitoring of Interactions between Chl-a and SST in the Arabian Sea and Persian Gulf area: a useful tool to identify ocean productive zones. J. Space Technol. 9, 9–14. doi: 10.13189/jst2019.091001
Khan F. A., Yang M., Khan T. M. A., Khan M. A. (2022). Detection of productive oceanic areas in the Arabian Sea and Persian Gulf based on reconstructed satellite-derived sea surface temperature and chlorophyll-a. Pak. J. Engg. Appl. Sci. 31, 1–13.
Khan H., Govil P., Panchang R., Agrawal S., Kumar P., Kumar B., et al. (2023). Surface and thermocline ocean circulation intensity changes in the western Arabian Sea during ∼172 kyr. Quaternary Sci. Rev. 311, 108133. doi: 10.1016/j.palaeo.2023.110033
Kok P. H., Akhir M. F. M., Tangang F., Husain M. L. (2017). Spatiotemporal trends in the southwest monsoon wind-driven upwelling in the southwestern part of the South China Sea. PloS One 12, 1–22. doi: 10.1371/journal.pone.0171979
Lévy M., Shankar D., André J.-M., Shenoi S. S. C., Durand F., de Boyer Montégut C. (2007). Basin-wide seasonal evolution of the Indian Ocean’s phytoplankton blooms. J. Geophys Res-Oceans 112, C12014. doi: 10.1029/2007JC004090
Li Y., He R. (2014). Spatial and temporal variability of SST and ocean color in the gulf of Maine based on cloud-free SST and chlorophyll reconstructions in 2003–2012. Remote Sens. Environ. 144, 98–108. doi: 10.1016/j.rse.2014.01.019
Liu X., Wang M. (2018). Gap filling of missing data for VIIRS global ocean color products using the DINEOF method. IEEE Trans. Geosci. Remote Sens. 56, 4464–4476. doi: 10.1109/TGRS.2018.2820423
McClain C. R. (2009). A decade of satellite ocean color observations. Annu. Rev. Mar. Sci. 1, 19–42. doi: 10.1146/annurev.marine.010908.163650
Miles T. N., He R. (2010). Temporal and spatial variability of chl-A and SST on the south atlantic bight revisiting with cloud-free reconstructions of MODIS satellite imagery. Cont Shelf Res. 30, 1951–1962. doi: 10.1016/j.csr.2010.08.016
Moradi M. (2020). Trend analysis and variations of sea surface temperature and chlorophyll-a in the Persian Gulf. Mar. Pollut. Bull. 156, 111267. doi: 10.1016/j.marpolbul.2020.111267
Moradi M., Moradi N. (2020). Correlation between concentrations of chlorophyll-a and satellite derived climatic factors in the Persian Gulf. Mar. Pollut. Bull. 161, 111728. doi: 10.1016/j.marpolbul.2020.111728
Nezlin N. P., Polikarpov I. G., Al-Yamani F. (2007). Satellite-measured chlorophyll distribution in the Arabian Gulf: Spatial, seasonal and inter-annual variability. Int. J. Oceans Oceanogr. 2, 139–156. doi: 10.5376/ijms.2012.02.0001
Perrone T. J. (1979). Winter shamal in the persian gulf. Naval Environ. Prediction Res. Facility Monterey CA, 79–86.
Piontkovski S. A., Claereboudt M. R., Al-Jufaili S. (2013). Seasonal and interannual changes in epipelagic ecosystem of the western Arabian Sea. Int. J. Oceans Oceanogr. 7, 117–130.
Pous S., Carton X. J., Lazure P. (2013). A process study of the wind-induced circulation in the Persian Gulf. Open J. Mar. Sci. 3, 27160. doi: 10.4236/ojms.2013.31001
Prakash P., Prakash S., Rahaman H., Ravichandran M., Nayak S. (2012). Is the trend in chlorophyll-a in the Arabian Sea decreasing? Geophys. Res. Lett. 39, L23605. doi: 10.1029/2012GL054187
Prasanna Kumar S., Roshin R. P., Narvekar J., Dinesh Kumar P. K., Vivekanandan E. (2010). What drives the increased phytoplankton biomass in the Arabian Sea? Curr. Sci. 99, 101–106. doi: 10.1007/s00227-010-0776-9
Sarma Y. V. B., Al-Azri A., Smith S. L. (2012). Inter-annual variability of chlorophyll-a in the Arabian sea and its gulfs. Int. J. Mar. Sci. 2, 1–11. doi: 10.5376/ijms.2012.02.0001
Sathyendranath S., Platt T., Stuart V., Lrwin B. D., Veldhuis M. J. W., JXraay G. W., et al. (1996). Some bio-optical characteristics of phytoplankton in the NW Indian Ocean. Mar. Ecol. Prog. Ser. 132, 299–311. doi: 10.3354/meps132299
Seelanki V., Nigam T., Pant V. (2022). Unravelling the roles of Indian Ocean Dipole and El-Niño on winter primary productivity over the Arabian Sea. Deep-Sea Res. PT I 190. doi: 10.1016/j.csr.2022.104383
Sen P. K. (1968). Estimates of the regression coefficient based on Kendall’s Tau. Am. Stat. Assoc. 63, 1379–1389. doi: 10.1080/01621459.1968.10480934
Shafeeque M., Balchand A. N., Shah P., George G., Smitha S. B. R., Varghese E., et al. (2021). Spatio-temporal variability of chlorophyll-a in response to coastal upwelling and mesoscale eddies in the South Eastern Arabian Sea. Int. J. Remote Sens 42, 4840–4867. doi: 10.1080/01431161.2021.1899329
Shropshire T., Li Y., He R. (2016). Storm impact on sea surface temperature and chlorophyll a in the Gulf of Mexico and Sargasso Sea based on daily cloud-free satellite data reconstructions. Geophys. Res. Lett. 43, 12,199–12,207. doi: 10.1002/2016GL071178
Solidoro C., Bastianini M., Bandelj V., Codermatz R., Cossarini G., Melaku Canu D., et al. (2009). Current state, scales of variability and decadal trends of biogeochemical properties in the Northern Adriatic Sea. J. Geophys Res. 114, C07S91. doi: 10.1029/2008JC004838
Swift S. A., Bower A. S. (2003). Formation and circulation of dense water in the Persian/Arabian Gulf. J. Geophys. Res. 108, 3004. doi: 10.1029/2002JC001360
Toumazou V., Cretaux J. F. (2001). Using a Lanczos eigensolver in the computation of empirical orthogonal functions. Mon. Weather Rev. 129, 1243–1250. doi: 10.1175/1520-0493(2001)129<1243:UALEIT>2.0.CO;2
Wiggert J. D., Hood R. R., Banse K., Kindle J. C. (2005). Monsoon-driven biogeochemical processes in the Arabian Sea. Prog. Oceanogr. 67, 78–121. doi: 10.1016/j.pocean.2005.08.003
Yan X., Gao Z., Jiang Y., He J., Yin J., Wu J. (2023). Application of synthetic DINCAE–BME spatiotemporal interpolation framework to reconstruct chlorophyll–a from satellite observations in the Arabian sea. J. Mar. Sci. Eng. 11, 743. doi: 10.3390/jmse11040743
Yang M., Khan F. A., Tian H., Liu Q. (2021). Analysis of the monthly and spring-neap tidal variability of satellite chlorophyll-a and total suspended matter in a turbid coastal ocean using the DINEOF method. Remote Sens. 13, 632. doi: 10.3390/rs13040632
Keywords: chlorophyll-a, data interpolating empirical orthogonal function, Arabian Sea and Persian Gulf, MODIS, sea surface temperature, wind
Citation: Yang M, Khan FA, Fang H, Maúre EdR, Ishizaka J, Liu D and Wang S (2024) Two-decade variability and trend of chlorophyll-a in the Arabian Sea and Persian Gulf based on reconstructed satellite data. Front. Mar. Sci. 11:1520775. doi: 10.3389/fmars.2024.1520775
Received: 31 October 2024; Accepted: 25 November 2024;
Published: 17 December 2024.
Edited by:
Chao Chen, Suzhou University of Science and Technology, ChinaCopyright © 2024 Yang, Khan, Fang, Maúre, Ishizaka, Liu and Wang. This is an open-access article distributed under the terms of the Creative Commons Attribution License (CC BY). The use, distribution or reproduction in other forums is permitted, provided the original author(s) and the copyright owner(s) are credited and that the original publication in this journal is cited, in accordance with accepted academic practice. No use, distribution or reproduction is permitted which does not comply with these terms.
*Correspondence: Dong Liu, ZGxpdUBuaWdsYXMuYWMuY24=; Shengqiang Wang, c2hlbmdxaWFuZy53YW5nQG51aXN0LmVkdS5jbg==
†ORCID: Elígio de Raús Maúre, orcid.org/0000-0003-0505-3796
 Mengmeng Yang
 Faisal Ahmed Khan
 Hua Fang
 Elígio de Raús Maúre
 Joji Ishizaka
 Dong Liu
 Shengqiang Wang