 Tshikana Rasehlomi
 Marjolaine Krug1,2
- 1Department of Forestry, Fisheries and the Environment, Oceans & Coasts, South Africa
- 2Nansen-Tutu Center for Marine Environmental Research, Department of Oceanography, University of Cape Town, Cape Town, South Africa
- 3Institute of Marine Research, Bergen, Norway
Lagrangian dispersal models are valuable tools for understanding the transport mechanisms and distribution of larvae in space and time. These models primarily use high-quality physical oceanographic data from hydrodynamic ocean models to simulate the advection and connecting pathways of larvae. The paper seeks to achieve the following objectives 1) to establish the dispersal patterns of larval anchovies and sardines spawned in South Africa’s coastal marine protected areas (i.e., inshore of the 200 m isobath), and 2) to assess the impact of model resolution on the dispersal patterns by comparing outputs of a 3-km-grid coastal and regional ocean community model, and the 8-km-grid global ocean physics reanalysis product. We demonstrate that the model yields more structured patterns than sporadic patterns obtained from the global reanalysis. The model shows relatively shorter residence times (i.e., < 5 days) and transport confined to the inshore area of the Agulhas Current. The high variability of dispersals observed off the west coast is attributable to the significant differences in mean kinetic energy between the model and global reanalysis. This finding directly impacts transport and potential connectivity along coastlines: global reanalysis data overestimated local retention and subsequent recruitment variability. Our findings indicate that a model grid size of 3 km or smaller may be more appropriate for studying the dispersal patterns of anchovies and sardines in the South African coastal zone. These findings add to the growing knowledge of the importance of including sub-mesoscale processes in Lagrangian analysis for dispersal studies of coastal species.
1 Introduction
Hydrodynamic models are crucial for understanding and predicting various aspects of the ocean environment, including circulation and population connectivity. They have improved significantly over the last 20 years, leading to a wide array of applications in studies and across disciplines, including larval dispersal (Miller, 2007; Lett et al., 2008; Parada et al., 2008; Simons et al., 2013; Lett et al., 2015., Swearer et al., 2019; Saint-Amand et al., 2023), population connectivity (Cowen, 2002; Cowen et al., 2007; Jesús et al., 2007; Treml et al., 2008; Lett et al., 2010; Pineda et al., 2007) and the assessment of networks of marine protected areas (Yemane et al., 2009; Rossi et al., 2014; D’Agostini et al., 2015; Fox et al., 2016; Ross et al., 2017). Hydrodynamic models are a critical component for the development of larval dispersal models for studying the transport mechanisms and distribution patterns of early life history stages of commercially and economically important species such as the South African anchovy (Engraulis capensis) and sardine (Sardinops sagax) foraging in and around coastal marine protected areas (MPAs). Larval dispersal models make use of physical oceanographic data (e.g., ocean current velocity fields, temperature and salinity) derived from these hydrodynamic ocean models [e.g., the Regional Ocean Modelling System (ROMS) and Hybrid Coordinate Ocean Model (HYCOM)]. Larval dispersal models are powerful tools for simulating larval transport and recruitment variability over time and space (Pineda et al., 2007; Cowen et al., 2009; Lett et al., 2008, 2010; White et al., 2019). Outputs from larval dispersal models provide insight into the science-based conservation and management of the coastal ecosystems. However, accurate estimates of ocean states on high spatial and temporal grids are needed, especially for current velocity fields and water temperatures.
The development and subsequent utilization of dispersal models in ecological studies is facilitated by the ever-increasing access to computational resources. Dispersal models are popular and effective tools for simulating larval transport and the evolution of coastal species driven passively by ocean currents. Therefore, the success of dispersal models is largely dependent on highly accurate three-dimensional estimates of ocean currents and temperature throughout the domain of interest. Conversely, the accurate description and parameterization of biological processes and the ability of the dispersal models to accurately represent physical parameters is crucial for achieving biological realism (i.e., the reproduction of realistic advection trajectories). Dispersal models are suitable candidates for studying larval advection in highly dynamic coastal environments (Mitarai et al., 2007; Lett et al., 2010; Ospina-Alvarez et al., 2018; Santos et al., 2018; Bashevkin et al., 2020). The accuracy of the ocean model is a more direct source of uncertainty in dispersal models than the model’s spatial resolution. The spatial resolution may affect the model’s accuracy. Optimal model spatial resolution is required for larval dispersal models to capture fine-scale processes in and around coastal marine protected areas. There is a need to accurately represent small-scale processes that are important for the dispersion of anchovy and sardine larvae. Few studies have investigated the impact of model spatial resolution on larval dispersal and connectivity of anchovies in South African waters (Huggett et al., 2003; Koneé et al., 2013; Lett et al., 2015). These studies relied on hydrodynamic models that could only resolve mesoscale processes to determine spawning patterns of anchovy within the Benguela Current ecosystem (BEC). For example, Huggett et al. (2003) simulated eggs and larvae of anchovies with passive transport completely driven by ocean currents. Koneé et al. (2013) incorporated food-dependency to the temperature-dependent larval growth to the biophysical models to determine spatial and temporal patterns of recruitment success of anchovy in the Benguela region. Lett et al. (2015) provided a synthesis of larval dispersal models used to simulate dispersal patterns of anchovy in the BEC region. None of these studies have considered model resolutions fine enough to be applicable to coastal marine protected areas. Other studies have investigated the role of model resolution in the larval dispersal of commercially important corals in nearshore regions (Liu et al., 2021; Saint-Amand et al., 2023; Ward et al., 2023). These studies highlighted the need to resolve small-scale processes to understand dispersal patterns and estimate larval connectivity in coastal ecosystems.
In this study, we assessed larval transport pathways and connectivity across the MPA Network located within the 200 m isobath along the coastline (Figure 1). The impact of the model spatial resolution on the larval dispersal patterns of the anchovy and sardine species of South Africa spawned in the Exclusive Economic Zone is also assessed. The simulation of larval transport driven only by ocean currents was investigated using current velocity fields from the 3-km model and 8-km global reanalysis product, focusing on the month of October, which coincides with the peak spawning period of anchovies and sardines (Crawford, 1980; Huggett et al., 1998; Hutchings et al., 1998; Beckley and Van der Lingen, 1999; Van der Lingen and Huggett, 2003; Miller et al., 2006). Our research aims to provide insight into the dispersion of anchovy and sardine larvae across the South African coastal MPA network. This study also aims to evaluate the consequences of not including small-scale processes in Lagrangian analyses of anchovy and sardine in the coastal zone of South Africa.
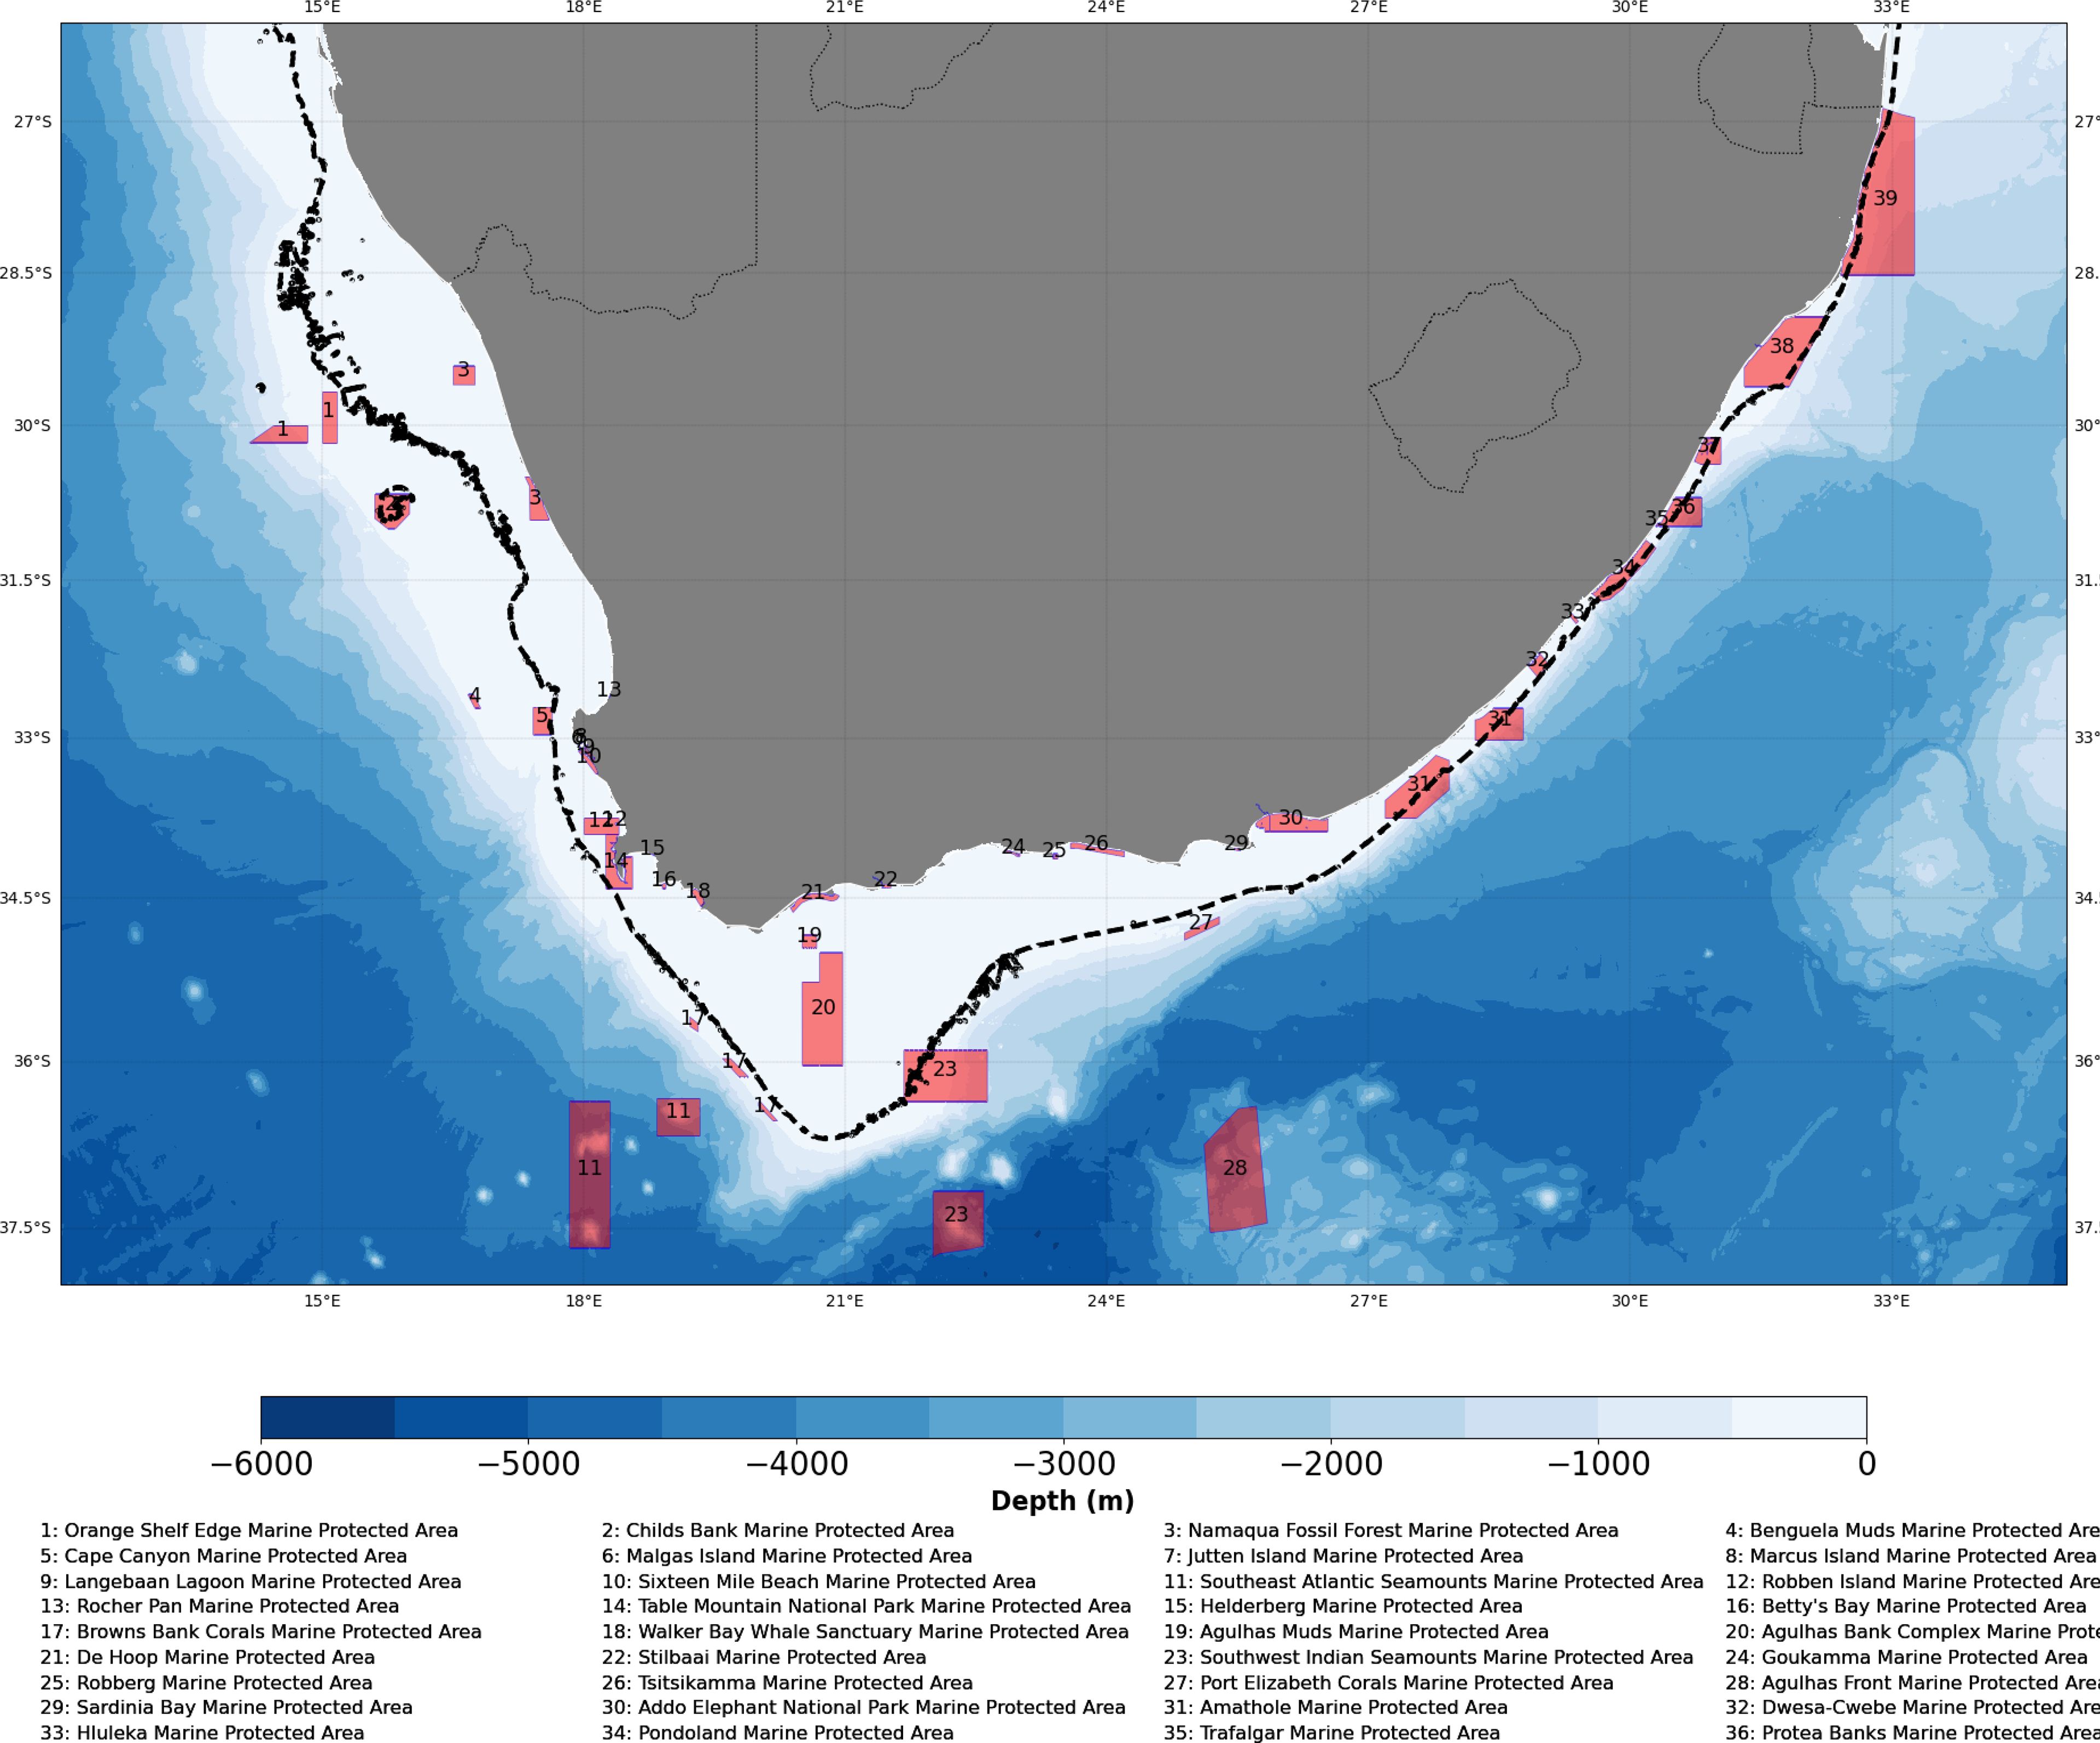
Figure 1. The bathymetry along the coastline of South Africa showing the 200 m isobath (black dotted line) delineating the positions of the marine protected areas in which particles were released.
Study area: Physical oceanography along the South African coastline
The Agulhas Current is a major driver of variability along South Africa’s east coast, influencing fish ecology and the dispersal of early life stages of various coastal fish species (Heydorn et al., 1978; Lutjeharms and De Ruijter, 1996; Lutjeharms, 2006; Lutjeharms, 2007). The current’s mesoscale and submesoscale variability impacts wind speeds and circulation patterns (Lutjeharms, 2006; Krug et al., 2017; Backeberg et al., 2008; Krug et al., 2018; Tedesco et al., 2019). The Kwa-Zulu Natal Bight, a key region within the northern Agulhas Current, is influenced by the KZN Bight Coastal Counter Current (Heye et al., 2022. Mesoscale features like Natal Pulses further impact shelf circulation and ecosystem dynamics (Krug and Penven, 2011; Malan et al., 2018).
The Agulhas Current and winds primarily drive circulation along South Africa’s south coast (Schumann et al., 1982; Schumann et al., 1995; Lutjeharms and De Ruijter, 1996; Schumann, 1999; Lutjeharms, 2006). The Agulhas Bank, a productive region, supports the spawning of key fish species (Hutchings, 1994; Hutchings et al., 2002). Mesoscale meanders in the Agulhas Current influence the circulation and productivity over the Agulhas Bank (Krug et al., 2014). Wind-driven circulation, particularly during October, is a key factor in the west coast’s ecosystem (Boyd and Nelson, 1998; Shannon, 2001; Risien, 2002). The Benguela Current jet plays a crucial role in transporting fish eggs and larvae Shelton and Hutchings, 1982; Grote et al., 2007; Stenevik et al., 2008; Veitch et al., 2018). Seasonal variations in upwelling influence the jet’s position and the success of fish recruitment (Fowler and Boyd, 1998; Huggett et al., 1998; Beckley and Van der Lingen, 1999).
The complex interaction of currents and winds along South Africa’s coastline creates a unique marine environment (Figure 2). This environment is ideal for studying how ocean processes influence the dispersal and survival of fish larvae.
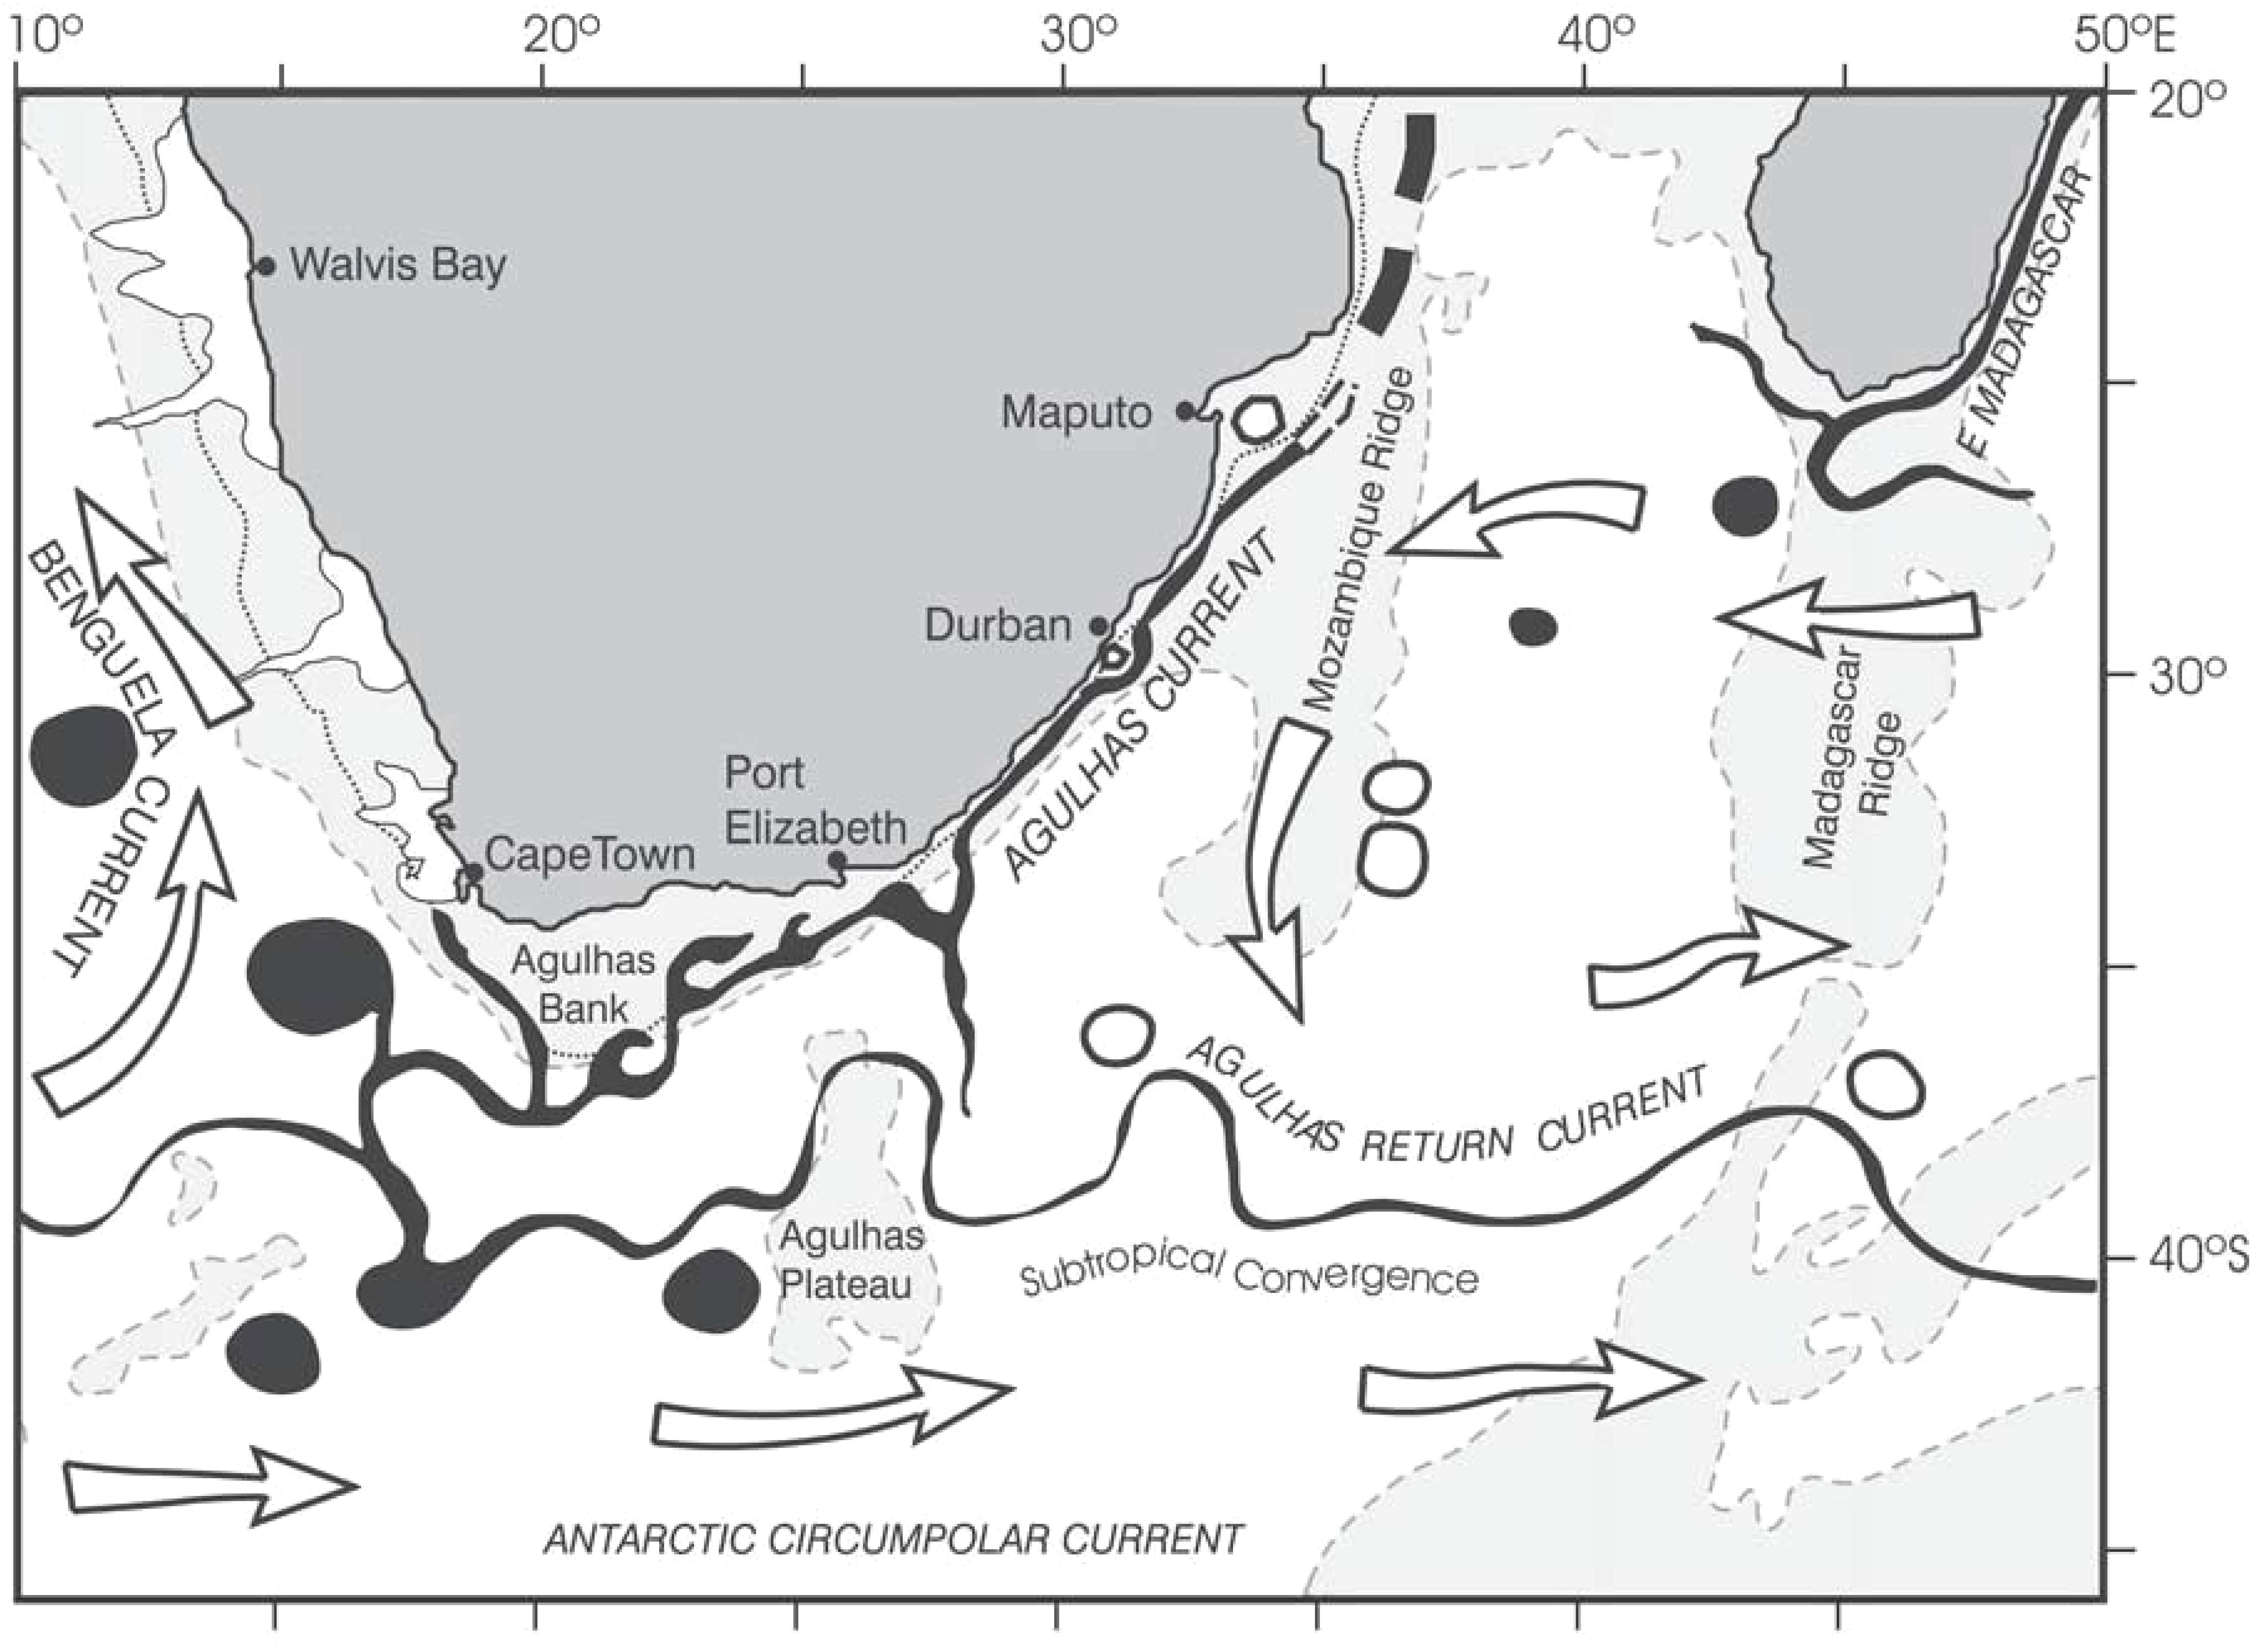
Figure 2. Schematics show the main circulation features of the Agulhas Current system. Areas shallower than 3000 m are shaded, while the edge of the shelf is circumscribed by a dotted line at the 500 m isobath (Source: Lutjeharms, 2006).
2 Methods
2.1 Ocean circulation model and global ocean reanalysis
Our approach uses a triply nested configuration of the Coastal and Regional Ocean Community (CROCO; Penven et al., 2006; Debreu et al., 2012) version of the Regional Ocean Modelling System (ROMS; Shchepetkin and McWilliams, 2005) for numerical simulations. The model has 60 terrain-following vertical levels, which were scaled down from 1/4° to 1/12° and finally to a 1/36° grid. Outputs from the 1/36° grid model are used in this study because of the model’s ability to capture and resolve smaller-scale features of the shelf around the South African coastline. The CROCO simulation used for our study is that of Tedesco et al., 2019, who set up the model to investigate key sub-mesoscale processes in the Agulhas Current. The model’s realism has been validated against existing observations in Tedesco et al. (2019) and has subsequently been used in a number of studies (Schubert et al., 2021; Heye et al., 2022; Pfaff et al., 2022; Suthers et al., 2023). CROCO was forced by climatological fields of wind stress, surface temperature and humidity from global reanalysis products and other atmospheric models. Daily and monthly means of the 1/36° grid datasets are available for the period 1993 to 2014. However, for the purposes of this study, we extracted and used daily outputs for a 5-year period spanning from 2010 to 2014. The model outputs are freely available and can be accessed at http://dap.saeon.ac.za/thredds/catalog/SAEON.EGAGASINI/2019.Penven/DAILY_MEANS/1_36_degree/catalog.html.
The 1/12° grid global ocean physics reanalysis (GLORYS12) from the Copernicus Marine Environment Monitoring Service (CMEMS) is used for comparison with the model in this study. The GLORYS12 product is a global eddy-resolving physical ocean and sea ice reanalysis product, with 50 vertical levels and covering the period from 1993 to the present (Jean-Michel et al., 2021). The product is based on the framework of the real-time forecasting CMEMS nested in the Nucleus for European Modelling of the Ocean (NEMO) platform and has been driven at the surface by the European Centre for Medium-Range Weather Forecasts (ECMWF) ERA-Interim and ERA5 reanalysis in recent years. In this product, ocean observations are assimilated by means of a reduced-order Kalman filter. GLORYS12 uses the 3D-VAR algorithm to resolve corrections for the slowly evolving large-scale biases in temperature and salinity. The product resolves small-scale variability in surface dynamics and compares well with nonassimilated data. It provides a reliable physical ocean state for climate variability and supports a variety of applications, such as seasonal forecasts and marine biogeochemistry. In this study, we extracted the daily products of GLORYS12 for a 5-year period spanning 2010-2014. The GLORYS12 product can be accessed freely from https://data.marine.copernicus.eu/product/GLOBAL_MULTIYEAR_PHY_001_030/.
2.2 Sea surface temperature
The level-4 sea surface temperature (SST) product from the European Space Agency Climate Change Initiative (ESA-CCI) is used in this study to evaluate the performance of the CROCO model in representing the main physical processes around the South African coastline. The level 4 ESA-CCI product provides gap-free maps of daily average SSTs at a depth of 20 cm in the global ocean at a horizontal grid resolution of 5 km. It consists of observations from the Along-Track Scanning Radiometers (A)ATSRs), Sea and Land Surface Temperature Radiometer (SLSTR) and Advanced Very High-Resolution Radiometer (AVHRR) series of sensors (Merchant et al., 2019; Good et al., 2020). The Level-4 product is available from 1 September 1981 to October 2022 and can be accessed from the CMEMS via the following link https://doi.org/10.48670/moi-00169.
The study also uses a global 1km Group for High Resolution Sea Surface Temperature (GHRSST) Level 2P dataset based on multi-channel SST retrievals from the AVHRR on the European Meteorological Operational-A satellite which was first launched on 19 October 2006. This SST product is produced and retrieved in near real time from Metop/AVHRR infrared channels (3.7, 10.8 and 12.0 micrometer) using multispectral algorithm by the Ocean and Sea Ice Satellite Application Facility (OSI SAF). To correct the multispectral algorithm for regional and seasonal biases, atmospheric profiles of water vapor and temperature from numerical weather prediction model and radiative transfer model are applied (OSI SAF, 2014). Data access is provided free of charge via THREDDS services on Catalog https://www.ncei.noaa.gov/thredds-ocean/catalog/ghrsst/L2P/AVHRR_SST_METOP_A/OSISAF/catalog.html.
2.3 Wind and Ekman transport
Hourly ERA5 wind data from the European Centre for Medium-Range Weather Forecasts (ECMWF) reanalysis for the global climate and weather are used in this study. The hourly ERA5 wind data are available from 1940 onwards, and they are regridded to a regular lat-lon grid of 0.25 degrees. The ERA5 data combines model data with global observations to produce a complete dataset (Hersbach et al., 2023). Conversely, Ekman currents derived from the Copernicus Level 4 multiyear global total velocity product are used to characterize the mean circulation along the west coast of South Africa. The Level 4 multiyear product provides velocity fields at the surface and 15 m depth, with a 3-hour frequency and a 0.25-degree regular grid (product ID: MULTIOBS_GLO_PHY_REP_015_004). The velocity fields are generated by combining the Ekman currents simulated using the approach of Rio et al. (2014) and the CMEMS geostrophic surface currents from satellites. Products are available in hourly, daily and monthly means. In this study, the daily averaged fields from 2010 to 2014 are used. For the purposes of this study, we extracted daily average fields from 2010 to 2014 (Rouault et al., 2010).
2.4 Larval dispersal model
To simulate the larval dispersal patterns of the anchovy species Engraulis capensis and sardine Sardinops sagax in South Africa’s coastal marine protected areas, the Ichthyop Lagrangian tool was used (Ichthyop v3.15; Lett et al., 2008). Ichthyop is an open-source java-based tool designed to study physical and biological drivers influencing larval dynamics throughout the water column. Ichthyop utilizes current velocity vector fields, temperature and salinity from hydrodynamic models to simulate advection and connecting pathways of virtual particles (i.e., larvae) in a three-dimensional physical environment. Ichthyop was built with the assumption that ichthyoplankton are advected and diffuse similarly to water particles and can be used in various applications in physical oceanography and marine ecology. The tool follows the particle’s location and records its associated ocean properties, such as temperature and salinity. One of the advantages of the tool is that it provides users with the option to code virtual particles with biological behavior (e.g., diel vertical migration, swimming, etc.) to assess its impact on larval dispersion.
Ichthyop allows users to run simulations offline in either hindcast (backtracking) or forecasting modes. However, in this study, particle trajectories were tracked in forecasting mode at a constant time step using a fourth-order Runge-Kutta model, which enables particle trajectory tracking with adaptive time steps without compromising computational efficiency (Van Sebille et al., 2018). In total, 140, 000 particles were released in the first 30 m of the water column every October (coinciding with the peak sardine and anchovy spawning periods) in 14 marine protected areas located within the 200 m isobath (Figure 1). We released 10, 000 particles in each of the marine protected areas on the first day of October. Simulation experiments were run for 30 days (~ pelagic duration of anchovy and sardine in South Africa) and particles were tracked every half an hour (1800 seconds). The number of virtual particles released was found to be statistically sufficient to reproduce stable connectivity estimates, as similar results were obtained when using twice as many particles. We configured and parameterized both coarse and fine meshes such that particles were prevented from overlapping with land; therefore, particles were considered dead when they reached land or drifted outside the domain. This approach was used to avoid bias in our analysis. Moreover, we released particles on the surface and allowed them to be transported passively by ocean currents derived from both the high-resolution CROCO model and the coarse-resolution GLORYS products. The objective here was to test the sensitivity of particle dispersion to spatial resolution when advected passively without incorporating biological behaviors.
2.5 Connectivity metrics
We constructed connectivity matrices by evaluating larval settlement (i.e., potential recruitment) every 15 days along the 30-day particle trajectories. In this study, larval anchovies and sardines were considered to have reached a suitable competency period at the age of 15 days, which is the period when larvae are suitable for settlement (Beckley and Van der Lingen, 1999; Somarakis and Nikolioudakis, 2010; Hampton, 2014). This exercise was performed every half an hour during the competency period. We considered particles to have successfully settled if they were found within a coastal marine protected area at any given time during the competency period. Essentially, connectivity matrices were constructed to summarize the number of virtual larvae exchanged between any two MPAs, as were obtained after 30 days of simulation. Moreover, from any connectivity matrix, we derived the strength of the connection from one MPA to another. The strength of the connection from MPA i to j corresponds to the proportion of virtual larvae released on MPA i that then settled onto MPA j. Row i of the matrix corresponds to the source MPA, and column j corresponds to the settlement MPA. A nonzero value obtained from the connectivity matrix denotes an existing connection between MPA i and MPA j (D’Agostini et al., 2015; Andrello et al., 2017; Belharet et al., 2020). Essentially, positive (negative) values of the connectivity matrix denote a strong (weak) connection between MPAs. Self-retention (also known as self-seeding) was also considered in this study and is defined as the number of virtual particles retained at the release MPA (i.e., origin location).
2.6 Visualization and analysis of results
The simulation outputs of the Ichthyop were analyzed using open source Python software (v.3.11; https://www.anaconda.com/) implemented in the Windows Anaconda platform for data science as well as using R Statistical Software (v.4.0.4; R Core Team, 2021). We calculated dispersion statistics for all 5 years combined (i.e., 2010–2014) while distinguishing between the results obtained from coarse-resolution GLORYS and the high-resolution CROCO model. We calculated the following from the 5 years of simulations: proportions of virtual particles 1) retained at the release MPA, 2) those settling at adjacent MPAs other than the release site, or 3) those not retained in any MPAs. We computed trajectory density maps, connectivity matrices and residence times for particles retained in any marine protected area.
3 Results
3.1 The realism of the evaluation model
The performance of the 3-km grid-resolution CROCO model in accurately reproducing physical processes around the South African coastline is assessed by comparing it to the 5-km grid-resolution SST data derived from the European Space Agency Climate Change Initiative (ESA-CCI) product. The ESA-CCI SST product is based only on satellite observations and objective mapping, thus providing us with independent observations to which we can compare the CROCO model SSTs. The SST comparison exercise serves to ascertain the model’s realism.
There is a demonstrable consistency between the results obtained from the model, GLORYS and the ESA-CCI SST (Figure 3A). The results show good agreement between the model and the three altimetry products (i.e., ESA-CCI,GLORYS and GHRSST) in terms of the representation of the mean SST and the location of the Agulhas Current (Supplementary Figure S1). The results also show a relatively warm bias of +1°C observed off the Cape Peninsula region in the CROCO model, which is more strongly expressed along the path of the northwards-flowing, shelf-edge Benguela jet current. The location of the jet appears to be slightly more west in the model as compared to the GLORYS product (Figure 3B).
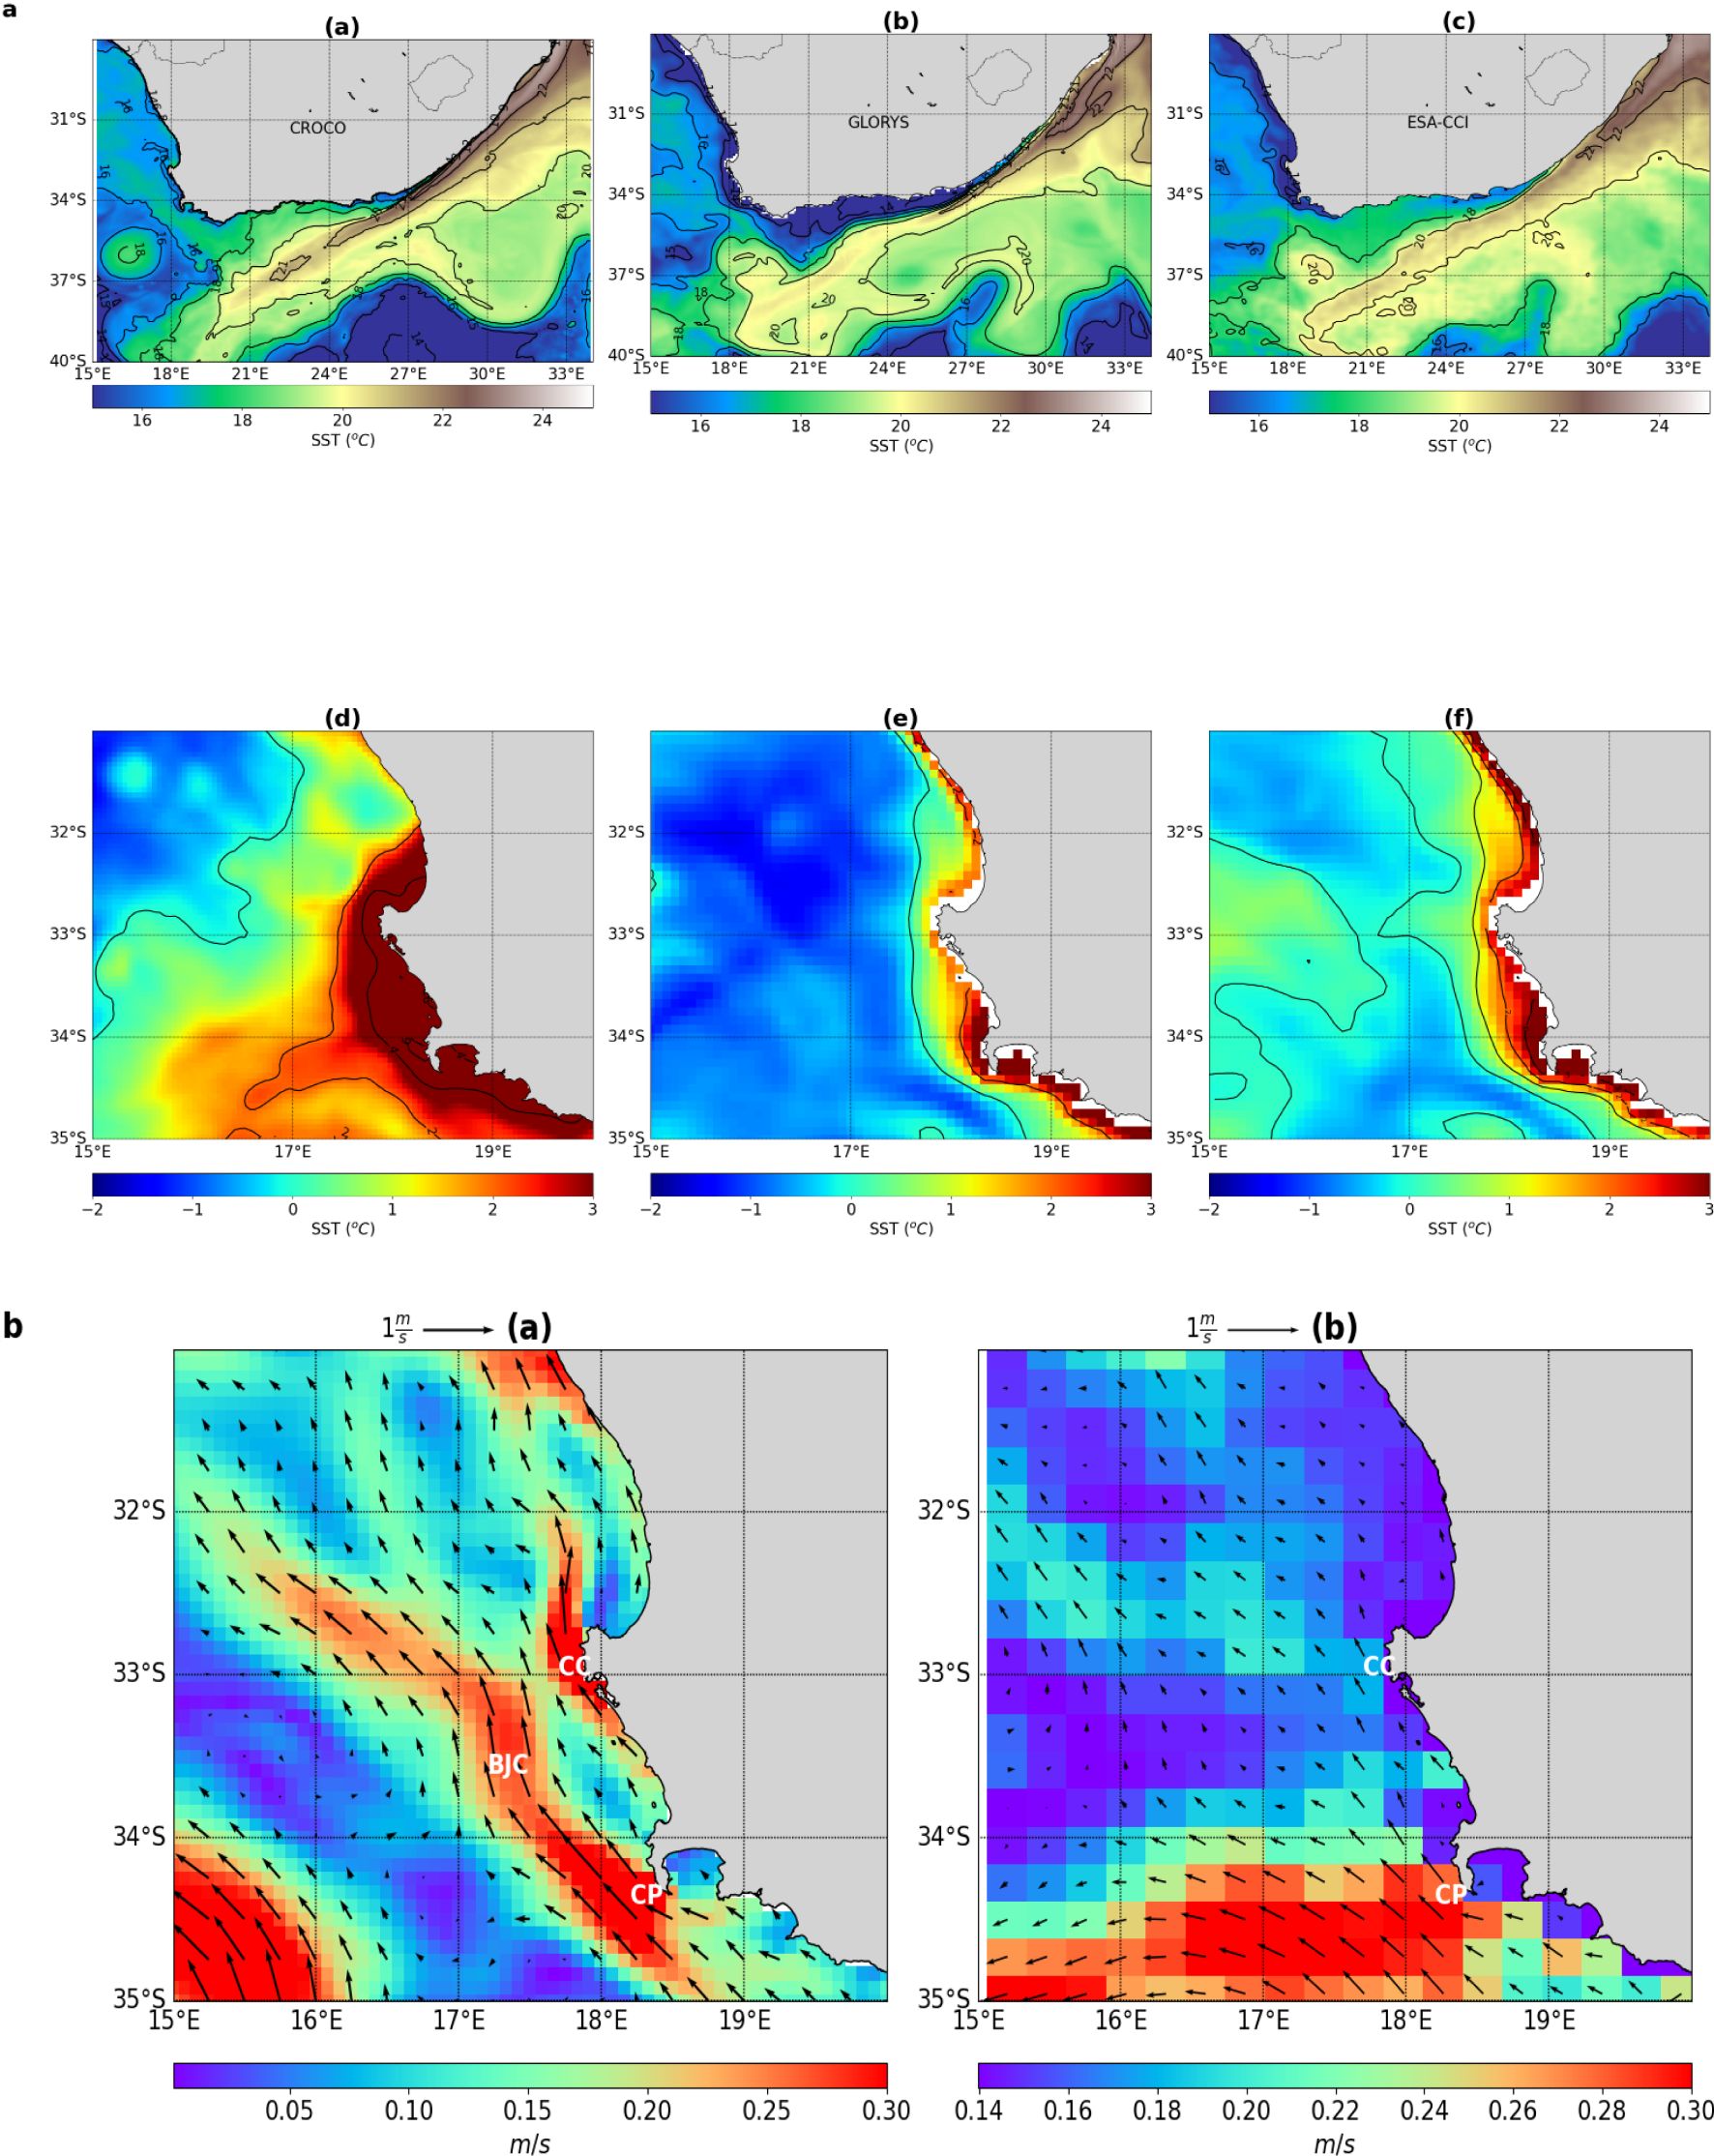
Figure 3. (A) (Panel 1) Spatial distribution of the mean Sea Surface Temperature (SST) averaged over the 2010-2014 period from the (a) CROCO model, (b) GLORYS and (c) ESA-CCI product. (Panel 2) A zoomed-out view of SST difference on the west coast between (d) (CROCO – ESA-CCI), (e) (CROCO – GLORYS) and (f) (GLORYS – ESA-CCI). (B). Mean current vectors from (a) the CROCO model, and (b) mean geostrophic velocities from GLORYS for all October months from 2010–2014. BJC, Benguela Jet Current; CC, Cape Columbine; and CC, Cape Peninsula. The BJC in CROCO model appears to be displaced slightly more west than in GLORYS.
3.2 Patterns of larval dispersal
Density maps of virtual particles released using a 3-km grid model (CROCO) and 8-km global reanalysis (GLORYS) are used to illustrate the dominant connecting pathways of particles that eventually reach a recruitment zone (Figure 4). The main connecting pathways observed in this study are consistent with those of general circulation along coastlines. The fast, south-westwards-flowing Agulhas Current drives variability off the east coast and virtual particles in that region tend to align with the flow of the Agulhas Current and are transported southwestward.
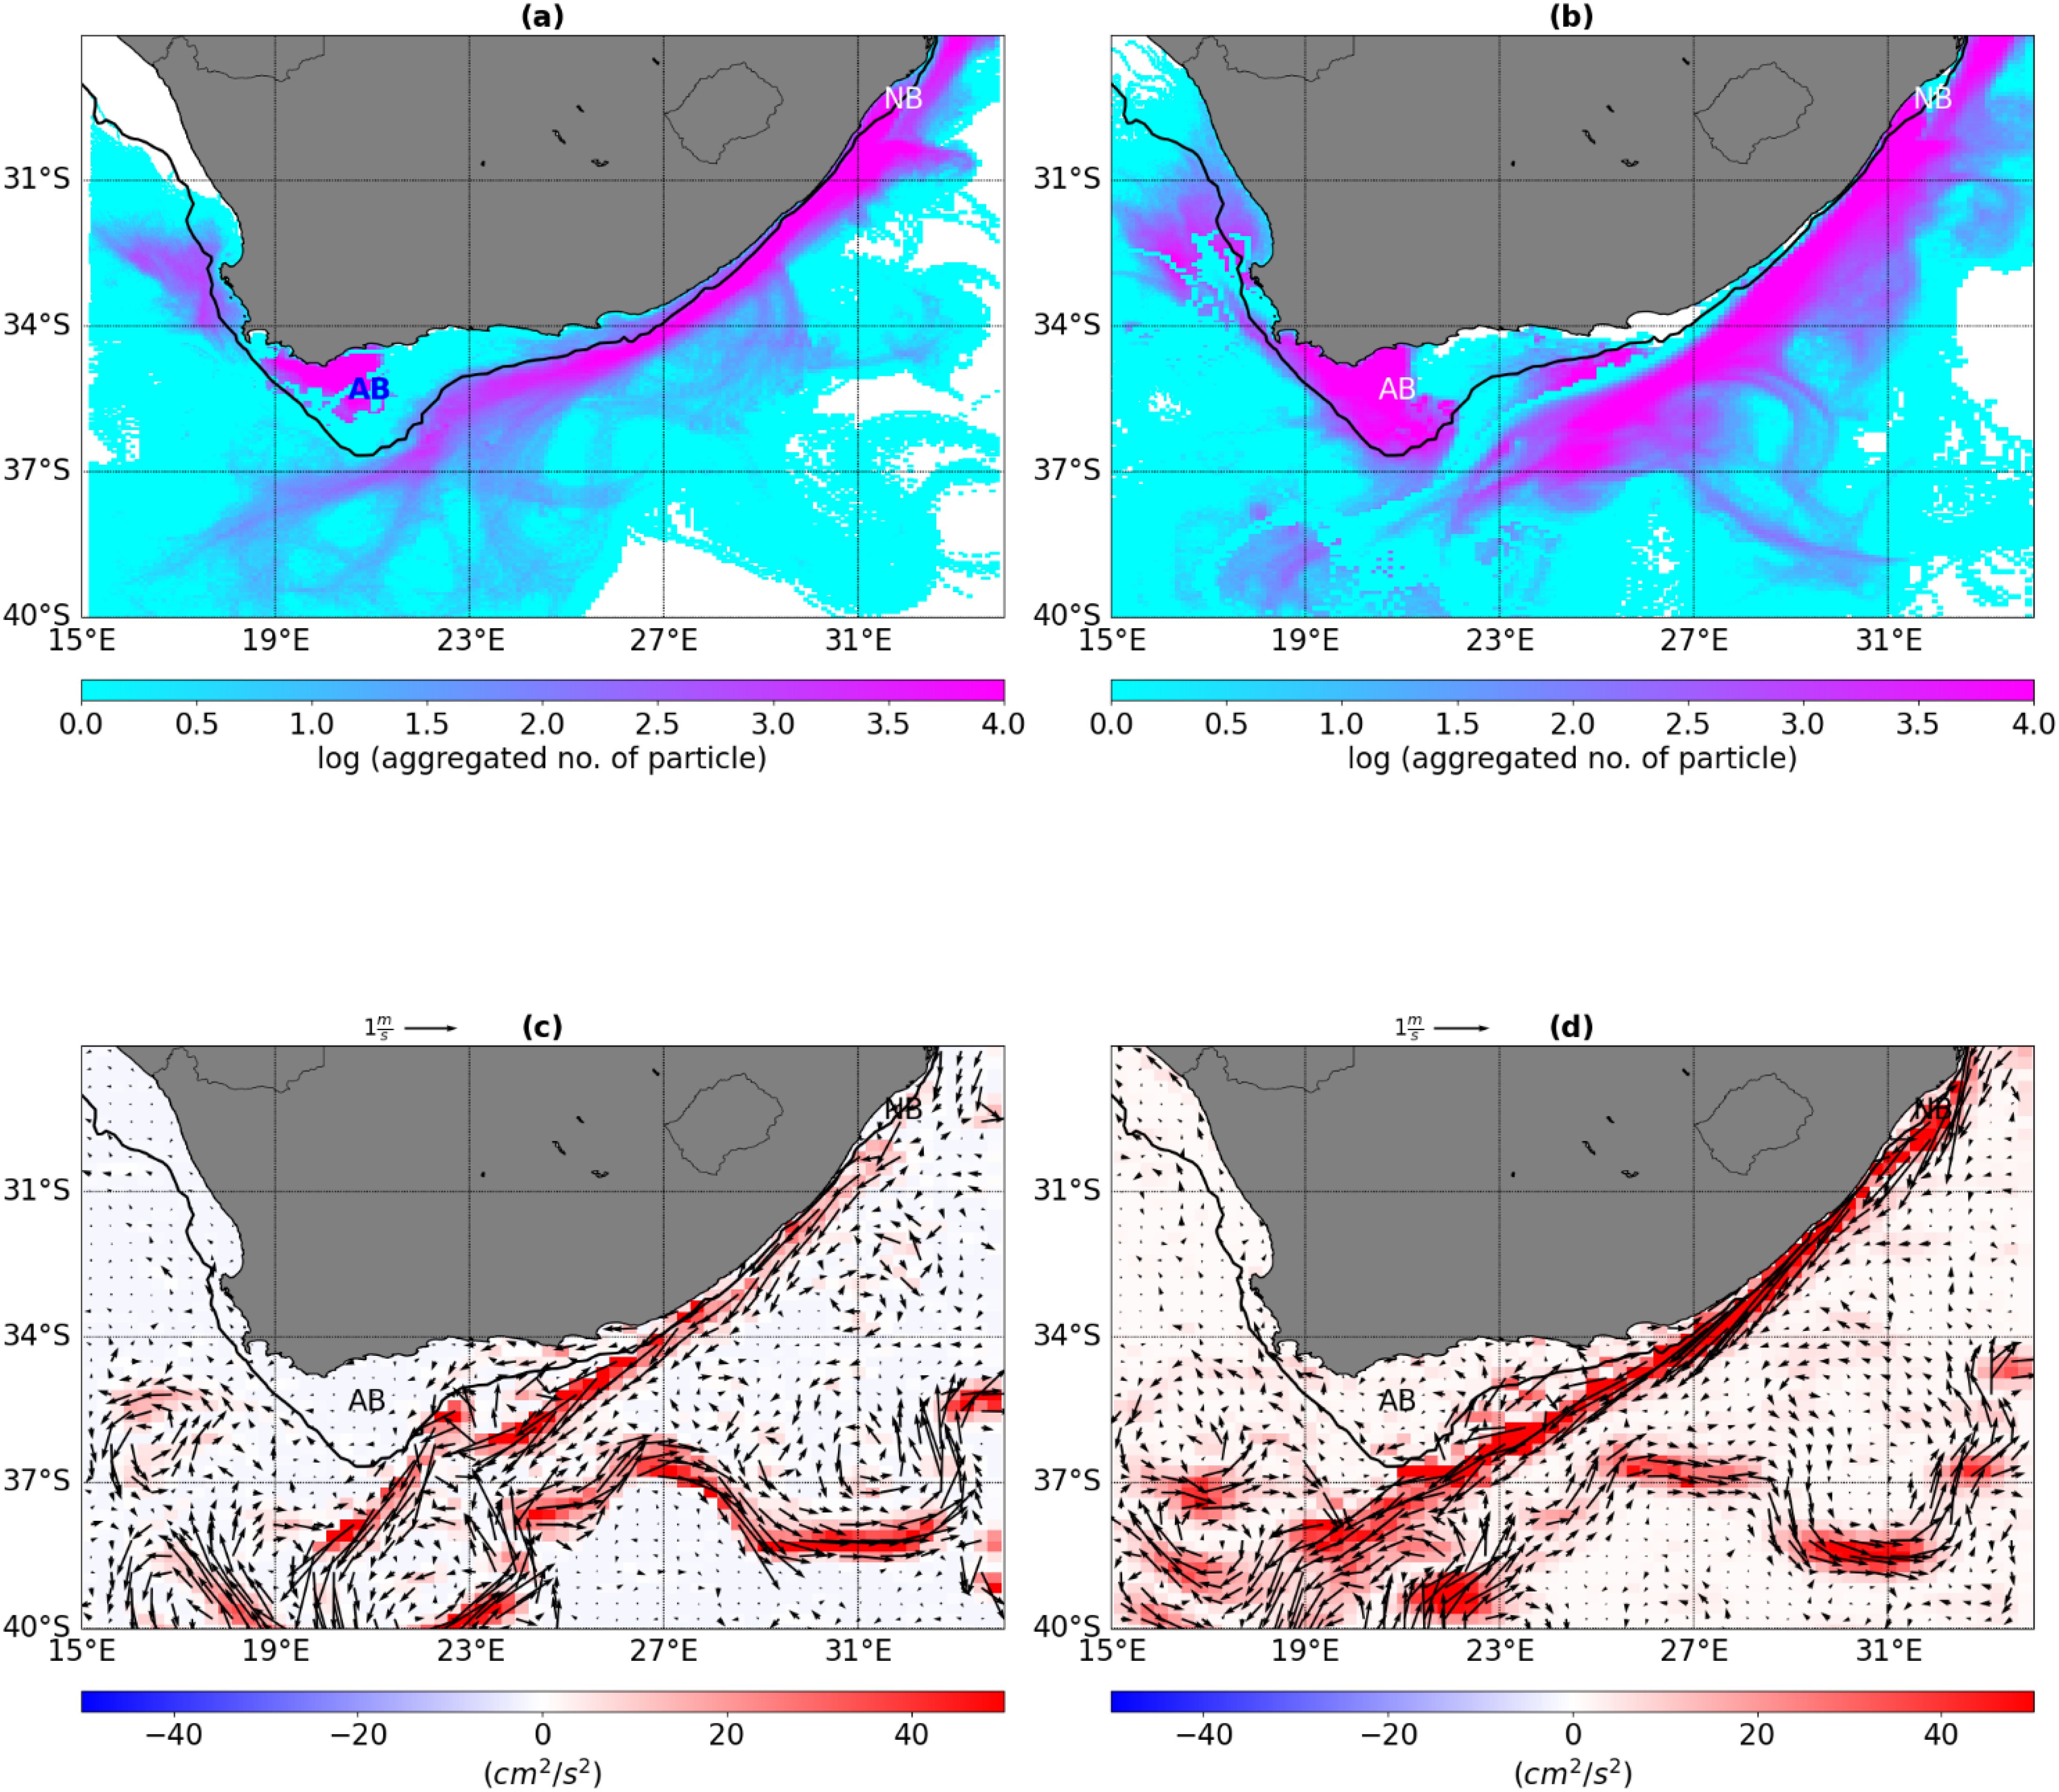
Figure 4. Spatial distribution of the mean particle density (logarithmic scale) derived from the (A) CROCO model, (B) GLORYS model and (C) difference in mean kinetic energy (MKE), and (D) eddy kinetic energy (EKE) for all October months of the period 2010–2014. Solid red and blue contour lines indicate the 200 m isobath. AB = Agulhas Bank, and NB = Natal Bight.
In the northern Agulhas Current region, a high number of particles are observed in the Natal Bight and along the path of the Agulhas Current in both models. South of 32 0S however, the model shows that particles released on the east coast of South Africa tend to move inshore of the Agulhas Current, whereas those in the global reanalysis (GLORYS) are either entrained by the current or drift to the outer regions of the current. Relatively large alongshore loss of particles is observed in the GLORYS as compared to the model. Relatively higher levels of energy are also observed in the Natal Bight. The core of the Agulhas Current is observed to be more inshore in the CROCO than in GLORYS. The large demonstrable differences in mean kinetic energy (MKE) and eddy kinetic energy (EKE) are observed south of the African continent.
The GLORYS show relatively sporadic (erratic) dispersal patterns to the south of the continent. However, both the model and GLORYS show a coherent high-density area of particles released over the Agulhas Bank. Interannual variability significantly influences dispersal patterns of anchovy and sardines (Supplementary Figure S3. The west coast is characterized by a relatively large magnitude of wind-modulated Ekman transport which appears to be influencing dispersion in the region (Figure 5). High variability of particle dispersals observed off the west coast. The model shows a stronger jet at the inshore edge of the Benguela Current accompanied by rapid advection of particles to the north. As a result, the particles follow the mean jet path more leading to less retention in the model. The GLORYS show strong inshore movement of particles leading to a more pronounced local retention off the west coast.
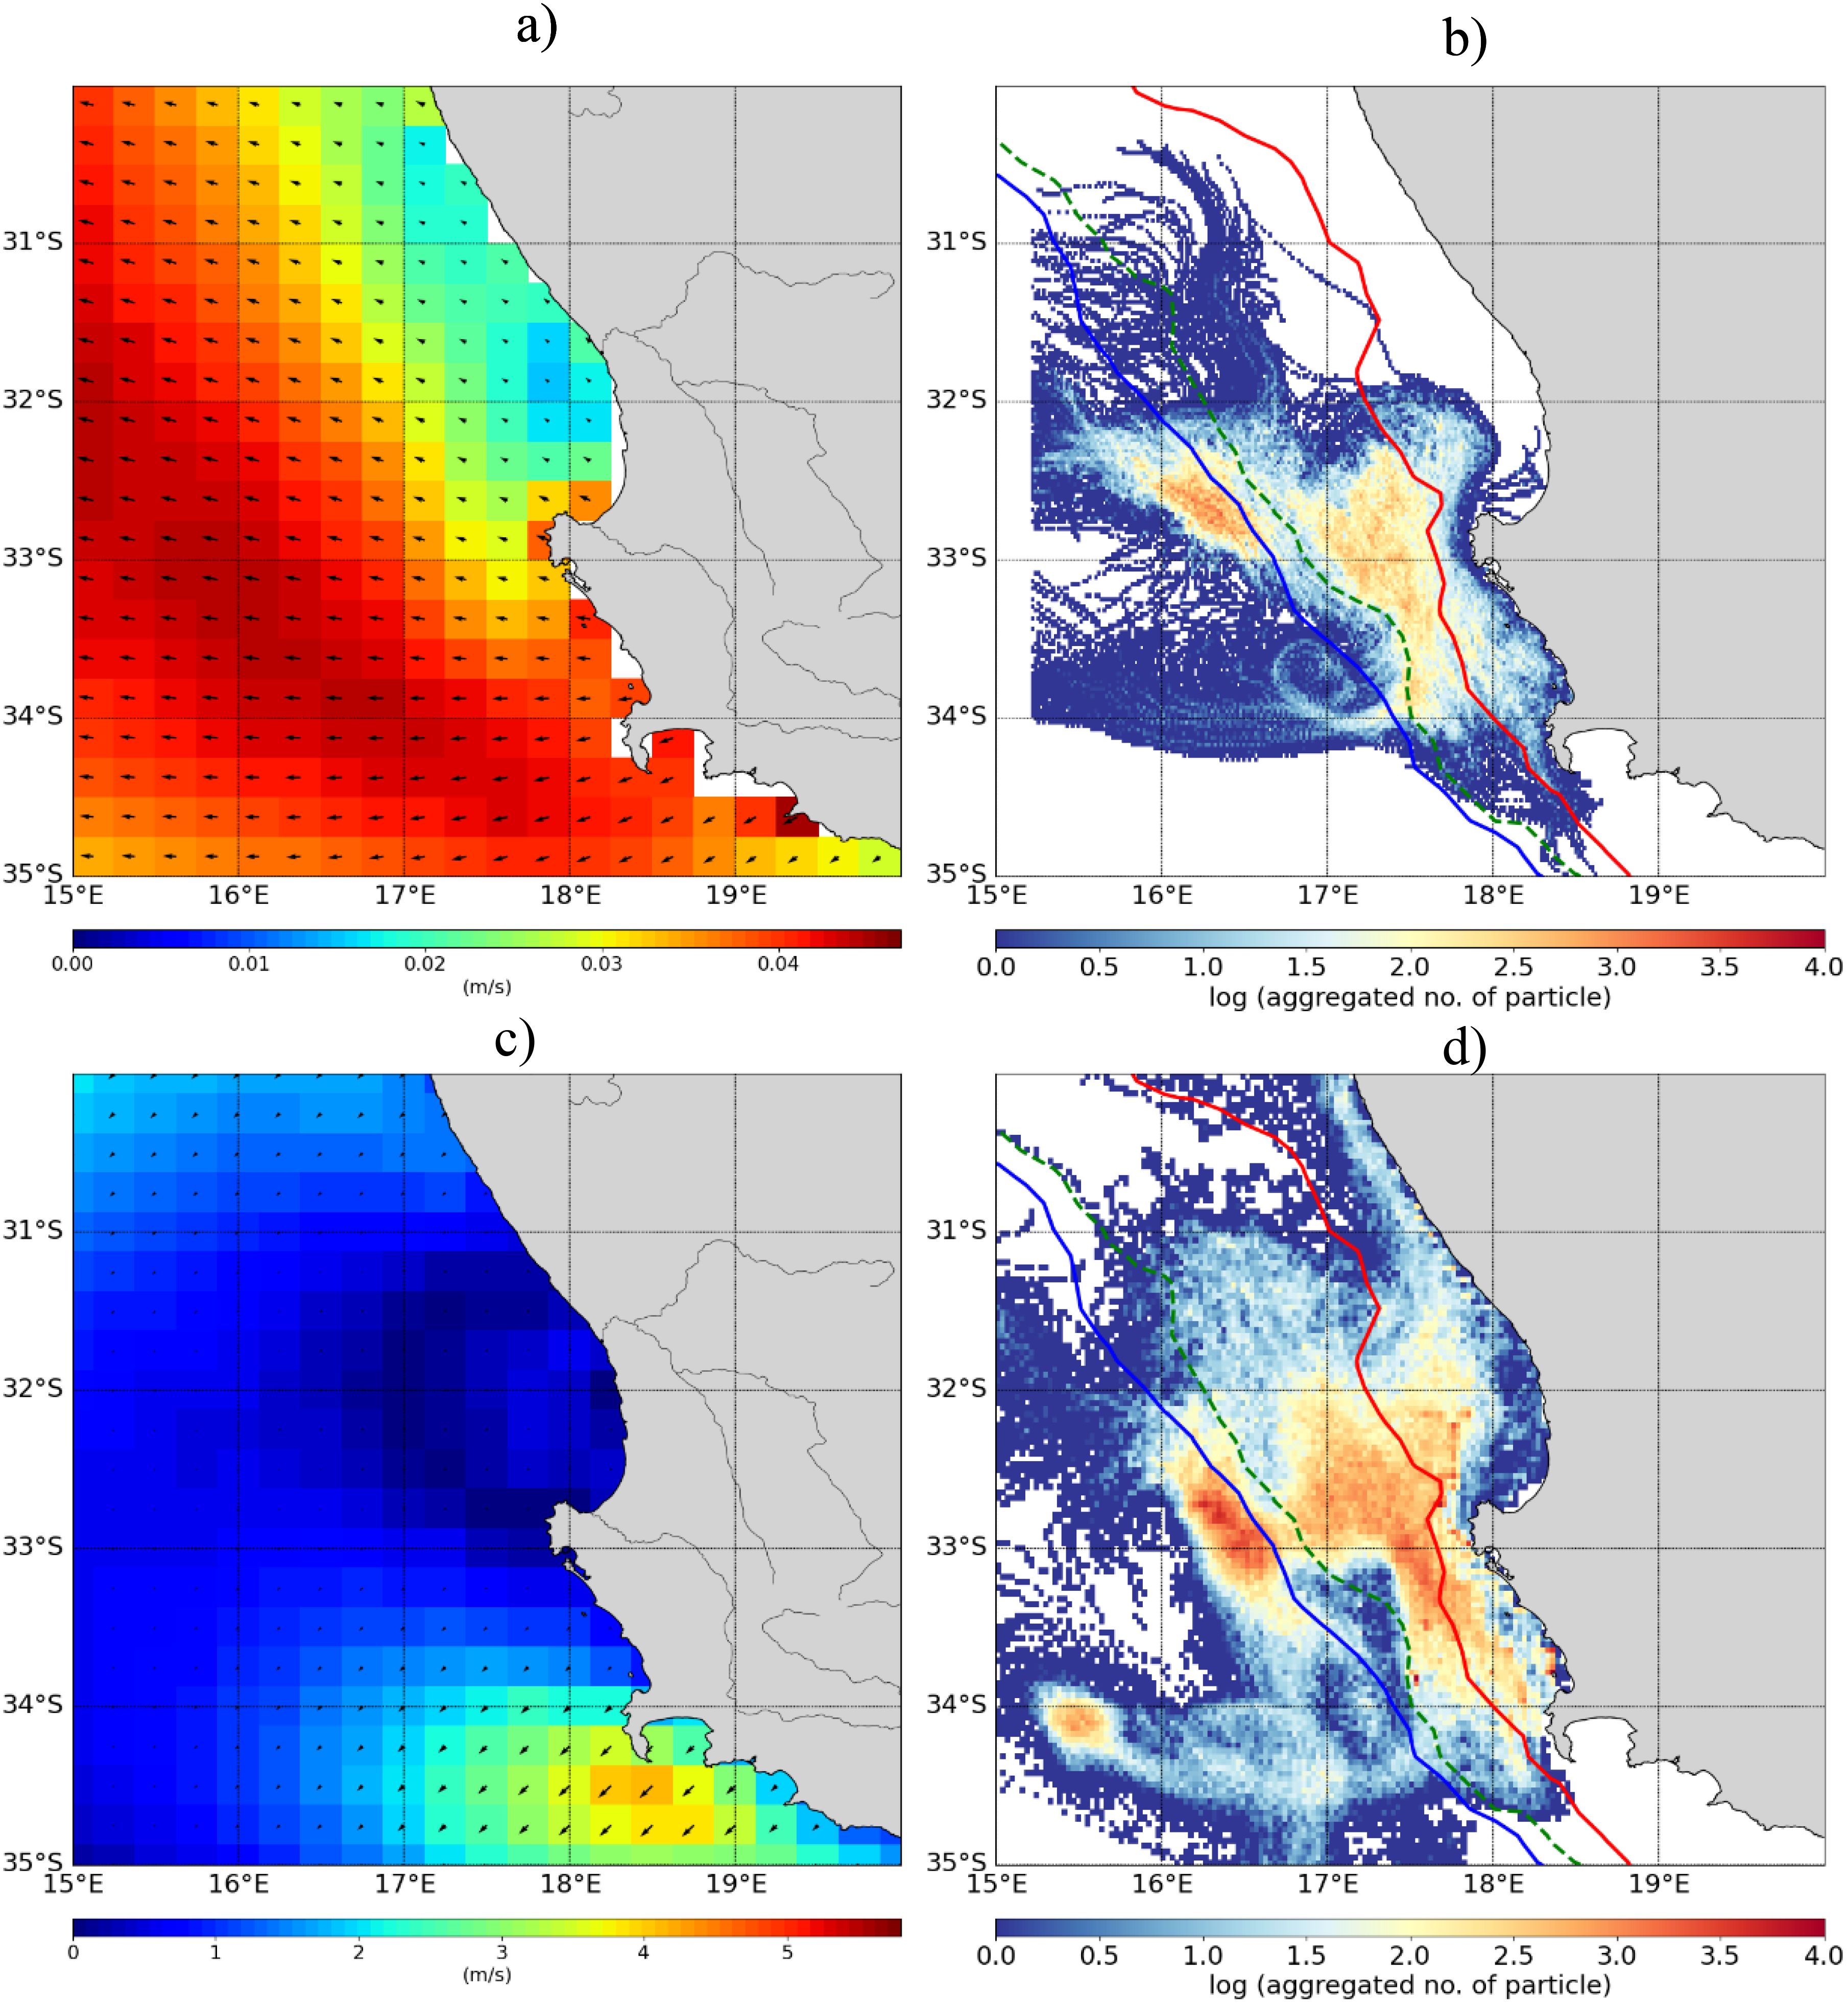
Figure 5. Mean circulation along the west coast of South Africa; (A) Ekman transport and (C) winds, together with spatial distribution of mean particle density (logarithmic scale) derived from (B) the CROCO model and (D) GLORYS. Red, green and blue contour lines indicate the 200 m, 500 m, and 1000 m isobaths, respectively.
3.3 MPA connectivity
The schematic of the alongshore connectivity matrices illustrates a generally high level of alongshore connectivity in the region (Figure 6). The strong connectivity observed in Figure 6 is consistent with the general hypothesis that connectivity increases from east to west along the South African coastline. The hypothesis is premised largely on the general coastal circulation around southern Africa driven mainly by the 1) south-westwards fast-flowing Agulhas Current on the east, 2) sluggish flow on the south coast driven by the combination of winds and the mesoscale activities of the Agulhas Current, and 3) northwesterly flowing frontal Benguela jet Current off the west coast. While the general pattern of alongshore connectivity was comparable between the model and GLORYS, the strength of the connections between release sites varied significantly. For instance, the model showed a high degree of variability in terms of connectivity between the release sites on the east and south coasts. Relatively high local recruitment and self-retention were observed on the south and west coasts in both the model and GLORYS. The GLORYS show a stronger connection between release sites located on the south and west coasts. Both the model and GLORYS show a coherent upstream connectivity along the west coast with stronger connections in the area between the Cape Peninsula and Cape Columbine (i.e., northwardly from Robben Island to the Childs Bank).
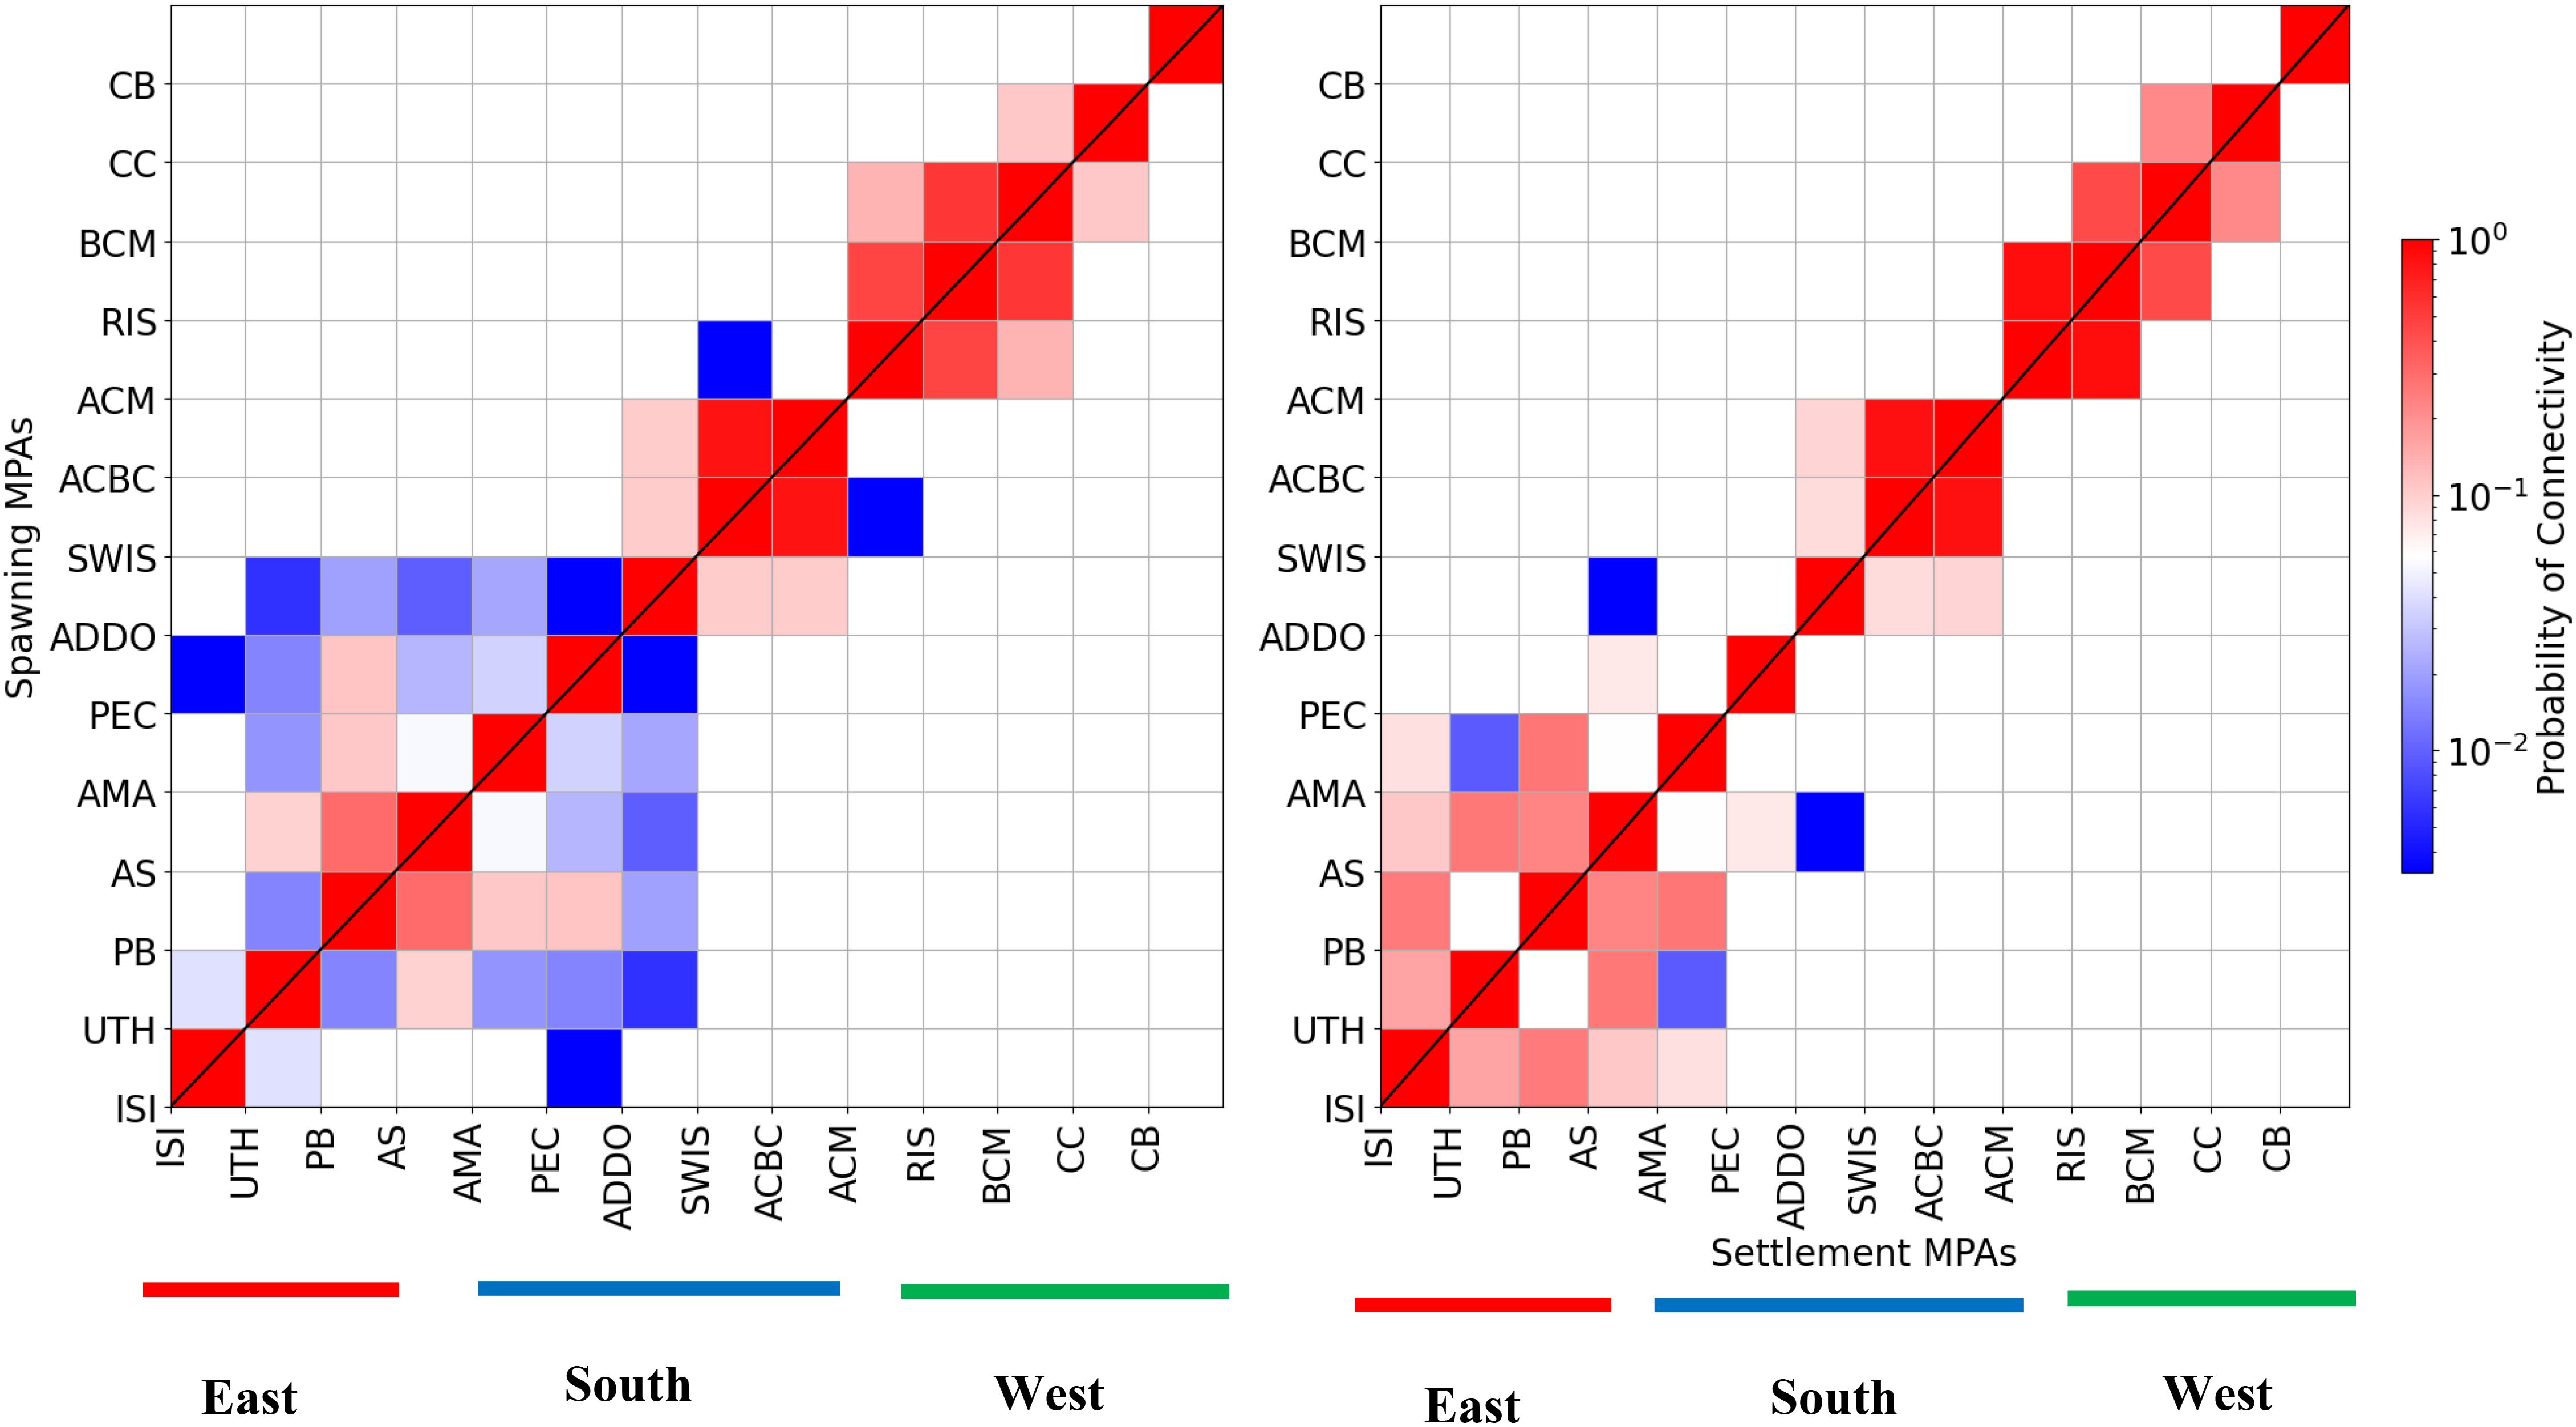
Figure 6. Mean alongshore connectivity matrix (on a logarithmic scale) computed from the 30-day pelagic larval duration using the (A) CROCO model and (B) GLORYS model for all the months of October in the period from 2010–2014. Connectivity matrices were calculated between MPAs from the east to the west of the coastline. East coast MPAs include ISI – Isimangaliso, UTH – UThukela and PB – Protea Banks. South coast MPAs include AM – Amathole, PEC – Port Elizabeth Corals, ADDO – Addo Elephant National Park, SWIS – Southwest Indian Ocean Seamounts, ACBC – Agulhas Bank Complex and ACM – Agulhas Muds. The MPAs on the west coast include the Robben Islands (RIS), the Benguela Muds (BCM), the Cape Canyon (CC) and the Childs Bank (CB).
The GLORYS show that particles take longer in the northern Agulhas region to move through the system (Figure 7). Similarly, longer residence times (> 10 days) were observed south of the continent in the GLORYS. This is especially true over the Agulhas Bank. Particles released in the model spend on average half of the time spent by those in the GLORYS on the south coast. Large variability of residence times observed off the west coast in the GLORYS with particles spending on average 8 days within the release sites.
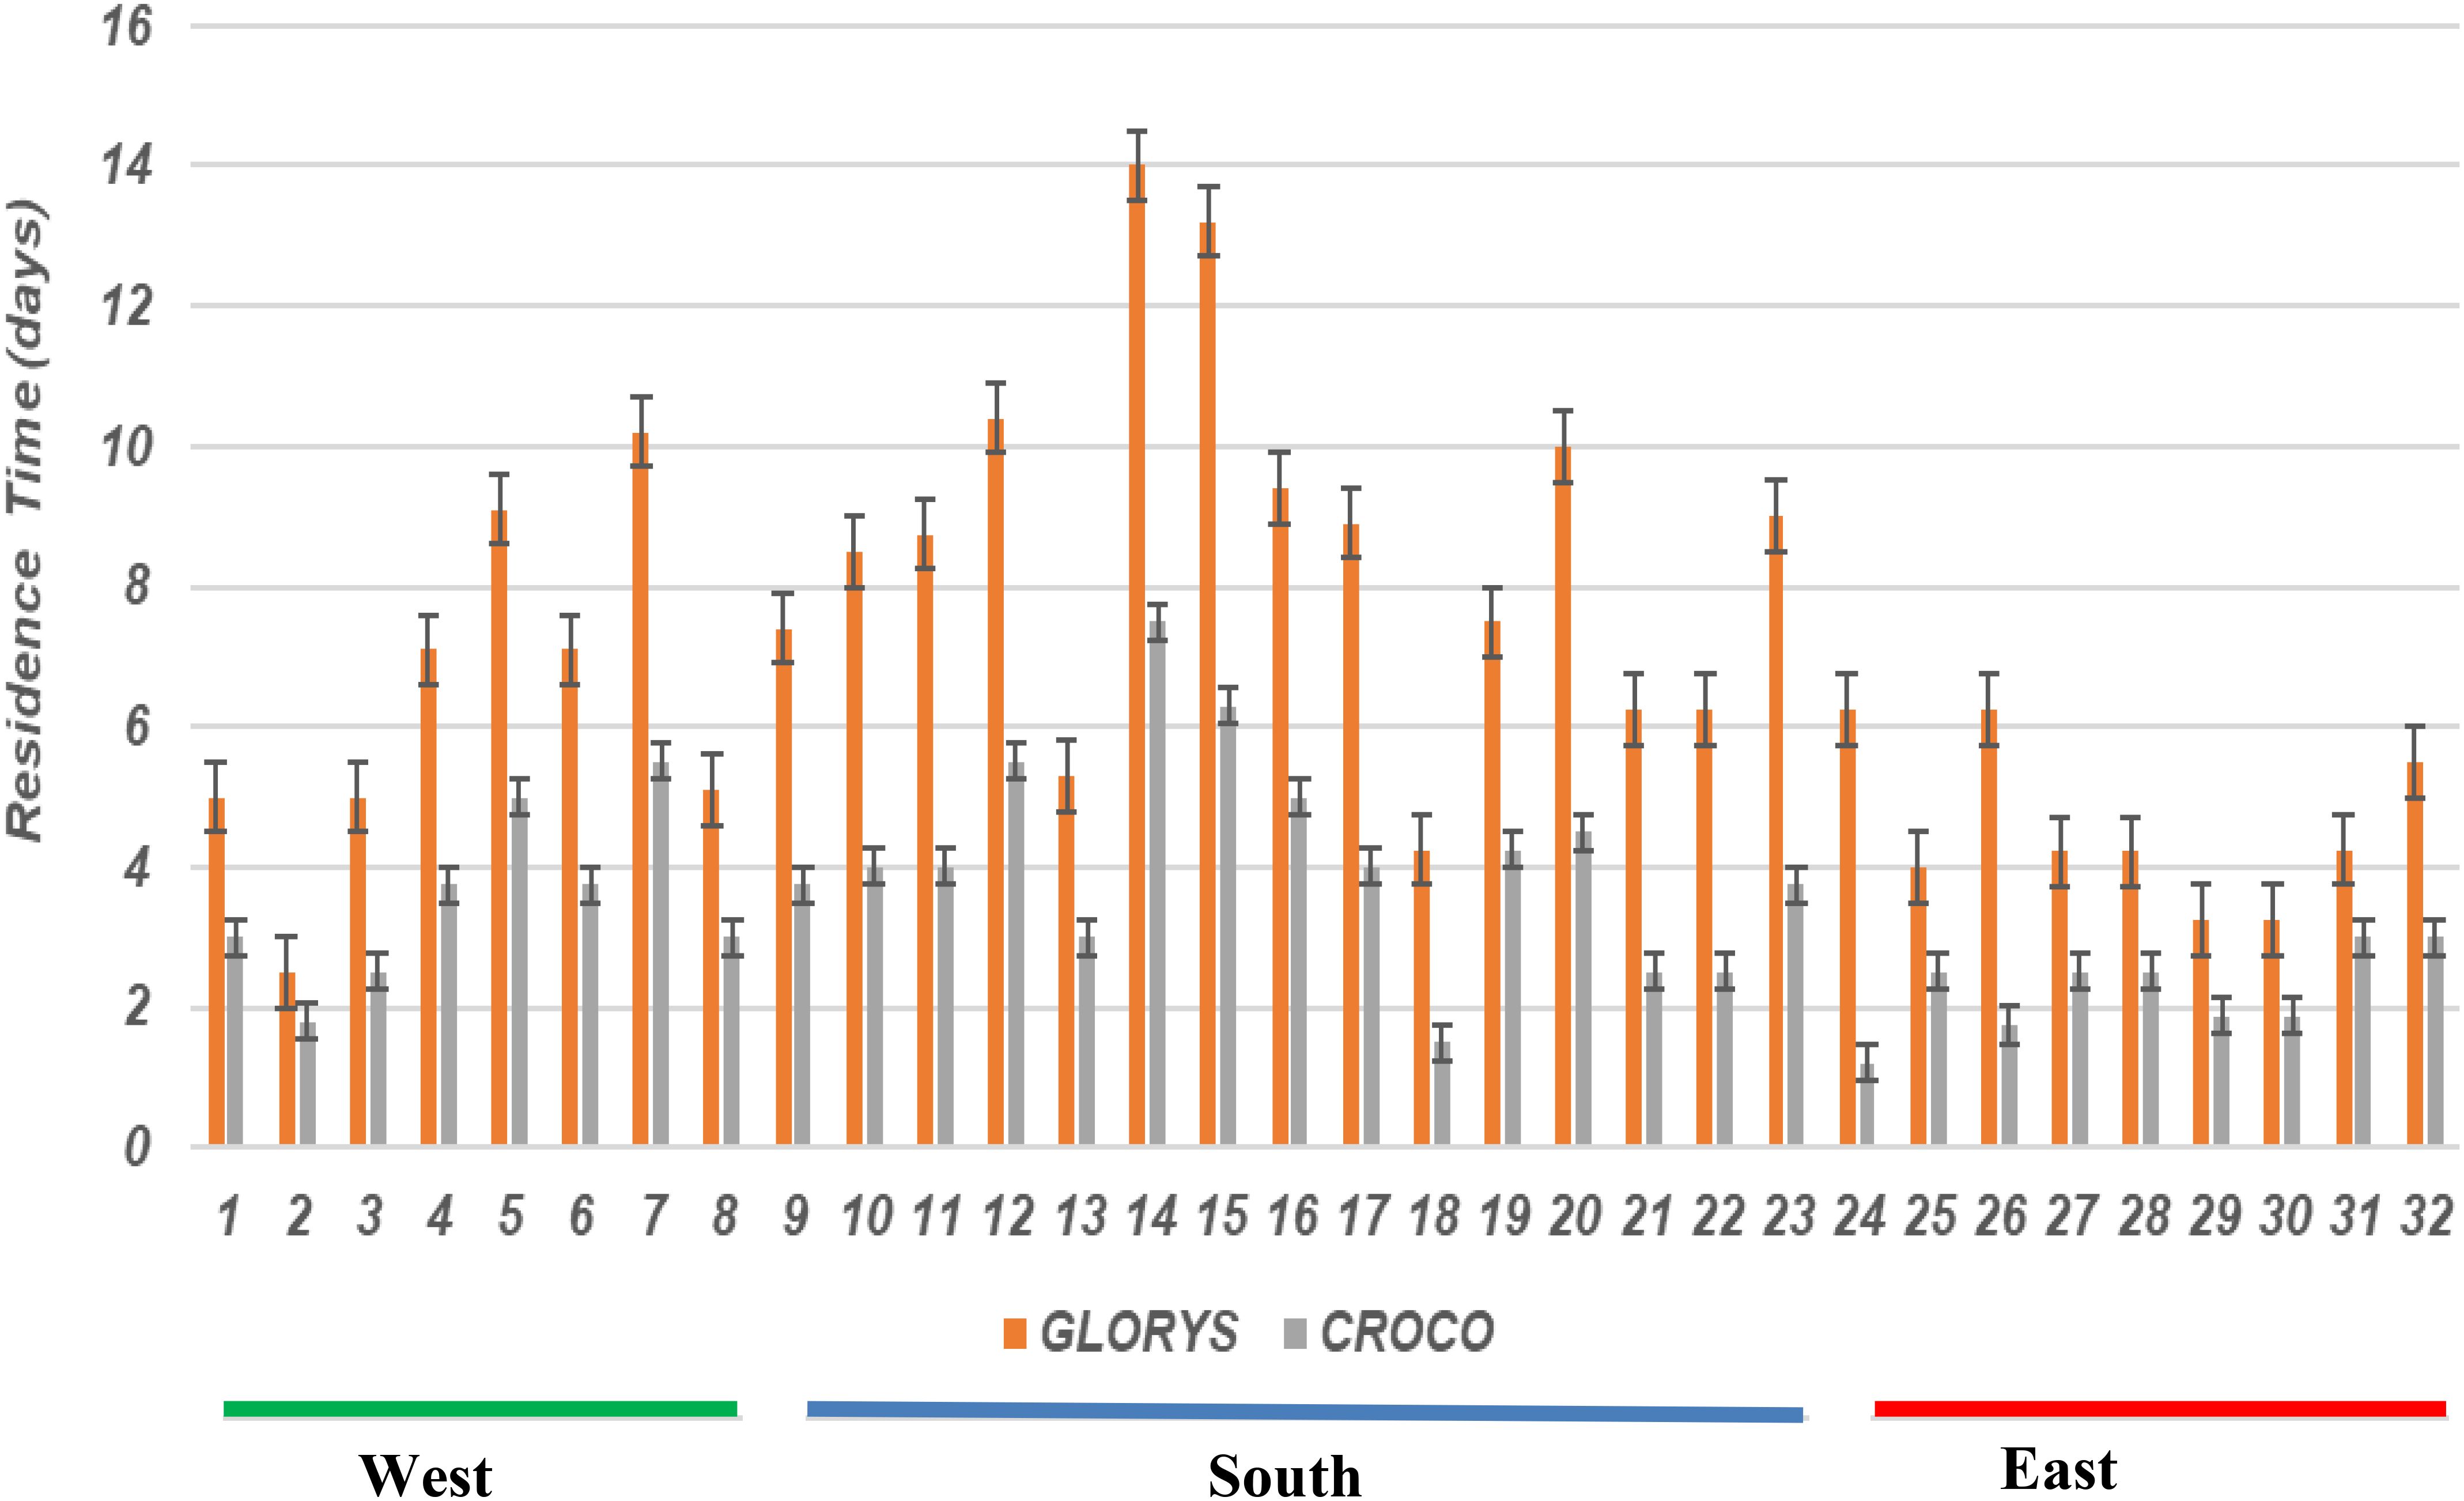
Figure 7. Average residence time (in days) of particles released in spawning areas using the GLORYS (orange color) and CROCO models (grey color). Spawning areas for the west coast (16.5–21 degrees east): 1–8, south coast (21–26 degree east): 9–23, and east coast (26–33 degrees east): (24–32).
4 Discussions
4.1 Representation of the major physical processes in the model
Figure 3A shows a remarkable agreement between the results obtained from the model and altimetry products (i.e., ESA-CCI and GLORYS). The results are further supported by quantification of SST error in terms of bias, RMSE and correlation coefficient (Supplementary Figure S1). The results also show a relatively warm bias of +1°C off the Cape Peninsula region in the CROCO model. This warm bias in sea surface temperature (SST) is more strongly expressed along the path of the northwards-flowing, shelf-edge Benguela jet current along the west coast of South Africa. The warm bias may be attributed to the location of the jet current which appears to be slightly far west in the CROCO model than in ESA-CCI product. While the model has a demonstrable ability to resolve fine-scale processes, it seems to position the mean location of the shelf-edge jet slightly far west. The jet appears to be too strong on the leading edge of the Benguela Current off the Peninsula. It follows that the observed warm bias in SST associated with eastern boundary currents is a fairly common phenomenon in regional coupled climate models (Dufois et al., 2012; Mao et al., 2019).
This warm bias typically manifests as higher than actual SSTs in subtropical eastern boundary regions of the ocean, particularly affecting upwelling systems resulting in discrepancies in modeled SST which can influence climate predictions and oceanic processes. Dufois et al. (2012) used the Pathfinder monthly SST climatologies and found out that this warm bias can be significant, with summertime differences up to 3–5°C in regions like the California, Humboldt, Canary, and Benguela upwelling systems. Ma et al. (2019) found that insufficient ocean dynamic upwelling is the dominant cause for SST warm bias in subtropical eastern boundary regions. Weakened eastern boundary currents result in additional warming that surpasses the cooling effects typically provided by upwelling in these regions. The origins of this warm bias, particularly during upwelling seasons, remain a subject of ongoing research.
4.2 Distribution patterns of the cape anchovy and sardine larvae
Figure 4 shows a high number of particles observed in the Natal Bight and along the path of the Agulhas Current in both the model and the GLORYS. The Natal Bight is recognized as a significant area for larval retention, which is vital for various ecological processes, including the successful settlement of fish larvae in the northern Agulhas Current region (Heye et al., 2022). For example, Heye et al. (2022) found that the Natal Bight Coastal Counter increases connectivity between MPAs within the Natal Bight, where the current increases water retention entrapping larvae, thus contributing to increasing the suitability of the habitat for larval development and settlement. However, south of the 310S, the model shows that particles released on the east coast of South Africa tend to move inshore of the Agulhas Current increasing residence times (Figure 7). Conversely, the GLORYS show that particles are either entrained by the current or drift to the outer regions of the current. The study of Tedesco et al. (2019) demonstrated the ability of the 3 km grid CROCO model to represent frontal features of the northern edge of the Agulhas Current such as shear driven meso-and sub-mesoscale cyclonic eddies. Studies by Krug et al. (2017) and Schubert et al. (2021) showed that these shear instabilities extract their energy from the mean Agulhas Current jet and increase the residence times of particles inshore of the current area.
Another major difference between larval dispersals obtained from the model and GLORYS is that there is a significantly large offshore loss of particles in the GLORYS between the eastern and southern coasts of South Africa (Figure 4). Demonstrable differences in the MKE and EKE are observed south of the African Continent. The differences in MKE can be attributed to the fact that the current is stronger and more inshore in the CROCO model, as opposed to the GLORYS where the current is slightly far offshore. The CROCO model’s realism has been validated by Tedesco et al. (2019) against in-situ Agulhas System Climate Array (ASCA) observations and altimetry from AVISO. The difference in EKE can be attributed to the net source of mesoscale eddy energy in the Agulhas Current region (Lutjeharms, 1989; Backeberg et al., 2008; Pauline et al., 2022; Tedesco et al., 2022). The net source of mesoscale eddy energy is caused by a strong generation of eddies (Tedesco et al., 2022) resulting in increased eddy energy in the Southern Agulhas Current. In the model, the local generation of mesoscale eddies dominates the net EKE budget leading to the observed EKE difference.
Circulation off the southern coast is relatively sluggish and is driven by winds and the Agulhas Current (Schumann et al., 1982; Schumann et al., 1995 and Lutjeharms and De Ruijter, 1996; Schumann, 1999; Lutjeharms, 2006). The region experiences a more variable wind regime especially during October, shifting from southwesterly in early October to southeasterly in late October (Lutjeharms, 2006; Rouault et al., 2010; Schumann, 2010). The GLORYS shows relatively sporadic dispersal patterns to the south of the continent as opposed to the model. However, both the GLORYS and model show a coherent high-density of particles over the Agulhas Bank (Figure 4). The winds influence the cross-shore transport leading to inshore movement of larvae in the region (Boyd and Shillington, 1994; Malan et al., 2019). The Agulhas Current influences the inshore movement of particles through intermittent mesoscale Natal Pulses meanders (Krug and Penven, 2011; Krug et al., 2014; Malan et al., 2018) that bring surface water closer to the shore. Krug et al. (2014) show that the Natal Pulses impact the eastern Agulhas Bank for 110 days per year on average, and through their intrusion, they impact drive the particles to the shelf. Furthermore, Krug et al. (2014) show that these Natal Pulses are responsible for the largest SST and current velocity anomalies leading to increased particles on the west Agulhas Bank.
The circulation along the highly dynamic west coast is largely driven by winds and the Benguela Jet (Boyd and Nelson, 1998; Shannon, 2001). The position and intensity of the shelf-edge Benguela Jet are largely driven by seasonal wind forcings (Strub et al., 1998; Penven et al., 2000; Fennel et al., 2012; Veitch et al., 2018). These dynamics influence the high variability of dispersal patterns observed on the west coast (Figures 4, 5). The wind-modulated Ekman transport drives the onshore movement of particles in the region (Figure 5; Desbiolles et al., 2015; Ragoasha et al., 2019; Ragoasha et al., 2022; Bordbar et al., 2021). We have anticipated the CROCO model to be able to resolve small-scale processes with more frontal variability at the inshore edge of Benguela Jet coupled with larval retention but our results show that the Jet is stronger there resulting in rapid advection of particles (and less retention) to the north and particles follow the mean jet path more. The model places the jet slightly more west than the GLORYS with implications for dispersals in that region. Conversely, the GLORYS show strong inshore movement leading to overestimation of local larval retention especially near the recognized recruitment area off the west coast.
4.3 MPA connectivity
Both the model and GLORYS show coherent upstream connectivity coupled with relatively high local recruitment and self-retention rates on the southern and western coasts (Figure 6) - which are regions characterized by relatively sluggish circulation driven by winds (Boyd and Nelson, 1998; Schumann et al., 1982; Lutjeharms and De Ruijter, 1996; Shannon, 2001; Lutjeharms, 2006) and mesoscale meanders on the Agulhas Bank (Krug et al., 2014; Malan et al., 2018; Tedesco et al., 2022; Tedesco et al., 2024). The general upstream connectivity in these regions is associated with large residence times (Figure 7). The difference between the model and GLORYS is found in the highly dynamic west coast region where GLORYS show larger connections, especially along the Cape Peninsula to the Cape Columbine (i.e., northwardly from Robben Island to the Childs Bank) stretch (Figure 5).
Stronger connections and large residence times are observed in the MPAs located in the northern Agulhas Current (Figures 6, 7) in both the model and GLORYS. These results highlight the influence of the frontal activity of the Agulhas Current especially near the Natal Bight region. The results show that there is significant larval retention on the western Agulhas Bank. These findings are consistent with literature which demonstrates that the western Agulhas Bank is a significant retention area for many coastal fish species.
4 Conclusion
Knowledge of dispersal patterns of the commercially and ecologically important Cape anchovy and sardine larvae in the coastal regions of South Africa is currently limited, and our study seeks to address this knowledge gap to support conservation and fisheries management efforts. We used a daily current velocity field from a regional configuration of 3 km grid, non-hydrostatic CROCO model and 8 km grid GLORYS to investigate the distribution patterns and connectivity pathways of the Cape anchovy and sardine, focusing across the MPA network located within the 200 m isobath. The model was chosen for its ability to resolve fine-scale processes that are crucial for the dispersal and recruitment variability of larval anchovies and sardines. We focused on distribution patterns of larvae during the October month as it coincides with the spawning peak period of the two coastal fish species (Crawford, 1980; Huggett et al., 1998; Hutchings et al., 1998; Beckley and Van der Lingen, 1999; Van der Lingen and Huggett, 2003; Miller et al., 2006).
Our study is unique because it provides for the first time an overview of coastal connectivity across the South African Exclusive Economic Zone (EEZ) and considers the impact of model resolution on dispersal pathways. Previous studies that investigated the influence of model resolution on larval dispersal in South Africa relied on hydrodynamic model output that could only resolve mesoscale processes (Huggett et al., 2003; Koneé et al., 2013; Lett et al., 2015). The main findings of the study are a) the dominant role of the Agulhas Current in driving southward connectivity across and causing short residence time on the east coast MPAs, b) the large retention area on the west Agulhas Bank, c) importance of the Benguela Jet in driving dispersion and connectivity in the southern Benguela region, and d) the inclusion of small scale processes representation of the Benguela Jet have significant impact on retention and connectivity. Particles were advected passively by surface currents. In our experiments, particles were advected passively by surface currents in a 2-dimensional flow.
Knowledge of distribution patterns and connecting pathways of larval anchovies and sardines is crucial for the conservation and sustainable management of pelagic fisheries. The Cape anchovy and sardines are commercially and ecologically important fish species in South Africa; hence, the a need to understand the transport mechanisms of these species’ early life stages. Our research adds to the growing body of knowledge on distribution patterns of the two most commercially and ecologically important fish species in South Africa.
Our study only considered the surface dispersion of particles in a 2-dimensional flow without incorporating larval behavior. However, future studies should incorporate larval behavior such as diel vertical migration and swimming, and the particle dispersion should be studied in 3-dimensional flow. This could potentially improve the realism of modelling studies of the Cape anchovy and sardine focusing on the entire water column within the EEZ.
Data availability statement
The raw data supporting the conclusions of this article will be made available by the authors, without undue reservation.
Author contributions
TR: Conceptualization, Data curation, Formal analysis, Funding acquisition, Investigation, Methodology, Project administration, Resources, Software, Supervision, Validation, Visualization, Writing – original draft, Writing – review & editing. MK: Conceptualization, Methodology, Project administration, Supervision, Writing – original draft, Writing – review & editing. MM: Conceptualization, Methodology, Project administration, Supervision, Writing – original draft, Writing – review & editing.
Funding
The author(s) declare financial support was received for the research, authorship, and/or publication of this article.
Acknowledgments
This project is funded as part of a bursary awarded by the Oceans and Coasts branch of the National Department of Forestry, Fisheries and the Environment in South Africa. Dr Pierrick Penven from the French National Research Institute for Sustainable Development (IRD) is greatly thanked for making available the output of the 3km grid CROCO model through the National Research Fund SAEON. Mr Bubele Rasmeni from the Oceans & Coasts branch of the National DFFE is thanked for his assistance in adapting the Ichthyop Python code for particle density calculations presented in this paper.
Conflict of interest
The authors declare that the research was conducted in the absence of any commercial or financial relationships that could be construed as a potential conflict of interest.
Generative AI statement
The author(s) declare that no Generative AI was used in the creation of this manuscript.
Publisher’s note
All claims expressed in this article are solely those of the authors and do not necessarily represent those of their affiliated organizations, or those of the publisher, the editors and the reviewers. Any product that may be evaluated in this article, or claim that may be made by its manufacturer, is not guaranteed or endorsed by the publisher.
Supplementary material
The Supplementary Material for this article can be found online at: https://www.frontiersin.org/articles/10.3389/fmars.2024.1508479/full#supplementary-material
References
Andrello M., Guilhaumon F., Albouy C., Parravicini V., Scholtens J., Verley P., et al. (2017). Global mismatch between fishing dependency and larval supply from marine reserves. Nat. Commun. 8 (1), 16039.
Backeberg B. C., Johannessen J. A., Bertino L., Reason C. J. (2008). The greater Agulhas Current system: An integrated study of its mesoscale variability. J. Operation. Oceanogr. 1, 29–44. doi: 10.1080/1755876X.2008.11020093
Bashevkin S. M., Dibble C. D., Dunn R. P., Hollarsmith J. A., Ng G., Satterthwaite E. V., et al. (2020). Larval dispersal in a changing ocean with an emphasis on upwelling regions. Ecosphere 11, e03015. doi: 10.1002/ecs2.v11.1
Beckley L. E., Van der Lingen C. D. (1999). Biology, fishery and management of sardines (Sardinops sagax) in southern African waters. Mar. Freshw. Res. 50, 955–978. doi: 10.1071/MF99068
Belharet M., Di Franco A., Calò A., Mari L., Claudet J., Casagrandi R., et al. (2020). Extending full protection inside existing marine protected areas, or reducing fishing effort outside, can reconcile conservation and fisheries goals. J. Appl. Ecol. 57 (10), 1948–1957.
Bordbar M. H., Mohrholz V., Schmidt M. (2021). The relation of wind-driven coastal and offshore upwelling in the benguela upwelling system. J. Phys. Oceanography 51 (10), 3117–3133.
Boyd A. J., Shillington F. A. (1994). Physical forcing and circulation patterns on the agulhas bank. South Afr. J. Sci. 90 (3), 143–154.
Boyd A. J., Nelson G. (1998). Variability of the Benguela current off the Cape Peninsula, South Africa. South Afr. J. Mar. Sci. 19, 27–39. doi: 10.2989/025776198784126665
Cowen R. K. (2002). “Larval Dispersal and Retention and Consequences for Population Connectivity,” in Coral reef fishes: dynamics and diversity in a complex ecosystem, vol. 149. .
Cowen R. K., Gawarkiewicz G., Pineda J., Thorrold S. R., Werner F. E. (2007). Population connectivity in marine systems an overview. Oceanography 20, 14–21. doi: 10.5670/oceanog.2007.26
Cowen R. K., Sponaugle S. (2009). Larval dispersal and marine population connectivity. Annu. Rev. Mar. Sci. 1 (1), 443–466.
Crawford R. J. M. (1980). Implications of availability, distribution and movement of pilchard (Sardinops ocellata) and anchovy (Engraulis capensis) for assessment and management of the South African purse-seine fishery. Rapp. Pv. Réun. Cons. perm. Int. Explor. Mer 177, 355–373. doi: 10.1111/j.1095-8649.1980.tb03744.x
D’Agostini A., Gherardi D. F. M., Pezzi L. P. (2015). Connectivity of marine protected areas and its relation with total kinetic energy. PloS One 10, e0139601. doi: 10.1371/journal.pone.0139601
Debreu L., Marchesiello P., Penven P., Cambon G. (2012). Two-way nesting in split-explicit ocean models: Algorithms, implementation and validation. Ocean Model. 49, 1–21. doi: 10.1016/j.ocemod.2012.03.003
Desbiolles F., Blanke B., Bentamy A., Grima N. (2015). Origin offine-scale wind stress curl structures in the benguela and canary upwellingsystems. J. Geophysical Research: Oceans 119 (11), 7931–7948.
Dufois F., Penven P., Whittle C. P., Veitch J. (2012). On the warm nearshore bias in pathfinder monthly SST products over eastern boundary upwelling systems. Ocean Modelling..
Fennel W., Junker T., Schmidt M., Mohrholz V. (2012). Response of the benguela upwelling systems to spatial variations in the wind stress. Continental Shelf Res. 45, 65–77.
Fowler J. L., Boyd A. J. (1998). Transport of anchovy and sardine eggs and larvae from the western Agulhas Bank to the West Coast during the 1993/94 and 1994/95 spawning seasons. Afr. J. Mar. Sci. 19, 181.
Fox A. D., Henry L. A., Corne D. W., Roberts J. M. (2016). Sensitivity of marine protected area network connectivity to atmospheric variability. R. Soc. Open Sci. 3, 160494. doi: 10.1098/rsos.160494
Good S., Fiedler E., Mao C., Martin M. J., Maycock A., Reid R., et al. (2020). The current configuration of the OSTIA system for operational production of foundation sea surface temperature and ice concentration analyses. Remote Sens. 12 (4), 720.
Grote B., Ekau W., Hagen W., Huggett J. A., Verheye H. M. (2007). The early life-history strategy of Cape hake in the Benguela upwelling region. Fish. Res. 86, 179–187. doi: 10.1016/j.fishres.2007.06.003
Hampton S. (2014). Multidisciplinary investigation into stock structure of small pelagic fishes in southern africa.
Hersbach H., Bell B., Berrisford P., Biavati G., Horányi A., Muñoz Sabater J., et al. (2023). ERA5 hourly data on single levels from 1940 to the present (Copernicus Climate Change Service (C3S) Climate Data Store (CDS)). doi: 10.24381/cds.adbb2d47
Heydorn A. E. F., Bang N. D., Pearce A. F., Flemming B. W., Carter R. A., Schleyer M. H., et al. (1978). Ecology of the agulhas current region: an assessment of biological responses to environmental parameters in the south-west indian ocean. Trans. R. Soc. South Afr. 43 (2), 151–190.
Heye S., Krug M., Penven P., Hart-Davis M. (2022). The Natal Bight coastal countercurrent: a modelling study. Continent. Shelf Res. 249, 104852. doi: 10.1016/j.csr.2022.104852
Huggett J. A., Boyd A. J., Hutchings L., Kemp A. D. (1998). Weekly variability of clupeoid eggs and larvae in the Benguela jet current: implications for recruitment (19: African Journal of Marine Science).
Huggett J., Fréon P., Mullon C., Penven P. (2003). Modelling the transport success of anchovy Engraulis encrasicolus eggs and larvae in the southern Benguela: the effect of spatiotemporal spawning patterns. Mar. Ecol. Prog. Ser. 250, 247–262. doi: 10.3354/meps250247
Hutchings L. (1994). The Agulhas Bank: a synthesis of available information and a brief comparison with other east-coast shelf regions. South Afr. J. Sci. 90, 179–185. doi: 10.10520/AJA00382353_4628
Hutchings L., Barange M., Bloomer S. F., Boyd A. J., Crawford R. J. M., Huggett J. A., et al. (1998). Multiple factors affecting south african anchovy recruitment in the spawning, transport and nursery areas. South Afr. J. Mar. Sci. 19 (1), 211–225.
Hutchings L., Beckley L. E., Griffiths M. H., Roberts M. J., Sundby S., Van der Lingen C. (2002). Spawning on the edge: spawning grounds and nursery areas around the southern African coastline. Mar. Freshw. Res. 53, 307–318. doi: 10.1071/MF01147
Jean-Michel L., Eric G., Romain B. B., Gilles G., Angélique M., Marie D., et al. (2021). The Copernicus global 1/12 oceanic and sea ice GLORYS12 reanalysis. Front. Earth Sci. 9, 698876. doi: 10.3389/feart.2021.698876
Jesús P., Jon H., Su S. (2007). Larval transport and dispersal in the coastal ocean and consequences for population connectivity. Oceanography 20. doi: 10.5670/oceanog.2007.27
Koné V., Lett C., Fréon P. (2013). Modelling the effect of food availability on recruitment success of cape anchovy ichthyoplankton in the southern benguela upwelling system. Afr. J. Mar. Sci. 35 (2), 151–161.
Krug M., Penven P. (2011). New perspectives on Natal Pulses from satellite observations. J. Geophys. Res.: Oceans 116, C07013. doi: 10.1029/2010JC006866
Krug M., Swart S., Gula J. (2017). Submesoscale cyclones in the Agulhas current. Geophys. Res. Lett. 44, 346–354. doi: 10.1002/2016GL071006
Krug M. J., Swart S., Hermes J. (2018). Ocean gliders ride the research wave in the agulhas current.
Krug M., Tournadre J., Dufois F. (2014). Interactions between the Agulhas Current and the eastern margin of the Agulhas Bank. Continent. Shelf Res. 81, 67–79. doi: 10.1016/j.csr.2014.02.020
Lett C., Ayata S. D., Huret M., Irisson J. O. (2010). Biophysical modelling to investigate the effects of climate change on marine population dispersal and connectivity. Prog. Oceanogr. 87, 106–113. doi: 10.1016/j.pocean.2010.09.005
Lett C., van der Lingen C., Loveday B., Moloney C. (2015). Biophysical models of larval dispersal in the Benguela Current ecosystem. Afr. J. Mar. Sci. 37, 457–465. doi: 10.2989/1814232X.2015.1105295
Lett C., Verley P., Mullon C., Parada C., Brochier T., Penven P., et al. (2008). A Lagrangian tool for modelling ichthyoplankton dynamics. Environ. Model. Softw. 23, 1210–1214. doi: 10.1016/j.envsoft.2008.02.005
Liu G., Bracco A., Quattrini A. M., Herrera S. (2021). Kilometer-scale larval dispersal processes predict metapopulation connectivity pathways for Paramuricea biscaya in the northern Gulf of Mexico. Front. Mar. Sci. 8, 790927. doi: 10.3389/fmars.2021.790927
Lutjeharms J. R. E., Catzel R., Valentine H. R. (1989). Eddies and other boundary phenomena of the Agulhas. Curr. Cont. Shelf Res. 9 (7), 597–616. doi: 10.1016/0278-4343(89)90032-0
Lutjeharms J. R. (2006). The coastal oceans of south-eastern Africa. sea 14, 783–834. doi: 10.1007/3-540-37212-1
Lutjeharms J. R. E. (2007). Three decades of research on the greater Agulhas Current. Ocean Science. 3 (1), 129–147.
Lutjeharms J. R. E., De Ruijter W. P. M. (1996). The influence of the Agulhas Current on the adjacent coastal ocean: possible impacts of climate change. J. Mar. Syst. 7, 321–336. doi: 10.1016/0924-7963(95)00010-0
Malan N., Backeberg B., Biastoch A., Durgadoo J. V., Samuelsen A., Reason C., et al. (2018). Agulhas Current Meanders facilitate shelf-slope exchange on the Eastern Agulhas Bank. J. Geophys. Res.: Oceans 123, 4762–4778. doi: 10.1029/2017JC013602
Malan N., Durgadoo J. V., Biastoch A., Reason C., Hermes J. (2019). Multidecadal wind variability drives temperature shifts on the agulhas bank. J. Geophysical Research: Oceans 124 (5), 3021–3035.
Mao X., Guo X., Kubota T., Wang Y. (2019). Numerical studies on snow crab (Chionoecetes opilio) larval survival and transport in the Sea of Japan. Progress in Oceanography. 179, 102204.
Merchant C. J., Embury O., Bulgin C. E., Block T., Corlett G. K., Fiedler E., et al. (2019). Satellite-based time-series of sea-surface temperature since 1981 for climate applications. Sci. Data 6 (1), 223.
Miller T. J. (2007). Contribution of individual-based coupled physical–biological models to understanding recruitment in marine fish populations. Mar. Ecol. Prog. Ser. 347, 127–138. doi: 10.3354/meps06973
Miller D. C., Moloney C. L., van der Lingen C. D., Lett C., Mullon C., Field J. G. (2006). Modelling the effects of physical–biological interactions and spatial variability in spawning and nursery areas on transport and retention of sardine Sardinops sagax eggs and larvae in the southern Benguela ecosystem. J. Mar. Syst. 61, 212–229. doi: 10.1016/j.jmarsys.2005.03.007
Mitarai S., Siegel D. A., Winters K. B., Warner R. R., Gaines S. D., Kendall B. E., et al. (2007). Larval dispersal in the turbulent coastal ocean: dynamics and impacts. Limnology and Oceanography Report CA 93106-3060.
Ocean and Sea Ice Satellite Application Facility (OSI SAF) (2014). GHRSST Level 2P sub-skin Sea Surface Temperature from the Advanced Very High Resolution Radiometer (AVHRR) on Metop satellites (currently Metop-A) produced by OSI SAF (GDS version 2).
Ospina-Alvarez A., Weidberg N., Aiken C. M., Navarrete S. A. (2018). Larval transport in the upwelling ecosystem of central chile: The effects of vertical migration, developmental time and coastal topography on recruitment. Prog. Oceanography 168, 82–99.
Parada C., Mullon C., Roy C., Freon P., Hutchings L., van der Lingen C. (2008). Does vertical migratory behavior retain fish larvae onshore in upwelling ecosystems? A modelling study of anchovy in the southern Benguela. Afr. J. Mar. Sci. 30, 437–452. doi: 10.2989/AJMS.2008.30.3.1.635
Pauline T., Gula J., Penven P., Ménesguen C. (2022). Mesoscale eddy kinetic energy budgets and transfers between vertical modes in the agulhas current. J. Phys. Oceanography 52 (4), 677–704.
Penven P., Claude R. O. Y., De Verdière A. C., Largier J. (2000). Simulation of a coastal jet retention process using a barotropic model. Oceanologica Acta 23 (5), 615–634.
Penven P., Debreu L., Marchesiello P., McWilliams J. C. (2006). Evaluation and application of the ROMS 1-way embedding procedure to the central California upwelling system. Ocean Model. 12, 157–187. doi: 10.1016/j.ocemod.2005.05.002
Pfaff M. C., Hart-Davis M., Smith M. E., Veitch J. (2022). A new model-based coastal retention index (CORE) identifies bays as hotspots of retention, biological production and cumulative anthropogenic pressures. Estuarine Coast. Shelf Sci. 273, 107909.
Pineda J., Hare J. A., Sponaugle S. U. (2007). Larval transport and dispersal in the coastal ocean and consequences for population connectivity. Oceanography 20, 22–39. doi: 10.5670/oceanog.2007.27
R Core Team. (2021). R: A language and environment for statistical computing (Vienna, Austria: R Foundation for Statistical Computing). Available at: https://www.R-project.org/.
Ragoasha N., Herbette S., Cambon G., Veitch J., Reason C., Roy C. (2019). Lagrangian pathways in the southern Benguela upwelling system. J. Mar. Syst. 195, 50–66. doi: 10.1016/j.jmarsys.2019.03.008
Ragoasha M. N., Herbette S., Veitch J., Cambon G., Reason C. J., Roy C. (2022). Inter-annual variability of the along-shore lagrangian transport success in the southern benguela current upwelling system. J. Geophysical Research: Oceans 127 (3), e2020JC017114.
Rio M. H., Mulet S., Picot N. (2014). Beyond GOCE for the ocean circulation estimate: Synergetic use of altimetry, gravimetry, and in situ data provides new insight into geostrophic and Ekman currents. Geophys. Res. Lett. 41, 8918–8925. doi: 10.1002/2014GL061773
Ross R. E., Nimmo-Smith W. A. M., Howell K. L. (2017). Towards ‘ecological coherence’: Assessing larval dispersal within a network of existing Marine Protected Areas. Deep Sea Research Part I: Oceanographic Research Papers 126, 128–138.
Rossi V., Ser-Giacomi E., López C., Hernández-García E. (2014). Hydrodynamic provinces and oceanic connectivity from a transport network help design marine reserves. Geophys. Res. Lett. 41, 2883–2891. doi: 10.1002/2014GL059540
Rouault M., Pohl B., Penven P. (2010). Coastal oceanic climate change and variability from 1982 to 2009 around South Africa. Afr. J. Mar. Sci. 32, 237–246. doi: 10.2989/1814232X.2010.501563
Saint-Amand A., Lambrechts J., Hanert E. (2023). Biophysical model resolution affects coral connectivity estimates. Sci. Rep. 13, 9414. doi: 10.1038/s41598-023-36158-5
Santos A. M. P., Nieblas A. E., Verley P., Teles-Machado A., Bonhommeau S., Lett C., et al. (2018). Sardine (Sardina pilchardus) larval dispersal in the iberian upwelling system, using coupled biophysical techniques. Prog. Oceanography 162, 83–97.
Schubert R., Gula J., Biastoch A. (2021). Submesoscale flows impact agulhas leakage in ocean simulations. Commun. Earth Environ. 2 (1), 197.
Schumann E. H. (1999). Wind-driven mixed layer and coastal upwelling processes off the south coast of South Africa. J. Mar. Res. 57, 671–691. doi: 10.1357/002224099321549639
Schumann E. H., Cohen A. L., Jury M. R. (1995). Coastal sea surface temperature variability along the south coast of South Africa and the relationship to regional and global climate. J. Mar. Res. 53, 231–248. doi: 10.1357/0022240953213205
Schumann E. H., Perrins L. A., Hunter I. T. (1982). Upwelling along the south coast of the cape province, south africa. South Afr. J. Sci. 78 (6), 238–242.
Schumann E. H. (2010). The Berg Estuary: Water structures and dynamics. Transact. Royal Soc. South Africa 64 (2), 164–180. doi: 10.1080/00359190909519250
Shannon L. V. (2001). Benguela Current. University of Cape Town, South Africa: Elsevier Ltd. 255–267. doi: 10.1006/rwos.2001.0359
Shchepetkin A. F., McWilliams J. C. (2005). The regional oceanic modelling system (ROMS): a split-explicit, free-surface, topography-following-coordinate oceanic model. Ocean Model. 9, 347–404. doi: 10.1016/j.ocemod.2004.08.002
Shelton A. P., Hutchings L. (1982). Transport of anchovy, Engraulis capensis Gilchrist, eggs and early larvae by a frontal jet current. ICES J. Mar. Sci. 40, 185–198. doi: 10.1093/icesjms/40.2.185
Simons R. D., David A. Siegel D. A., Brown K. S. (2013). Model sensitivity and robustness in the estimation of larval transport: A study of particle tracking parameters. J. Mar. Syst. 119–120,19–29. doi: 10.1016/j.jmarsys.2013.03.004
Somarakis S., Nikolioudakis N. (2010). What makes a late anchovy larva? the development of the caudal fin seen as a milestone in fish ontogeny. J. Plankton Res. 32 (3), 317–326.
Stenevik E. K., Verheye H. M., Lipinski M. R., Ostrowski M., Strømme T. (2008). Drift routes of Cape hake eggs and larvae in the southern Benguela Current system. J. Plankton Res. 30, 1147–1156. doi: 10.1093/plankt/fbn068
Strub P. T., Shillington F. A., James C., Weeks S. J. (1998). Satellite comparison of the seasonal circulation in the benguela and california current systems. Afr. J. Mar. Sci. 19.
Suthers I. M., Schaeffer A., Archer M., Roughan M., Griffin D. A., Chapman C. C., et al. (2023). Frontal eddies provide an oceanographic triad for favorable larval fish habitat. Limnology Oceanography 68 (5), 1019–1036.
Swearer S. E., Treml E. A., Shima J. S. (2019). A review of biophysical models of marine larval dispersal. Oceanogr. Mar. Biol. An Annual Review, 2019. 57, 325–356.
Tedesco P., Gula J., Penven P., Ménesguen C. (2022). Mesoscale eddy kinetic energy budgets and transfers between vertical modes in the Agulhas Current. J. Phys. Oceanogr. 52 (4), 677–704.
Tedesco P., Gula J., Ménesguen C., Penven P., Krug M. (2019). Generation of submesoscale frontal eddies in the Agulhas Current. J. Geophys. Res.: Oceans 124, 7606–7625. doi: 10.1029/2019JC015229
Tedesco P., Gula J., Penven P., Ménesguen C., Jamet Q., Vic C. (2024). Can mesoscale eddy kinetic energy sources and sinks be inferred from sea surface height in the agulhas current region? J. Geophysical Research: Oceans 129 (4), e2023JC020833.
Treml E. A., Halpin P. N., Urban D. L., Pratson L. F. (2008). Modeling population connectivity by ocean currents, a graph-theoretic approach for marine conservation. Landscape Ecol. 23, 19–36.
Veitch J., Hermes J., Lamont T., Penven P., Dufois F. (2018). Shelf-edge jet currents in the southern benguela: A modelling approach. J. Mar. Syst. 188, 27–38.
Van der Lingen C. D., Huggett J. A. (2003). “The role of ichthyoplankton surveys in recruitment research and management of South African anchovy and sardine,” In The big fish bang: proceedings of the 26th annual larval fish conference. Vol. 303. 341 (Bergen, Norway: Institute of Marine Research).
Van Sebille E., Griffies S. M., Abernathey R., Adams T. P., Berloff P., Biastoch A., et al. (2018). Lagrangian ocean analysis: Fundamentals and practices. Ocean Model. 121, 49–75. doi: 10.1016/j.ocemod.2017.11.008
Ward S. L., Robins P. E., Owen A., Demmer J., Jenkins S. R. (2023). The importance of resolving nearshore currents in coastal dispersal models. Ocean Model. 183, 102181.
White J. W., Carr M. H., Caselle J. E., Washburn L., Woodson C. B., Palumbi S. R., et al. (2019). Connectivity, dispersal, and recruitment. Oceanography 32, 50–59. doi: 10.5670/oceanog.2019.310
Keywords: marine protected areas, Lagrangian analysis, dispersion, connectivity, ocean model, South Africa, anchovy, sardines
Citation: Rasehlomi T, Krug M and Myksvoll MS (2025) Larval anchovy and sardine dispersal patterns in South Africa’s exclusive economic zone. Front. Mar. Sci. 11:1508479. doi: 10.3389/fmars.2024.1508479
Received: 09 October 2024; Accepted: 23 December 2024;
Published: 06 February 2025.
Edited by:
Harry Gorfine, Victorian Fisheries Authority, AustraliaReviewed by:
Tomislav Džoic, Institute of Oceanography and Fisheries (IZOR), CroatiaQinwang Xing, Shandong University, China
Copyright © 2025 Rasehlomi, Krug and Myksvoll. This is an open-access article distributed under the terms of the Creative Commons Attribution License (CC BY). The use, distribution or reproduction in other forums is permitted, provided the original author(s) and the copyright owner(s) are credited and that the original publication in this journal is cited, in accordance with accepted academic practice. No use, distribution or reproduction is permitted which does not comply with these terms.
*Correspondence: Tshikana Rasehlomi, dHNoaWthbmEuZGVmZkBnbWFpbC5jb20=