- School of Biological Sciences, Georgia Institute of Technology, Atlanta, GA, United States
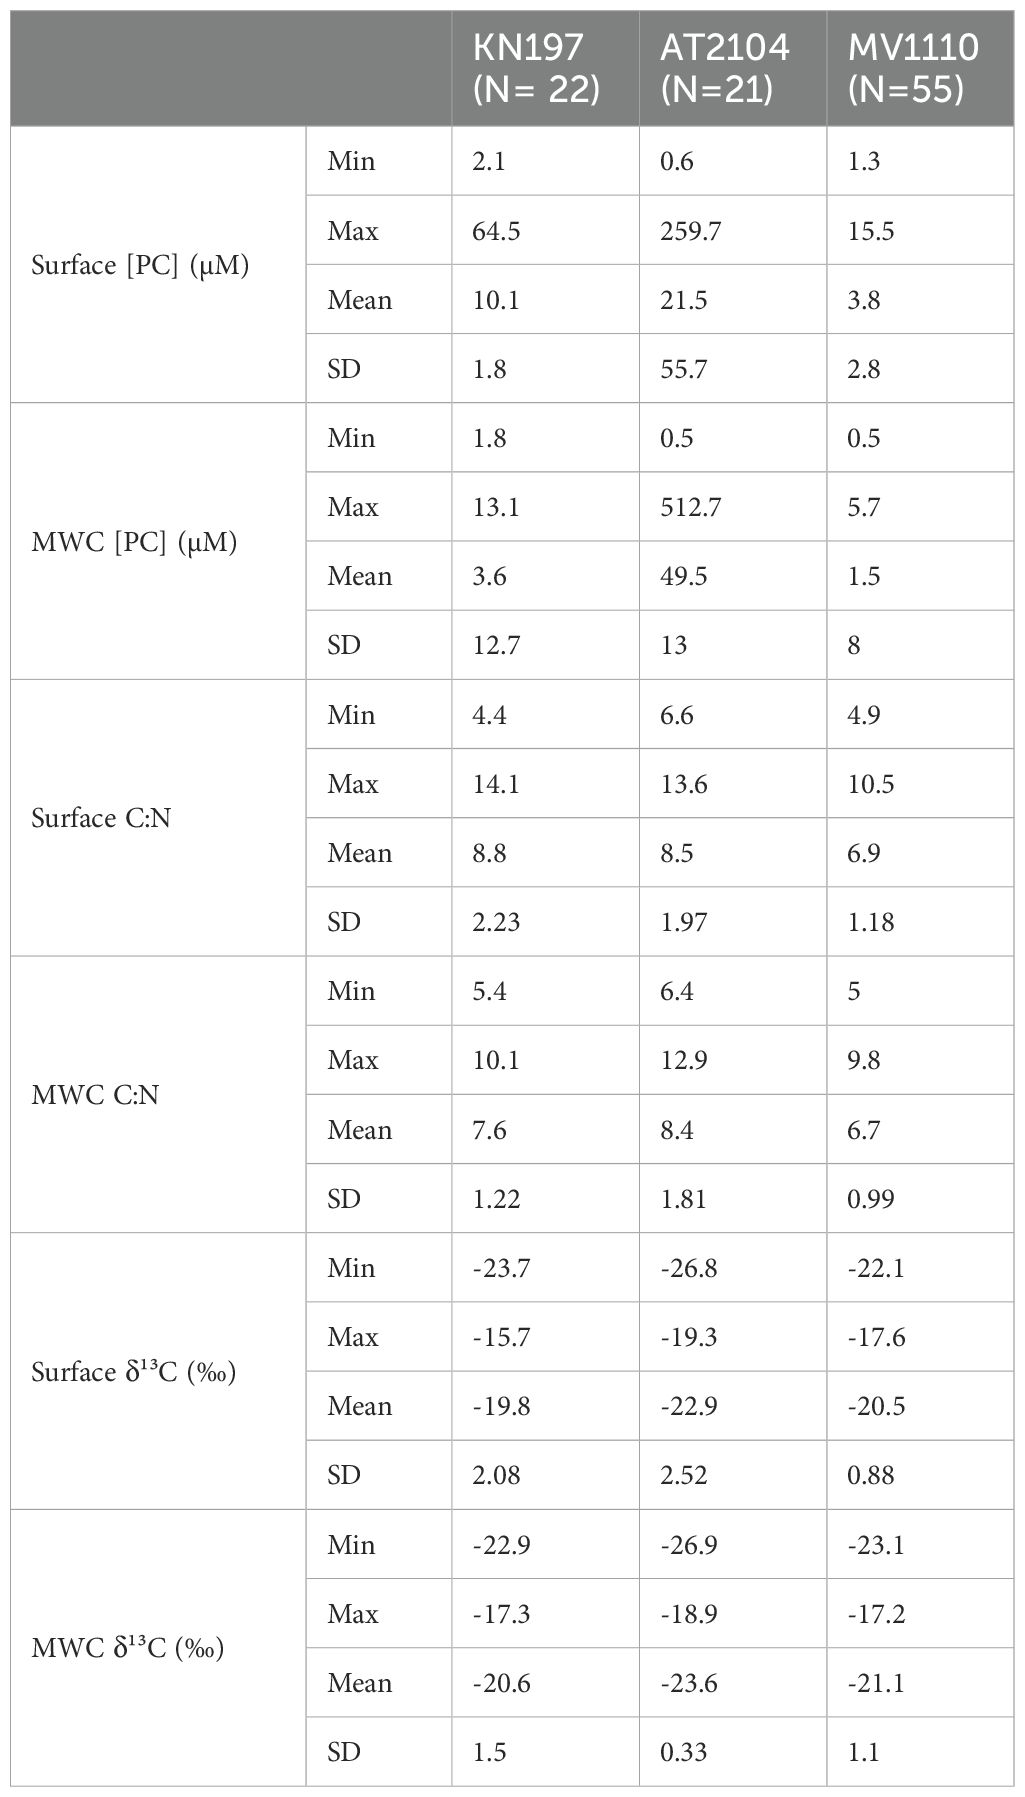
We investigated the distribution, C:N elemental ratio, and δ¹³C of suspended particulate carbon in the surface and upper 100 m of the water column during three seasons in areas of the Western Tropical North Atlantic influenced by the Amazon River Plume: the Spring high flow period (KN197 Cruise, May-June), the late Summer period of reduced flow (AT2104 cruise, July), and the low flow period in the Fall (MV1110 cruise, Sept-Oct). We used a habitat delineation method to examine spatial and temporal variability in our biogeochemical parameters. We found the highest biomass concentration ([PC]=259.7 µM), high C:N ratio (13.6), and the most negative δ¹³C (-26.8 ‰) in the area proximate to the river mouth during the late summer cruise. We measured elevated [PC] (64.5 µM), C:N ratios (14.1), and δ¹³C (max -15.7 ‰) in the plume core habitats during the peak flow season, reflecting the impact of both the outflow and in situ phytoplankton production. We found that the western margin of the plume had relatively higher biomass, C:N ratios, and organic matter more enriched in 13C than the east margins. In our work area, oceanic waters had the lowest [PC] (1.3 µM), a C:N ratio higher than the Redfield ratio (6.6), and an average δ¹³C of -22 ‰. We explored the relationships between PC and Chla, and δ¹³C and C:N ratio to estimate the contribution of phytoplankton production and terrigenous sources to the suspended particulate carbon pool. We found terrestrial and detrital sources contributing more to the organic matter of the river mouth area. However, the contribution of phytoplankton and living sources dominate most of our study area in all seasons. Our findings emphasize the role of the Amazon River Plume in enhancing biomass and productivity of the WTNA and the biogeochemical dynamic of the carbon cycle.
Introduction
Suspended particulate organic matter (POM) is a crucial transporter of carbon from the sunlit, productive ocean surface to its depths, a process known as the biological pump (Platt and Subba Rao, 1975). In areas affected by riverine inputs, POM includes a mixture of marine-derived materials, including phytoplankton, microzooplankton, bacteria, and detrital matter, along with terrestrially-derived organic material such as land plants, freshwater phytoplankton, and anthropogenic inputs of organic matter (Cai et al., 1988; Çoban-Yıldız et al., 2006; Hedges et al., 1986). Physical and biochemical forcings control the POM pool, including primary productivity, zooplankton grazing, water circulation patterns, sediment resuspension, and influxes from terrestrial sources (Sigleo and Macko, 2002; Wassmann and Aadnesen, 1984). In aquatic biogeochemistry, the elemental ratio of carbon to nitrogen (C:N by atoms) and carbon stable isotope (δ¹³C) are natural tracers widely used to determine the origin and fate of organic matter (Fry and Sherr, 1984; Richey et al., 1990). This approach relies on the significant differences in C:N ratios and δ¹³C among various end members and assumes that only a physical mixing occurs in these marginal sites (Fry, 2006). Quantifying the relative contributions of end members using mass balance models requires known and constant elemental and isotopic values of these end members and well-identified sources in the study region (Hedges et al., 1986; Redfield, 1958; Wada et al., 1987).
Marine phytoplankton assimilate dissolved carbon dioxide (CO2(aq)) to synthesize organic carbon during photosynthesis. This metabolic process exhibits a preference for the lighter isotope (12C), resulting in the progressive enrichment of the residual dissolved pool with the heavier isotope (13C). The expression of isotopic fractionation during phytoplankton carbon fixation depends on both the activity of RuBP carboxylase and the availability of CO2(aq) relative to demand. Enzymatic fractionation produces organic matter with a δ13C lower than the inorganic source pool by about 25‰ to 28‰ (Farquhar et al., 1982; Fischer, 1991; Hofmann et al., 2000). Lower ambient CO2(aq) concentrations and higher consumption rates may cause CO2 fixation to become diffusion-limited and mask the expression of enzymatic fractionation, producing organic matter with a higher δ13C (Laws et al., 1995; Popp et al., 1998). Additional factors such as cell size and morphology and the sources of dissolved inorganic carbon (DIC) used (e.g., HCO3- vs. CO2) may also influence the expression of isotopic fractionation (Falkowski, 1991; Fry and Sherr, 1989; Kukert and Riebesell, 1998; Rau et al., 1992). Smaller-sized phytoplankton, such as picoplankton, typically exhibit lower δ13C values compared to larger cells like diatoms, especially during rapid growth phases or blooms. This disparity arises primarily from the smaller surface area-to-volume ratio of large cells, making them more susceptible to diffusion limitation (Montoya and McCarthy, 1995; Rau et al., 1990). Finally, carbon concentrating mechanisms (CCMs) occur in most cyanobacteria and may have developed over time in response to decreasing atmospheric CO2 levels to facilitate efficient carboxylation near Rubisco in oxygenated waters (Falkowski, 1991; Popp et al., 1998). Phytoplankton with CCMs or diffusive limitation of carbon supply have more positive δ13C. In contrast, the diffusive entry of CO2 typically leads to more negative δ13C values due to enzymatic limitation (Laws et al., 1995).
The Amazon is the largest river globally, with an average discharge of 1.75 x 10⁵ m3 s-1 and the size of its drainage basin of 7.05 x 10⁶ km2 (Muller–Karger et al., 1988; Ryther et al., 1967). The flow of the Amazon River exhibits a pronounced seasonal cycle, with peak flow reaching about 2.5 x 10⁵ m3 s-1 in May and a minimum flow of approximately 1 x 10⁵ m3 s-1 in November (Richey et al., 1990). The river plume generally flows to the northwest toward the Caribbean during peak discharge periods, while it retroflects eastward into offshore waters of the tropical Atlantic Ocean during low discharge periods (Muller–Karger et al., 1988). These movements are facilitated by the North Brazil Current, which undergoes seasonal retroflection by the North Equatorial Counter Current (Coles et al., 2013a; Lentz, 1995).
Extensive studies conducted in the Amazon River Plume region have revealed significant variations in particulate organic matter’s composition and distribution over time and distance in response to hydrological changes (Cai et al., 1988; Quay et al., 1992; Richey et al., 1990; Ward et al., 2013). Few studies have specifically examined the vertical distributions of biomass and carbon isotopic composition in the Amazon River Plume (ARP) area (DeMaster et al., 1991). This study addresses two main questions: 1) How do the hydrographic and biogeochemical properties of the Amazon River plume and adjacent offshore waters influence the spatial and temporal distribution of biomass and carbon-stable isotopes? 2) What factors regulate biomass distribution at the surface and throughout the water column? To explore these, we aggregate data from three seasonal cruises that span the Western Tropical North Atlantic (WTNA) region influenced by the ARP and surrounding oceanic waters. We document the distributions of the PC, C:N elemental ratio, and δ¹³C values at the surface and in the upper 100 m of the water column. We then investigate the potential influence of environmental drivers in shaping the observed patterns, including hydrographic conditions, nutrient availability, and biological processes. We aim to understand better the complex dynamics governing carbon cycling and ecosystem function in the ARP region.
Methods
Study area and research cruises
This research explores the Amazon Plume region of the Western Tropical North Atlantic. Samples were collected during three oceanographic cruises: KN197 (May-June 2010, R/V Knorr) during the peak discharge period, AT2104 (July 2012, R/V Atlantis), during the falling discharge period, and MV1110 (September-October 2011, R/V Melville), during the low discharge period. Each cruise sampled a different set of planktonic habitats defined by Weber et al. (2019) and Pham et al. (2024): RI (Riverine Input), YPC (Young Plume Core), OPC (Old Plume Core), WPM (Western Plume Margin), EPM (Eastern Plume Margin), and OSW (Offshore Waters, Table 1) (Figure 1).

Table 1. List of Habitat Types, description, color code, Cruises sampled, and the total number of casts of each habitat.
Hydrography, nutrients and suspended particles
We obtained hydrographic data using the shipboard underway flow-through system and a CTD-rosette equipped with a fluorometer, transmissometer, and PAR sensor. In brief, we collected unfiltered seawater samples directly from the ship’s underway system or CTD-rosette for measurement of the concentrations of dissolved nutrients (NO3-+NO2-, PO4-3, and SiO2) using a Lachat QuickChem 8000 FIA system. We collected suspended particles for isotopic and elemental analysis by passing 2-18 L of seawater through pre-combusted (450˚C for four hours) 47mm GF/F filters under gentle pressure (5-10 psi) without acidification. Sample filters were dried at sea (60˚C) and stored over desiccant for analysis ashore (Weber et al., 2017).
Elemental and isotopic composition
We measured the elemental composition and natural abundance of 13C in suspended particles by continuous-flow isotope-ratio mass spectrometry (CF-IRMS) using a Micromass Optima or an Isoprime 100 interfaced to a Carlo Erba NA2500 elemental analyzer for online combustion and purification of sample carbon and nitrogen. We report all stable isotope abundances as δ13C values relative to VPDB. A size series of standards for elemental (methionine) and isotopic (peptone) composition were used to check instrument stability and correct analytical blanks (Montoya, 2008). We estimate that the overall analytical precision of our isotopic measurements is better than ±0.2‰.
Biogeochemical parameter calculations
We calculated the depth-weighted mean of the concentration of particulate carbon, [PC], and the depth-weighted mean δ13C of suspended particulate matter in the upper water column by trapezoidal integration (Landrum et al., 2011):
Where [PC]i is the particulate carbon PC concentration (μM), and δ¹³C is the isotopic composition of PC in-depth interval Δzi (m).
Similarly, we calculated the depth-weighted mean water column (MWC) concentrations of nitrate, phosphate, and silicate as:
In all cases, we integrated our data over the upper 100 m of the water column. We integrated through the entire sampling depth where the bottom depth was ≤ 100 m.
Statistical analysis
We tested for significant differences in surface and mean water column (MWC) values of PC concentration, elemental C:N ratio, and the δ13C among the habitat types defined by Weber et al. (2019) and Pham et al. (2024) by performing one-way ANOVAs. When tests were significant (p < 0.05); we additionally ran post hoc Tukey–Kramer tests to explore significant differences among habitats (α = 0.05). Additionally, we calculated principal component analysis (PCA) and Pearson correlation coefficients to investigate the relationships between hydrographic conditions and particulate matter characteristics. Our statistics and graphical data representations were performed using JMP Pro 17 software (SAS Institute Inc., Cary, USA) and R using RStudio (Team, 2022).
Results
Hydrographic and nutrient properties
Cruise KN197 sampled five habitats (Figure 1A; Table 1) in the WTNA during the peak discharge period of spring 2010 (Pham et al., 2024; Weber et al., 2019). The plume core habitats (YPC and OPC) had the most stratified water column due to their higher surface temperature (mean SST=29.7°C) and lower surface salinity (mean SSS= 16.6 psu) relative to the surrounding oceanic waters. As the plume moved northward, it mixed with offshore water and became less coherent spatially. The eastern and western margins of the plume (EPM and WPM habitats) had lower surface temperatures (< 28.5°C) and higher surface salinities (>30 psu) and were less stratified compared to the plume core habitats. The average mixed layer depth (MLD) increased from less than 10 m in the YPC to more than 60 m in the OSW habitat. The depth of the deep chlorophyll-a maximum (ChlDM) deepened from a few meters in plume core habitats to about 120 m in the EPM habitat (Figures 2A-C).
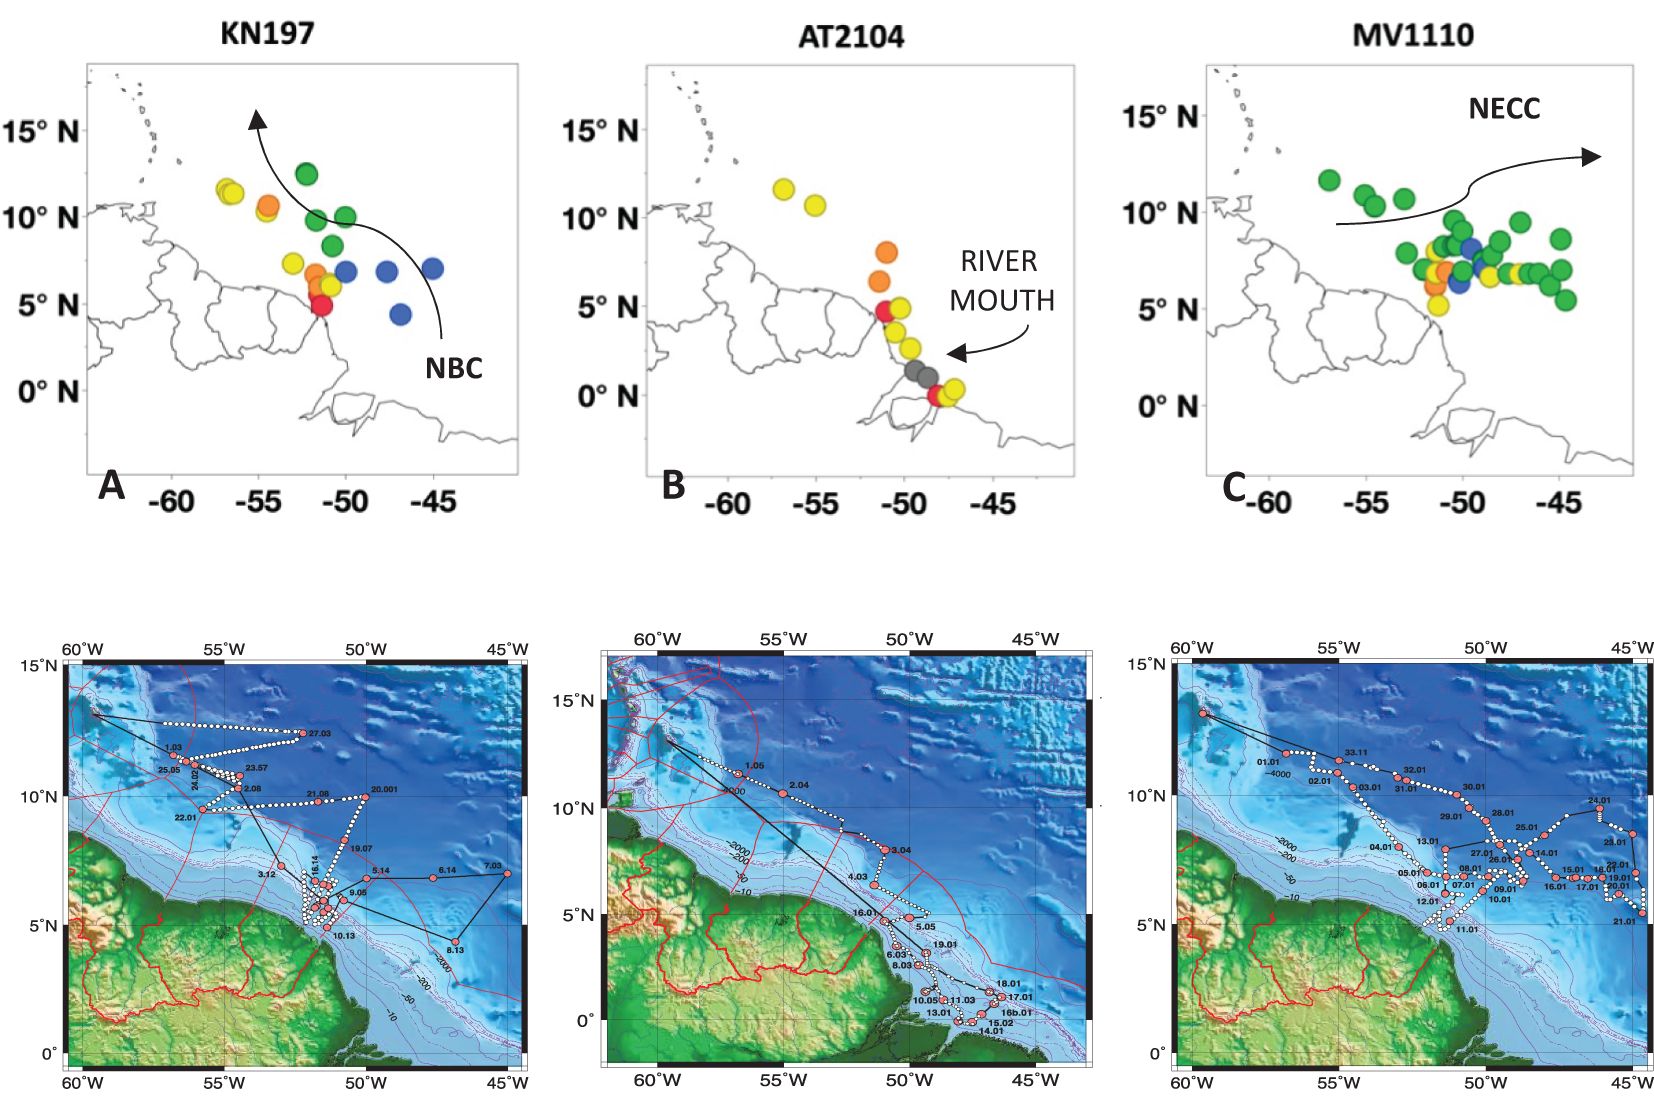
Figure 1. Maps of sampling stations of (A) Cruise KN197 in spring, (B) Cruise AT2104 in late summer, and (C) Cruise MV1110 in fall in the western tropical North Atlantic. Each marker denotes a single sampling station. Habitat types defined by Weber et al. (2019) and Pham et al. (2024) are marked by color: Riverine Input (RI, gray), Young Plume Core (YPC, red), Old Plume Core (OPC, orange), Western Plume Margin (WPM, yellow), Eastern Plume Margin (EPM, green), and Oceanic Water (OSW, blue). These cruises were part of the ANACONDAS program (Amazon’s influence on the Atlantic Carbon export from nitrogen fixed by diatom symbioses). Photo credit Joseph Montoya.
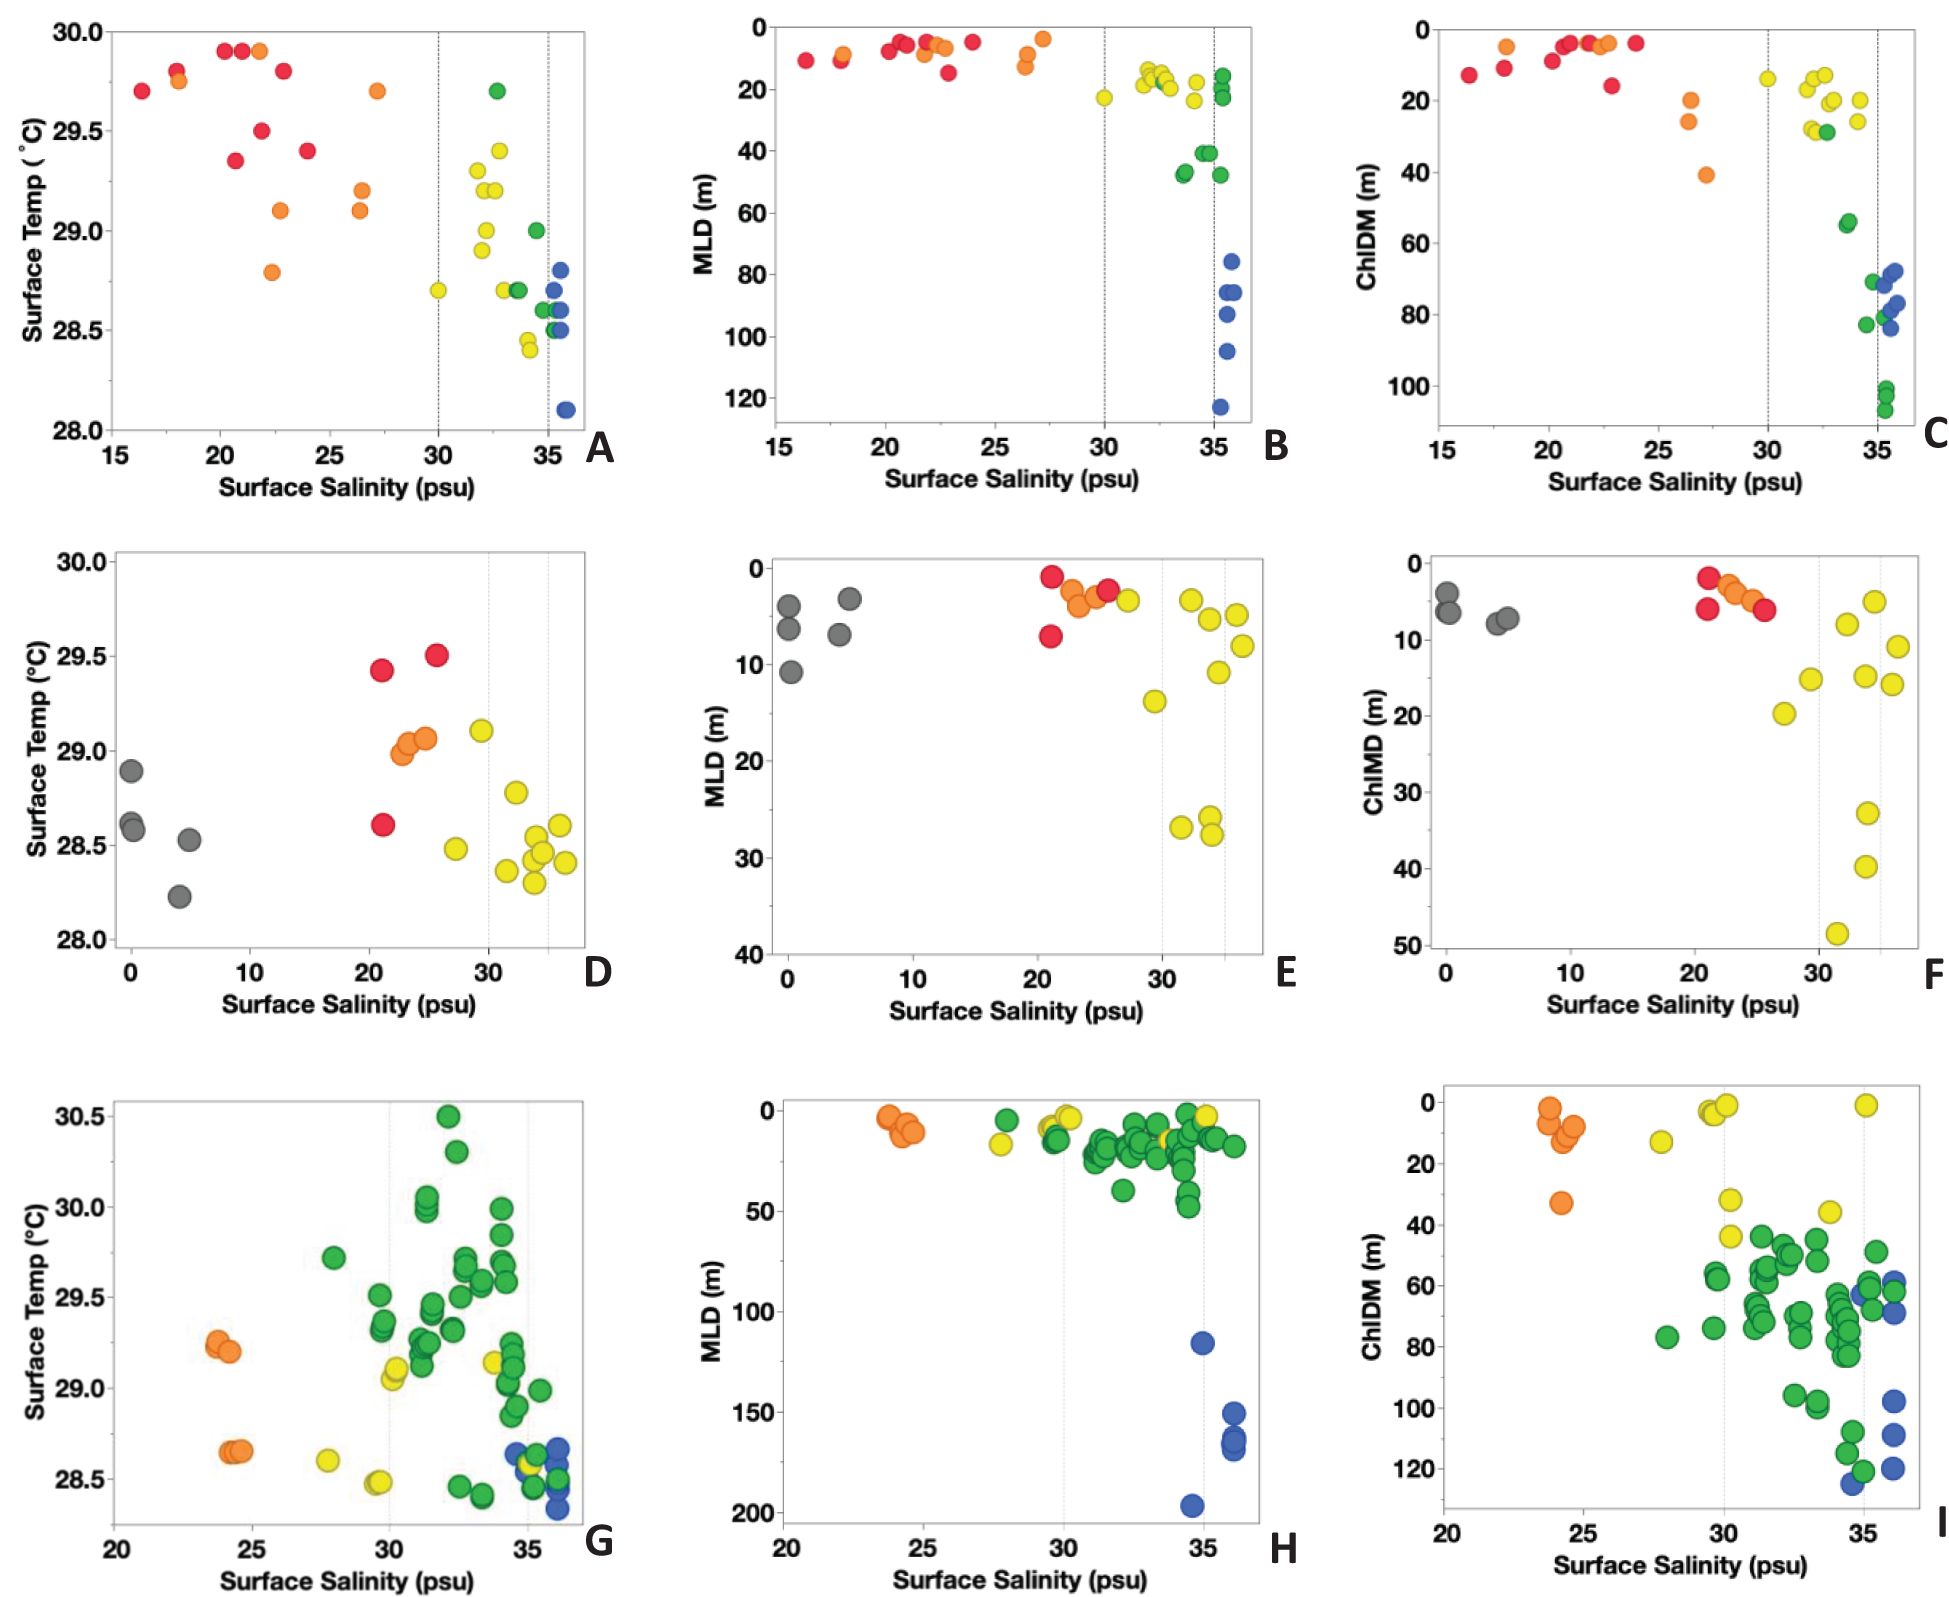
Figure 2. Hydrographic properties of surface temperature (°C), mixed layer depth (MLD, in m), and Chla maximum depth (ChlDM, in m) vs. surface salinity (psu) for Cruise KN197 (A–C), Cruise AT2104 (D–F), and Cruise MV1110 (G–I). The color represents habitat types as follows: Riverine Input (RI, gray), Young Plume Core (YPC, red), Old Plume Core (OPC, orange), Western Plume Margin (WPM, yellow), Eastern Plume Margin (EPM, green), and Oceanic Water (OSW, blue).
The spatial distributions of nutrient concentrations in the surface water (depth <5m) were like those in the upper water column (down to 100 m). Specifically, we found higher nutrient values in the plume core habitats and gradually decreasing concentrations moving northward (Figures 3A-C). The surface [NO3-] was undetectable at most stations, with notable exceptions at Stations 4.04 and 9.43, which belonged to the OPC and WPM habitats. In contrast, the surface concentrations of [PO4-3] and [SiO2] were notably higher in the YPC and OPC habitats but decreased sharply in the WPM, EPM, and OSW habitats. Below the surface, the MWC [NO3-] ranged from 1.9 ± 1.6 µM in the YPC habitat to 0.4 ± 0.3µM in the OSW habitat, while the MWC [PO4-3] ranged from 0.2 ± 0.1 µM in the YPC habitat to 0.05 ± 0.06µM in the OSW habitat. The MWC [SiO2] ranged from 5.4 ± 4.6 µM in the YPC habitat to 1.2 ± 0.3µM in the OSW habitat.
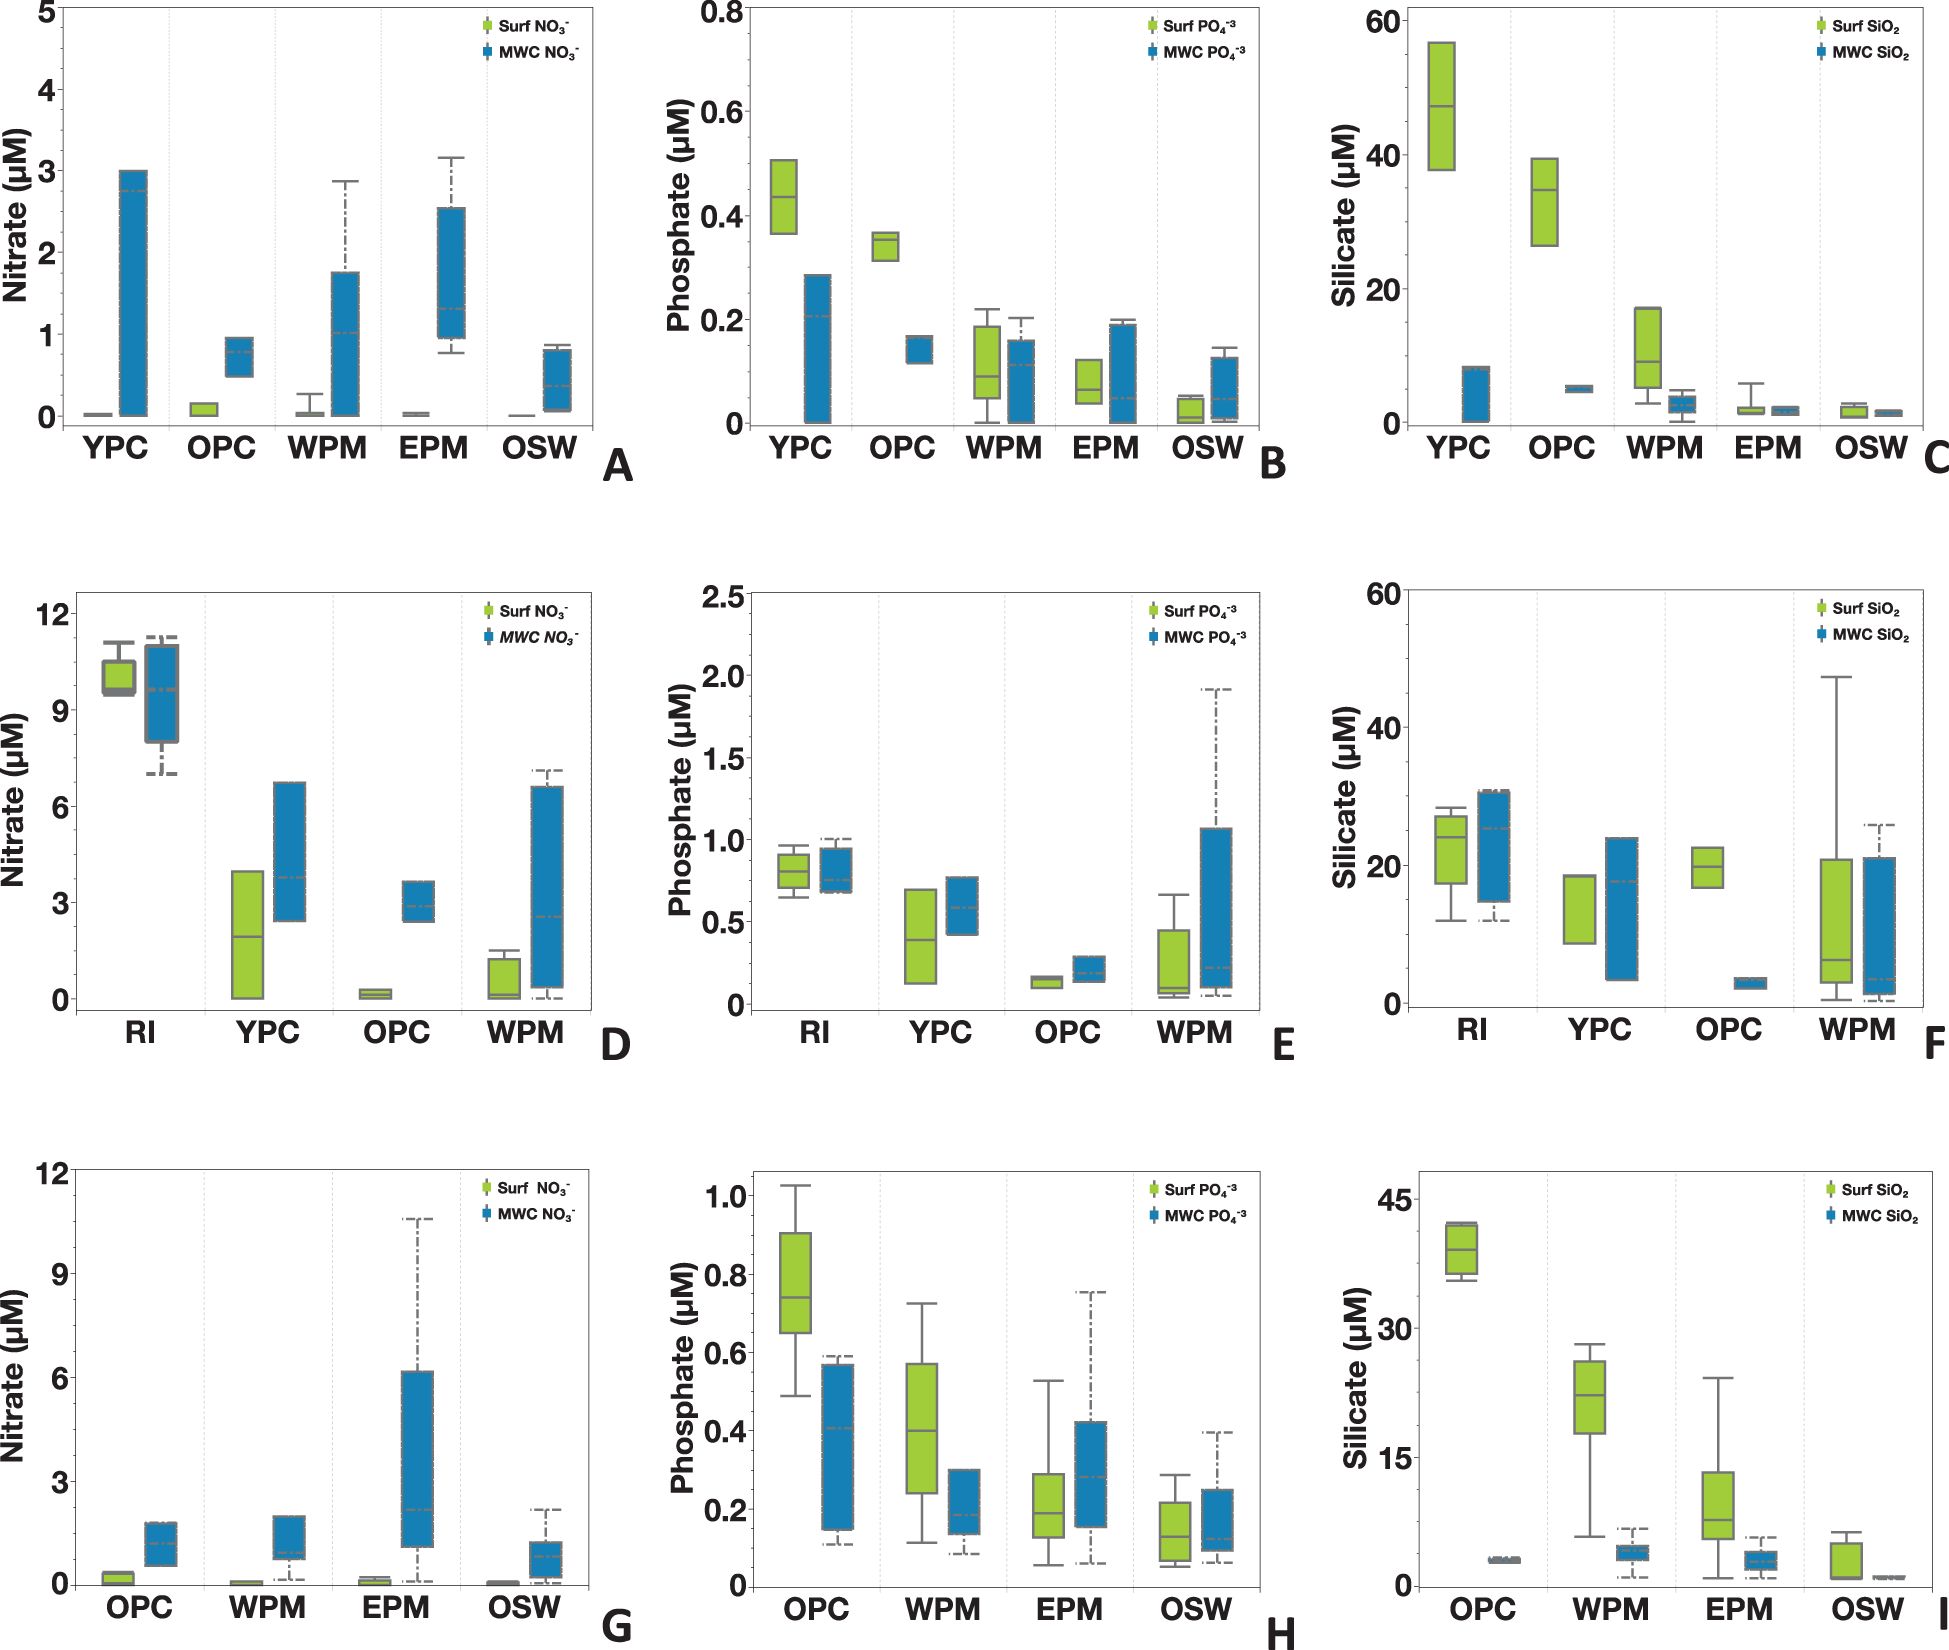
Figure 3. Nutrient distributions of nitrate, phosphate, and silicate for Cruise KN197 (A–C), Cruise AT2104 (D–F), and Cruise MV1110 (G–I). The light green box plot represents surface measurement, the blue box plot represents the mean water column (MWC) measurement, and the error bar represents standard error. Note the variation in scale in the Y-axis and X-axis. Each cruise sampled various habitat types.
Cruise AT2104 sampled four habitats during the late summer of 2012 (Pham et al., 2024), a period of weaker river discharge (Figure 1B; Table 1). The RI habitat was located nearest the river mouth and had the greatest freshwater influence, with surface salinity ranging between 0 psu to less than 8 psu. In contrast, we found surface salinities of 20-25 psu in the plume core habitats (YPC and OPC) and 30-35 psu in the WPM habitat. The surface waters in the plume core habitats were slightly warmer (SST~29.5°C) than in the RI and WPM habitats (SST~ 28.5°C). The MLD was shallow (~ 10m) at almost all our stations, with a few deeper values toward the northwest of the plume area (> 25m) in the WPM habitat. The ChlDM occurred near the surface (<10m) at all RI, YPC, and OPC habitat stations. The ChlDM deepened towards the north and reached depths of 50 m at some WPM stations (Figures 2D-F).
Nutrient distributions during Cruise AT2104 varied laterally among different habitat types and vertically through the water column (Figures 3D-F). Nutrient concentrations in the surface waters were notably elevated in the RI habitat compared to other sampled habitats (YPC, OPC, and WPM). Surface [NO3-] levels were generally high and detectable at most stations, with the RI habitat reaching a maximum of 11.1 µM. Surface [PO4-³] and [SiO2] concentrations showed a similar trend, with higher values near the river mouth and gradually decreasing down the Plume. Due to the shallow depth of the RI habitat (< 10m), surface and mean water column (MWC) nutrient measurements were very similar. Further from the river mouth, MWC [NO3-] and [PO4-³] values were higher than those at the surface and decreased from the YPC to WPM habitats. MWC [SiO2] was slightly lower than surface levels in all habitats, except for a notable decrease in the OPC habitat relative to the other habitats.
Cruise MV1110 sampled four habitats in the fall of 2011 (Pham et al., 2024) when the ARP was weaker and entrained by the NECC and retroflected to the northeast (Figure 1C; Table 1). The surface temperature was highest in the OPC habitat (~29.5°C) and lowest in the OSW habitat (~ 28.0°C). The stations in the EPM habitat showed the greatest variation in SST, ranging from 28.3°C to 30.5°C. Surface salinities ranged from 23 psu in the OPC habitat to slightly above 36 psu in the OSW habitat. The MLD was shallow at most stations of the OPC, WPM, and EPM habitats (< ca. 30m) and deeper in the OSW habitat (> 115m). The ChlDM showed more variation among habitat types, with a shallower ChlDM (< 40m) in the OPC and WPM habitats than in the EPM and OSW habitats (> 50m; Figures 2G-I).
The spatial distributions of nutrients at the surface varied among habitats, with a consistent pattern of higher concentrations in the OPC habitat and lower concentrations in offshore waters (Figures 3G-I). Specifically, surface nitrate [NO3-] levels were generally below detection limits, except for six stations in the OPC habitat, where the average concentration was 0.13± 0.17µM. In contrast, surface phosphate [PO4-3] and silicate [SiO2] concentrations were measurable at all sampling sites and showed elevated levels in the OPC and WPM habitats compared to the EPM and OSW habitats. In the water column, the MWC [NO3-] ranged from 1.18± 0.62 µM in the OPC habitat (N=6) to 3.63± 3.03 µM in the EPM habitat (N= 53), then dropped in the OSW (0.86± 0.71 µM, N=8). The MWC [PO4-3] and [SiO2] were lower than surface values but showed a similar spatial distribution at the surface among habitats.
Elemental and isotopic distributions
We observed lateral variability in the [PC], elemental (C:N) ratio, and δ¹³C across different habitats and vertical variation from the surface through the water column. During Cruise KN197, the YPC, OPC, and WPM habitats showed higher [PC] values near the surface (<5m) compared to the upper water column (~100m). In contrast, the EPM and OSW habitats had comparable [PC] levels at the surface and throughout the water column. The surface [PC] ranged from 64.6 µmol L-1 in the YPC habitat to less than 2.3 µmol L-1 in the OSW habitat, and MWC [PC] ranged from 13.0 µmol L-¹ in the YPC habitat to 1.9 µmol L-¹ in the OSW habitat (Figure 4A).
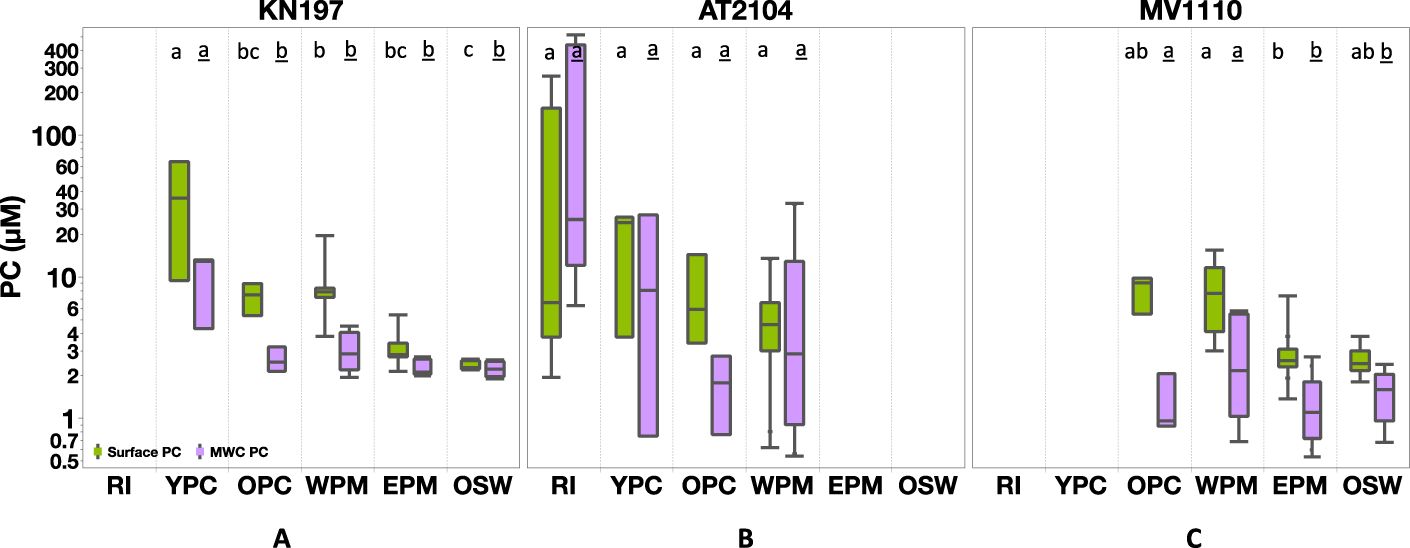
Figure 4. Particulate Carbon (PC, in µM) distribution among our habitat types in (A) Cruise KN197, (B) Cruise AT2104, (C) Cruise MV1110. The green box represents surface measurement, and the purple box represents MWC measurement. The box plot displays the median, 25th, and 75th percentile. The upper and lower whisker shows the maximum and minimum values. The letter above the boxes displays the comparison of all Tukey-Kramer pairs among habitats for surface PC (plain letter) and MWC PC (underlined letter). Habitats with the same letter do not differ significantly. Note the log scale in the y-axis; cruises without corresponding habitats are left blank.
The surface C:N ratio was relatively high in the YPC and WPM habitats, averaging 10.2 ± 3.0 (N = 3) and 9.6 ± 1.9 (N = 6), respectively. In contrast, the OPC, EPM, and OSW habitats had lower surface C:N ratios, averaging C:N = 7.1 ± 2.7 (N = 3), 7.6 ± 1.2 (N = 5), and 8.3 ± 1.9 (N = 4), respectively (Figure 5A). Within the water column, the MWC C:N ratio varied less among habitats than the surface values. The highest average MWC C:N ratio of 9.0 ± 1.9 (N = 3) occurred in the YPC habitat, with a minimum value of 7.1 ± 1.4 (N = 3) in the OPC habitat. The average MWC C:N ratios in the WPM, OSW, and EPM habitats were 7.5 ± 0.6 (N = 6), 7.5 ± 1.5 (N = 4), and 7.3 ± 0.8 (N = 5), respectively (Figure 5A; Supplementary Figure S2).
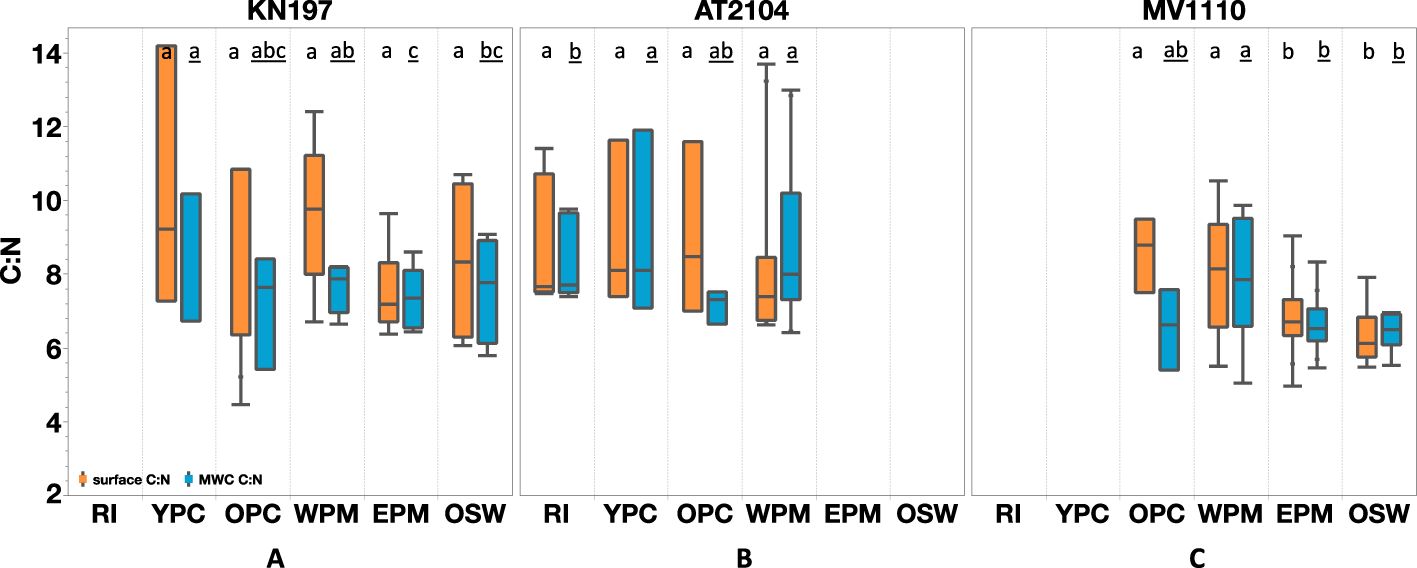
Figure 5. Elemental Carbon to Nitrogen ratio (C:N) distribution among our habitat types in (A) Cruise KN197 (B) Cruise AT2104 (C) Cruise MV1110. The orange box represents surface measurement, and the blue box represents MWC measurement. The box plot displays the median, 25th, and 75th percentile. The upper and lower whisker shows the maximum and minimum values. The letter above the boxes displays the comparison of all Tukey-Kramer pairs among habitats for surface C:N (plain letter) and MWC C:N (underlined letter). Habitats with the same letter do not differ significantly. Cruises without corresponding habitats are left blank.
Surface δ¹³C was generally higher in the YPC, OPC, and WPM habitats, averaging -19.7 ± 1.5‰ (N = 3), -18.2 ± 1.6‰ (N = 3), and -19.2 ± 2.6‰ (N = 6), respectively. In contrast, we found lower surface δ¹³C values in the EPM and OSW habitats, with means of -20.1 ± 1.2‰(N = 5) and -21.6 ± 0.5‰ (N = 4), respectively (Figure 6A). The MWC δ¹³C decreased from an average of -19.3 ± 1.5‰ in the YPC habitat to -22.1 ± 0.5‰ in the OSW habitat. Interestingly, the WPM habitat showed the greatest variability in δ¹³C both at the surface (-23.7‰ to -15.0‰) and in the water column (MWC δ 13C of -22.9‰ to -17.1‰; Figure 6A).
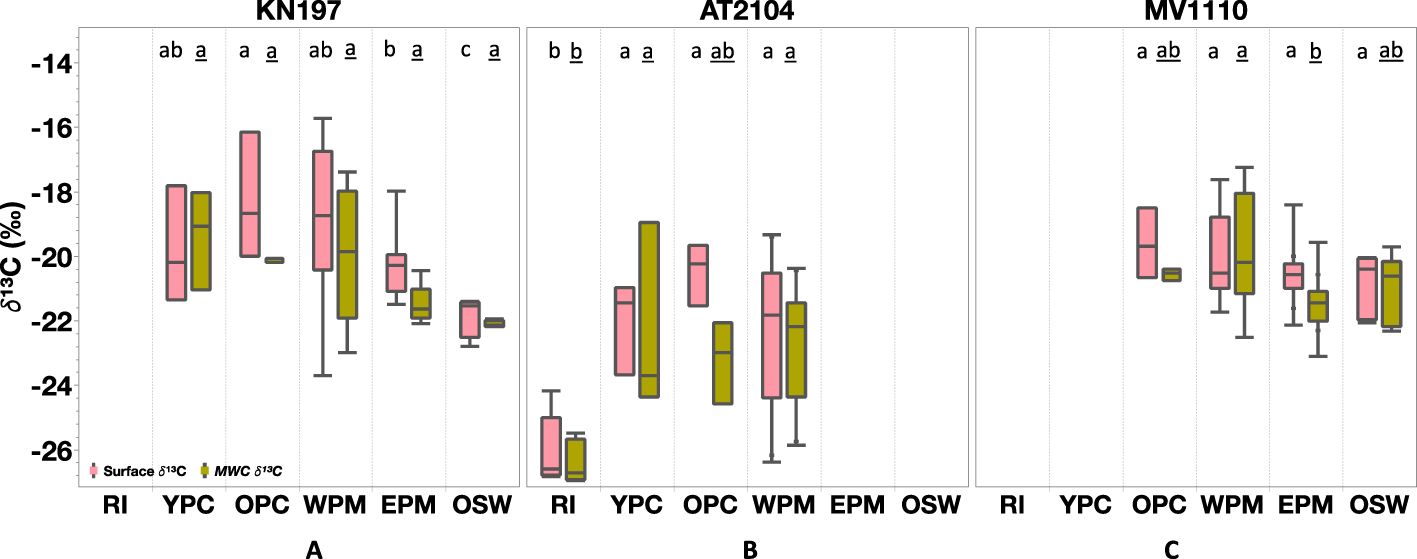
Figure 6. Stable Carbon Isotope (δ¹³C, in ‰) distribution among our habitat types in (A) Cruise KN197, (B) Cruise AT2104, (C) Cruise MV1110. The Rose box represents surface measurement, and the olive-green box represents MWC measurement. The box plot displays the median, 25th, and 75th percentile. The upper and lower whisker shows the maximum and minimum values. The letter above the boxes displays Tukey-Kramer all pairs comparison among habitat for surface δ¹³C (plain letter) and MWC δ¹³C (underlined letter). Habitats with the same letter do not differ significantly. Cruises without corresponding habitats are left blank.
During Cruise AT2104, the spatial distributions and vertical profiles of [PC], C:N ratio, and δ¹³C differed from those during Cruise KN197. Specifically, these parameters showed more heterogeneity among habitats and with depth (Figures 4B, 5B, 6B). The average surface [PC] varied across habitats, ranging from 64.6 ± 110.8 µmol L-¹ (N=5) in the RI habitat to 5.3 ± 3.8 µmol L-¹ (N=9) in the WPM habitat. In the YPC and OPC habitats, the average surface [PC] was 17.9 ± 12.3 µmol L-¹ (N=3) and 7.8 ± 5.6 µmol L-¹ (N=3), respectively. The MWC [PC] varied considerably across habitats. It was highest in the RI habitat, with an average of 182.1 ± 235 µmol L-¹ (N=5), and then decreased to a minimum of 1.8 ± 0.9 µmol L-¹ (N=3) in the OPC habitat. In the YPC and WPM habitats, the MWC [PC] was 12.0 ± 13.7 µmol L-¹ (N=3) and 8.6 ± 12.3 µmol L-¹ (N=9), respectively.
The surface C:N ratio was similar in the RI, YPC, and OPC habitats, with an average value of 8.5 ± 2.3 (N = 11). In the WPM habitat, the average surface C:N ratio decreased to 7.5 ± 0.5 (N = 9). Interestingly, the MWC C:N ratio exhibited more variation among habitats than the surface C:N ratios. Specifically, we found lower MWC C:N ratios in the OPC habitat (average 7.1 ± 0.5, N = 3) and higher ratios in the WPM habitat (average 8.2 ± 1.5, N = 9).
The surface and MWC δ¹³C values were notably lower in the RI habitat compared to the YPC, OPC, and WPM habitats. Specifically, the average surface δ¹³C was -26.0 ± 1.1‰ (N = 5) in the RI habitat and increased to -20.4 ± 0.9‰ (N = 3) in the OPC habitat. The average MWC δ¹³C values ranged from -26.4 ± 0.6‰ (N=5) in the RI habitat to -22.7 ± 0.9‰ (N=9) in the WPM habitat.
During Cruise MV1110, PC concentrations, C:N ratio, and δ¹³C values were higher at the surface than in the water column and tended to decrease offshore (Figures 4C, 5C, 6C). Surface [PC] decreased from an average value of 7.6 ± 2.1µmol L-¹ (N=4) in the OPC and 8.3 ± 4.7µmol L-¹ (N=7) in the WPM habitat to 2.8 ± 1.0 µmol L-¹ (N= 37) and 2.5 ± 0.6 µmol L-¹(N=6) in the EPM and OSW habitats, respectively. The average value of MWC [PC] decreased from 1.3 ± 0.6µmol L-¹ (N=4) in the OPC and 2.9 ± 2.1µmol L-¹ (N=7) in the WPM habitat, to 1.2 ± 0.6 µmol L-¹ (N= 37) and 1.5 ± 0.6 µmol L-¹(N=6) in the EPM and OSW habitats, respectively.
Surface C:N ratios varied more than MWC values among different habitats. For instance, the surface C:N ratio had an average value of 8.5 ± 1.0 (N=4) in the OPC habitat, then decreased to 6.3 ± 0.8 (N=6) in the OSW habitat. Similarly, the average MWC C:N ratio declined from 7.6 ± 1.7 in the WPM habitat to 6.4 ± 0.5 in the OSW habitat.
Surface δ¹³C values decreased from a maximum of -18.5‰ in the OPC habitat to a minimum of -22‰ in the OSW habitat, with averages of -19.6 ± 1.1‰ (N=4), -20.0 ± 1.4‰ (N=7), -20.6 ± 0.6‰ (N= 37), and -20.8 ± 0.9‰ (N=6) in the OPC, WPM, EPM, and OSW habitats, respectively. The MWC δ¹³C ranged from a maximum of -17.3‰ in the WPM to a minimum of -23.1‰ in the EPM habitat, with an average of -20.5 ± 0.1‰ (N=4), -19.8 ± 1.8‰ (N=7), -21.4 ± 0.7‰ (N= 37), and -20.9 ± 1.0‰ (N=6) in OPC, WPM, EPM, and OSW habitats, respectively.
Seasonal variations
We aggregated data from all three cruises to investigate variations in habitats sampled in multiple cruises/seasons (Figures 7–9; Supplementary Figures S1-S3; Table 2). The highlighted results are those with statistically significant differences (p < 0.05) in the ANOVA tests.
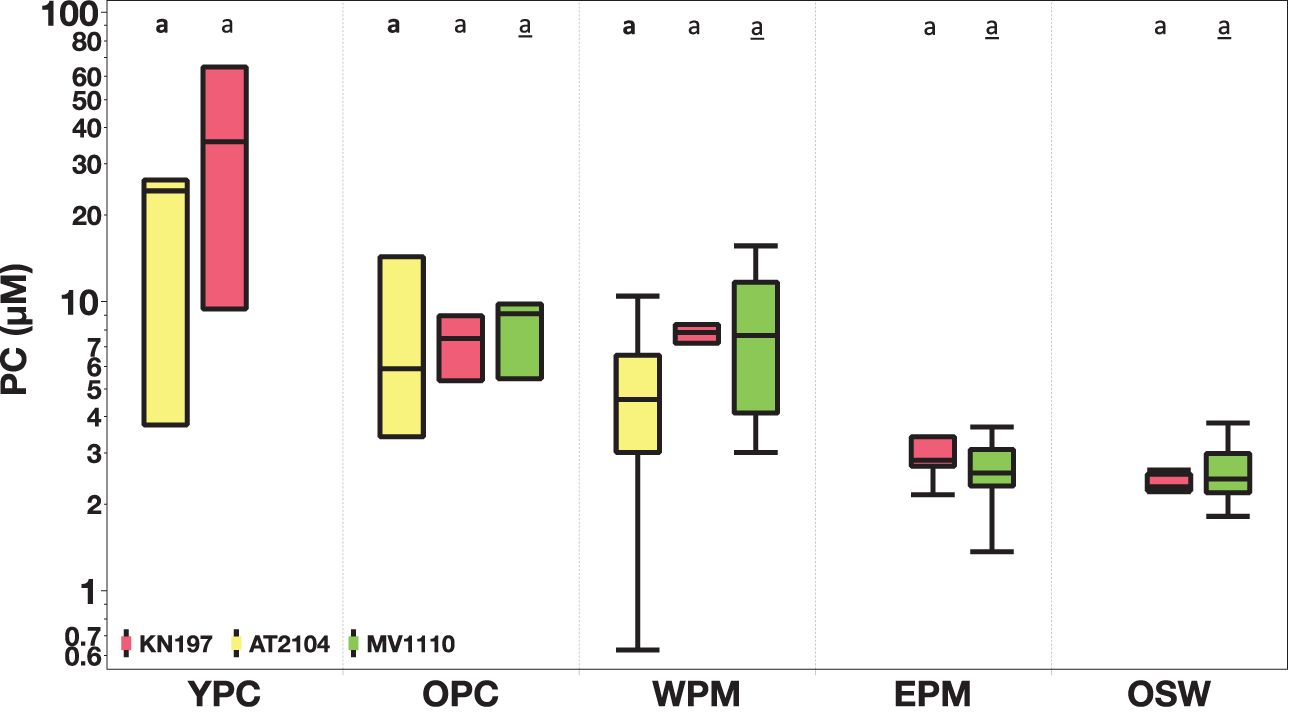
Figure 7. Spatial comparison of surface particulate carbon (PC, in µM) among our habitat types. Cruise KN197, in red; Cruise AT2104, in yellow; and Cruise MV1110, in green. The box plot displays the median, 25th, and 75th percentile. The upper and lower whisker shows the maximum and minimum values. The letter above the boxes displays Tukey-Kramer’s comparison of all pairs of mean PC concentration in different cruises. Cruise KN197 (plain letter), Cruise AT2104 (bold letter), and Cruise MV1110 (underline letter). Habitats with the same letter do not differ significantly. Note that the log scale on the y-axis and habitat without corresponding cruise are left blank.
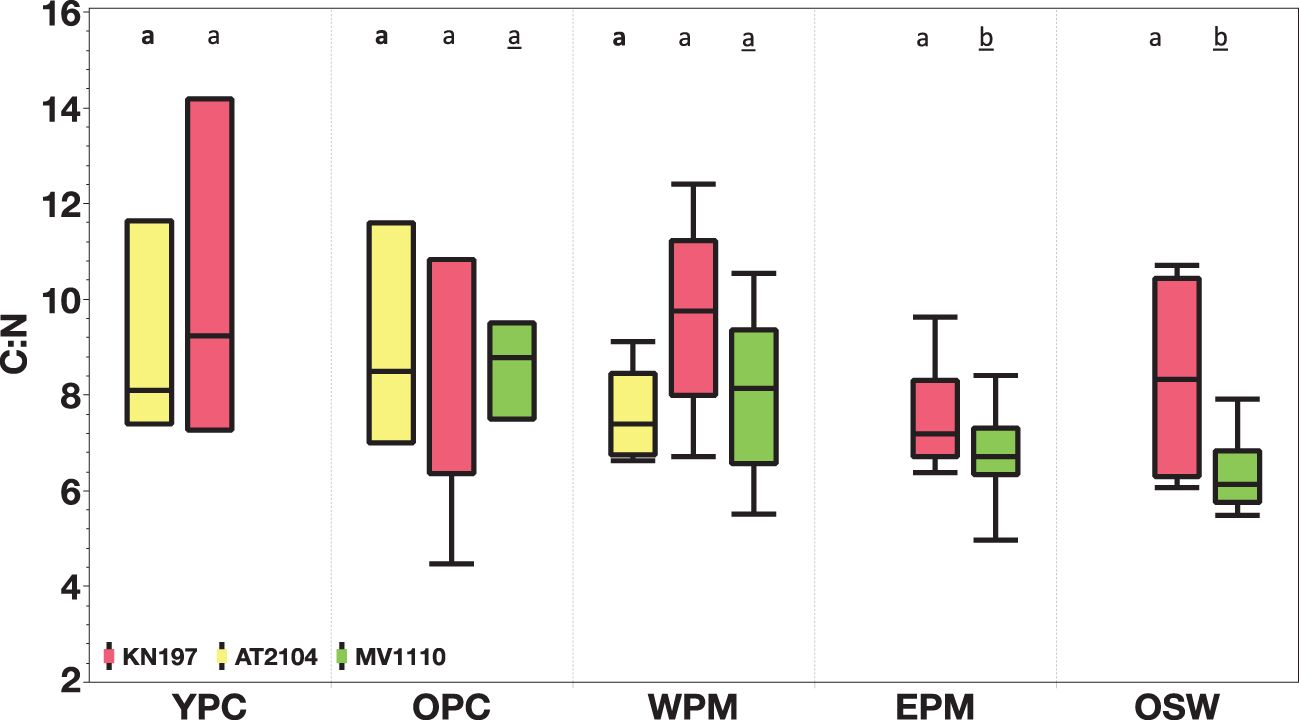
Figure 8. Spatial comparison of surface elemental carbon to nitrogen ratio (C:N) among our habitat types. Cruise KN197, in red; Cruise AT2104, in yellow; and Cruise MV1110, in green. The box plot displays the median, 25th, and 75th percentile. The upper and lower whisker shows the maximum and minimum values. The letter above the boxes displays all pairs of Tukey-Kramer, comparing the mean C:N ratio in different cruises. Cruise KN197 (plain letter), Cruise AT2104 (bold letter), and Cruise MV1110 (underline letter). Habitats with the same letter do not differ significantly. Note habitats without corresponding cruises are left blank.
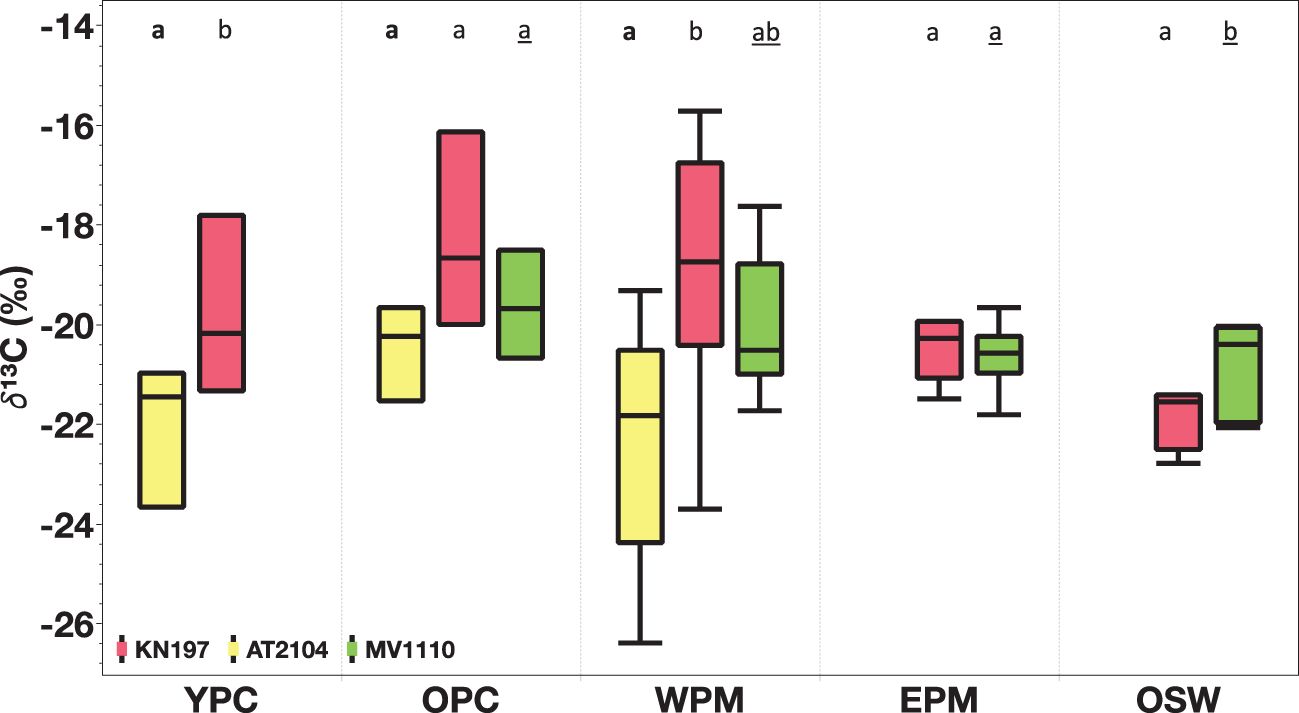
Figure 9. Spatial comparison of surface δ¹³C (‰) among our habitat types. Cruise KN197, in red; Cruise AT2104, in yellow; and Cruise MV1110, in green. The box plot displays the median, 25th, and 75th percentile. The upper and lower whisker shows the maximum and minimum values. The letter above the boxes displays Tukey-Kramer all pairs comparison of mean δ¹³C (‰)in different cruises. Cruise KN197 (plain letter), Cruise AT2104 (bold letter), and Cruise MV1110 (underline letter). Habitats with the same letter do not differ significantly. Note habitats without corresponding cruises are left blank.
We sampled the YPC habitat during the spring and late summer and found surface δ¹³C values were notably higher during spring/Cruise KN197 than during summer/Cruise AT2104.
We sampled the OPC habitat during all three cruises and found no significant differences in the surface value of biogeochemical parameters across the seasons. However, MWC δ¹³C values were more positive during spring/Cruise KN197 and fall/MV1110 than during summer/Cruise AT2104.
The WPM habitat was sampled during all three cruises. The surface and MWC δ¹³C (Supplementary Figure S3) were more positive during spring/Cruise KN197 and fall/MV1110 compared to less positive values during summer/Cruise AT2104.
The EPM habitat was sampled during the spring and fall seasons. We found surface and MWC PC and C:N ratios were higher during sping/Cruise KN197 than fall/Cruise MV1110.
Finally, we sampled the OSW habitat during the spring and fall cruises. We found that the surface C:N ratio was higher in the spring than in the fall. However, surface δ¹³C was more positive during fall/Cruise MV1110 than summer/Cruise AT2104.
Discussion
Heterogeneity in hydrographic conditions, nutrient availability, and phytoplankton biomass and productivity have profound implications for suspended particulate matter dynamics (Liu et al., 2019). The concentration, C:N ratio, and δ¹³C of PC varied laterally (among our habitat types), vertically (through the water column), and seasonally (over different sampling periods). We characterized spatial variation in this highly dynamic environment using the six distinct habitats defined by Weber et al. (2019) and Pham et al. (2024): RI (Riverine Input), YPC (Young Plume Core), OPC (Old Plume Core), WPM (Western Plume Margin), EPM (Eastern Plume Margin), and OSW (Offshore Waters). Below, we first discuss the variations within cruises. Then, we combine observations from all cruises to explore the spatial coherence and seasonal contrast of biogeochemical properties in the ARP ecosystem.
Spring: the high flow period
Cruise KN197 sampled the ARP region during peak discharge in spring, a period when the plume delivers a substantial volume of buoyancy and terrigenous material into the ocean, profoundly affecting the hydrography and biogeochemical status over a large region of the Western Tropical Atlantic (DeMaster et al., 1996; Ryther et al., 1967; Smith and Demaster, 1996). Our hydrological measurements showed gradients in sea surface salinity, temperature, and turbidity (Figure 2A) extending from the plume core habitats to the offshore waters (Coles et al., 2013a; Liang et al., 2020). The physical structure of the water column transitioned from shallow stratification near the plume core to a deeper, well-mixed state offshore (Figure 2B). The impact of solar heating on the surface water causes strong thermal stratification of the upper water column, which increases offshore (Foltz and McPhaden, 2009).
During this cruise, the ARP region included a range of nutrient availability and potential limitations. Nitrate concentrations were below the detection limit at the surface of most stations (Figure 3A) due to the high demand and active biological uptake (Demaster and Pope, 1996; Edmond et al., 1981; Goes et al., 2014). In contrast, phosphate and silicate concentrations were uniformly measurable and decreased northward due to the mixing of plume water with oceanic water and biological uptake (Figures 3A-C). Weber et al. (2017) found that phosphate concentrations deviated positively from the conservative mixing line in the plume due to release from terrigenous materials. The high demand for nitrogen by coastal phytoplankton, composed primarily of diatoms, cryptophytes, and green-water Synechococcus spp., produced strong N-limitation at the surface (Goes et al., 2014). As the plume moved northward, the nitrogen supply from the riverine flow and coastal upwelling diminished while the phosphate and silicate concentrations were still high enough to support diazotrophy. The atmospheric dinitrogen fixers, mainly diazotrophic-diatom associations (DDAs), bloomed in the mesohaline area of the plume and Trichodesmium, found on the plume margins and oceanic water (Goes et al., 2014; Weber et al., 2017), supported new production and facilitated carbon export to the deep ocean (Demaster and Pope, 1996; Loick‐Wilde et al., 2016). Nutrient dynamics are crucial for phytoplankton niche partitioning in this region and, therefore, carbon budgets (Agawin et al., 2000).
In-situ chlorophyll fluorescence is a valuable proxy for phytoplankton biomass. During this cruise, elevated surface [Chl a]coincided with higher biomass ([PC]) and nutrient concentrations ([PO43-]) in the YPC and OPC habitats. The [Chl a] decreased as the plume influence waned northward in the EPM and OSW habitats. The maximum [Chl a]value in our data set, 18.1 mg m-3 in the YPC habitat, coincided with a high abundance of diatoms, dinoflagellates, and Cryptophytes (Goes et al., 2014; O'Reilly and Busch, 1984). Higher [Chla] at the surface in the YPC habitat is associated with a larger phytoplankton cell (Pham et al., 2024), as well as an elevated PC concentration (64.4 µM) and high δ13C (-17.7‰), and also supported by the finding of high rates of carbon fixation in the area (Alriyami et al., 20241; Montoya et al., 2019).
The ChlDM reflected the interaction between the availability of nutrients from subsurface nutrient-rich deep water and light from the above sunlight-abundant surface as mediated by phytoplankton physiology (Latasa et al., 2017; Letelier et al., 2004). The ChlDM frequently occurs at the nitracline, reflecting strong nutrient limitation in the well-illuminated waters above (Cullen, 2015). The ChlDM was near the surface in the YPC and OPC habitats and at some WPM stations (Figure 2C), where the nitracline was also shallow due to riverine nutrient input and coastal upwelling in the area (Demaster and Pope, 1996; Weber et al., 2019). Further offshore, the EPM and OSW habitats had deeper ChlDM values, reflecting the location of the nitracline (Figure 10) in the thermally stratified water column (Chen and Chen, 2006; Marañón et al., 2000). The plume-proper habitats supported higher phytoplankton growth at the surface, while in the EPM and OSW habitats, growth was limited by nitrate availability on the surface, leading to deeper ChlDM values. The absolute [Chla]in the ChlDM varied from 6.8 mg m-3 in the YPC habitat to 0.25 mg m-3 in the EPM habitat. Due to variation in the intensity and duration of oceanic waters mixing with the plume margins, the WPM and EPM habitats showed high variation in ChlDM on a time scale of hours, compared to the vertically more stable water column in the YPC, OPC, and OSW habitats, reflecting the very dynamic nature of the plume along the continuum (Weber et al., 2017, 2019).
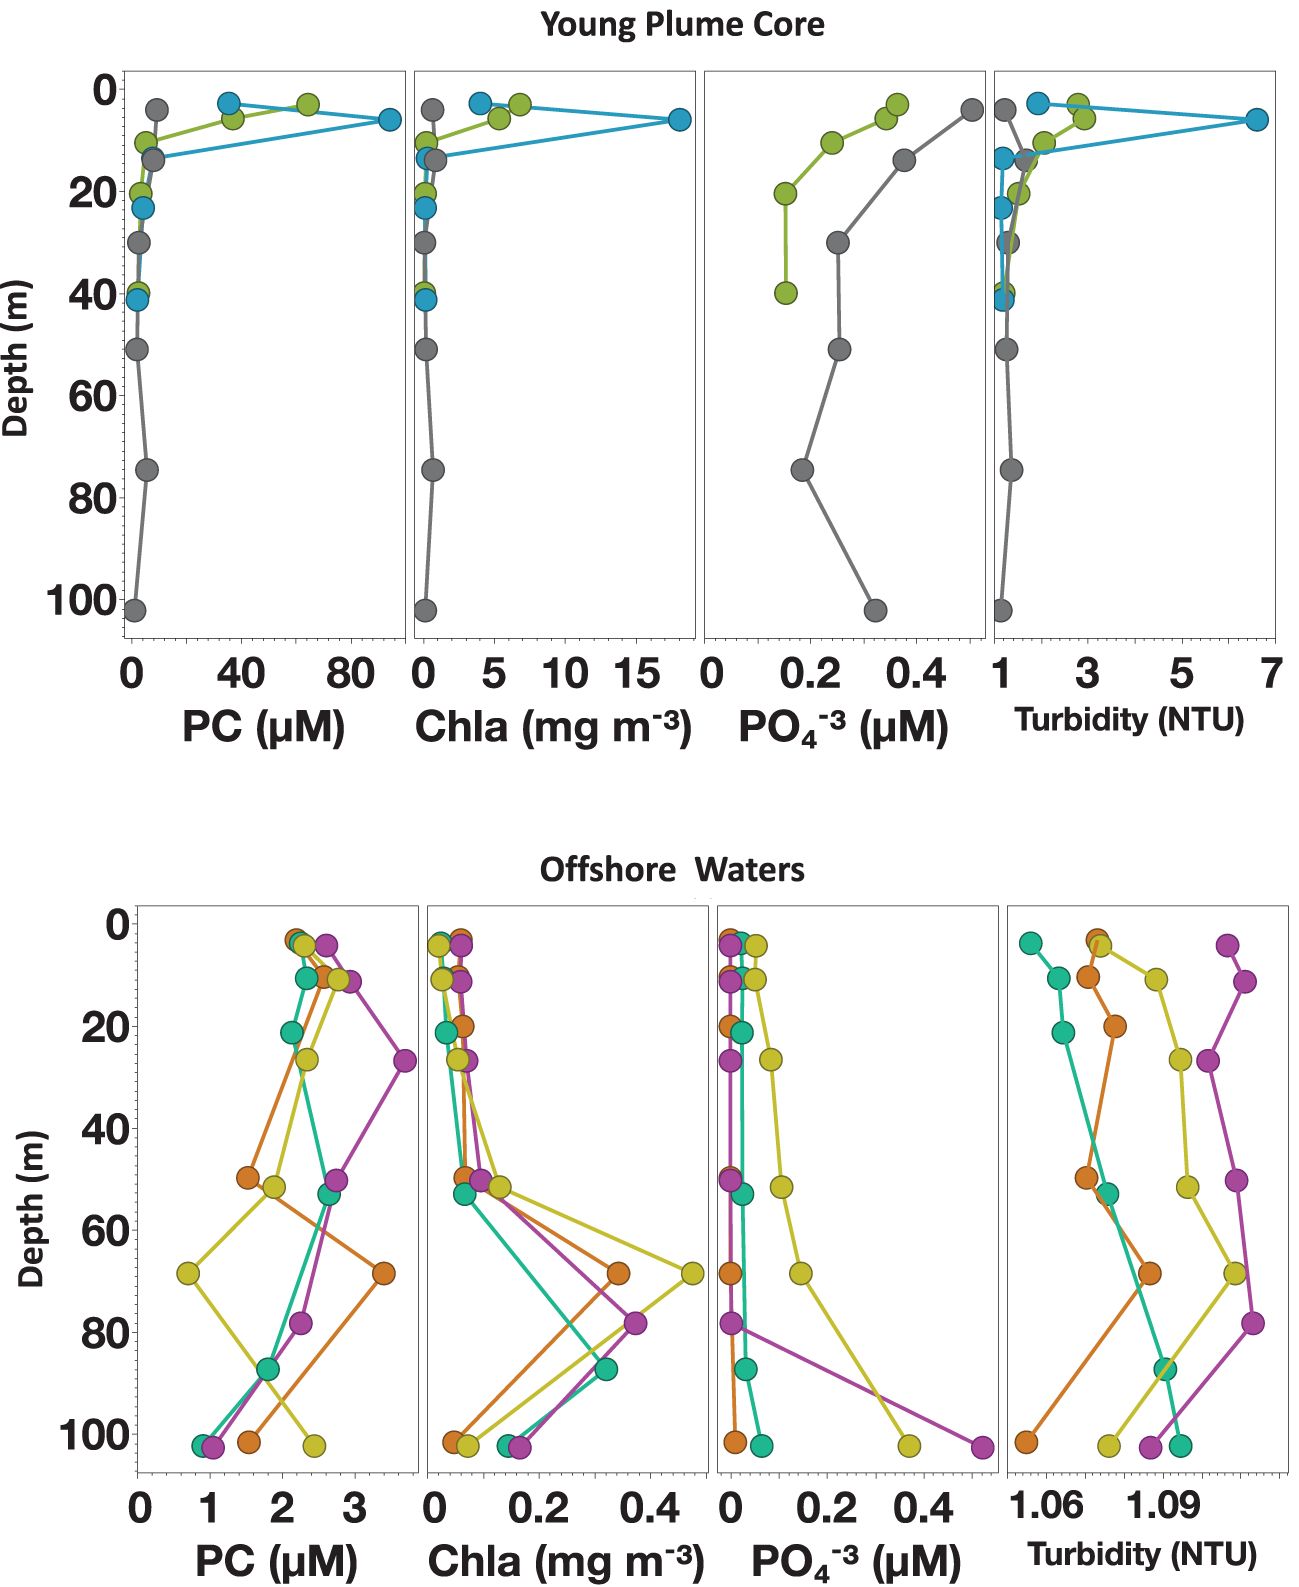
Figure 10. Depth profile from Cruise KN197, Stations of YPC habitat (above) and OSW habitat (below). Panels show particulate carbon (PC, in µM), Chlorophyll a (Chla, in mg m-3), phosphate (PO4-3, in µM), and Turbidity (NTU). Colors denote different stations. Note the differences in the scale of the x-axis.
The [PC] was highest at the surface of the habitats nearest the river mouth and declined with depth. This pattern slightly changed in the offshore waters, where surface [PC] was low, and a subsurface [PC] maximum occurred at the depth above ChlDM. Specifically, the YPC, OPC, and some stations of the WPM habitat had the highest [PC] values at the surface, reflecting the contribution of the riverine input to particle loads (Smith and Demaster, 1996), enhanced production rates, and the high abundance of phytoplankton (Conroy et al., 2016; Goes et al., 2014). The strong correlations between [PC] and our measurements of turbidity, nutrients, and Chla concentration (R2 = 0.82, 0.85, and 0.96, respectively, Station10.04, YPC habitat; Figure 10) further illustrated the combined influence of physical, chemical, and biological factors on PC dynamics over this area. In contrast, the EPM and OSW habitats had low particulate matter concentrations at the surface and throughout the water column (Figure 10). The deep MLD restricted the vertical transport of nutrients to the surface, limiting surface production, thus generating a more uniform [PC] distribution throughout the water column (Figure 4A).
The high surface C:N ratio (>12) at some YPC and WPM stations suggested a high input from terrigenous organic matter or elevated production under a nitrogen limitation (Galbraith and Martiny, 2015; Kendall et al., 2001). However, most of our surface C:N ratios fell in the range of 9-6, which is typical of marine plankton (Moore et al., 2013; Redfield, 1958). The surface C:N ratio was lower than the Redfield Ratio (C:N= 6.6) at a few stations in the OPC (C:N= 4.5) and WPM (C:N= 6.0) habitats (Figure 5A), which may reflect production under nitrogen replete conditions due to diazotrophic N-fixation (Finlay and Kendall, 2007; Montoya, 2007) or localize eddies (Cherubin and Richardson, 2007). The MWC C:N ratio (10-6) was slightly lower than the surface C:N ratio (14-6). This observation suggests a stronger influence of terrigenous sources at the surface and a predominance of organic matter derived from phytoplankton at greater depths while indicating. Edmond et al. (1981) argued that the C:N ratio cannot resolve the contribution of different sources on the organic matter pool in the Amazon shelf, as the soil microbe (C:N= 16) is not significantly different than phytoplankton. Furthermore, the strong linear correlation between [PC] and [Chl a] in the water column (R2 = 0.93), along with the relationship of our surface and MWC C:N ratios within the PC: Chla ratio of < 200 (Supplementary Figure S4), underscores the significant contribution of living phytoplankton in the organic matter we sampled than terrestrial or detrital material (Foster et al., 2011; Hedges et al., 1986; Hofmann et al., 2000; Pan et al., 2014).
The δ¹³C of surface suspended particles decreased northward from the OPC habitat to the OSW habitat. Additionally, δ¹³C values decreased with increasing depth throughout the water column (Figure 6A; Supplementary Figure S3). The high surface δ¹³C in the OPC habitat coincided with high biomass (PC and Chla), likely produced by rapidly growing large phytoplankton cells including diatoms (Goes et al., 2014). The diffusion-limitation of dissolved inorganic carbon into algal cells may also result in high δ¹³C values of the organic matter produced (Burkhardt et al., 1999). The WPM habitat had the most significant variability in δ¹³C of suspended particles both at the surface (-23.7‰ to -15.0‰) and in the water column (MWC range: -22.9 ‰ to -17 ‰). This mesohaline habitat supported a diverse phytoplankton community, including DDAs, flagellates, and Trichodesmium, that vary in growth rate, cell size, and inorganic carbon source, and therefore, δ¹³C values (Goes et al., 2014; Laws et al., 1995; Smith, 1972).
On the other hand, the EPM and OSW habitats had the lowest surface and MWC δ¹³C values, which coincided with lower biomass (PC and Chla) and low production rates dominated by small cells (Alriyami et al., 20241; Goes et al., 2014; Montoya et al., 2019). Additionally, The high concentration of DIC in oceanic water allows phytoplankton cells to discriminate enzymatically against 13C through carboxylase activity, producing OM depleted in 13C compared to the organic matter produced in the plume water (Popp et al., 1998). The difference between surface and MWC δ¹³C likely reflects the impact of photosynthesis at the surface versus respiration at depth. Other factors, like the use of bicarbonate rather than dissolved carbon dioxide and shifts of community structure to smaller cells in response to changes in light and nutrients, generally lead to lower 13C abundance in organic matter (Laws et al., 1995).
Summer: the falling flow period
During Cruise AT2104 (Figure 11), conducted during late summer, the plume core habitats (YPC and OPC) had slightly warmer surface waters compared to the RI and WPM habitats, a reflection of both the weaker influence of riverine outflow and the regular seasonal drop in temperature (Muller–Karger et al., 1988). The RI habitat, closest to the river mouth, showed the most freshwater influence with an extremely low surface salinity (min SSS=0 psu). The MLD was shallow at the plume proper habitats, with deeper values observed northwest of the cruise track. The ChlDM varied among habitats and was slightly shallower than in spring, occurring near the surface in RI, YPC, and OPC habitats and deepening towards the north in the WPM habitat (Pham et al., 2024).
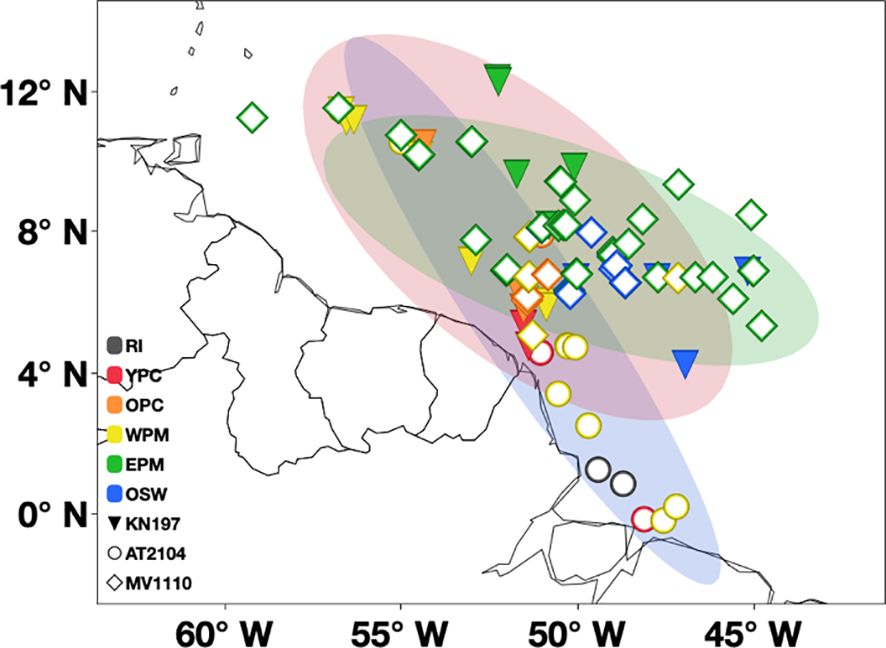
Figure 11. Map shows the spatial and temporal overlap of sampling stations of the three studied cruises. The ellipse shows 99% density of the sampling area of Cruise KN197 (in red), Cruise AT2104 (in blue), and Cruise MV1110 (in green). The symbol represents different cruises (triangle for spring Cruise KN197, circle for late summer Cruise AT2104, and diamond for fall Cruise MV1110). The color represents different habitat types. Riverine Input (RI, gray), Young Plume Core (YPC, red), Old Plume Core (OPC, orange), Western Plume Margin (WPM, yellow), Eastern Plume Margin (EPM, green), and Oceanic Water (OSW, blue).
Nutrient concentrations were measurable in surface waters at most of our sampling stations except for deficient nitrate concentrations in the OPC habitat (Mean 0.13 ± 0.14 µM, N=3). Nutrient concentrations were generally higher below the plume than at the surface, highlighting the potential impact of mixing and upwelling in bringing nutrient-rich waters to the surface below the pycnocline (Lentz and Limeburner, 1995). Moreover, the high nutrient availability, especially at the surface of southernmost stations belonging to the RI habitat, may be amplified by riverine supply (Edmond et al., 1981), the remineralized particles from the spring bloom (DeMaster et al., 1991), nitrate production through nitrification (Choisnard et al., 2024), and seasonal changes in the nutrient recycling rate (Vital et al., 1999). These organic materials decompose and release nutrients back into the water column, providing an additional source of nutrients to support the primary producer’s growth (Harrison, 1980; Sarmiento et al., 1990). The low but measurable nitrate concentrations in the OPC habitat may stem from localized differences in nutrient utilization due to biological processes unique to the OPC habitat, such as higher growth and production rates or more grazing and heterotrophy.
The strong positive correlation between [PC] and [Chla] in the water column (R2 = 0.64, Figure 12) and the relationship between the C:N ratio and PC: Chla ratio (Supplementary Figure S4) suggested an elevated contribution of phytoplankton production in the particulate carbon pool in all but the RI habitat. We found very high surface and MWC [PC] in the RI habitat, reflecting its proximity to the river mouth and the extension of the plume to the bottom depth (Smith and Russell, 1995). Notably, the highest PC concentration in our dataset (~ 500 µmol L-¹) was recorded in the subsurface waters of the RI habitat. A subsurface maximum [PC] is common in riverine estuaries, typically resulting from tidal mixing, redistribution of material within the water column, or resuspension of benthic sediments (DeMaster et al., 1986; Lohrenz et al., 1992).
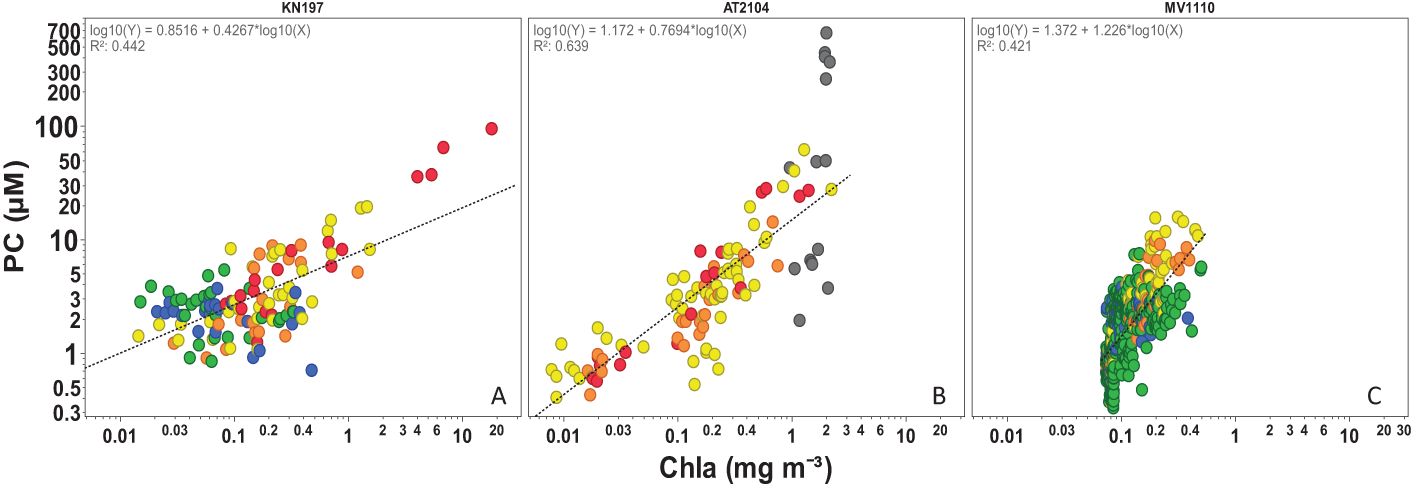
Figure 12. Relationship between water column PC (µM) and Chla (mg m-3) in (A)Cruise KN197 (B) Cruise AT2104 (C)Cruise MV1110. The regression line equations are shown in each plot and R2. Each dot represents a station, and the color represents habitat. Note the log scale in both axes.
The OPC habitat displayed elevated [PC] at the surface, which declined with depth. Nutrient data suggest active biological drawdown in the OPC zone; however, the accumulation and sinking of biomass to the deeper ocean may be inhibited by heterotrophic consumption at the surface. Through grazing and decomposition, heterotrophs break down organic matter into smaller, more degradable forms or respire it as CO2, reducing the availability of larger particles that typically contribute to vertical flux (Lefèvre et al., 2017). While heterotrophs can repackage organic matter into fecal pellets, which usually enhance vertical flux, in this case, the intense surface heterotrophic activity appears to favor rapid recycling within the euphotic zone, thereby limiting the export of organic carbon to deeper waters (Calef and Grice, 1967). The surface and MWC [PC] variations among habitats during the summer cruise may be related to turbidity (in the RI habitat), productivity (in the YPC and OPC habitats), and density gradients (in the WPM habitat). For instance, turbidity is increased by the organic material load from river basin, increasing [PC] closer to the river mouth. High marine productivity contributes directly to [PC] via phytoplankton growth in habitats where the water column has sufficient light and nutrients. Where density gradients limit nutrient supply by vertical mixing, the [PC] is low throughout the water column as in the WPM habitat.
The average surface and MWC C:N ratios were similar in all four habitat types sampled during this cruise and showed lower values than those during the spring period (Figure 5; Supplementary Figure S2). Given the relatively smaller scope of the sampling area during this cruise and the weakening river flow, these observations revealed the plume’s reduced influence on terrigenous material or marine production under replete nutrient conditions (Kendall et al., 2001).
The considerably depleted δ¹³C values in the RI habitat compared to values in the YPC, OPC, and WPM habitats suggested a major contribution of organic matter from terrestrial plants (Farquhar et al., 1982; Parker, 1964; Smith, 1972). We found highly enriched surface δ¹³C in the OPC and WPM habitats, which coincided with reduced nitrate concentration in the area (Figure 3D), high surface [PC], and average C:N ratios above the Redfield ratio, all could reveal high in situ production (Figures 4, 5; Supplementary Figure S3). Showers and Angle (1986) found that δ¹³C values in surface waters of 0 psu salinity of Amazon river mouth were isotopically depleted (-27.3‰), whereas δ¹³C values in outer shelf waters (35 psu), ranged from -19.5 ‰ at the surface to -25.3 ‰ near the seabed.
Fall: the weak flow retroflection period
During the fall season (Cruise MV1110), the riverine outflow from the Amazon weakened, and the plume extended further northeast under the influence of the NECC (Muller–Karger et al., 1988) (Figure 11). While surface temperatures decreased at most OPC, WPM, and OSW stations, the EPM habitat remained relatively warm. Although the gradient of surface salinity from the plume core to the surrounding oceanic water was less pronounced compared to our spring and late summer cruises, most stations sampled fell within the mesohaline range of surface salinity 30-35 psu (Subramaniam et al., 2008). The OSW habitat exhibited a much deeper MLD (>115 meters) than during the spring period, reflecting the intrusion of oceanic waters into the plume through intense vertical mixing during the fall season (Geyer and Kineke, 1995; McGowan and Hayward, 1978). However, we found considerable variation in the depth of the chlorophyll maximum (ChlDM) among habitats, with a pronounced deepening towards the northeast (Pham et al., 2024).
The spatial distribution of major nutrients (NO3-, PO4-3, and SiO2) during fall was generally similar to what we observed during spring. The undetectable nitrate concentrations at the surface of most stations may reflect the influence of fall blooms (Longhurst, 1993).
The seasonal shift in riverine discharge influences the extent of autochthonous vs allochthonous productivity (Cai et al., 1988; Hedges et al., 1986). The surface [PC] exhibited high values in OPC and WPM habitats and decreased in the EPM and OSW habitats. Similarly, the MWC [PC] followed a similar trend, albeit with lower concentrations than the surface. According to our hydrographic and nutrient data, the outflow significantly boosts productivity and biomass at the surface of the OPC and WPM habitats, more so than in the EPM and OSW habitats. The river’s influence diminishes and weakens as it moves northeast, impacting the production of organic matter (Figure 4C).
The C:N ratio remained within a narrow range (9-6) across all our sampling sites and was notably lower than the spring and late summer ratios (Figure 6C).The observed range of C:N ratios provides evidence of the awakening influence of outflow in transporting terrestrial material in the fall compared to spring (Kendall et al., 2001). The relationship between the C:N ratio and the PC: Chla ratio (Supplementary Figure S4) further supported that most organic matter came from living sources, mainly marine phytoplankton, rather than detrital or non-living sources (Cifuentes et al., 1988).
Surface δ¹³C peaked in the OPC and WPM habitats, where sufficient growth conditions led to a high carbon fixation rate, and δ¹³C decreased further offshore in the EPM and OSW habitats (Cifuentes et al., 1988; Popp et al., 1998). When examining the relationship between δ¹³C and C:N ratios, we observed that most of our particles originated from marine in-situ production, with minimal contributions from terrigenous sources compared to the spring and summer data (Figure 13). The PC: Chla ratio was <60, and δ¹³C ranged between -18‰ to -24‰, typical of a phytoplanktonic signature, indicating the predominance of living material in the suspended particles stock (Kendall et al., 2001).
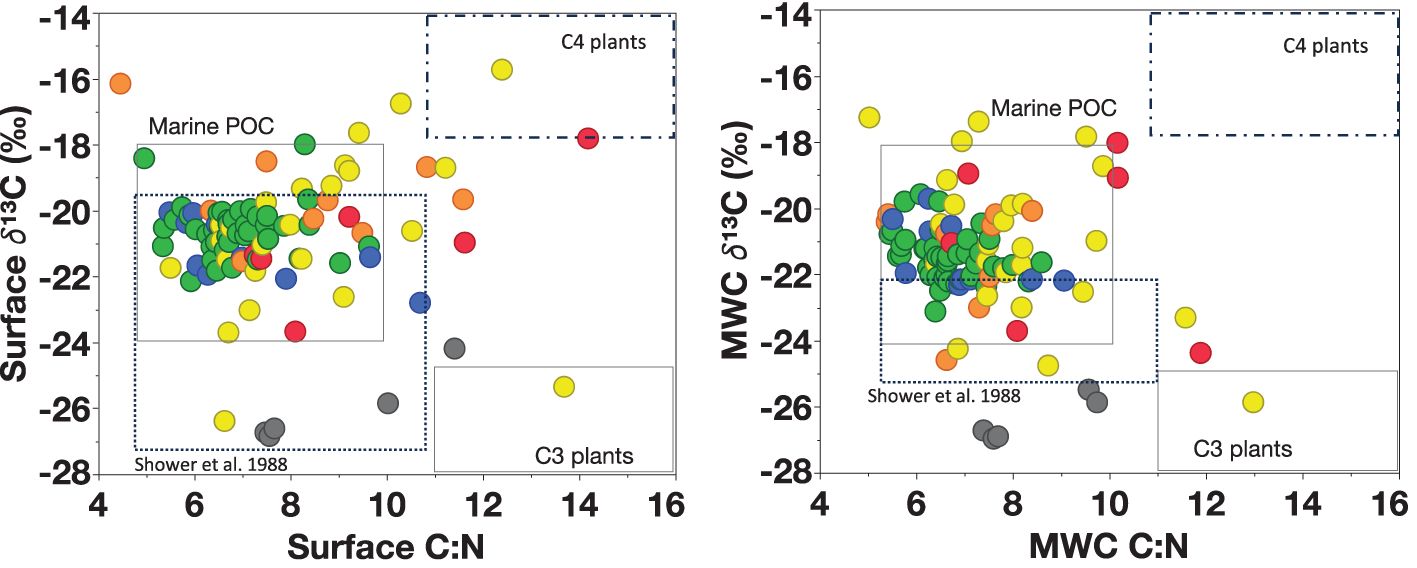
Figure 13. The relationship between δ¹³C (‰) and C:N ratio in the surface (left) and MWC (right). Data are from all cruises. Boxes showed the marine vs. terrestrial sources of organic matter based on value ranges from Lamb et al. (2006) and Amazon River Plume range based on Showers and Angle (1986). Each dot represents a station, and the color represents habitat types.
Spatial and temporal dynamics of particulate matter
From the river mouth to the offshore area, surface C:N ratios decreased but remained above the Redfield ratio, reflecting the reduced influence of terrestrial materials or phytoplankton production under nutrient limitation (Goes et al., 2014; Montoya et al., 2019; Ryther et al., 1967; Weber et al., 2017). The RI habitat exhibited high surface C:N ratios, likely because of terrestrial C3 plant’s input or higher remineralization rates and bacterial breakdown of riverine organic matter. This agreed with the hypothesis of preferential nitrogen uptake by microorganisms during organic matter remineralization (Geider and La Roche, 2002; Harrison, 1980; Martiny et al., 2014). The lateral variations in the surface C:N ratio among other habitats (from YPC habitat to OSW habitat) are largely driven by several physical and biochemical processes besides the degree of plume influence. The dominance of specific phytoplankton groups, like diatoms, dinoflagellates, and DDAs in the plume water, leads to higher C:N ratios. These larger cells have more carbon-rich structures, such as silica frustules or carbon storage compounds, which increase their carbon content relative to nitrogen. In contrast, oceanic waters are dominated by smaller cells, which have lower C:N ratios due to their higher nutrient efficiency and lower carbon content (Carpenter et al., 2004; Pham et al., 2024). However, changes in the surrounding environment may suppress the role of phytoplankton physiology. For instance, small cells (cyanobacteria and small eukaryotes) usually exhibited a higher C:N ratio than the canonical Redfield ratio in oligotrophic areas and a lower C:N ratio in nutrient-replete conditions (Moore et al., 2013). Additionally, photoautotrophs in the most productive regions (YPC, OPC, and WPM habitats) are susceptible to nitrogen limitation on the surface due to the high demand, leading to high C:N ratios (Martiny et al., 2014).
In this study, the surface C:N ratios showed higher values and a wider range during spring compared to late summer and fall (Figure 5, Supplementary Figure S2). The peak outflow facilitated higher biological activity via transporting more nutrients and supporting the organic matter pool with a considerable amount of terrestrial material (Liu et al., 2019). Meanwhile, the surface C:N ratios declined in the late summer and fall cruises and showed fewer habitat variations. This is due to the reduced terrigenous material delivered in the weakened outflow and the change in nutrients available for phytoplankton growth. This supports the hypothesis that the Amazon River is not the major nitrogen source for primary producers (Dippner et al., 2024; Umbricht et al., 2024).
The wide variability of δ¹³C in the surface (-27.3‰ to -15.7 ‰) and the MWC (-26.9‰ to -17.3 ‰) indicates that the particulate matter is likely a blend of terrestrial C3 plants which have a typical δ¹³C value of approximately -27 ‰ to -32‰ (Peterson and Fry, 1987; Wada et al., 1987) and marine phytoplankton which have a typical δ¹³C range of -18‰ to -20 ‰ (Goericke et al., 1994), with more data fell into phytoplankton predominance. The highest δ¹³C values (averaging -20.9 ± 0.5‰.) were found in the coastal habitats (YPC, OPC, and WPM habitats), coupled with elevated nutrients, biomass (PC and Chla), and with the higher carbon fixation rate documented in the area (Alriyami et al., 20241; Montoya et al., 2019; Umbricht et al., 2024). Conversely, the most negative δ¹³C occurred in the RI habitat (-27.3‰), characterized by proximity to the river mouth, where terrestrial input is most dominant. This observation is further supported by the hydrographic data, having extremely low surface salinity (min 0psu) and the highest nitrate concentrations (12µM) in our data set (Figures 2, 3; Supplementary Figure S3).
The PC: Chla ratio provides an important indicator of the efficiency of the phytoplankton community in converting nutrients into biomass (Furuya, 1990). Deep cells within the euphotic zone, adapted to low light and close to the source of new nitrogen in the nitracline, tend to have low PC: Chla and C:N ratios. Conversely, cells higher in the euphotic zone, which are light-adapted but nutrient-depleted, may exhibit different ratios (Marañón et al., 2003). In our dataset, the PC: Chla ratios tended to be higher at the surface and decreased with depth, higher during spring than during summer and fall cruises (Supplementary Figure S5). The relationship between the PC: Chla ratio and the C:N ratio further supports the idea that most PC came from living sources, particularly away from the river mouth (Cifuentes et al., 1988). The PC: Chla of living phytoplankton generally falls between 40 and 140 (g/g), and the higher values (> 200 g/g) indicate that detrital and degraded materials are significant components of the PC pool (Eppley and Peterson, 1979; Liu et al., 2019). Most of the OM in our study fell within the range of living material contribution, except the RI habitat, which appears dominated by terrestrial sources (high PC : Chla ratio) that might be colonized by heterotrophic bacteria (moderate C:N ratio). Similarly, the relationship of δ¹³C and PC : Chla in the surface and MWC emphasized the role of spring and fall bloom on the organic matter pool. The regression analysis indicated that the F-statistic was notably higher, with significant p-values observed in both spring and fall compared to late summer (Supplementary Figure S6).
The PCA analysis explained 47% of the total variance (30% by PC1 and 17% by PC2). It showed that biogeochemical parameters (PC, C:N ratio, and δ¹³C) correlated positively with SST and negatively with MLD and nitrate concentrations. Warmer waters, shallower MLD, and low nitrate likely supported higher biomass stock, high C:N ratio, and more positive δ¹³C (Figure 14). The plume core habitats had the warmest waters, shallower MLD, and higher nitrate concentrations, which enhanced phytoplankton growth and biomass (i.e. fluorescence), leading to increased organic carbon production (high [PC]) and a shift towards the carbon-rich organic matter (high C:N ratios). The elevated δ¹³C in warmer water might stem from the influence of temperature on phytoplankton growth and production rates. Liu et al. (2022) argued that water temperature might better predict δ¹³Csp than the DIC source. Given the seasonal and spatial variation of the measured SST in our study, this might have had a marginal effect in δ¹³C.
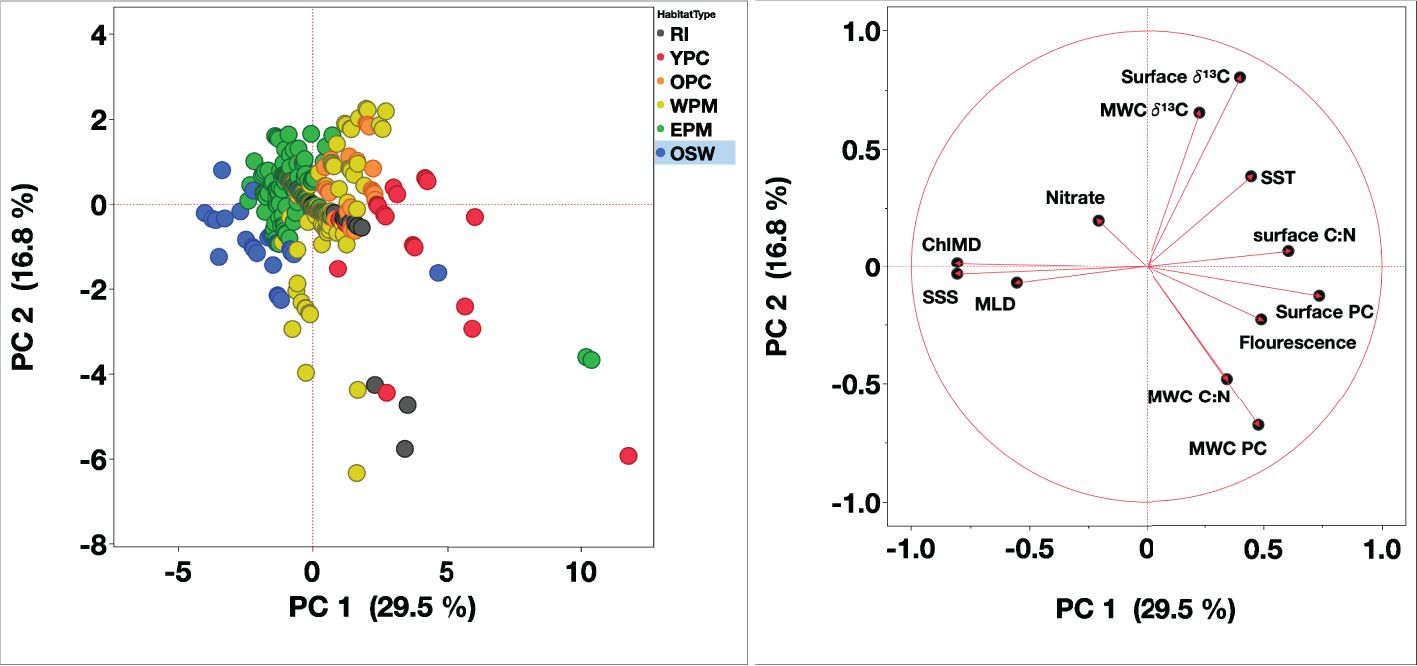
Figure 14. Principal component analysis of 64 stations from three cruises conducted in the WTNA (Left) Scatter plot of each score for the first two principal components, where colors correspond to habitat types based on Weber et al. (2019) and Pham et al. (2024). (Right) Loading plot showing the unrotated loading matrix of different variables as a function of the first two principal components. The closer the variable’s loading value is to 1 or -1, the greater the effect of the variable in driving that component. Habitat types are marked by color: riverine input (RI, grey), young plume core (YPC, red), old plume core (OPC, orange), western plume margin (WPM, yellow), eastern plume margin (EPM, green), and oceanic water (OSW, blue).
Further offshore, the thermally stratified water column limits nutrient replenishment from deeper waters, favoring the dominance of small phytoplankton that can thrive in nutrient-limited environments. The negative correlation between MLD and nitrate concentrations further supports this, as lower nitrate concentrations are typically associated with reduced nutrient input or active biological uptake, driving a shift towards higher C:N ratios indicative of nitrogen limitation. The more negative δ¹³C values observed under these conditions may reflect higher dissolved [CO2aq] in oceanic waters or small cell dominants with lower growth rate. Collectively, these results highlight the importance of physical structure and nutrient dynamics in shaping the spatial and temporal distribution of biogeochemical parameters of organic matter pool.
Conclusions and implications
This study investigates the role of environmental conditions and physical and biochemical parameters in shaping the productivity and particulate carbon composition of the Amazon River Plume and surrounding oceanic waters during three different outflow regimes.
We found that the plume waters greatly influenced the hydrodynamic process in the study area; therefore, the biogeochemical process related to the water column structures is also greatly influenced. Multiple indicators pointed towards the predominance of in situ phytoplankton synthesized organic matter at the surface and throughout the water column. Firstly, the spatial and vertical distribution trends of [PC] are consistent with favorable growth conditions of warm SST, high nutrient concentration, shallow MLD, and phytoplankton biomass (i.e. Chla). Also, as evidenced by average molar C:N ratios, which were within the typical range for phytoplankton (i.e., 6-10). Secondly, the δ¹³C values observed across different seasons indicate a phytoplanktonic origin, with the surface δ¹³C (-27.3‰ to -15.7 ‰) and the MWC (-26.9‰ to -17.3 ‰), with peak enrichment occurring in habitats associated with maximum production conditions and lowest δ¹³C value in the river mouth area. Additionally, the consistent linear correlation between PC and Chla across all seasons and PC: Chla ratios mostly below 200 (g/g) highlights in situ production with minimal terrestrial influence on the PC stock. The insights gained from this study provided a foundation for improving ecological models and predicting the impacts of environmental changes on the productivity of the river-influenced coastal systems.
Data availability statement
The original contributions presented in the study are included in the article/Supplementary Material. Further inquiries can be directed to the corresponding author.
Author contributions
ZA: Conceptualization, Data curation, Formal analysis, Investigation, Methodology, Software, Visualization, Writing – original draft, Writing – review & editing, Validation. JM: Conceptualization, Funding acquisition, Investigation, Project administration, Supervision, Validation, Writing – review & editing, Methodology, Resources.
Funding
The author(s) declare financial support was received for the research, authorship, and/or publication of this article. This work was supported by NSF grants to JM (OCE-0934025 and OCE-1737078). ZA is working under a PhD Scholarship Fund from the Government of Oman.
Acknowledgments
The authors want to thank the RV Knorr, RV Melville, and RV Atlantis officers and crew for their support of our work at sea. The authors also thank J. Landrum, S. Weber, E. Strope, and A. Pham for their assistance and collaboration at sea and ashore. The authors declare that Gen AI was used in the creation of this manuscript. ChatGPT is used only to proofread the text and fix grammatical and spelling mistakes. ChatGPT or any other generative AI has never been used to generate text or information in preparing this manuscript.
Conflict of interest
The authors declare that the research was conducted in the absence of any commercial or financial relationships that could be construed as a potential conflict of interest.
Publisher’s note
All claims expressed in this article are solely those of the authors and do not necessarily represent those of their affiliated organizations, or those of the publisher, the editors and the reviewers. Any product that may be evaluated in this article, or claim that may be made by its manufacturer, is not guaranteed or endorsed by the publisher.
Supplementary material
The Supplementary Material for this article can be found online at: https://www.frontiersin.org/articles/10.3389/fmars.2024.1484825/full#supplementary-material
Footnotes
- ^ Alriyami, Z. S., Ajit, and Montoya, J. (2024). Growth rate, carbon fixation rate, and photosynthetic parameters in the Western Tropical North Atlantic. Front. Mar. Sci.
References
Agawin N. S., Duarte C. M., Agustí S. (2000). Nutrient and temperature control of the contribution of picoplankton to phytoplankton biomass and production. Limnology oceanography 45, 591–600. doi: 10.4319/lo.2000.45.3.0591
Burkhardt S., Riebesell U., Zondervan I. (1999). Stable carbon isotope fractionation by marine phytoplankton in response to daylength, growth rate, and CO 2 availability. Mar. Ecol. Prog. Ser. 184, 31–41. doi: 10.3354/meps184031
Cai D. L., Tan F. C., Edmond J. M. (1988). Sources and transport of particulate organic carbon in the Amazon River and estuary. Estuarine Coast. Shelf Sci. 26, 1–14. doi: 10.1016/0272-7714(88)90008-X
Calef G. W., Grice G. D. (1967). Influence of the Amazon River outflow on the ecology of the western tropical Atlantic. II Zooplankton abundance, copepod distribution, and a discussion of the fauna of low salinity areas. J. Mar. Res. 25, 84–94.
Carpenter E. J., Subramaniam A., Capone D. G. (2004). Biomass and productivity of the cyanobacterium, Trichodesmium spp. in the southwestern tropical North Atlantic Ocean. Deep-Sea Res. I 51, 173–203. doi: 10.1016/j.dsr.2003.10.006
Chen Y. F. L., Chen H. Y. (2006). Seasonal dynamics of primary and new production in the northern South China Sea: The significance of river discharge and nutrient advection. Deep-Sea Res. Part I-Oceanographic Res. Papers 53, 971–986. doi: 10.1016/j.dsr.2006.02.005
Cherubin L. M., Richardson P. L. (2007). Caribbean current variability and the influence of the Amazon and Orinoco freshwater plumes. Deep-Sea Res. Part I-Oceanographic Res. Papers 54, 1451–1473. doi: 10.1016/j.dsr.2007.04.021
Choisnard N., Sperlea T., Liskow I., Voss M. (2024). Nitrification in the amazon river plume. Mar. Ecol. Prog. Ser. 730, 1–14. doi: 10.3354/meps14530
Cifuentes L., Sharp J., Fogel M. L. (1988). Stable carbon and nitrogen isotope biogeochemistry in the Delaware estuary. Limnology oceanography 33, 1102–1115. doi: 10.4319/lo.1988.33.5.1102
Çoban-Yıldız Y., Altabet M. A., Yılmaz A., Tuğrul S. (2006). Carbon and nitrogen isotopic ratios of suspended particulate organic matter (SPOM) in the Black Sea water column. Deep Sea Res. Part II: Topical Stud. Oceanography 53, 1875–1892.
Coles V. J., Brooks M. T., Hopkins J., Stukel M. R., Yager P. L., Hood R. R. (2013a). The pathways and properties of the Amazon River Plume in the tropical North Atlantic Ocean. J. Geophysical Research-Oceans 118, 6894–6913. doi: 10.1002/2013JC008981
Conroy B. J., Steinberg D. K., Stukel M. R., Goes J. I., Coles V. J. (2016). Meso- and microzooplankton grazing in the Amazon River plume and western tropical North Atlantic. Limnology Oceanography 61, 825–840. doi: 10.1002/lno.10261
Cullen J. J. (2015). Subsurface chlorophyll maximum layers: enduring enigma or mystery solved? Ann. Rev. Mar. Sci. 7.1, 207–239. doi: 10.1146/annurev-marine-010213-135111
DeMaster D. J., Kuehl S. A., Nittrouer C. A. (1986). Effects of suspended sediments on geochemical processes near the mouth of the Amazon River: examination of biological silica uptake and the fate of particle-reactive elements. Continental Shelf Res. 6, 107–125. doi: 10.1016/0278-4343(86)90056-7
DeMaster D. J., McKee B., Moore W. S., Nelson D. M., Showers W. J., Smith W. O. (1991). Geochemical processes occurring in the waters at the Amazon River/Ocean boundary. Oceanography 4, 15–20. doi: 10.5670/oceanog.1991.16
Demaster D. J., Pope R. H. (1996). Nutrient dynamics in Amazon shelf waters: results from AMASSEDS. Continental Shelf Res. 16, 263–289. doi: 10.1016/0278-4343(95)00008-O
DeMaster D., Smith W. Jr., Nelson D., Aller J. (1996). Biogeochemical processes in Amazon shelf waters: chemical distributions and uptake rates of silicon, carbon and nitrogen. Continental Shelf Res. 16, 617–643. doi: 10.1016/0278-4343(95)00048-8
Dippner J. W., Montoya J. P., Subramaniam A., Umbricht J., Voss M. (2024). The Amazon River plume—a Lagrangian view. Limnology Oceanography: Methods.
Edmond J., Boyle E., Grant B., Stallard R. (1981). The chemical mass balance in the Amazon plume I: the nutrients. Deep Sea Res. Part A. Oceanographic Res. Papers 28, 1339–1374. doi: 10.1016/0198-0149(81)90038-8
Eppley R. W., Peterson B. J. (1979). Particulate organic matter flux and planktonic new production in the deep ocean. Nature 282, 677–680. doi: 10.1038/282677a0
Falkowski P. G. (1991). Species variability in the fractionation of 13C and 12C by marine phytoplankton. J. Plankton Res. 13, 21–28.
Farquhar G. D., O'Leary M. H., Berry J. A. (1982). On the relationship between carbon isotope discrimination and the intercellular carbon dioxide concentration in leaves. Funct. Plant Biol. 9, 121–137. doi: 10.1071/PP9820121
Finlay J., Kendall C. (2007). “Stable isotope tracing of temporal and spatial variability in organic matter sources to freshwater ecosystems,” in Stable isotopes in ecology and environmental science, 283–333.
Fischer G. (1991). Stable carbon isotope ratios of plankton carbon and sinking organic matter from the Atlantic sector of the Southern Ocean. Mar. Chem. 35, 581–596. doi: 10.1016/S0304-4203(09)90044-5
Foltz G. R., McPhaden M. J. (2009). Impact of barrier layer thickness on SST in the central tropical North Atlantic. J. Climate 22, 285–299. doi: 10.1175/2008JCLI2308.1
Foster R. A., Kuypers M. M., Vagner T., Paerl R. W., Musat N., Zehr J. P. (2011). Nitrogen fixation and transfer in open ocean diatom–cyanobacterial symbioses. ISME J. 5, 1484–1493. doi: 10.1038/ismej.2011.26
Fry B., Sherr E. B. (1984). [amp]]part;13C measurements as indicators of carbon flow in marine and freshwater ecosystems. Contributions Mar. Sci. 27, 13–47.
Fry B., Sherr E. B. (1989). [amp]]delta; 13 C measurements as indicators of carbon flow in marine and freshwater ecosystems. Stable isotopes Ecol. Res. 27, 196–229.
Furuya K. (1990). Subsurface chlorophyll maximum in the tropical and subtropical western Pacific Ocean: Vertical profiles of phytoplankton biomass and its relationship with chlorophylla and particulate organic carbon. Mar. Biol. 107, 529–539. doi: 10.1007/BF01313438
Galbraith E. D., Martiny A. C. (2015). A simple nutrient-dependence mechanism for predicting the stoichiometry of marine ecosystems. Proc. Natl. Acad. Sci. 112, 8199–8204. doi: 10.1073/pnas.1423917112
Geider R., La Roche J. (2002). Redfield revisited: variability of C:N:P in marine microalgae and its biochemical basis. Eur. J. Phycology 37, 1–17. doi: 10.1017/S0967026201003456
Geyer W. R., Kineke G. C. (1995). Observations of currents and water properties in the amazon frontal zone. J. Geophysical Research-Oceans 100, 2321–2339. doi: 10.1029/94JC02657
Goericke R., Fry B. (1994). Variations of marine plankton δ13C with latitude, temperature, and dissolved CO2 in the world ocean. Global Biogeochemical Cycles 8, 85–90.
Goes J. I., do Rosario Gomes H., Chekalyuk A. M., Carpenter E. J., Montoya J. P., Coles V. J., et al. (2014). Influence of the Amazon River discharge on the biogeography of phytoplankton communities in the western tropical north Atlantic. Prog. Oceanography 120, 29–40. doi: 10.1016/j.pocean.2013.07.010
Harrison W. G. (1980). “Nutrient regeneration and primary production in the sea,” in Primary Productivity in the Sea. (Boston, MA: Springer US), 433–460.
Hedges J. I., Clark W. A., Quay P. D., Richey J. E., Devol A. H., Santos M. (1986). Compositions and fluxes of particulate organic material in the Amazon River 1. Limnology Oceanography 31, 717–738. doi: 10.4319/lo.1986.31.4.0717
Hofmann M., Wolf-Gladrow D. A., Takahashi T., Sutherland S. C., Six K. D., Maier-Reimer E. (2000). Stable carbon isotope distribution of particulate organic matter in the ocean: a model study. Mar. Chem. 72, 131–150. doi: 10.1016/S0304-4203(00)00078-5
Kendall C., Silva S. R., Kelly V. J. (2001). Carbon and nitrogen isotopic compositions of particulate organic matter in four large river systems across the United States. Hydrological Processes 15, 1301–1346. doi: 10.1002/hyp.v15:7
Kukert H., Riebesell U. (1998). Phytoplankton carbon isotope fractionation during a diatom spring bloom in a Norwegian fjord. Mar. Ecol. Prog. Ser. 173, 127–138. doi: 10.3354/meps173127
Lamb A., Wilson G., Leng M. (2006). A review of coastal palaeoclimate and relative sea-level reconstructions using [delta] 13C and C/N ratios in organic material. Earth-Science Rev. 75, 29–57. doi: 10.1016/j.earscirev.2005.10.003
Landrum J. P., Altabet M. A., Montoya J. P. (2011). Basin-scale distributions of stable nitrogen isotopes in the subtropical North Atlantic Ocean: Contribution of diazotroph nitrogen to particulate organic matter and mesozooplankton. Deep Sea Res. Part I: Oceanographic Res. Papers 58, 615–625. doi: 10.1016/j.dsr.2011.01.012
Latasa M., Cabello A. M., Morán X. A. G., Massana R., Scharek R. (2017). Distribution of phytoplankton groups within the deep chlorophyll maximum. Limnology Oceanography 62, 665–685. doi: 10.1002/lno.10452
Laws E. A., Popp B. N., Bidigare R. R., Kennicutt M. C., Macko S. A. (1995). Dependence of phytoplankton carbon isotopic composition on growth rate and [CO2)aq: Theoretical considerations and experimental results. Geochimica Cosmochimica Acta 59, 1131–1138. doi: 10.1016/0016-7037(95)00030-4
Lefèvre N., Flores Montes M., Gaspar F. L., Rocha C., Jiang S., De Araújo M. C., et al. (2017). Net heterotrophy in the Amazon continental shelf changes rapidly to a sink of CO2 in the outer Amazon plume. Front. Mar. Sci. 4, 278. doi: 10.3389/fmars.2017.00278
Lentz S. J. (1995). The amazon river plume during amasseds - subtidal current variability and the importance of wind forcing. J. Geophysical Research-Oceans 100, 2377–2390. doi: 10.1029/94JC00343
Lentz S. J., Limeburner R. (1995). The amazon river plume during amasseds - spatial characteristics and salinity variability. J. Geophysical Research-Oceans 100, 2355–2375. doi: 10.1029/94JC01411
Letelier R. M., Karl D. M., Abbott M. R., Bidigare R. R. (2004). Light driven seasonal patterns of chlorophyll and nitrate in the lower euphotic zone of the North Pacific Subtropical Gyre. Limnology Oceanography 49, 508–519. doi: 10.4319/lo.2004.49.2.0508
Liang Y.-C., Lo M. H., Lan C. W., Seo H., Ummenhofer C. C., Yeager S., et al. (2020). Amplified seasonal cycle in hydroclimate over the Amazon river basin and its plume region. Nat. Commun. 11, 4390. doi: 10.1038/s41467-020-18187-0
Liu Q., Kandasamy S., Wang H., Wang L., Lin B., Gao A., et al. (2019). Impact of hydrological conditions on the biogeochemical dynamics of suspended particulate organic matter in the upper mixed layer of the Southern East China Sea. J. Geophysical Research: Oceans 124, 6120–6140. doi: 10.1029/2019JC015193
Liu Q., Kandasamy S., Zhai W., Wang H., Veeran Y., Gao A., et al. (2022). Temperature is a better predictor of stable carbon isotopic compositions in marine particulates than dissolved CO2 concentration. Commun. Earth Environ. 3, 303. doi: 10.1038/s43247-022-00627-y
Lohrenz S. E., Knauer G. A., Asper V. L., Tuel M., Michaels A. F., Knap A. H. (1992). Seasonal variability in primary production and particle flux in the northwestern Sargasso Sea: US JGOFS Bermuda Atlantic Time-series Study. Deep Sea Res. Part A. Oceanographic Res. Papers 39, 1373–1391. doi: 10.1016/0198-0149(92)90074-4
Loick-Wilde N., Weber S. C., Conroy B. J., Capone D. G., Coles V. J., Medeiros P. M., et al. (2016). Nitrogen sources and net growth efficiency of zooplankton in three A mazon River plume food webs. Limnology Oceanography 61, 460–481.
Longhurst A. (1993). Seasonal cooling and blooming in tropical oceans. Deep-Sea Res. I: Oceanogr. Res. Pap. 40, 2145–2165.
Marañón E., Behrenfeld M. J., González N., Mouriño B., Zubkov M. V. (2003). High variability of primary production in oligotrophic waters of the Atlantic Ocean: uncoupling from phytoplankton biomass and size structure. Mar. Ecol. Prog. Ser. 257, 1–11. doi: 10.3354/meps257001
Marañón E., Holligan P. M., Varela M., Mouriño B., Bale A. J. (2000). Basin-scale variability of phytoplankton biomass, production and growth in the Atlantic Ocean. Deep Sea Res. Part I: Oceanographic Res. Papers 47, 825–857.
Martiny A. C., Vrugt J. A., Lomas M. W. (2014). Concentrations and ratios of particulate organic carbon, nitrogen, and phosphorus in the global ocean. Sci. Data 1, 1–7. doi: 10.1038/sdata.2014.48
McGowan J. A., Hayward T. L. (1978). Mixing and oceanic productivity. Deep-Sea Res. 25, 771–793. doi: 10.1016/0146-6291(78)90023-1
Montoya J. P. (2007). “Natural abundance of 15N in marine planktonic ecosystems,” Stable isotopes in ecology and environmental science, 176–201.
Montoya J. (2008). Nitrogen stable isotopes in marine environments. Nitrogen Mar. Environ. 2, 1277–1302. doi: 10.1016/B978-0-12-372522-6.00029-3
Montoya J. P., Landrum J. P., Weber S. C. (2019). Amazon River influence on nitrogen fixation in the western tropical North Atlantic. J. Mar. Res. 77, 191–213. doi: 10.1357/002224019828474278
Montoya J. P., McCarthy J. J. (1995). Isotopic fractionation during nitrate uptake by phytoplankton grown in continuous-culture. J. Plankton Res. 17, 439–464. doi: 10.1093/plankt/17.3.439
Moore C. M., Mills M. M., Arrigo K. R., Berman-Frank I., Bopp L., Boyd P. W., et al. (2013). Processes and patterns of oceanic nutrient limitation. Nat. Geosci. 6, 701–710. doi: 10.1038/ngeo1765
Muller–Karger F. E., McClain C. R., Richardson P. L. (1988). The dispersal of the Amazon's water. Nature 333, 56–58. doi: 10.1038/333056a0
O'Reilly J. E., Busch D. E. (1984). Phytoplankton primary production on the northwestern Atlantic shelf. Rapports Procés-verbaux du Conseil Int. pour l'Exploration la Mer 183, 255–268.
Pan D., Liu Q., Bai Y. (2014). Review and suggestions for estimating particulate organic carbon and dissolved organic carbon inventories in the ocean using remote sensing data. Acta Oceanologica Sin. 33, 1–10. doi: 10.1007/s13131-014-0419-4
Parker P. L. (1964). The biogeochemistry of the stable isotopes of carbon in a marine bay. Geochimica Cosmochimica Acta 28, 1155–1164. doi: 10.1016/0016-7037(64)90067-5
Peterson B. J., Fry B. (1987). Stable isotopes in ecosystem studies. Annu. Rev. Ecol. systematics 18, 293–320. doi: 10.1146/annurev.es.18.110187.001453
Pham A. H., Choisnard N., Fernández-Carrera A., Subramaniam A., Strope E. K., Carpenter E. J., et al. (2024). Planktonic habitats in the Amazon Plume region of the Western Tropical North Atlantic. Front. Mar. Sci. 11, 1287497. doi: 10.3389/fmars.2024.1287497
Platt T., Subba Rao D. V. (1975). “Primary production of marine microphytes,” Photosynthesis and productivity in different environments 3, 249–280.
Popp B. N., Laws E. A., Bidigare R. R., Dore J. E., Hanson K. L., Wakeham S. G. (1998). Effect of phytoplankton cell geometry on carbon isotopic fractionation. Geochimica cosmochimica Acta 62, 69–77. doi: 10.1016/S0016-7037(97)00333-5
Quay P. D., Wilbur D. O., Richey J. E., Hedges J. J., Devol A. H. (1992). Carbon cycling in the Amazon River: Implications from the 13C compositions of particles and solutes. Limnology Oceanography 37, 857–871. doi: 10.4319/lo.1992.37.4.0857
Rau G., Takahashi T., Des Marais D., Repeta D., Martin J. (1992). The relationship between δ13C of organic matter and [CO2 (aq)] in ocean surface water: data from a JGOFS site in the northeast Atlantic Ocean and a model. Geochimica Cosmochimica Acta 56, 1413–1419. doi: 10.1016/0016-7037(92)90073-R
Rau G., Teyssie J.-L., Rassoulzadegan F., Fowler S. (1990). ¹³C/¹²C and ¹5N/¹4N variations among size-fractionated marine particles: implications for their origin and trophic relationships. Mar. Ecol. Prog. Ser., 33–38. doi: 10.3354/meps059033
Redfield A. C. (1958). The biological control of chemical factors in the environment. Am. scientist 46, 230A–2221.
Richey J. E., Hedges J. I., Devol A. H., Quay P. D., Victoria R., Martinelli L., et al. (1990). Biogeochemistry of carbon in the Amazon River. Limnology oceanography 35, 352–371. doi: 10.4319/lo.1990.35.2.0352
Ryther J. H., Menzel D. W., Corwin N. (1967). Influence of the Amazon River outflow on the ecology of the western tropical Atlantic. I. Hydrography and nutrient chemistry. J. Mar. Res. 25, 69–83.
Sarmiento J. L., Thiele G., Key R. M., Moore W. S. (1990). Oxygen and nitrate new production and remineralization in the North Atlantic subtropical gyre. J. Geophysical Research: Oceans 95, 18303–18315. doi: 10.1029/JC095iC10p18303
Showers W. J., Angle D. G. (1986). Stable isotopic characterization of organic carbon accumulation on the Amazon continental shelf. Continental Shelf Res. 6, 227–244. doi: 10.1016/0278-4343(86)90062-2
Sigleo A., Macko S. (2002). Carbon and nitrogen isotopes in suspended particles and colloids, Chesapeake and San Francisco estuaries, USA. Estuarine Coast. Shelf Sci. 54, 701–711. doi: 10.1006/ecss.2001.0853
Smith B. N. (1972). Natural abundance of the stable isotopes of carbon in biological systems. BioScience 22, 226–231. doi: 10.2307/1296391
Smith W. O., Demaster D. J. (1996). Phytoplankton biomass and productivity in the Amazon River plume: Correlation with seasonal river discharge. Continental Shelf Res. 16, 291–319. doi: 10.1016/0278-4343(95)00007-N
Smith W. O., Russell G. J. (1995). Phytoplankton biomass and nutrient distributions in the Amazon River plume: environmental correlates. Geo-Marine Lett. 15, 195–198. doi: 10.1007/BF01204463
Subramaniam A., Yager P. L., Carpenter E. J., Mahaffey C., Björkman K., Cooley S., et al. (2008). Amazon River enhances diazotrophy and carbon sequestration in the tropical North Atlantic Ocean. Proc. Natl. Acad. Sci. United States America 105, 10460–10465.
Team, R. C. (2022). R: A language and environment for statistical computing (Vienna, Austria: R Foundation for Statistical Computing). Available at: http://www.R-project.org/, ISBN: 3-900051-07-0.
Umbricht J., Burmeister C., Dippner J. W., Liskow I., Montoya J. P., Subramaniam A., et al. (2024). Nitrate uptake and primary production along the Amazon River plume continuum. J. Geophysical Research: Biogeosciences 129, e2023JG007662.
Vital H., Stattegger K., Garbe-Schonberg C. D. (1999). Composition and trace-element geochemistry of detrital clay and heavy-mineral suites of the lowermost Amazon River: A provenance study. J. Sedimentary Res. 69, 563–575. doi: 10.2110/jsr.69.563
Wada E., Terazaki M., Kabaya Y., Nemoto T. (1987). 15N and 13C abundances in the Antartic Ocean with emphasis on the biogeochemical structure of the food web. Deep Sea Res. Part A. Oceanographic Res. Papers 34, 829–841. doi: 10.1016/0198-0149(87)90039-2
Ward N. D., Keil R. G., Medeiros P. M., Brito D. C., Cunha A. C., Dittmar T., et al. (2013). Degradation of terrestrially derived macromolecules in the Amazon River. Nat. Geosci. 6, 530–533. doi: 10.1038/ngeo1817
Wassmann P., Aadnesen A. (1984). Hydrography, nutrients, suspended organic matter, and primary production in a shallow fjord system on the west coast of Norway. Sarsia 69, 139–153. doi: 10.1080/00364827.1984.10420600
Weber S. C., Carpenter E. J., Coles V. J., Yager P. L., Goes J., Montoya J. P. (2017). Amazon River influence on nitrogen fixation and export production in the western tropical North Atlantic. Limnology Oceanography 62, 618–631. doi: 10.1002/lno.10448
Keywords: particulate carbon, C:N ratio, δ¹³C, Amazon River, Western Tropical North Atlantic, carbon stable isotope
Citation: Alriyami Z and Montoya JP (2024) Biomass and stable carbon isotope distributions in the Amazon plume region. Front. Mar. Sci. 11:1484825. doi: 10.3389/fmars.2024.1484825
Received: 22 August 2024; Accepted: 31 October 2024;
Published: 29 November 2024.
Edited by:
Martin F. Soto-Jimenez, National Autonomous University of Mexico, MexicoReviewed by:
Selvaraj Kandasamy, Central University of Tamil Nadu, IndiaFrank Dehairs, Vrije University Brussels, Belgium
Copyright © 2024 Alriyami and Montoya. This is an open-access article distributed under the terms of the Creative Commons Attribution License (CC BY). The use, distribution or reproduction in other forums is permitted, provided the original author(s) and the copyright owner(s) are credited and that the original publication in this journal is cited, in accordance with accepted academic practice. No use, distribution or reproduction is permitted which does not comply with these terms.
*Correspondence: Zainab Alriyami, emFpbmFiYWxyaXlhbWlAZ2F0ZWNoLmVkdQ==
 Zainab Alriyami
 Joseph P. Montoya