- 1Department of Oceanography, Inha University, Incheon, Republic of Korea
- 2Key Laboratory of Marine Geology and Environment, Institute of Oceanology, Chinese Academy of Sciences, Qingdao, China
In steady uniform boundary layers, the dynamics of sediment resuspension and transport are controlled by near-bed turbulence, often quantified by bed shear stress, τb. Over the past few decades, various methods have been developed to infer bed shear stress using noninvasive, high-resolution flow observations from acoustic instruments. However, there is room for improvement in these methods. This study adopts an inertial dissipation method for sediment (IDM_Sed) to improve the accuracy of shear stress estimation from suspended sediment concentrations (SSC) and to evaluate IDM_Sed performance in cohesive sediment environments by incorporating more accurate, time- and elevation-varying settling velocities. Comprehensive observations were conducted on the Songdo tidal flats over more than one month in 2023, using both acoustic and optical instruments. Our results suggest that the improved IDM_Sed enhances the accuracy of computed shear stress. In cohesive environments, this method captures trends in shear stress induced by current velocity and incorporates influences from sediment concentration. Moreover, the enhancement of shear stress calculation in IDM_Sed, incorporating SSC and in-situ observed shear velocities, proposes a novel method to compute time-varying settling velocities from shear stress.
1 Introduction
Bed shear stress is a fundamental factor in controlling sediment resuspension, and near-bed turbulence acts as a primary mechanism of flocculation, including particle aggregation and break-up. With point measurements of turbulence, bed shear stress can be estimated using methods such as Reynolds stress (Launder et al., 1975; Shih et al., 1995; Stacey et al., 1999) and the turbulent kinetic energy (TKE) method (Soulsby, 1983; Pope et al., 2006), both of which utilize velocity fluctuation components. These approaches are commonly applied in local bed shear stress investigations. An alternative approach is the inertial dissipation method (IDM_Flow), which leverages the spectra of turbulent fluctuations and has been modified for conditions with coexisting waves and currents and low Reynolds numbers (Grant et al., 1984; Huntley, 1988; Stapleton and Huntley, 1995). Comprehensive reviews of widely used methodologies, including their strengths and weaknesses, have been conducted by Kim et al. (2000); Boudreau and Jørgensen (2001), and Biron et al. (2004).
While previous studies have significantly advanced our understanding of shear stress estimation, many methodologies for shear stress estimation tend to overlook the substantial influence of suspended sediment on turbulence dynamics. A notable exception is Lee et al. (2003), who proposed an IDM for passive tracers (hereinafter referred to as IDM_Sed), specifically for non-cohesive sediment, capable of estimating the shear stress by incorporating constant sediment properties such as settling velocity. However, this approach focuses primarily on non-cohesive sediments and relies on a fixed settling velocity.
Cohesive sediments exhibit dynamic properties that evolve over time due to flocculation processes, encompassing both aggregation and break-up (van Leussen, 1988). Among these properties, settling velocity holds particular significance for cohesive sediments (Maa and Kwon, 2007). Settling velocity is influenced by various factors, including particle size, turbulence and sediment concentration (van Leussen, 1994; Winterwerp, 1998; Fornari et al., 2016). Under low turbulence conditions, particles settle more slowly, with Brownian motion playing a significant role. This can lead to differential settling, where particles of different sizes and densities separate vertically and may aggregate under certain conditions (van Leussen, 1994; Winterwerp, 1998). In contrast, in high turbulence environments, continuous mixing and resuspension of particles occur, resulting in reduced or variable settling velocities and influencing sediment distribution through particle aggregation and breakup (Fornari et al., 2016). Additionally, as suspended sediment concentration increases, settling velocity exhibits a non-linear increase, particularly under turbulent conditions (Ha and Maa, 2010).
Early attempts to measure settling velocity directly used Owen tube calculations (van Leussen, 1999) and in situ settling chambers (Syvitski et al., 1995; She et al., 2005). Technological advancements have led to direct observation methods using video systems, such as floc cameras, which calculate settling velocity based on snapshots of individual particles (Smith and Friedrichs, 2011; 2015; Shen and Maa, 2016). However, direct observations are limited by spatial and temporal coverage, prompting researchers to develop indirect methods for estimating settling velocity. Some studies have formulated settling velocity based on sediment concentration (C) using the equation, , where K and m are constants related to turbulence, sediment type, and salinity (Krone, 1962; Mehta, 1989; Winterwerp, 2002; You, 2004). Other methods balance the downward flux with averaged settling velocity against the diffusive upward flux related to sediment concentration and eddy diffusivity (Fugate and Friedrichs, 2002). While previous studies have introduced effective methodologies for estimating settling velocity, both direct and indirect methods have limitations. Direct measurements, such as those from floc cameras, allow for the observation of time-varying settling velocity but are constrained by temporal and spatial limitations. Indirect methods often provide a constant value for settling velocity over time, even when using sequential data of velocity and suspended sediment concentration (SSC). Consequently, it is necessary to develop a methodology to overcome these challenges.
To address these limitations, this study examines the applicability of IDM_Sed to cohesive sediment environments with observed settling velocity to improve the estimation of shear stress and time-varying settling velocity. The specific objectives include: 1) implementing the IDM_Sed in cohesive sediment environments and comparing it with alternative methods for shear stress calculation, 2) assessing the significance of applying realistic settling velocity in shear stress calculations through a comparative analysis of estimated and observed settling velocities, and 3) evaluating settling velocities obtained through the inverse process of the IDM_Sed with cohesive sediment.
The structure of this paper is as follows. Section 2 introduces the background of estimating important parameters such as bed shear stress and settling velocity. Section 3 describes the study site, the Aam tidal channel, and the field experiment, including data collection. Data processing and analysis are presented in Section 4. Observation results are shown in Section 5. Section 6 discusses the application of IDM in cohesive sediment environments and the estimation of settling velocity from IDM. Finally, the conclusions of this study are drawn in Section 7.
2 Background
Bed shear stress (τ) and shear velocity (u*) are fundamental parameters in sediment dynamics, affecting resuspension, deposition of sediment, and the diffusion of SSC in the water column. The relationship between bed shear stress (τ) and shear velocity (u*) is given by , where is the density of seawater. To accurately calculate bed shear stress, it is essential to remove noise caused by oscillatory turbulence from gravitational waves, as this turbulence can obscure the actual stress induced by underlying currents. Separating different timescales allows for the evaluation of shear stress induced solely by true turbulence. Moreover, the flow is assumed to be neutrally stratified, horizontally homogeneous, and stationary (Kim et al., 2000). Under these conditions, three representative methods are available to estimate bed shear stress from high-resolution velocity observations. Two of these methods utilize horizontal and vertical velocity fluctuations, while the third method involves using spectra of either velocity fluctuations or SSC.
2.1 Estimating bed shear velocity from observed velocity fluctuations
High-resolution velocity observations (u) can be decomposed into mean component () and fluctuating velocity (). The Reynolds stress, calculated using the cross-product of observed velocity fluctuations in the streamwise () and vertical () directions, provides an estimate of bed shear velocity (u*RE):
where <> denotes the burst average. This method is ideal as covariance provides an unbiased estimation of bottom stress. However, potential error, including contamination from intra-tidal frequency flows like secondary flows, must be considered (Kim et al., 2000).
The turbulent kinetic energy (TKE) method also uses turbulent measurements, using the three components of velocity fluctuation:
where v’ represents the lateral direction of velocity fluctuation, and C1 is a proportionality constant (C1 = 0.19) (Soulsby, 1983).
2.2 Estimating bed shear velocity from observed spectra of velocity and SSC
The inertial dissipation method (IDM) involves spectral fitting on the velocity spectra within the inertial subrange to estimate bed shear velocity. IDM assumed that (1) measurements are made in steady, spatially uniform, unstratified constant stress layer; (2) sufficient separation must exist in the inertial subrange between the scales of turbulence production and dissipation; and (3) the characteristic lifetimes of turbulent eddies in the inertial subrange are much larger than the characteristic time required for eddies to advect past the point of Eulerian measurement (Lee et al., 2003). In IDM, shear velocity is determined by assuming a first-order balance between shear production (P) and energy dissipation (), utilizing the 1D spectrum applicable to the inertial dissipation range (Huntley, 1988; Kim et al., 2000):
where U is the current speed at depth z, averaged over wave and turbulent time scale. From the Reynold stress and logarithmic profile (), the shear velocity can be expressed as:
where k is the von Karman’s constant (≈ 0.4). In the inertial subrange, where sufficient separation exists between turbulence production and dissipation, the energy flux from lower to higher turbulence levels must be balanced by the dissipation rate (ϵ), given the absence of local sources or sinks for energy. This leads to the 1D spectrum (Tennekes and Lumley, 1972):
where k is the eddy wave number, and denotes the 1-D Kolmogorov constant ( and for horizontal components ≈ 0.51 and for the vertical component ≈ 0.69) (Huntley, 1988; Green, 1992). is the spectral density of ith velocity component. Combining Equations 4 and 5 results in:
With the condition of , the wave-number spectra can be translated into frequency spectra, assuming with , where f is frequency. Then Equation 6 becomes
To avoid the influence of wave, the vertical velocity from the Nortek Vector, less affected by waves than horizontal velocity, was utilized to calculate and as U.
In well-developed turbulent flows, scalar quantities such as passive tracers typically exhibit a consistent distribution of spectral density across an inertial subrange of wave numbers or equivalent frequencies. By applying the analogy between other passive tracers and suspended sediment, Lee et al. (2003) suggested the new inertial dissipation method for estimating bed shear velocity from the suspended sediment concentration and settling velocity (IDM_Sed). The dissipation rate of turbulence fluctuation is introduced in Equation 8, with the balance between the production of concentration variance and its dissipation, where is the concentration fluctuation and is the time-averaged SSC at elevation z above the bed:
In Equation 8, the vertical turbulence of sediment in a horizontally uniform and fully developed turbulent flow can be described in terms of eddy diffusivity (K) as:
Also, the vertical gradient of SSC can be expressed by the time-averaged sediment diffusion in steady and horizontally uniform conditions, where is the settling velocity, assumed to be constant over time and height above the bed. In this approach, molecular diffusivity (generally on order of 10-9 m2/s) is disregarded due to its relatively small influence compared to eddy diffusivity (generally on order of 10-2 m2/s).
With dimensional considerations and assuming uniform shear stress in the z-direction, the eddy diffusivity near the bottom boundary layer can be described as (Tennekes and Lumley, 1972):
Substitution of Equations 9, 10, and 11 into Equation 8 results in the relationship between the dissipation rate and the SSC and settling velocity.
Applying the analogy between other passive tracers such as temperature and SSC, dimensional considerations lead to general relationships similar to Equation 5:
where denotes the spectral density of sediment concentration and is an empirical constant ( = 0.71 in atmosphere and marine boundary layer) (Sharples et al., 2001). The similarity between Equation 5 for velocity and Equation 13 for SSC was proven in Soulsby et al. (1984) in a tidal flow. By substituting Equation 12 into Equation 13 and rearranging it into shear velocity () in terms of frequency spectra (such as Equation 7):
is the TKE frequency spectra of SSC. The method in previous studies (Lee et al., 2003) utilized a constant settling velocity, failing to account for time-varying settling velocities. Therefore, to emphasize the importance of observed settling velocities, Equation 15 will be evaluated using two settling velocities: a single settling velocity value calculated with Equation 16 and varying settling velocities measured by the floc camera, as described in Section 3.
2.3 Estimating the settling velocity
The settling velocity can be calculated using Equation 10 by applying the eddy diffusivity (K) and the profile of SSC (). However, due to the challenge of directly acquiring eddy diffusivity, Equation 10 cannot be used directly. Instead, we decomposed the concentration (C) into its mean () and fluctuating components () and applied the turbulent diffusion of sediment to obtain the settling velocity through an alternative formulation, as shown in the equation below (Fugate and Friedrichs, 2002; Lee et al., 2003):
In this equation, the settling velocity is represented as the reciprocal of the gradient, indicating the relationship between sediment concentration and vertical turbulence of sediment. This estimation allows the calculation of settling velocity using SSC and vertical velocity, but only yields a constant value over time with sequential datasets of velocity and SSC. The calculated constant settling velocity was applied in IDM_sed (u*IDM_Sed,est) and compared with the shear velocity computed using directly in-situ observed settling velocities, ws,obs (u*IDM_Sed,obs).
A new method to estimate time-varying settling velocity is suggested in Equation 17, by rearranging Equation 15 based on IDM_Sed. This approach is based on the idea that if IDM, utilizing the actual settling velocity, effectively estimates shear velocity, then it should also enable the calculation of time-dependent settling velocity through shear velocity derived from other methods (TKE, Reynolds stress). With the time-varying shear velocity, this method calculates time-dependent settling velocity using sequential observations of velocity and SSC:
In evaluating Equation 17, we use the shear velocity obtained by using the TKE method.
2.4 Summary of background
In this section, we have summarized the existing methods for calculating bed shear velocity and settling velocity. High-resolution velocity data allow for decomposing velocity into mean (ū) and fluctuating (u’) components, facilitating bed shear velocity calculation using Equations 1 and 2. The spectral density of velocity, balanced between shear production (P) and energy dissipation (ϵ) in the inertial subrange, enables boundary layer flow intensity estimation, represented by shear velocity in Equations 3–7. This spectral approach extends to passive tracers, particularly for SSC, as outlined in Equations 8–15. Settling velocity determination can be influenced by the balance between the vertical gradient of SSC and the downward settling flux of sediment, incorporating eddy diffusivity as described in Equation 10. Given the challenges in estimating eddy diffusivity, Equation 11 utilizes the covariance of vertical velocity fluctuations. In this study, we propose a new approach using IDM_Sed to estimate time-varying settling velocity.
3 Study area and field experiment
The Aam tidal channel, extending over a length of 4.5 km, is a semi-enclosed artificial waterway covering an area of 2 km2 in Incheon, South Korea (Figure 1). Originally open-ocean tidal flats in the Gyeonggi Bay until 2003, the artificial Aam tidal channel was formed as part of the Songdo International Business District development project, with breakwaters constructed on the northern and southern sides and the land between them reclaimed in 2006 (Lee et al., 2024). This reclamation led to the formation of the tidal channel between the reclaimed land and the pre-existing seawalls to the north and east. The channel now has a flipped L-shape, with its seaward side connecting to the tidal flat of Gyeonggi Bay, while its landward side is enclosed by a sluice gate connecting to the Aam waterfront lake. The width of the tidal channel varies from 30 to 100 m, and the main channel depth ranges from 2 to 3 m.
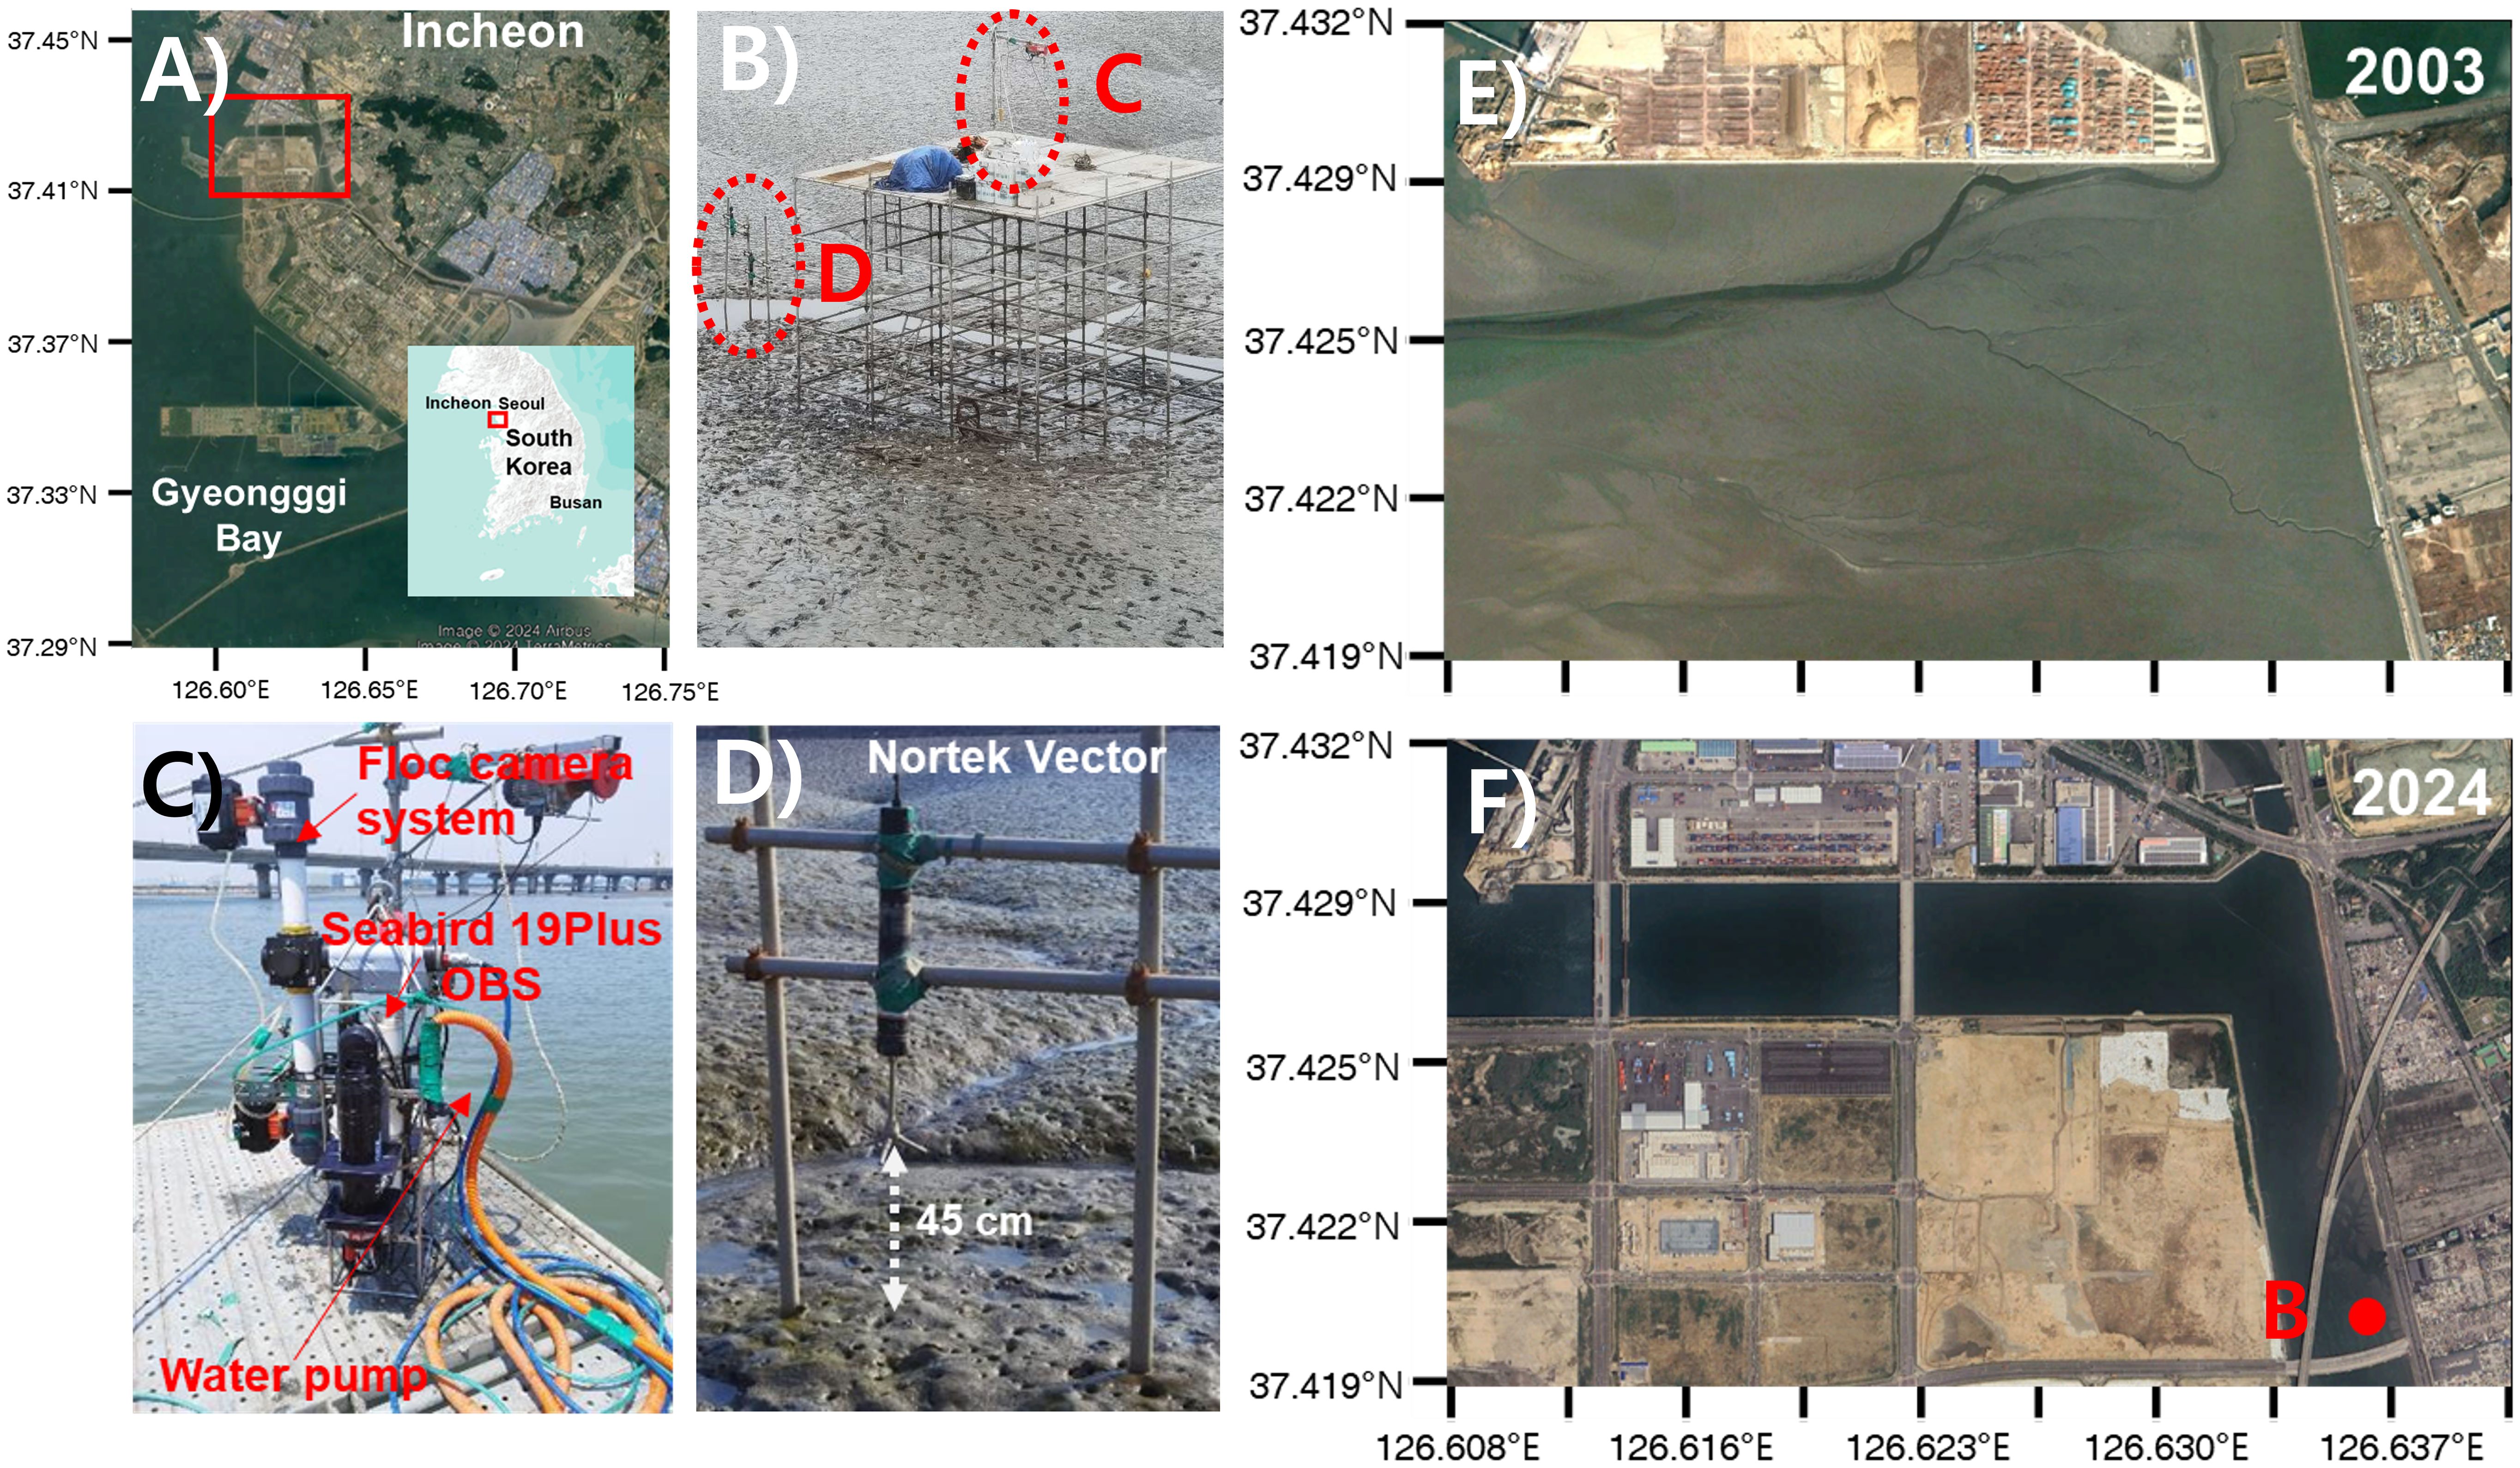
Figure 1. Location map of the Aam tidal channel and observation sites. (A) Map of South Korea showing the location of the Aam channel. (B) Photo of the system support where mooring and casting surveys were conducted. (C) Photo of the instruments used for casting surveys, including the floc camera system for observing settling velocity, the Seabird 19Plus for measuring temperature, salinity, and depth, the OBS for turbidity measurements, and the water pump. (D) Photo of a Nortek Vector mounted on an H-frame. (E) Satellite image of the Aam channel taken before land reclamation in 2003. (F) Satellite image of the Aam channel taken after land reclamation in 2024, indicating the observation station. The inset shows a photo of the scaffolding platform used for casting observations.
Gyeonggi Bay is classified as a macrotidal, semi-diurnal system, with a maximum tidal range reaching 10 m during a spring tide and a mean tidal range of 6.5 m. The climate of the Aam tidal channel is dominated by the East Asian monsoon. The climate is characterized by gentle southeasterly winds and heavy precipitation during summer, while relatively strong northwesterly winds prevail during the dry winter. The wave climate is also controlled by the East Asian monsoon, with wave heights inside the channel rarely exceeding 1 m due to wave energy dissipation in the Gyeonggi Bay (Lee et al., 2019). Sediment within the Aam tidal channel primarily originates from the Han River, particularly during summer, characterized by high freshwater discharge due to intensified precipitation (Lee and Kang, 2018; Shin et al., 2019). The entrance of the Aam tidal channel is predominantly composed of sand deposits, with a substantial quantity of oyster shells extending from the channel entrance to the channel bent. In contrast, fine sediments are primarily deposited inside the Aam tidal channel, where the energy regime is relatively low compared to the entrance.
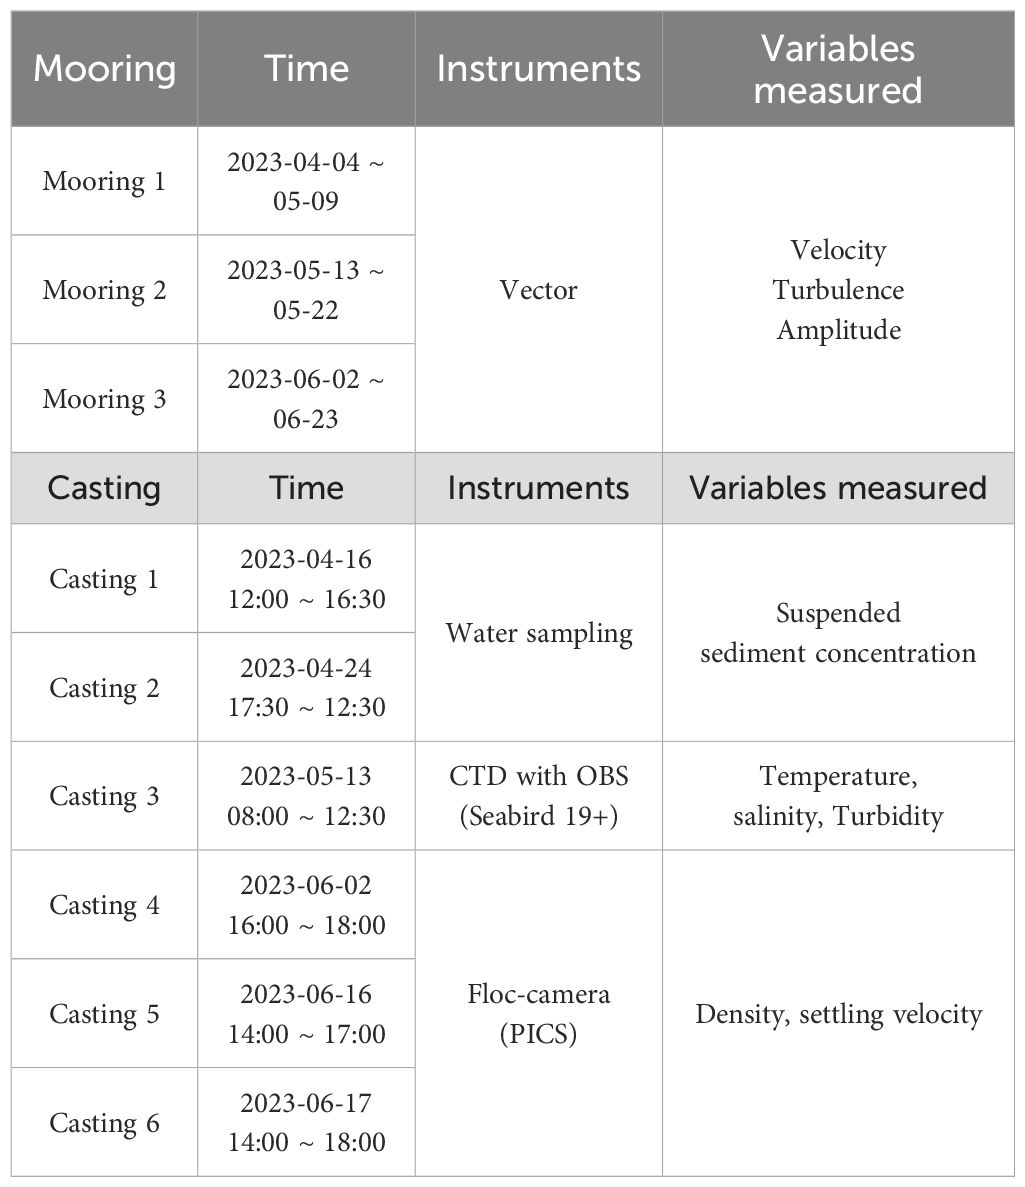
Field measurements were conducted using mooring observations and casting to obtain various hydrodynamic and sediment parameters in 2023. Current velocity, acoustic signal strength, and settling velocity were measured through mooring observations, while SSC was obtained from water samples collected during casting surveys (Table 1). The first mooring observation was conducted from April 4th to May 9th, 2023, inside the channel where cohesive sediments dominate (Figure 1). Two additional mooring observations were carried out for both from May 13th to May 22nd and from June 2nd to June 23rd at the same observation point. A Nortek Vector was deployed on the H-frame to measure current velocity and acoustic signal strength. The Nortek Vector was installed 45 cm from the sediment bed and collected current velocity at a sampling rate of 8 Hz with a burst interval of 30 minutes. Each burst consisted of 4096 samples.
To measure in-situ settling velocity and SSC, 6 casting observations were conducted over a system scaffolding platform near the mooring station. In the profiling observation, a Seabird SBE 19plus SEACAT profiler equipped with a Seapoint OBS was employed in conjunction with a water pump for water sampling. The Seabird SBE 19 plus conducted measurements of conductivity, temperature, and depth profiles at a frequency of 4 Hz every 30 minutes during the downcast. Simultaneously, the Seapoint OBS observed the turbidity profile, and 3 L water samples were collected at the surface, middle, and bottom layers of the water column using a pump to calibrate the OBS and acoustic signal strength from the Nortek Vector. The floc camera system was deployed to capture snapshots of settling particles to observe settling velocity. Snapshots of settling particles were captured during 30-second intervals at 8 frames per second (Smith and Friedrichs, 2011), resulting in a total of 240 frames and 326 MB of data per sample/observation.
4 Data analysis
All observed variables underwent rigorous quality control procedures before being used in the analysis. Current velocity data from the Nortek Vector were utilized to calculate both velocity fluctuations (u’, v’, w’) and the dominant flow speed () for the IDM. The correlation value, representing the consistency of the acoustic signal in detecting particle movement on a scale from 0 to 100, was used to assess the reliability of the current data. Only data with a correlation of over 80% were considered acceptable, and values exceeding three times the standard deviation for each variable were excluded to remove noise and statistically insignificant values. Furthermore, to ensure consistency, the current velocity data were rotated to align the u-velocity with the major axis direction.
Acoustic signal strength that met the velocity quality control criteria was converted to SSC by calibrating with in-situ water samples. The water samples were subjected to vacuum filtration using membrane filters, then dried and weighed in the laboratory to determine the SSC. This SSC data was used to establish a regression curve for converting acoustic backscatter to SSC. The regression analysis yielded the equation SSC = 5.64X – 611.47, with a correlation coefficient of 0.76 (Figure 2).
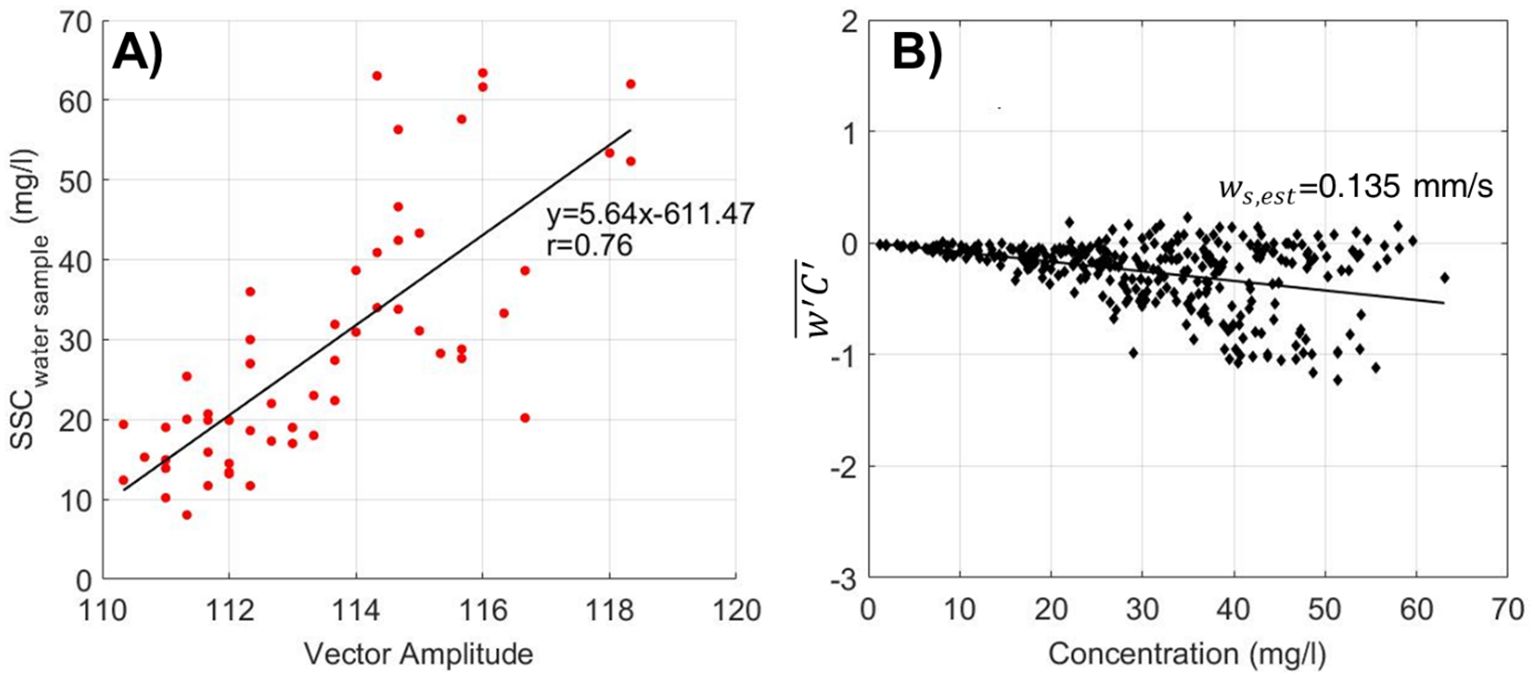
Figure 2. (A) Calibration of Vector amplitude against water sample-derived SSC. (B) Settling velocity calculations using Reynolds concentration flux versus sediment concentration.
To apply the IDM for the bed shear velocity, there must be sufficient separation between the scales of turbulent production and dissipation in the inertial subrange. Spectrum analysis was conducted on qualified current velocity and SSC data to examine this separation. An example of the spectrum density of current velocity and SSC is shown in Figure 3. The time-series data for velocity and SSC were transformed into the frequency domain using Fourier transforms. Frequency spectra exhibiting a -5/3 slope were then selected for calculating the bed shears stress by the IDM. To mitigate wave influence, the w-component of the velocity data was used (Lee et al., 2003).
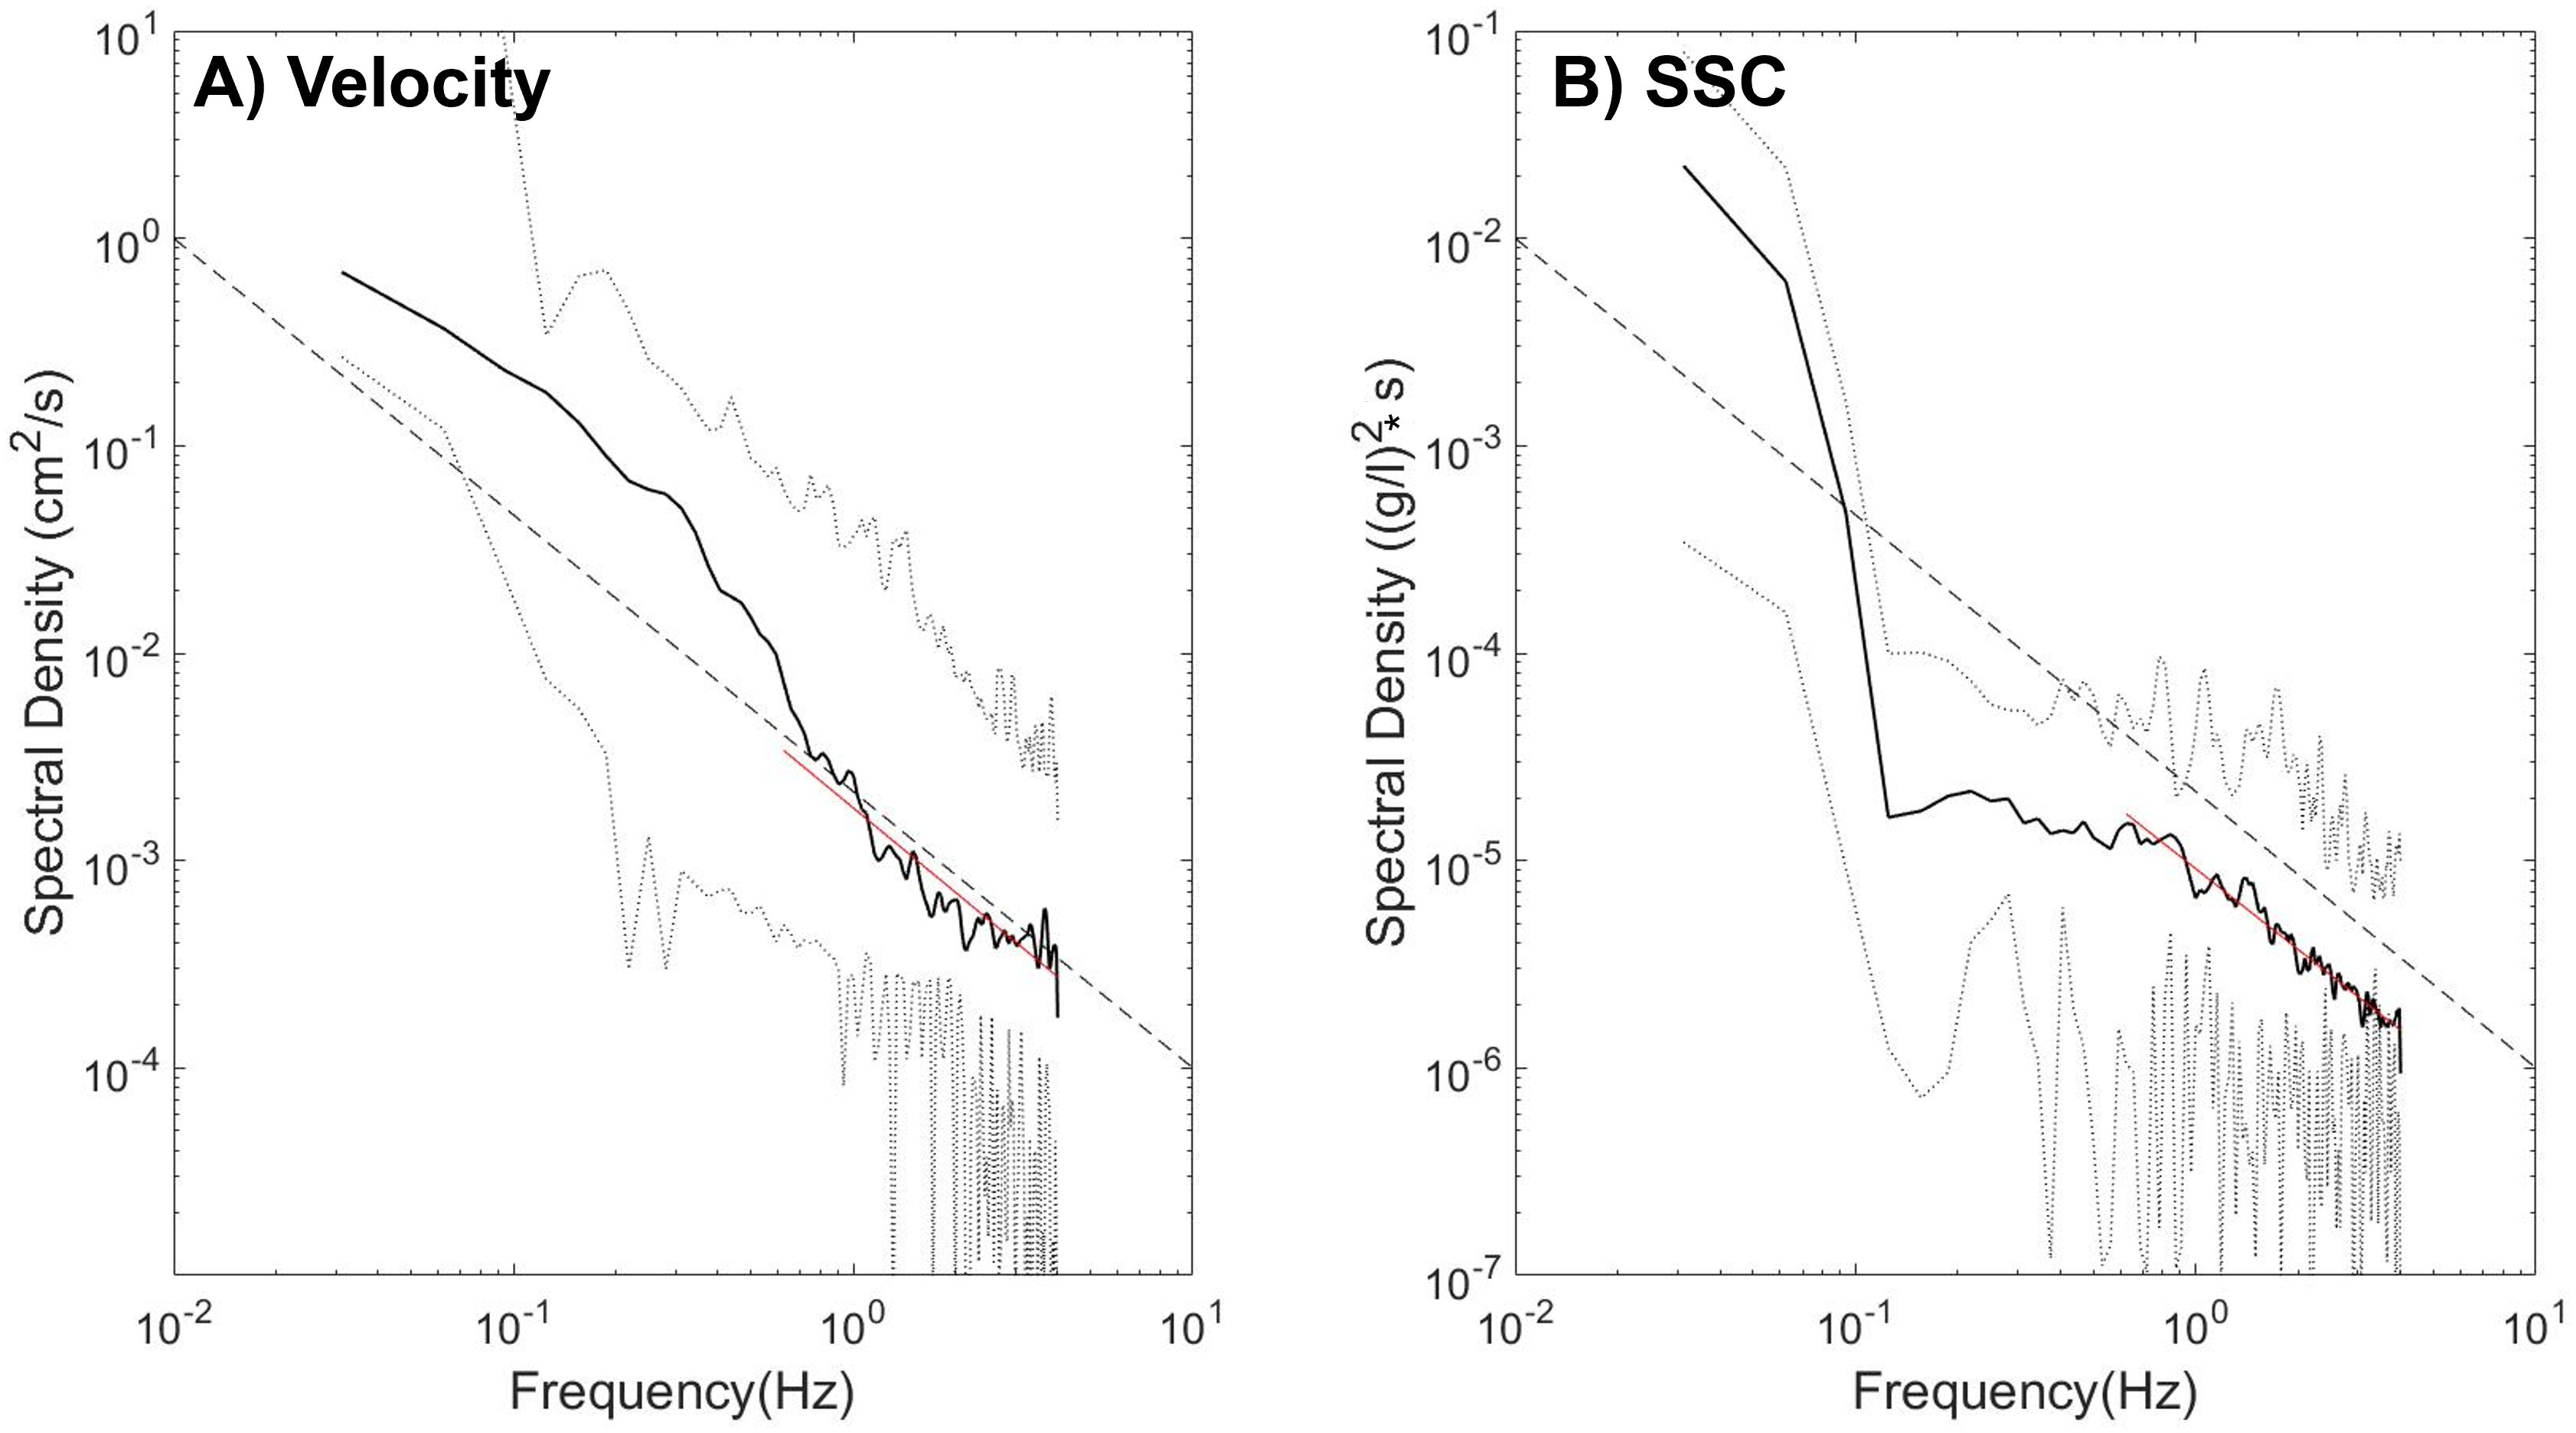
Figure 3. Spectra of vertical turbulent velocities (A) and SSC (B) measured at 45 cm above the bed. A -5/3 slope line is indicated in red for comparison. The gray lines indicate the 95% confidence level.
The Turbulent Kinetic Energy (TKE) method was used to validate the IDM calculations by comparing the results from both methods, given TKE’s known accuracy in estimating bed shear stress. The TKE method integrates the vertical component of turbulence, which more accurately reflects the influence of turbulence on bed shear stress and on the settling velocity of sediments (Kim et al., 2000). Kim et al. (2000) demonstrated that TKE provided consistent results across different heights, indicating its potential for reliable application in various conditions. Additionally, due to turbulence’s inherently three-dimensional nature, the TKE method captures a broader range of spatial components of shear stress, whereas the RS method is limited to specific stress elements, which may restrict its application under varying turbulent conditions (Soulsby, 1983; Grant and Madsen, 1986). In this study, spectral analysis of the w component was applied to select data suitable for removing oscillatory stress effects induced by waves, supporting the appropriateness of the TKE method, which includes the w component in shear stress calculations. Experimental and numerical model validations have shown that TKE maintains a high level of consistency between estimated and measured bed shear stress, further supporting its accuracy in hydrodynamic modeling (Nelson et al., 1995). These comparisons thus reinforce the use of the TKE method over the RS method in validating IDM bed shear stress estimates across various conditions (Gargett, 1989; Lacy and Sherwood, 2004).
The performance of IDM was evaluated using two error statistics: the correlation coefficient (r), representing the goodness of fit, and root mean square error (RMSE). The RMSE was calculated as:
To assess the significance of incorporating the time-varying observed settling velocity into IDM, both the observed settling velocity by the floc camera system and the averaged settling velocity estimated by the balance between the downward flux and the upward diffusive flux were utilized. Among the 46 observations conducted by the floc camera, only 23 met the predefined criteria for the fractal model approach, which are necessary for determining key parameters such as fractal dimension (F), particle density (ρ), and settling velocity (Ws). These criteria include a density range of 700–2600 kg/m³ and structural self-similarity, which are essential for reliable analysis. A meticulous examination of the floc camera videos revealed factors like vortex-induced whirling, turbulence, platform instability, and potential valve malfunctions that caused unusually high particle densities, leading to the exclusion of unreliable data. Therefore, our analysis focused on a selected group of 23 observations, comprising approximately 36,000 flocs/particles, which met our predefined criteria for reliable results (Figure 4). The observed settling velocity during the period when qualified data were available was input for the calculation of bed shear velocity, and the averaged value of qualified settling velocity was substituted for periods when it was not available.
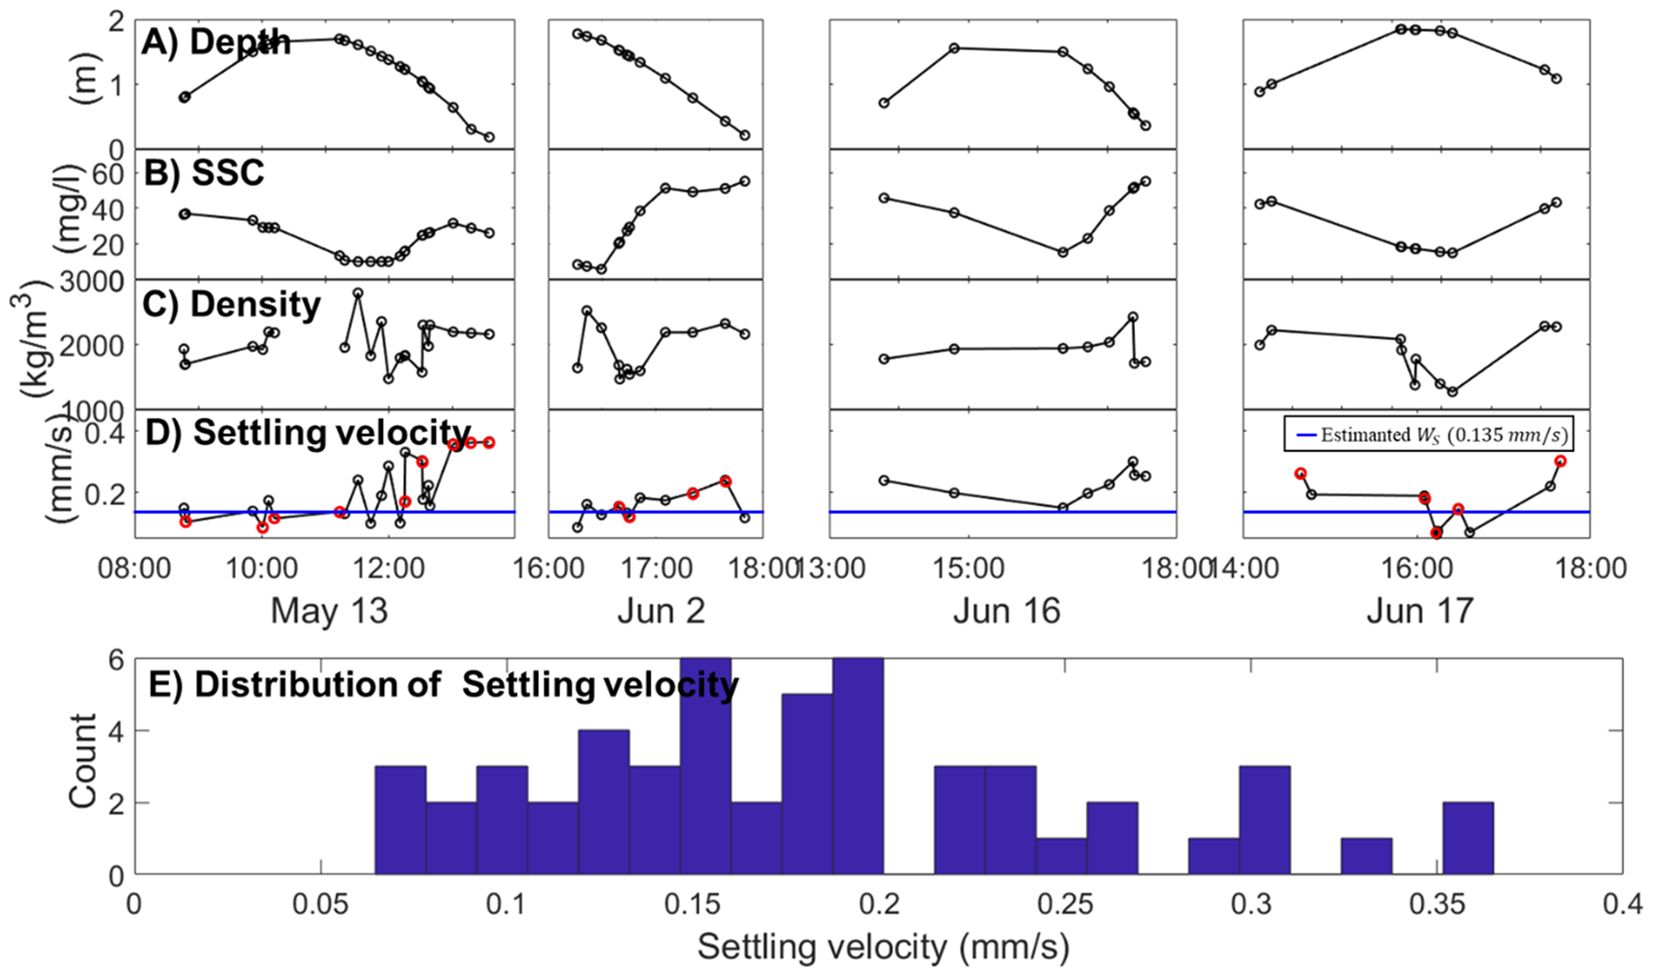
Figure 4. Characteristics of casting survey data. (A) Depth variations during the casting survey acquired from CTD, with circles indicating observation times. (B) Suspended sediment concentration. (C) Changes in floc density acquired from the floc camera system. (D) Changes in settling velocity of suspended sediments acquired using the floc camera system. (E) Distribution of settling velocities over the four casting surveys using the floc camera system. The estimated settling velocity (0.135 mm/s) based on equation (16) was represented by the blue line. The red dots represent the points where floc camera observations overlap with quality-controlled TKE data, used for comparing settling velocities.
A new method presented in Equation 17 was applied to estimate settling velocities, which were validated through comparison with field-observed velocities obtained from a floc camera. Using quality-controlled velocity data, shear stress based on the TKE method was calculated and then substituted into Equation 17 to estimate the settling velocities (ws,IDM_Sed). These estimates were compared with in-situ observations from the floc camera (ws,obs) for 19 samples, where calculated TKE shear stress and observed settling velocities overlapped (Figure 4). For a quantitative evaluation, correlation analysis, histogram-based distribution comparisons, and statistical assessments using box plots were conducted. Additionally, the Root Mean Squared Error (RMSE, Equation 18) and Mean Absolute Percentage Error (MAPE, Equation 19) were calculated to analyze the agreement between the estimated and observed settling velocities.
5 Results
5.1 Flow, SSC and settling velocity
The time-series of observed water depth, current velocity and SSC are shown in Figure 5. Water depth at the measurement station ranged from approximately 3.7 m during spring tide to 1.7 m during neap tide. The average current velocity along the major axis, which flows from the northwest to the southeast, was 0.09 m/s. During ebb tide, the velocity increased to 0.18 m/s, slightly higher than the flood velocity of 0.10 m/s. The minor axis velocity averaged 0.04 m/s, with 0.05 m/s during ebb tide and 0.03 m/s during flood tide. The vertical velocity was an order of magnitude smaller than the horizontal velocities. SSC varied with the tides, peaking at approximately 110 mg/l during spring tide and dropping to a minimum of 12 mg/l during neap tide, with an average SSC of 32 mg/l over the observation period. Overall, both velocity and SSC were significantly influenced by tides, with stronger velocities observed during ebb tide compared to flood tide. The velocity asymmetry is attributable to the artificial channel morphology, where wide tidal flats within the channel facilitate stronger ebb currents (Lee et al., 2024).
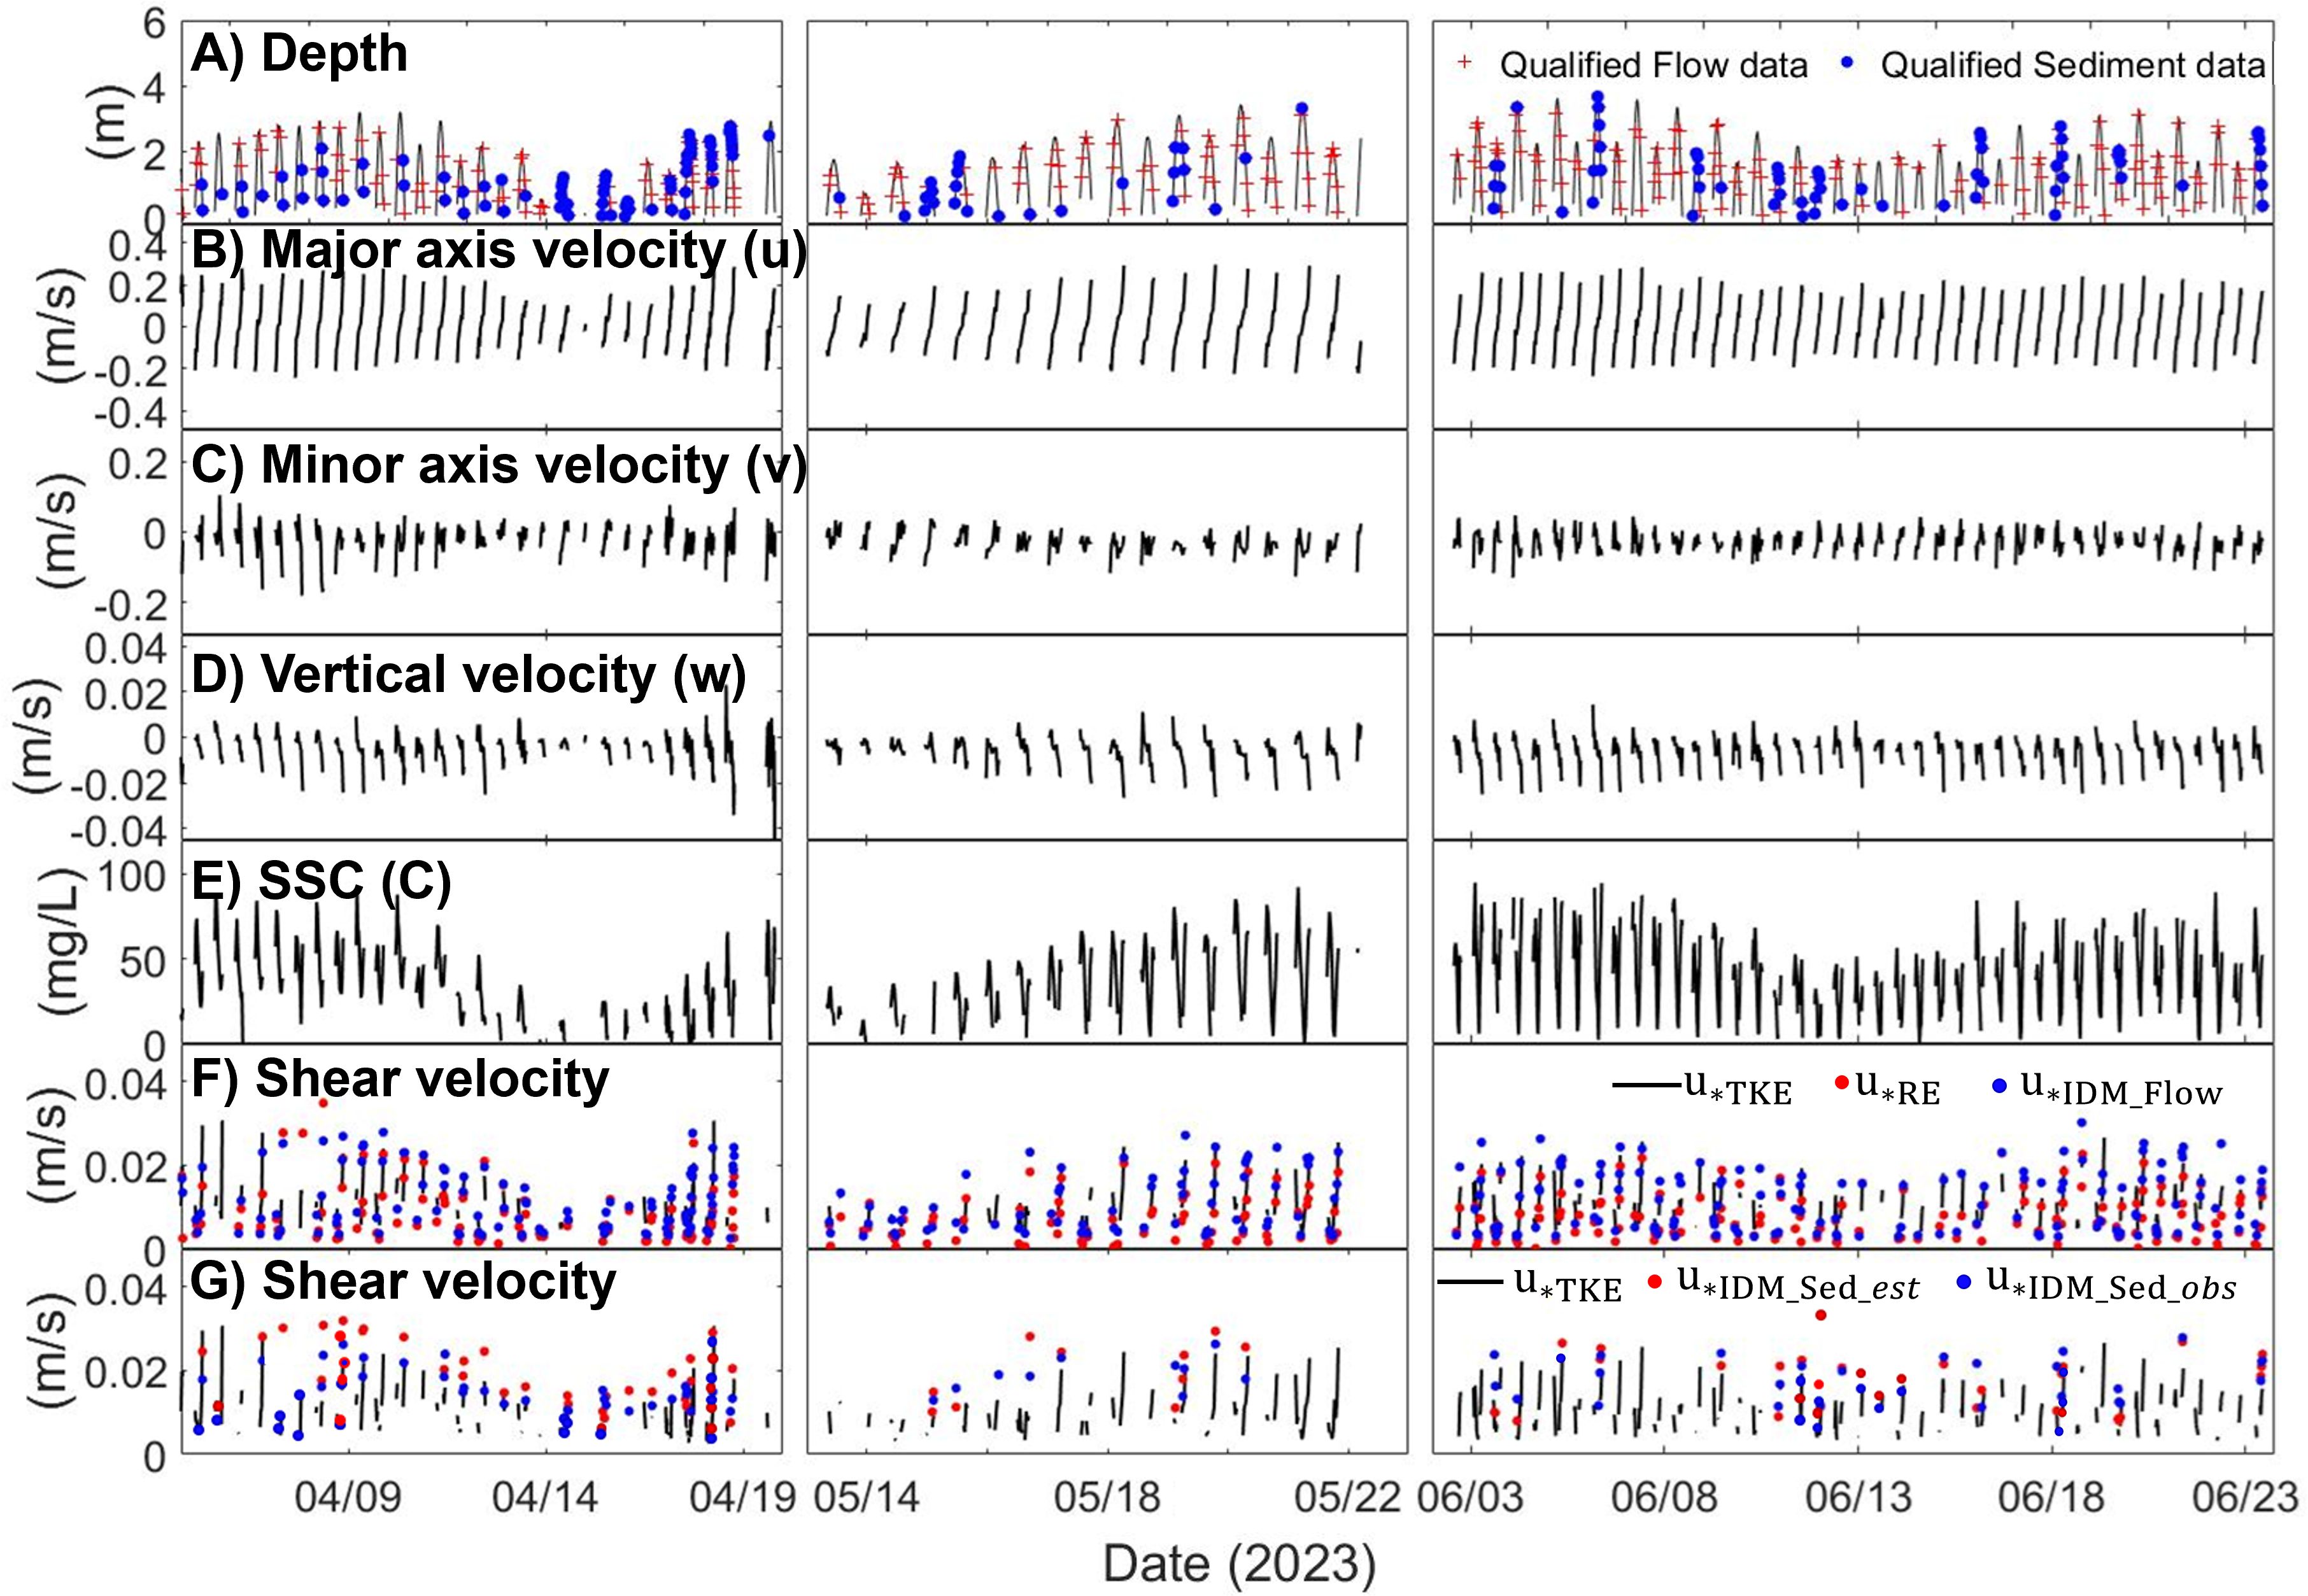
Figure 5. Time series of water depth, current velocity, SSC, and shear velocity. (A) Water depth. Red crosses indicate bursts qualified by IDM_Flow, while blue dots indicate bursts qualified by IDM_Sed. (B) Major axis current velocity. (C) Minor axis current velocity. (D) Vertical velocity. (E) SSC at 45 cm above the seabed, derived from vector amplitude. (F) Shear velocity estimated from current velocity. The black solid line represents shear velocity calculated using the TKE method, red dots represent shear velocity calculated using the Reynolds method, and blue dots represent shear velocity calculated using the IDM_Flow method. (G) Shear velocity calculated from IDM_Sed with ws,est and ws,obs. Shear velocities using TKE (u*TKE) are also shown for comparison.
To evaluate the significance of in-situ sediment properties in IDM_Sed, constant settling velocities were estimated based on the balance between turbulence fluctuations and SSC using Equation 16 and were then compared with observed settling velocities obtained from a floc camera during the casting survey (Figure 4). Figure 2B illustrates this balance, with the settling velocity determined by the slope of the relationship. The analysis shows that as SSC increases, turbulence fluctuations decrease. Using this relationship, the settling velocity was calculated to be 0.135 mm/s. During the casting survey, a total of 25 sets of qualified data for SSC, floc density, and settling velocity were obtained from the floc camera system (Figure 4). The in-situ SSC averaged 37 mg/l, closely matching the overall mean of 32 mg/l observed throughout the study period. Floc density was measured at 1,945 kg/m³, lower than the typical particle density of non-cohesive sediment like sand (2,650 kg/m³). The in-situ settling velocity ranged from 0.06 mm/s to 0.36 mm/s, with an average of 0.197 mm/s, slightly higher than the calculated value of 0.135 mm/s from Equation 16. These in-situ settling velocities were incorporated into IDM_Sed with realistic ws to improve the estimation of bed shear velocity.
5.2 Estimation and comparison of shear velocities
We performed spectrum analysis on the pre-processed vertical velocity and SSC data to investigate the separation of production and dissipation within the inertial subrange. An example of the spectrum density of current velocity and SSC is shown in Figure 3. Among 3012 bursts of preprocessed velocity data, approximately 11% (324 bursts) corresponded to a slope of -5/3, indicating their inclusion within the inertial subrange. The mean slope of the spectra of vertical velocities within the frequency range of 0.3 to 2 Hz is -1.61 ± 0.13 SE (95% standard deviation). For SSC, 125 bursts were validated, yielding a mean slope of -1.59 ± 0.18 SE.
The bed shear velocity, as determined using both the TKE (u*TKE), Reynolds (u*RE), IDM_Flow (u*IDM_Flow), IDM_Sed with constant, estimated (u*IDM_Sed,est), and IDM_Sed with varying observed (u*IDM_Sed,obs) exhibit significant variation influenced by tidal cycles (Figure 5). The shear velocities derived from the current velocity spans similar ranges with averaged value of 0.010 m/s for u*TKE, 0.012 for u*RE, and 0.014 for u*IDM_Flow (Figure 5F). The shear velocity obtained from IDM_Sed which considered concentration and settling velocity showed a smaller value than obtained from the current velocity (Figure 5G). The IDM_Sed with constant settling velocity showed an average of 0.021 m/s, indicating the least accurate results among the methods. On the other hand, the IDM_Sed with varying observed settling velocity has an average of 0.013 m/s which is similar to the results from the shear velocity obtained from the current velocity.
In this study, we compared methods for calculating shear velocity in environments dominated by tides and composed of cohesive sediments. For statistic comparison between the methods, the Reynolds method (u*RE), TKE method (u*TKE), IDM_Flow (u*IDM_Flow), and IDM_Sed methods applying both a constant settling velocity (u*IDM_Sed,est) and varying, observed settling velocities (u*IDM_Sed,obs) were utilized. The commonly used Reynolds stress and TKE methods demonstrated a correlation of 0.90 and an RMSE of 0.0038 m/s. Based on previous studies showing that the TKE method, which incorporates vertical velocity fluctuations, is more accurate than the Reynolds method (Kim et al., 2000), the TKE method was used as a benchmark for comparing the other methods (Figure 6). The shear velocity estimated using the IDM_Flow method showed a correlation of 0.83 (Figure 6B), indicating that it better captured the temporal variations in shear velocity compared to the Reynolds method (Figure 6A). However, it exhibited a slightly increased RMSE of 0.0035 m/s. The comparison between shear velocities estimated using the observed realistic settling velocity of cohesive sediments and a constant settling velocity in the IDM_Sed method is presented in Figures 6C, D. Despite using more data points, the shear velocity estimated with a constant settling velocity (R=0.77, RMSE=0.0059 m/s) was less accurate than that estimated by the IDM_Flow method (R=0.83, RMSE=0.0035 m/s) (Figure 6C). However, when the varying, observed settling velocity was applied, the accuracy of the IDM_Sed (R=0.80, RMSE=0.0045 m/s) was similar to that of the IDM_Flow method (Figure 6D).
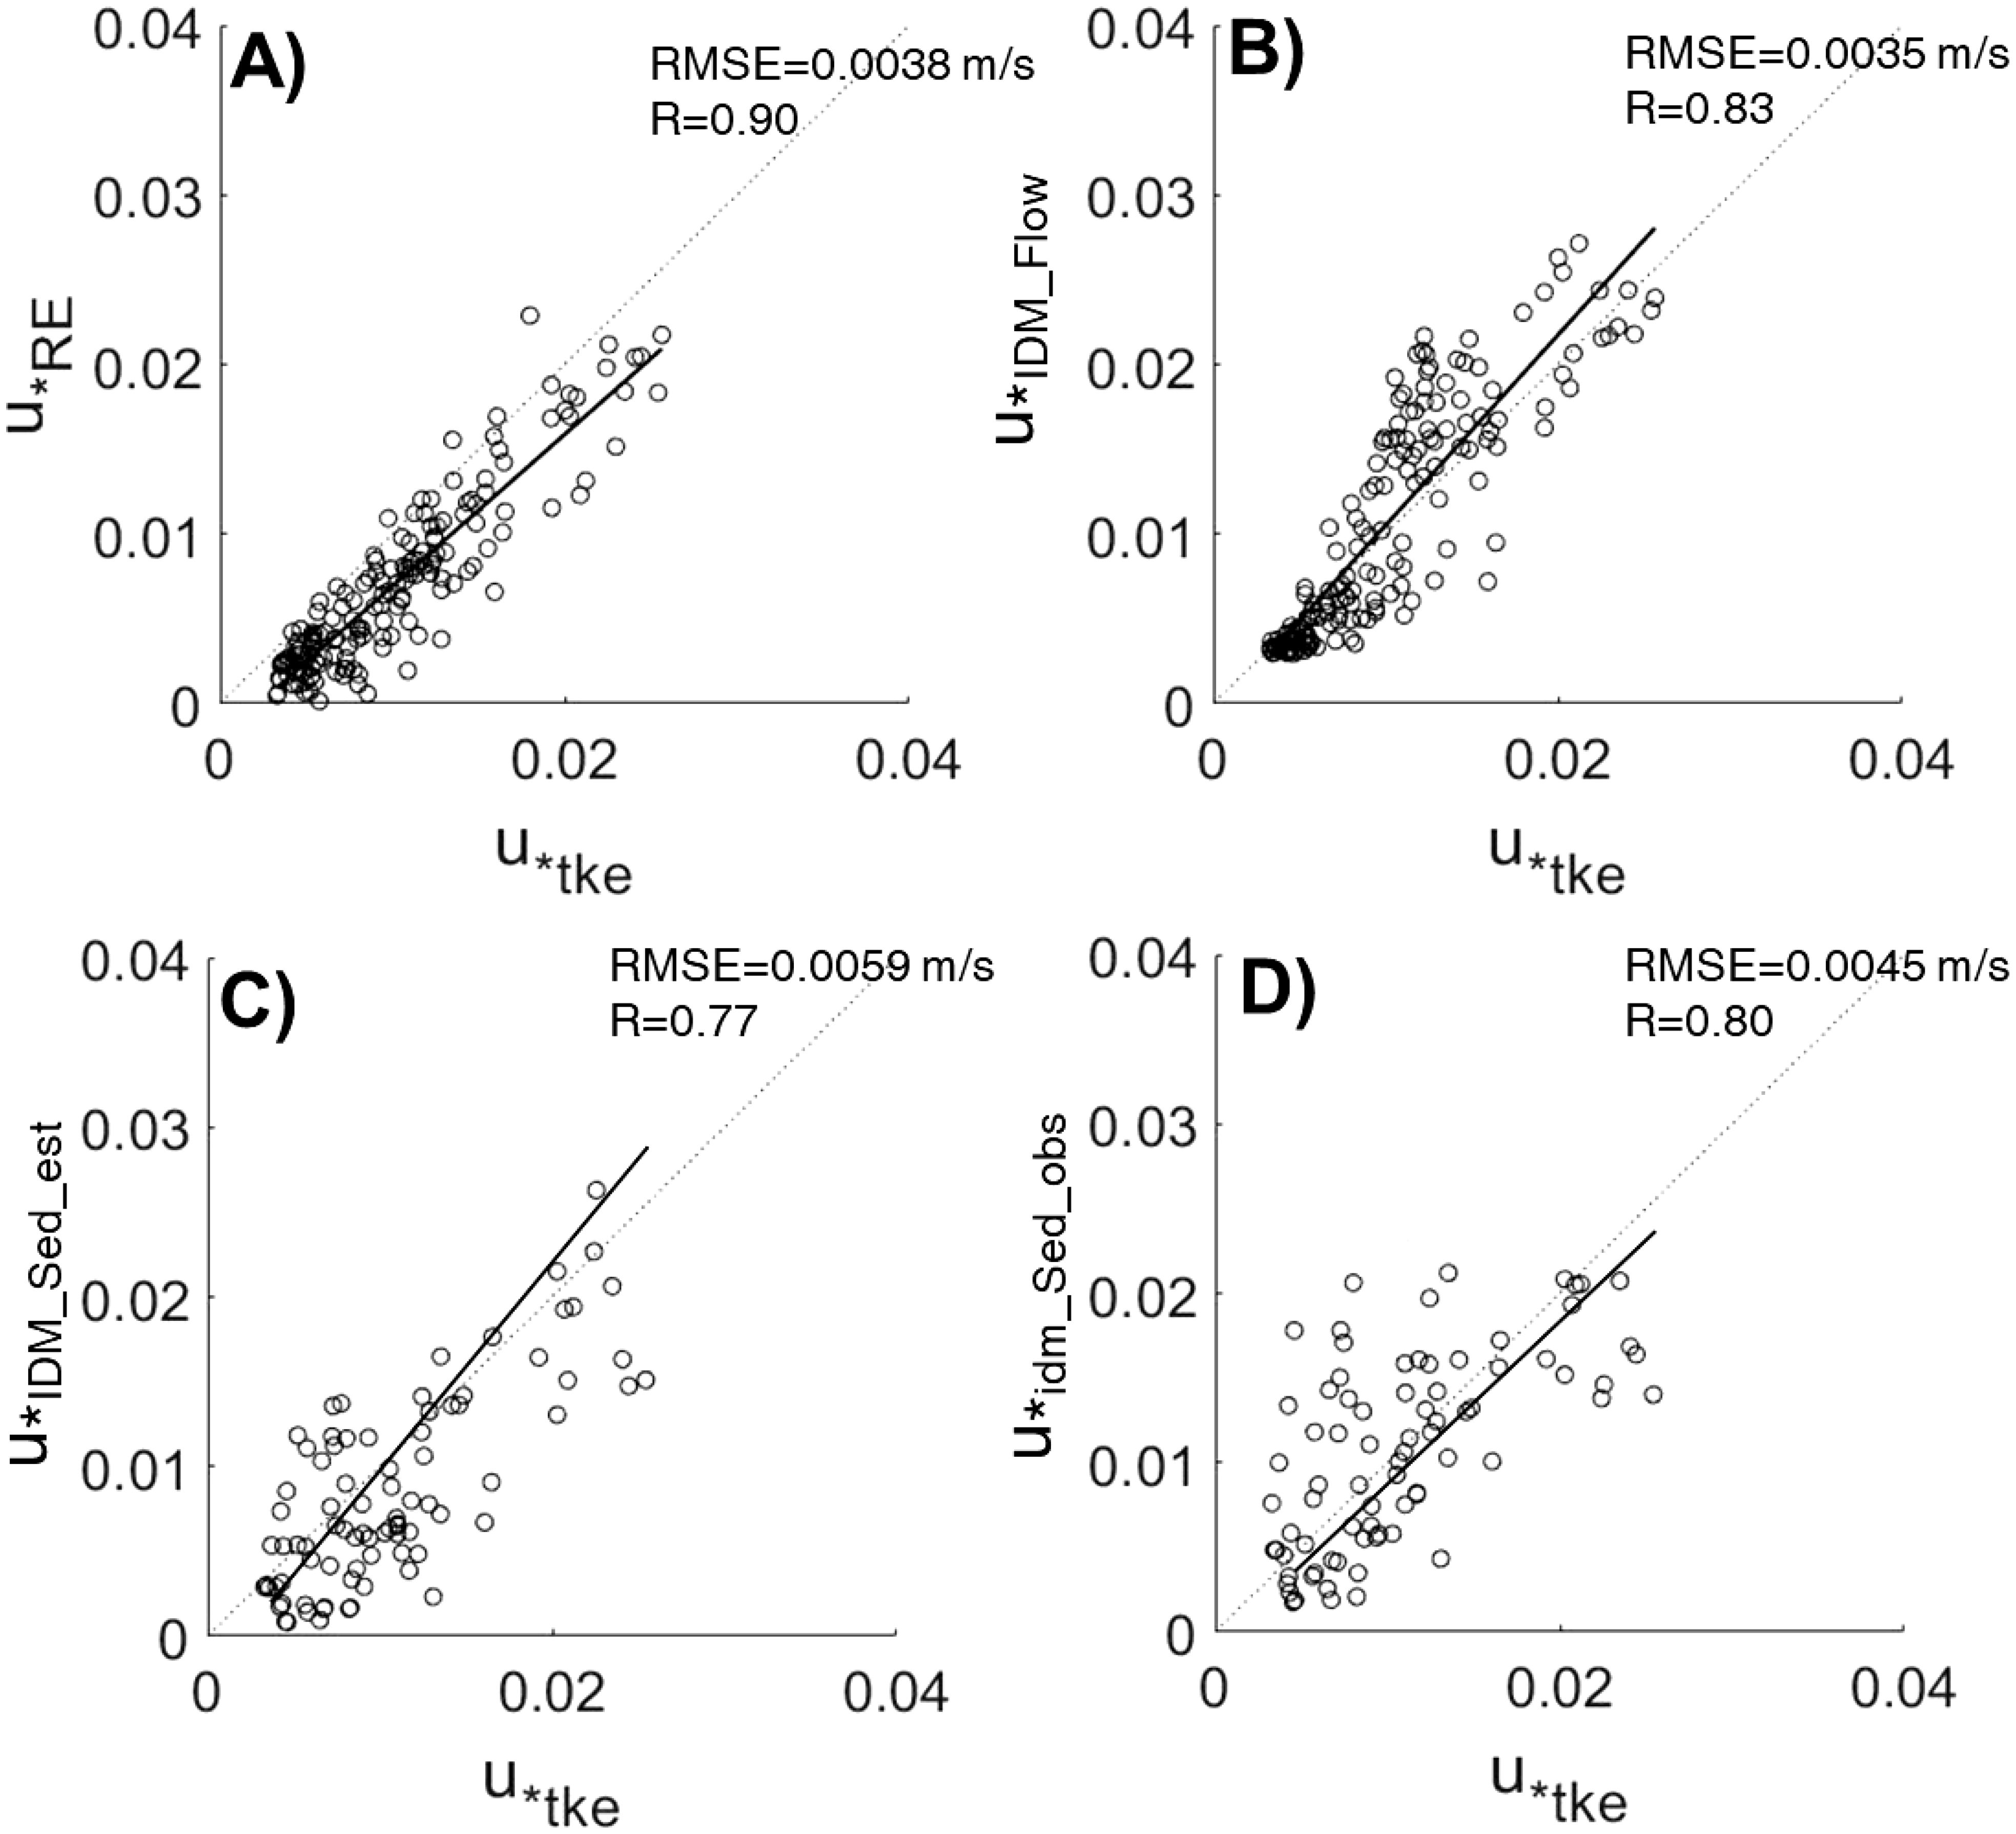
Figure 6. One to one comparison of shear velocity estimates. (A) Shear velocities estimated by the Reynolds stress () against those estimated by the TKE method (). (B) Shear velocities estimated by the inertial dissipation method for flow () against those estimated by the TKE method (). (C) Shear velocities estimated by the inertial dissipation method from SSC with estimated ws () against those estimated by the TKE method (). (D) Shear velocities estimated by the inertial dissipation method from SSC with observed ws () against those estimated by the TKE method (). Root mean squared errors and correlation coefficients are included for comparison. The black dashed line represents the one-to-one line, and the black solid line represents the regression line.
6 Discussion
6.1 Importance of settling velocity
Estimating shear stress is crucial for understanding sediment dynamics, and numerous methods have been developed to calculate it (Soulsby, 1983; Huntley, 1988; Shih et al., 1995). Different methods have been compared based on available equipment and environmental conditions (Kim et al., 2000), with attempts to incorporate sediment concentration and settling velocity into the Inertial Dissipation Method (IDM) (Lee et al., 2003). While previous studies have explored shear stress calculations in various energy environments (Bowden et al., 1959; Soulsby et al., 1993; Nielsen and Callaghan, 2003), they have often neglected specific sedimentary environments, focusing predominantly on non-cohesive sediments (Lee et al., 2003). Due to the difficulty of directly observing settling velocity, a single, static settling velocity has frequently been used for shear stress calculations. However, in cohesive sediment environments, settling velocity varies over time and exhibits diverse characteristics (Winterwerp, 1998; Ha and Maa, 2010). This study underscores the importance of incorporating observed in-situ settling velocities into the IDM for accurate shear stress estimation.
Figure 6 shows that shear velocity estimates based on a constant, static settling velocity are less accurate compared to those obtained using IDM, which relies on flow velocity data. This suggests that using inaccurately estimated or incorrect settling velocities in cohesive sediment environments compromises the reliability of shear velocity estimates. To improve accuracy, it is crucial to use time-varying settling velocities. This is further illustrated in Figure 7, where shear velocity estimates using a constant settling velocity are lower than those from IDM_TKE and IDM_Sed with realistic ws, which use in-situ observed velocities. This discrepancy arises because the constant settling velocity (0.135 mm/s) underestimates the time-varying velocities observed in the results. Conversely, IDM_Sed with realistic ws, which incorporates observed settling velocities, aligns more closely with IDM_TKE, reflecting both the changes in shear velocity with flow velocity and the effects of time-varying settling velocities and suspended sediment concentrations. Significant differences are observed during flood and ebb tides when current velocities are higher, affecting turbulence and cohesive sediment characteristics.
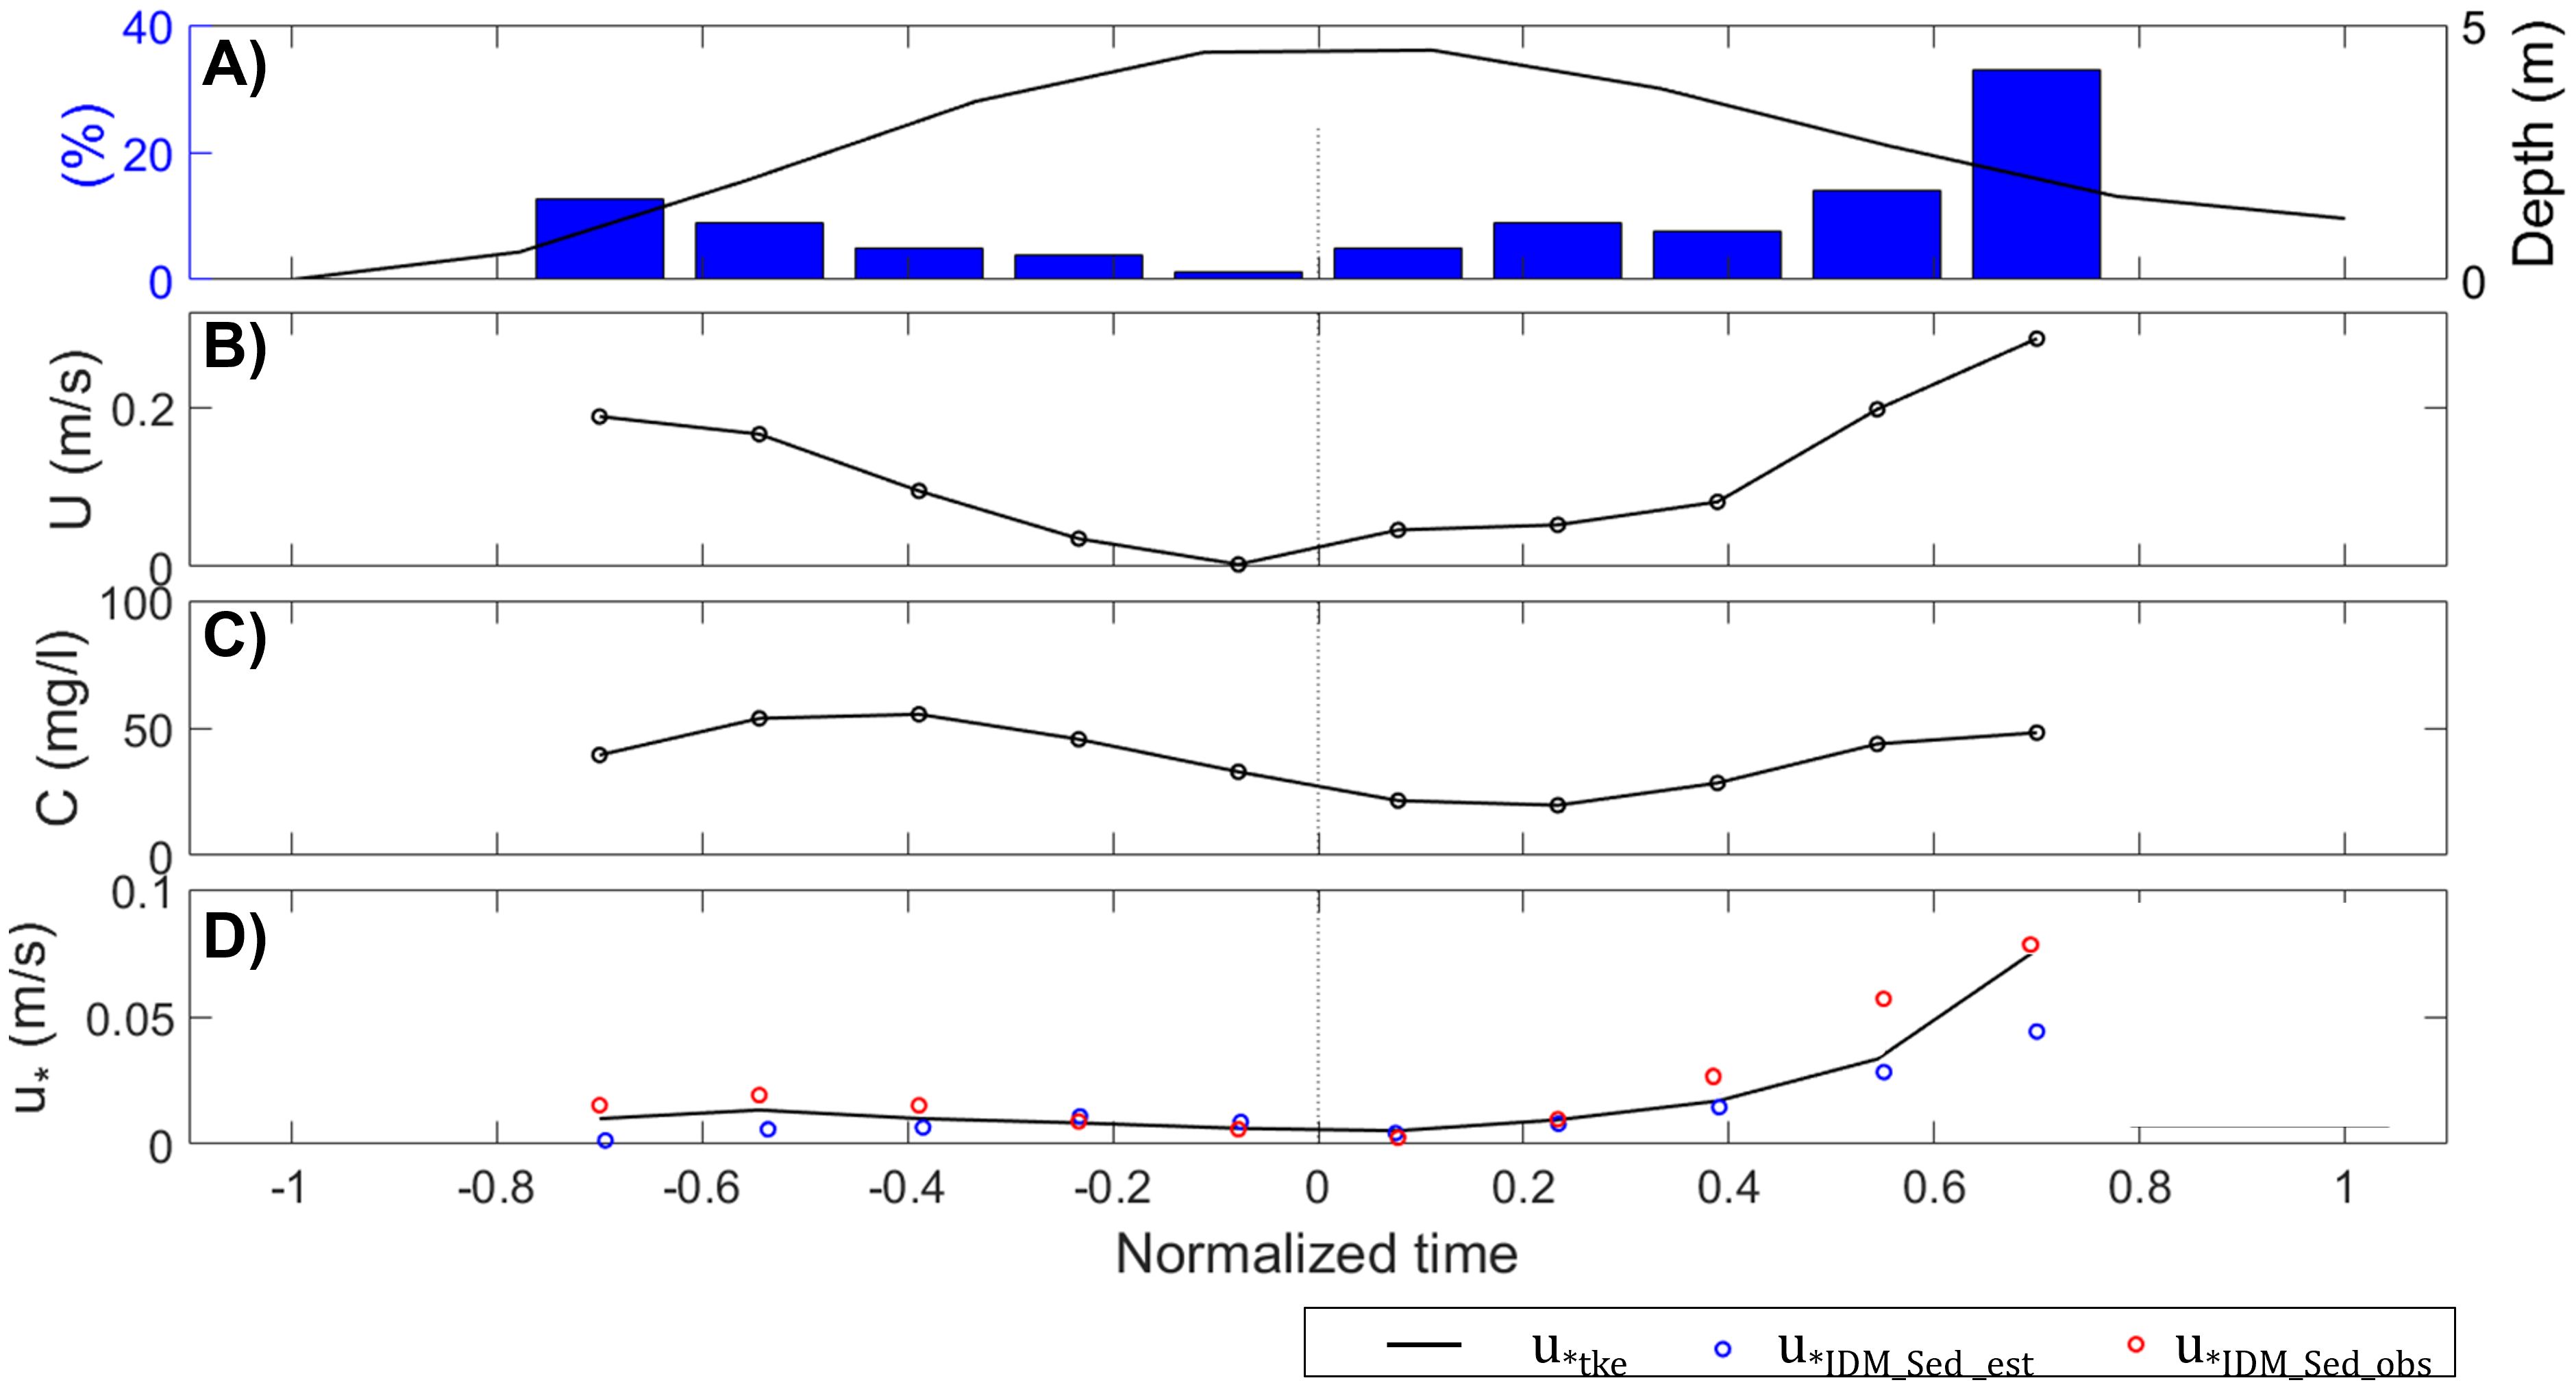
Figure 7. (A) Tidal phase-averaged water depth and percentage of shear velocity. (B) Tidal phase-averaged current velocity in the major axis. (C) Tidal phase-averaged SSC. (D) Tidal phase-averaged shear velocity; Black line – u*TKE; Blue – u*IDM_Sed,est; Red – u*IDM_Sed,obs. Negative normalized time represents flood tide, positive normalized time represents ebb tide, and 0 indicates high tide slack.
The improved results from using in-situ observed settling velocities highlight the importance of capturing turbulence effects on bed shear stress. Additionally, the in-situ observed settling velocity strongly reflects the turbulent characteristics of that setting. Settling velocity is influenced by turbulence and its associated small-scale interactions, as demonstrated in various studies. Weak turbulence can increase the settling velocity of heavy particles, with this effect becoming more pronounced as the turbulent Reynolds number rises due to enhanced interactions with small turbulent scales (Wang et al., 2018). In estuarine environments, both velocity gradients and suspended sediment concentration (SSC) significantly impact the equilibrium settling velocity of cohesive particles. When both velocity gradient and SSC are simultaneously considered, the explanatory power for settling velocity improves significantly, highlighting the combined influence of these factors on settling dynamics (Pejrup and Mikkelsen, 2010). For cohesive sediments, turbulence can significantly increase settling velocity, but excessive turbulent shear stress (>0.14 Pa) can disrupt flocs and reduce it (Ha and Maa, 2010). Thus, incorporating in-situ observed settling velocities into the IDM is crucial for more accurate bed shear stress estimation.
6.2 Development of a new method for estimating settling velocity
Despite the significance of observed in-situ settling velocities in cohesive sediment dynamics, their application has been limited due to the challenges of observation. Direct measurement of time-varying settling velocity requires specialized equipment (Smith and Friedrichs, 2011; 2015; Shen and Maa, 2016) or extensive laboratory experiments (van Leussen, 1999). This study proposes a new method for estimating time-varying settling velocity by leveraging the similarities between IDM using observed settling velocities and other shear stress calculation methods (Equation 17).
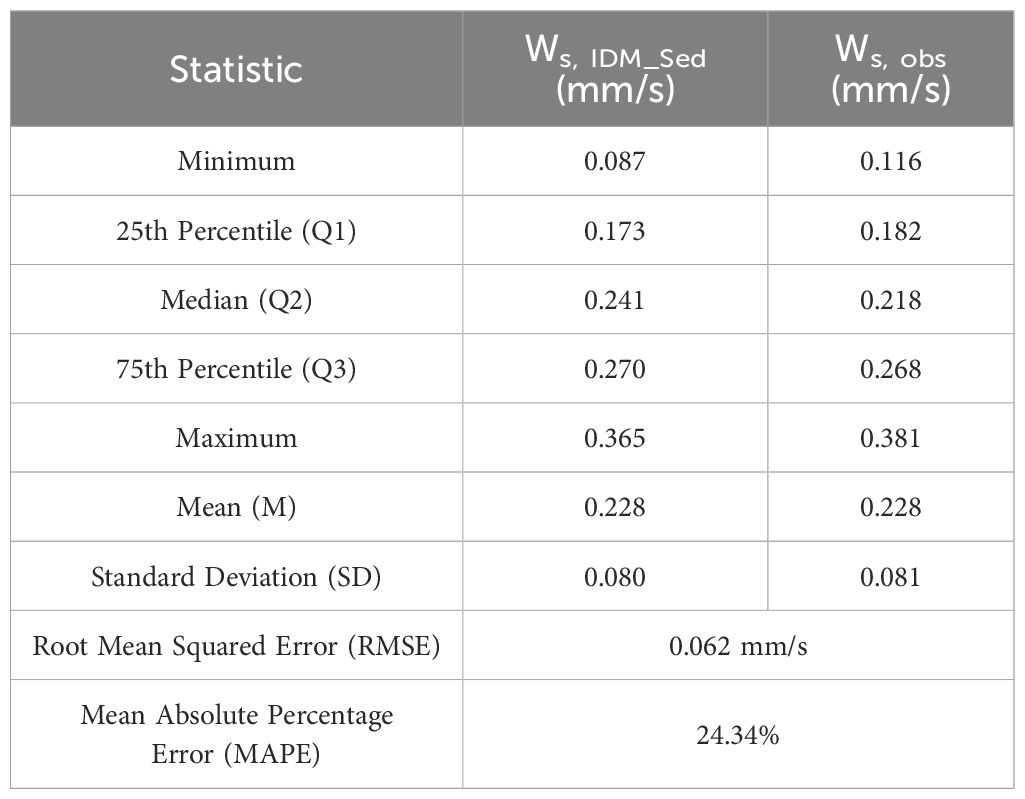
Using the new method, shear stress calculated by the TKE method was substituted into Equation 17 to estimate settling velocities, which were then compared with field-observed velocities from a floc camera (Figure 8). The estimated settling velocities ranged from 0.05 mm/s to 0.38 mm/s, closely matching the field-observed range of 0.07 mm/s to 0.37 mm/s. The histogram shows that the frequency distributions of the observed (ws,obs) and estimated (ws,IDM_Sed) settling velocities align closely across most velocity intervals, indicating similar patterns in data occurrence (Figure 8E). Additionally, the box plot further supports this, with comparable median values and interquartile ranges, suggesting that both datasets share a similar central tendency and spread (Figure 8F) (Table 2). Furthermore, the Root Mean Squared Error (RMSE) of 0.0625 and Mean Absolute Percentage Error (MAPE) of 24.34% quantitatively demonstrate the close match between the observed and estimated settling velocities (Table 2). The correlation coefficient of 0.697 also indicates that the new method effectively captures temporal variations in settling velocities. This similarity in statistics and distribution suggests that the new method successfully replicates the natural variability observed in the field data.
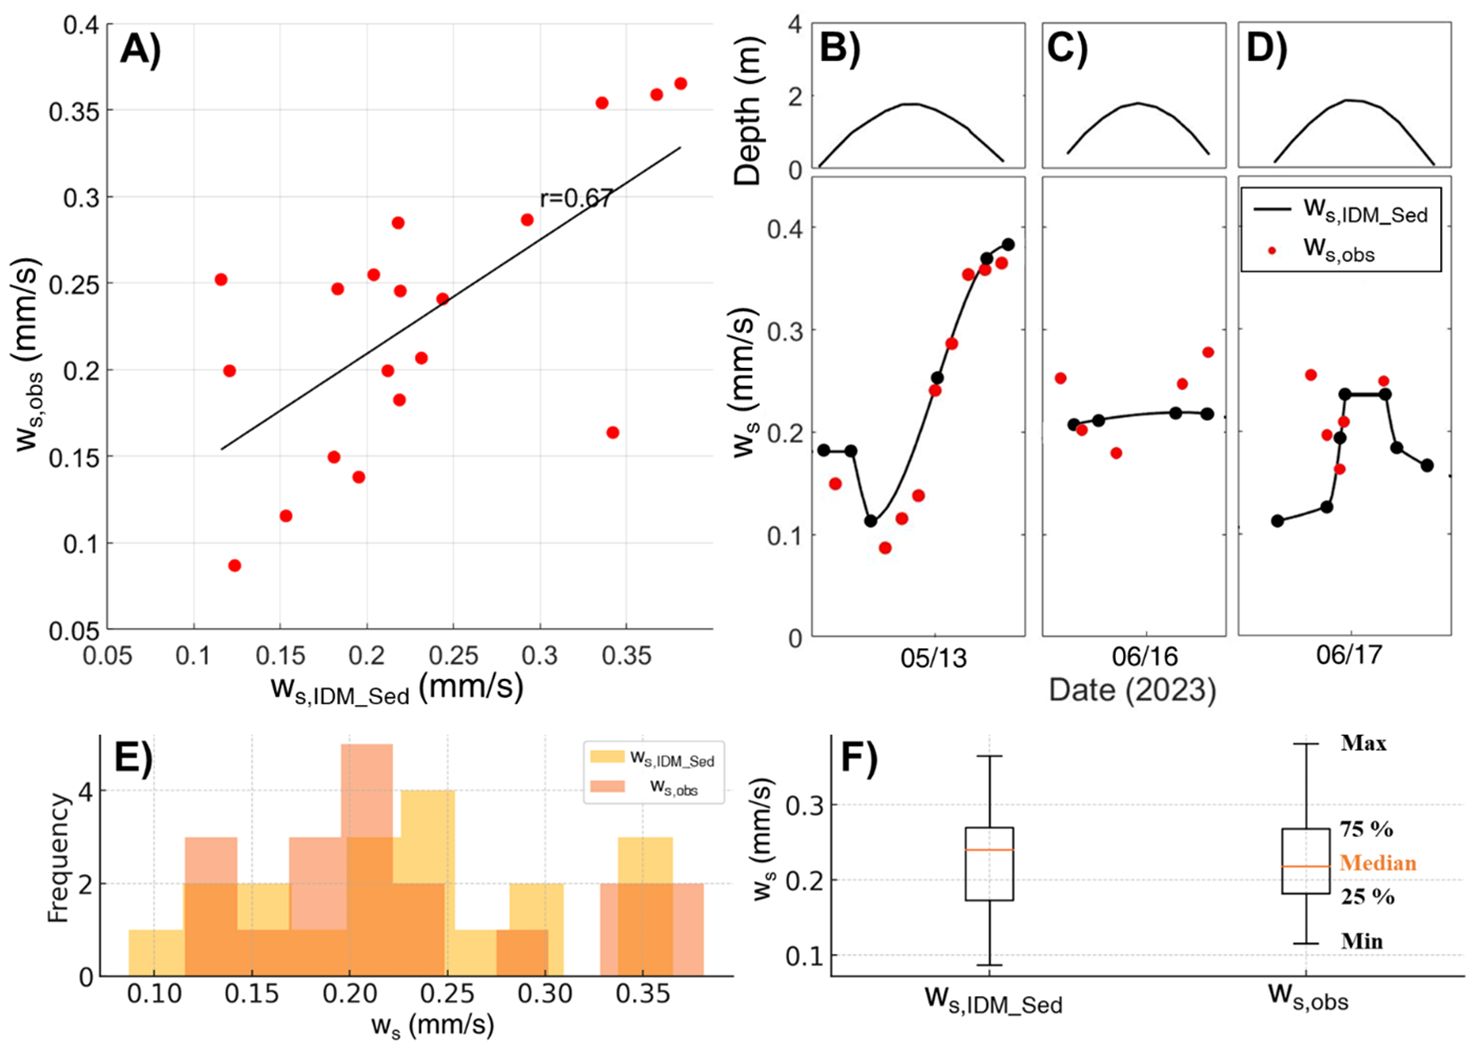
Figure 8. Comparison of settling velocities obtained from direct observations (ws,obs) and calculated using a new method (ws,IDM_Sed). (A) One to one comparison. (B-D) Time series comparison of ws,obs and ws,IDM_Sed. The correlation coefficient is shown on A). (E) Histogram displaying the frequency distributions of direct observations (ws,obs) and calculated using a new method (ws,IDM_Sed). (F) Box plot comparing the distribution of ws,obs and ws,IDM_Sed.
This method contributes to more accurate estimation of time-varying settling velocity for cohesive sediments, addressing a gap in previous studies. The findings demonstrate a clear relationship between turbulence intensity and the settling velocity of cohesive sediments, where settling velocity remains stable in low turbulence but significantly increases under moderate turbulence due to enhanced floc formation (Winterwerp, 1998; Dyer and Manning, 1999). This observation aligns well with laboratory findings, showing that weak turbulence supports stable sedimentation, while moderate turbulence promotes aggregation and accelerates settling rates. The improved estimation by this method is due to IDM_Sed’s ability to account for turbulence dissipation within the inertial subrange (Huntley, 1988; Lee et al., 2003). This approach integrates the impact of shear stress on settling velocity and the influence of turbulence dissipation, aligning with previous studies (Partheniades, 1993; Winterwerp, 2002). Furthermore, the new method for calculating time-varying settling velocity, combined with previous research that investigated the relationship between turbulence and settling velocity based on the size of cohesive sediments (Yuan et al., 2008), contributes to understanding the temporal relationship between cohesive sediment size, settling velocity, and turbulence. Thus, this new method provides an efficient and reasonable estimation of time-varying settling velocity with minimal observations. It will be valuable for future research on cohesive sediments and turbulence, as it will contribute to a better understanding of the characteristics of cohesive sediments.
6.3 Future studies for the IDM_Sed method in cohesive sediment environments
This study utilized the IDM with SSC to estimate bed shear stress in cohesive sediment environments, highlighting the crucial role of accurate settling velocity. However, several limitations and areas for further research have been identified. One key limitation of the IDM is its reliance on stable flow conditions for accurate application. While the study area, shielded from significant wave events, proved suitable for this method, environments with substantial wave impacts or shallow depths characterized by flow instability or high turbulence may produce erroneous bed shear stress estimates (Grant, 1978; Soulsby and Clarke, 2005).
Previous research has explored modified IDM approaches to address wave-current interactions, considering the periodicity and variability in time and space (Huntley, 1988). One straightforward method involves using observed or empirically derived wave periodicity to segment each wave cycle and compute averages, thereby eliminating wave-induced fluctuations (Trowbridge and Elgar, 2001). Additionally, techniques such as wavelet transform or spectral analysis can extract dominant wave frequencies from the environment, enabling the removal of specific frequencies and mitigating wave influence on turbulence (Grant and Madsen, 1979; Soulsby, 1983). Furthermore, modeling vertical turbulent eddy diffusivity at wave-current boundaries using IDM characteristics based on turbulence energy distribution has also been explored (Lee et al., 2003). Due to the study area’s lack of wave influence, this research could not assess the impact of waves on IDM when using observed realistic settling velocity. Future studies should investigate the applicability of this method in environments where waves and currents interact.
Methods for calculating shear stress using turbulence, including the Inertial Dissipation Method (IDM), have inherent limitations when applied to slow flow velocities. This is due to the reduced turbulence intensity in such conditions, which makes accurate measurements and calculations more challenging. As a continuation of this, another limitation is related to the tidal cycle; while the IDM is suitable during flood and ebb tides, it is less effective during slack tides when current velocities are weak and turbulence is minimal. Figure 7A shows that most qualified data were collected during flood and ebb tides, with limited data available during slack tides for shear stress calculations. Previous research has applied eddy diffusivity profiles in weak current environments using combined wave-current shear velocities (Lee et al., 2003). Future research should address shear stress estimation in low-energy environments with weak currents, variable cohesive sediment conditions, and restricted wave influence.
This study’s limitations, stemming from observations conducted at a single location, underscore the need for further research to generalize the findings and broaden our understanding of hydrodynamic processes. To extend these findings and improve our understanding of broader hydrodynamic phenomena, it would be beneficial to integrate insights from similar environments through prior studies, allowing for a more comprehensive analysis of local characteristics and variability. Furthermore, additional research on the floc properties in this region is essential, as these characteristics significantly impact sediment settling velocity and bed shear stress calculations. Given that this study site is a tidally dominated, semi-enclosed, human-modified channel, its specific environmental conditions may limit the broader applicability of the findings. Therefore, future studies should apply the same methodology across diverse hydrodynamic and sedimentary settings to validate its reliability and accuracy. By analyzing the relationships between various environmental factors and bed shear stress in different contexts, this research approach could be generalized, providing valuable insights into shear stress estimation in varied environmental conditions.
7 Conclusion
The goal of this study was to improve the accuracy of shear velocity estimation using SSC and to evaluate the performance of IDM in cohesive sediment environments. The following key conclusions were drawn:
1. To assess the performance of IDM_Sed in cohesive sediment environments, we compared it with the Reynold stress and IDM_Flow methods, using shear velocity calculated by the TKE method as a reference. The results showed that IDM_Flow outperformed the Reynold stress method in estimating shear velocity. IDM_Sed performed similarly to IDM_Flow but demonstrated improved accuracy by reflecting changes in both flow velocity and variations in suspended sediment concentration and settling velocity in cohesive environments.
2. To highlight the significance of using in-situ observed settling velocities, we calculated shear velocity using both constant and temporally varying observed settling velocities. The findings indicated that using a constant settling velocity could lead to overestimation or underestimation of shear velocity due to discrepancies with the actual settling velocity. Constant settling velocities failed to adequately reflect changes in sediment characteristics within cohesive sediment environments. Conversely, using temporally varying settling velocities accurately captured these changes and produced more reliable results. This underscores the importance of utilizing observed data when applying IDM in environments influenced by varying flow velocity and SSC.
3. Despite the critical role of in-situ observed settling velocities, estimating temporally varying settling velocity remains challenging due to observational and methodological limitations. The IDM method, which incorporates suspended sediment and in-situ observed settling velocities, has shown improved shear stress estimation. This study presents a novel approach for deriving temporally varying settling velocities. The calculated settling velocities using IDM_Sed not only fell within a similar range as data from simultaneous observations but also accurately reflected trends. These results suggest that by calculating time-varying settling velocity through shear velocity derived from TKE or velocity spectra, we can enhance our understanding of cohesive sediment behavior in such environments.
Data availability statement
The raw data supporting the conclusions of this article will be made available by the authors, without undue reservation.
Author contributions
JC: Conceptualization, Data curation, Formal analysis, Investigation, Methodology, Validation, Visualization, Writing – original draft. G-HL: Conceptualization, Data curation, Funding acquisition, Investigation, Project administration, Supervision, Validation, Writing – review & editing. OA: Data curation, Investigation, Methodology, Validation, Writing – review & editing. WL: Data curation, Investigation, Mehodology, Validation, Writing – review & editing.
Funding
The author(s) declare financial support was received for the research, authorship, and/or publication of this article. This research was supported by the Basic Science Research Program (2017R1D1A1B05033162) through the National Research Foundation of Korea (NRF), and also by the Ministry of Oceans and Fisheries of Korea under the project titled “Establishment of the Ocean Research Station in the Jurisdiction Zone and Convergence Research (20210607)”.
Conflict of interest
The authors declare that the research was conducted in the absence of any commercial or financial relationships that could be construed as a potential conflict of interest.
Publisher’s note
All claims expressed in this article are solely those of the authors and do not necessarily represent those of their affiliated organizations, or those of the publisher, the editors and the reviewers. Any product that may be evaluated in this article, or claim that may be made by its manufacturer, is not guaranteed or endorsed by the publisher.
References
Biron P. M., Robson C., Lapointe M. F., Gaskin S. J. (2004). Comparing different methods of bed shear stress estimates in simple and complex flow fields. Earth Surface. Processes. Landforms.: J. Br. Geomorphol. Res. Group. 29, 1403–1415. doi: 10.1002/esp.1111
Boudreau B. P., Jørgensen B. B. (2001). The benthic boundary layer: Transport processes and biogeochemistry (Oxford, United Kingdom: Oxford University Press).
Bowden K. F., Fairbairn L. A., Hughes P. (1959). The distribution of shearing stresses in a tidal current. Geophys. J. Int. 2, 288–305. doi: 10.1111/j.1365-246X.1959.tb05801.x
Dyer K. R., Manning A. J. (1999). Observation of the size, settling velocity, effective density of flocs, and their fractal dimensions. J. Sea. Res. 41, 87–95. doi: 10.1016/S1385-1101(98)00036-7
Fornari W., Picano F., Brandt L. (2016). Sedimentation of finite-size spheres in quiescent and turbulent environments. J. Fluid. Mechanics. 788, 640–669. doi: 10.1017/jfm.2015.698
Fugate D., Friedrichs C. (2002). Determining concentration and fall velocity of estuarine particle populations using ADV, OBS, and LISST. Continental. Shelf. Res. 22, 1867–1886. doi: 10.1016/S0278-4343(02)00043-2
Gargett A. E. (1989). Ocean turbulence. Annu. Rev. Fluid. Mechanics. 21, 419–451. doi: 10.1146/annurev.fl.21.010189.002223
Grant W. D., Madsen O. S. (1979). Combined wave and current interaction with a rough bottom. J. Geophys. Res.: Oceans. 84, 1797–1808. doi: 10.1029/JC084iC04p01797
Grant W. D., Madsen O. S. (1986). The continental-shelf bottom boundary layer. Annu. Rev. Fluid. Mechanics. 18, 265–305. doi: 10.1146/annurev.fl.18.010186.001405
Grant W. D., Williams A. J. III, Glenn S. M. (1984). Bottom stress estimates and their prediction on the Northern California Continental Shelf during CODE-1: The importance of wave-current interaction. J. Phys. Oceanogr. 14, 506–527. doi: 10.1175/1520-0485(1984)014<0506>2.0.CO;2
Green M. O. (1992). Spectral estimates of bed stress at subcritical Reynolds numbers in a tidal boundary layer. J. Phys. Oceanogr. 22, 903–917. doi: 10.1175/1520-0485(1992)022<0903:SEOBSS>2.0.CO;2
Ha H. K., Maa J. P. Y. (2010). Effects of suspended sediment concentration and turbulence on settling velocity of cohesive sediment. Geosci. J. 14, 163–171. doi: 10.1007/s12303-010-0016-2
Huntley D. A. (1988). A modified inertial dissipation method for estimating seabed stresses at low Reynolds numbers, with application to wave/current boundary layer measurements. J. Phys. Oceanogr. 18, 339–346. doi: 10.1175/1520-0485(1988)018<0339>2.0.CO;2
Kim S.-C., Friedrichs C. T., Maa J. P.-Y., Wright L. D. (2000). Estimating bottom stress in tidal boundary layer from Acoustic Doppler Velocimeter data. J. Hydraulic. Eng. 126, 399–406. doi: 10.1061/(ASCE)0733-9429(2000)126:6(399)
Krone R. B. (1962). Flume studies of transport of sediment in estuarial shoaling processes (Berkeley, California, USA: Hydraulics and Sanitary Engineering Research Laboratory, University of California).
Lacy J. R., Sherwood C. R. (2004). Accuracy of vertical velocity profiles and fluxes measured with an upward-looking ADCP. J. Atmospheric. Oceanic. Technol. 21, 279–287. doi: 10.1175/1520-0426(2004)021<1448:AOAPAD>2.0.CO;2
Launder B. E., Reece G. J., Rodi W. (1975). Progress in the development of a Reynolds-stress turbulence closure. J. Fluid. Mechanics. 68, 537–566. doi: 10.1017/S0022112075001814
Lee G., Chang J., Li W., Ajama O. D. (2024). Spatial variation of asymmetry in velocity and sediment flux along the artificial aam tidal channel. Water 16, 2323. doi: 10.3390/w16162323
Lee G., Dade W. B., Friedrichs C. T., Vincent C. E. (2003). Spectral estimates of bed shear stress using suspended-sediment concentrations in a wave-current boundary layer. J. Geophys. Res.: Oceans. 108, C7. doi: 10.1029/2001JC001279
Lee G., Kang K. (2018). Wave-induced maintenance of suspended sediment concentration during slack in a tidal channel on a sheltered macro-tidal flat, Ganghwa Island, Korea. Ocean. Sci. J. 53, 583–594. doi: 10.1007/s12601-018-0020-4
Lee G., Shin H. J., Kim Y. T., Dellapenna T. M., Kim K. J., Williams J., et al. (2019). Field investigation of siltation at a tidal harbor: North Port of Incheon, Korea. Ocean. Dynamics. 69, 1101–1120. doi: 10.1007/s10236-019-01292-0
Maa J. Y., Kwon J. I. (2007). Using ADV for cohesive sediment settling velocity measurements. Estuarine. Coast. Shelf. Sci. 73, 351–354. doi: 10.1016/j.ecss.2007.01.008
Mehta A. J. (1989). On estuarine cohesive sediment suspension behavior. J. Geophys. Res.: Oceans. 94, 14303–14314. doi: 10.1029/JC094iC10p14303
Nelson J. M., Shreve R. L., McLean S. R., Drake T. G. (1995). Role of near-bed turbulence structure in bed load transport and bed form mechanics. Water Resour. Res. 31, 2071–2086. doi: 10.1029/95WR00976
Nielsen P., Callaghan D. P. (2003). Shear stress and sediment transport calculations for sheet flow under waves. Coast. Eng. 47, 347–354. doi: 10.1016/S0378-3839(02)00141-2
Partheniades E. (1993). “Turbulence, flocculation and cohesive sediment dynamics,” in Nearshore and estuarine cohesive sediment transport (Amsterdam, Netherlands: Elsevier), 40–59.
Pejrup M., Mikkelsen O. A. (2010). Factors controlling the field settling velocity of cohesive sediment in estuaries. Estuarine. Coast. Shelf. Sci. 87, 177–185. doi: 10.1016/j.ecss.2009.09.028
Pope N. D., Widdows J., Brinsley M. D. (2006). Estimation of bed shear stress using the turbulent kinetic energy approach—A comparison of annular flume and field data. Continental. Shelf. Res. 26, 959–970. doi: 10.1016/j.csr.2006.02.010
Sharples J., Moore C. M., Abraham E. R. (2001). Internal tide dissipation, mixing, and vertical nitrate flux at the shelf edge of NE New Zealand. J. Geophys. Res.: Oceans. 106, 14069–14082. doi: 10.1029/2000JC000604
She K., Trim L., Pope D. (2005). Fall velocities of natural sediment particles: A simple mathematical presentation of the fall velocity law. J. Hydraulic. Res. 43, 189–195. doi: 10.1080/00221686.2005.9641235
Shen X., Maa J. P. Y. (2016). Numerical simulations of particle size distributions: Comparison with analytical solutions and kaolinite flocculation experiments. Mar. Geol. 379, 84–99. doi: 10.1016/j.margeo.2016.05.014
Shih T. H., Zhu J., Lumley J. L. (1995). A new Reynolds stress algebraic equation model. Comput. Methods Appl. Mechanics. Eng. 125, 287–302. doi: 10.1016/0045-7825(95)00796-4
Shin H. J., Lee G., Kang K. R., Park K. (2019). Shift of estuarine type in altered estuaries. Anthropocene. Coasts. 2, 145–170. doi: 10.1139/anc-2018-0013
Smith S. J., Friedrichs C. T. (2011). Size and settling velocities of cohesive flocs and suspended sediment aggregates in a trailing suction hopper dredge plume. Continental. Shelf. Res. 31, S50–S63. doi: 10.1016/j.csr.2010.04.002
Smith S. J., Friedrichs C. T. (2015). Image processing methods for in situ estimation of cohesive sediment floc size, settling velocity, and density. Limnol. Oceanogr.: Methods 13, 250–264. doi: 10.1002/lom3.10022
Soulsby R. L. (1983). “The bottom boundary layer of shelf seas,” in Elsevier oceanography series, vol. 35. (Amsterdam, Netherlands: Elsevier), 189–266.
Soulsby R. L., Clarke S. (2005). Bed shear-stresses under combined waves and currents on smooth and rough beds (Wallingford, Oxfordshire, United Kingdom: HR Wallingford Ltd).
Soulsby R. L., Hamm L., Klopman G., Myrhaug D., Simons R. R., Thomas G. P. (1993). Wave-current interaction within and outside the bottom boundary layer. Coast. Eng. 21, 41–69. doi: 10.1016/0378-3839(93)90045-A
Soulsby R. L., Salkield A. P., Le Good G. P. (1984). Measurements of the turbulence characteristics of sand suspended by a tidal current. Continental. Shelf. Res. 3, 439–454. doi: 10.1016/0278-4343(84)90021-9
Stacey M. T., Monismith S. G., Burau J. R. (1999). Measurements of Reynolds stress profiles in unstratified tidal flow. J. Geophys. Res.: Oceans. 104, 10933–10949. doi: 10.1029/1998JC900095
Stapleton K. R., Huntley D. A. (1995). Seabed stress determinations using the inertial dissipation method and the turbulent kinetic energy method. Earth Surface. Processes. Landforms. 20, 807–815. doi: 10.1002/esp.3290200906
Syvitski J. P., Asprey K. W., Leblanc K. W. G. (1995). In-situ characteristics of particles settling within a deep-water estuary. Deep. Sea. Res. Part II.: Topical. Stud. Oceanogr. 42, 223–256. doi: 10.1016/0967-0645(95)00013-G
Tennekes H., Lumley J. L. (1972). A first course in turbulence (Cambridge, Massachusetts, USA: MIT Press).
Trowbridge J., Elgar S. (2001). Turbulence measurements in the surf zone. J. Phys. Oceanogr. 31, 2403–2417. doi: 10.1175/1520-0485(2001)031<2403:TMITSZ>2.0.CO;2
van Leussen W. (1988). “Aggregation of particles, settling velocity of mud flocs: A review,” in Physical processes in estuaries (Berlin and Heidelberg, Germany: Springer), 347–403.
van Leussen W. (1994). Estuarine Macroflocs and their role in fine-grained sediment transport (Utrecht, Netherlands: University of Utrecht).
van Leussen W. (1999). The variability of settling velocities of suspended fine-grained sediment in the Ems estuary. J. Sea. Res. 41, 109–118. doi: 10.1016/S1385-1101(98)00046-X
Wang Y., Lam K. M., Lu Y. (2018). Settling velocity of fine heavy particles in turbulent open channel flow. Phys. Fluids. 30, 095106. doi: 10.1063/1.5046333
Winterwerp J. C. (1998). A simple model for turbulence-induced flocculation of cohesive sediment. J. Hydraulic. Res. 36, 309–326. doi: 10.1080/00221689809498621
Winterwerp J. C. (2002). On the flocculation and settling velocity of estuarine mud. Continental. Shelf. Res. 22, 1339–1360. doi: 10.1016/S0278-4343(02)00010-9
You Z. J. (2004). The effect of suspended sediment concentration on the settling velocity of cohesive sediment in quiescent water. Ocean. Eng. 31, 1955–1965. doi: 10.1016/j.oceaneng.2004.05.005
Keywords: bed shear stress, settling velocity, inertial dissipation method, suspended sediment concentration, cohesive sediment
Citation: Chang J, Lee G-h, Ajama OD and Li W (2024) Estimation of bed shear stress and settling velocity with inertial dissipation method of suspended sediment concentration in cohesive sediment environments. Front. Mar. Sci. 11:1475565. doi: 10.3389/fmars.2024.1475565
Received: 04 August 2024; Accepted: 03 December 2024;
Published: 19 December 2024.
Edited by:
Haosheng Huang, Louisiana State University, United StatesReviewed by:
Jorge A. Penaloza-Giraldo, Oak Ridge National Laboratory (DOE), United StatesLuís Portela, National Laboratory for Civil Engineering, Portugal
Copyright © 2024 Chang, Lee, Ajama and Li. This is an open-access article distributed under the terms of the Creative Commons Attribution License (CC BY). The use, distribution or reproduction in other forums is permitted, provided the original author(s) and the copyright owner(s) are credited and that the original publication in this journal is cited, in accordance with accepted academic practice. No use, distribution or reproduction is permitted which does not comply with these terms.
*Correspondence: Guan-hong Lee, Z2hsZWVAaW5oYS5hYy5rcg==
 Jongwi Chang
 Guan-hong Lee
 Ojudoo Darius Ajama
 Wenjian Li