- 1College of Civil Engineering, Fuzhou University, Fuzhou, China
- 2College of Harbour, Coastal and Offshore Engineering, Hohai University, Nanjing, China
- 3Laboratory of Ocean and Coast Geology, Third Institute of Oceanography, Ministry of Natural Resources, Xiamen, China
- 4Fujian Lugang (Group) Co. Ltd., Quanzhou, China
Forecasting typhoon waves during typhoons is crucial. In this paper, the numerical wave model SWAN was enhanced through integration with two machine learning methods: the Back Propagation Neural Network and Random Forest. This integration facilitated the development of two distinct models, namely SWAN-BP and SWAN-Tree. Through correlation analysis, key input features were identified for the machine learning models. The forecasts from the SWAN model were subsequently utilized as inputs to enhance further wave prediction. These hybrid models were validated using data from Typhoon Doksuri (2023) and Typhoon Nesat (2017). The results indicated significant improvements in predicting typhoon-induced wave heights with both the SWAN-BP and SWAN-Tree models compared to the original SWAN model. Specifically, the SWAN-BP model demonstrated a 33% improvement in accuracy for the Typhoon Doksuri, whereas the SWAN-Tree model exhibited a 24% improvement. For Typhoon Nesat, the accuracy improvements were 23% for the SWAN-BP model and 21% for the SWAN-Tree model. These findings demonstrate that integrating wave numerical models with machine learning techniques can significantly enhance the predictive accuracy of numerical models. This approach offers a cost-effective means to improve the existing wave forecasting database. Traditionally, the direct use of meteorological and oceanographic data for typhoon wave prediction might be compromised by biases inherent in the numerical wave models. However, the SWAN-BP and SWAN-Tree models effectively reduce these biases, thereby providing more accurate and robust predictions. In conclusion, this paper enhances the predictive accuracy of the SWAN model and establishes a crucial foundation for more precise typhoon wave forecasting through the application of machine learning techniques.
1 Introduction
Marine hazards, especially catastrophic waves, storm surges, sea ice, and tsunamis, pose a great threat to coastal countries around the globe, and China, as one of the countries most affected by these natural hazards, faces increasing risks (Hou et al., 2020). These risks are further amplified with the intensification of economic construction in coastal areas. Catastrophic waves, particularly those caused by typhoons, cold air, and cyclones, and most notably typhoon waves, have a profound impact on human life and activities due to their immense destructive power. Waves exert a substantial influence on offshore structures. Effective scour protection methods around monopile foundations are crucial in studying wave dynamics and their impact on these structures. Tang et al. (2023) investigated the efficacy of collars as local scour countermeasures, providing valuable insights into their performance under various flow intensities. Therefore, accurately understanding and predicting typhoon wave patterns is crucial. Currently, the forecasting of typhoon waves is mainly done by numerical wave models. Three popular models are SWAN (Booij et al., 1999), WAVE-WATCH III (Tolman, 1991), and WAM (Willemsen, 1997).
Numerical wave models are a common method for predicting typhoon waves today. Booij et al. (1999) analyzed and validated wave distribution in the German and Dutch seas using the first-generation SWAN model. In their study, they found that the RMSE of the SWAN simulations was about 10%, a result that validates the reliability of the SWAN model in predicting wind, swell, and mixed waves. The SWAN model provides reliable simulations in various ocean environments, and its accuracy can be improved by adjusting the model parameters. This applicability extends to both deep-sea and shallow-sea areas (Ortiz-Royero and Mercado-Irizarry, 2008; Afzal and Kumar, 2022; Majidi et al., 2023). Wornom et al. (Wornom et al., 2001, 2002a) employed SWAN and WAM nested models to analyze and simulate Typhoon Luis in 1995, verifying the effectiveness of the SWAN wave model. However, they also highlighted that the current version of the SWAN model is inefficient in parallel operation. To address this issue, Wornom et al. (2002b) implemented an MPI interface to enable parallel computation, significantly enhancing the computational speed of the SWAN model. Additionally, Ou et al. (2002) demonstrated that using a nested grid scheme improves the accuracy of nearshore water simulations by employing the SWAN model to simulate waves in the Taiwan sea area. Feng and Chen (2021); Umesh and Behera (2021), and Li et al. (2023) obtained similar results based on the ERA5 and ERA-Interim reanalysis of the wind field, confirming that ERA5 significantly outperforms ERA-Interim in typhoon simulation, although it may underestimate wind speeds overall. Additionally, a study by Gao and Zheng (2018) demonstrated that using CCMP as the driving wind field for the SWAN model can achieve higher accuracy. Considering the significant influence of wind speed input on the results of SWAN simulations of typhoon waves (Akpinar and Ponce de León, 2016), Li et al. (2021) simulated typhoon waves off the coast of Zhejiang using the reanalysis wind fields ERA5 and CCMP. They found that the simulation results from ERA5 outperformed those from CCMP. Due to the low wind speeds in the available wind field data, Ma and Wei (2024) investigated the impact of various combinations of maximum wind radius and Holland B parameters on the simulated wave heights in SWAN, using the wind field model proposed by Holland. These studies employed a numerical wave model to thoroughly analyze the wave characteristics of the region and explored the main factors influencing wave forecasts with the aim of achieving more accurate predictions.
In recent years, the emergence of machine learning and deep learning techniques has sparked significant advancements in various fields. In marine science, deep learning models have demonstrated their ability to predict effective wave heights with high accuracy by utilizing multiple layers of neurons to model complex nonlinear relationships (Malekmohamadi et al., 2011). Rizianiza and Aisjah (2015) employed backpropagation neural networks to predict wave heights in the Java Sea, achieving mean results with root mean square errors of 0.06 m and 0.07 m. James et al. (2018) developed a machine learning framework for wave height prediction. Additionally, Shamshirband et al. (2020) and Luo et al. (2023) investigated the effectiveness of multiple machine learning methods for wave height prediction, using the output from numerical models as input data for the machine learning models. Gong et al. (2022) proposed a hybrid model that combines a multi-layer perceptron with a genetic expression programming model. This model performs well in predicting significant wave heights. All of the aforementioned studies primarily used the results of numerical models as inputs to machine learning models for single-point, short-term wave prediction. This approach can introduce bias due to errors inherent in the simulation results themselves (Londhe and Panchang, 2018). The wave field is essentially a dynamic two-dimensional field, and its prediction challenge lies not only in handling time-series data but also in addressing complexities in the spatial dimension. In wave prediction, predicting wave height at a single point involves extracting relevant information from the entire wave field and considering the influence of surrounding points on the predicted point. Addressing this issue, Zhang et al. (2024) utilized a Convolutional Neural Network (CNN) to extract wind and wave feature information from various locations in the study area. They also considered the influence of other points on the predicted point and developed a CNN-LSTM model to more comprehensively account for dynamic changes in both space and time. Despite the progress made by the CNN-LSTM model in capturing spatial features, the inherent bias of the numerical model may still affect the prediction results of the machine learning model. To address the issue of inaccurate machine learning wave forecasting databases, this study proposes integrating BP neural networks and random forests with the SWAN model, resulting in the SWAN-BP and SWAN-Tree models. This integrated approach aims to optimize the output of the SWAN numerical model using the powerful capabilities of machine learning, thereby reducing biases caused by numerical simulation errors. It offers a cost-effective method to improve the existing wave forecasting database.
It's crucial to note that this optimization approach using machine learning should be considered only after other methods to enhance the physical model have been explored without yielding significant improvements. For instance, Hoque et al. (2020) implemented nested grids in the Canadian Beaufort Sea, accounting for bottom friction and nonlinear ternary interactions within the SWAN model. Despite these adjustments, they did not observe substantial enhancements in model performance. This context underscores the importance of turning to machine learning techniques as a last resort, particularly when traditional methods fail to deliver the desired improvements in accuracy and reliability.
The remainder of the paper is organized as follows: Section 2 focuses on the study area, detailing the typhoon and buoy information used, the construction of the synthetic wind field, and the configuration of the model employed. Section 3 presents the validation of the wind speed and the SWAN model. Section 4 focuses on the comparative analysis of the results using various machine learning models. Section 5 summarizes the conclusions drawn from the previous sections.
2 Materials and methods
2.1 Study area, typhoons, and Buoy data
In this paper, Typhoons Doksuri (2023) and Nesat (2017) were selected for model validation due to their significant impacts. Typhoon Doksuri made landfall along the Fujian Province coast on July 28, 2023, with maximum winds at landfall reaching 50 m/s, classifying it as a strong typhoon. It also recorded a minimum central pressure of 945 hPa. Typhoon Nesat made its initial landfall on the eastern coast of Taiwan Province on July 29, 2017, followed by a subsequent landfall on the Fujian coast on July 30, with maximum winds of 33 m/s at landfall and a minimum central pressure of 975 hPa. The trajectories of these two typhoons are shown in Figure 1, offering a visual representation of their paths and the areas impacted by their landfalls.
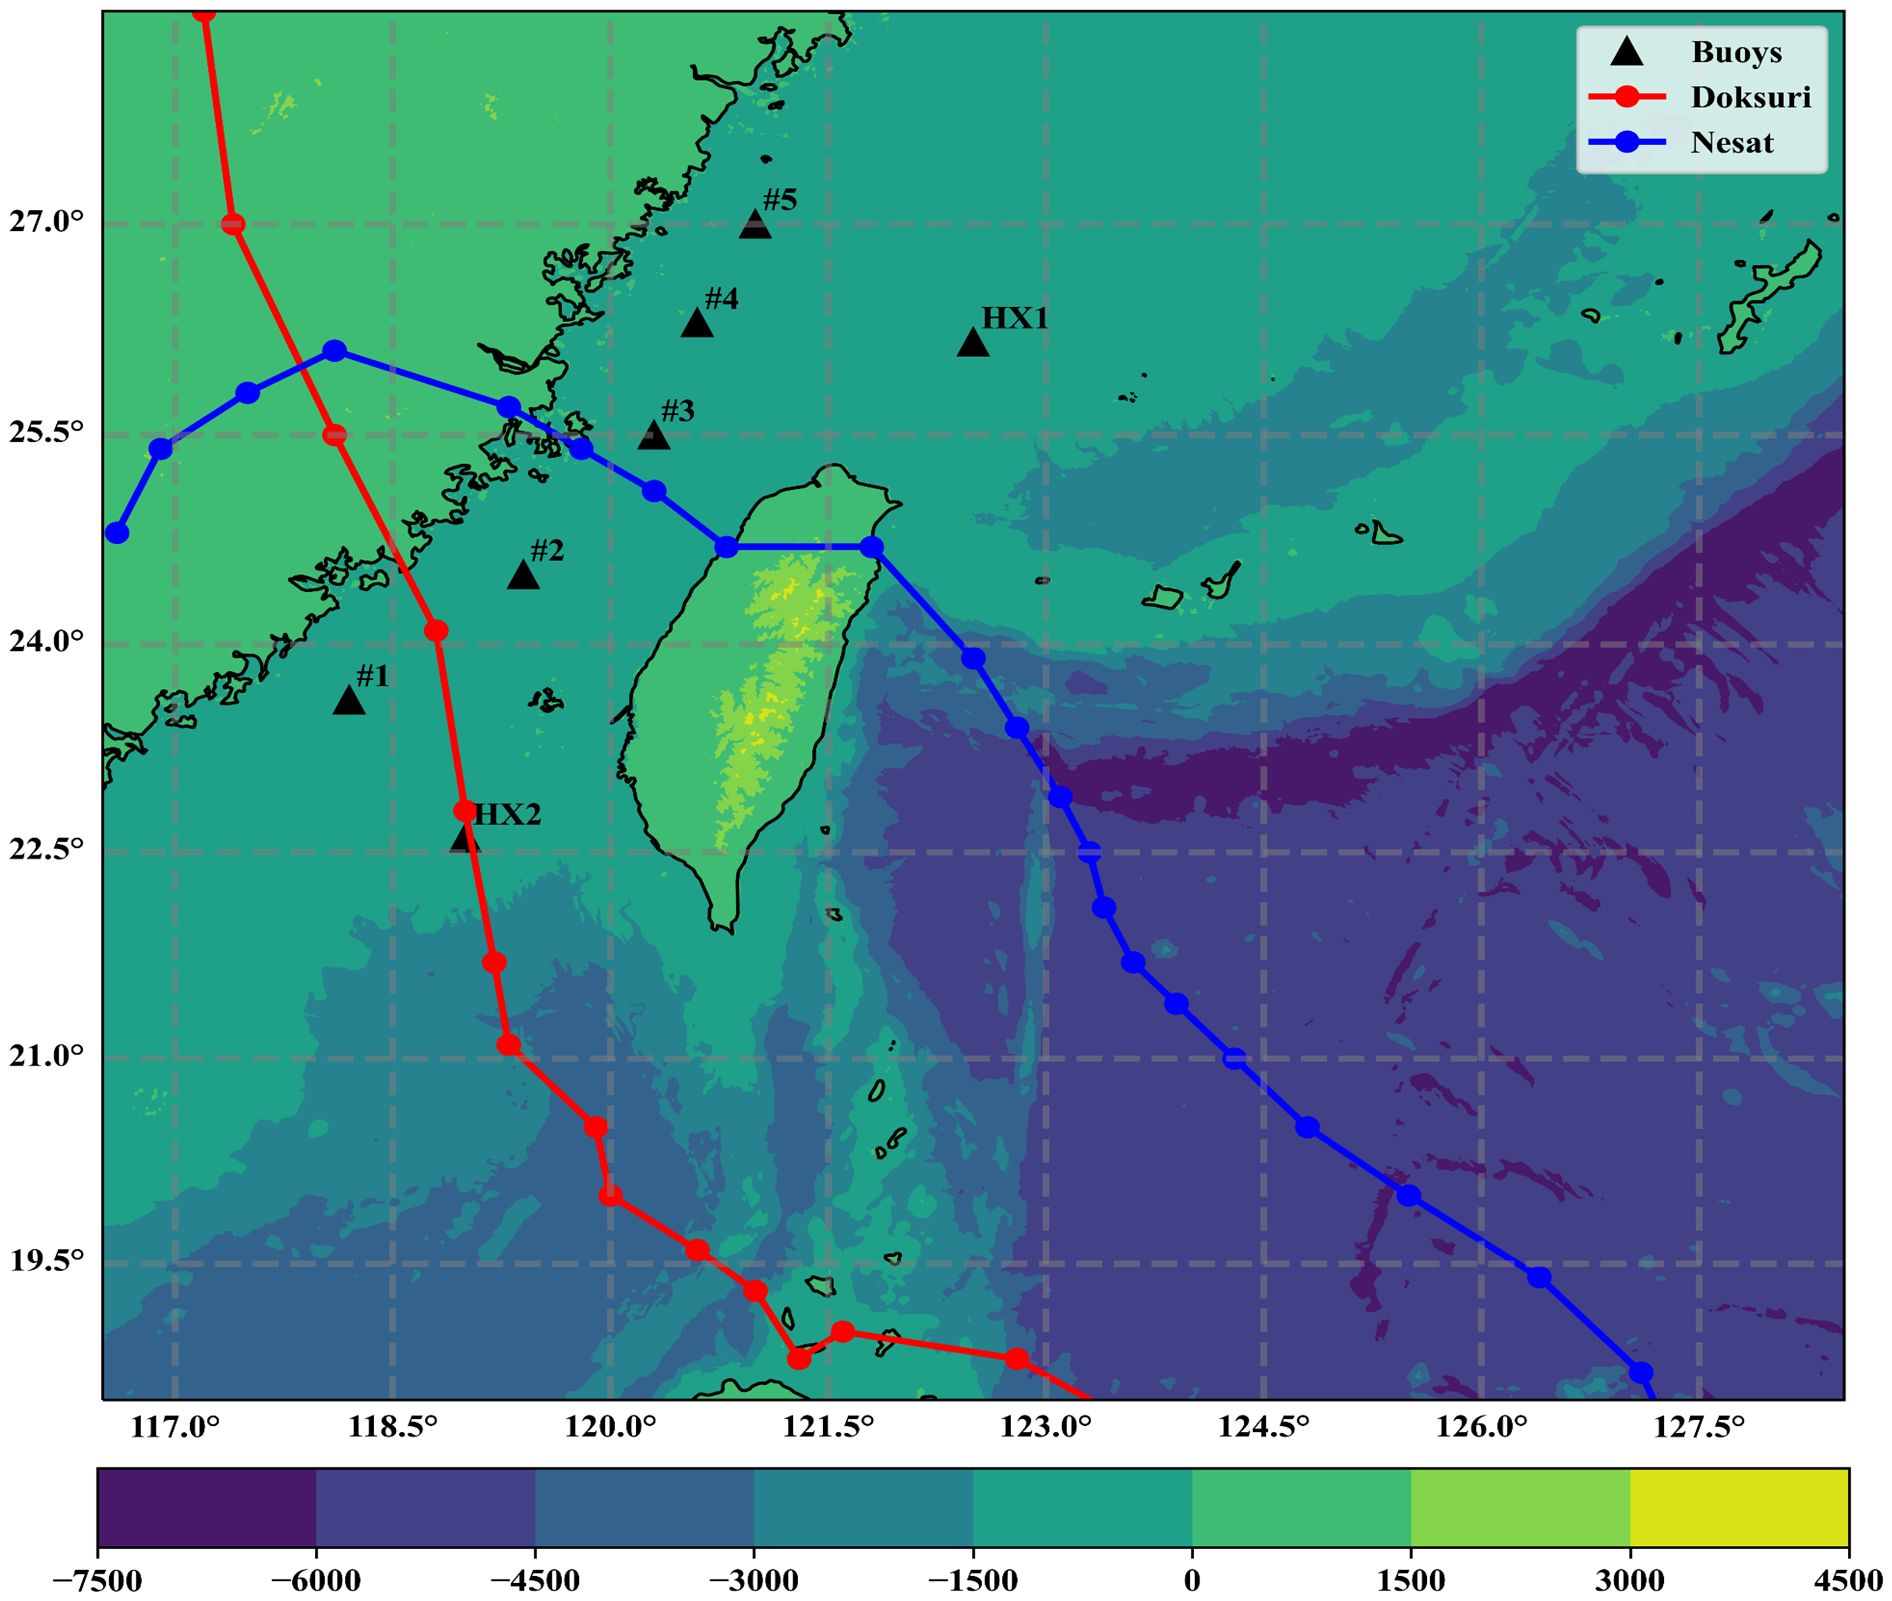
Figure 1. Water depth, buoy position, and typhoon paths (red represents Doksuri, blue represents Nesat).
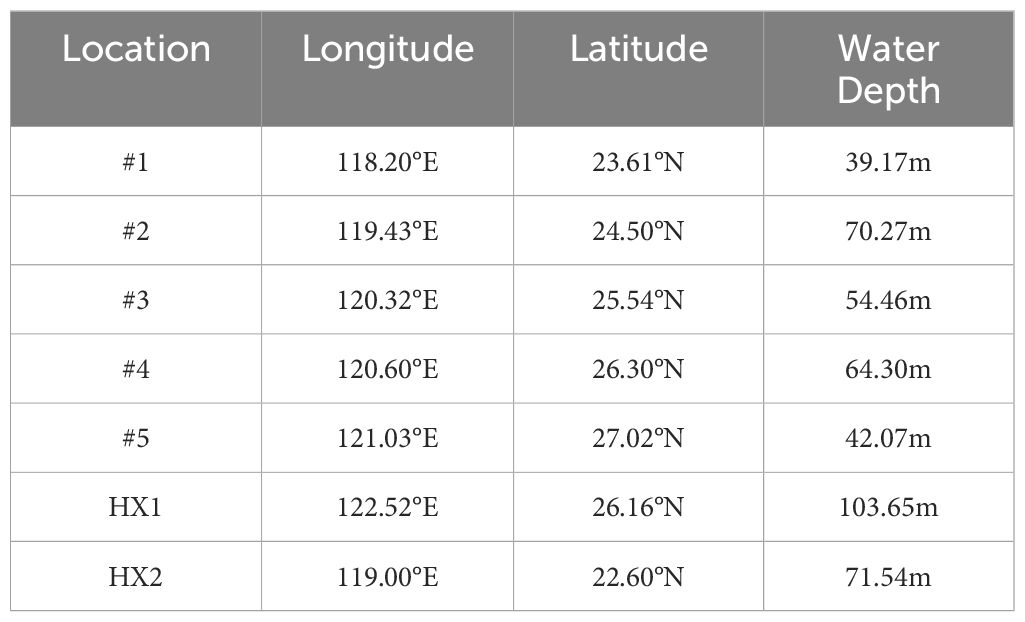
The buoys shown in Figure 1 are situated in the East and South China Seas, near the Chinese mainland, and include buoys #1, #2, #3, #4, #5, HX1, and HX2. The wave and wind speed observational data are obtained from the large buoy observational data of the Fujian Provincial Marine Forecasting Station. The buoy is 10m high, with a diameter of 10m, and data is recorded at 10-minute intervals. Detailed information about these buoys, including their longitude, latitude, and water depth, is shown in Table 1.
2.2 Typhoon models and data
2.2.1 Reanalysis wind field data
In this paper, the selection of reanalysis wind field data encompasses two internationally recognized datasets: the ERA5 dataset and the Cross-Calibrated Multi-Platform (CCMP) dataset. The ERA5 dataset is provided by the European Union's Copernicus Climate Change Service (C3S) and its partner institutions. The CCMP dataset has been developed by the Physical Ocean Data Center (PODC) at the National Aeronautics and Space Administration (NASA) in the United States. Detailed characteristics of the datasets, including specific attributes and applications, are presented in Table 2.
2.2.2 Parameterized typhoon model (Holland)
Holland (1980) introduced the Holland typhoon model, which builds upon the model proposed by Schloemer by incorporating the typhoon shape parameter B. The Holland typhoon wind field is calculated as:
Where is the air pressure at the center of the typhoon, is the air pressure at the periphery, is the radius of the maximum wind speed, is the air density, f is the Koch force parameter, r is the distance from the center of the typhoon, and B is the shape factor of the typhoon.
The calculation for Rmax and B is as follows:
In numerical wave simulations, the accuracy of the simulation is highly dependent on the computational precision of the wind field data utilized. However, existing reanalysis wind field data often underestimate the wind speed at the center of the typhoon. To address this issue, the Holland model can be utilized to more accurately simulate the wind speed at the center of the typhoon, thereby compensating for the shortcomings in the reanalysis wind field data. By introducing a weighting factor, Carr and Elsberry (1997) integrated the results of the Holland model with reanalyzed wind field data to create a synthetic wind field. This approach enhances the overall reliability of the reanalyzed wind field and improves the simulation accuracy near the maximum wind speed regions of the typhoon. The construction relationships and weighting coefficients are calculated as:
Where is the synthetic wind field, is the Holland wind field, is the reanalyzed wind field, e is the weighting factor, and n is taken as 9.
Principles of synthetic wind fields: the Holland Typhoon Model is used for the center of the typhoon, while the reanalysis wind field is used for the periphery. The synthetic wind field is shown in Figure 2.

Figure 2. Doksuri July 28, 0:00 Wind Field, (A) parametric typhoon wind field, (B) reanalysis wind field, (C) synthetic wind field.
2.3 SWAN model
In this paper, the third-generation numerical ocean wave model, SWAN 41.45, is employed for the study. This model represents an advanced numerical simulation method, grounded in ocean dynamics and wave theory, that describes and simulates wave motions in the ocean using mathematical equations and physical principles. The SWAN model is solved numerically by using computer technology to simulate various physical properties of waves, such as wave heights, periods, directions, and wave spectra.
The SWAN model represents random waves by means of a two-dimensional kinetic spectral density, and when the driving element includes tidal conditions, the interaction between waves and currents leads to a conservation of the kinetic spectral density but not the wave energy spectral density, the kinetic spectral density and the wave energy spectral density are calculated as:
Where N denotes the kinetic spectral density, E denotes the energy spectral density, and σ and θ denote the relative frequency and wave direction, respectively. Expanding the control equation to the spherical and right-angle coordinate systems, the control equation is calculated as:
Where σ is the relative frequency of the wave, θ is the wave direction perpendicular to the crest line in the spectral component, are the wave propagation speeds in the X and Y directions in the direct coordinate system, are the wave propagation speeds in the λ and φ directions in the spherical coordinate system, are the wave propagation speeds in the σ and θ directions. the first term on the left hand side of the equation is the change rate of momentum spectral density N with time t in different coordinate systems. the 2nd and 3rd terms are the rates of change of momentum spectral density N propagating in spatial positions in different coordinate systems. the 4th term is the frequency shift, refraction and shallowing change of N in frequency space σ caused by changes in the flow field and water depth. The 5th term is the propagation of N in the direction θ of the spectral distribution. S on the right side of the equation is the spectral density source and sink terms, including energy dissipation terms such as wind field input, wave-wave nonlinear interactions, and bottom friction dissipation, the equation is calculated as:
Where denotes the wind input term, denotes the bottom friction effect, denotes the fourth-order wave interaction, denotes the wave breaking due to the change in depth, denotes the white crown dissipation effect, and denotes the third-order wave interaction.
2.4 Model settings
The computational domain of the model encompasses the entire coast of Fujian, extending from 116°E to 128°E in longitude and from 18°N to 28°N in latitude. It employs an unstructured grid, comprising a total of 44,274 grids and 86,213 nodes. The bathymetric data were sourced from the ETOPO2022 global topographic dataset, featuring a resolution of 15 arc seconds. Shoreline data were derived from the GSHHS dataset.
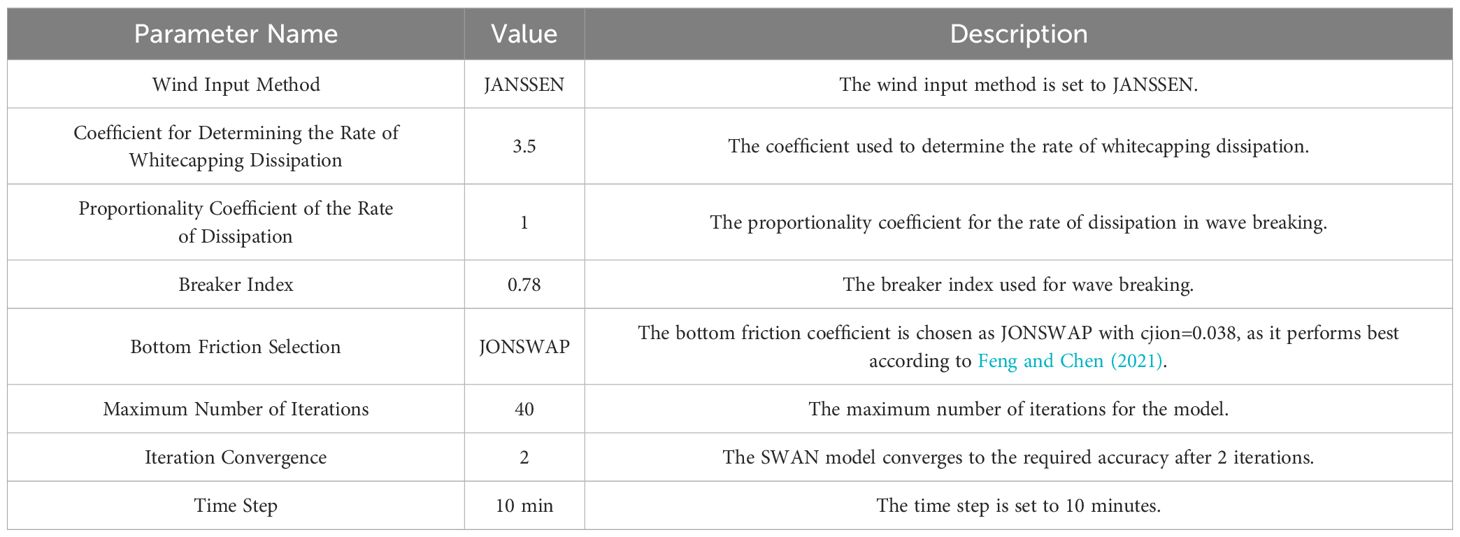
The SWAN model incorporates several source terms, including the wind input method, wave breaking term, bottom friction term, whitecapping dissipation, and interactions involving three and four waves. After multiple attempts, the optimal parameter settings are shown in Table 3.
2.5 Machine learning model
2.5.1 Correlation analysis
The output parameters from the SWAN model settings include predicted wave height, time, averaging period for first-order moment calculations (TM01), averaging period for second-order moment calculations (TM02), wind speed in the X-direction (X-Wind), wind speed in the Y-direction (Y-Wind), wave direction (Dir), and spectral peak wave direction (PkDir). If wave heights computed solely by the SWAN model are utilized as input features for machine learning, achieving high accuracy is unlikely. A correlation analysis between the SWAN output parameters and measured wave heights is conducted to evaluate the degree of correlation and to inform the selection of input features for machine learning.
Spearman's correlation coefficient was used in this study and the formula was calculated as:
Where denotes the difference between two data orders, n denotes the amount of observed data samples.
The Spearman correlation coefficient plot between the measured wave height and each parameter output from the SWAN model is shown in Figure 3. It is evident that the correlation coefficients for Dir and PkDir are below 0.3, indicating a weak correlation with the measured wave heights. Consequently, these parameters can be excluded. The parameters demonstrating a high correlation (Predicted wave height, Time, TM01, TM02, X-Wind, and Y-Wind) should be considered as input features for machine learning.
2.5.2 Backpropagation neural network
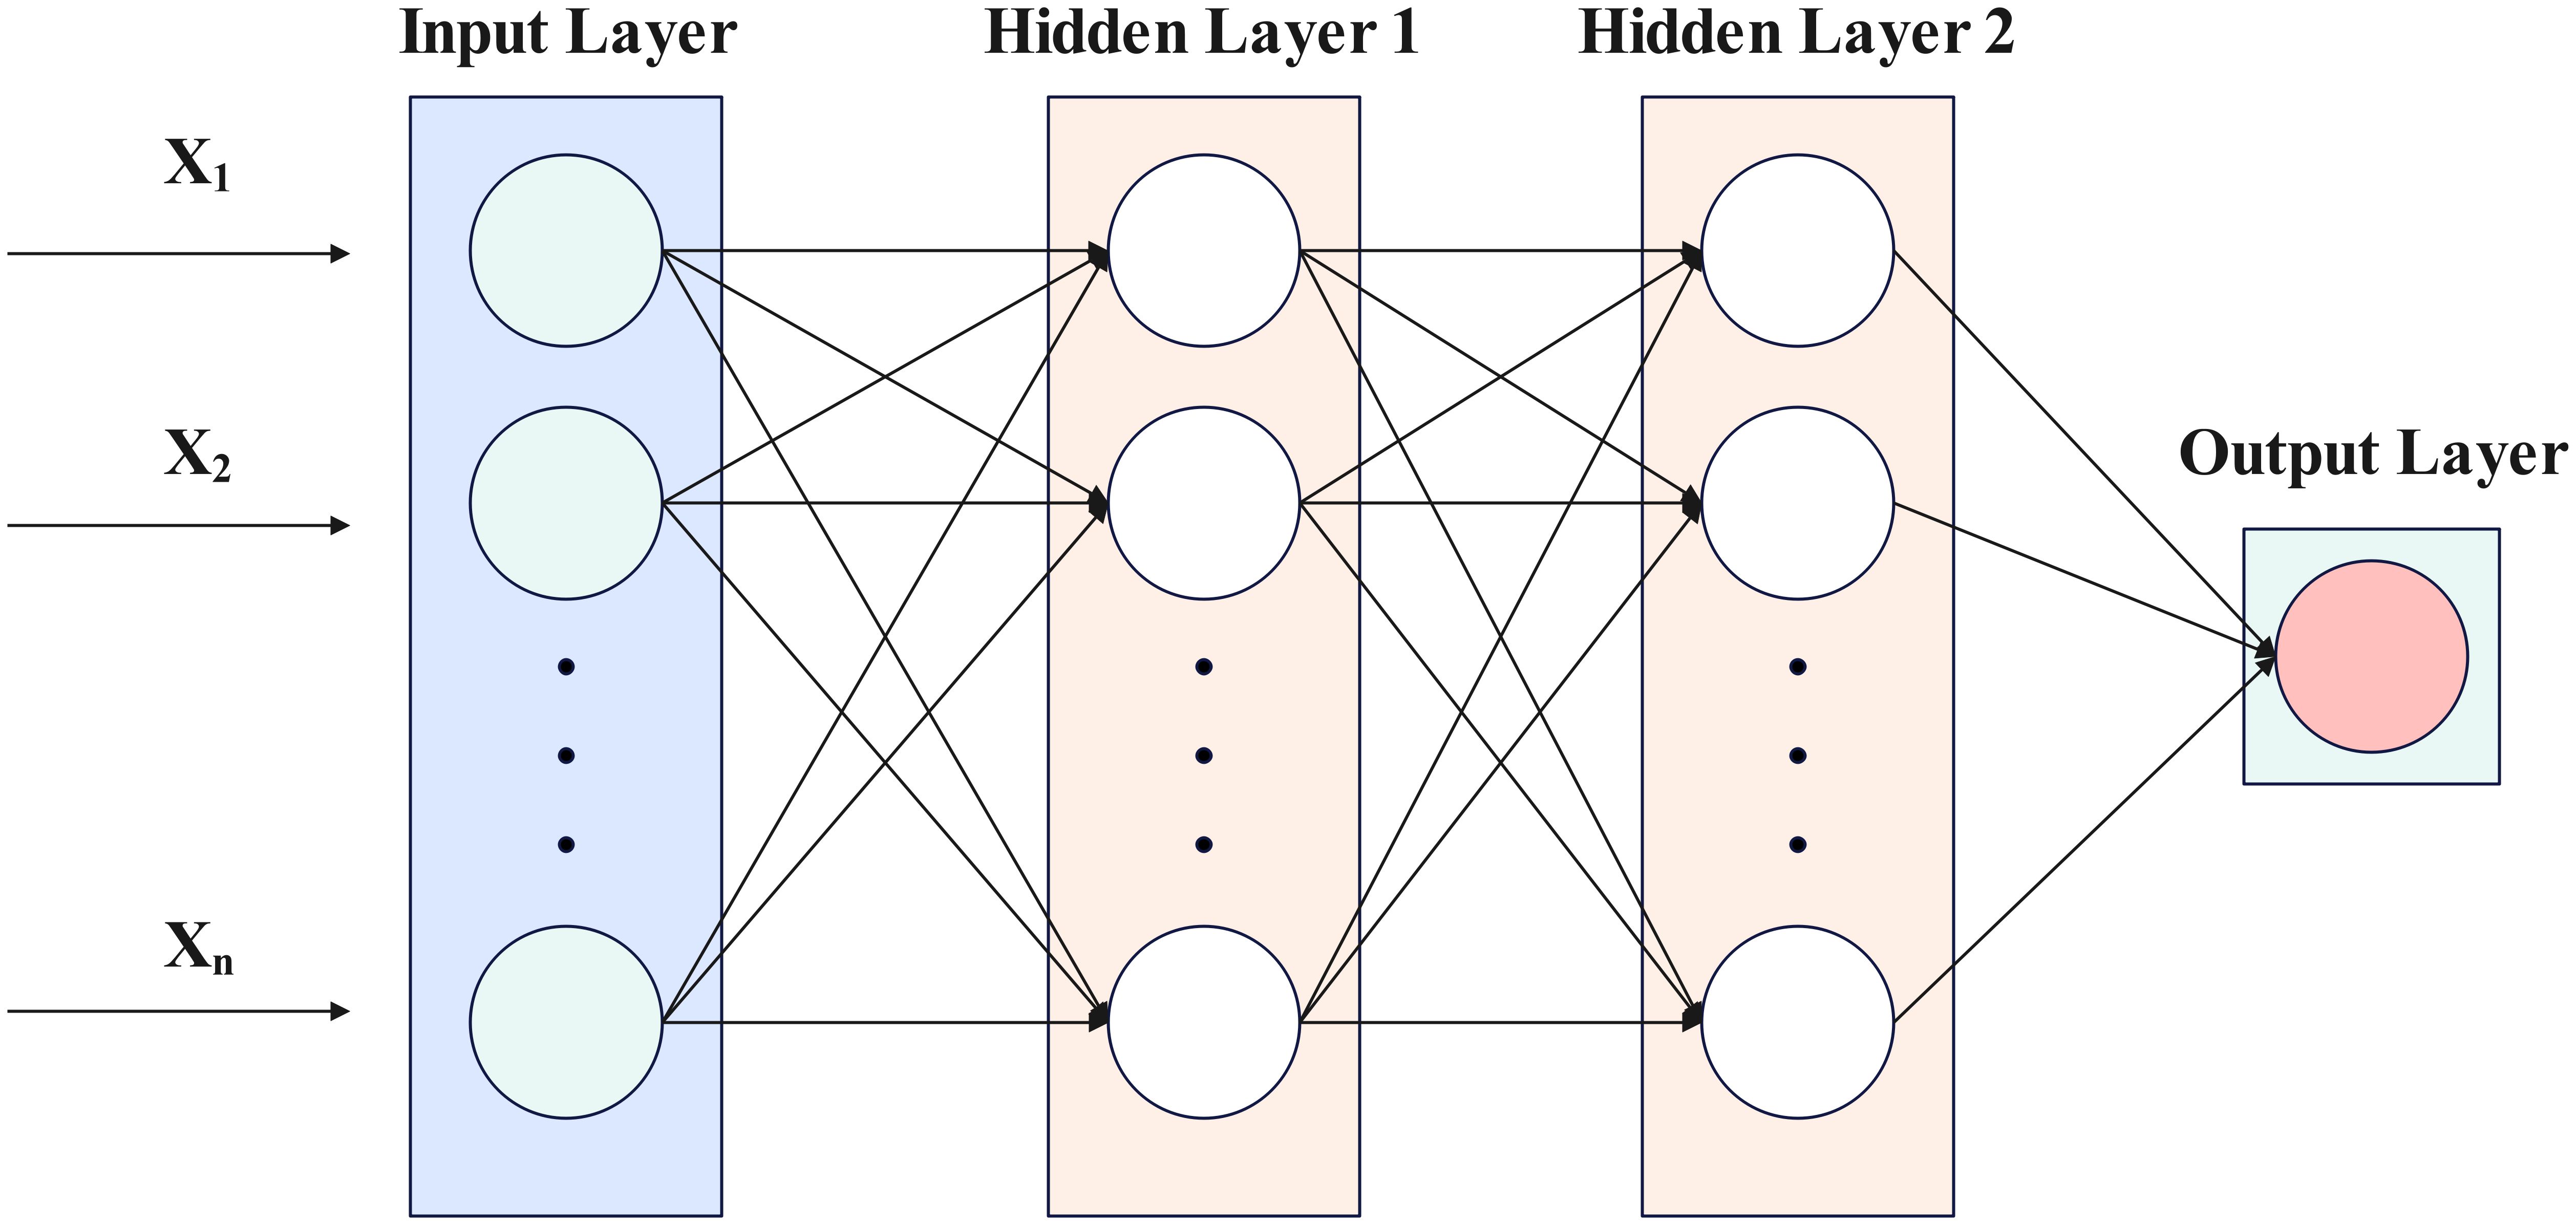
A BP neural network is a multilayer perceptron (MLP) that uses the back propagation algorithm (BP) to update the parameter gradient (Ibukahla et al., 1997). It is a multilayer feedforward network trained according to the error back propagation algorithm (BP). It is a multilayer feed-forward network trained according to the error back propagation algorithm, the essence is to take the quadratic of the network error as the objective function, use the gradient fastest descent method to calculate the minimum value of the objective function, and end the training when the error between the actual output of the neural network and the ideal output is reduced to the set expectation and reach the prediction accuracy, or reach the pre-set number of generation selection. The model is set as a neural network with three layers, each containing 10 neurons, using the ReLU activation function, with a maximum of 1000 iterations. The schematic structure is shown in Figure 4.
2.5.3 Random Forest
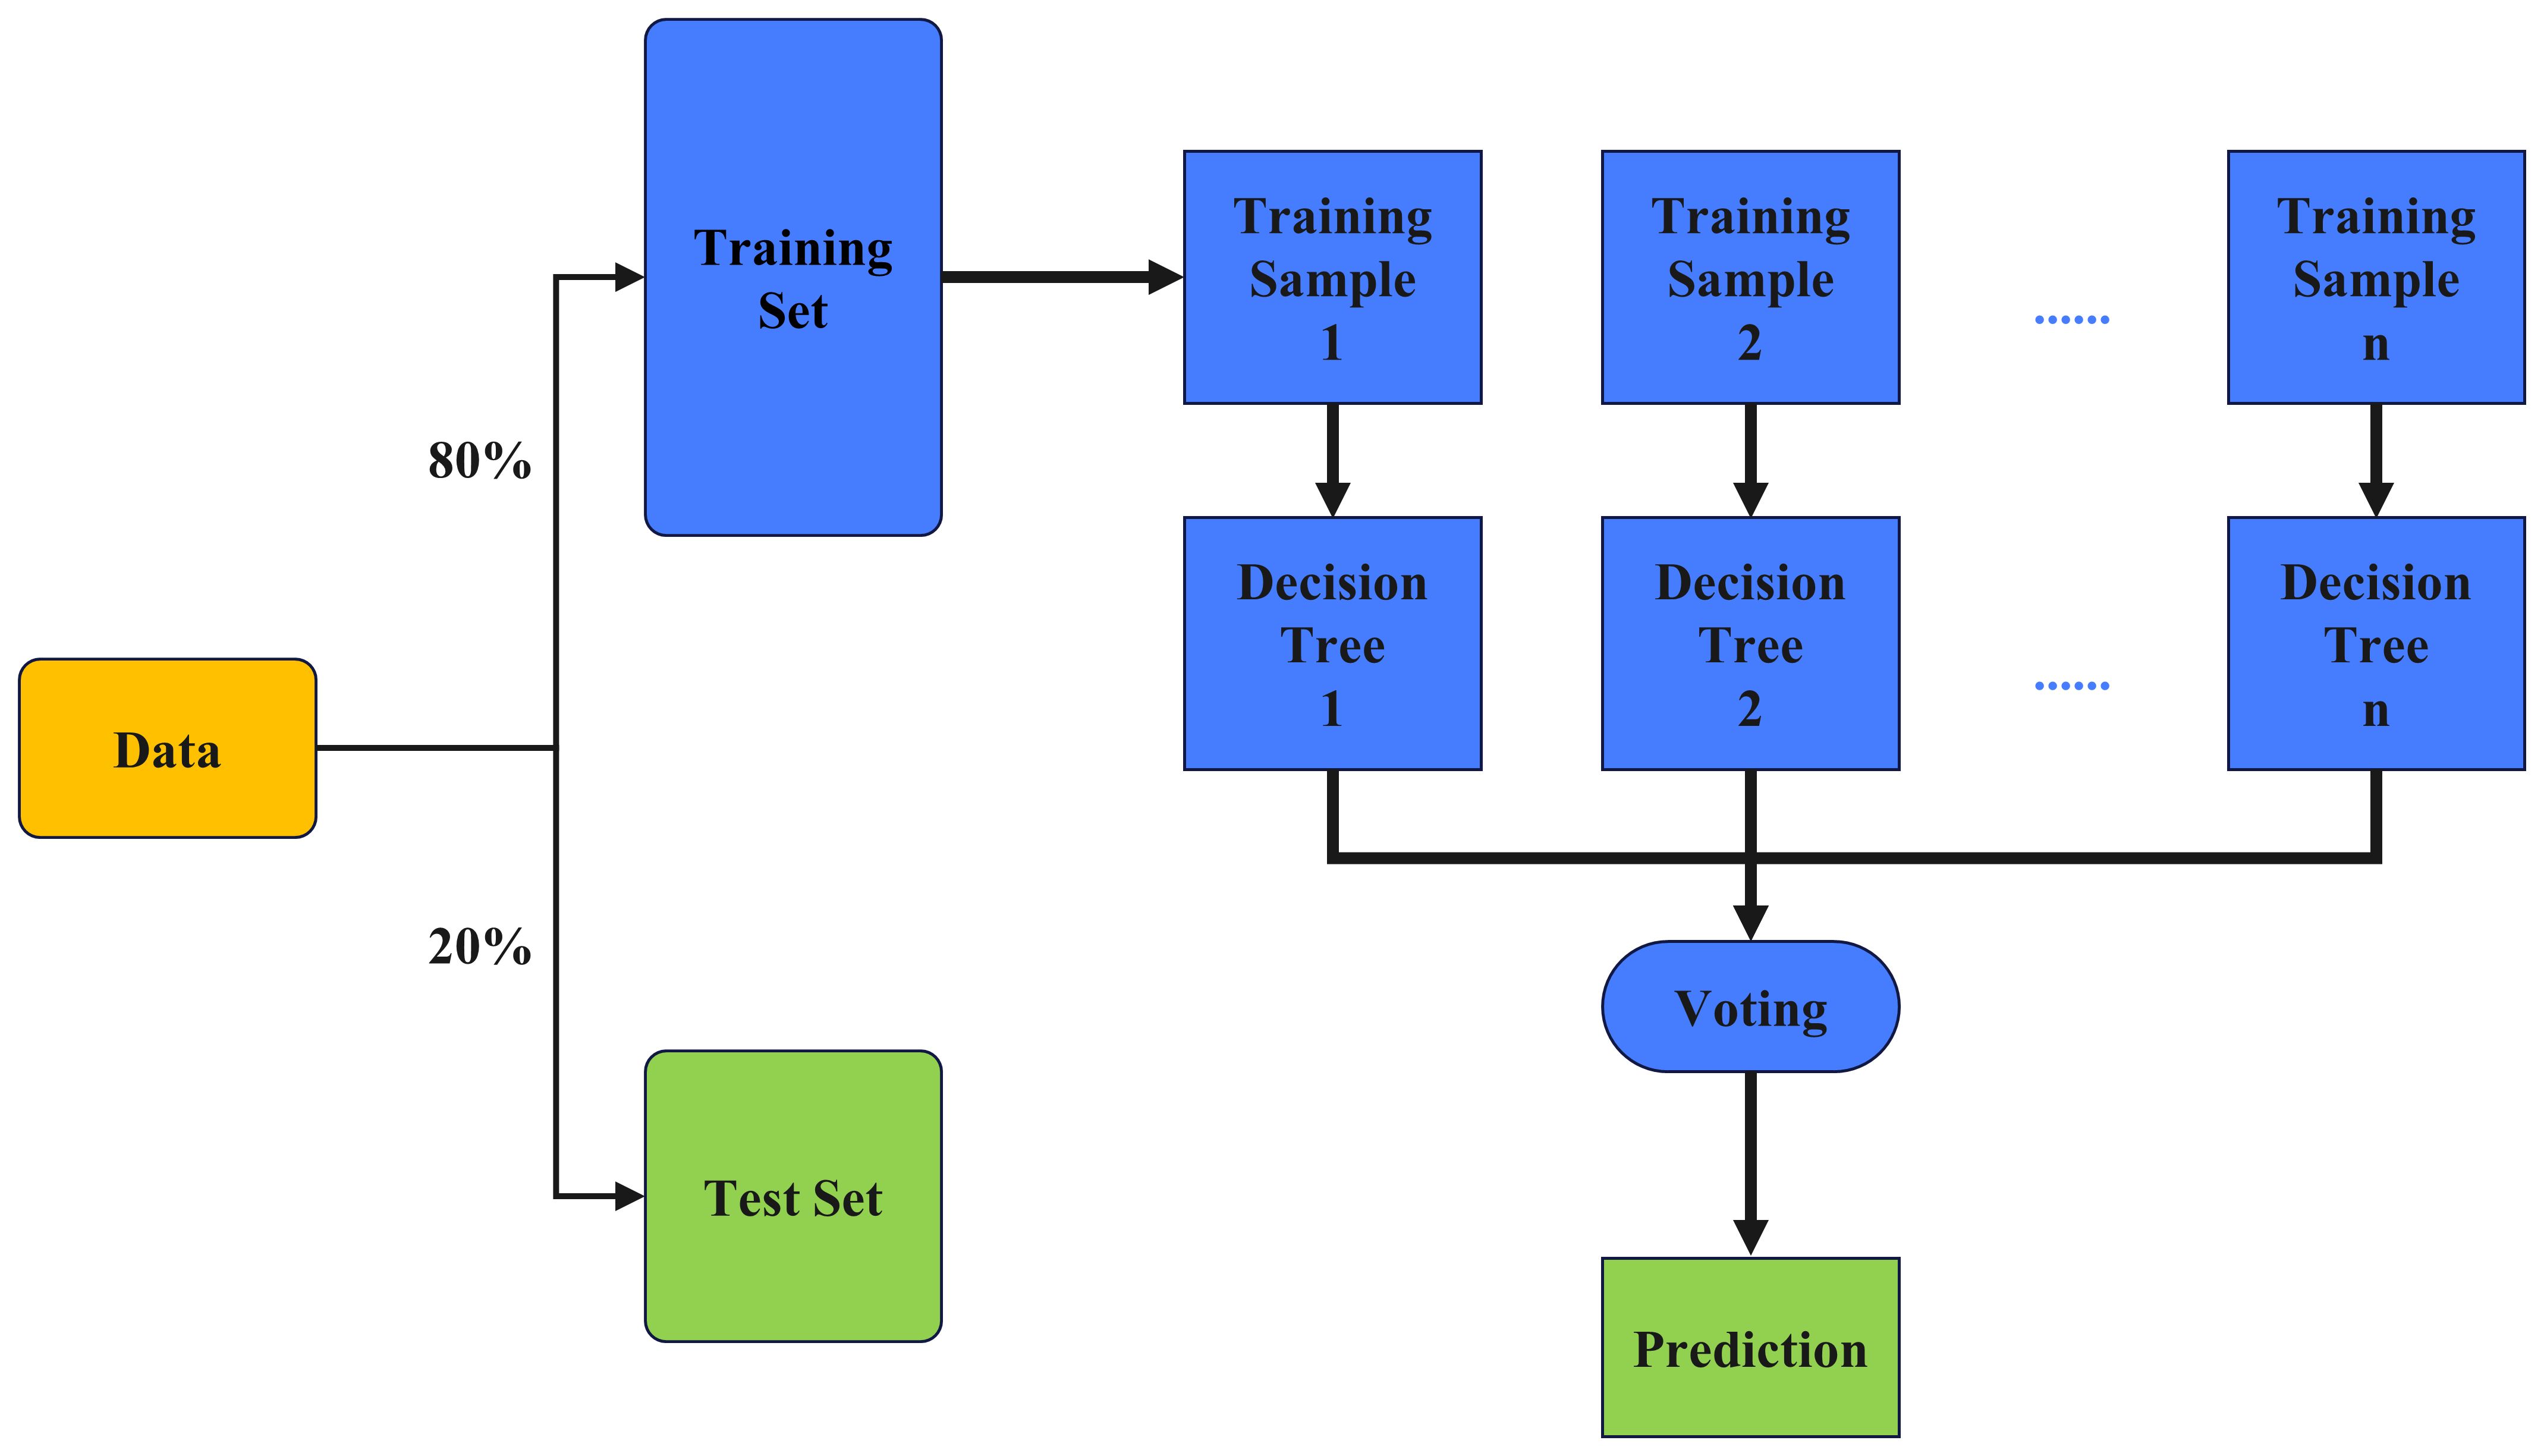
Random Forest (Breiman, 2001) randomly divides the training data into N sets of samples, and each set of samples is divided into the data used for training called "inside the bag'' and the data not included is called "outside the bag" This constructs a decision tree, and each decision tree is independently and identically distribution. The "out of bag" is used to evaluate the training results of each decision tree to minimize the Root Mean Square Error (RMSE) of each decision tree, and finally take the average value of each decision tree. The ''MinLeafSize'' for each decision tree is set to 4, which means the minimum number of samples per leaf node is 4.The schematic structure is shown in Figure 5.
2.5.4 Dataset partitioning
In this paper, wave height simulations for Typhoon Doksuri (2023) were conducted using the SWAN model. These simulations computed wave parameters at seven buoy locations, collecting critical data for each site. These collected data were subsequently analyzed for correlations to identify the most influential parameters for wave prediction. The parameters selected as input features for the machine learning model included simulation time, TM01 (mean wave period based on the first moment), TM02 (mean wave period based on the second moment), X-Wind (wind component in the X direction), and Y-Wind (wind component in the Y direction). These parameters were chosen to effectively capture the intricate dynamics between the typhoon-induced waves and the influencing meteorological and oceanographic variables. These features were selected due to their high correlation with wave height. Using these features as inputs can aid in examining the complex relationships between waves and other factors.
In constructing the machine learning dataset, the data of buoys #1, #2, #3, #4, HX1 and HX2 are compiled into the training set for training the machine learning models. Whereas, the data with buoy #5 is divided into a test set for evaluating the generalization ability and prediction accuracy of the model. This data division method helps to verify the performance of the model on unseen data and ensure that the model can provide reliable predictions in real applications. The specific divisions are shown in Table 4.
2.5.5 Evaluation metrics
This study evaluates the model's performance in predicting typhoon waves and validating wind speeds using three key metrics: MAE, RMSE, and R2.MAE is the mean absolute error and RMSE is the root mean square error, and the closer they are to 0 means the more accurate the result is. R2 is the correlation coefficient, and the closer it is to 1 means the stronger the correlation is. The evaluation indexes are calculated as:
Where denotes the predicted value, denotes the observed value, denotes the observed mean, and N denotes the size of the sample.
3 Model validation
3.1 Wind speed verification
To assess the accuracy of both synthetic and reanalyzed wind fields, this study utilizes observational data and simulation results for Typhoon Doksuri, covering the period from July 24 to July 30, 2023, for comparative analysis. This study employed two reanalysis datasets, ERA5 and CCMP, which were integrated with the Holland typhoon model to generate four distinct wind field datasets: ERA5, CCMP, ERA5+Holland, and CCMP+Holland.
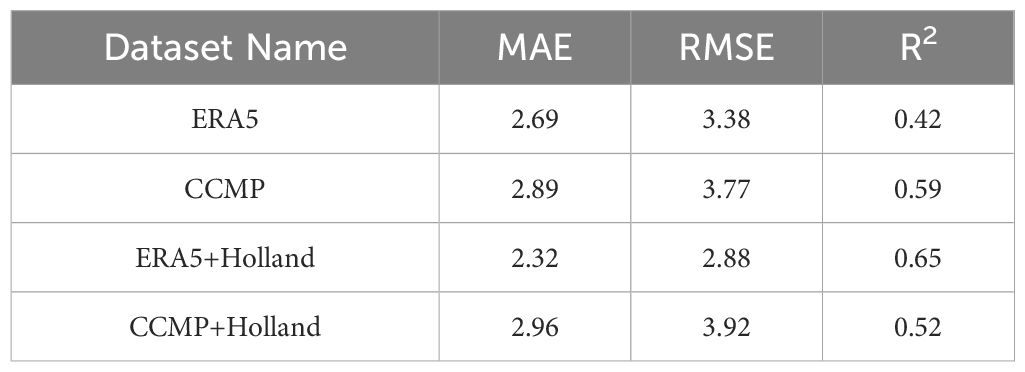
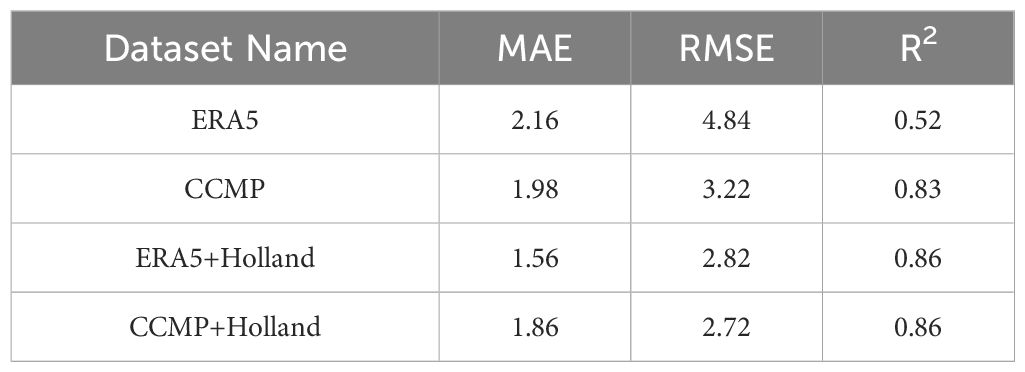
Figure 1 illustrates that buoys #1, #2, and HX2 are positioned nearer to the typhoon's center, in contrast to the other buoys which are located further away. In Figures 6A–G, the wind speed measurements derived from both the ERA5 and ERA5+Holland datasets exhibit considerable overlap, similarly to those from the CCMP and CCMP+Holland datasets. This overlap indicates that there are no significant differences between the synthetic and reanalyzed wind fields for buoys situated farther from the typhoon's center. Moreover, this study conducts a detailed analysis of error metrics for the four datasets. The analysis concerning buoys #1 and #2 is shown in Tables 5 and 6, while the analysis for HX2 is shown in Table 7.
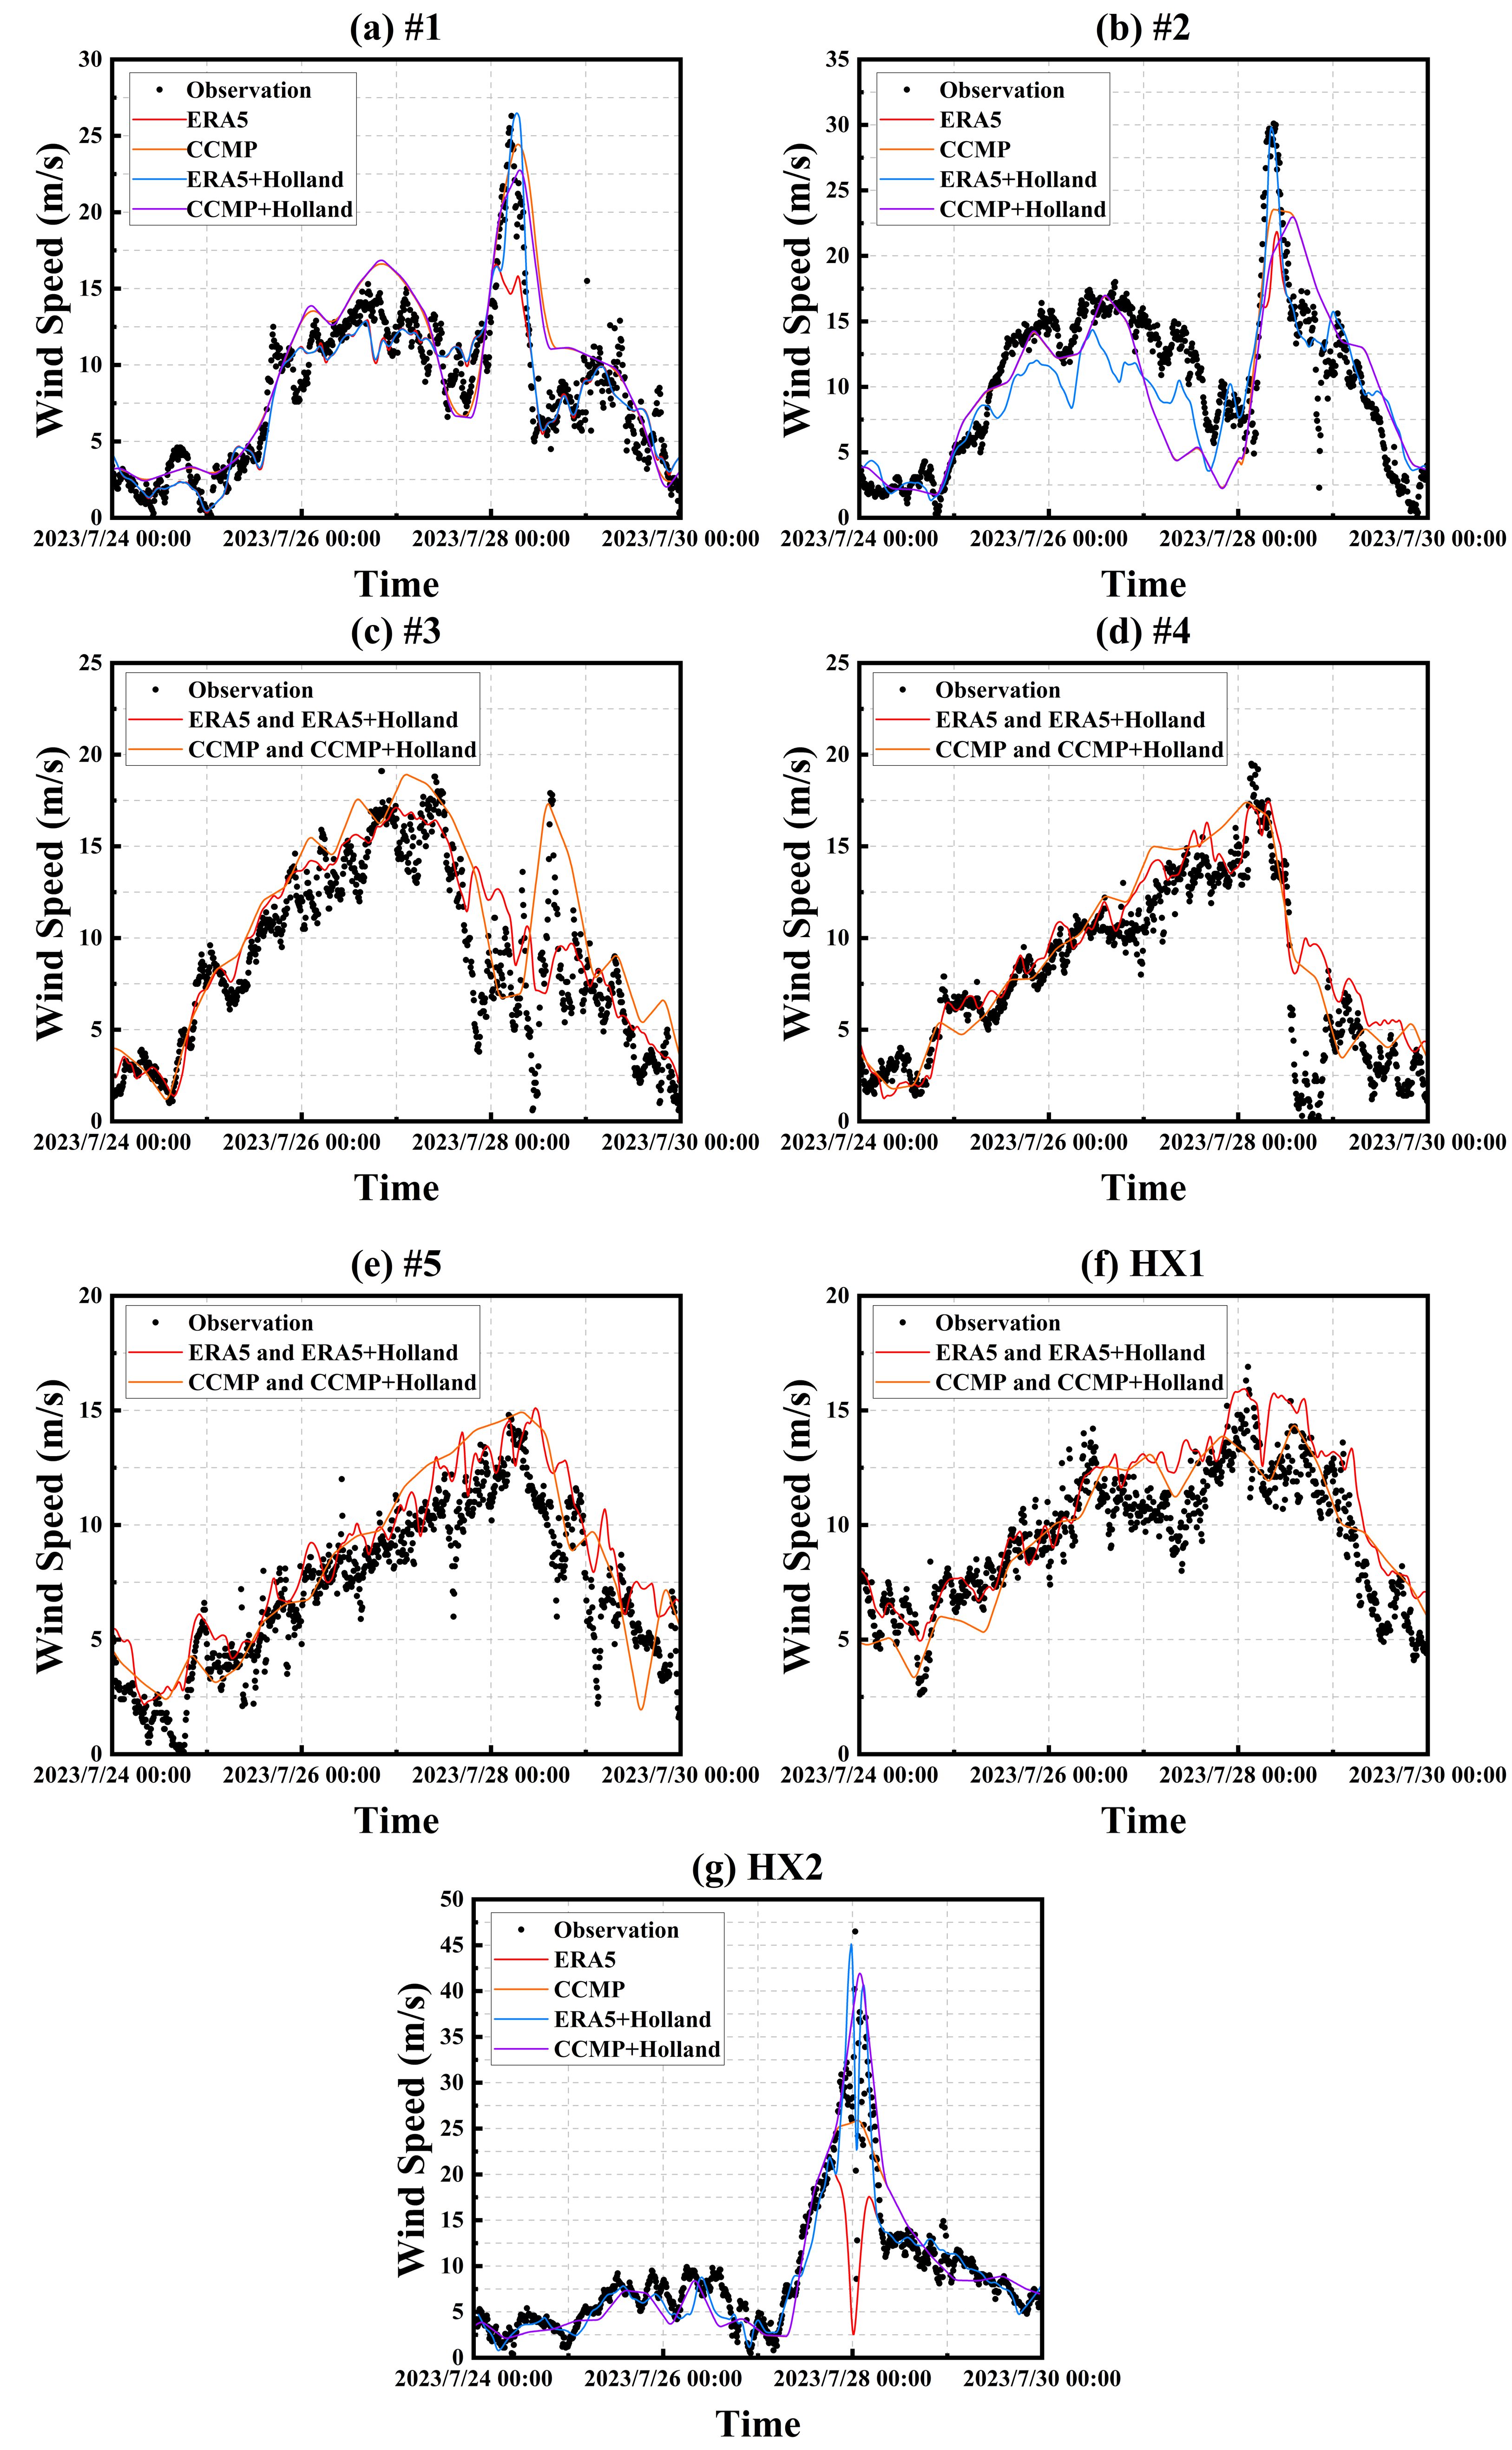
Figure 6. Comparison of results from four wind field datasets used by buoys #1 (A), #2 (B), #3 (C), #4 (D), #5 (E), HX1 (F), and HX2 (G) with measured wind speeds.
3.2 SWAN model validation
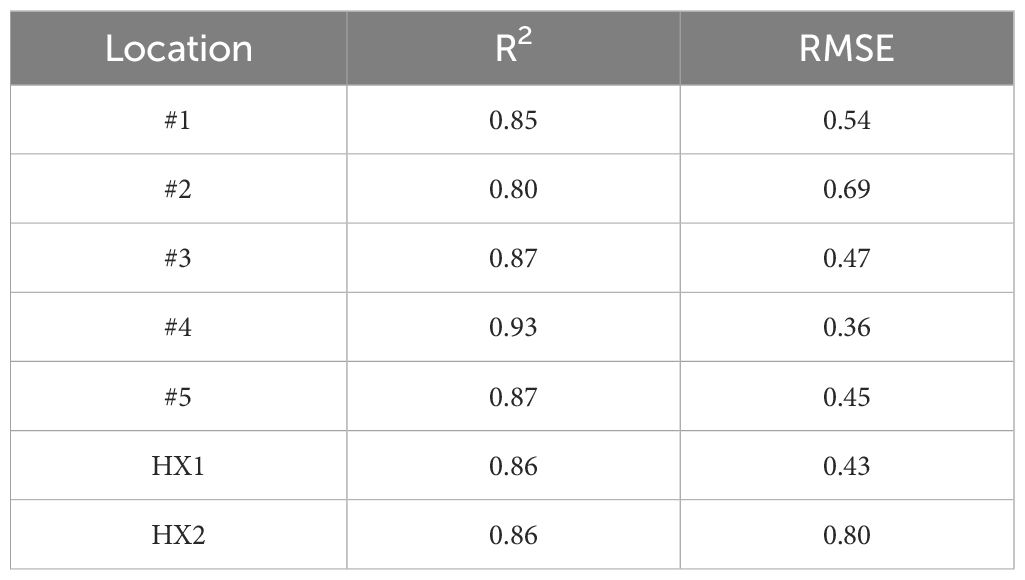
A comparison of wave height simulations using the SWAN model integrated with the synthetic wind field (Holland+ERA5) against actual measurements from various buoy locations during Typhoon Doksuri is shown in Figure 7. Error indicators are shown in Table 8. The simulations show close alignment with the measured wave heights, especially at the extremes, which highlights the model's high accuracy. The correlation coefficients, as shown in Table 7, range from 0.80 to 0.93, confirming a strong correlation between the predictions of the SWAN model and the observed data. Despite the general proximity of simulated results to the measured values across most buoys, the root mean square errors (RMSE) for buoy #2 and buoy HX2 are notably higher, recorded at 0.69 and 0.80 respectively. This increased error is likely due to the direct passage of Typhoon Doksuri's center over these buoys, exacerbating discrepancies under extreme weather conditions. Capturing such dynamic changes in wave heights accurately poses a significant challenge for any model, particularly when complex, nonlinear dynamic processes are involved.
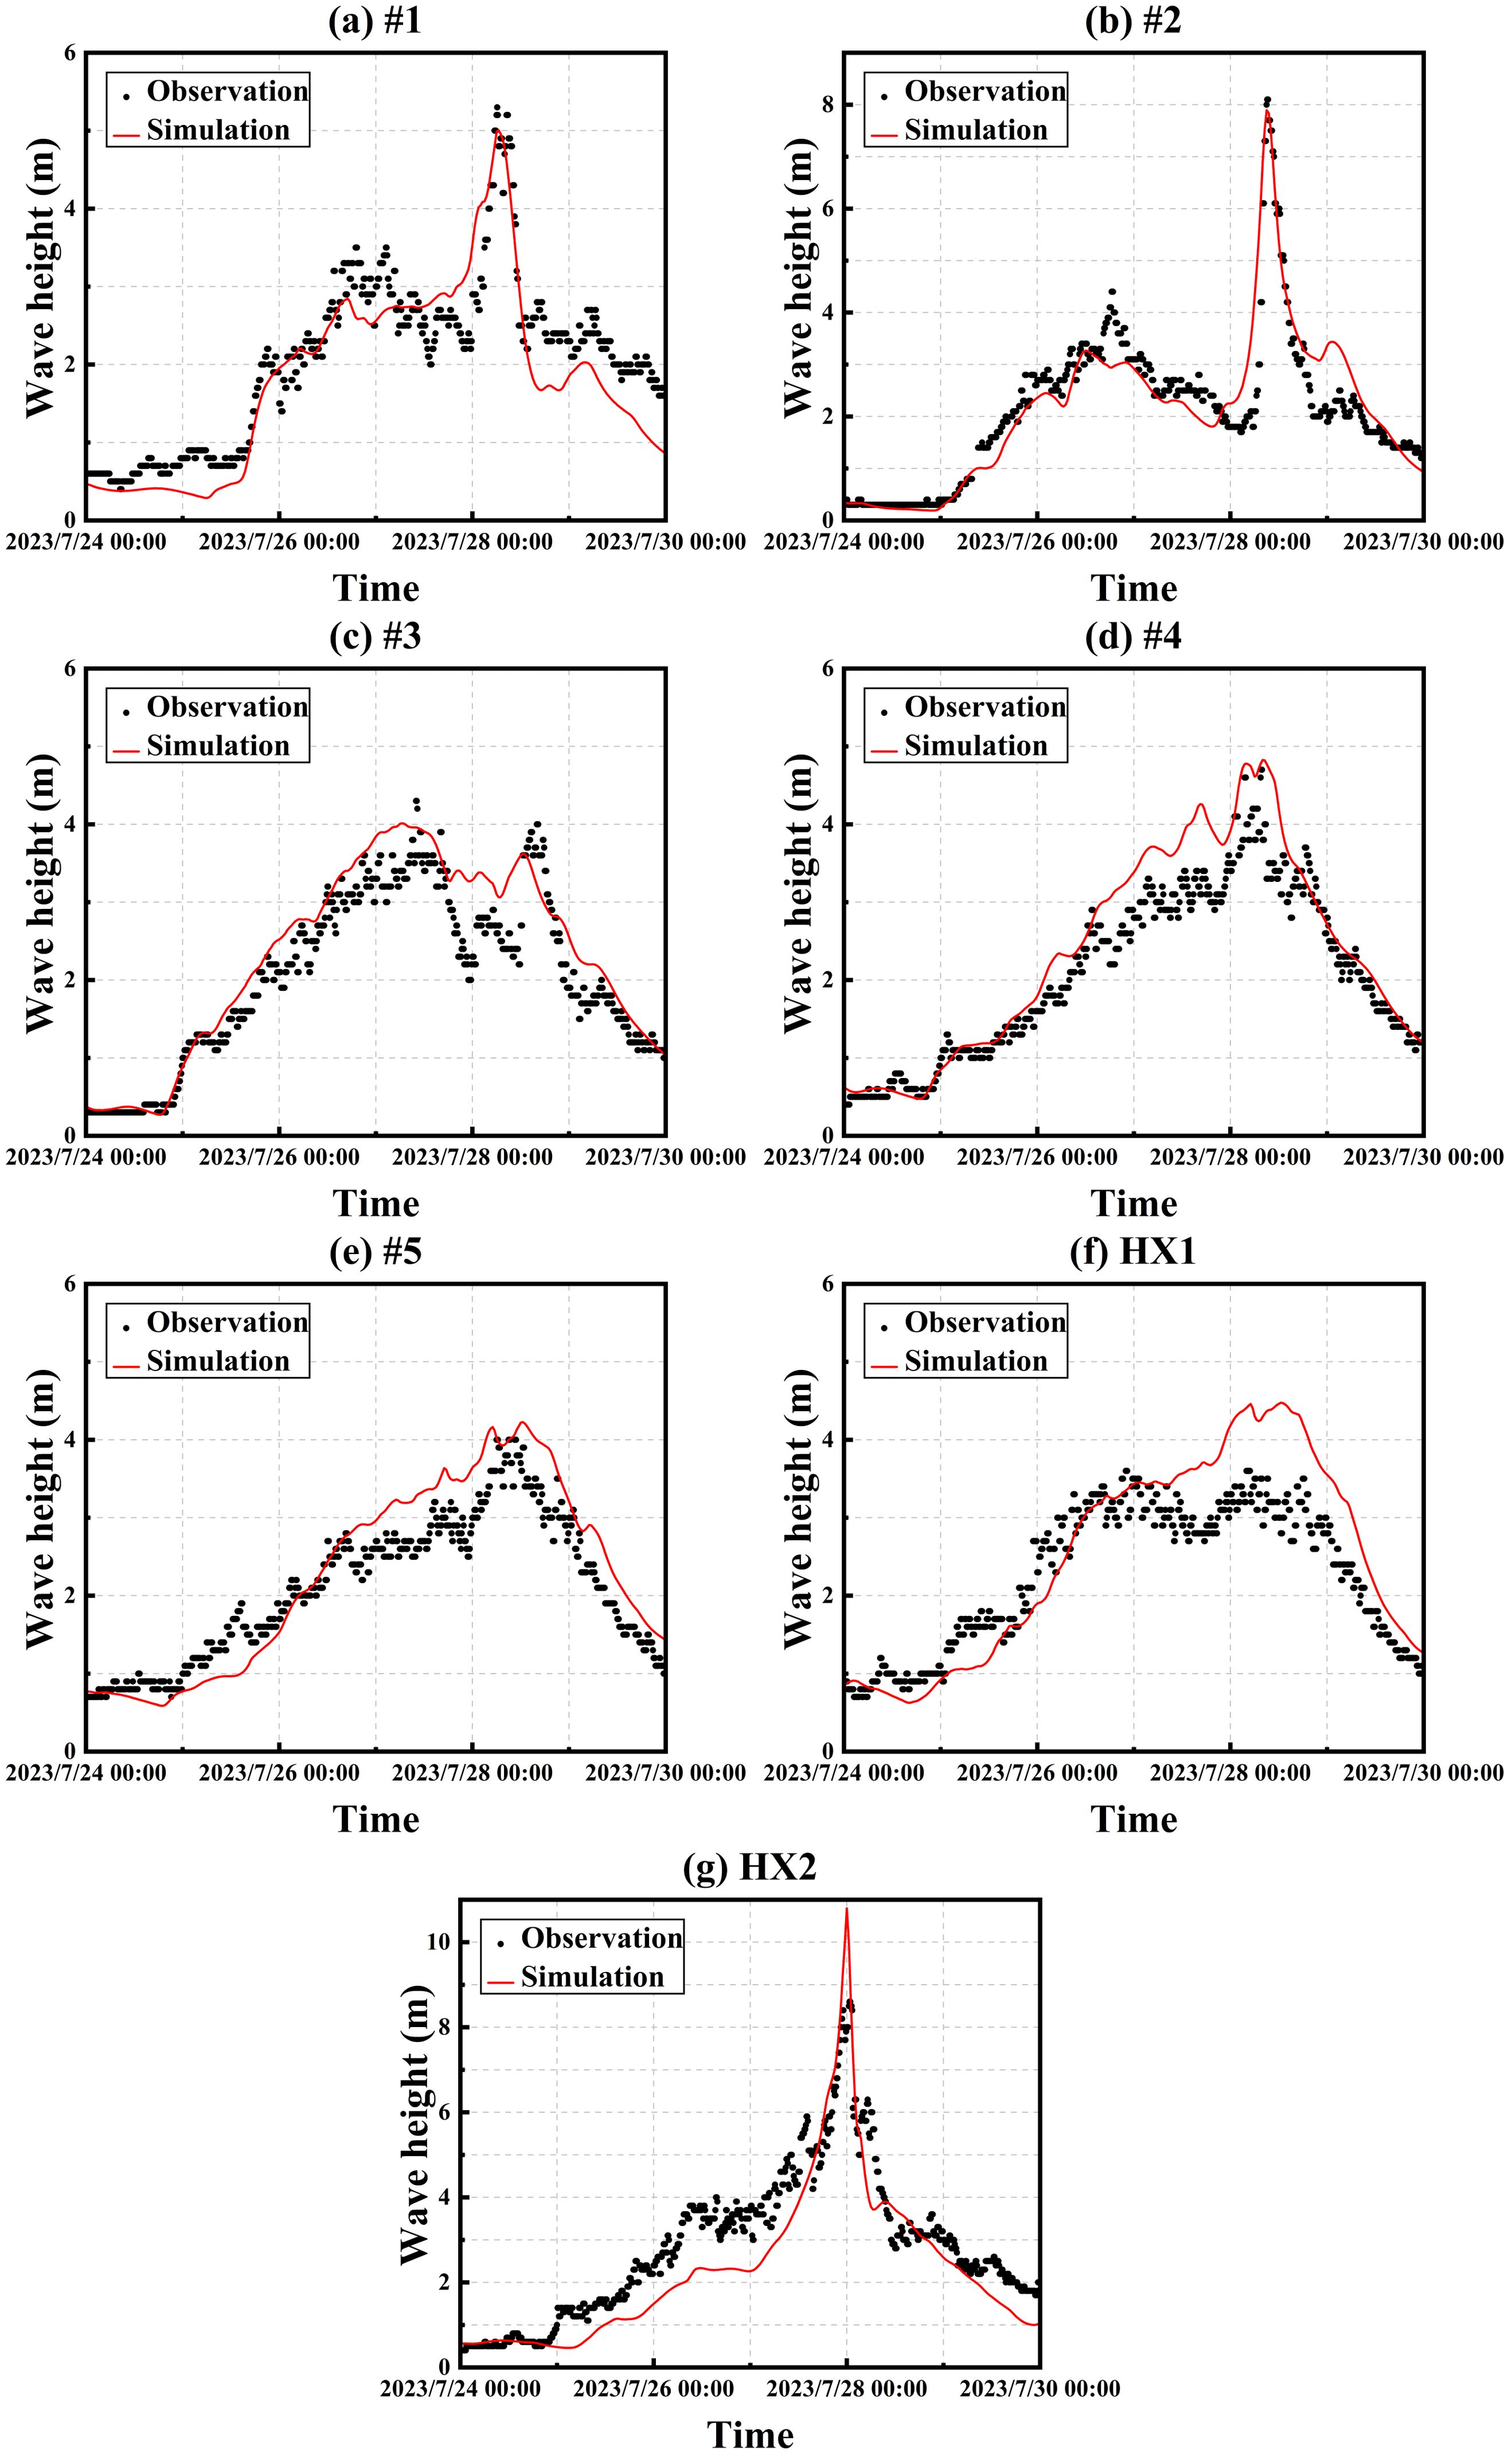
Figure 7. Comparison of simulated wave heights and measured wave heights for buoys #1 (A), #2 (B), #3 (C), #4 (D), #5 (E), HX1 (F), and HX2 (G).
4 Discussion
4.1 Effect of using different wind field datasets on wind speed
To explore the impact of reanalyzing both synthetic and reanalyzed datasets of wind fields on wind speed measurements, this study utilizes four distinct wind field datasets: ERA5, CCMP, ERA5+Holland, and CCMP+Holland for comparative analysis against the empirical wind speed data recorded during Typhoon Doksuri.
The error metrics for buoy #1, derived from each wind field dataset, are shown in Table 5. The metrics for buoy #2 are shown in Table 6, and those for buoy HX2 are shown in Table 7. These tables indicate that ERA5 generally exhibits lower root mean square error (RMSE) and mean absolute error (MAE) compared to CCMP. However, as shown in Table 9, CCMP outperforms ERA5 in simulating the maximum wind speeds of typhoons. This observation is consistent with findings from Li et al. (2021), who evaluated different wind field datasets in the East China Sea and noted that despite ERA5's lower error rates, it tends to underperform in capturing the very high wind speeds associated with typhoons.
Further analysis reveals that the incorporation of the synthetic wind field significantly reduces the root mean square error (RMSE) for both the ERA5 and CCMP datasets, as evidenced by the data shown in Tables 5–7. This reduction indicates that the synthetic wind field effectively enhances the accuracy of wind data, compensating for ERA5's limitations in capturing the extreme wind speeds of typhoons. Consequently, the ERA5+Holland synthetic wind field has been selected as the primary driving field for this study. This approach serves as a benchmark for future typhoon wave forecasting and wind field dataset selection in Fujian waters and provides valuable guidance for selecting wind fields in other maritime regions.
4.2 Effect of using different machine learning models to optimize SWAN results (SWAN-BP, SWAN-Tree)
In this study, the BP neural network and random forest algorithm were employed to enhance the accuracy of wave predictions by the SWAN model, resulting in the development of two hybrid models: SWAN-BP and SWAN-Tree. These machine learning-enhanced models significantly improved the precision of the numerical wave model predictions, demonstrating their efficacy in refining wave forecasting techniques.
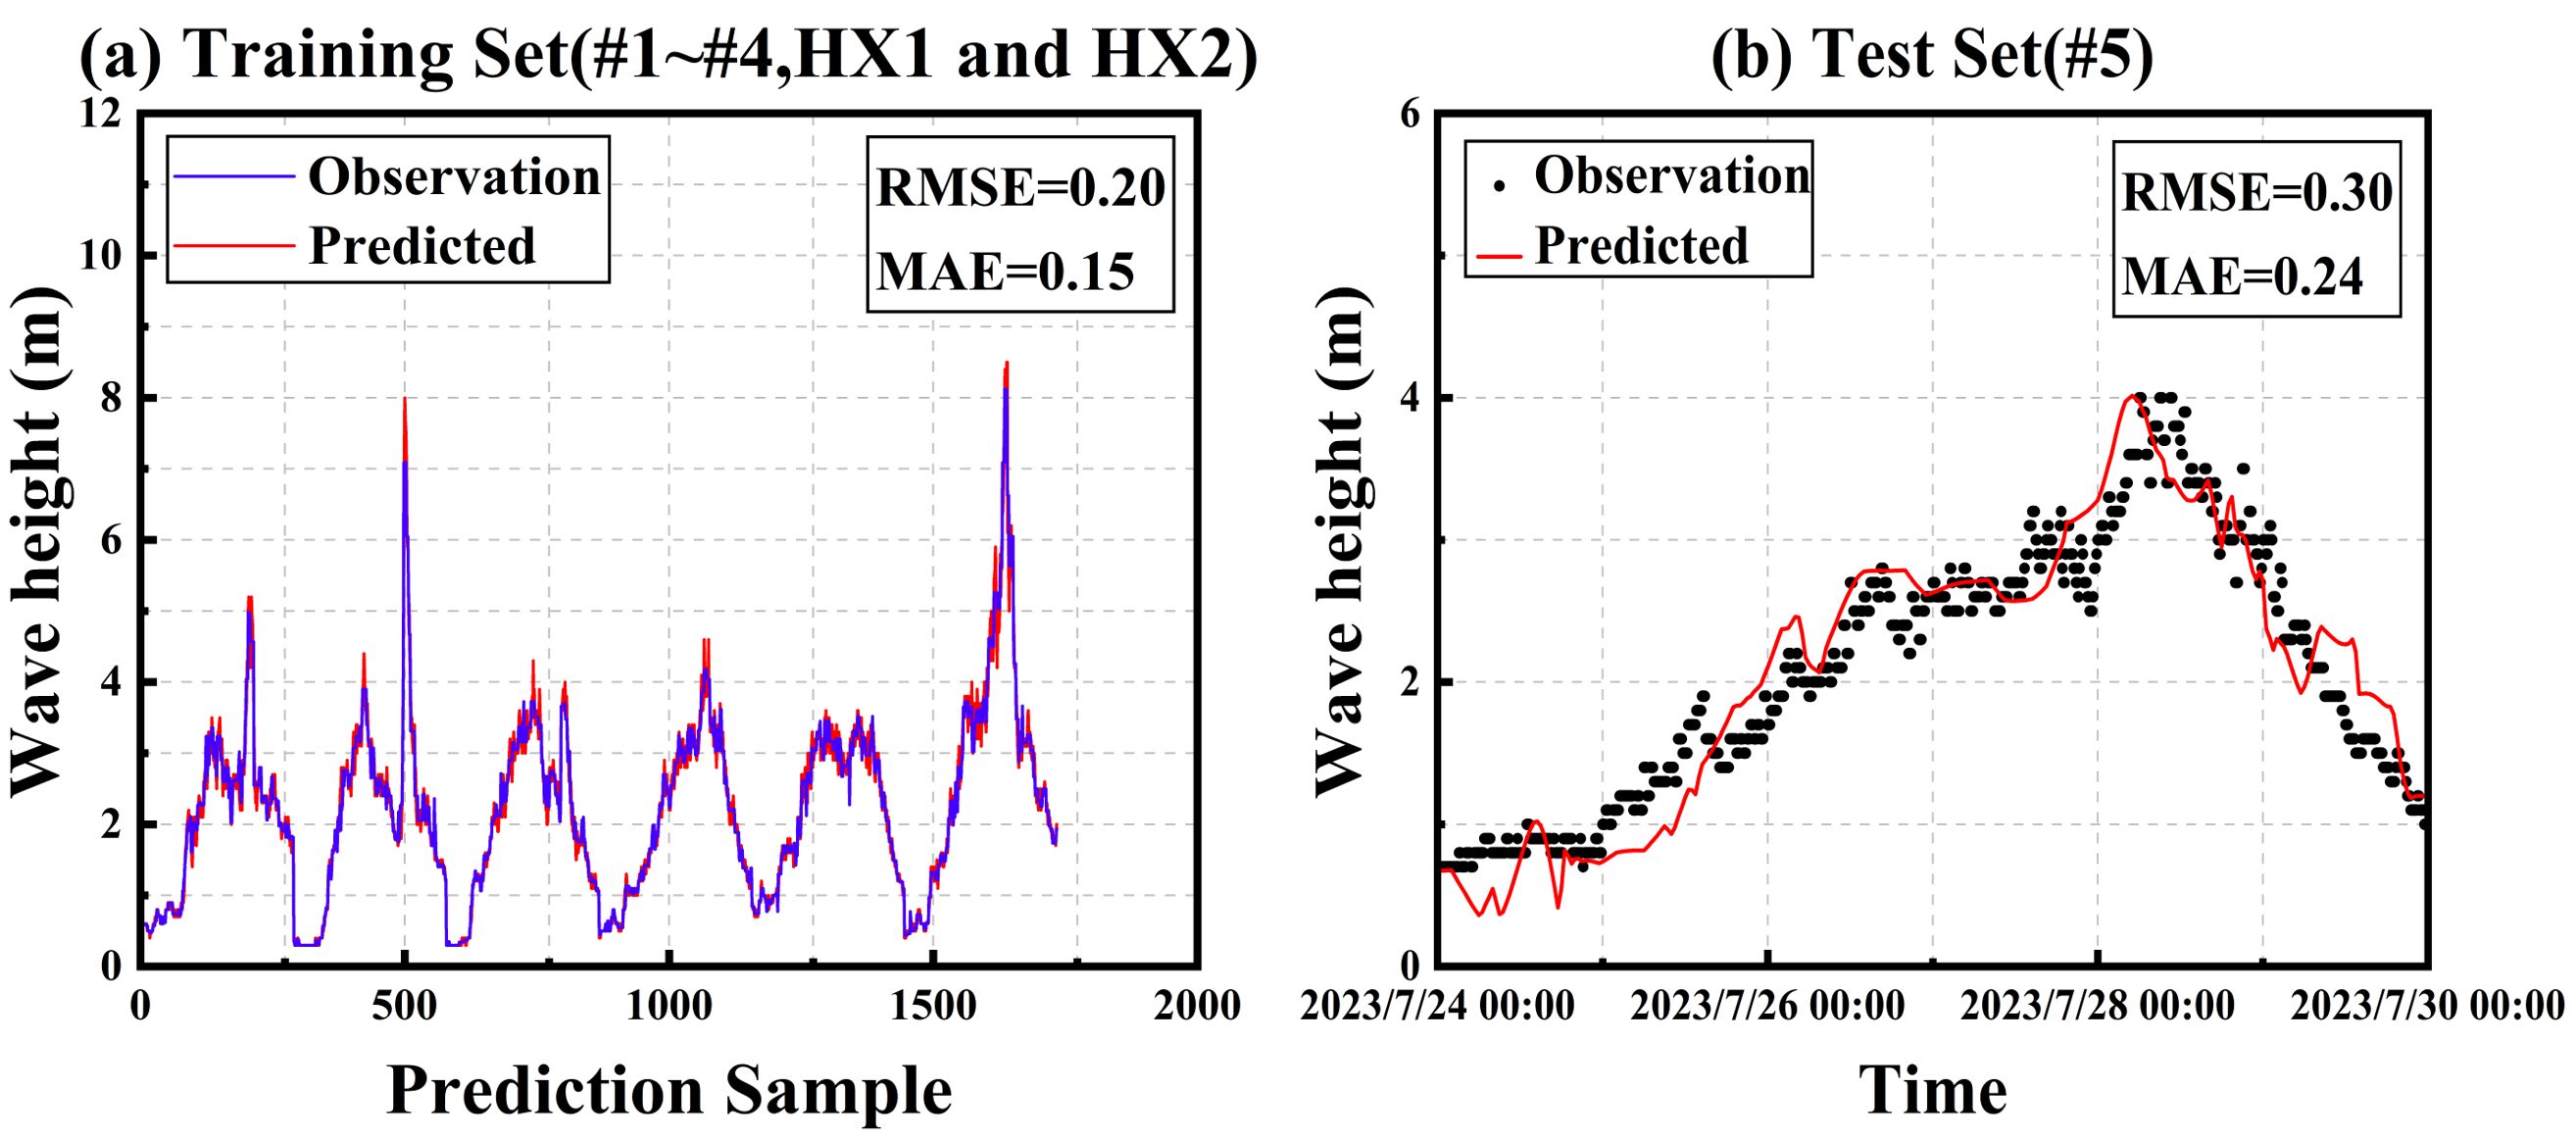
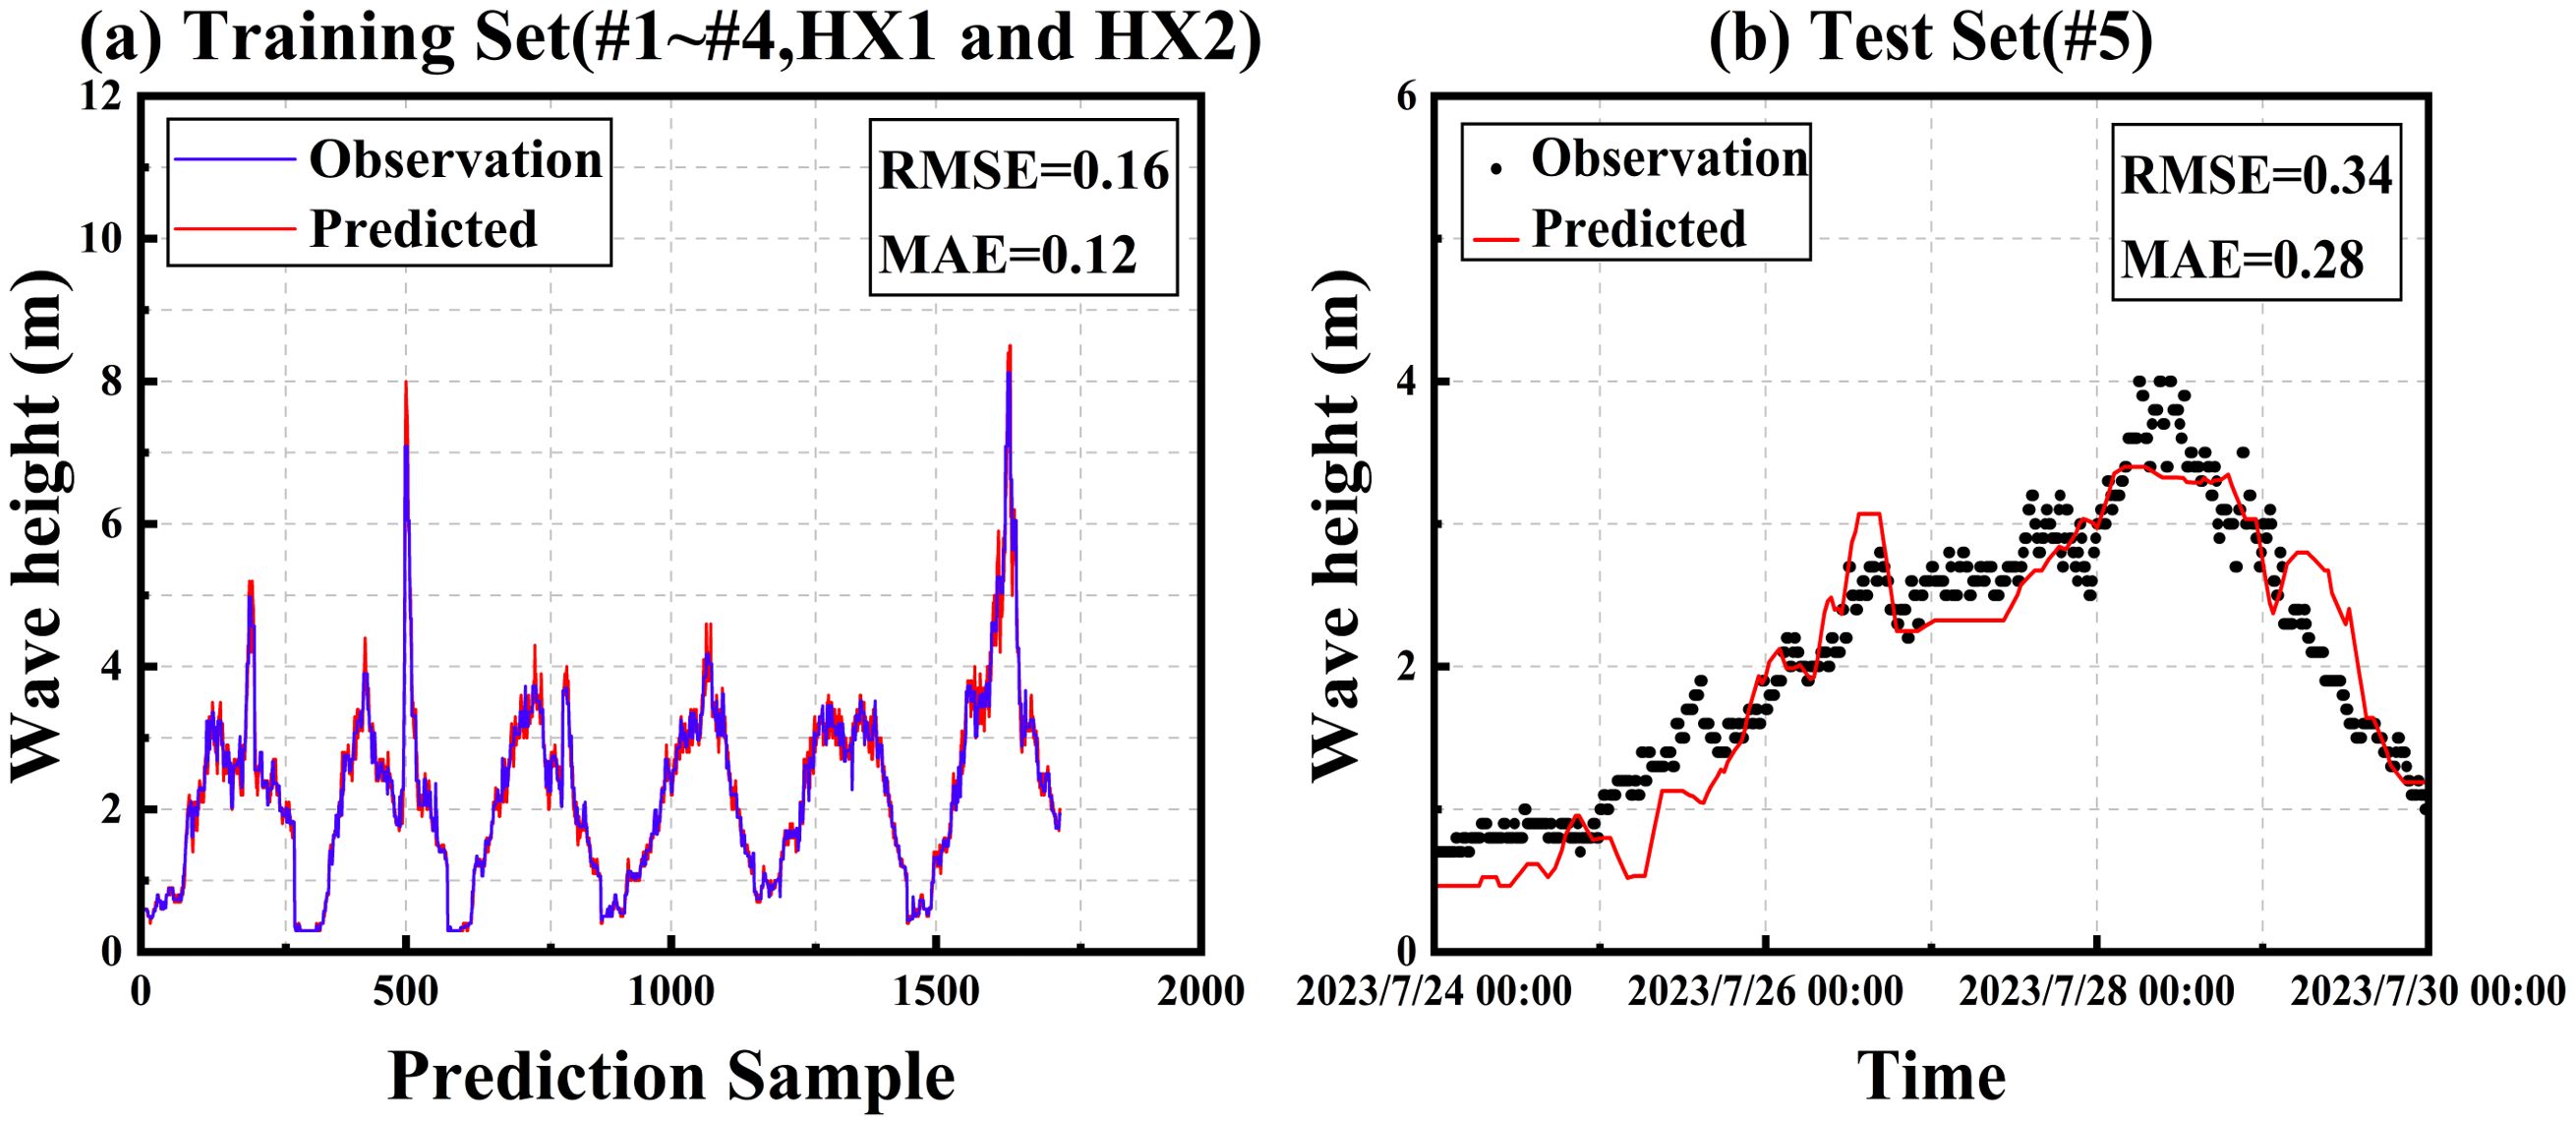
During the optimization phase, the SWAN-BP model required 58 seconds to complete, whereas the SWAN-Tree model only needed 8 seconds, demonstrating a significant advantage in computational efficiency for the SWAN-Tree model. Furthermore, as shown in Figures 8A and 9A, the performance metrics from the training set indicate that the SWAN-BP model achieved an RMSE of 0.20 and an MAE of 0.15. In comparison, the SWAN-Tree model recorded a lower RMSE of 0.16 and an MAE of 0.12, suggesting that the SWAN-Tree model not only operates more efficiently but also provides slightly better accuracy during the training phase.
Although the SWAN-Tree model demonstrates superior computational efficiency and training performance, the SWAN-BP model exhibits better performance on the test set, indicating greater robustness in generalizing to unseen data. Notably, the SWAN-BP model more accurately simulated the maximum wave height, achieving a value of 3.9 meters, as presented in Figure 8B, which is closer to the actual measured maximum wave height of 4.0 meters. In contrast, the SWAN-Tree model predicted a maximum wave height of 3.4 meters, as shown in Figure 9B. This disparity underscores the SWAN-BP model's enhanced accuracy, particularly in predicting extreme wave heights, highlighting its utility in scenarios requiring precise forecasts of severe marine conditions.
In simulating Typhoon Doksuri using the SWAN model, the RMSE recorded at buoy #5 was initially 0.45. Upon applying the SWAN-BP and SWAN-Tree models to optimize the simulation, the RMSE was reduced to 0.30 and 0.34, respectively. This improvement translates to a 33% enhancement in the accuracy of wave height predictions with the SWAN-BP model and a 24% improvement with the SWAN-Tree model. The specific error metrics for each model are detailed in Table 10, illustrating the effectiveness of these optimizations in refining the accuracy of wave height predictions during typhoon conditions.
For Typhoon Nesat (2017), the pre-existing SWAN-BP and SWAN-Tree models, initially developed and refined using data from Typhoon Doksuri (2023), were applied to retrospectively analyze wave heights, as shown in Figure 10. This application of the models to different typhoon allows for an assessment of their generalizability and effectiveness across varied meteorological conditions. This approach helps evaluate whether the models maintain their predictive accuracy when faced with different typhoon characteristics and conditions.
According to Table 11, utilizing the SWAN-BP model for wave height prediction results in a 0.14 reduction in RMSE compared to the standard SWAN-only model, marking a 23% enhancement in predictive accuracy. Similarly, the SWAN-Tree model also demonstrates improved performance, achieving a 0.13 decrease in RMSE, which corresponds to a 21% improvement in accuracy relative to the SWAN-only model. These results confirm that although these machine learning models were initially trained using data from Typhoon Doksuri, they are still effectively applicable to predicting wave heights for other typhoons, such as Nesat. This highlights the adaptability and robustness of the models across different typhoon scenarios.
Integrating machine learning techniques with traditional numerical models significantly enhances the prediction of extreme wave heights and their fluctuations, also bolsters the models' generalization capabilities across various typhoon. This methodology demonstrates the substantial potential of machine learning in elevating the accuracy of numerical ocean wave models. By combining conventional physical modeling with advanced machine learning strategies, wave height predictions can be effectively optimized. This approach addresses inherent biases in numerical models that might otherwise compromise the accuracy of using direct meteorological ocean data as input for forecasting wave heights. This synergy between machine learning and physical modeling is a promising avenue for refining predictive models in oceanography.
5 Conclusion
This analysis assesses the impact of different wind field datasets on wind speed predictions, particularly during typhoon. Synthetic wind fields, such as ERA5+Holland and CCMP+Holland, are found to outperform their reanalyzed counterparts (ERA5 and CCMP) in simulating maximum typhoon wind speeds. The use of synthetic wind fields significantly reduces prediction errors, highlighting their capacity to provide more accurate data for extreme weather. Consequently, for applications that require high precision in wind field data, the adoption of synthetic wind field datasets is strongly recommended. This method enhances the reliability of forecasts and analyses in meteorological studies, particularly in scenarios involving severe atmospheric conditions.
This study delves into the application of machine learning models to enhance wave height prediction models. By integrating the BP neural network and the random forest algorithm with the SWAN model, and testing these enhanced models using historical data from Typhoon Doksuri (2023) and Typhoon Nesat (2017), notable improvements in prediction accuracy have been observed. The resulting models, SWAN-BP and SWAN-Tree, demonstrated enhanced performance in wave height predictions. Notably, the SWAN-BP model exhibited superior robustness and accuracy, particularly in predicting extreme wave heights. This suggests that machine learning can significantly refine the capabilities of traditional wave prediction models, offering more reliable and precise forecasts for critical weather events.
The results of this study significantly enhance the existing wave post-report database. SWAN-BP and SWAN-Tree, by integrating machine learning techniques, effectively address the biases present in the SWAN model and improve the accuracy of typhoon wave predictions. These models are better equipped to handle complex marine and meteorological conditions. The improved predictive data contributes to more accurate disaster warning information, thereby strengthening safety and emergency response capabilities in coastal regions.
Data availability statement
The original contributions presented in the study are included in the article/supplementary material. Further inquiries can be directed to the corresponding author.
Author contributions
CC: Funding acquisition, Supervision, Validation, Writing – original draft, Writing – review & editing. HL: Methodology, Software, Validation, Visualization, Writing – original draft, Writing – review & editing. DG: Investigation, Methodology, Software, Writing – review & editing. FC: Investigation, Writing – review & editing. QW: Investigation, Writing – review & editing. QL: Investigation, Writing – review & editing.
Funding
The author(s) declare that financial support was received for the research, authorship, and/or publication of this article. National Natural Science Foundation of China (U22A20585); National Natural Science Foundation of China (Grant No51809047); the National Basic Research Program of China (2022YFC3106100); the Fujian Provincial Natural Science Foundation (Grant No. 2019J05029).
Conflict of interest
Author WQ and QL were employed by the company Fujian Lugang Group Co. Ltd.
The remaining authors declare that the research was conducted in the absence of any commercial or financial relationships that could be construed as a potential conflict of interest.
Publisher’s note
All claims expressed in this article are solely those of the authors and do not necessarily represent those of their affiliated organizations, or those of the publisher, the editors and the reviewers. Any product that may be evaluated in this article, or claim that may be made by its manufacturer, is not guaranteed or endorsed by the publisher.
References
Afzal M. S., Kumar L. (2022). Propagation of waves over a rugged topography. J. Ocean Eng. Sci. 7, 14–28. doi: 10.1016/j.joes.2021.04.004
Akpinar A., Ponce de León S. (2016). An assessment of the wind re-analyses in the modelling of an extreme sea state in the Black Sea. Dynam. Atmos. Oceans 73, 61–75. doi: 10.1016/j.dynatmoce.2015.12.002
Booij N., Ris R. C., Holthuijsen L. H. (1999). A third-generation wave model for coastal regions: 1. Model. descript. valid. J. Geophys. Res. Oceans 104, 7649–7666. doi: 10.1029/98JC02622
Carr L. E., Elsberry R. L. (1997). Models of tropical cyclone wind distribution and beta-effect propagation for application to tropical cyclone track forecasting. Mon Weather Rev. 125, 3190–3209. doi: 10.1175/1520-0493(1997)125<3190:MOTCWD>2.0.CO;2
Feng X., Chen X. (2021). Feasibility of ERA5 reanalysis wind dataset on wave simulation for the western inner-shelf of Yellow Sea. Ocean Eng. 236, 109413. doi: 10.1016/j.oceaneng.2021.109413
Gao C., Zheng C. (2018). Analysis of typhoon waves caused by westbound path typhoons. Harbin Eng. Univ. 39, 1158–1164. doi: 10.11990/jheu.201612099
Gong Y., Dong S., Wang Z. (2022). Forecasting of typhoon wave based on hybrid machine learning models. Ocean Eng. 266, 112934. doi: 10.1016/j.oceaneng.2022.112934
Holland G. J. (1980). An analytic model of the wind and pressure profiles in hurricanes. Mon Weather Rev. 108, 1212–1218. doi: 10.1175/1520-0493(1980)108<1212:AAMOTW>2.0.CO;2
Hoque M., Perrie W., Solomon S. M. (2020). Application of SWAN model for storm generated wave simulation in the Canadian Beaufort Sea. J. Ocean Eng. Sci. 5, 19–34. doi: 10.1016/j.joes.2019.07.003
Hou Y., Yi B., Guang C. (2020). Progress and prospect in research on marine dynamin disasters in China. Oceanol. Limnol. 51, 759–767. doi: 10.11693/hyhz20200100029
Ibukahla M., Sombria J., Castanie F., Bershad N. J. (1997). Neural networks for modeling nonlinear memoryless communication channels. IEEE Trans. Commun. 45, 768–771. doi: 10.1109/26.602580
James S. C., Zhang Y., O’Donncha F. (2018). A machine learning framework to forecast wave conditions. Coast. Eng. 137, 1–10. doi: 10.1016/j.coastaleng.2018.03.004
Li X., Ding J., Huang J. (2021). Performance assessment of different wind forcing datasets for simulation of wind wave during typhoon. Hydro-Sci. Eng. 6, 34–42. doi: 10.12170/20210928001
Li J., Zhu Y., Xu J., Yao Y. (2023). A comparative study on the applicability of ERA-Interim and ERA5 reanalysis wind data in the coastal waters of China. Mar. Sci. Bull. 42, 260–271. doi: 10.11840/j.issn.1001-6392.2023.03.003
Londhe S. N., Panchang V. (2018). ANN techniques: A survey of coastal applications, in: advances in coastal hydraulics. World Sci. pp, 199–234. doi: 10.1142/9789813231283_0006
Luo F., Zhang J., Quan X., Wang Y. (2023). Application of machine learning-based methods to short-term forecasting of typhoon waves. Oceanol. Limnol. 45, 8–16.
Ma X., Wei L. (2024). Numerical simulation of typhoon waves based on the holland typhoon model and triple nested wave pattern. Oceanol. Limnol. 55, 51–64. doi: 10.11693/hyhz20230800176
Majidi A. G., Ramos V., Amarouche K., Rosa Santos P., das Neves L., Taveira-Pinto F. (2023). Assessing the impact of wave model calibration in the uncertainty of wave energy estimation. Renew Energy 212, 415–429. doi: 10.1016/j.renene.2023.05.049
Malekmohamadi I., Bazargan-Lari M. R., Kerachian R., Nikoo M. R., Fallahnia M. (2011). Evaluating the efficacy of SVMs, BNs, ANNs and ANFIS in wave height prediction. Ocean Eng. 38, 487–497. doi: 10.1016/j.oceaneng.2010.11.020
Ortiz-Royero J. C., Mercado-Irizarry A. (2008). An intercomparison of swan and wavewatch III models with data from NDBC-NOAA buoys at oceanic scales. Coast. Eng. J. 50, 47–73. doi: 10.1142/S0578563408001739
Ou S.-H., Liau J.-M., Hsu T.-W., Tzang S.-Y. (2002). Simulating typhoon waves by SWAN wave model in coastal waters of Taiwan. Ocean Eng. 29, 947–971. doi: 10.1016/S0029-8018(01)00049-X
Rizianiza I., Aisjah A. S. (2015). Prediction of significant wave height in The Java Sea using Artificial Neural Network, in: 2015 International Seminar on Intelligent Technology and Its Applications (ISITIA). IEEE pp, 5–9. doi: 10.1109/ISITIA.2015.7219944
Shamshirband S., Mosavi A., Rabczuk T., Nabipour N., Chau K. (2020). Prediction of significant wave height; comparison between nested grid numerical model, and machine learning models of artificial neural networks, extreme learning and support vector machines. Eng. Appl. Comput. Fluid Mechan. 14, 805–817. doi: 10.1080/19942060.2020.1773932
Tang Z., Melville B., Shamseldin A., Guan D., Singhal N., Yao Z. (2023). Experimental study of collar protection for local scour reduction around offshore wind turbine monopile foundations. Coast. Eng. 183, 104324. doi: 10.1016/j.coastaleng.2023.104324
Tolman H. L. (1991). A third-generation model for wind waves on slowly varying, unsteady, and inhomogeneous depths and currents. J. Phys. Oceanogr. 21, 782–797. doi: 10.1175/1520-0485(1991)021<0782:ATGMFW>2.0.CO;2
Umesh P. A., Behera M. R. (2021). On the improvements in nearshore wave height predictions using nested SWAN-SWASH modelling in the eastern coastal waters of India. Ocean Eng. 236, 109550. doi: 10.1016/j.oceaneng.2021.109550
Willemsen J. F. (1997). Dynamics and modelling of ocean waves. Dynam. Atmos. Oceans 25, 276–278. doi: 10.1016/0377-0265(95)00469-6
Wornom S. F., Welsh D. J. S., Bedford K. W. (2001). On coupling the swan and wam wave models for accurate nearshore wave predictions. Coast. Eng. J. 43, 161–201. doi: 10.1142/S0578563401000335
Wornom S. F., Welsh D. J. S., Bedford K. W. (2002a). The effect of the wave propagation scheme on nearshore wave predictions. Coast. Eng. J. 44, 359–371. doi: 10.1142/S0578563402000597
Wornom S. F., Welsh D. J. S., Bedford K. W. (2002b). An MPI quasi time-accurate approach for nearshore wave prediction using the swan code part I: method. Coast. Eng. J. 44, 247–256. doi: 10.1142/S0578563402000524
Keywords: typhoon waves, SWAN model, machine learning, back propagation neural network, random forest, optimization
Citation: Chen C, Lin H, Guan D, Cai F, Wang Q and Liu Q (2024) Enhancing typhoon wave hindcasting with random forests and BP neural networks in the SWAN model. Front. Mar. Sci. 11:1472047. doi: 10.3389/fmars.2024.1472047
Received: 28 July 2024; Accepted: 03 September 2024;
Published: 19 September 2024.
Edited by:
Donald B. Olson, University of Miami, United StatesReviewed by:
Guoxiang Wu, Ocean University of China, ChinaDake Chen, Nanjing Hydraulic Research Institute, China
Copyright © 2024 Chen, Lin, Guan, Cai, Wang and Liu. This is an open-access article distributed under the terms of the Creative Commons Attribution License (CC BY). The use, distribution or reproduction in other forums is permitted, provided the original author(s) and the copyright owner(s) are credited and that the original publication in this journal is cited, in accordance with accepted academic practice. No use, distribution or reproduction is permitted which does not comply with these terms.
*Correspondence: Cheng Chen, Y2hlbmNoZW5nXzExMTdAMTYzLmNvbQ==
 Cheng Chen
 Hongkun Lin1