- 1Bergverk AS, Sandefjord, Norway
- 2AkerBP ASA, Lysaker, Norway
We present a new dataset combined with the DeepSee model, which utilizes the YOLOv8 architecture, designed to rapidly and accurately detect benthic lifeforms in deep-sea environments of the North Atlantic. The dataset consists of 2,825 carefully curated images, encompassing 20,076 instances across 15 object-detection classes based on morphospecies from the phyla Arthropoda, Chordata, Cnidaria, Echinodermata, and Porifera. When benchmarked against a published dataset from the same region, DeepSee achieves high performance metrics, including an impressive mean Average Precision (mAP) score of 0.84, and produces very few false positives, ensuring reliable detection. The model processes images at 28–50 frames per second (fps) for images sized at 1280 pixels, significantly increasing processing speed and reducing annotation workloads by over 1000 times when compared to manual annotation. While the model is not intended to replace the expertise of experienced biologists, it provides a valuable tool for accelerating data analysis and increasing efficiency. As additional data becomes available, augmenting the dataset and retraining the model will enable further improvements in detection capabilities. The dataset and model are designed for extensibility, allowing for the inclusion of other benthic lifeforms from the North Atlantic and beyond. This capability supports the creation of high-resolution maps of benthic life on the largely unexplored ocean floor of the Norwegian Continental Shelf (NCS) and other regions. This will facilitate informed decision-making in marine resource exploration, including mining operations, bottom trawling, and deep-sea pipeline laying, while also contributing to marine conservation and the sustainable management of deep-sea ecosystems.
1 Introduction
The deep sea remains one of the least explored frontiers on Earth, with limited high-resolution data available on its biological diversity. Previous work in this domain has often been constrained by the low resolution and limited scope of available data (Ramirez-Llodra et al., 2010). Recent advancements in technology have resulted in large amounts of high-resolution images and video footage captured by remotely operated vehicles (ROVs). While this wealth of data holds immense potential for scientific discovery, e.g. of new megafaunal species or communities, the sheer volume makes manual annotation of observed megafaunal species impractical. This is where machine learning (ML) can play a pivotal role, automating the annotation process and enabling more efficient analysis of these vast datasets. Notably, studies (Schoening et al., 2016; Liu and Wang, 2021; Fu et al., 2022; Liu et al., 2023; Lyu et al., 2023; Xu et al., 2023; Geisz et al., 2024) have demonstrated the efficacy of object detection/segmentation techniques in similar environments, underscoring the potential of ML in this field.
The objective here is to contribute to the emerging, high-resolution database on benthic life by leveraging ML to process and annotate the extensive video footage particularly in the North Atlantic. Object detection in computer vision involves identifying and localizing objects within an image. The method provides both the classification of objects and their precise locations within the image. This is particularly useful in various applications such as autonomous driving, security surveillance, and environmental monitoring. Over the past two decades, object detection has undergone a remarkable evolution, with several groundbreaking models significantly advancing the field. Region-based Convolutional Neural Networks (R-CNN) (Girshick et al., 2014) introduced a two-stage approach involving region proposals and classification. Fast R-CNN (Girshick, 2015) and Faster R-CNN (Ren et al., 2015) improved speed and efficiency by integrating these stages and introducing a Region Proposal Network. The Single Shot MultiBox Detector (SSD) (Liu et al., 2016) uses a single network to predict bounding boxes and class probabilities directly, enhancing speed while maintaining accuracy. The You Only Look Once (YOLO) (Redmon et al., 2016) family of models is a single stage detector that uses one pass of the network to identify and classify objects, significantly improving speed by predicting bounding boxes and class probabilities simultaneously. Subsequent versions (Redmon and Farhadi, 2017; Wang et al., 2023; Redmon and Farhadi, 2018; Bochkovskiy et al., 2020; Jocher, 2020; Jocher, 2023; Wang A. et al., 2024; Wang C.-Y. et al., 2024) introduced various enhancements including batch normalization, deeper networks, and optimized feature aggregation. These models offer various trade-offs between accuracy, speed, and computational complexity, with the choice depending on specific application requirements.
In this paper, we present the DeepSee dataset, a comprehensive collection of annotated images from the Arctic Mid-Ocean Ridge, the Norwegian Sea, and the Greenland Sea. This dataset is designed to support the development of ML models capable of detecting and classifying benthic organisms. The DeepSee object detection model, trained on this dataset, is capable of processing vast amounts of footage quickly with high precision and recall. The model provides a valuable addition to the traditional workflow of manual annotation by significantly reducing the load on human annotators. By deploying such models, we aim to streamline the annotation process, making it easier for biologists to conduct their research and ultimately supporting informed decision-making regarding deep-sea resource management and protection.
The implications of our work, and others like it, extend beyond mere academic inquiry; they are particularly relevant in the context of various anthropogenic activities that can disturb benthic ecosystems.
Mining Operations: As deep-sea mining becomes increasingly viable, particularly with recent proposals from the Norwegian government to open parts of its Exclusive Economic Zone (EEZ) for mining operations (https://www.regjeringen.no/no/aktuelt/horing-av-forste-konsesjonsrunde-for-havbunnsmineraler/id3047008/) and the ongoing interest in mining polymetallic nodules in the Clarion-Clipperton Zone (CCZ) (Gollner et al., 2022), object detection models can help monitor biodiversity as well as community and abundance changes in these areas. By identifying sensitive habitats and taxa before mining activities commence, stakeholders can make informed decisions that minimize ecological impact.
Bottom Trawling: This fishing method has been criticized for its destructive effects on seafloor habitats over vast areas globally (Kroodsma et al., 2018). Our models can be employed to assess areas impacted by bottom trawling by detecting and cataloging benthic life before and after trawling events. This data can be used to guide regulations aimed at sustainable fishing practices.
Deep-Sea Pipeline Laying: The installation of pipelines for oil and gas transport poses risks to benthic ecosystems (Clare et al., 2023). By utilizing our object detection capabilities during pipeline construction projects, operators can identify critical habitats that need protection or monitoring during installation processes.
Environmental Monitoring: Continuous monitoring of deep-sea environments is crucial for assessing changes over time due to climate change or human activity. Our ML models can add to the toolbox of deep-sea benthic monitoring (Lim et al., 2020; Gallego et al., 2024) by automating the detection of shifts in species distribution or abundance, providing timely data that can influence conservation strategies.
Marine Protected Areas (MPAs): Effective management of MPAs requires robust data on biodiversity within these regions. Today, proposed MPAs of the NE Atlantic largely depend on biophysical habitat mapping founded on bathymetric analysis (Evans et al., 2015; Legrand et al., 2024). Our dataset and models can facilitate ongoing assessments of benthic life within MPAs, ensuring that these protected areas fulfill their conservation objectives.
Pollution Tracking: The detection of marine debris is increasingly important as pollution levels rise in oceanic environments. Our models can assist in identifying and quantifying debris impacts on benthic communities, contributing to efforts aimed at mitigating pollution effects.
In summary, integrating advanced machine learning techniques into deep-sea research workflows enhances our understanding of benthic ecosystems and provides valuable tools for addressing human impacts on these environments. Our work seeks to promote collaboration between technology and biology, contributing to informed decision-making in deep-sea resource management through accurate, rapid and comprehensive ecological data analysis.
2 Methods
2.1 Model
In this study, we utilize the YOLOv8 model architecture as the basis of the DeepSee model for detecting benthic lifeforms on the ocean floor. The model is selected for its balance of speed and accuracy, making it well-suited for processing large volumes of underwater imagery efficiently. YOLOv8 begins by dividing the input image into a grid of cells. Each cell is responsible for detecting objects that fall within its area. The model uses a deep convolutional neural network (CNN) to extract important features from the image. This process identifies key details such as edges, shapes, and textures, which are crucial for recognizing different objects. For each cell in the grid, YOLOv8 predicts multiple bounding boxes. A bounding box is an imaginary rectangle that outlines where an object is located in the image. Along with the coordinates (center point, width, and height) of these boxes, the model also predicts a confidence score that indicates how likely it is that an object of a certain class (a particular morphospecies in this study) is present within that box. Each bounding box prediction comes with class probabilities. This means that for each box, YOLOv8 assigns a score to each possible object class, indicating how likely it is that the object belongs to each class. After predicting multiple bounding boxes for potential objects, YOLOv8 uses a technique called non-maxima suppression to eliminate overlapping boxes. This step ensures that only the most accurate bounding boxes are retained for each detected object, reducing clutter and improving clarity in the final output.
To detect benthic lifeforms, the DeepSee model is trained on a custom dataset comprising underwater images annotated with various benthic species. The training utilizes the YOLOv8x model weights (largest model in the family) as a starting point to leverage the advanced features of this architecture and to maximize prediction accuracy. Initially, the AdamW optimizer is employed for the first 10,000 iterations which helps with initial convergence. After 10,000 iterations, the optimizer is switched to Stochastic Gradient Descent (SGD) to refine the model further. SGD is known for its stability and convergence properties, which are beneficial in the later stages of training to fine-tune the weights precisely. To enhance the model’s performance, data augmentation techniques are applied during training. These include random rotations, flips, scaling, color adjustments and image and label blending to simulate various underwater conditions and improve the model’s robustness. The default loss function is used in training which is a composite of three components: “box”, “dfl”, and “cls”. The “box” loss refers to the loss associated with bounding box regression, ensuring the predicted boxes accurately localize the benthic organisms. The “dfl”, or Distribution Focal Loss, focuses on the distribution of predictions to enhance the model’s confidence in detecting objects and minimizes the effects of class imbalance in the dataset. The “cls” component is the standard classification Cross Entropy Loss, which deals with the accuracy of class predictions. Other hyperparameters including the learning rate and loss function weighting are tuned on the dataset over multiple iterations, each lasting 200 epochs. Through this comprehensive training procedure, the DeepSee model is fine-tuned to effectively detect and classify benthic lifeforms. Final training is carried out over 400 epochs with an early stopping criterion of 100 epochs, i.e. the model will stop training if no improvement is detected over 100 epochs. The best model over these epochs is used for inference.
2.2 Dataset
The DeepSee dataset is initially constructed using frame grabs (906 images) from videos captured by remotely operated vehicles (ROVs) during deep-sea surveys in the Arctic Mid-Ocean Ridge, the Norwegian Sea, and the Greenland Sea (Figure 1). The locations are mostly from regions broadly classified as marine mountainous terrain. High-quality images, where instances of one or more classes are distinctly visible, are selected for the training dataset. Note that class in this context is a ML-term that represents a distinct object, not to be confused with the biological taxonomic rank ‘class’. An instance refers to an occurrence of a class in an image.
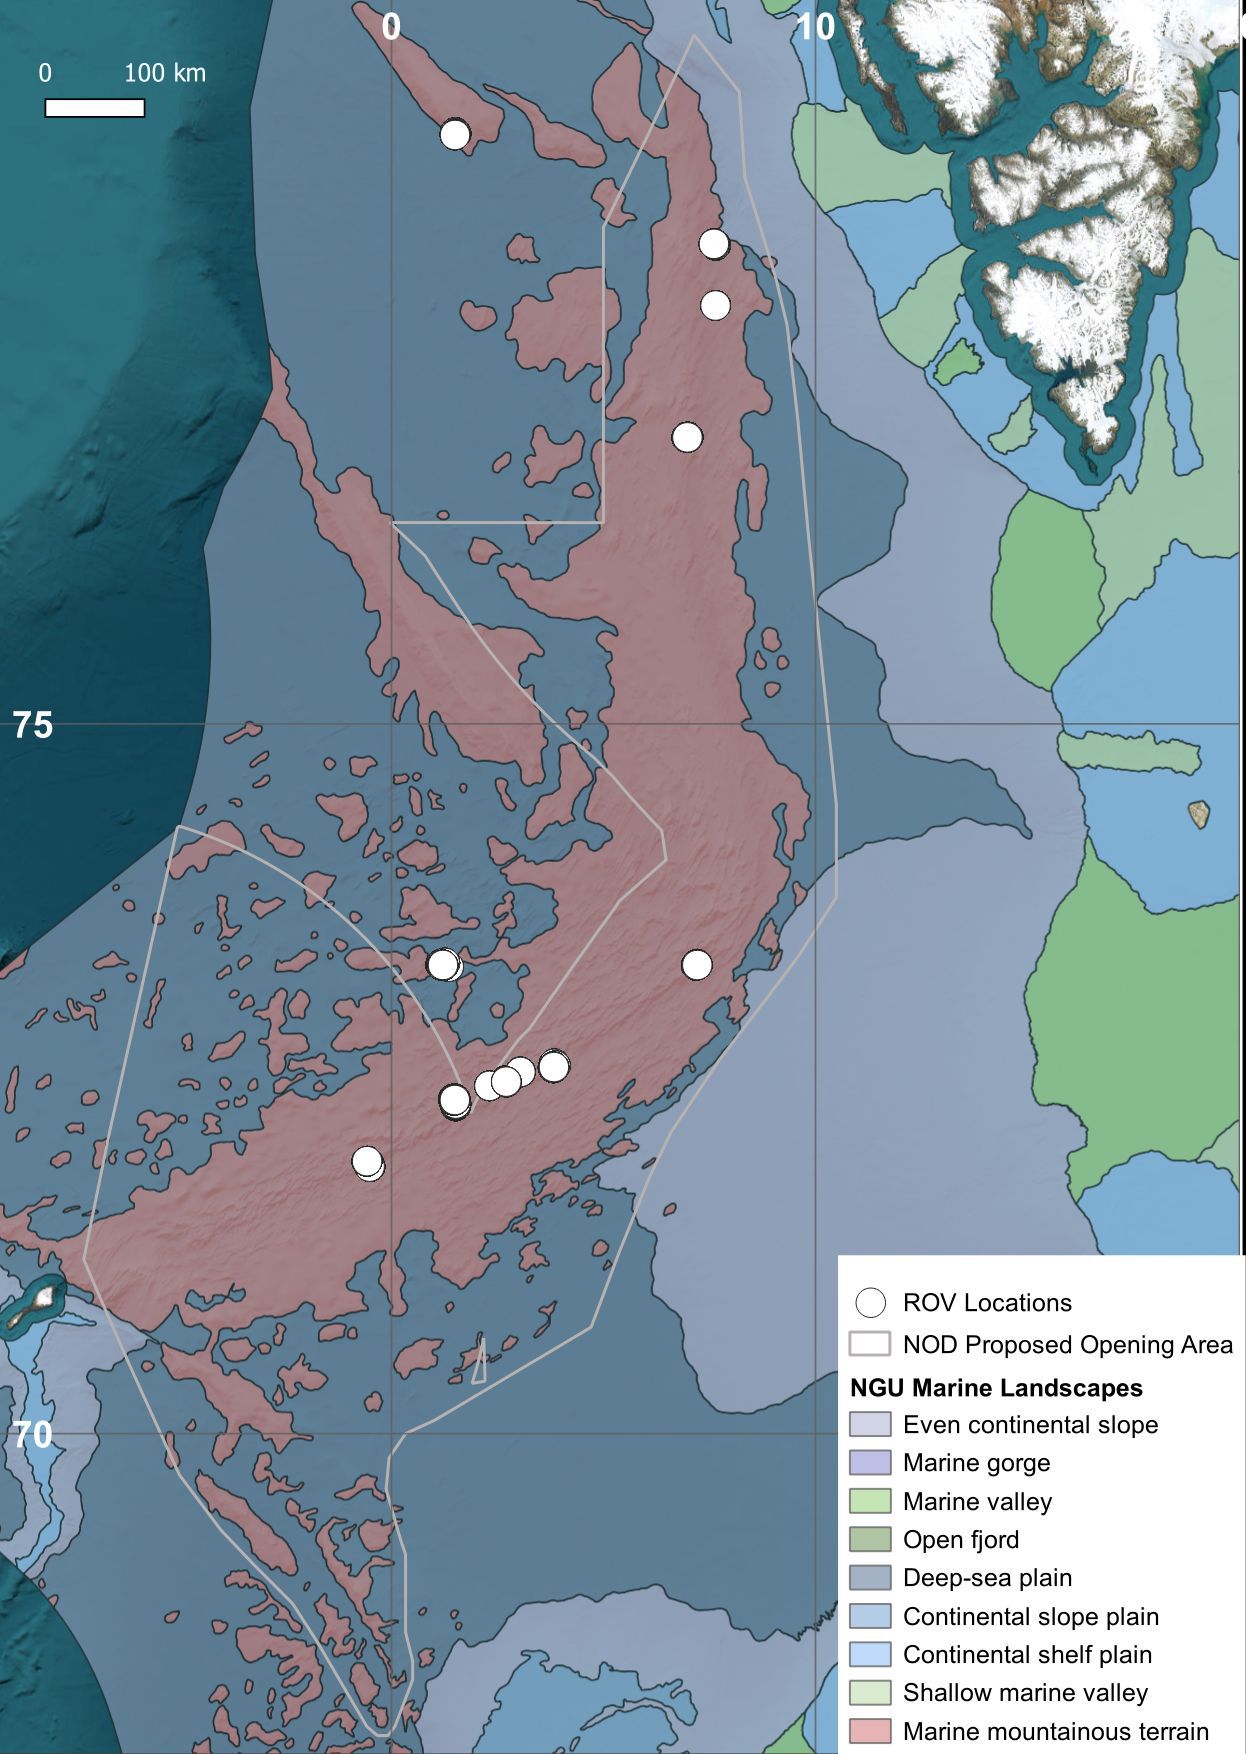
Figure 1. Map of the Northeast Atlantic showing the locations of ROV footage used in the DeepSee dataset. The marine landscape layer is produced by the Geological Survey of Norway (https://www.ngu.no/en/geologiske-kart/datasett).
Variations in camera equipment, video resolution, ROV altitude and speed, and lighting conditions introduce significant diversity in image quality, presenting challenges in selecting appropriate training material. While this variation can enhance the model’s ability to classify unseen data (Geisz et al., 2024), it is crucial to maintain high image and annotation quality to prevent an increase in false positives. Therefore, careful selection of training data is essential. The ROV camera perspectives range from top-down views to sub-parallel orientations relative to the seafloor, providing a comprehensive dataset with the organisms seen from multiple angles. Optimal video material includes segments with at least full HD resolution, sufficient lighting, minimal seafloor sampling activity to avoid obscured views from suspended particulate matter, and proximity to the seafloor to ensure good visibility of organisms and their morphological characteristics. Some images are cropped to exclude cases where organisms are not fully visible or cannot be clearly identified as a unique class to reduce erroneous detections. To enhance dataset diversity and increase the number of instances per class, additional images from published datasets have been incorporated. These include images of megabenthic communities from the Schulz Bank (Meyer et al., 2022; Meyer et al., 2023) (141 images), ophiuroids (Marnor, 2022) (74), and various fish and asteroids species from the Open Images Dataset V6/7 (Kuznetsova et al., 2020) (1778 images). It should be noted that the Open Images Dataset contains more than 10,000 images of fish and asteroids which largely consist of shallow water species. These images included many incorrect annotations that needed significant manual revision and curation. This comprehensive approach aims to improve the model’s robustness and accuracy in detecting benthic life in the deep sea.
The resulting dataset comprises 2,825 images, each annotated with bounding boxes by a single observer. To ensure consistency, a second observer conducts a quality check of the annotations. Overall, the images contain 20,076 instances across 15 different lifeform classes (Figures 2, 3, Supplementary Table S1). The classes are chosen based on distinct morphospecies and groups of morphospecies that share a similar morphology. The classes must have enough instances in the video and image material so that they can be used for training, e.g. some organisms like the octopus Cirrotheutis muelleri have been observed in the video footage but cannot be used to train the model due to their rarity. Organism taxonomy is based on the World Register of Marine Species database. The observed deep-sea environment in the dataset ranges from sedimentary plains to hard substrate areas, and from desolate areas with few visible organisms to diversity hot spots like sponge grounds. Most of the detected classes are mainly associated with hard substrate. Some organisms, like sea stars, brittle stars, and sea anemones are observed both on hard and soft substrates. In sediment dominated areas single rocks or rocky outcrops are frequently observed with sponges, crinoids and/or soft corals.
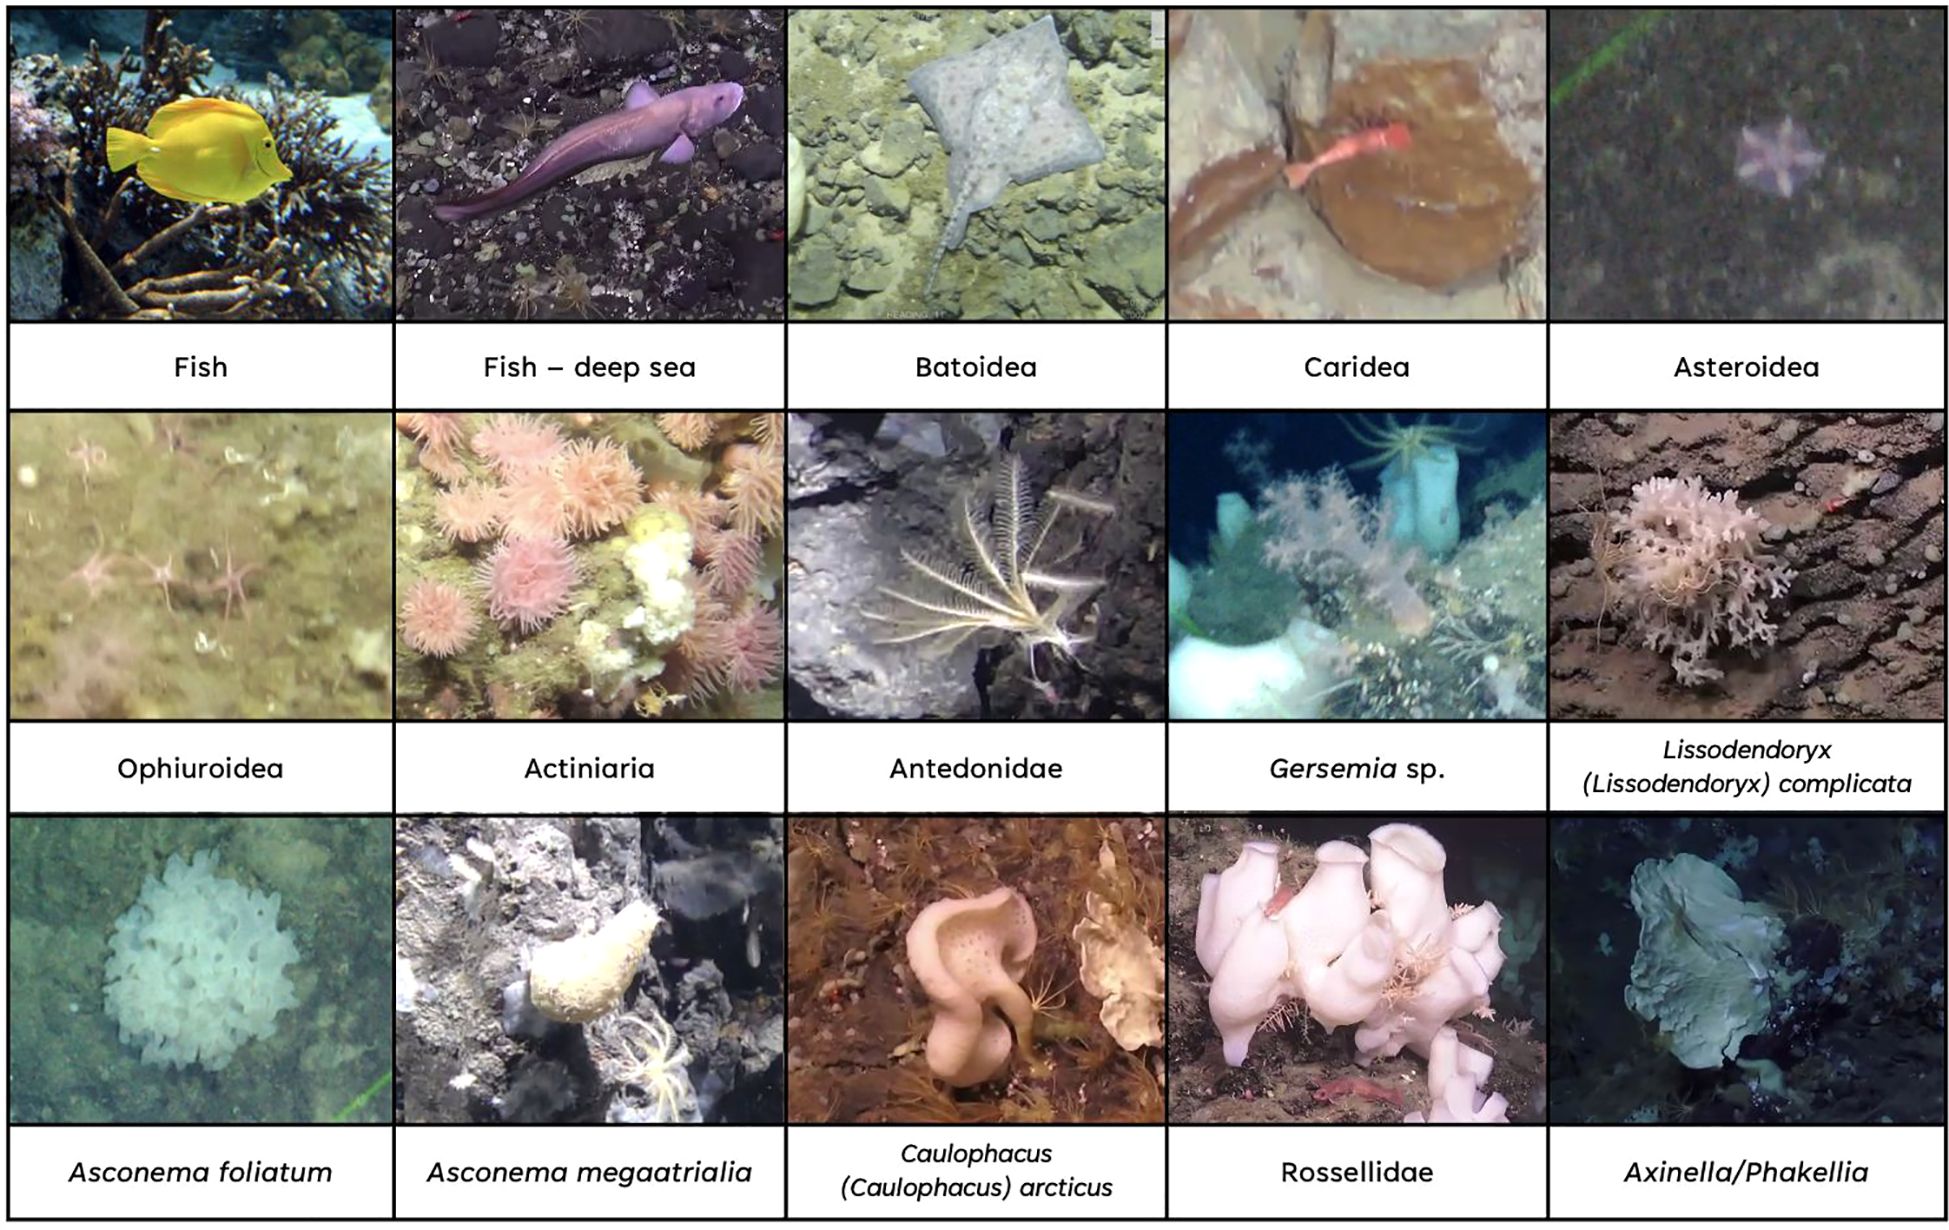
Figure 2. Example instances of the different classes in the DeepSee dataset. The image of the Fish class is from the Open Image Dataset V6/7.
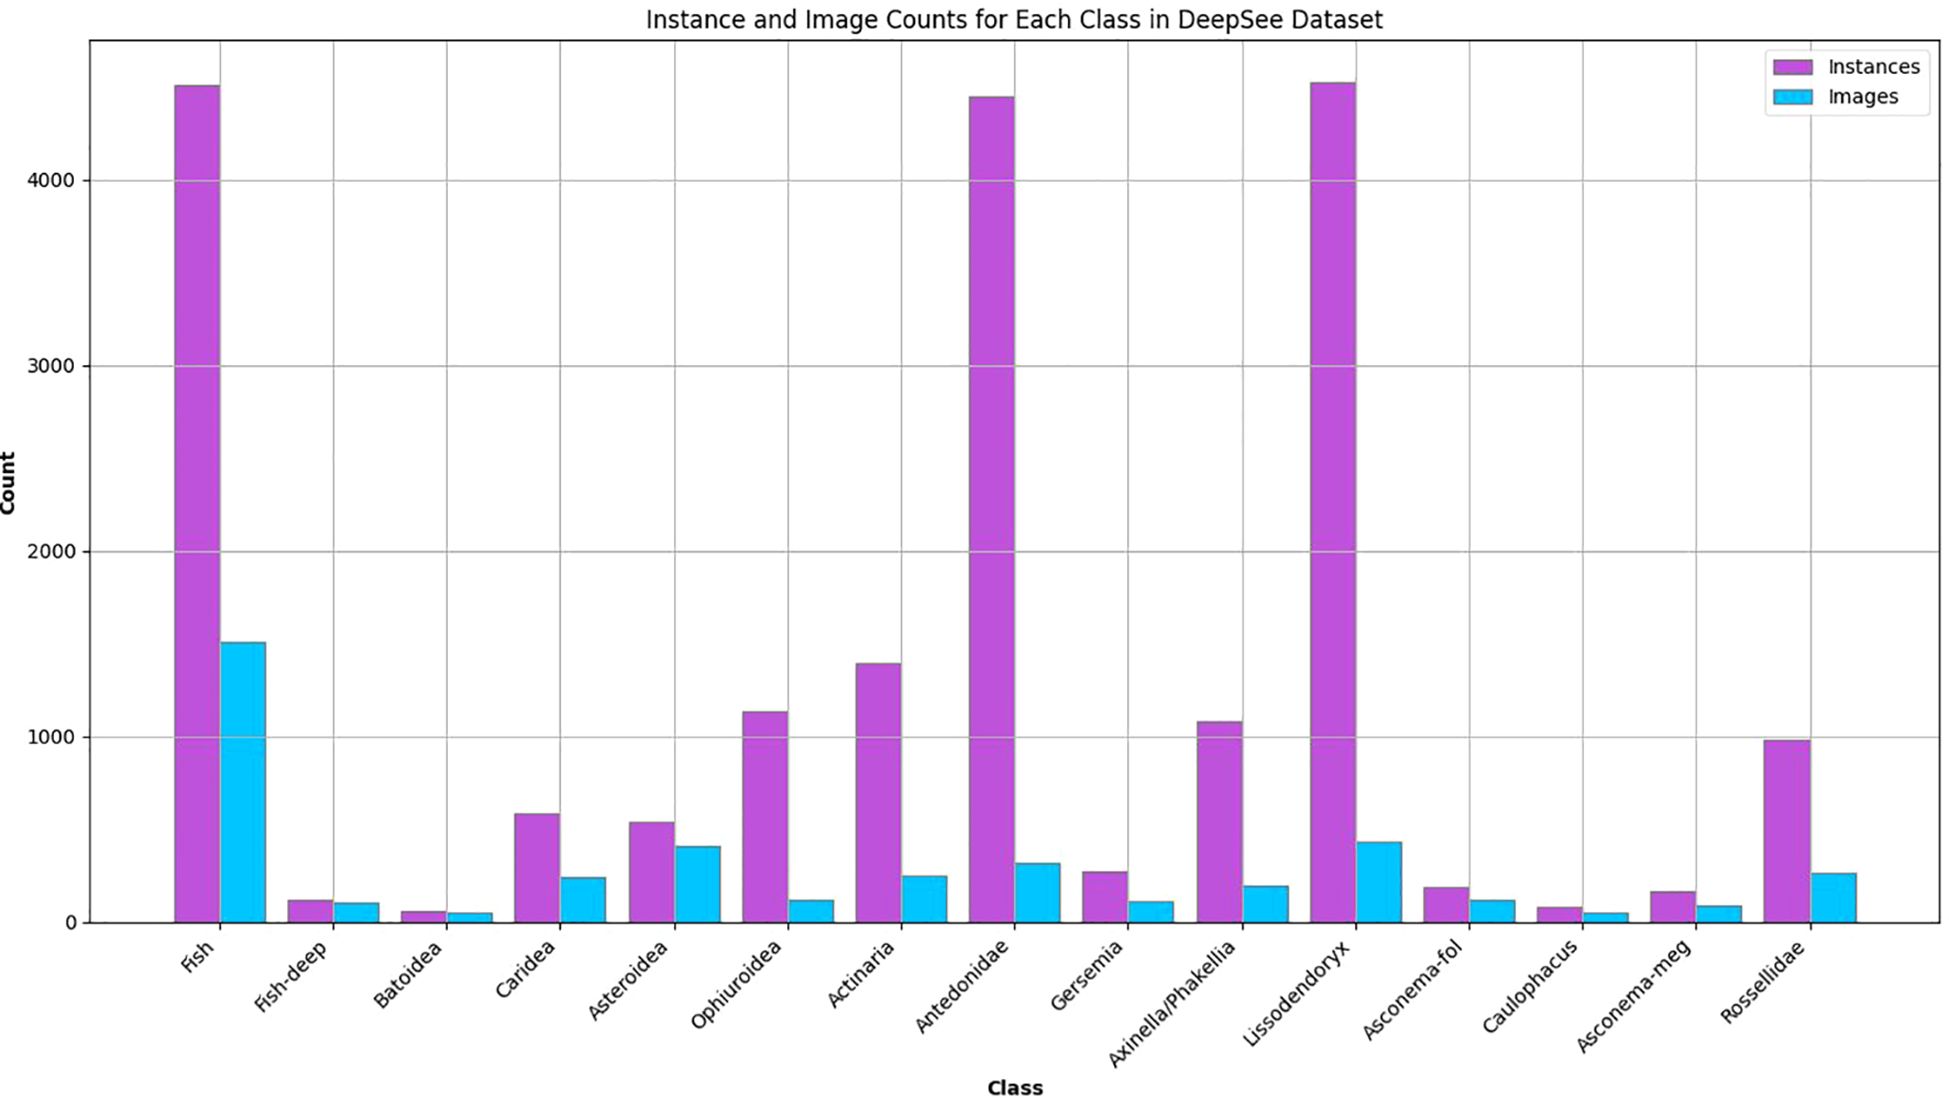
Figure 3. Distribution of instances and images per class in the DeepSee training/validation dataset.
Phylum: Arthropoda
● Caridea: Several different morphospecies of shrimps. The deep-sea shrimp Bythocaris is the most abundant one in the training dataset. Only the body is annotated. Legs and antennas are not included in the bounding box as these features are usually not visible in the data.
Phylum: Chordata
● Chordata are divided into three different classes based on morphology: Fish, Fish – deep sea, and Batoidea.
● Fish: Based on the downloaded images from Open Images and covers a large variety of fish, mostly tropical fish.
● Fish – deep sea: Fish associated with the deep-sea seafloor in the ROV video material. Some relevant morphospecies in this class are Glacial eelpout (Lycodes frigidus), Arctic rockling (Gaidropsarus argentatus), Threadfin seasnail (Rhodichthys regina) and Black seasnail (Paraliparis bathybius) (Brodnicke et al., 2023). Shortened to Fish-deep for annotation.
● Batoidea: Skates and rays. These can be morphologically distinguished from the other fish and are annotated as a separate class. Arctic skate (Amblyraja hyperborea) is an example of an observed morphospecies from this class.
Phylum: Cnidaria
● Actiniaria: Instances of sea anemones. Actiniarians are observed both on hard substrates and in soft sediment areas. They are only annotated when the central disc and tentacles are visible. Individuals with withdrawn tentacles are not annotated since the morphology is not unique.
● Gersemia: Soft corals with morphology resembling that of genus Gersemia. An indicator of cauliflower coral gardens (Albrecht et al., 2020; Ramirez-Llodra et al., 2024).
Phylum: Echinodermata
● Asteroidea: Instances of sea stars. All observations of sea stars, including individuals with more than 5 arms. Sea stars are observed on both hard and soft substrates, and on sponges.
● Ophiuroidea: Instances of brittle stars. Compared to sea stars, brittle stars have a rounder central disc and thinner arms that are more clearly separated from each other on the central disc. Brittle stars are observed in high abundances and densities in some areas, mainly soft sediment areas.
● Antedonidae: Instances of unstalked crinoids. They are usually observed on hard substrates and on other sponges, sometimes in high abundance. There are two relevant species that have a morphology too similar to be differentiated with ML currently: Poliometra prolixa and Heliometra glacialis (Ramirez-Llodra et al., 2020; Pedersen et al., 2022). They are collectively annotated under the family Antedonidae. The instances are annotated when their characteristic morphology is visible either from the side or from above.
Phylum: Porifera
● Lissodendoryx (Lissodendoryx) complicata: A relatively small, bush-shaped white demosponge that often can be identified based on its morphology (Marmen et al., 2019). L. (L.) complicata is a common sponge in arctic sponge grounds (Mayer and Piepenburg, 1996; Meyer et al., 2019). Shortened to Lissodendoryx for annotation.
● Asconema foliatum: Bush-shaped glass sponge like L. (L.) complicata but greyer and less dendritic. An indicator species for arctic sponge grounds (Albrecht et al., 2020; Ramirez-Llodra et al., 2024). Shortened to Asconema-fol for annotation.
● Asconema megaatrialia: Brownish, vase-shaped glass sponge. Shortened to Asconema-meg for annotation.
● Caulophacus (Caulophacus) arcticus: A common glass sponge in the Norwegian Sea and an indicator species for arctic sponge grounds (Buhl-Mortensen et al., 2019; Albrecht et al., 2020). C. (C.) arcticus is only annotated when the top and stalk are visible, as the top part alone can look like other sponges. Shortened to Caulophacus for annotation.
● Axinella/Phakellia: White fan-shaped sponges most likely belonging to the Phakellia and Axinella genera (Buhl-Mortensen et al., 2019; Pedersen et al., 2022). Indicators for hard-bottom sponge grounds (Albrecht et al., 2020).
● Rossellidae: Three species of white, vase-shaped glass sponges in the family Rosselidae grouped together due to similar morphology (Meyer et al., 2023): Schaudinnia rosea, Trichasterina borealis and Scyphidium septentrionale. These are structure-forming sponges and indicators for arctic sponge grounds (Albrecht et al., 2020; Meyer et al., 2023; Ramirez-Llodra et al., 2024).
Organisms are only annotated if it was possible to classify them into one of the classes without context (i.e., not by association with another individual from the same class present in the image). For some classes that tend to occur in clusters, like L. (L.) complicata and Rossellidae, it is challenging to distinguish individuals from each other. These are annotated as separate individuals where there is a clear spatial separation visible between the specimens in the image. L. (L.) complicata is only labelled if it is represented as at least a small “bush”. Small dendritic fractions are not annotated as they cannot be uniquely identified as such.
2.3 Training and validation
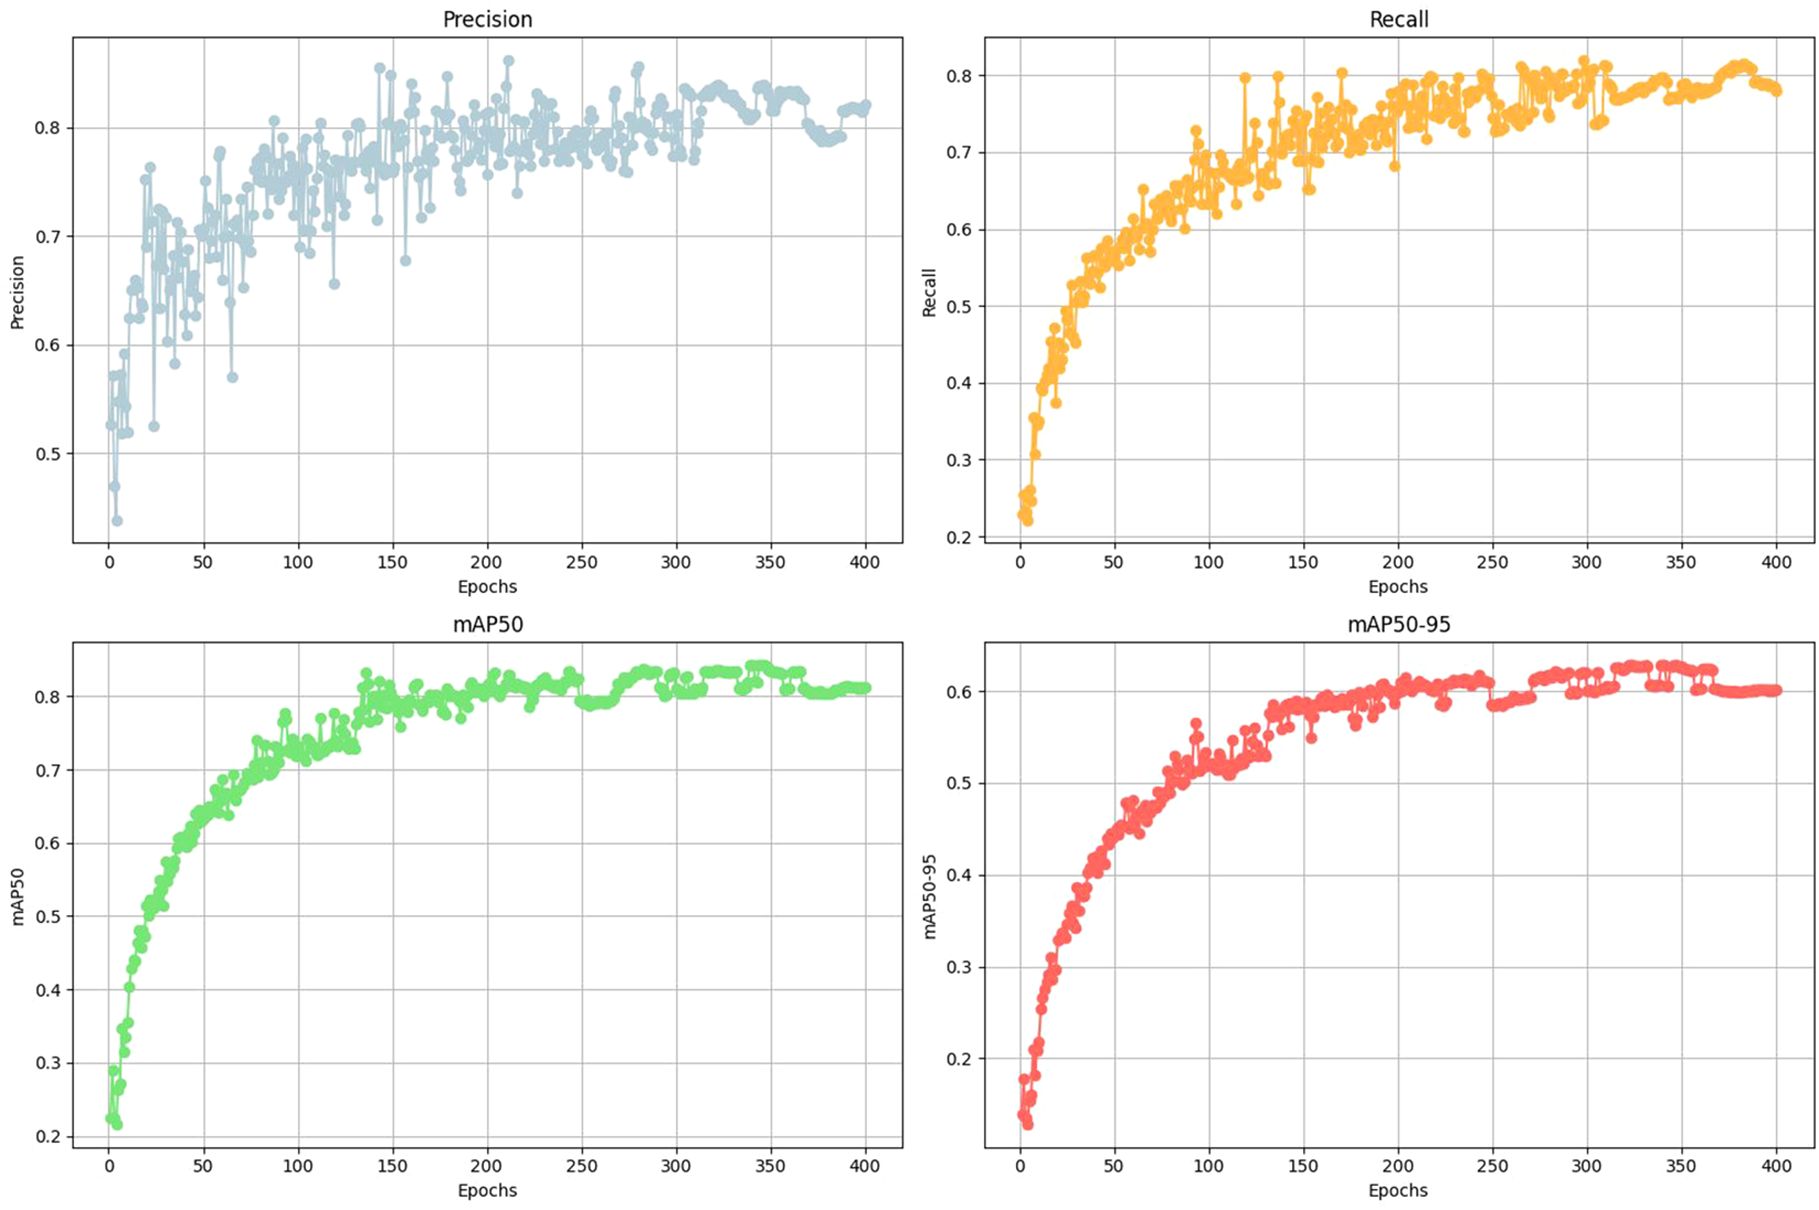
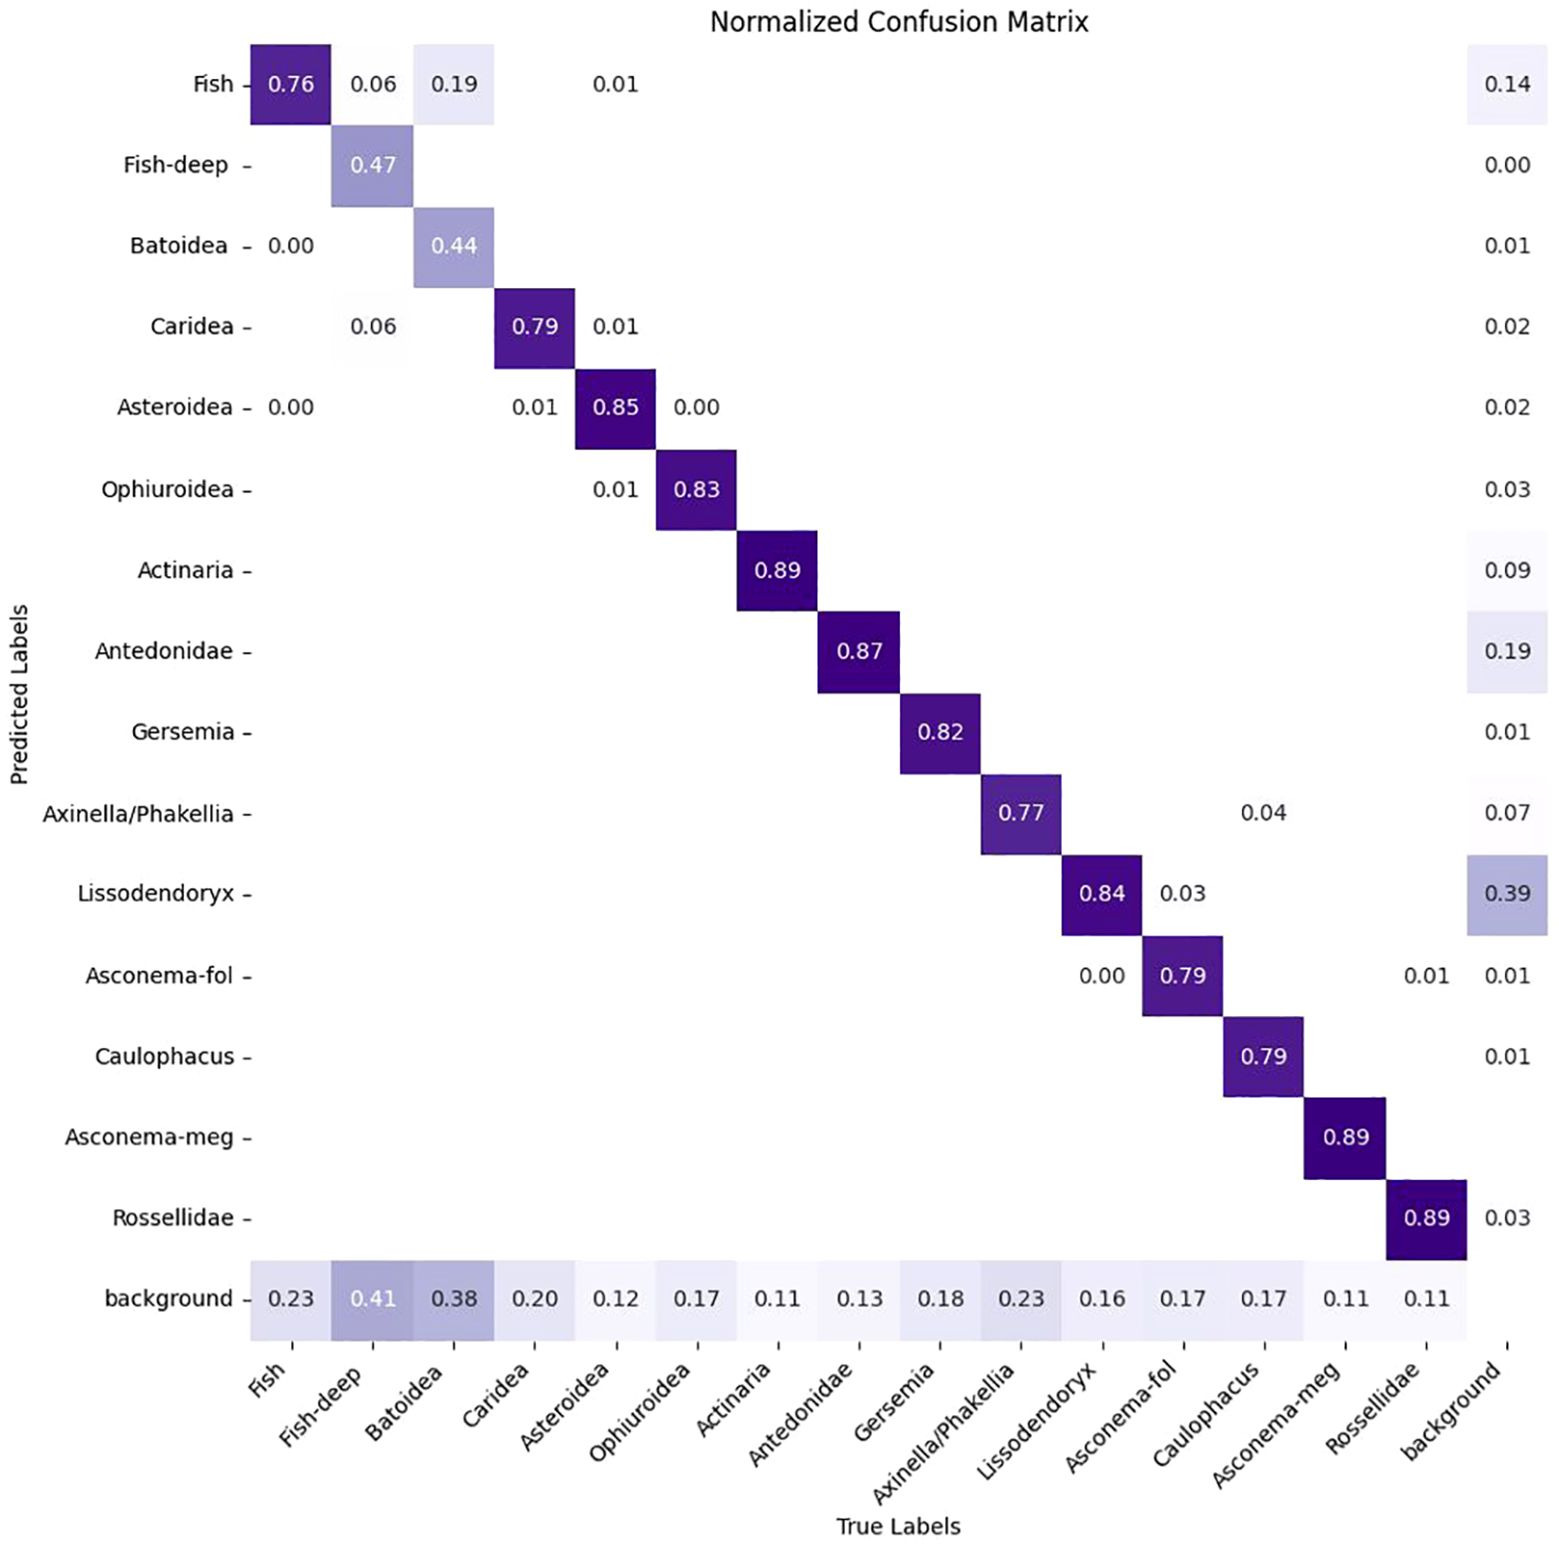
Training is carried out on the DeepSee dataset using a 75/25 split for training and validation over 400 epochs. The number of epochs is chosen based on multiple iterations of model training where a flattening of the performance metrics is observed after ca. 250-350 epochs (Figure 4). The image size is set to 1280 pixels and batch size to 8 during training. We tested multiple batch sizes and found that increasing batch size results in a slight hit in model accuracy for our setup. Training is carried out on 4 Nvidia T4 GPUs. Object inference on a single image including post-processing takes ca. 35-60 milliseconds on a single Nvidia 4070 GPU, depending on the image complexity. The Yolov8 model uses the precision metric to identify the best model. See Table 1 for the performance metrics. Precision is the fraction of relevant instances or true positives among all retrieved instances. Recall is the fraction of relevant instances (true positives) that were retrieved to the total number of ground truth instances. The F1 Score is the harmonic mean of precision and recall, providing a balanced assessment of a model’s performance while considering both false positives and false negatives (Supplementary Figure S1). mAP50 is the mean average precision calculated at an intersection over union (IoU) threshold of 0.50 and is a measure of the model’s accuracy. The trained model has a high mAP50 score of 0.84 over all classes. The high precision and mAP scores also show that false positives are kept to a minimum for most classes. This is also reflected in the confusion matrix where the detections are largely confined to the diagonal (Figure 5). A confusion matrix is a table layout that allows visualization of model performance by quantifying the detection errors or how the model confuses different classes during detection. For example, reading Figure 5 vertically for the ‘Fish’ class, the model correctly predicts the ‘Fish’ class in 76 out of 100 cases and predicts it as ‘Background’ in 23 out of 100 cases (false negative). When read horizontally, the model correctly predicts the ‘Fish’ class in 76 out of 100 cases and incorrectly predicts instances of ‘Batoidea’ as ‘Fish’ in 19 out of 100 cases (false positive). The only classes with mAP50 scores lower than 0.8 are Fish-deep and Batoidea. The confusion matrix shows that these classes are often predicted as background, i.e. not detected, explaining the relatively low mAP50 scores. This is also reflected in low recall scores for these classes. This is most likely due to the low number of images and instances of these classes in the training dataset. The mAP50-95 score, or mean Average Precision over IoU thresholds from 0.5 to 0.95, measures model performance at multiple higher levels of localization precision, making it a more rigorous metric than mAP50. mAP50-95 scores are generally lower than mAP50 scores as it assesses not only detection accuracy but also the tightness of bounding boxes.
The dataset is also utilized to train other models from the YOLO family for comparative analysis and to verify the stability of dataset performance (Supplementary Table S2). The tests indicate that the performance of the DeepSee dataset remains consistent across different generations of YOLO models and model sizes. Inference time for a 1280x1280 pixel image ranges from ca. 20 to 35 milliseconds per frame. Testing with smaller models resulted in only a minor decrease in performance metrics from 0.84 to 0.81 mAP. This is promising, as these smaller models can be deployed on systems with limited computational power, such as remotely operated vehicles (ROVs), and where near real-time decision-making may be key.
3 Results and discussion
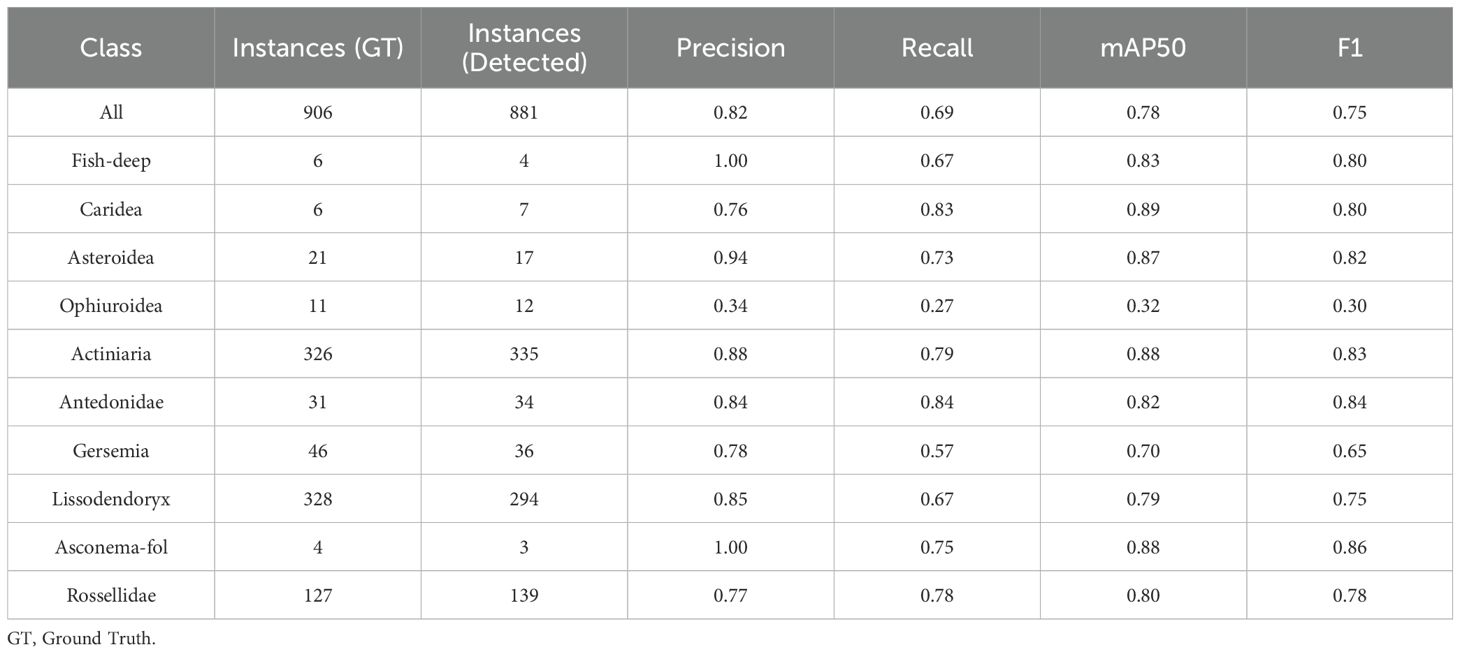
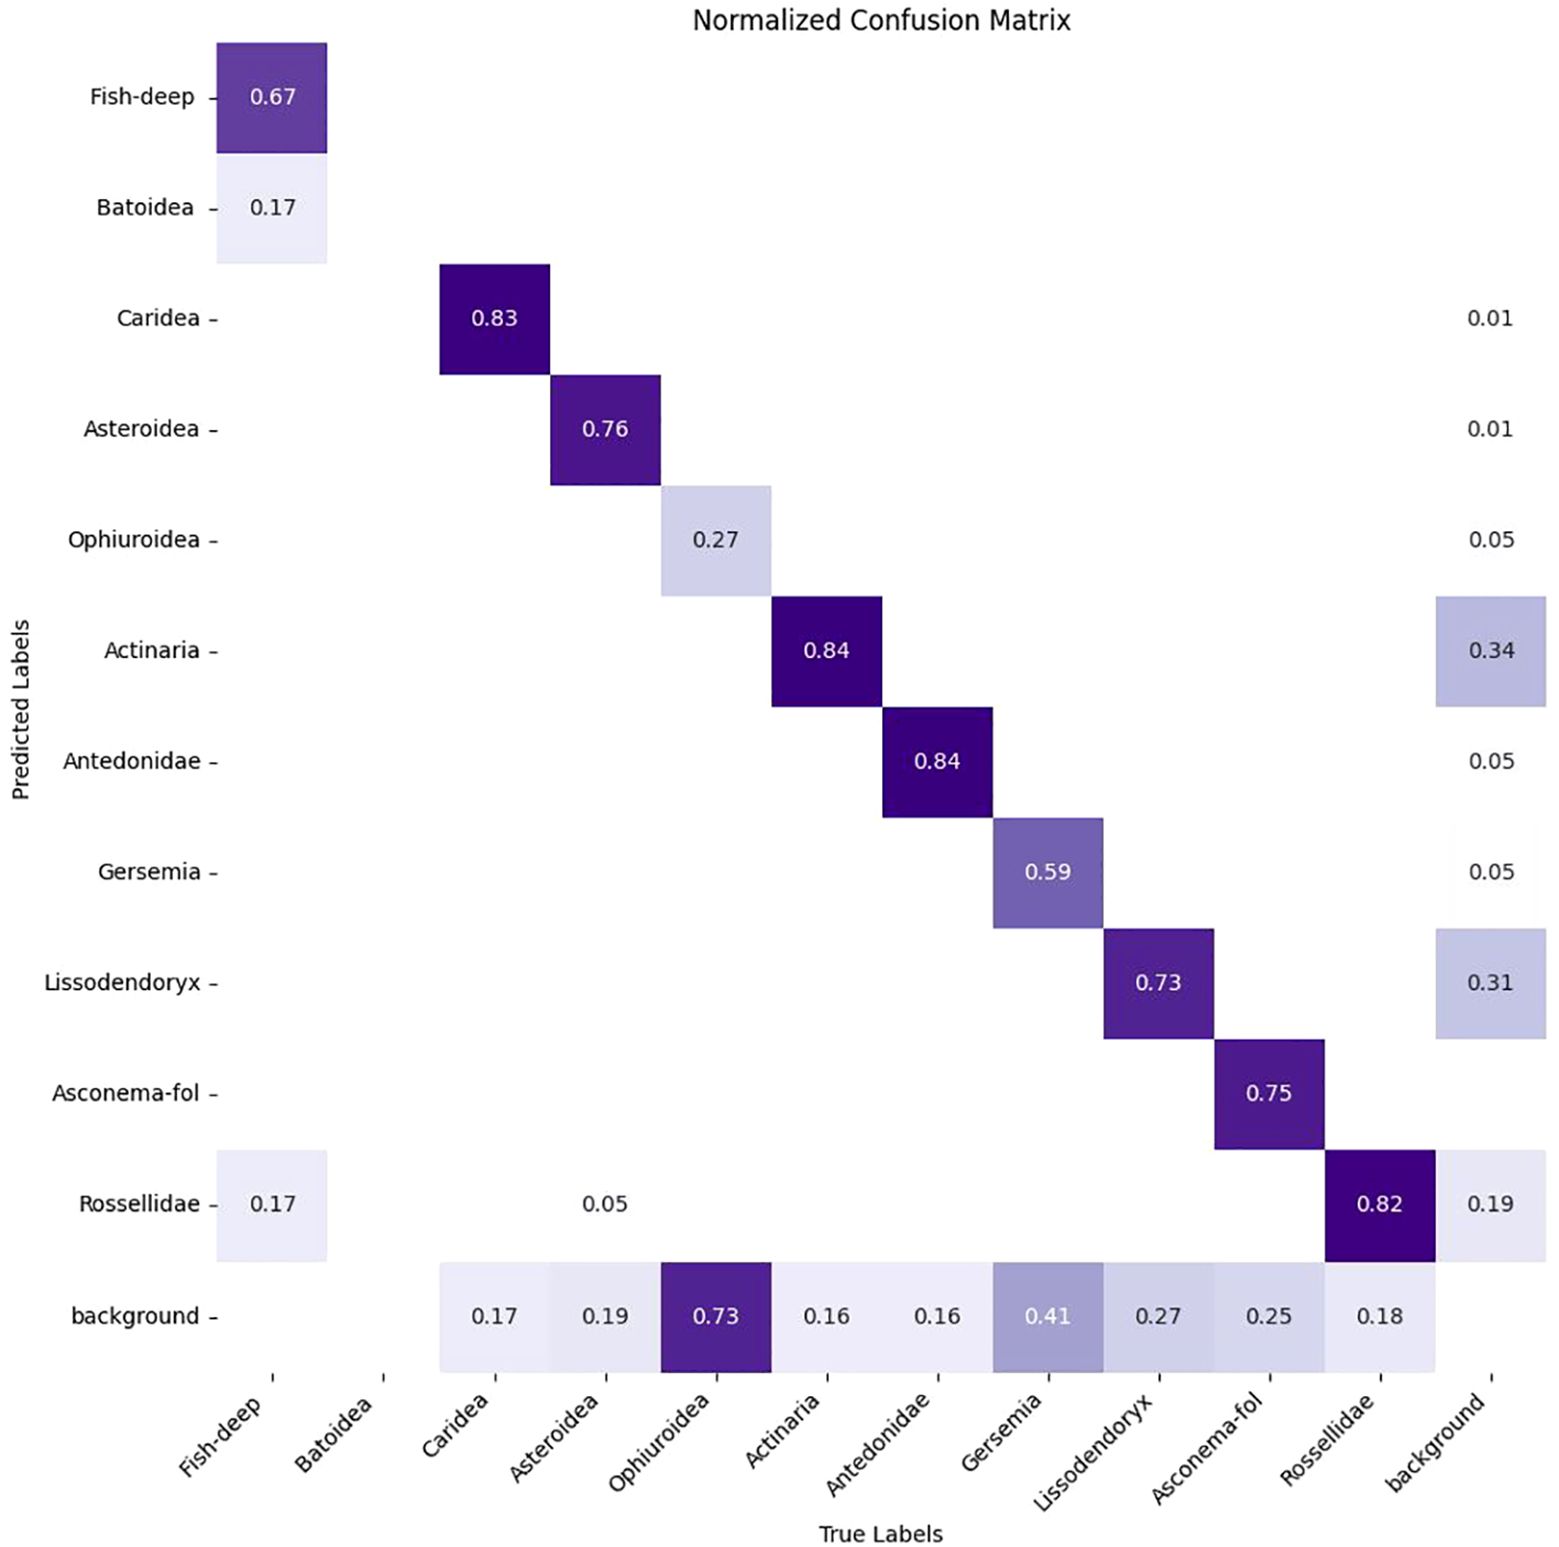
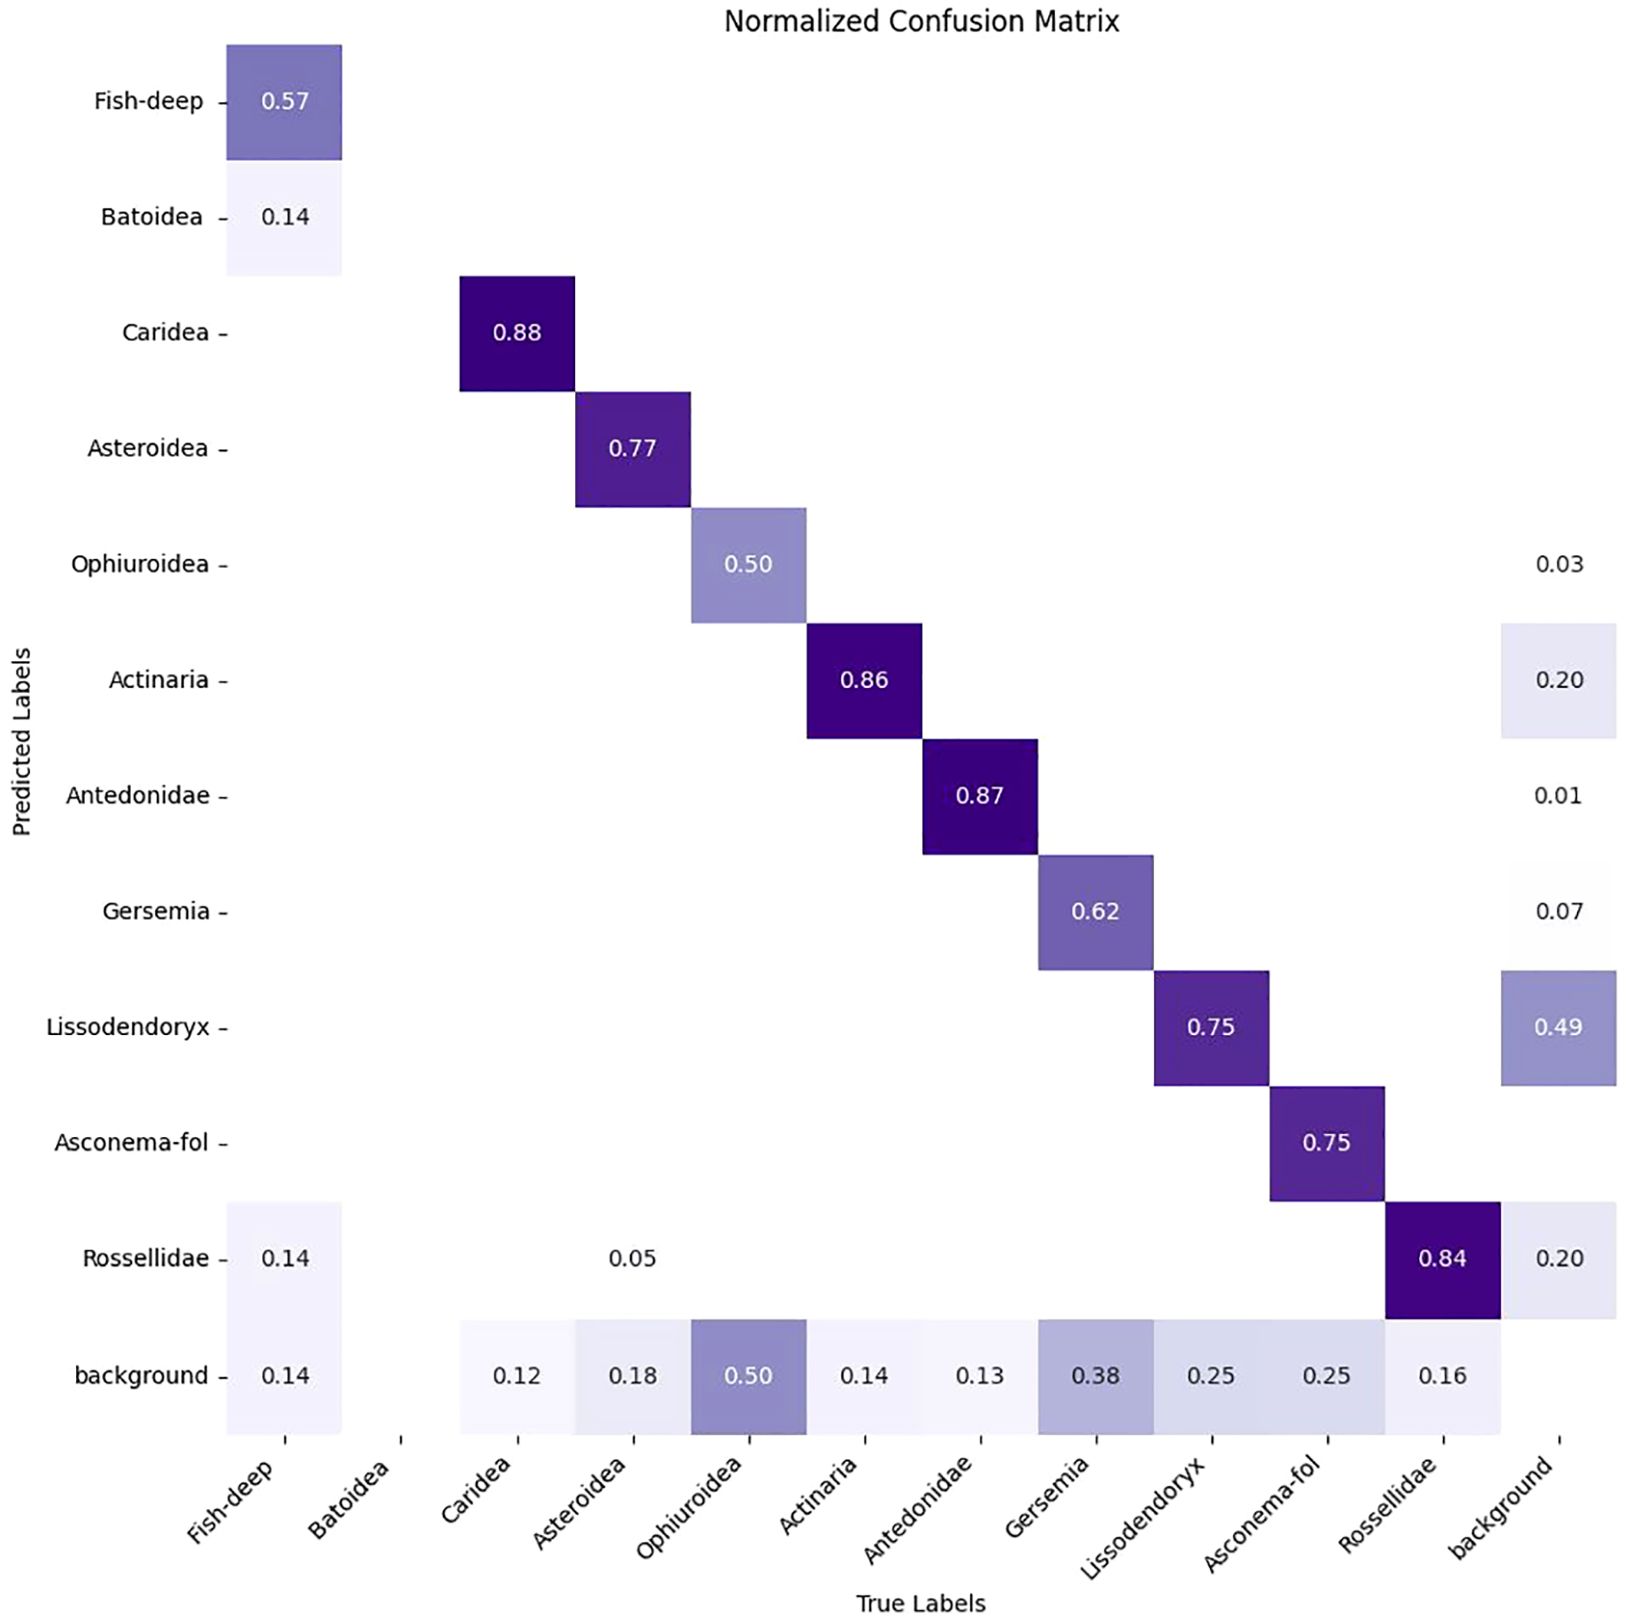
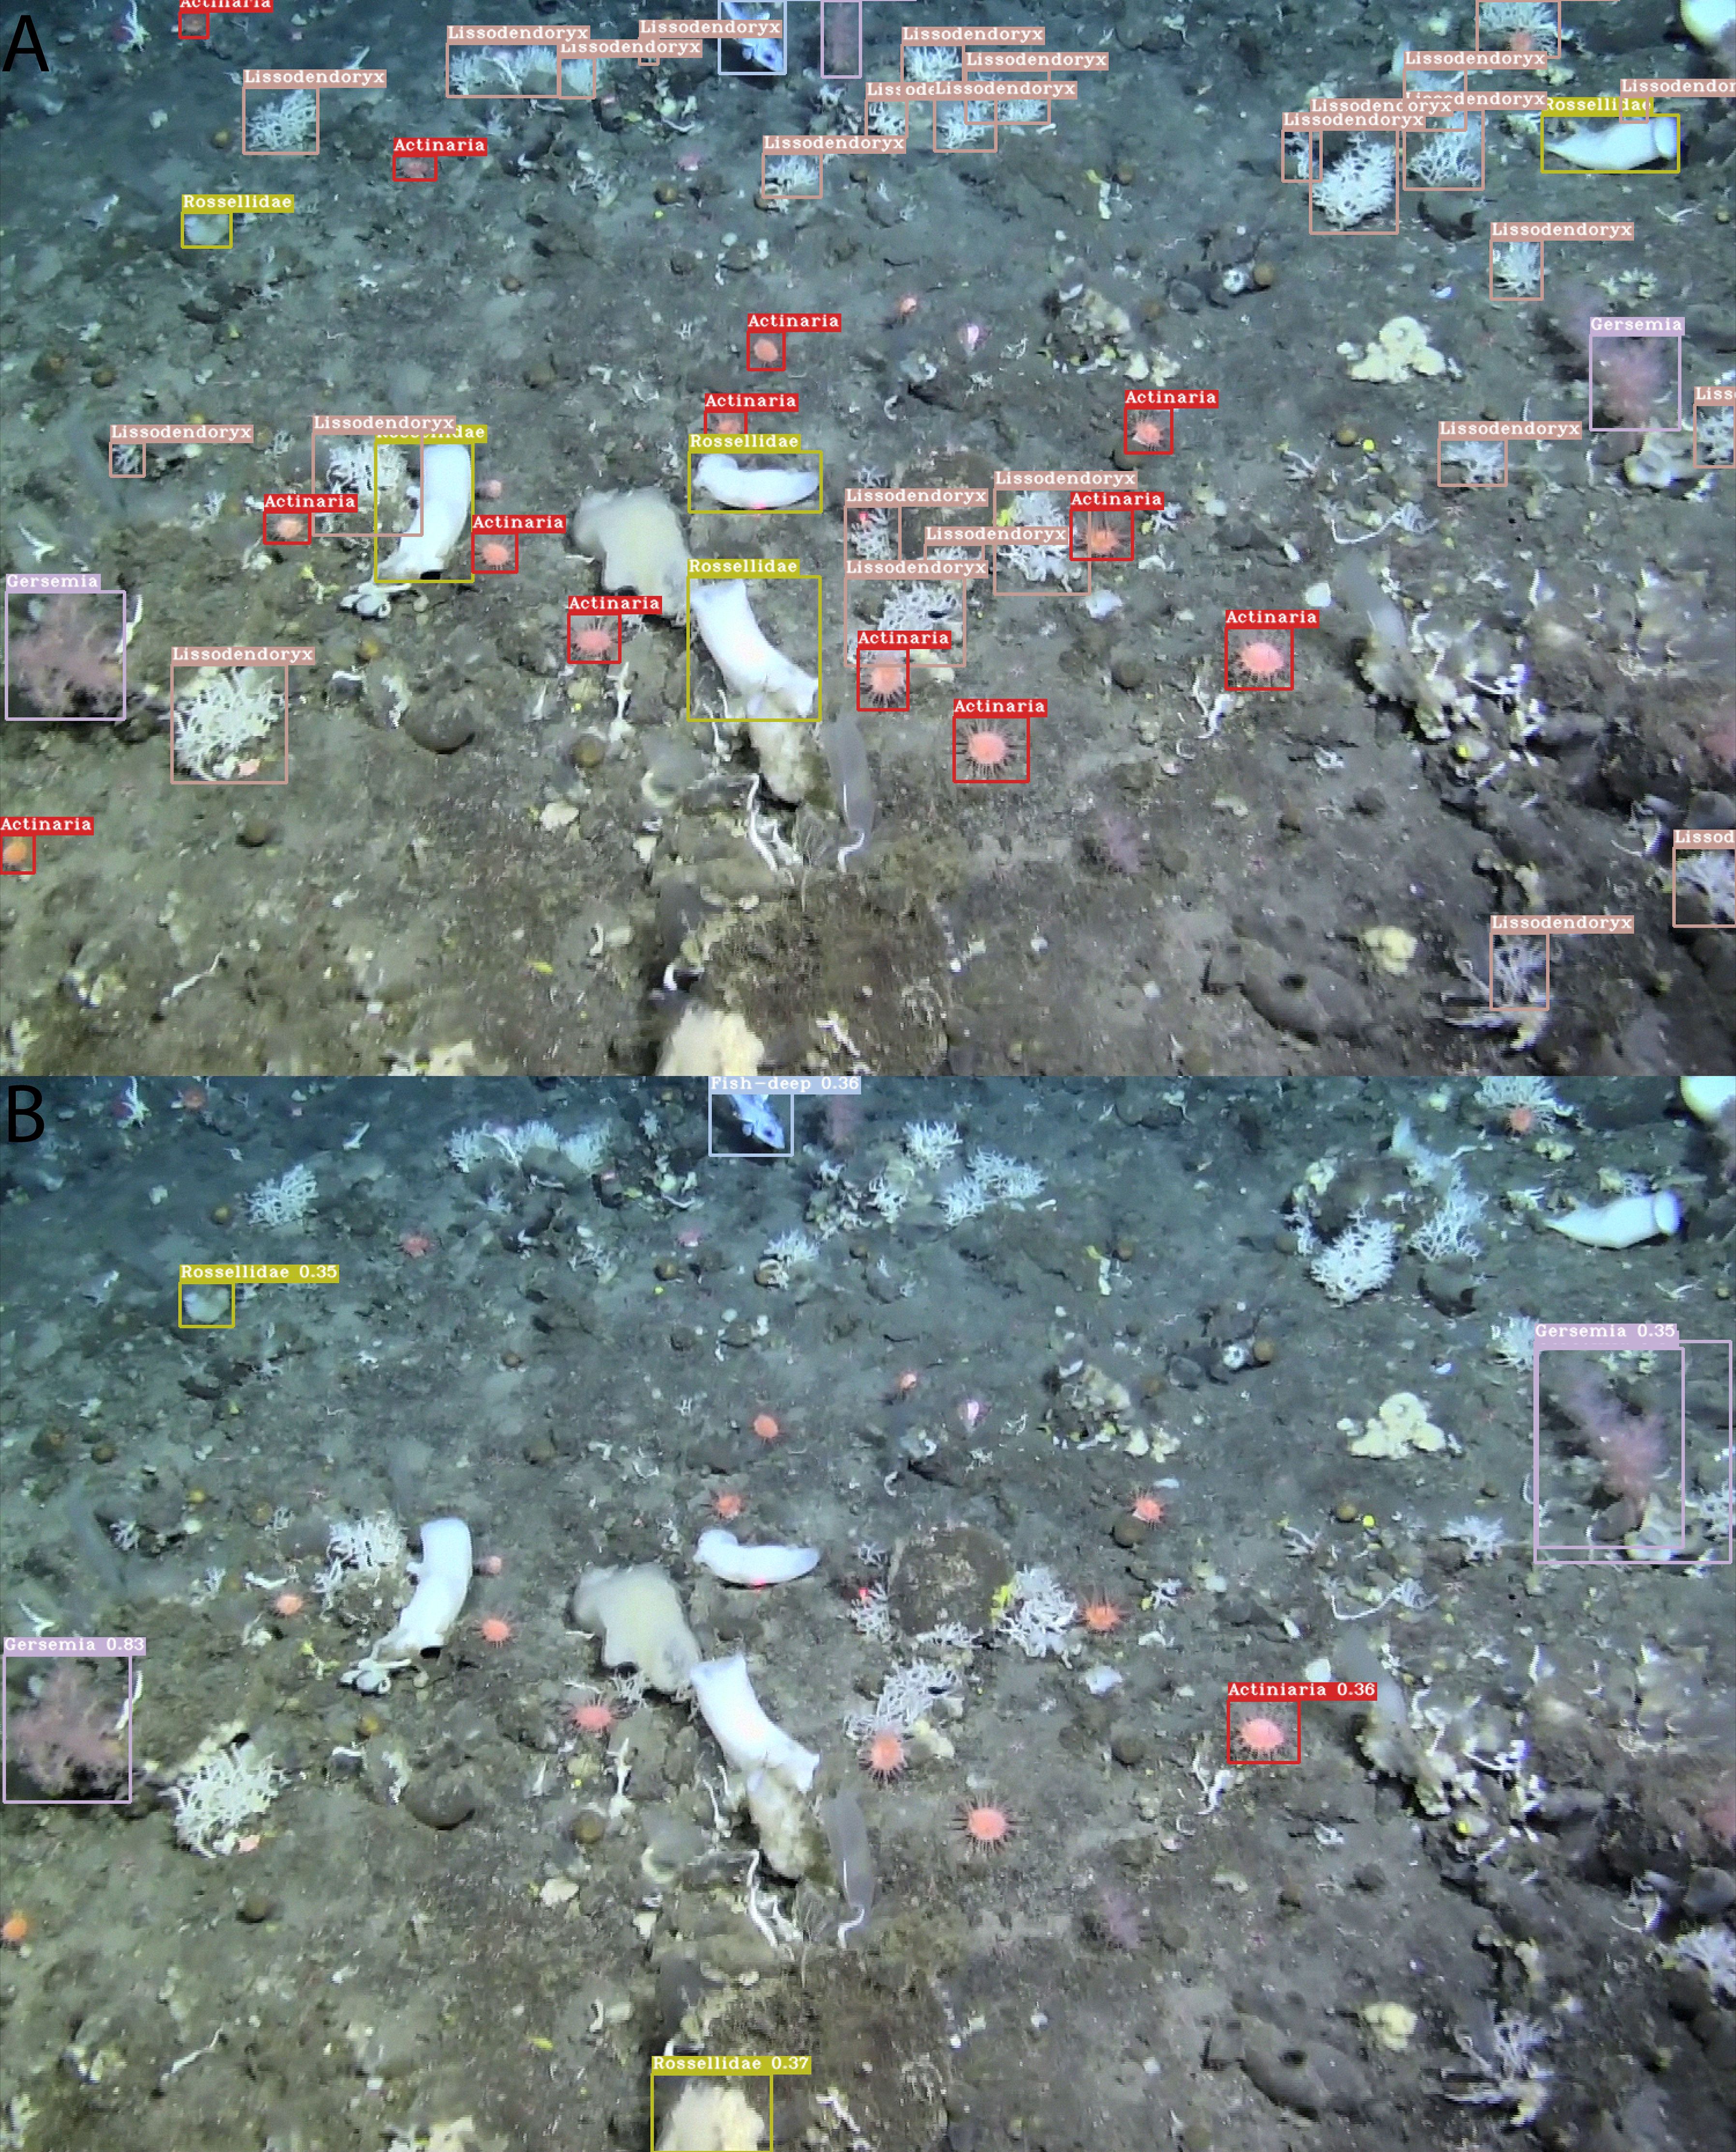
The trained DeepSee model achieves a high mAP50 score of 0.84 on validation data, indicating strong accuracy and minimal false positives across most classes. Inference times for images sized at 1280 pixels range from approximately 20 to 35 milliseconds per frame, demonstrating the model’s efficiency. The DeepSee model is further benchmarked against 48 images selected from the Meyer (Meyer et al., 2022; Meyer et al., 2023) dataset covering the range of habitat types and organisms present in the DeepSee dataset. Note that these images are not used for DeepSee model training and validation. The Meyer dataset catalogues benthic organisms on the Schulz Bank, a seamount of the Artic Mid-Ocean Ridge, using ROV video footage from 580 to 2700m depth. The Meyer study also provides instance counts of the identified organisms for each image in the dataset. However, these counts include not only clearly visible organisms but also obscured or fragmented organisms that do not display the characteristic features of their class as required for ML classification. These additional counts were identified by tentative association with other organisms in the image or by physical sampling (Heidi Kristina Meyer, pers. comm.). For example, in Supplementary Figure S2, where all clearly visible organisms in the DeepSee dataset are annotated, 3 instances of Lissodendoryx are identifiable. In contrast, the Meyer study counts 7 Lissodendoryx instances here (Meyer et al., 2022). Therefore, for benchmarking and comparative purposes in this study, the dataset has been manually re-annotated to align with the classification and methodology used for the DeepSee model as outlined in Section 2 to provide the ground truth instance count, rather than using the instance counts provided by the Meyer study. Inference is carried out using the DeepSee model and the results are compared to the annotations. The resulting validation metrics are shown in Table 2 and the confusion matrix in Figure 6. The validation metrics and confusion matrix show that the model does an excellent job in detecting most organisms in the dataset with mAP50 scores higher than 0.7. The only exception to this is the Ophiuroidea class where the metrics are relatively low. False positives, with respect to other classes in the dataset, are minimized except for the Fish-deep class (Figure 6). Figure 7 is an example that shows a comparison between the manually annotated (Figure 7A) and DeepSee detected (Figure 7B) images. The Caridea, Antedonidae and Lissodendoryx classes with high mAP50 scores are annotated/detected in the example figure. The example figure has only 1 instance of Caridea annotated but the model returns two detected instances. As it stands, the precision and recall of this class would be 0.5 and 1, respectively. However, the ‘false positive’ detection is indeed a missed manual ground truth annotation of the Caridea class. Accounting for this (Supplementary Figure S3), the precision and recall of this class reaches a perfect score of 1 for this class in the example (Table 3). This effect is also observed in the other classes present in the figure. There are 15 Antedonidae instances detected by the model of which 4 are ‘false positive’. In reality, there are no false positives when the manual annotations are corrected. The precision and recall for this class increase from 0.73 and 0.79, respectively, to 1 and 0.83. Similarly, 15 instances of Lissodendoryx are detected with 1 ‘false-positive’ which is a misannotated instance. When the annotations are corrected, the precision and recall of this class are both 1.
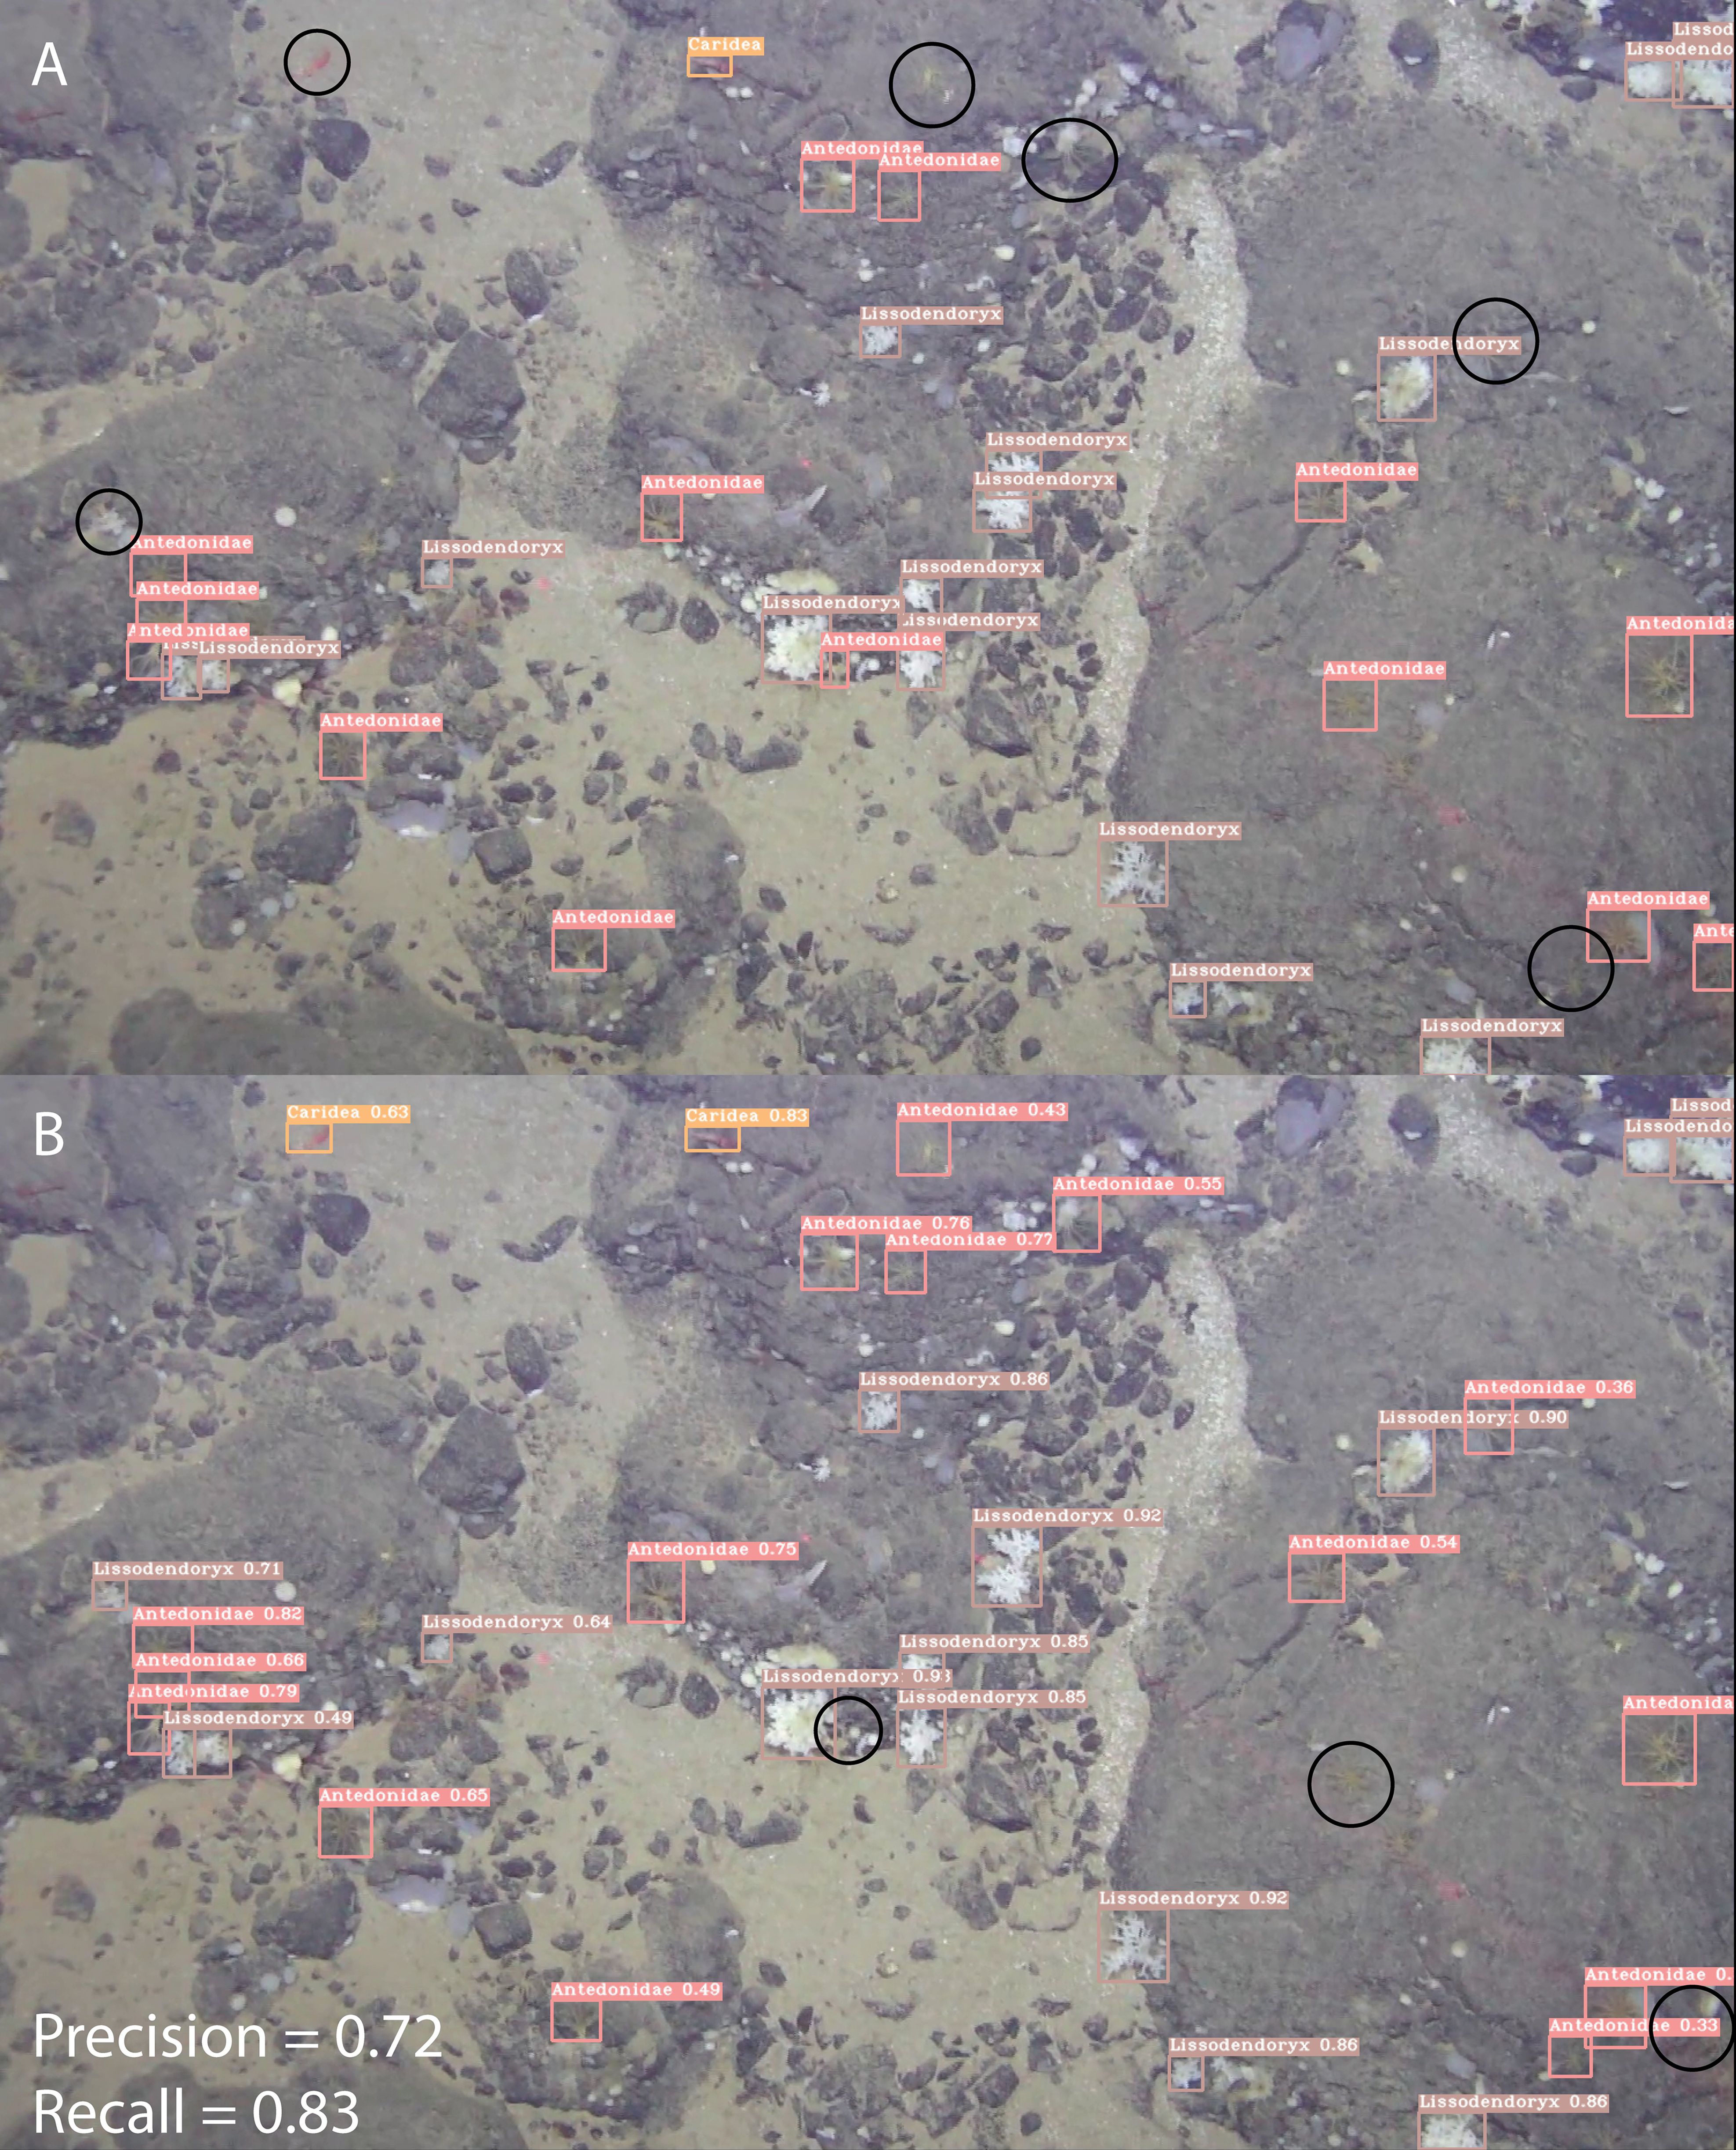
Figure 7. Figure showing the comparison between the manually annotated (A) and detected labels (B) in an example image. Instances that are labelled in the ground truth image and not found by the DeepSee model, and vice-versa, are encircled in black. The average precision and recall of the model detections for the image are 0.72 and 0.83, respectively. However, it is evident that the ‘false positives’ detected by the model are indeed valid detections that were missed in the annotated dataset. When corrected, the average precision and recall increase to 1 and 0.91, respectively. Images are from the Meyer dataset.
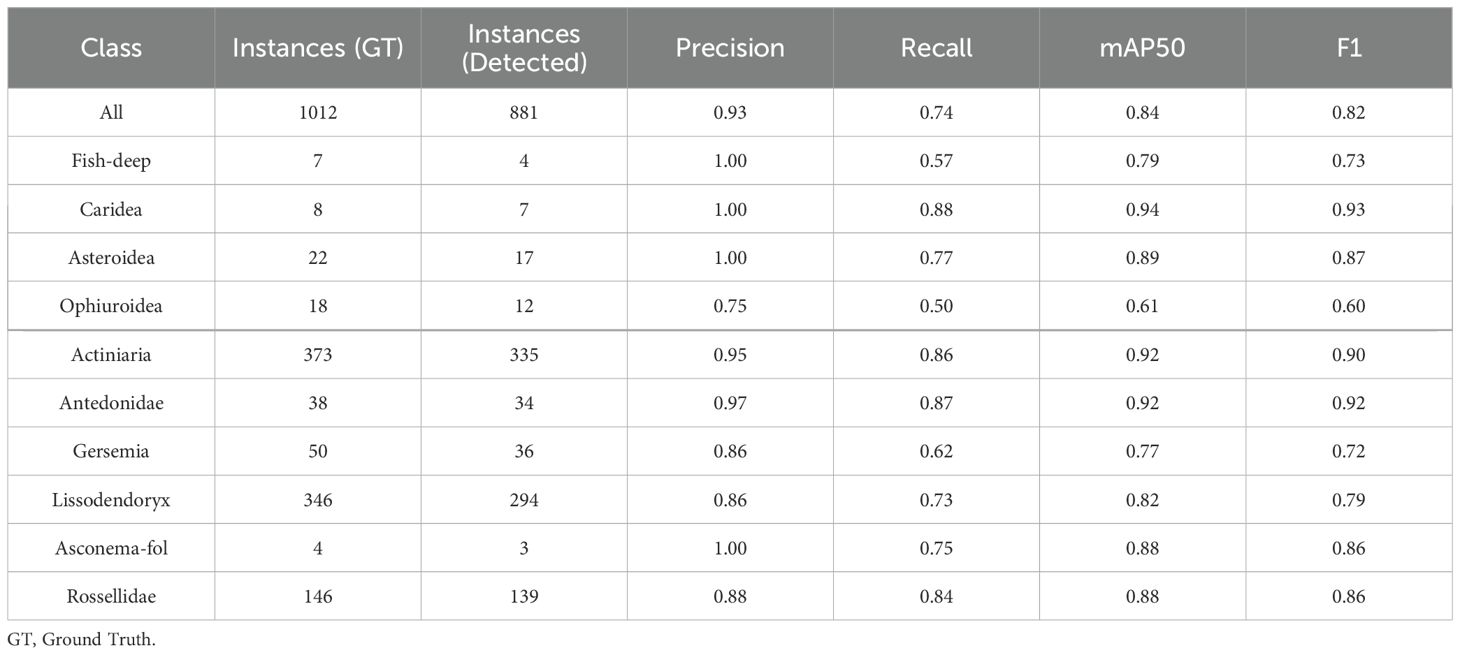
Table 3. Performance metrics of the trained model for all detected classes in the revised Meyer dataset.
The Fish-deep class has a perfect precision value of 1 but a relatively low recall value of 0.67 (Table 2) which tells us that although there are no false positives for this class, the class is either not detected or has been mislabeled as Batoidea or Rossellidae (Figure 6). The mislabeling of the Fish-deep class can be attributed to the features of the labelled classes in the image (Figure 8). In Figure 8A, the upper part of the organism is perceived as an angular wedge due to the proximity of the fins to the upper body. This feature is also present in the Batoidea class and is possibly the cause of the mislabel. In Figure 8B, the Fish-deep instance in the top center of the image is cut off at the image edge. Consequently, the instance looks somewhat like class Rossellidae (see other Rossellidae instances in Figure 8) and is mislabeled as such, albeit with a low confidence value.
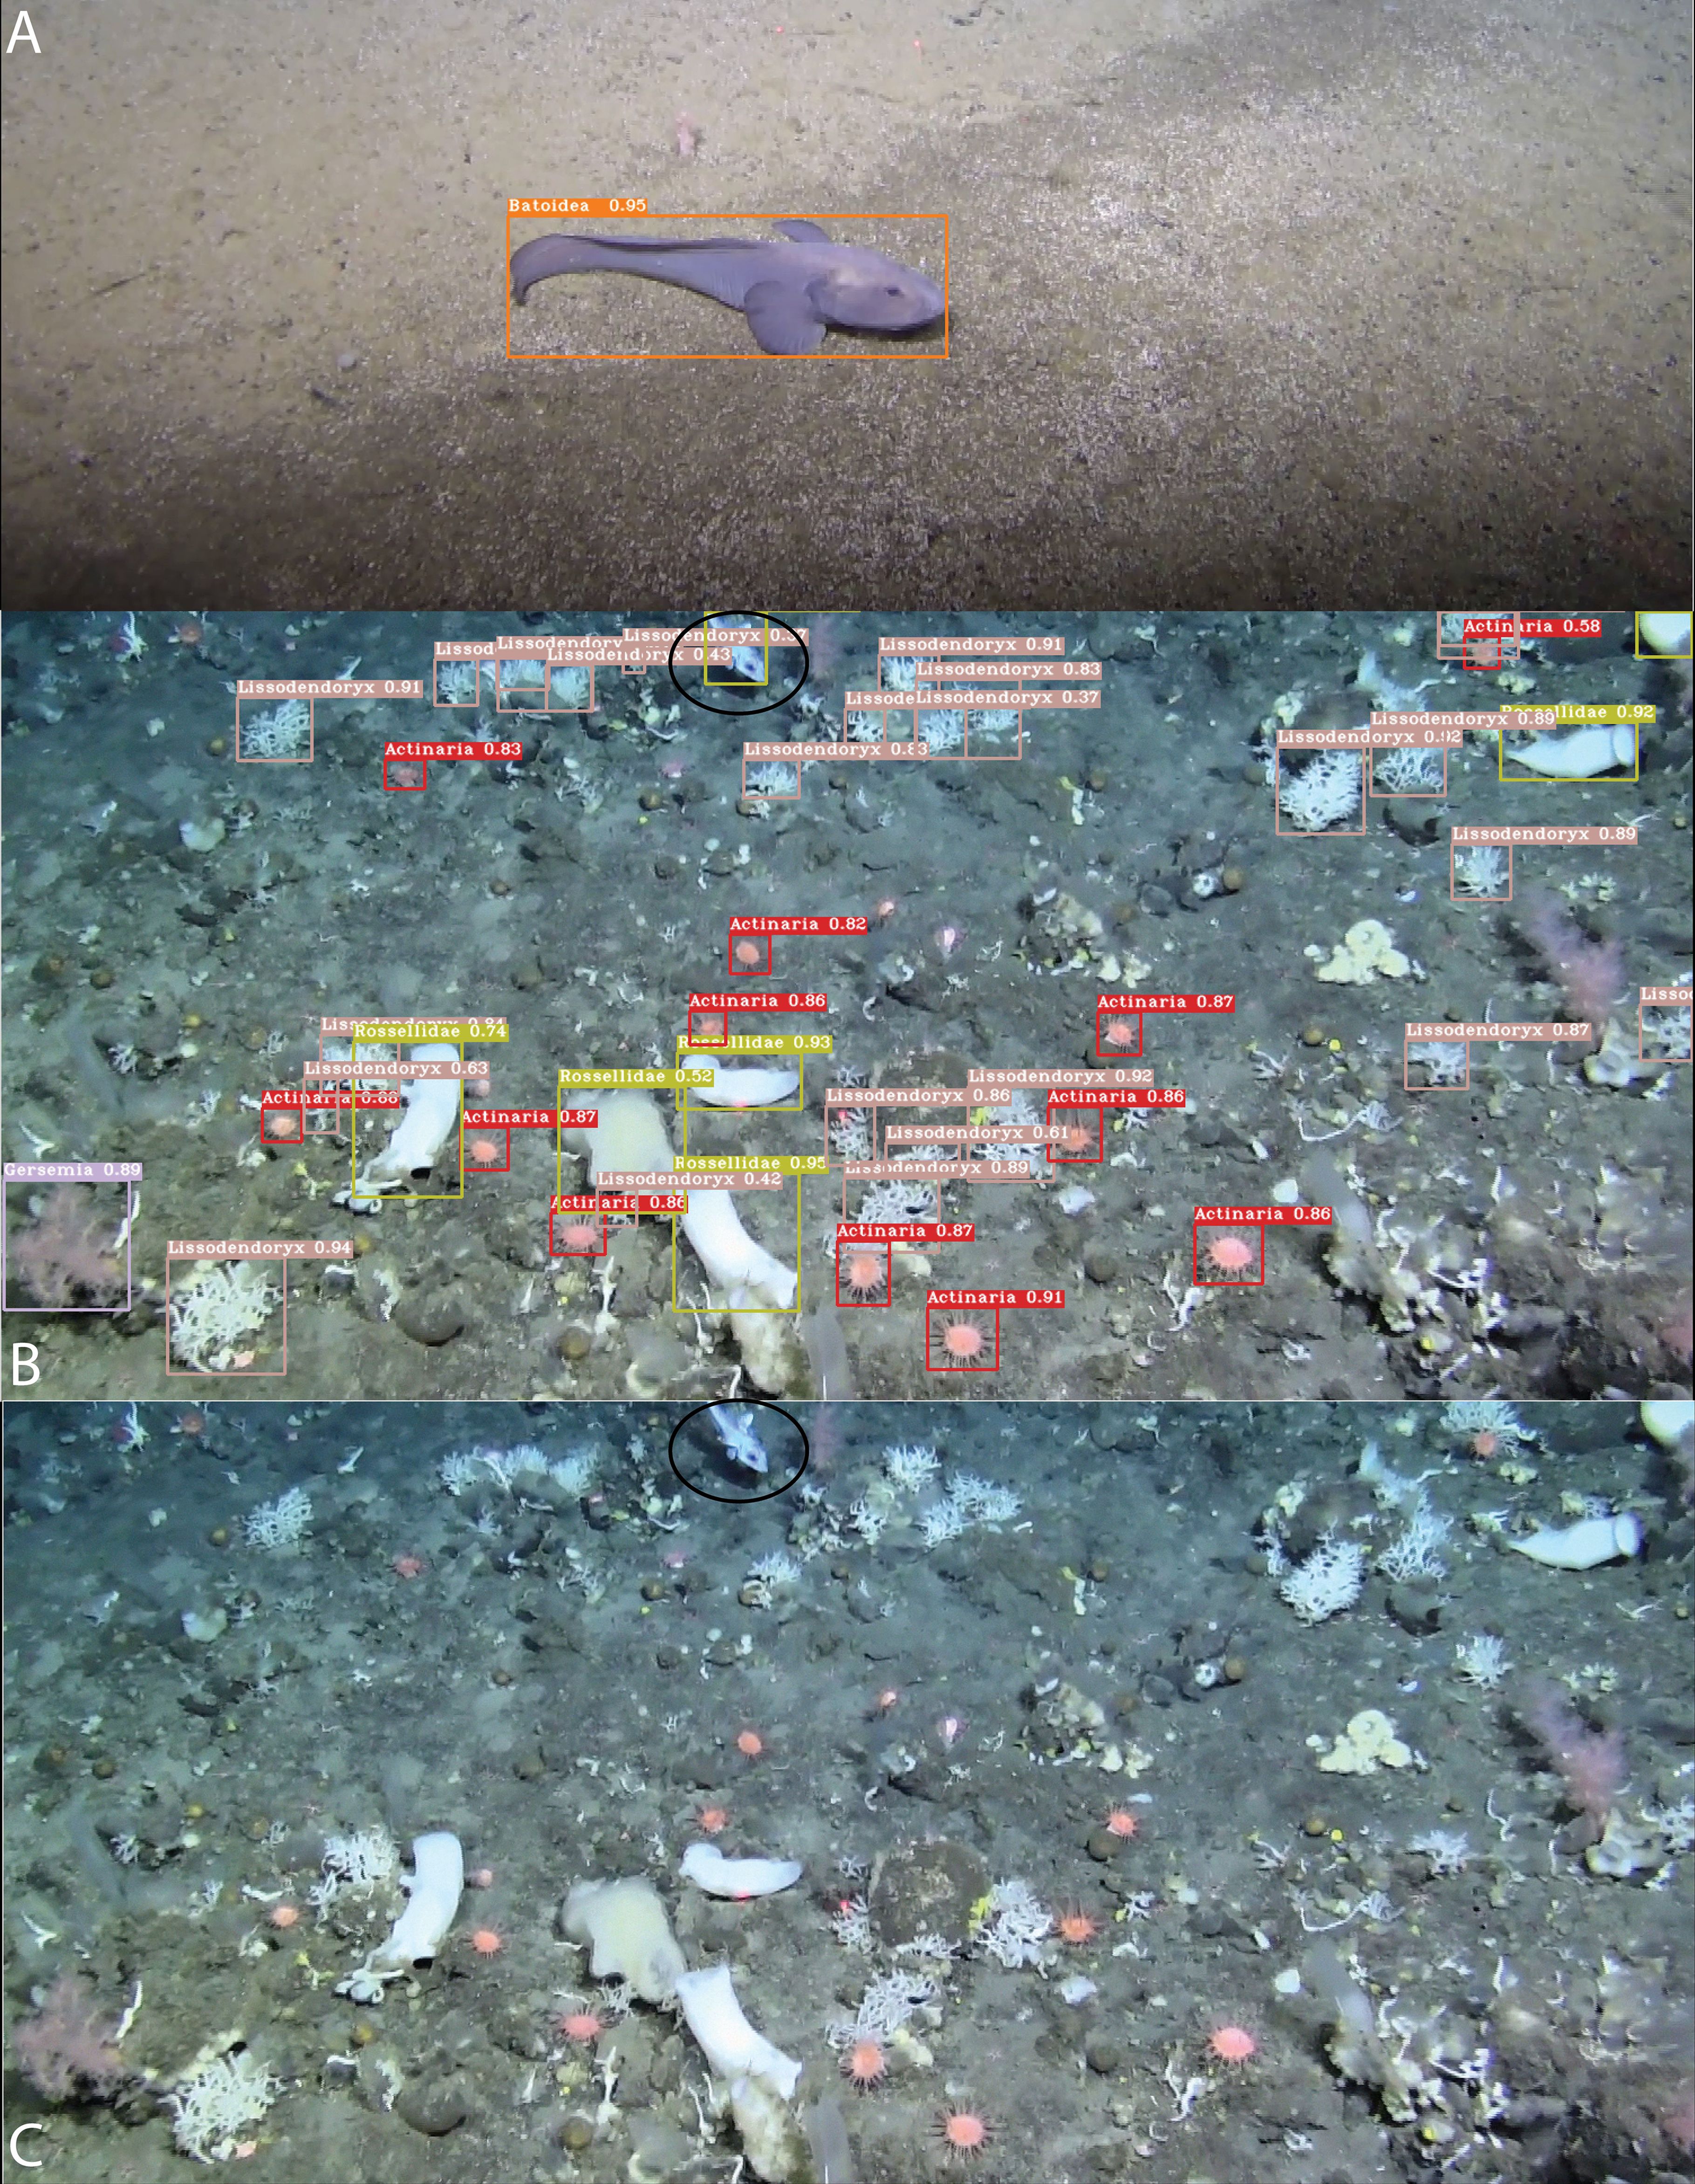
Figure 8. (A) and (B) show the instances where the class Fish-deep has been mislabeled as Batoidea and Rossellidae, respectively. (C) shows the unlabeled image in (B) to emphasize the mislabeled Rossellidae instance (black ellipses). Images are from the Meyer dataset.
The Gersemia class also has a relatively low recall value of 0.57 (Table 2). The low recall value is because several Gersemia instances are simply not detected (background) (Figure 9) and is most likely due to the limited number of instances in the training dataset. This is also true for other detected classes but occurs less frequently due to better training data with respect to these classes, e.g. Lissodendoryx and Rossellidae (Figures 9, 10).
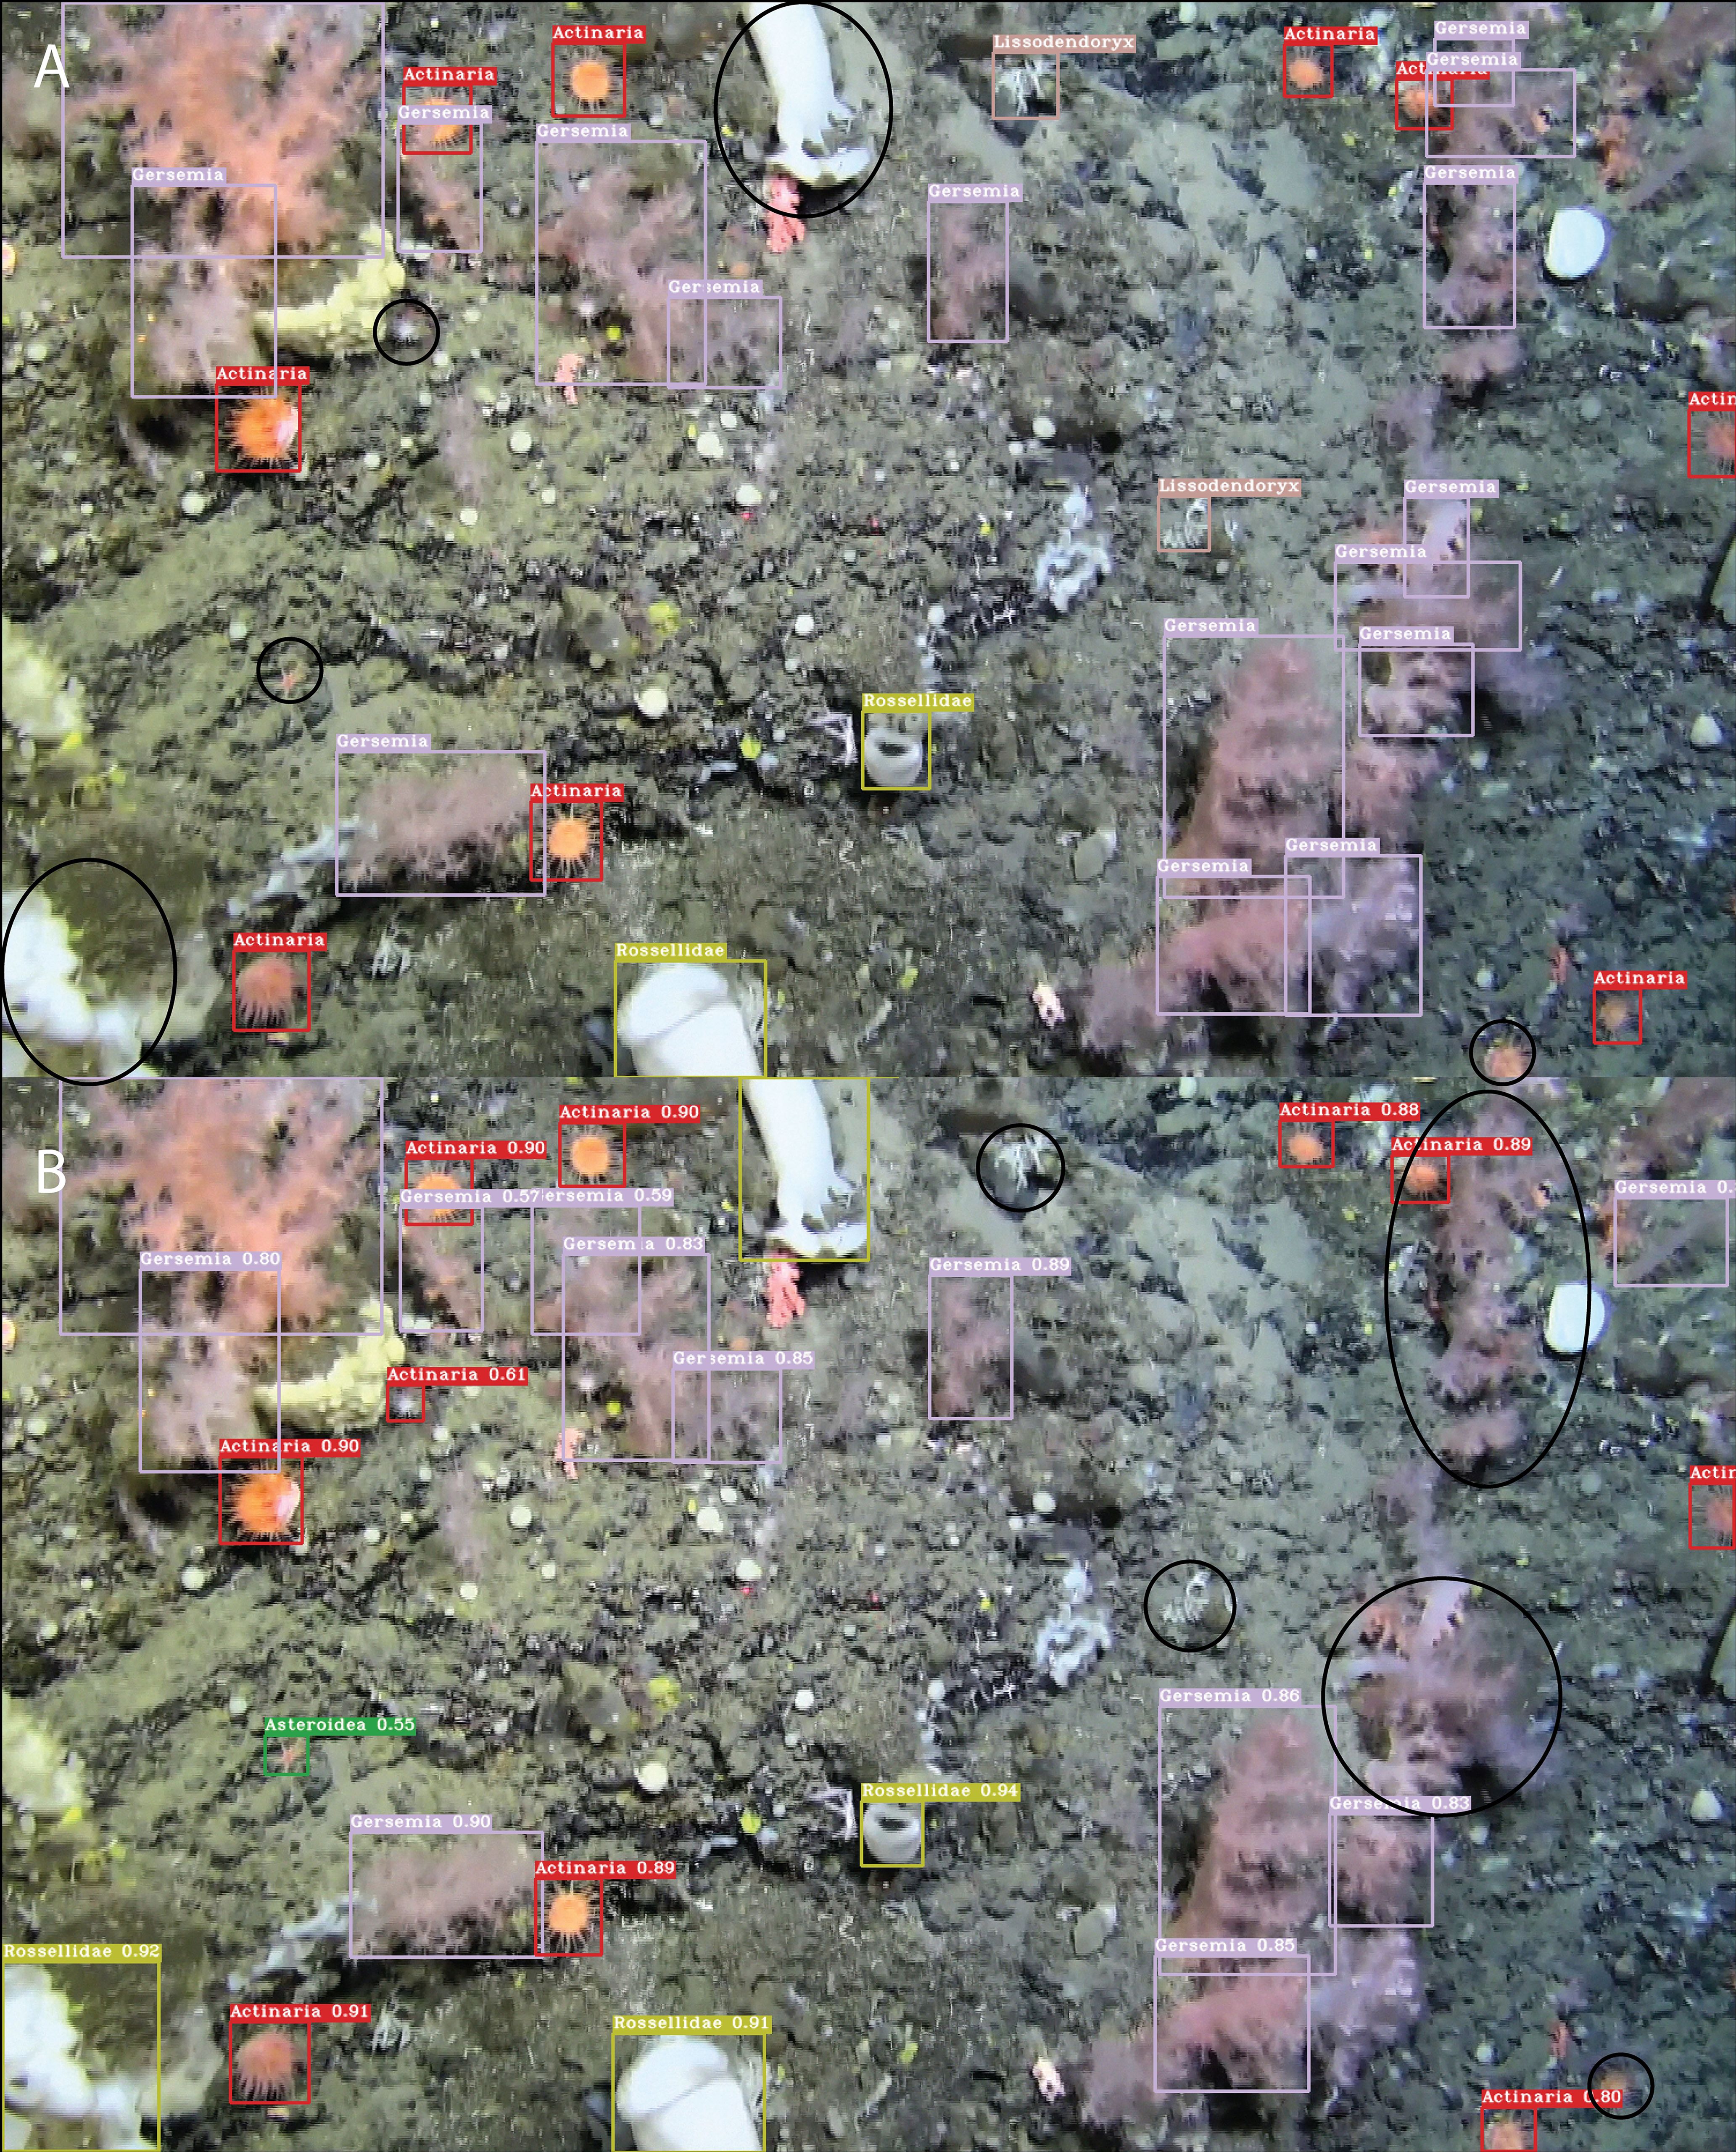
Figure 9. Example showing manually annotated (A) and model detected (B) labels for a selected image illustrating the low recall value of the Gersemia class (soft corals). Instances that are labelled in the ground truth image and not found by the DeepSee model, and vice-versa, are encircled in black. Images are from the Meyer dataset.
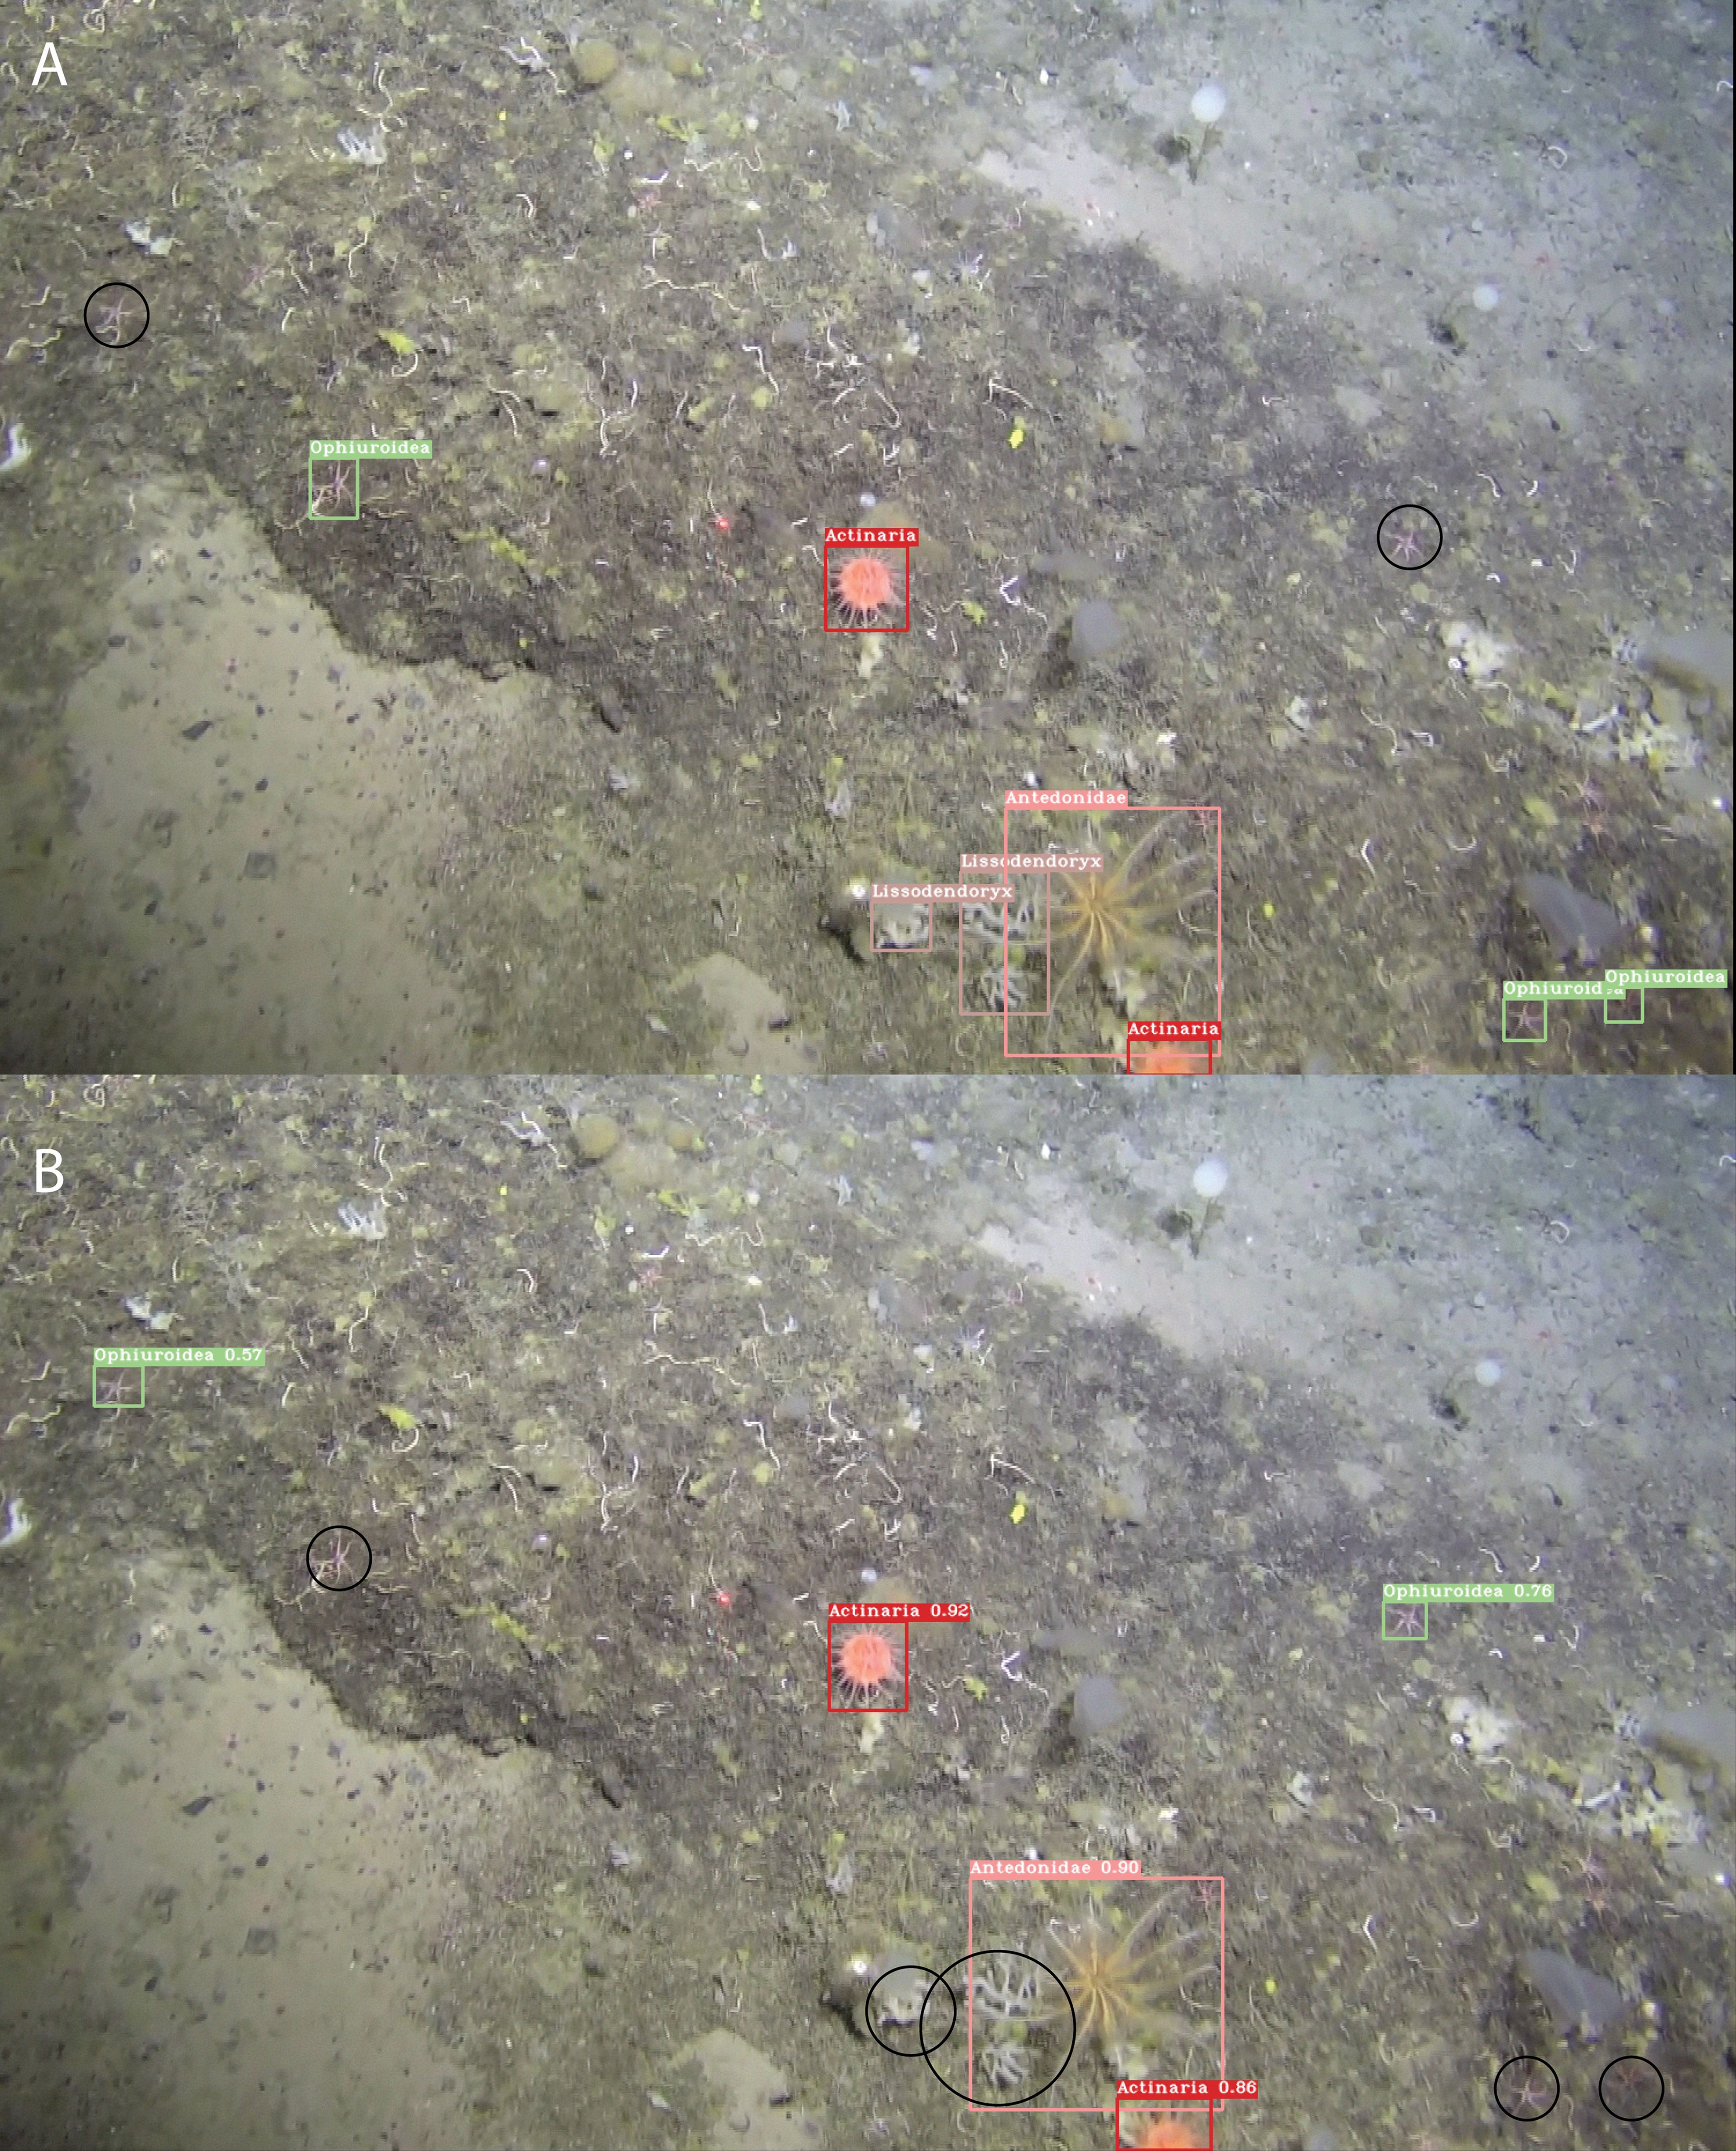
Figure 10. Example showing manually annotated (A) and model detected (B) labels for a selected image illustrating the low metric scores of the Ophiuroidea class. Instances that are labelled in the ground truth image and not found by the DeepSee model, and vice-versa, are encircled in black. Images are from the Meyer dataset.
The Ophiuroidea show very low scores for all metrics throughout the dataset (Table 2). The cause for these low scores is shown exemplarily in Figure 10. There are 3 instances of the class annotated in the image while there are only 2 instances detected by model. Moreover, the detections do not correspond to the annotations, i.e. the model failed to detect the annotated Ophiuroidea and instead found additional, valid instances that were not annotated. The reason for this is twofold. Firstly, Ophiuroidea instances in all images in the dataset are relatively small and the model architecture has problems detecting very small objects. Secondly, in the dataset, these instances are always present on spicule mats that contain a lot of white detritus with sizes and shapes similar to the Ophiuroidea which makes model detection problematic. Many instances are so obscured and blurry that they can only be manually identified with context, i.e. they look only somewhat similar but can be identified as such due to the presence of other brittlestars in the image. The precision and recall of the model for this image without annotation corrections are both 0. When corrected, the precision and recall values increase to 1 and 0.4, respectively.
The validation dataset can then be corrected to account for the instances that are detected by the DeepSee model but were not annotated in the dataset, i.e. manual labelling was conservative, or the organism was simply missed during manual annotation. Note that the instances for which the model does not detect the organism are not corrected. This increases the metrics (Table 3, Figure 11) of the Caridea and Ophiuroidea classes where the model correctly identified the previously unlabeled organism in the images. The high precision values across the board show that the DeepSee model is very robust when it comes to correctly identifying benthic life while keeping false positives to a minimum. In most cases, the recall scores are also relatively high with some exceptions due to factors such as inadequate training data and feature similarity between classes.
4 Comparison to other models
Recently, other models have also been developed to detect benthic life, achieving varying degrees of success in terms of accuracy and reliability. These studies (Fu et al., 2022; Zhang et al., 2022; Lyu et al., 2023; Xu et al., 2023; Cai et al., 2024) focus on refining model architecture to improve detection in complex marine environments with highly variable scenes and increase model efficiency. The models achieve high mAP scores (between 0.7 and 0.85) that are largely in the same range as the DeepSee model. Interestingly, a recent model (Cuvelier et al., 2024) trained on a dataset from the Clarion-Clipperton Zone (CCZ) in the NE Pacific demonstrates high recall values (~0.90) but very low precision (~0.13) despite using relatively well-lit images captured by a camera consistently positioned approximately 1.5 meters above the seafloor and facing orthogonal to the seafloor. Although this model could be potentially used as a general object detector, the high rate of false positives (~86%) would necessitate substantial manual correction efforts to ensure accuracy.
Direct comparison of the DeepSee model with other such object detection models is challenging due to several factors. Firstly, the training dataset used in these studies is different, which directly influences performance metrics and applicability. More importantly, many of the models and/or their trained weights are not publicly available, limiting the ability to replicate results or conduct thorough evaluations. We compare DeepSee to the MBARI/FathomNet model that has been also developed to detect marine benthos and where the weights and models are publicly available (https://huggingface.co/FathomNet/MBARI-315k-yolov8). It should be noted that the released weights are almost a year old and may be outdated. To be fair, DeepSee classes that are not comparable to the ones found in the MBARI model, and vice-versa, are ignored when computing performance metrics.
FathomNet is an impressive, open-source image database that has been specifically built to train AI models to help detect marine life. Like DeepSee, the MBARI model also uses YOLOv8x (model size is inferred from model parameter count) as the base object detection model and is trained on a FathomNet dataset containing 499 classes. Currently, the FathomNet dataset contains more than 110,000 images and 303,000 localizations. However, the number of images and instances in the dataset used for training the model has not been provided. Inference is performed on the revised Meyer dataset using the available model weights. Detections using the MBARI model classes have been relabeled to the appropriate DeepSee class for comparison (Supplementary Figure S4, Supplementary Table S3). In some cases, the MBARI model identifies the same DeepSee class as different classes. All such classes are relabeled. For example, the DeepSee class ‘Rossellidae’ is detected as ‘Porifera’ and ‘Hexactinellida’ by the MBARI model and are all relabeled to ‘Rossellidae’. The ‘Lissodendoryx’ and ‘Asconema-fol’ DeepSee classes which are present in the revised Meyer dataset are not detected by the MBARI model and are not used when computing performance metrics. Validation of the MBARI model on the revised Meyer dataset results in precision, recall and mAP scores of 0.73, 0.15 and 0.25, respectively. While the MBARI model demonstrates reasonable performance in correctly identifying organisms, as indicated by its fair precision score, it struggles to detect all organisms that are clearly visible in the images, resulting in very poor recall scores. The DeepSee model and dataset significantly outperform the MBARI model (Figure 12).
The DeepSee model metrics show that ML methods can successfully automate benthic lifeform detection with relatively high accuracy thereby reducing the manual annotation load significantly. Manual annotation of an hour long ROV video where 1 frame is annotated per second would take ca. 50 hours to annotate, assuming each frame contains 10 instances with each instance requiring 5 seconds. The DeepSee model would, for the same video, require only 126-180 seconds, which is more than a thousand-fold increase in speed. It should be noted that to do this, the imaged lifeforms need to have clearly visible and defined morphologies or feature sets that can be usefully extracted, learned and subsequently detected by the model. The model cannot contextually label lifeforms as an experienced biologist would be able to do. This kind of reasoning and association is currently beyond the capabilities of models such as presented here and would require a trained professional to correctly identify these instances. The methodology presented here can help create high-resolution maps of benthic life in the deep sea by combining location metadata from the ROV with model object detections. This approach has the potential to overcome the typical data sparseness associated with deep-sea lifeform mapping. Traditionally, due to limited data availability, such maps are produced with granularity ranging from hundreds to tens of thousands of square kilometers (Legrand et al., 2024; Ramirez-Llodra et al., 2024), which can lead to an incomplete or inaccurate assessment of target regions. With the techniques presented in this study, map resolutions down to the square meter scale or even lower (Hartz et al., 2024) can be achieved, offering a much more detailed understanding of species and biomass distribution. Such precision could transform current perceptions of deep-sea biodiversity and community composition, and profoundly impact decision-making processes related to resource management and conservation in deep-sea environments.
5 Conclusions
This study demonstrates that the state-of-the-art DeepSee object detection model, trained on a carefully curated dataset that focuses on the Arctic Ocean Ridge, the Norwegian Sea and the Greenland Sea, can effectively detect benthic lifeforms in challenging deep-sea environments characterized by variation in lighting, perspective, object occlusion and imaging equipment. We show that the model can successfully localize organisms with high precision and achieve high mAP scores when sufficient training data is available. Lower recall scores are obtained in only a few cases and can be directly attributed to a lack of training data and/or the presence of highly obscured, small instances in the validation data, such as ophiuroids in spicule mats. The model metrics also inspire confidence in detection certainty with minimal false-positive detections.
Thus, DeepSee forms a strong foundation for future annotation tasks, integral to the workflow of marine scientists and surveyors in the North Atlantic. Although a valuable tool, the model cannot replace the expertise of scientists and in-situ sampling. The model annotations should be subject to expert verification and additional annotations will be required for cases where the model misses instances due to contextual or environmental challenges. Nevertheless, model deployment serves as a valuable foundation and will significantly reduce the time and workload needed to annotate such images by many orders of magnitude. This, in turn, will accelerate the creation of high-resolution maps of the seafloor, enhancing our understanding of the distribution of life in these regions and aiding in making quantitative, informed resource allocation decisions.
Future work will focus on expanding the DeepSee dataset by incorporating new detection classes to enhance its versatility and applicability. Additionally, efforts will be made to explore the identification of benthic organisms in regions beyond the North Atlantic, thereby broadening the dataset’s geographical scope. This expansion will not only improve the model’s robustness but also contribute to a more comprehensive understanding of benthic ecosystems globally. Furthermore, modifications to model architecture to enhance performance while maintaining computational efficiency is also worth investigating. Potential adjustments may include refining convolutional layers, integrating attention mechanisms, and experimenting with alternative loss functions. These improvements could yield valuable advancements in detection capabilities, particularly in the complex environments of deep-sea imagery, representing a promising direction for ongoing research.
Data availability statement
The raw data supporting the conclusions of this article will be made available by the authors, without undue reservation.
Author contributions
KI: Conceptualization, Data curation, Formal analysis, Investigation, Methodology, Software, Validation, Visualization, Writing – original draft, Writing – review & editing. CM: Conceptualization, Data curation, Investigation, Visualization, Writing – original draft. DS: Conceptualization, Investigation, Methodology, Project administration, Resources, Writing – review & editing. EH: Conceptualization, Project administration, Resources, Writing – review & editing.
Funding
The author(s) declare that no financial support was received for the research, authorship, and/or publication of this article.
Acknowledgments
We would like to thank AkerBP giving permission to publish this study and the Norwegian Offshore Directorate, University of Bergen and Adepth Minerals for supplying ROV videos for model training. We would also like to thank Heidi Kristina Meyer for an insightful discussion about the Schulz Bank study. We thank Jianfeng Tong and Annemiek Vink for their constructive reviews that helped strengthen the manuscript. ChatGPT-4o by OpenAI was used to refine the manuscript.
Conflict of interest
Authors KI, CM, and DS were employed by company Bergverk AS. Author EH was employed by company AkerBP ASA.
The remaining authors declare that the research was conducted in the absence of any commercial or financial relationships that could be construed as a potential conflict of interest.
Publisher’s note
All claims expressed in this article are solely those of the authors and do not necessarily represent those of their affiliated organizations, or those of the publisher, the editors and the reviewers. Any product that may be evaluated in this article, or claim that may be made by its manufacturer, is not guaranteed or endorsed by the publisher.
Supplementary material
The Supplementary Material for this article can be found online at: https://www.frontiersin.org/articles/10.3389/fmars.2024.1470424/full#supplementary-material
References
Albrecht J., Beazley L., Braga-Henriques A., Cardenas P., Carreiro-Silva M., Colaço A., et al. (2020). ICES/NAFO joint working group on deep-water ecology (WGDEC). doi: 10.17895/ices.pub.6095
Bochkovskiy A., Wang C.-Y., Liao H.-Y. M. (2020). Yolov4: Optimal speed and accuracy of object detection. arXiv preprint arXiv:2004.10934. doi: 10.48550/arXiv.2004.10934
Brodnicke O. B., Meyer H. K., Busch K., Xavier J. R., Knudsen S. W., Møller P. R., et al. (2023). Deep-sea sponge derived environmental DNA analysis reveals demersal fish biodiversity of a remote Arctic ecosystem. Environ. DNA 5, 1405–1417. doi: 10.1002/edn3.v5.6
Buhl-Mortensen L., Burgos J. M., Steingrund P., Buhl-Mortensen P., Ólafsdóttir S. H., Ragnarsson S. Á. (2019). Vulnerable marine ecosystems (VMEs): Coral and sponge VMEs in Arctic and sub-Arctic waters–Distribution and threats Vol. 2019519 (Denmark: Nordic Council of Ministers).
Cai S., Zhang X., Mo Y. (2024). A Lightweight underwater detector enhanced by Attention mechanism, GSConv and WIoU on YOLOv8. Sci. Rep. 14, 25797. doi: 10.1038/s41598-024-75809-z
Clare M. A., Lichtschlag A., Paradis S., Barlow N. L. M. (2023). Assessing the impact of the global subsea telecommunications network on sedimentary organic carbon stocks. Nat. Commun. 14, 2080. doi: 10.1038/s41467-023-37854-6
Cuvelier D., Zurowietz M., Nattkemper T. W. (2024). Deep learning–assisted biodiversity assessment in deep-sea benthic megafauna communities: a case study in the context of polymetallic nodule mining. Front. Mar. Sci. 11. doi: 10.3389/fmars.2024.1366078
Evans J. L., Peckett F., Howell K. L. (2015). Combined application of biophysical habitat mapping and systematic conservation planning to assess efficiency and representativeness of the existing High Seas MPA network in the Northeast Atlantic. ICES J. Mar. Sci. 72, 1483–1497. doi: 10.1093/icesjms/fsv012
Fu X., Liu Y., Liu Y. (2022). A case study of utilizing YOLOT based quantitative detection algorithm for marine benthos. Ecol. Inf. 70, 101603. doi: 10.1016/j.ecoinf.2022.101603
Gallego R., Arias M. B., Corral-Lou A., Díez-Vives C., Neave E. F., Wang C., et al. (2024). North Atlantic deep-sea benthic biodiversity unveiled through sponge natural sampler DNA. Commun. Biol. 7, 1015. doi: 10.1038/s42003-024-06695-4
Geisz J. K., Wernette P. A., Esselman P. C. (2024). Classification of lakebed geologic substrate in autonomously collected benthic imagery using machine learning. Remote Sens. 16, 1264. doi: 10.3390/rs16071264
Girshick R. (2015). Proceedings of the IEEE international conference on computer vision, Santiago, Chile. 1440–1448.
Girshick R., Donahue J., Darrell T., Malik J. (2014). Proceedings of the IEEE conference on computer vision and pattern recognition, Columbus, Ohio. 580–587.
Gollner S., Haeckel M., Janssen F., Lefaible N., Molari M., Papadopoulou S., et al. (2022). Restoration experiments in polymetallic nodule areas. Integr. Environ. Assess. Manag. 18, 682–696. doi: 10.1002/ieam.4541
Hartz E. H., Iyer K. H., Marnor C. M., Schmid D. W. (2024). DeepSee (v0.1.0). Github Repository. https://github.com/Aker-BP-Open-Research/DeepSeehttps://github.com/Aker-BP-Open-Research/DeepSee.
Jocher G. (2020). YOLOv5 by Ultralytics. Available online at: https://github.com/ultralytics/yolov5.
Jocher G. (2023). YOLOv8 by Ultralytics. Available online at: https://github.com/ultralytics/ultralytics.
Kroodsma D. A., Mayorga J., Hochberg T., Miller N. A., Boerder K., Ferretti F., et al. (2018). Tracking the global footprint of fisheries. Science 359, 904–908. doi: 10.1126/science.aao5646
Kuznetsova A., et al. (2020). The open images dataset v4: Unified image classification, object detection, and visual relationship detection at scale. Int. J. Comput. Vision 128, 1956–1981. doi: 10.1007/s11263-020-01316-z
Legrand E., Boulard M., O’Connor J., Kutti T. (2024). Identifying priorities for the protection of deep-sea species and habitats in the Nordic Seas.
Lim A., Wheeler A. J., Price D. M., O’Reilly L., Harris K., Conti L. (2020). Influence of benthic currents on cold-water coral habitats: a combined benthic monitoring and 3D photogrammetric investigation. Sci. Rep. 10, 19433. doi: 10.1038/s41598-020-76446-y
Liu W., Anguelov D., Erhan D., Szegedy C., Reed S., Fu C.-Y., et al. (2016). Computer Vision–ECCV 2016: 14th European Conference, Amsterdam, The Netherlands (Springer), 21–37. Proceedings, Part I 14.
Liu Y., Wang S. (2021). A quantitative detection algorithm based on improved faster R-CNN for marine benthos. Ecol. Inf. 61, 101228. doi: 10.1016/j.ecoinf.2021.101228
Liu Y., Xu Y., Wang H., Li X. (2023). Artificial Intelligence Oceanography. Eds. Li X., Wang F. (Singapore: Springer Nature Singapore), 323–346.
Lyu L., Liu Y., Xu X., Yan P., Zhang J. (2023). EFP-YOLO: A quantitative detection algorithm for marine benthic organisms. Ocean Coast. Manage. 243, 106770. doi: 10.1016/j.ocecoaman.2023.106770
Marmen M. B., Tompkins G., Harrington N., Savard-Drouin A., Wells M., Baker E., et al. (2019). Sponges from the 2010-2014 paamiut multispecies trawl surveys, eastern arctic and subarctic: class demospongiae, subclass heteroscleromorpha, order poecilosclerida, families microcionidae, acarnidae and esperiopsidae. Fish. Oceans Canada.
Marnor C. M. (2022). Mapping distribution patterns of brittle stars using ROV-based imaging (Norway: NTNU).
Mayer M., Piepenburg D. (1996). Epibenthic community patterns on the continental slope off East Greenland at 75* N. Mar. Ecol. Prog. Ser. 143, 151–164. doi: 10.3354/meps143151
Meyer H. K., Davies A. J., Roberts E. M., Xavier J. R., Ribeiro P. A., Glenner H., et al. (2022). Megafauna abundance records during 2017 and 2018 SponGES Cruises (GSGS2017110 and GS2018108) with RV G.O. Sars and ROV Ægir 6000 on Schulz Bank, Arctic Mid-Ocean Ridge PANGAEA. doi: 10.1594/PANGAEA.949920
Meyer H. K., Davies A. J., Roberts E. M., Xavier J. R., Ribeiro P. A., Glenner H., et al. (2023). Beyond the tip of the seamount: Distinct megabenthic communities found beyond the charismatic summit sponge ground on an arctic seamount (Schulz Bank, Arctic Mid-Ocean Ridge). Deep Sea Res. Part I: Oceanogr. Res. Papers 191, 103920. doi: 10.1016/j.dsr.2022.103920
Meyer H. K., Roberts E. M., Rapp H. T., Davies A. J. (2019). Spatial patterns of arctic sponge ground fauna and demersal fish are detectable in autonomous underwater vehicle (AUV) imagery. Deep Sea Res. Part I: Oceanogr. Res. Papers 153, 103137. doi: 10.1016/j.dsr.2019.103137
Pedersen R. B., Rydland Olsen B., Barreyre T., Bjerga A., Denny A., et al. (2022). Fagutredning mineralressurser i norskehavet landskapstrekk, naturtyper og bentiske økosystemer.
Ramirez-Llodra E., Brandt A., Danovaro R., De Mol B., Escobar E., German C. R., et al. (2010). Deep, diverse and definitely different: unique attributes of the world’s largest ecosystem. Biogeosciences 7, 2851–2899. doi: 10.5194/bg-7-2851-2010
Ramirez-Llodra E., Hilario A., Paulsen E., Costa C. V., Bakken T., Johnsen G., et al. (2020). Benthic communities on the Mohn’s treasure mound: implications for management of seabed mining in the Arctic mid-ocean ridge. Front. Mar. Sci. 7, 490. doi: 10.3389/fmars.2020.00490
Ramirez-Llodra E., Meyer H. K., Bluhm B. A., Brix S., Brandt A., Dannheim J., et al. (2024). The emerging picture of a diverse deep Arctic Ocean seafloor: From habitats to ecosystems. Elementa: Sci. Anthropocene 12, 00140. doi: 10.1525/elementa.2023.00140
Redmon J., Divvala S., Girshick R., Farhadi A. (2016). You only look once: Unified, real-time object detection Proceedings of the IEEE conference on computer vision and pattern recognition. Las Vegas, USA. 779–788.
Redmon J., Farhadi A. (2017). Proceedings of the IEEE conference on computer vision and pattern recognition. Honolulu, USA. 7263–7271.
Redmon J., Farhadi A. (2018). Yolov3: An incremental improvement. arXiv preprint arXiv:1804.02767. doi: 10.48550/arXiv.1804.02767
Ren S., He K., Girshick R., Sun J. (2015). Faster r-cnn: Towards real-time object detection with region proposal networks. IEEE transactions on pattern analysis and machine intelligence 39 (6), 1137-1149. doi: 10.48550/arXiv.1506.01497
Schoening T., Kuhn T., Jones D. O. B., Simon-Lledo E., Nattkemper T. W. (2016). Fully automated image segmentation for benthic resource assessment of poly-metallic nodules. Methods Oceanogr. 15-16, 78–89. doi: 10.1016/j.mio.2016.04.002
Wang C.-Y., Bochkovskiy A., Liao H.-Y. M. (2023). YOLOv7: Trainable bag-of-freebies sets new state-of-the-art for real-time object detectors. Proceedings of the IEEE/CVF conference on computer vision and pattern recognition. Nashville, USA, 7464–7475.
Wang A., Chen H., Liu L., Chen K., Lin Z., Han J., et al. (2024). YOLOv10: real-time end-to-end object detection. arXiv preprint arXiv:2405.14458. doi: 10.48550/arXiv.2405.14458
Wang C.-Y., Yeh I.-H., Liao H.-Y. M. (2024). YOLOv9: learning what you want to learn using programmable gradient information. arXiv preprint arXiv:2402.13616. doi: 10.48550/arXiv.2402.13616
Xu X., Liu Y., Lyu L., Yan P., Zhang J. (2023). MAD-YOLO: A quantitative detection algorithm for dense small-scale marine benthos. Ecol. Inf. 75, 102022. doi: 10.1016/j.ecoinf.2023.102022
Keywords: deep sea benthic life, object detection, machine learning, marine resources, MPA (marine protected area)
Citation: Iyer KH, Marnor CM, Schmid DW and Hartz EH (2025) Detecting and quantifying deep sea benthic life using advanced object detection. Front. Mar. Sci. 11:1470424. doi: 10.3389/fmars.2024.1470424
Received: 25 July 2024; Accepted: 19 December 2024;
Published: 13 January 2025.
Edited by:
Elva G. Escobar-Briones, National Autonomous University of Mexico, MexicoReviewed by:
Jianfeng Tong, Shanghai Ocean University, ChinaAnnemiek Vink, Federal Institute For Geosciences and Natural Resources, Germany
Copyright © 2025 Iyer, Marnor, Schmid and Hartz. This is an open-access article distributed under the terms of the Creative Commons Attribution License (CC BY). The use, distribution or reproduction in other forums is permitted, provided the original author(s) and the copyright owner(s) are credited and that the original publication in this journal is cited, in accordance with accepted academic practice. No use, distribution or reproduction is permitted which does not comply with these terms.
*Correspondence: Karthik H. Iyer, a2FydGhpay5peWVyQGJlcmd3ZXJrLmNvbQ==
†ORCID: Camilla M. Marnor, orcid.org/0009-0007-5584-5528
 Karthik H. Iyer
 Camilla M. Marnor
 Daniel W. Schmid
 Ebbe H. Hartz