- 1Research Institute for Applied Mechanics, Kyushu University, Kasuga, Japan
- 2Faculty of Fisheries, Nagasaki University, Nagasaki, Japan
- 3Saga Genkai Fisheries Promotion Center, Saga Prefectural Office, Karatsu, Japan
- 4Fukuoka Fisheries and Marine Technology Research Center, Fukuoka Prefectural Office, Fukuoka, Japan
- 5Nagasaki Prefectural Institute of Fisheries, Nagasaki Prefectural Office, Nagasaki, Japan
- 6Center for Development of Information Technology, IDEA Consultants, Inc., Takasaki, Japan
- 7Product Development Department, JFE Advantech Co., Ltd., Nishinomiya, Japan
- 8System and Planning Division, Japan Fisheries Information Service Center, Tokyo, Japan
- 9Research & Development Department, Furuno Electric Co., Ltd., Nishinomiya, Japan
Subsurface observations in coastal and shelf seas remain insufficient compared to profiling measurements in open oceans. To address this gap, we have developed a system that involves coastal fishermen in conducting in-situ measurements. By assimilating this observation data in real-time, we can provide valuable feedback on ocean predictions to support their fishing activities. We adapted the traditional full-scale conductivity-temperature-depth (CTD) instrument into a more conventional model dedicated to small-scale fisheries. This simple and smart CTD device allows Bluetooth communication with Android devices. Although its accuracy and pressure resistance were reduced to make it affordable, it remains effective for our data assimilation purpose. Along with acoustic current data, the accuracy of coastal ocean prediction models, particularly for velocity components, can be significantly increased. Using the intuitive and user-friendly forecasting app, cooperating fishermen have been able to reduce fuel usage, working hours, and gear damages, thereby improving profitability and working conditions. This app has become an indispensable operational tool for fishermen in the Kyushu region, motivating them to actively participate in coastal ocean observations.
1 Introduction
Observational data is the cornerstone of oceanography. While sea surface data have become quite comprehensive thanks to a variety of satellite observations, the amount of observation data in the ocean interior is still short of the demands from ocean science.
In the 21st century, in offshore areas where Argo floats have been actively deployed, the amount of in-situ observation data has increased (e.g., Jayne et al., 2017). However, since the Argo program was designed primarily for deep water, the typical parking depth of 1000 meters does not facilitate routine measurement in coastal and shelf seas. As a result, observations in shallow waters still rely heavily on oceanographic research vessels.
Van Vranken et al. (2020) suggested that requesting ocean observations from fishing vessels could dramatically increase the number of in-situ observations in shallow areas less than 1000 meters. As pioneers in this field, the Fishery Observing System (FOS) and RECOPESCA projects were launched in Italy and France, respectively, in the early 2000s (Falco et al., 2007; Leblond et al., 2010). These groundbreaking initiatives collected water environmental data (such as temperature and salinity) and fishing data from numerous fishing vessels. One project further expanded as Fishery and Oceanography Observing System (Patti et al., 2016), while the other recently came to an end (Duchene et al., 2023). Various challenges have been pointed out, such as instrument deterioration and changes in communication environments, but the presence of users especially ocean scientists is particularly important.
In Japan, although the number of fishing vessels has been decreasing over the decades, it is estimated that around 100,000 fishing boats (less than 10 tons) are still in operation in coastal waters (Japan Fisheries Agency, 2023). Compared to other developed countries, there are many small-scale coastal fisheries that catch a diverse range of fish species using various fishing methods (Yagi et al., 2018). These small vessels hold great potential as platforms for coastal ocean observation as demonstrated by Nakada et al. (2014). If the accuracy of environment predictions improves through marine data collected from such vessels, it could not only enhance the estimation of fish abundance but also increase the efficiency of fishing activities. In contrast to the highly information-driven offshore large-scale fishing and coastal aquaculture (Saitoh et al., 2011; Igarashi et al., 2017), there is significant potential for innovation in coastal small-scale vessel fisheries (Saitoh, 2016).
The Kyushu Smart Fisheries (QSF) team was formed in 2016 through the cooperation of government, academia, and industry. From the outset, our goal was set to provide an accurate forecast of ocean conditions based on in-situ measurements taken with fishing vessels. We consider coastal fishermen to be prospective heavy users who would benefit from these ocean forecasts. In the next section, we explain the development of a simplified CTD instrument and the acquisition of data from acoustic current meters. Sections 3 and 4 introduce a coastal ocean prediction model and data assimilation, respectively. Section 5 is devoted to forecast app for fishermen. Evaluations of fishermen and public organizations are presented in Section 6, followed by the summary section.
2 Fishing vessel measurement
To achieve accurate ocean forecasts, dense measurements of ocean state variables (such as temperature, salinity, and velocity components) by numerous fishermen are essential. However, professional CTDs are too large for fishermen to handle. Therefore, a small-scale CTD device (hereafter referred to as S-CTD) has been developed in the earliest years of the QSF project (JFE Advantech Co., Ltd, 2022).
The main part of the S-CTD is protected by a titanium body against noise, corrosion, and pressure. The head and bottom sections house the CTD sensors, a non-contact charging unit and a Bluetooth module in robust resins. The power switch for the S-CTD is designed to make no protrusions and features a magnet-responsive mechanism, ensuring it will not malfunction at sea. Two titanium rings are welded onto the main body, allowing it to be securely attached to ropes or fishing gear. Weighting only 870 grams, fishermen can easily and safely throw this CTD device into the seawater from their boats (Figure 1). For measurements, it is often allowed to free-fall when lowered and is usually retrieved using an electric winch.

Figure 1. One fisherman just dropped S-CTD from his fishing vessel into seawater. The Bluetooth technology allows automatic transmission of measurement data to his Android device as soon as it returns above the sea surface.
The nominal accuracy is within ±0.2°C for water temperature and within ±0.2mS/cm for conductivity. However, if we compare actual measurements with those of a high-precision CTD sensor, the differences tend to be smaller. Practically, the accuracy is estimated to be ±0.09°C for temperature and ±0.08mS/cm for conductivity (Ito et al., 2021).
The vertical structure of ocean currents has been already measured by many fishing vessels. Most acoustic Doppler current profilers (ADCP) on small fishing boats are products of Furuno Electric Co., Ltd. or Japan Radio Co., Ltd. Typically, these instruments observe the velocity vectors in three or five vertical layers. In shallow coastal areas (approximately less than 300 meters deep), the velocity measurements can be more accurate using bottom track mode.
However, the current data are mostly only viewed in real time on monitors aboard the vessels and are rarely recorded, necessitating the installation of data loggers on the fishing vessels as shown in Figure 2, Nakada et al. (2014) or Fukudome et al. (2016). The length, width, and height of this logger box made by Yoron Denshi, Inc. are 155, 135 and, 86 mm, respectively. The CUR (Water Current Layer) sentence, output by the current meter and part of the NMEA0183 standard communication protocol for marine electronics, is received by the data logger serially connected to the current meter.
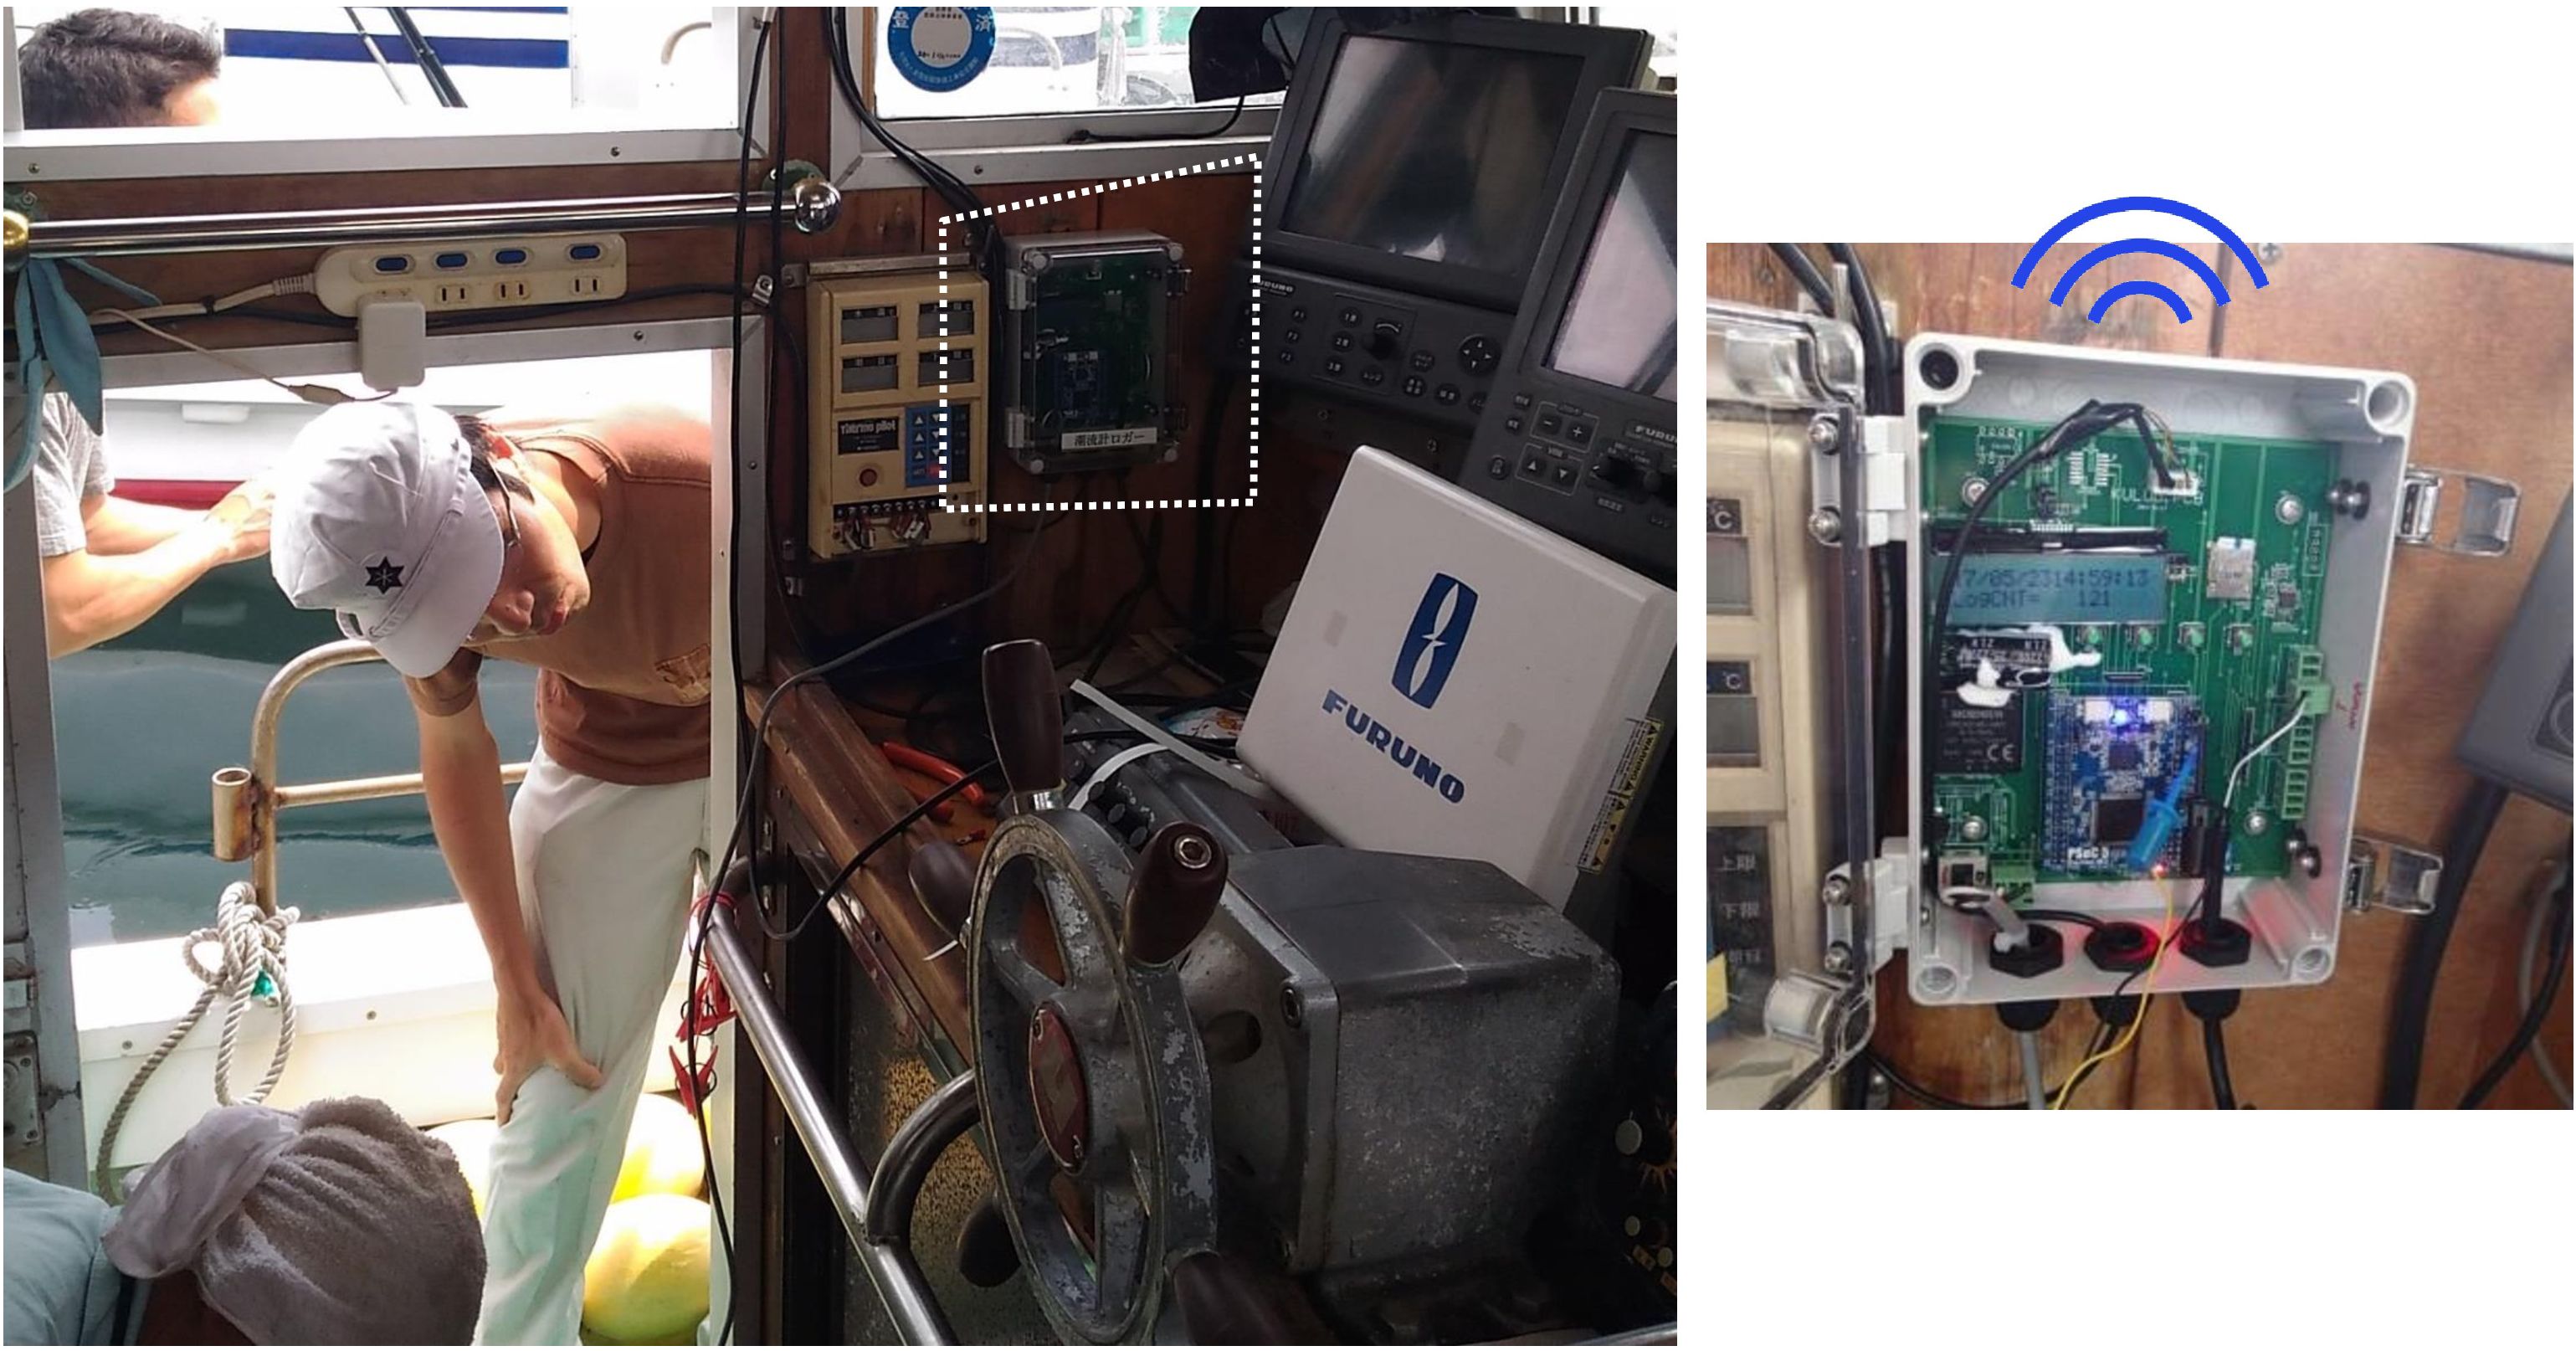
Figure 2. NMEA data logger (Yoron Denshi, Inc.) installed to a fishing vessel. This box records NMEA-0183 sentence including ADCP data from vessel electronic equipment(s) via wired serial connection. The data are then transferred wirelessly to an Android phone/tablet.
We have also developed an Android app “isow” for collecting observation data from marine observation equipments, displaying graphs, and automatically transferring data to cloud servers. The app automatically connects via Bluetooth to a NMEA logger and a S-CTD, retrieving the observation data directly into the app. The position information of the S-CTD utilizes the GPS of the Android device, while for ADCP data, the app acquires fishing vessel GPS information via the logger. Once the observation data is imported into the app, it is instantly visualized through graphs and other means. One fisherman said that after observing the depth graph of the S-CTD attached to his fishing gear, which differed from his expectations, he adjusted his operating methods and consequently improved his fishing efficiency.
The observation data imported into the “isow” app is backed up to a cloud server. Even data observed in areas without mobile network coverage, such as at open sea, will be automatically transferred to the cloud server once back within communication range. Fishermen can review in-situ observation data not only on Android devices but also on their home PCs. For example, one fisherman analyzed the bottom temperature and salinity that he observed himself, identifying the optimal environmental conditions for good fishing. Furthermore, they can share the data with others, such as ocean modelers in Kyushu University, facilitating collaboration and data sharing.
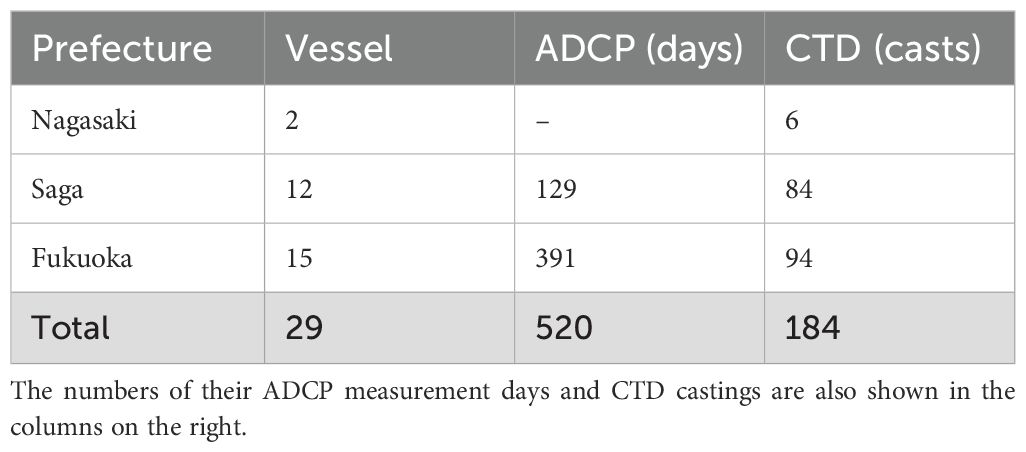
The number of cooperating fishermen/vessels and the frequency of marine observations have been increasing continuously (Tables 1, 2). In particular, the number of CTD observations exceeded 13,000 castings last fiscal year, which is equivalent to approximately last 20 years of CTD profiles in the northern Kyushu area derived from the Japan Oceanographic Data Center (JODC). With the high-frequency and high-density observation network, it is expected to capture small-scale temporal and spatial phenomena (Takikawa et al., 2019).
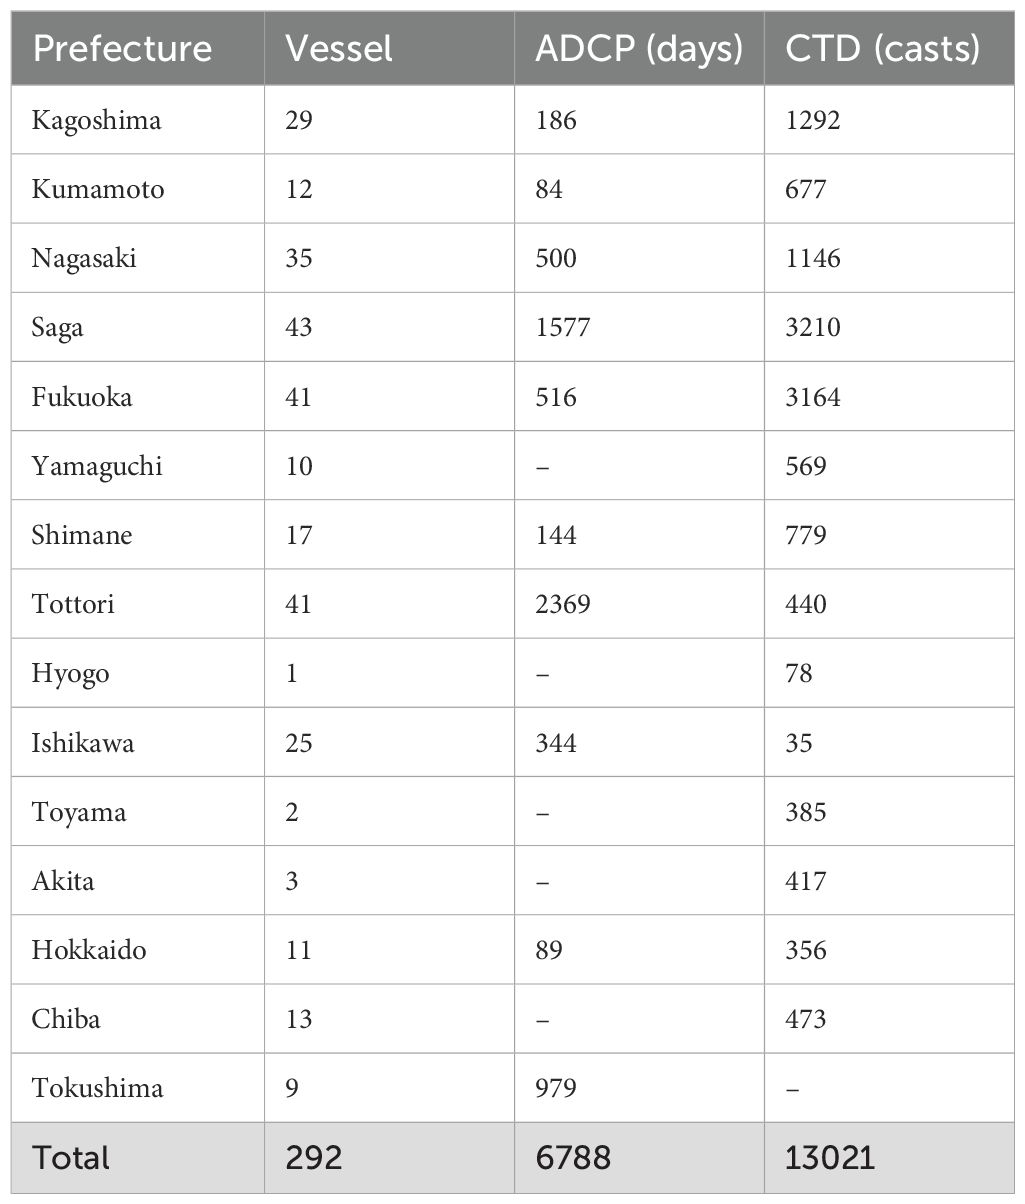
Table 2. Same as Table 1 but for 2023.
3 Ocean modeling
A high-resolution coastal ocean prediction model (DR_D) was developed for the area in and around the Tsushima Strait (Hirose et al., 2021). The horizontal resolution is approximately 1.5km in spherical coordinates and the vertical grid size is increased from 2m at the surface, 4m at 200m depth, and much larger at deeper levels. The open boundary conditions are provided by downscaling the hourly output from the parent model with approximately 7.5km horizontal mesh (Hirose et al., 2013). However, in the early version, the tidal currents were not simulated very accurately, as indicated by feedback from cooperating fishermen.
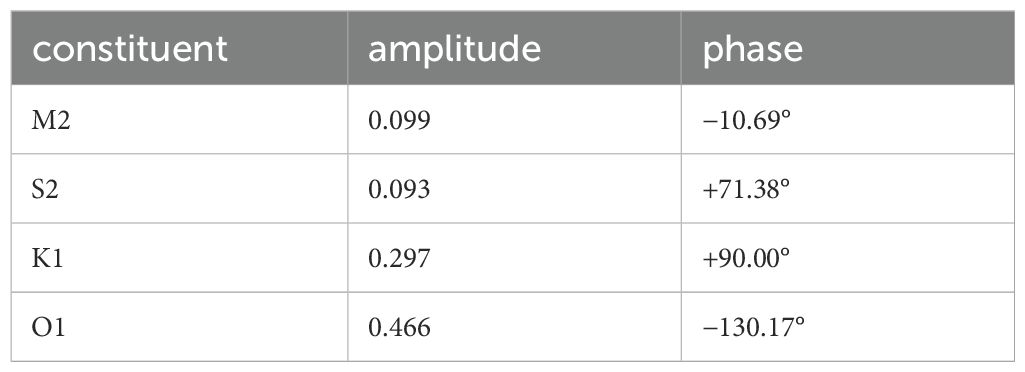
Therefore, we decided to add correction terms of the four major tidal constituents (M2, S2, K1, and O1) to the open boundary conditions using fishing vessel ADCP observation data as constraints. Since barotropic tidal motions were expected to be dominant during non-stratified periods, we used the vessel data from seven vessels received in March 2019. The first guess of the tidal constituents was given by Matsumoto et al. (2000), and the eight parameters consisting of the sine and cosine functions of the four constituents were inversely estimated by using model Green’s functions (Menemenlis et al., 2005).
As a result, as shown in Table 3, the adjustments for the semi-diurnal tides (M2, S2) were small, while the diurnal tides (K1, O1) required larger adjustments. The calibrated experiment for March 2019 with these adjustments indicates that the correlation coefficient increased from 0.922 to 0.944, the coefficient of determination improved from 0.841 to 0.891, and the RMS difference decreased from 8.6 cm/s to 7.1 cm/s. The revision of the tidal components was effective to a certain extent.
Figure 3 shows the temporal changes in alongshore velocity component at several representative points. The correction effect is small if the tidal current changes regularly, oscillating twice a day. However, during neap tides, when diurnal inequality occurs, the difference becomes more pronounced.
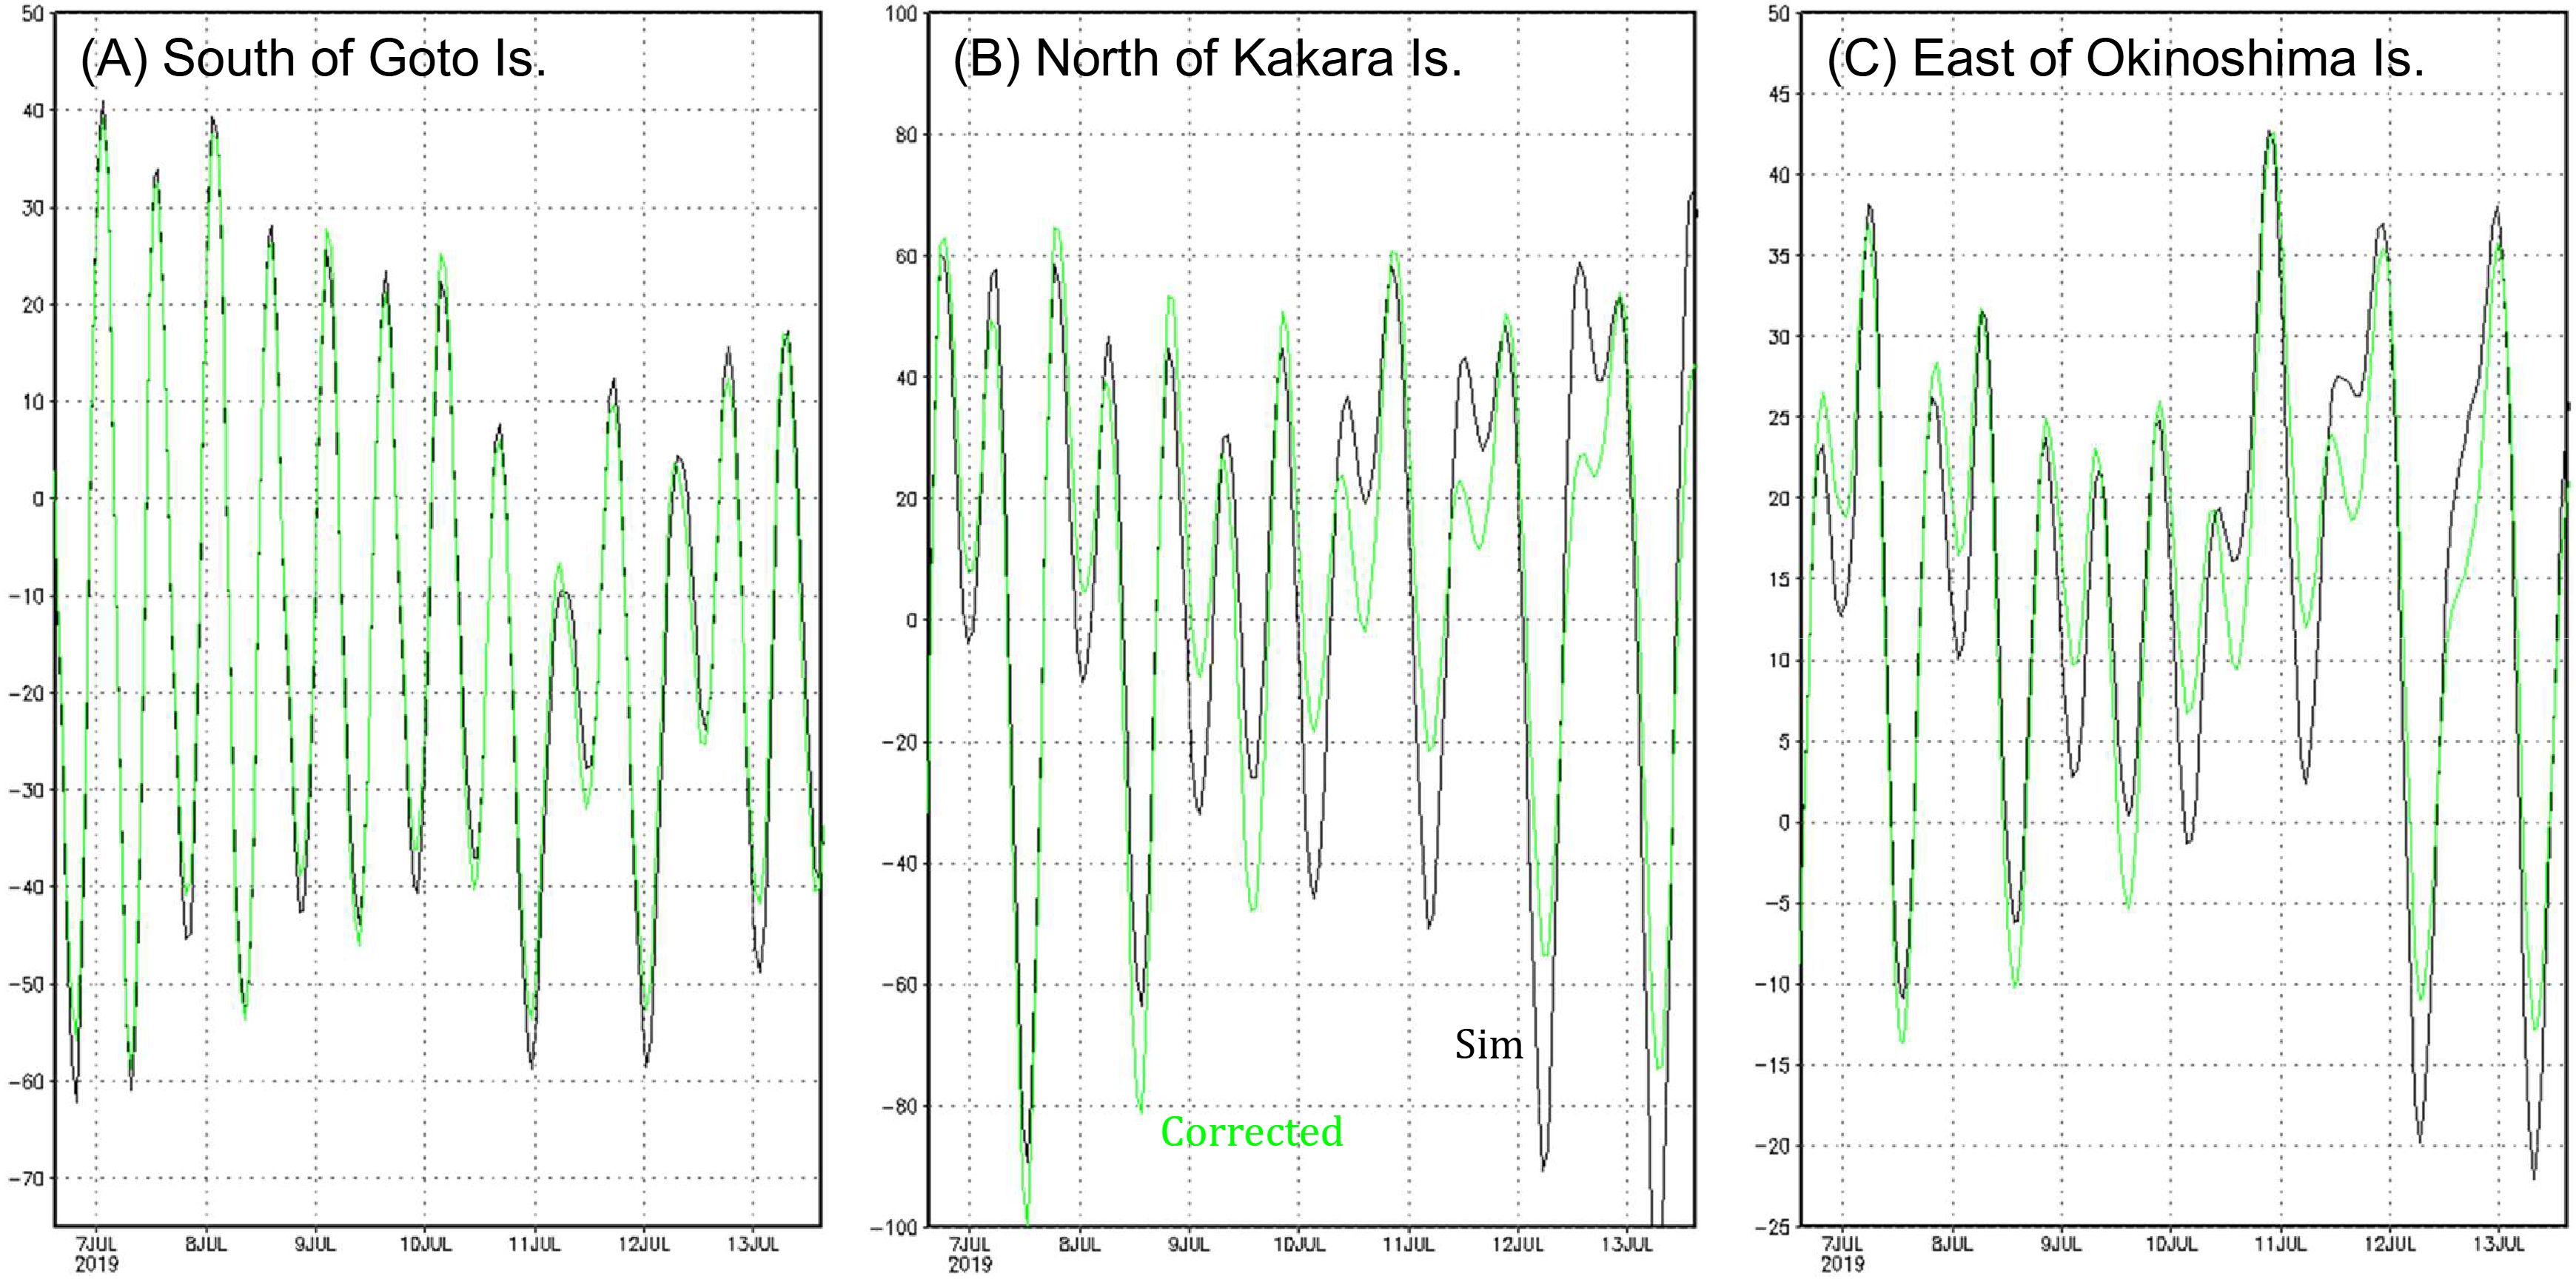
Figure 3. Time series of along-shore component of modeled velocity at 10m depth in (A) 32.207°N, 128.675°E, (B) 33.633°N, 129.854°E, and (C) 34.250°N, 130,333°E before and after the calibration.
In July 2019, we implemented these tidal conditions into the operational forecast calculations without any announcements, and shortly thereafter, one of the cooperating fishermen noticed the update. The feedback from attentive fishermen has indeed helped to identify problems of our forecasts, leading to improvements. The interaction with fishing industry reinforces our responsibility towards the accuracy of the prediction model.
4 Kalman filtering
The S-CTD data and ADCP data from the fishing vessels are assimilated into the DR_D model using a sparse and efficient Kalman filter (Fukumori, 2002; Hirose et al., 2013). The state vector consists of the prognostic variables of temperature, salinity, horizontal velocity components, and sea surface height, though with a coarse horizontal grid resolution of 19.2 km. The number of vertical levels is also reduced to 8 (at depths of 1, 11, 21, 31, 43, 58, 76, and 100 m). Therefore, this data assimilation method can be considered suboptimal, prioritizing fast operation.
The estimation of data and model error using covariance matching equations (Fu et al., 1993) indicated that both were of similar magnitude. The errors for temperature and salinity were estimated to exceed 0.5°C2 and 0.1 psu2, respectively, while the velocity error exceeded 100 cm2s-2. As shown in the previous section, the measurement accuracy of the S-CTD is approximately 0.01°C2 and 0.01 psu2, indicating that the representation error is significantly larger than the instrument error. Consequently, since the data-constraint error (R matrix) should be much larger than the instrument error, the measurement accuracy of the S-CTD—though inferior to that of a full-spec CTD sensor—does not pose a limiting factor for this data assimilation. Even with the increased resolution of 1.5 km mesh, the missing physics in the model, such as internal waves, likely remain significant.
In the absence of observational data, an asymptotic solution was obtained using the doubling algorithm for accelerated convergence (Anderson and Moore, 1979). The error variance of temperature was similar to that obtained through covariance matching, but the salinity and velocity components remained smaller as shown in Table 4. Using this asymptotic limit as the initial condition, we compared the assimilation effects of monthly regular full-spec CTD data from regular governmental observations (RG) with those of S-CTD observations from irregular coastal fishing vessels (FV). The data-constrained error variances (or diagonal components of the R matrix) were set uniformly across space (1.0°C2, 0.16 psu2, and 100 cm2s-2). In the case of RG assimilation, observations usually conducted at the beginning of each month reduced the estimated errors. But by the end of each month, when no observation data were available, the error levels asymptotically returned to those of the simulation (Figure 4). In the case of FV assimilation, the short-term fluctuations in model error were significantly more intense; however, except for the first few days, the errors consistently remained lower than those of the simulation. This tendency was also similar for salinity and velocity components (Table 4). Furthermore, the accuracy of FV assimilation was found to improve more during the warm season than in the cold season. This can be attributed to the increased frequency of observations due to the higher number of fishing operations during the warm season, which is typically favored by good weather conditions.

Table 4. Time-mean and standard deviation of diagonal averages of error covariance matrices for 2021.

Figure 4. Time series of diagonal average of temperature part of error covariance matrices for the three cases of no-data assimilation (Sim, black dots), data assimilation with regular governmental measurement (RG, blue curve) and irregular fishing vessel measurement (FV, green curve).
Finally, by correcting the tidal and empirical parameters in the DR_D model using the numerical Green’s function as in previous section and Hirose et al. (2021), and assimilating fishing vessel data (ADCP, S-CTD) into this model with the approximate Kalman filter, significant improvements were found particularly in the velocity changes (Figure 5).

Figure 5. Scatter diagram comparing model prediction and measurement data for temperature, salinity, and northeastward velocity components in August 2019. All data located north of Kyushu Island (roughly 130-131°E, 33.5-34.5°N). The blue and red dots indicate the earliest and assimilation version of DR_D model (Hirose et al., 2021), respectively.
For the predominant northeast-southwest velocity component in the Tsushima Strait, the correlation coefficient with ADCP data improved from 0.828 to 0.881, and the residual variance decreased from 279 cm²/s² to 143 cm²/s² (−49%). The modeled temperature and salinity are also improved, with residual variances reduced by 31% (from 1.29 to 0.89°C2) and 38% (from 0.132 to 0.081 psu2), respectively, though the magnitude of improvement in velocity changes is more significant. One of the main reasons of this improvement can be attributed to the enhancement of the vertical viscosity coefficient as shown by Hirose et al. (2021).
Ito et al. (2023) coupled a lower trophic ecosystem model with this dynamical model to create statistical models for predicting fishing grounds of the swordtip squid. While these results have not yet been provided to the local fishermen (as of 2022), the data assimilation improves the initial conditions and predictability of ocean condition forecasts, thus contributing to better predictions of fishing conditions for various fish species in the future.
5 Viewer app
We developed an Android app as a display tool to easily utilize forecast data from the coastal ocean prediction models without requiring specialized knowledge (IDEA Consultants, Inc, 2024). The app named Yochou visualizes predicted values for water temperature, salinity, and ocean currents up to three days ahead (and extended to one week in 2022), presenting them as horizontal distributions at different depths and vertical profiles for the areas specified. Users can also observe their temporal changes. The app is designed for use at sea, where mobile communication is often unavailable. Basically, the users download the forecast data in advance while on land and access it offline at sea.
The Yochou follows a mapping approach commonly used in various weather viewer apps. To provide similar usability to map apps, our app uses the open-source map library Leaflet and its plugins as the foundation for the visualization components.
On smartphones and tablets, touch operation is fundamental. This app is designed to be intuitive, allowing users to operate it almost entirely through finger touch. It can also display depth-time graphs to observe temporal changes by fixing latitude and longitude. By aligning the cursor (+ mark) displayed in the center of the screen with the point of interest and pressing the ZT mark in the bottom right corner, a depth-time diagram pops up (Figure 6).

Figure 6. Screen shots of prediction app “Yochou” for (left) horizontal map and (right) depth-time diagram. Translations are shown in italics.
During the development of Yochou app, we repeatedly sought feedback from fishers and made numerous improvements. As a result, the app is optimized for coastal fishing vessels. This app has been provided free of charge to the cooperating fishers who have achieved a certain level of measurement frequency.
6 Fishermen comments
In this section, we introduce the voices of cooperative fishermen who used the Yochou app during the QSF project period, which lasted until March 2022.
● I have never seen a forecast of the ocean conditions before. The predictions from this app seem quite accurate and trustworthy.
● My lightweight fishing gear is easily out of control at strong or sheared current, and thus we need to select fishing grounds with moderate water motion. The accurate current prediction is essential to deploy the gear at target depth.
● I can avoid my fishing gear caught on rocky bed, and thus spend less time on repairs of the gear on the boat or at the port.
● Using this app feels like listening to my grandfather when I was learning how to fish. The predictions became inaccurate on a biweekly basis, but since the summer of 2019, the accuracy of tidal forecasts has significantly improved.
● We had only been looking at the remotely sensed sea surface temperature the day before fishing. The real-time information is groundbreaking and highly valuable. It seems that the predicted sea surface salinity correlates to my fish catch.
● Since there is almost no need to search for fishing grounds anymore, our fleet can go straight from the port to the fishing grounds, resulting in a reduction of over 10% in fuel costs and operating (labor) hours. With increased break time, I feel physically much better.
● This app is also effective for training newcomers. By using this visual information, experienced fishermen can more easily convey their expertise and know-how to the freshmen. We are pleased that the fishing techniques can be more easily passed down, supporting new workers entering the traditional industry.
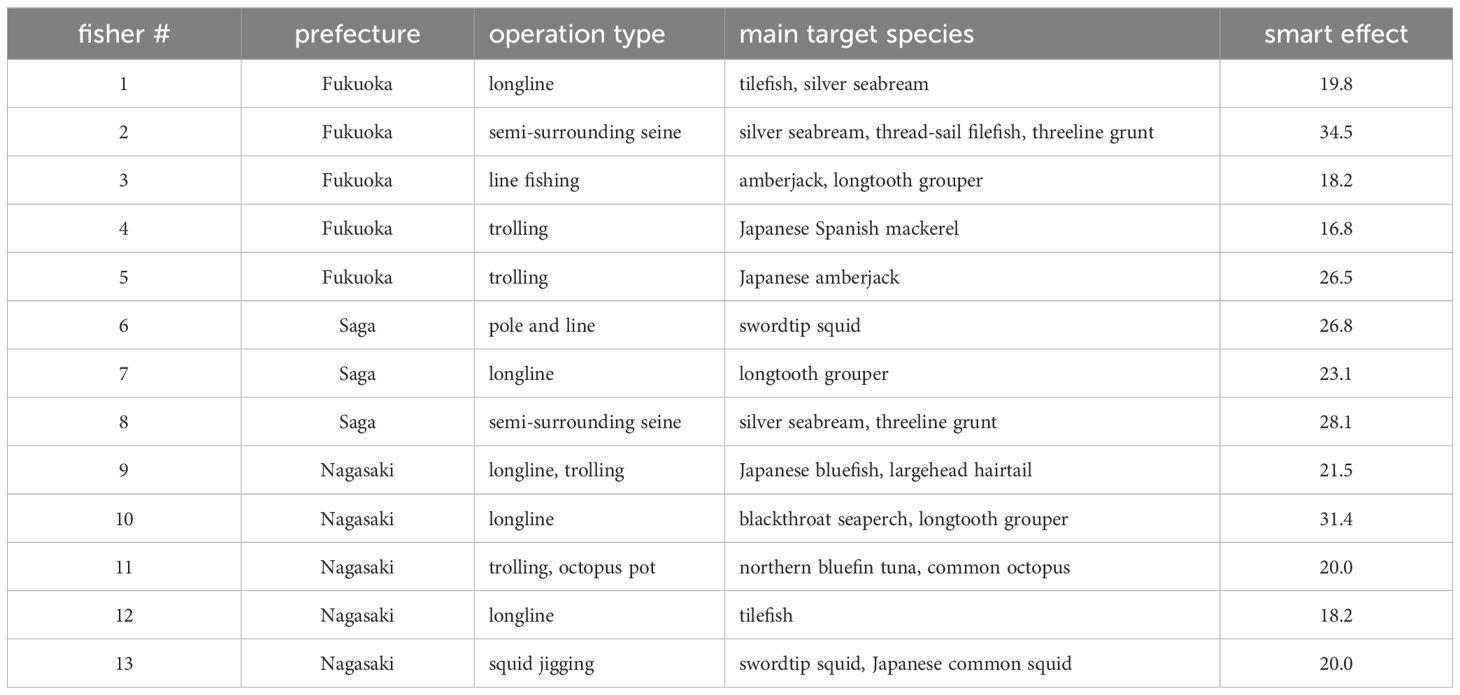
We considered “fishing duration times fuel usage per unit catch” as the primary cost of fishing. The reduction rate of this fishing cost is defined as a unique indicator of the smart effect in the QSF team. As shown in Table 5, 13 fishermen (13 vessels) achieved the numerical target of 15% or more reduction of the fishing cost by closing the 5-year JFA project (March 2022). The total number of fishermen utilized the two apps (“isow” and “Yochou”) was 45, resulting in an achievement rate of about 29%. Among those other than the 13, cost reduction effects of around 5-10% were also recognized, and many participants expressed positive evaluations as shown above. These effects were observed across various fishing methods/species, indicating that the smart initiative of this project is a highly versatile approach.
On the other hand, we cannot neglect the following negative comments.
● The forecasted flow direction and speed often did not match the actual conditions on site, so I have not been using the app much since then.
● During the spring and rainy season, there is a phenomenon where thin surface water accelerates suddenly (we call it Mizushio), but this forecast often turns out to be wrong.
● Although I want to use this app at sea, slow response of the app makes it unsuitable for the fast-paced fishing environment.
● The three-day forecast is too short because we go fishing in areas where ground radio signals do not reach for about a week.
Critical comments can lead to improvements of our prediction system in the future. In fact, we extended the forecast period from three days to one week since June 2022.
7 Concluding remarks
The main axis of this work has been a data exchange that fishermen provide observation data and, in return, receive improved ocean predictions from academics. As the accuracy of these forecasts increases, it has enhanced fishermen’s motivation to make observations, creating a positive cycle of coastal ocean data circulation. The coastal ocean modeling has also advanced significantly due to the vast amount of in-situ observation data.
One major group of collaborative fishermen has received Prime Minister Award recently (Fukuoka Prefectual Office, 2023). The three reasons for this award can be used directly as a summary for this article. (1) Fishermen, local government, academia, and industry have collaborated to develop an information communication technology (ICT) system to provide predictive information on water temperature, currents, and other environmental factors. (2) The fleet contributes to improving prediction accuracy by using small measurement devices installed on their fishing vessels to observe water temperature, currents, and other parameters during operations, and sending the in-situ data to a supercomputer of Kyushu University. (3) By utilizing this system, the fishermen can select fishing grounds in advance, leading to efficiency improvements in fishing such as reduced fuel consumptions and shortened working hours. Sasaki (2024) reported their efforts in more detail.
Finally, we have established a win-win relationship between coastal fisheries, local governments, ocean science and industry by exchanging model and observational data (Figure 7). The Yochou app has become an indispensable operational tool for many fishermen, motivating them to actively participate in coastal ocean observations. In April 2022, we renamed our group from the Kyushu Smart Fisheries (QSF) team to Smart Fisheries Network (SFiN). The new network promotes the integrated approach that not only acquires observational data but also utilizes ocean predictions widely across Japan. Indeed, the modeling areas are steadily expanding (Ocean Modeling G, 2024). We would like to apply this data circulation strategy eventually to global coastal oceans.
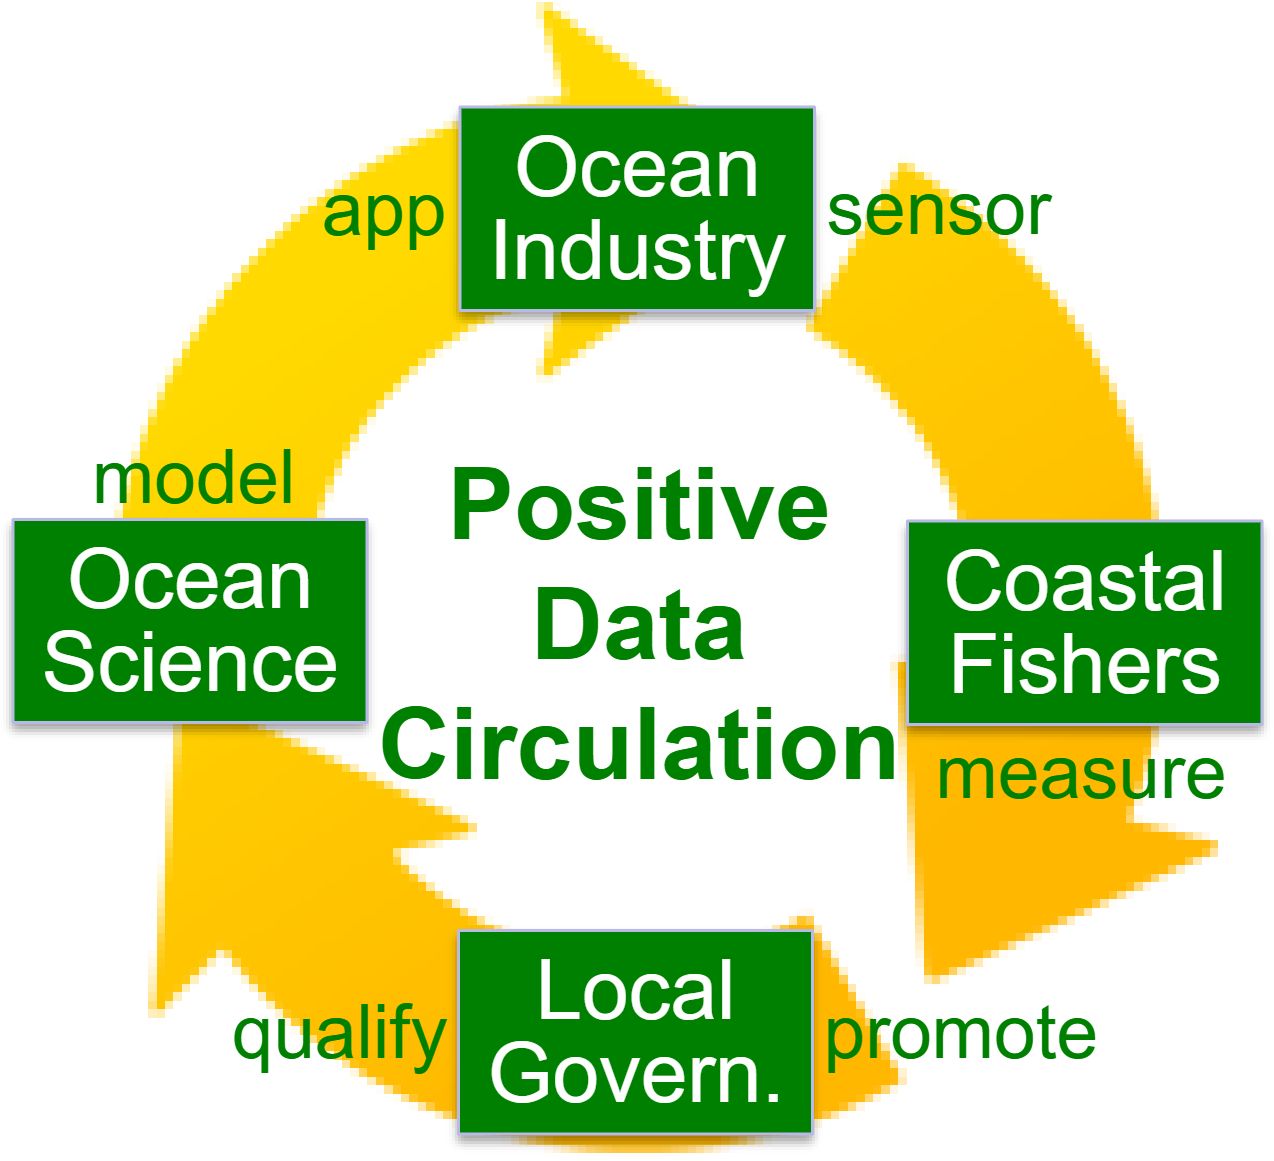
Figure 7. Establishment of local circulation of ocean data from in-situ measurement and numerical modeling.
Data availability statement
The original contributions presented in the study are included in the article/supplementary material. Further inquiries can be directed to the corresponding author.
Author contributions
NH: Conceptualization, Data curation, Formal analysis, Funding acquisition, Investigation, Methodology, Project administration, Resources, Software, Supervision, Validation, Visualization, Writing – original draft, Writing – review & editing. TT: Writing – review & editing. TI: Data curation, Validation, Writing – review & editing. AN: Data curation, Validation, Writing – review & editing. NT: Data curation, Validation, Writing – review & editing. TK: Visualization, Writing – review & editing, Writing – original draft. MK: Methodology, Writing – review & editing, Writing – original draft. TY: Validation, Writing – review & editing. TH: Data curation, Writing – review & editing.
Funding
The author(s) declare financial support was received for the research, authorship, and/or publication of this article. The research and development project “smart coastal fisheries with information and communication technology” has been commissioned by Japan Fisheries Agency for five years from April 2017 to March 2022. Part of the budget for this project was also allocated from Saga, Fukuoka, and Nagasaki Prefectures. The academic part of this work was supported by Grant-in-Aid for Scientific Research (16H02226).
Acknowledgments
So many people from private companies and prefectural fisheries research institutions are participating in this project on a voluntary basis. We respect deeply for their strong determination to save coastal fisheries from long-term crisis.
Conflict of interest
Author TK was employed by the company IDEA Consultants, Inc. Author MK was employed by the company JFE Advantech Co., Ltd. Author TY was employed by the company Japan Fisheries Information Service Center, General Incorporated Association. Author TH was employed by the company Furuno Electric Co., Ltd.
The remaining authors declare that the research was conducted in the absence of any commercial or financial relationships that could be construed as a potential conflict of interest.
Publisher’s note
All claims expressed in this article are solely those of the authors and do not necessarily represent those of their affiliated organizations, or those of the publisher, the editors and the reviewers. Any product that may be evaluated in this article, or claim that may be made by its manufacturer, is not guaranteed or endorsed by the publisher.
References
Anderson B. D. O., Moore J. B. (1979). Optimal Filtering (Englewood Cliffs, NJ: Prentice-Hall), 357.
Duchene J., Leblond E., Quemener L., Charria G. (2023). Available online at: https://archimer.ifremer.fr/doc/00858/97035/ (Accessed Jun 30, 2024).
Falco P., Belardinelli A., Santojanni A., Cingolani N., Russo A., Arneri E. (2007). An observing system for the collection of fishery and oceanographic data. Ocean Sci. 3, 189–203. doi: 10.5194/os-3-189-2007
Fu L.-L., Fukumori I., Miller R. N. (1993). Fitting dynamic models to the Geosat sea level observations in the tropical Pacific Ocean. Part II: A linear, wind-driven model. J. Geophys. Res. 23, 2162–2181. doi: 10.1175/1520-0485(1993)023<2162:FDMTTG>2.0.CO;2
Fukudome K., Igeta Y., Senjyu T., Okei N., Watanabe T. (2016). Spatiotemporal current variation of coastal-trapped waves west of the Noto Peninsula measured by using fishing boats. Continental Shelf Res. 115, 1–13. doi: 10.1016/j.csr.2015.12.013
Fukumori I. (2002). A partitioned Kalman filter and smoother. Monthly Weather Rev. 130, 1370–1383. doi: 10.1175/1520-0493(2002)130<1370:APKFAS>2.0.CO;2
Fukuoka Prefectual Office (2023). Available online at: https://www.pref.fukuoka.lg.jp/press-release/amahaenawa.html (Accessed Jun 30, 2024).
Hirose N., Liu T., Takayama K., Uehara K., Taneda T., Kim Y. H. (2021). Vertical viscosity coefficient increased for high-resolution modeling of the Tsushima/Korea Strait. J. Atmos. Oceanic Tech 38, 1205–1215. doi: 10.1175/JTECH-D-20-0156.1
Hirose N., Takayama K., Moon J.-H., Watanabe T., Nishida Y. (2013). Regional data assimilation system extended to the East Asian marginal seas. Umi to Sora (Sea and Sky) 89, 43–51. Available online at: https://dl.ndl.go.jp/pid/10116140 (accessed October 20, 2024).
IDEA Consultants, Inc (2024). Available online at: https://www.ideacon.co.jp/technology/detail/20240424081456.html (Accessed Jun 30, 2024).
Igarashi H., Saitoh S., Ishikawa Y., Kamachi M., Usui N., Sakai M., et al. (2017). Identifying potential habitat distribution of the neon flying squid (Ommastrephes bartramii) off the eastern coast of Japan in winter. Fisheries Oceanography 27, 16–27. doi: 10.1111/fog.12230
Ito T., Nagamoto A., Takagi N., Kajiwara N., Kokubo T., Takikawa T., et al. (2021). Construction of CTD hydrographic observation system by fishermen in northwest Kyushu, Japan. Bull. Jpn. Soc Fish. Oceanogr 85, 197–203. doi: 10.34423/jsfo.85.4_197
Ito T., Takayama K., Hirose N. (2023). Prediction of potential fishing grounds of swordtip squid (Uroteuthis edulis) based on a physical–biochemical coupled model. Fisheries Oceanography 32, 559–570. doi: 10.1111/fog.12652
Japan Fisheries Agency (2023). Available online at: https://www.maff.go.jp/j/tokei/kouhyou/gyocen/ (Accessed Oct 20, 2024).
Jayne S. R., Roemmich D., Zilberman N., Riser S. C., Johnson K. S., Johnson G. C., et al. (2017). The Argo program: Present and future. Oceanography 30, 18–28. doi: 10.5670/oceanog.2017.213
JFE Advantech Co., Ltd (2022). Available online at: https://www.jfe-advantech.co.jp/eng/products/ocean-tegaru-ctd.html (Accessed Jun 30, 2024).
Leblond E., Lazure P., Laurans M., Rioual C., Woerther P., Quemener L., et al. (2010). “The Recopesca Project: a New Example of Participative Approach to Collect Fisheries and in situ Environmental Data,” in Joint Coriolis-Mercator Ocean Quarterly Newsletter (Mercator Ocean) 37, 40–48.
Matsumoto K., Takanezawa T., Ooe M. (2000). Ocean tide models developed by assimilating TOPEX/POSEIDON altimeter data into hydrodynamical model: A global model and a regional model around Japan. J. Oceanography 56, 567–581. doi: 10.1023/A:1011157212596
Menemenlis D., Fukumori I., Lee T. (2005). Using Green’s functions to calibrate an ocean general circulation model. Mon. Weather Rev. 133, 1224–1240. doi: 10.1175/MWR2912.1
Nakada S., Hirose N., Senjyu T., Fukudome K., Tsuji T., Okei N. (2014). Operational ocean prediction experiments for smart coastal fishing. Prog. Oceanography 121, 125–140. doi: 10.1016/j.pocean.2013.10.008
Ocean Modeling G (2024). Available online at: https://dreams-c2.riam.kyushu-u.ac.jp/vwp/ (Accessed Jun 30, 2024).
Patti B., Martinelli M., Aronica S., Belardinelli A., Penna P., Bonnano A., et al. (2016). The Fishery and Oceanography Observing System (FOOS): a tool for oceanography and fisheries science. J. Operational Oceanogr 9, s99–s118. doi: 10.1080/1755876X.2015.1120961
Saitoh K. (2016). Fisheries utilization of satellite data and its application to coastal area. Coastal Mar Res. 54, 63–68. doi: 10.32142/engankaiyo.54.1_63
Saitoh S., Mugo R., Radiarta I. N., Asaga S., Takahashi F., Hirawake T., et al. (2011). Some operational uses of satellite remote sensing and marine GIS for sustainable fisheries and aquaculture. ICES J. Mar. Sci. 68, 687–695. doi: 10.1093/icesjms/fsq190
Sasaki T. (2024). Efforts to visualize fishing grounds through fishermen-driven smart fisheries. Suisankai (Fishery World) 1668, 32–37.
Takikawa T., Kanetake M., Ito T., Hirose N. (2019). Hydrographic observations by fisherman and coastal ocean model –Salinity variations around Iki Island during cooling season–. J. Advanced Mar. Sci. Technol. Soc. 25, 15–20. doi: 10.14928/amstec.25.1_15
Van Vranken C., Vastenhoud B. M. J., Manning J. P., Plet-Hansen K. S., Jakoboski J., Gorringe M. Martinelli P. (2020). Fishing gear as a data collection platform: Opportunities to fill spatial and temporal gaps in operational sub-surface observation networks. Front. Mar. Sci. 7. doi: 10.3389/fmars.2020.485512
Keywords: fishing vessel observation, smart CTD device, coastal ocean prediction model, data assimilation, forecasting app, fisher profitability
Citation: Hirose N, Takikawa T, Ito T, Nagamoto A, Takagi N, Kokubo T, Kimura M, Yabuki T and Hazama T (2024) Positive data circulation established by Kyushu Smart Fisheries (QSF) team. Front. Mar. Sci. 11:1457272. doi: 10.3389/fmars.2024.1457272
Received: 30 June 2024; Accepted: 22 November 2024;
Published: 17 December 2024.
Edited by:
Elisabeth Remy, Mercator Ocean (France), FranceReviewed by:
Martin A. Pastoors, Martin Pastoors Fish & Fisheries, NetherlandsPeter R. Oke, Oceans and Atmosphere (CSIRO), Australia
Copyright © 2024 Hirose, Takikawa, Ito, Nagamoto, Takagi, Kokubo, Kimura, Yabuki and Hazama. This is an open-access article distributed under the terms of the Creative Commons Attribution License (CC BY). The use, distribution or reproduction in other forums is permitted, provided the original author(s) and the copyright owner(s) are credited and that the original publication in this journal is cited, in accordance with accepted academic practice. No use, distribution or reproduction is permitted which does not comply with these terms.
*Correspondence: Naoki Hirose, aGlyb3NlQHJpYW0ua3l1c2h1LXUuYWMuanA=
 Naoki Hirose
 Tetsutaro Takikawa2