 Ann N. Allen1*Matt Harvey2Lauren Harrell3Megan Wood4Angela R. Szesciorka5Jennifer L. K. McCullough1Erin M. Oleson1
- 1NOAA Pacific Islands Fisheries Science Center, Honolulu, HI, United States
- 2Google, Inc., Mountain view, CA, United States
- 3Google, Inc., Boulder, CO, United States
- 4Saltwater Inc, Under Contract to NOAA Pacific Islands Fisheries Science Center, Honolulu, HI, United States
- 5Marine Mammal Institute, Hatfield Marine Science Center, Oregon State University, Newport, OR, United States
In 2014, a novel call was discovered in autonomous acoustic recordings from the Mariana Archipelago and designated a “Biotwang”. It was assumed to be produced by a baleen whale, but without visual verification it was impossible to assign a species. Using a combination of visual and acoustic survey data collected in the Mariana Archipelago, we determined that Biotwangs are produced by Bryde’s whales. Bryde’s whales occur worldwide in tropical and warm temperate waters, but their population structure and movements are not well understood. Genetic and morphological data recognize two populations in the western North Pacific (WNP), separate from those elsewhere in the Pacific. We used a combination of manual and machine learning annotation methods to detect Biotwangs in our extensive historical passive acoustic monitoring datasets collected across the central and western North Pacific. We identified a consistent seasonal presence of Biotwangs in the Mariana Archipelago and to the east at Wake Island, with occasional occurrence as far away as the Northwestern Hawaiian Islands and near the equator (Howland Island). The seasonal occurrence of Biotwangs is consistent with Bryde’s whales migrating between low and mid-latitudes, with a small peak in calling between February and April and a larger peak between August and November as the whales travel past the recording sites. Our results provide evidence for a pelagic WNP population of Bryde’s whales with broad distribution, but with seasonal and inter-annual variation in occurrence that imply a complex range most likely linked to changing oceanographic conditions in this region.
1 Introduction
Bryde’s whales (Balaenoptera edeni) were originally described from the northern Bay of Bengal. Later, Balaenoptera brydei was described from whales landed at a South African whaling station (Olsen, 1913). Both were originally confused with Sei whales (B. borealis), and more recently with Omura’s whales (B. omurai) and Rice’s whales (B. ricei), which all have morphological similarities. There has been further disagreement as to whether they are comprised of a single species or two subspecies. The Society of Marine Mammalogy considers them subspecies: a smaller form (B. edeni edeni) found coastally in the Indian and western Pacific Ocean, and (B. edeni brydei) a larger form found worldwide in pelagic waters (Yoshida and Kato, 1999; Wada et al., 2003; Kershaw et al., 2013). Some of this confusion is driven by the globally distributed, but dispersed nature of their populations, with Bryde’s whales found in warm (>20°C) tropical and warm-temperate waters between approximately 40°S and 40°N (Omura and Nemoto, 1955; Omura, 1959).
Bryde’s whales are found throughout the North Pacific (NP). They are present in the Gulf of California (Viloria-Gómora et al., 2015) and range along the coast of California up to 36°N (Heimlich et al., 2005; Kerosky et al., 2012; Smultea, 2012). In the central North Pacific (CNP), visual surveys of the Hawaiian Islands have shown occurrences of Bryde’s whales in the Northwestern Hawaiian Islands (DeLong and Brownell, 1977; Barlow, 2006; Yano et al., 2018), with rare sightings and acoustic detections further south in the Main Hawaiian Islands (Smultea et al., 2010; Helble et al., 2016). In the western North Pacific (WNP) Omura and Fujino (1954) initially identified the presence of Bryde’s whales around the Ogasawara Islands, with subsequent sighting data from line transect surveys conducted under the Japan Whale Research Program (JARPN II) demonstrating Bryde’s whale presence in tropical and subtropical waters from Japan extending as far east as 150°W, encompassing the waters around the Northwest Hawaiian Islands (Kitakado et al., 2008). Visual surveys further documented Bryde’s whale presence around the Mariana Archipelago and the West Mariana Ridge (Hill et al., 2020). However the cryptic nature, and complex movements of Bryde’s whales make it difficult to distinguish between populations.
In the eastern North Pacific (ENP) population structure is based on gaps in distribution from sighting surveys or distinct call characteristics. Unique calls from the Gulf of California suggest a resident population discrete from whales in the broader ENP (Viloria-Gómora et al., 2021). Separate call types North and South of the equator in the eastern tropical Pacific (ETP; Oleson et al., 2003) aligned with a latitudinal gap in sighting surveys of Bryde’s whales (Wade and Genodette, 1993), suggesting distinct populations. Sighting surveys show no Bryde’s whales between 140°W and 150°W, indicating a separation between ENP populations from CNP and WNP populations (Kishiro, 1996). However, there is still little clarity around the division, range, and extent of Bryde’s whale populations in the NP.
Genetic data can provide important insights into population structure and within the NP, WNP Bryde’s whales are among the best studied, with genetic and sighting data collected by International Whaling Commission- Pacific Ocean Whale and Ecosystem Research Programme (IWC-POWER) cruises and JARPN II. Two populations of Bryde’s whales are recognized based on morphology and genetics: (1) in the East China Sea including the coastal waters around southwestern Japan (Yoshida and Kato, 1999; Wada et al., 2003) and (2) in the pelagic WNP with density prediction models based on the Japanese sighting data indicating the population is likely concentrated between 145°E and 165°E (Wada et al., 2003; Konishi et al., 2009). Recent studies established differences in genetic markers for Bryde’s whales sampled west vs east of the 180° longitude line (Pastene et al., 2016; Taguchi et al., 2023), possibly separating WNP and CNP populations, but there is still uncertainty about the division of WNP Bryde’s whales.
Bryde’s whales differ from other baleen whales in that they do not undertake long-range seasonal migrations to high-latitudes, instead traveling widely within ocean basins, moving between low and mid-latitudes. They are generally thought to be income breeders, feeding regularly and following prey distributions, which are in turn influenced by oceanographic and biological factors which vary over time. Within the WNP, pelagic whales feed along the subarctic-subtropical transition area associated with the Kuroshio Current, which forms the northern edge of their range (Sasaki et al., 2013). Kishiro (1996) examined mark-recapture data and found that in the WNP Bryde’s whales stayed in low latitudes (0°–10°N) from January to March and then migrated to mid-latitudes (20-40°N) in April to September, although some individuals stayed in the mid-latitudes from February through August. Historical commercial catch and sighting data showed Bryde’s whales were also distributed all the way to the equator in the WNP during August and September (International Whaling Commission, 2007), indicating a potentially complex migration pattern. However, sighting and genetic data are limited in temporal resolution, which is needed to clarify annual migration patterns.
A powerful tool for long-term data collection is passive acoustic monitoring (PAM) which can add this temporal resolution to estimates of the distribution and movements of cryptic marine mammal species. Bryde’s whale call types are well documented in the ENP (Cummings et al., 1986; Oleson et al., 2003; Heimlich et al., 2005; Viloria-Gómora et al., 2015). Their vocalizations are generally low frequency, typically below 100 Hz, often with higher frequency harmonics up to 400 Hz and above. While many of the calls share similar features, the specific call types have been shown to be regionally specific (Oleson et al., 2003; Heimlich et al., 2005; Viloria-Gómora et al., 2015), and in the ENP they have been used to differentiate between different stocks (Viloria-Gómora et al., 2021) and document changes in their distribution over time (Kerosky et al., 2012). However, there is almost nothing known about the vocalizations Bryde’s whales make in the Western and Central North Pacific, with only three known recordings: one taken from off the coast of Japan containing a call named Be8 that has fundamental frequencies around 45Hz and multiple harmonics (Oleson et al., 2003); another from Japan, that also detected Be8 as well as a mother-calf call similar to mother-calf recordings from Bryde’s whales in the Atlantic (Edds et al., 1993; Oleson et al., 2003; Chiu, 2009); and a third from a moored array off the coast of the Hawaiian Island of Kauai (Helble et al., 2016), documenting calls similar to the Be3 call type from the ENP (Oleson et al., 2003). No other Bryde’s whale call types have been identified in the Central and WNP.
In 2014 and 2015, an acoustic glider survey was conducted over the Mariana Trench off the coast of Guam (Nieukirk et al., 2016). During the survey they detected a novel sound, a complex call lasting 3.5 sec with 5 different parts, starting at 30 Hz and ending with a metallic sound that reaches up to 8000 Hz, which they dubbed a ‘Biotwang’. Nieukirk et al. (2016) attributed Biotwangs to baleen whales, but without visual observations they could not conclude which species was generating the sound. Here we demonstrate that this complex vocalization is a previously undocumented sound produced by Bryde’s whales. We then use manual and machine learning annotations to identify Biotwangs in both bottom-mounted and drifting acoustic recorders at locations in the Western to the Central North Pacific. Using this data we can identify possible population demarcation throughout the Western and Central North Pacific, deduce information on the seasonal presence of Bryde’s whales at the recording locations suggesting migration patterns, and document differences in Bryde’s whale presence at recording locations which indicate complex migration patterns with inter-annual variations in movement.
2 Materials and methods
2.1 Identification of Biotwang as belonging to Bryde’s whales
Paired visual and acoustic observations of Bryde’s whales occurred during two ship-based surveys in the Mariana Archipelago, one from July 9 - August 1, 2018 surveying between Guam and Pagan and west to the West Mariana Ridge, and the other from May 3 - July 14, 2021 surveying the entire Exclusive Economic Zones (EEZ) of Guam and the Commonwealth of the Northern Marianas (CNMI) (Hill et al., 2020; Yano et al., 2022). A team of visual observers collected sighting data for cetaceans using line-transect methods. Cetacean groups within 3 nmi of the transect line were approached for group size estimation, attempted photo identification, and biopsy sampling. For most baleen whale sightings that were approached within 1 nmi, Directional Fixing and Ranging (DIFAR) type 53F and 53G sonobuoys were deployed to obtain recordings of any low frequency vocalizations of the animals. The low frequency (0-3,000 Hz) audio from the sonobuoy was monitored in real time according to the methods in Rankin et al. (2019), and cetacean vocalizations were annotated.
2.2 Geographic and temporal distribution of Biotwangs
Drifting Acoustic Spar Buoy Recorders (DASBRs) were deployed during both ship-based survey efforts (McCullough et al., 2021, Yano et al., 2022). DASBRs collect acoustic recordings on two hydrophones, suspended vertically at a depth of ~135 m and 150 m. The data were recorded using a SoundTrap (ST4300HF, Ocean Instruments, Auckland, NZ) at a sampling rate of either 576 kHz or 384 kHz on a duty cycle of 2 mins of recording out of every 5 or 10 mins. The buoys were allowed to drift until pickup, with GPS location recorded every 2 hours using an iridium transmitter. In 2018, eight DASBRs were deployed, with recordings from July 9 to July 27. In 2018, all DASBRs were deployed between the island archipelago and the West Mariana Ridge, between 12°N and 18°N. Deployments lasted between 4.5 days and 11.5 days for a total of 1,807 hours of recordings, and all DASBRs drifted in a generally westerly direction. In 2021, twenty-two DASBRs were deployed from May 3 to July 11, with recording durations between 33 hours and 24.5 days for a total of 4,405 hours of recordings. They were deployed between 11.7°N and 22.5°N to both the East and the West of the Mariana Islands, with drifts in non-uniform directions.
All files from the DASBR data were decimated to 9.6 kHz sampling rate and were manually scanned in the program Raven Pro 1.6.2 (K. Lisa Yang Center for Conservation Bioacoustics, 2022). Spectrograms of 120 s in length and up to 4.3 kHz were scanned manually and each occurrence of a Biotwang call was annotated with the start and end time. The start time of the call was then matched to the nearest GPS location of the DASBR to provide an approximate location.
Long term acoustic recordings were collected at 13 sites in the North Pacific (Figure 1) using bottom-mounted High Frequency Acoustic Recording Packages (HARPs; Wiggins and Hildebrand, 2007) and form the Pacific Islands Passive Acoustic Network (PIPAN). HARPs are equipped with an omni-directional hydrophone, with a flat (± 2 dB) hydrophone sensitivity from 10 Hz to 100 kHz of −200 dB re V/μPa. Recording efforts began in 2005 with long-term monitoring (>6 years) at 5 of the 13 sites. Monitoring duration at an individual site varied from just over a month to 13 years, with recording schedules ranging from continuous to 5 min of recording out of every 40 min. HARPs were deployed at depths between 111 and 1,266 m with an average deployment depth of 730 m. The data were low-pass filtered and decimated to 10 kHz, resulting in an effective bandwidth of 10 Hz to 5 kHz, to facilitate efficient detection of Biotwangs.
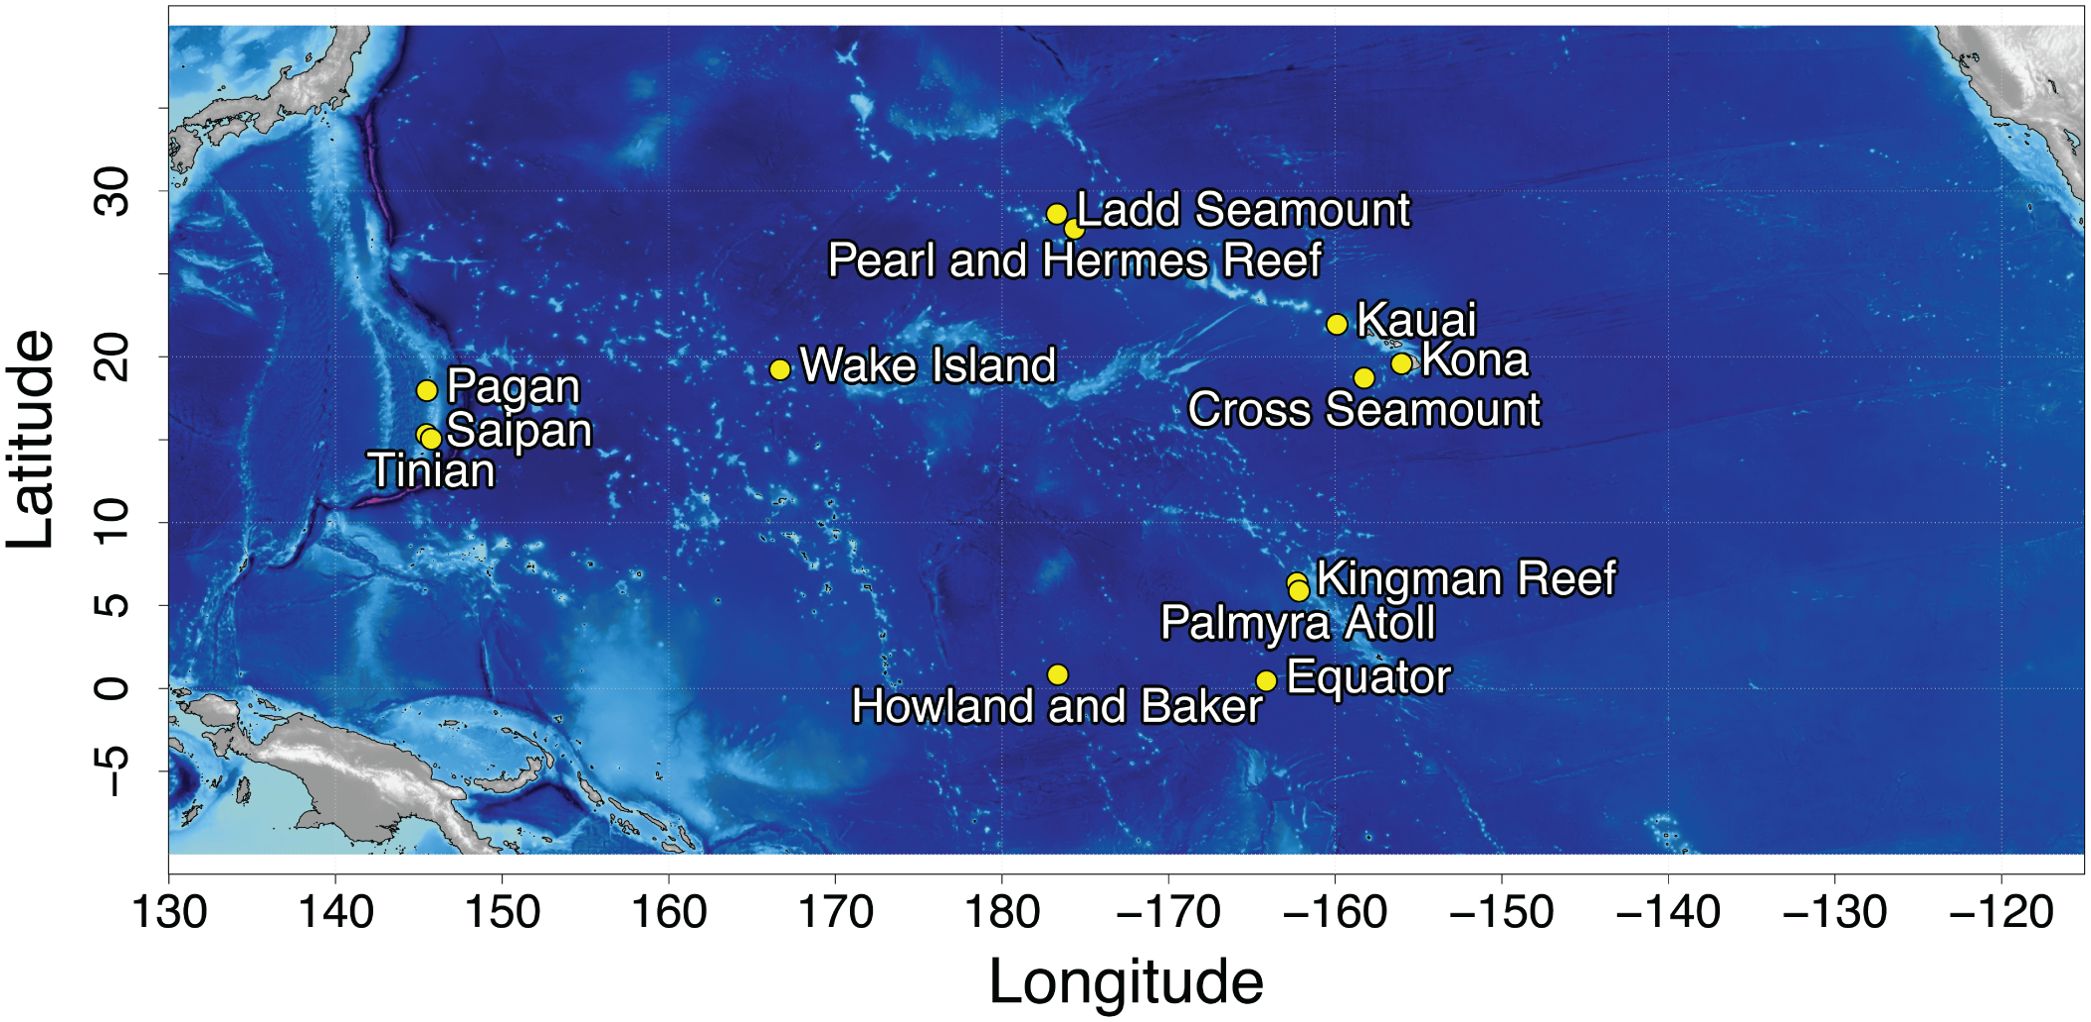
Figure 1. Map of the 13 HARP recording locations.
Given the duration of the HARP dataset, complete manual annotation was not feasible. Three WNP HARP deployments were manually scanned and annotated for Biotwang occurrence: Saipan (May 13, 2015 to May 2, 2016; May 30, 2016 to May 17, 2017) and Tinian (May 30 to November 5, 2016). For all three deployments the data were duty-cycled, with 5 mins of recording out of every 7. The data were scanned in a custom software package TRITON (Wiggins et al., 2010) and the start and end time of every observed Biotwang marked (example Biotwang: Supplementary Figure 1). The initial manual annotations of the HARP data were used to train a convolutional neural network (CNN) Machine Learning (ML) model to identify Biotwangs in the full HARP dataset.
The Biotwang ML model was developed as part of a larger effort to create a multi-species model to recognize a range of cetacean vocalizations in a variety of different types of hydrophone recordings, with several organizations which collect whale acoustic monitoring data contributing to the model. The training dataset for Biotwangs consisted of all the Biotwangs from the three fully annotated HARP deployments as ‘positives.’ As negatives, it included a random sample of background audio, annotated positives of other species and anthropogenic sound events, and annotated false positives from prior active learning efforts on the same dataset. Biotwangs are rare in the entire HARP dataset, but due to pre-selection with a coarse detector, they make up a large fraction of audio that has been human reviewed. Therefore, to balance the training set to better reflect the natural occurrence of Biotwangs and to better sample the background distribution, we added to the training set a random sample of audio from the entire dataset, with total duration about 10 times the total duration of the human-reviewed data. This kind of implicit negative sampling carries some risk of adding false negatives to training, but at the 10:1 ratio, these do not overwhelm the number of confirmed positives. For training, the train/test split was uniform, with 20% of the data going to test.
In order to standardize audio for the multi-species model, we first resampled all of the HARP recordings to 24kHz, which amounted to upsampling for most of the contributed data. We then sliced the audio into non-overlapping 5-second windows, with independent binary labels for each species or call type, ‘true’ if the window overlapped with a human label by a minimum of 1s or half the duration of the label.
We transformed the audio to a spectrogram with a standard short-time Fourier transform (STFT) with a Hann window of 200 ms and a hop of 30 ms. We then applied a non-trained log mel spectrogram frontend with 128 bins from 20Hz to 12kHz and a break frequency of 50Hz (chosen due to the low frequencies produced by rorquals). To reduce inter-deployment variation in overall level and background spectrum, we applied per-channel energy normalization (PCEN; Wang et al., 2017).
We fed the normalized spectrogram images into an EfficientNetB0, whose output was max pooled over the spatial dimensions, and minimized the cross entropy between the binary labels and the network output, as is standard for multi-label classifiers. For optimization, we chose the Adam optimizer with batch size 256 and a constant learning rate of 1e-4. We did not apply dropout or data augmentation.
We used several rounds of active learning to improve on the first Biotwang model candidate, annotating high scoring segments from the initial model as positive or negative. To increase training data from all recording sites and years, but without the sampling bias resulting from preselection in active learning, an additional manual annotation round was conducted, selecting random segments (~1 hour long) of data from every 10 days of data from the Pagan, Wake, Tinian, and Saipan sites. All annotations can be found with the openly available data. Data were pooled into 75 s ‘subchunks’ and the maximum 5 s score taken as the score for the total subchunk. Overall performance was evaluated using the area under the receiver operating characteristic curve (AUC-ROC). Site-specific detection thresholds were chosen targeting < 3% false positive rate, which was chosen to approximate optimal AUC-ROC thresholds across all sites.
2.2.1 Seasonal and spatial distribution
The Biotwang annotations from the ML model were analyzed for spatial presence at the HARP sites, and within sites with consistent Biotwangs, for patterns of seasonal occurrence. To account for differences in duty cycles and recording durations, occurrence was calculated as the percentage of daily audio that was positive for Biotwangs. For those HARP sites with consistently low ML scores, manual spot checking of the highest scoring segments was used to evaluate whether there was any Biotwang occurrence, or if all detections were false positives.
2.2.2 Diurnal patterns
We looked for diurnal patterns in the occurrence of Biotwangs in the HARP and DASBR data. The range of sunrise and sunset times over the course of the entire year, at the latitude and longitude of the recorder at each site were calculated using ‘suncycle’ (The MathWorks Inc., 2022). The manually annotated Biotwangs from the DASBRs and the ML annotated Biotwangs from each HARP site were analyzed for diurnal patterns both as seasonal aggregations (grouped in 3 month bins) and combined across all months.
2.2.3 Intercall intervals
The intercall intervals (ICI) of Biotwangs were calculated from the two datasets with a continuous recording duty cycle, one from Saipan (recordings between July 23, 2019 – June 7, 2020) and one from Wake (recordings between May 8, 2021 and March 6, 2022). High scoring segments from the CNN model were used to identify time periods with Biotwangs, and then the start and end time of each call in the identified period were manually annotated. The ICI was calculated as the start time from one call to the start time of the next call.
3 Results
3.1 Identification of Biotwang as belonging to Bryde’s whales
There were 13 large whale sightings (Figure 2) with concurrent sonobuoy deployments during the 2018 survey (Table 1). Of these, 10 were confirmed sightings of Bryde’s whales, including four sightings with a mother-calf pair. Nine of the confirmed Bryde’s whale sightings had Biotwangs recorded on a deployed sonobuoy (Table 1). The only Bryde’s whale encounter without Biotwangs was from a group of five whales, none of them calves. In addition to the confirmed Bryde’s whales there were three sightings of unidentified large whales with concurrent sonobuoy recordings, two of these encounters included Biotwangs (Table 1). None of the Bryde’s whale or large whale encounters included mixed species groups. In five instances there were other sightings within 10 km of the Bryde’s whale sighting. Three of these were of odontocetes, which are extremely unlikely to produce sounds similar to the Biotwang. The other two were an unidentified rorqual and a confirmed Bryde’s whale that were sighted within an hour of each other. The Bryde’s whale had confirmed Biotwangs during the sighting, but there were no Biotwangs recorded for the unidentified rorqual.
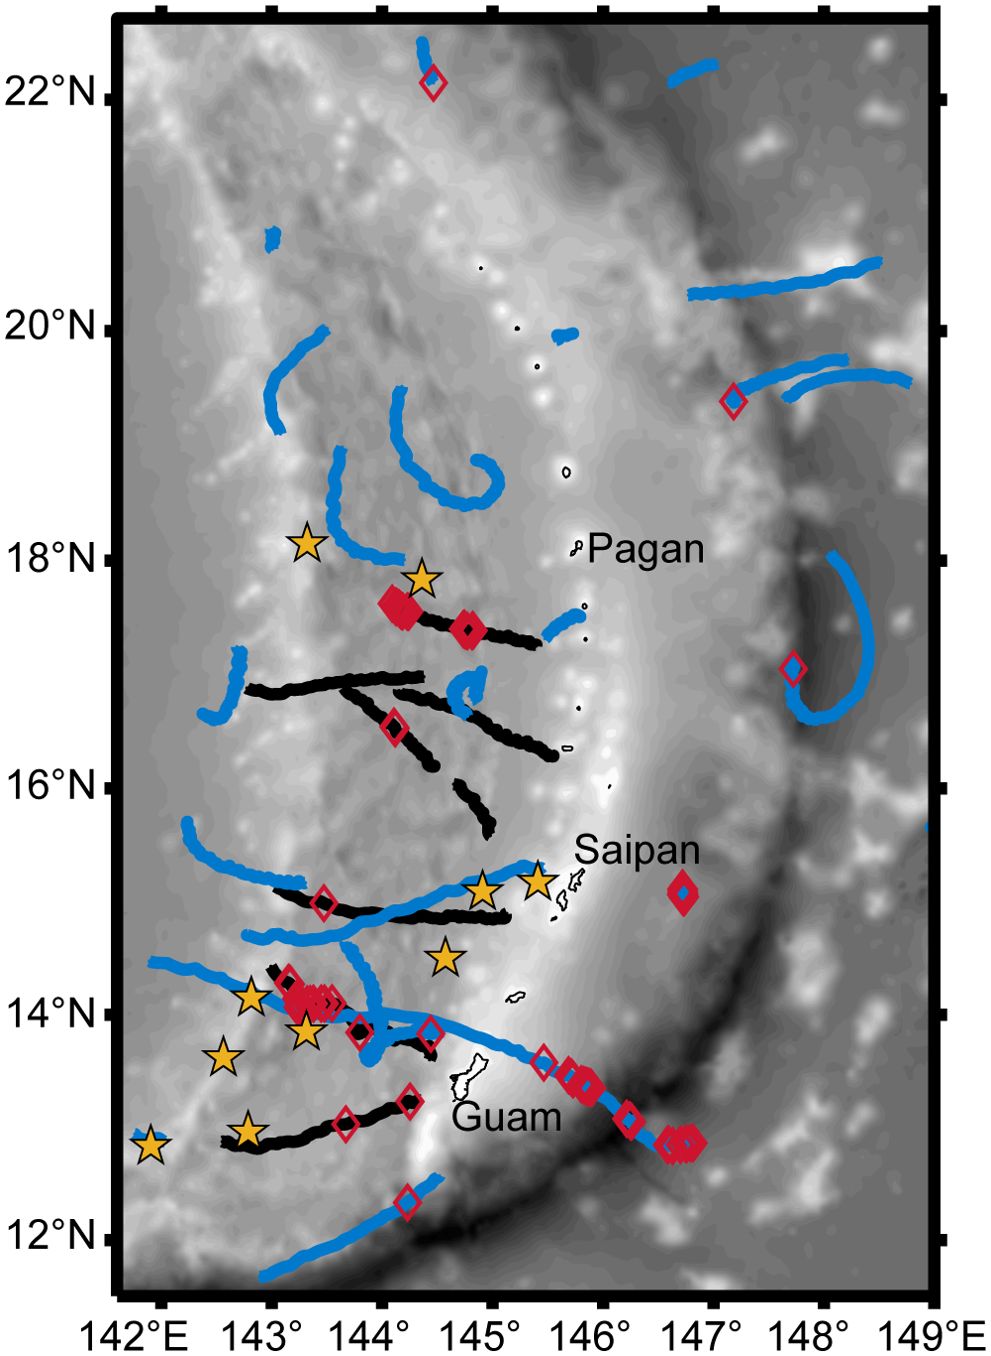
Figure 2. Map of the Mariana Archipelago with DASBR tracks from 2018 indicated in black, and 2021 in blue, Biotwang detections on the DASBRs are indicated with red diamonds, and yellow stars represent the 10 confirmed visual sightings of Bryde’s whales from 2018.
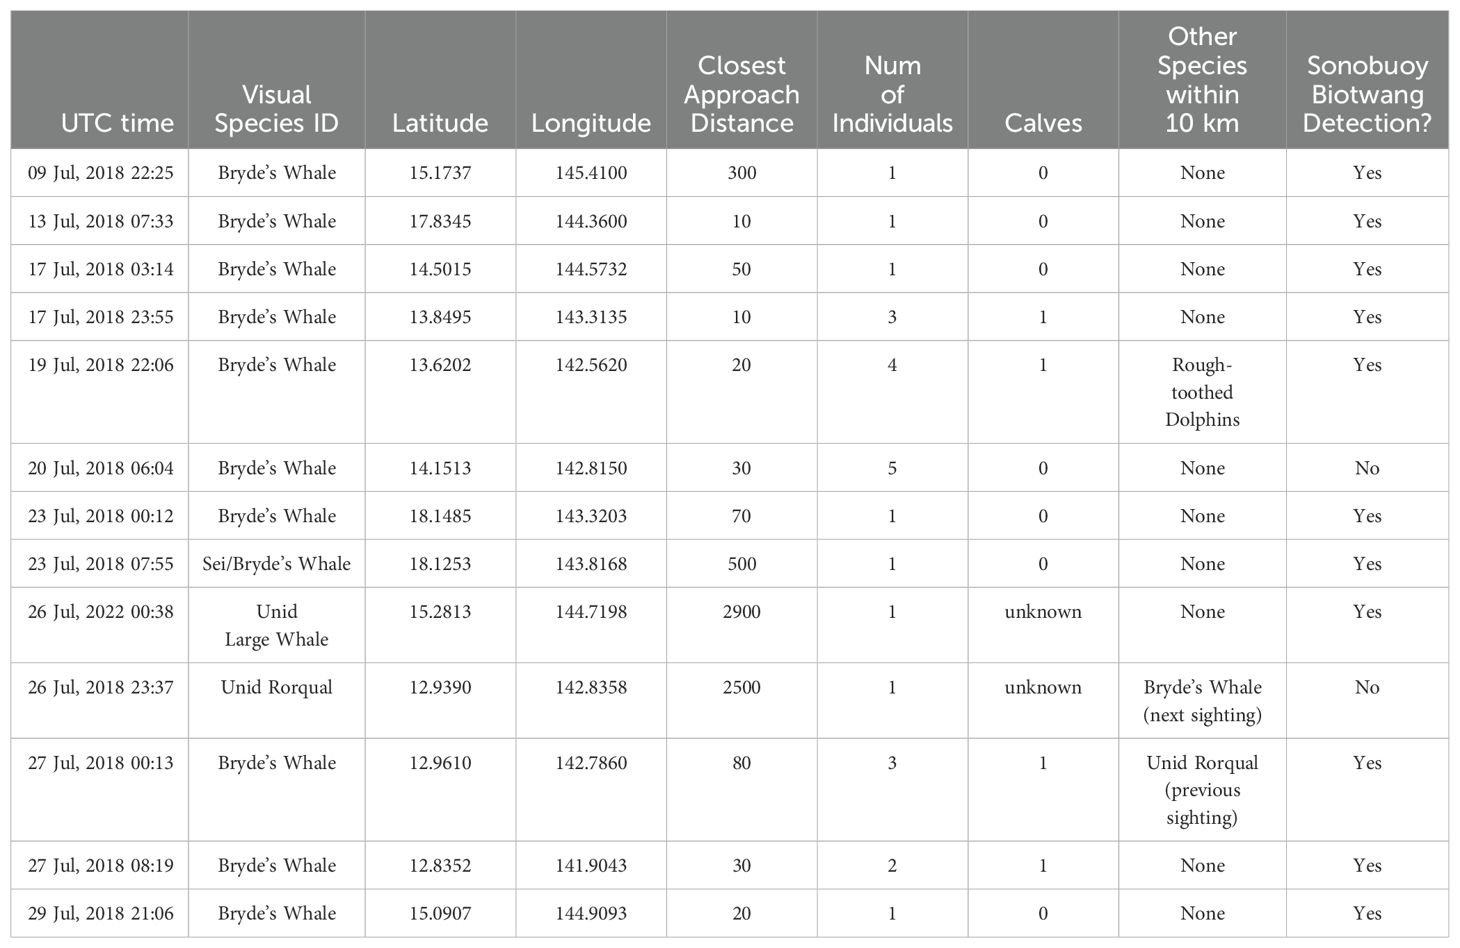
Table 1. Table of all visual encounters during which a sonobuoy was also deployed. There were 10 confirmed Bryde’s whale encounters, with another three that could not be differentiated to the species level.
3.2 Geographic and temporal distribution of Bryde’s whale Biotwangs
Biotwangs were consistently detected at four of the PIPAN recording sites (example Biotwang: Supplementary Figure 1), all in the Central and WNP: Saipan, Tinian and Pagan and 2,200 km to the east at Wake Island. After manual spot checking, it was confirmed that a small number of Biotwangs were detected in the Northwestern Hawaiian Islands, at Pearl and Hermes Reef, but they were only present at very low levels (<3% of recording time with Biotwangs) with no apparent seasonal pattern, and most consistently during the years 2015-2016. They were also found in low numbers (<3% of recording time with Biotwangs) at the equatorial recording site at Howland Island. This site has only 9 months of recording, with Biotwangs found throughout the recording period, but more consistently from April through September. No other recording sites in the PIPAN network had confirmed Biotwangs.
The performance of the CNN model varied between sites, but it generalized well across the four locations with consistent Biotwangs, with AUC-ROCs of 0.992, 0.982, 0.964 and 0.959 for Wake, Pagan, Tinian and Saipan respectively (Supplementary Figure 2). For consistency, a threshold was chosen for each site with a 3% false positive rate, which approximated the optimal point on the curve. This corresponded to a threshold of 0.48, 0.67, 0.80, and 0.63 for Wake, Pagan, Tinian, and Saipan.
The percentage of recording time with Biotwangs per day of the year for each of the four sites with consistent Biotwang detections is displayed in Figure 3. There was a maximum of 78% recording time with calls at Wake, 60% at Pagan, 30% at Saipan and 29% at Tinian. There was an increase in calling during July through November at each of these sites, with the start date of increased calling and the peak date varying between sites and between years within a site. There was a smaller peak in calling during February through April at Pagan, Wake, and Tinian during some years. Saipan also had this peak in some years, but it frequently blended into low level year-round calling. There was large inter-annual variation in percentage of recording time with calling, with 2016 corresponding to relatively high calling rates at all sites and 2021 to low calling at Wake and Pagan (the only sites with data for that year). At Pearl and Hermes Reef the majority of Biotwangs were detected during 2015-2016.
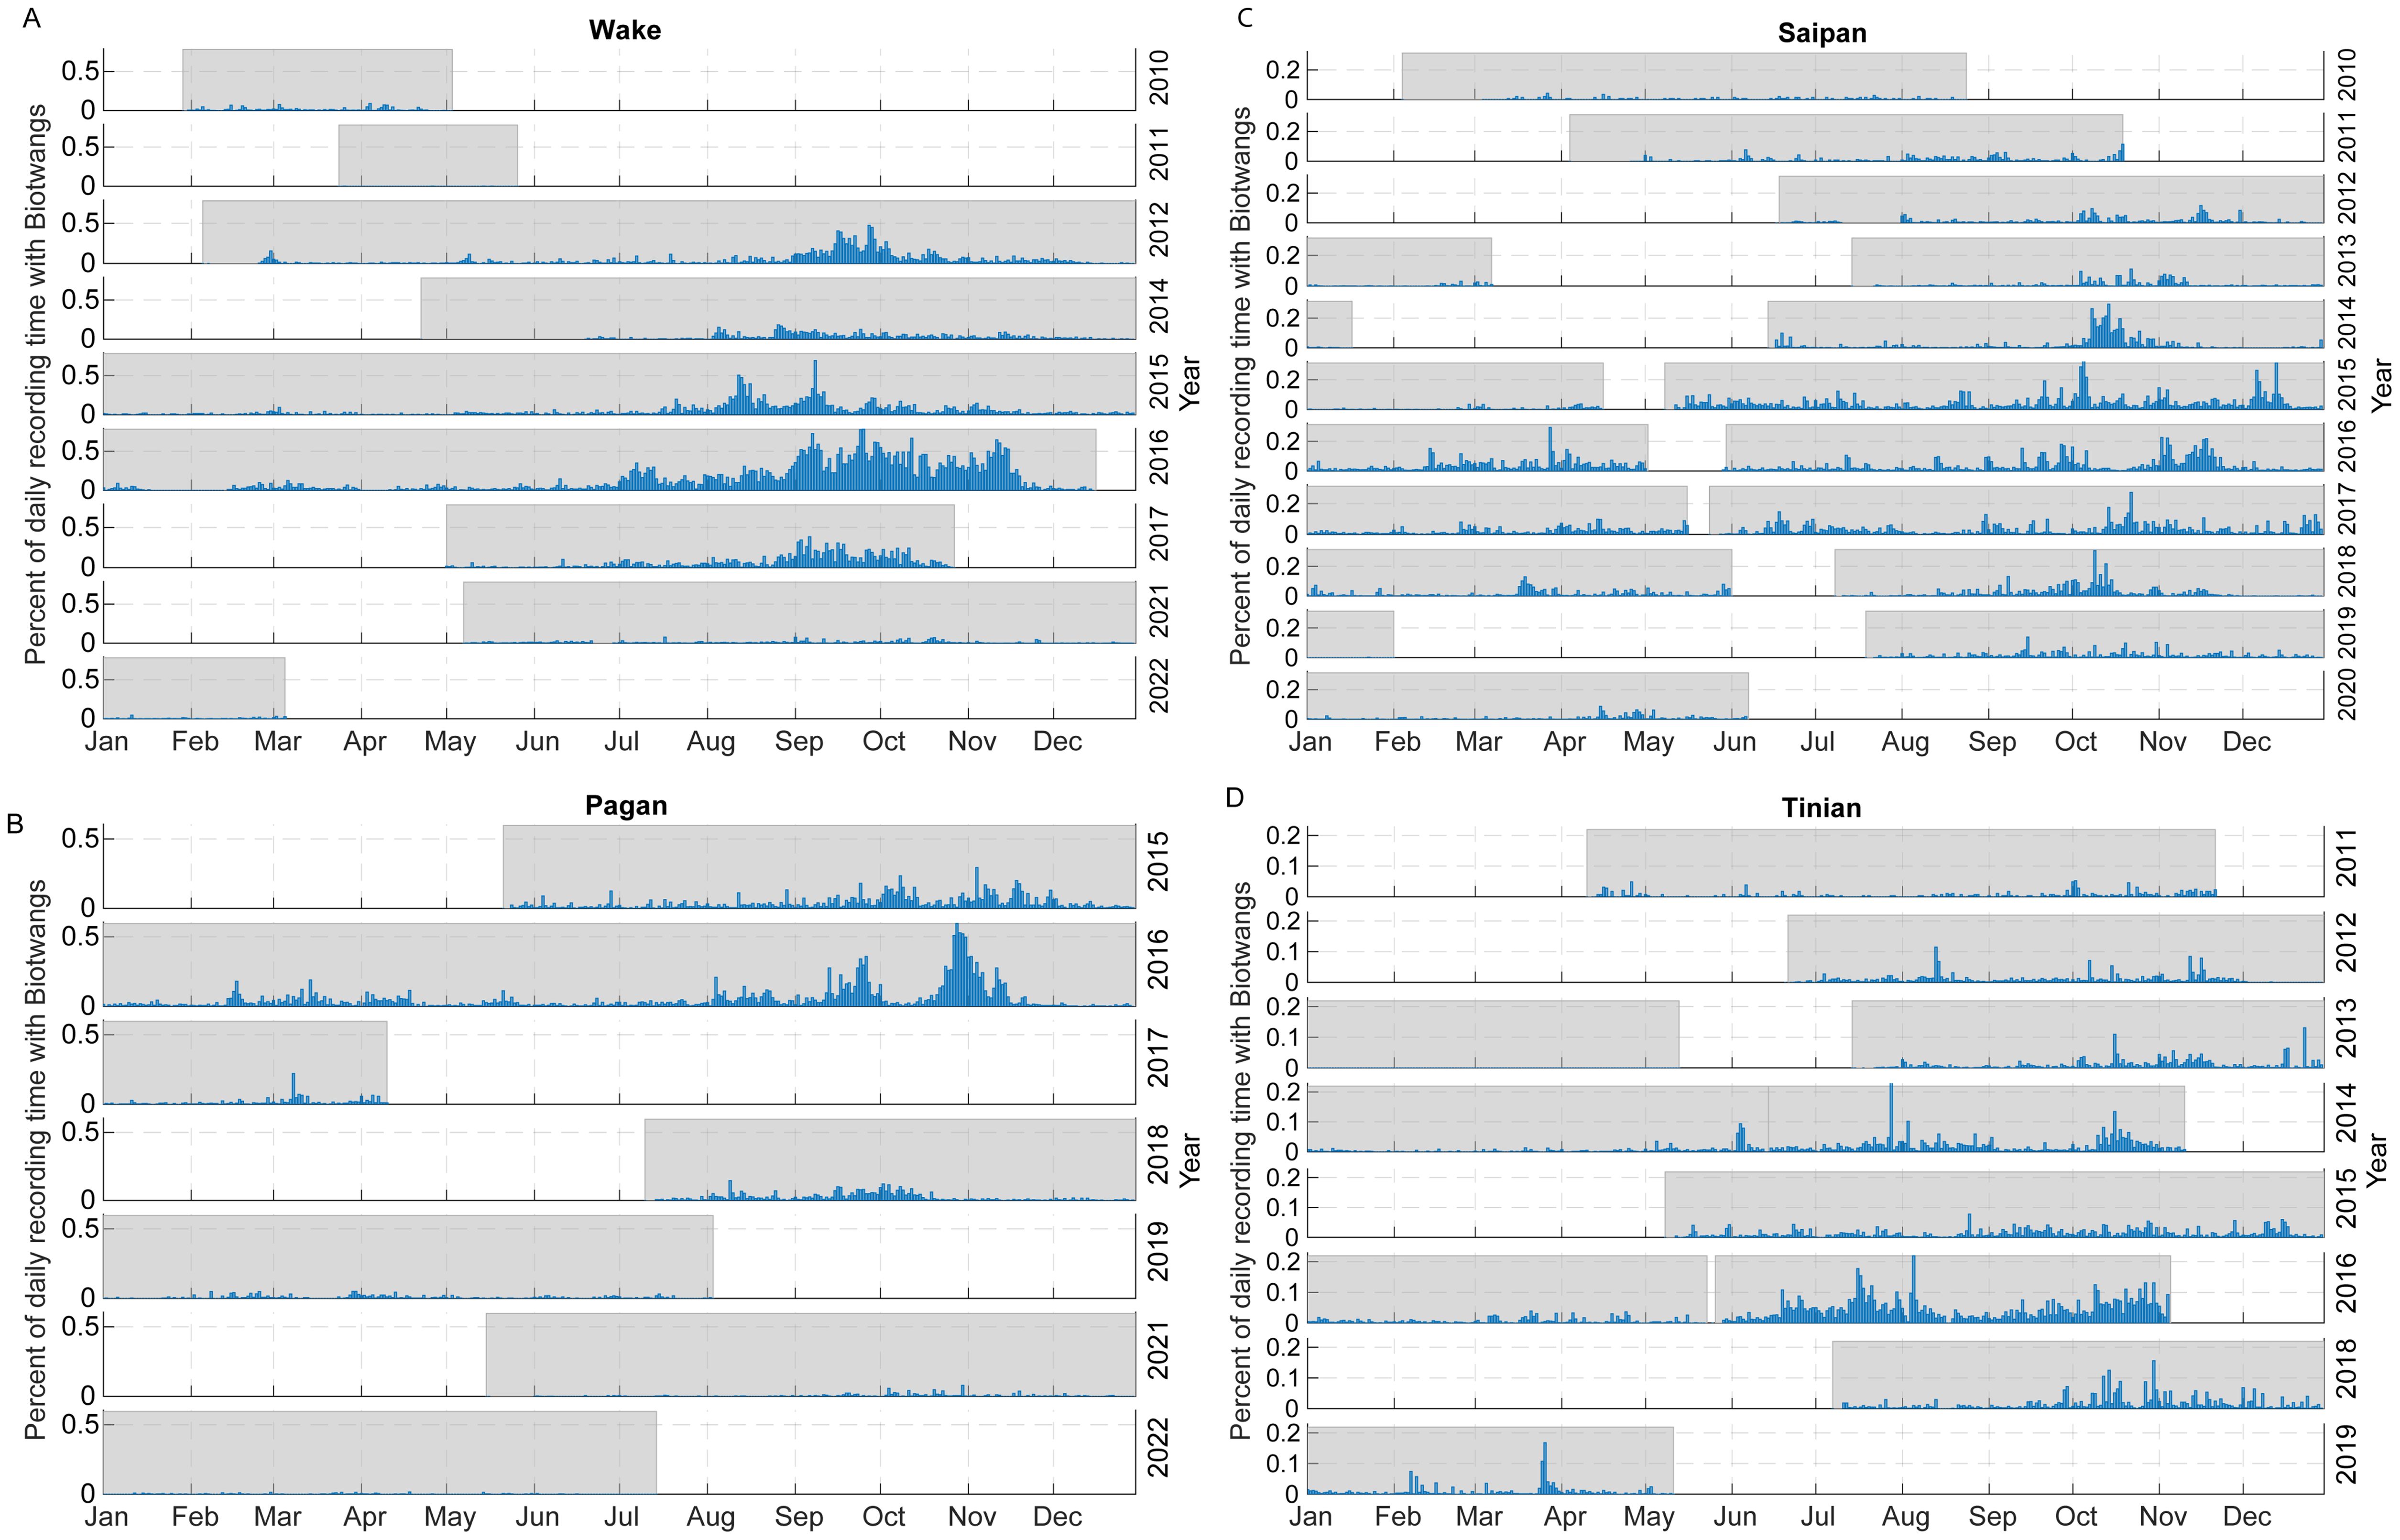
Figure 3. Relative occurrence of Biotwangs across the four HARP sites with consistent detections, calculated as the percentage of daily recording time with Biotwangs. Shaded areas indicate time periods that have recordings. (A) Wake, (B) Pagan, (C) Saipan, (D) Tinian.
In the DASBR recordings from July 2018, 5 of the 8 drifts had detections of Biotwangs, with a total of 191 Biotwangs detected, primarily within two DASBR deployments (Figure 2). In May-June 2021, 7 of the 22 DASBR deployments had detections of Biotwangs, with a total of 80 detected. The majority of these occurred to the east of the Mariana Archipelago, though with relatively few total detections compared to 2018 (Figure 2).
The ICIs for manually annotated Biotwangs at Saipan and Wake had a peak between 3.5-5 min (Figure 4). The ICIs then tapered off sharply until maintaining a low level distribution after 9 mins.
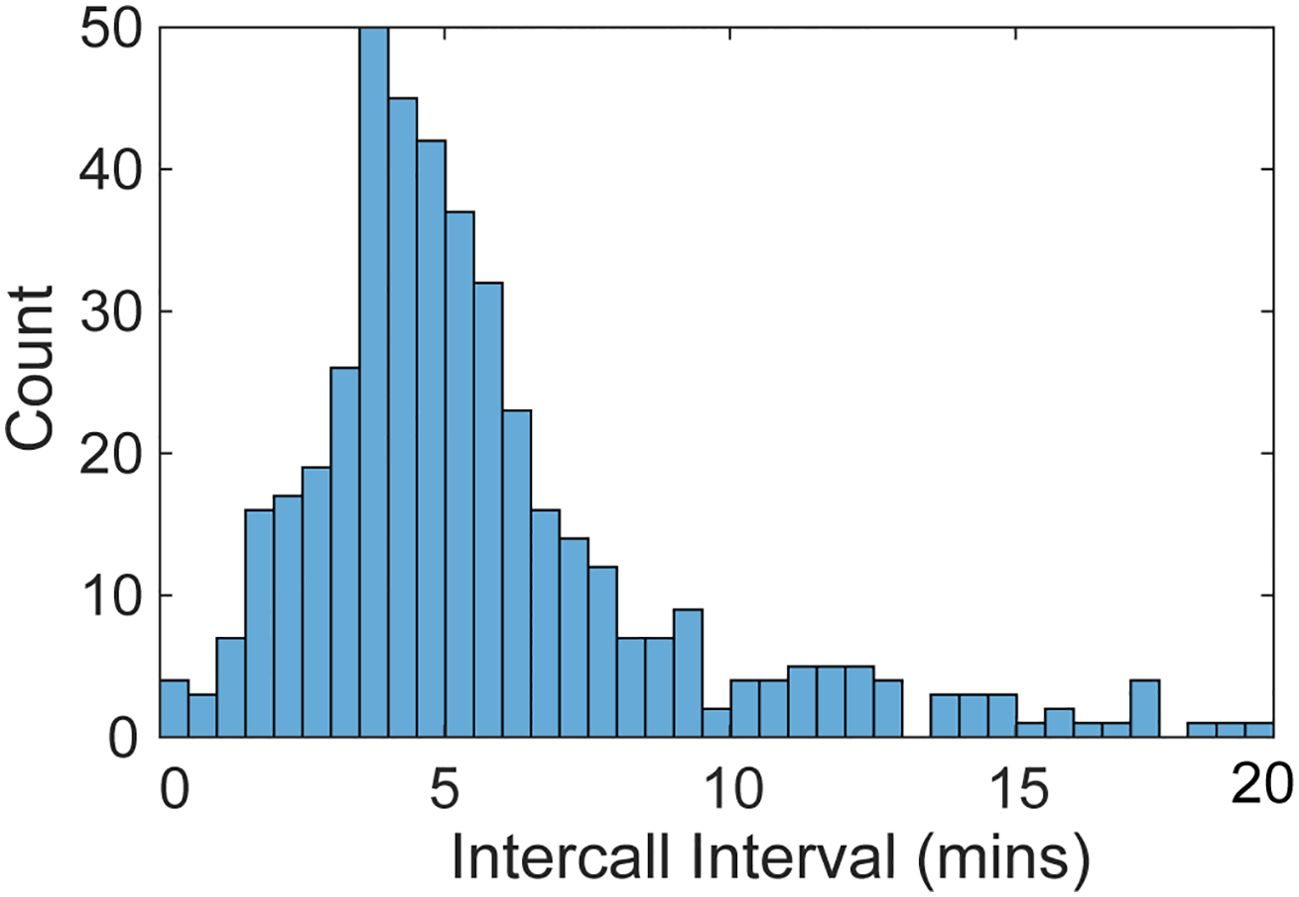
Figure 4. Histogram of the intercall intervals calculated for the manually annotated HARP data. The calls are binned into 30 second intervals and truncated after 20 mins.
When the call data was split into seasons there was no pattern of diurnal calling distinctive from that seen when all data was aggregated across all months of the year. There was no consistent pattern in the number of calls detected per hour of day across all datasets (Figure 5). The DASBR data showed a peak in calling from dawn until noon and two hours after sunset to midnight. At Tinian there were a higher number of calls at night, while Pagan and Wake had slightly higher numbers of calls during the daytime hours.
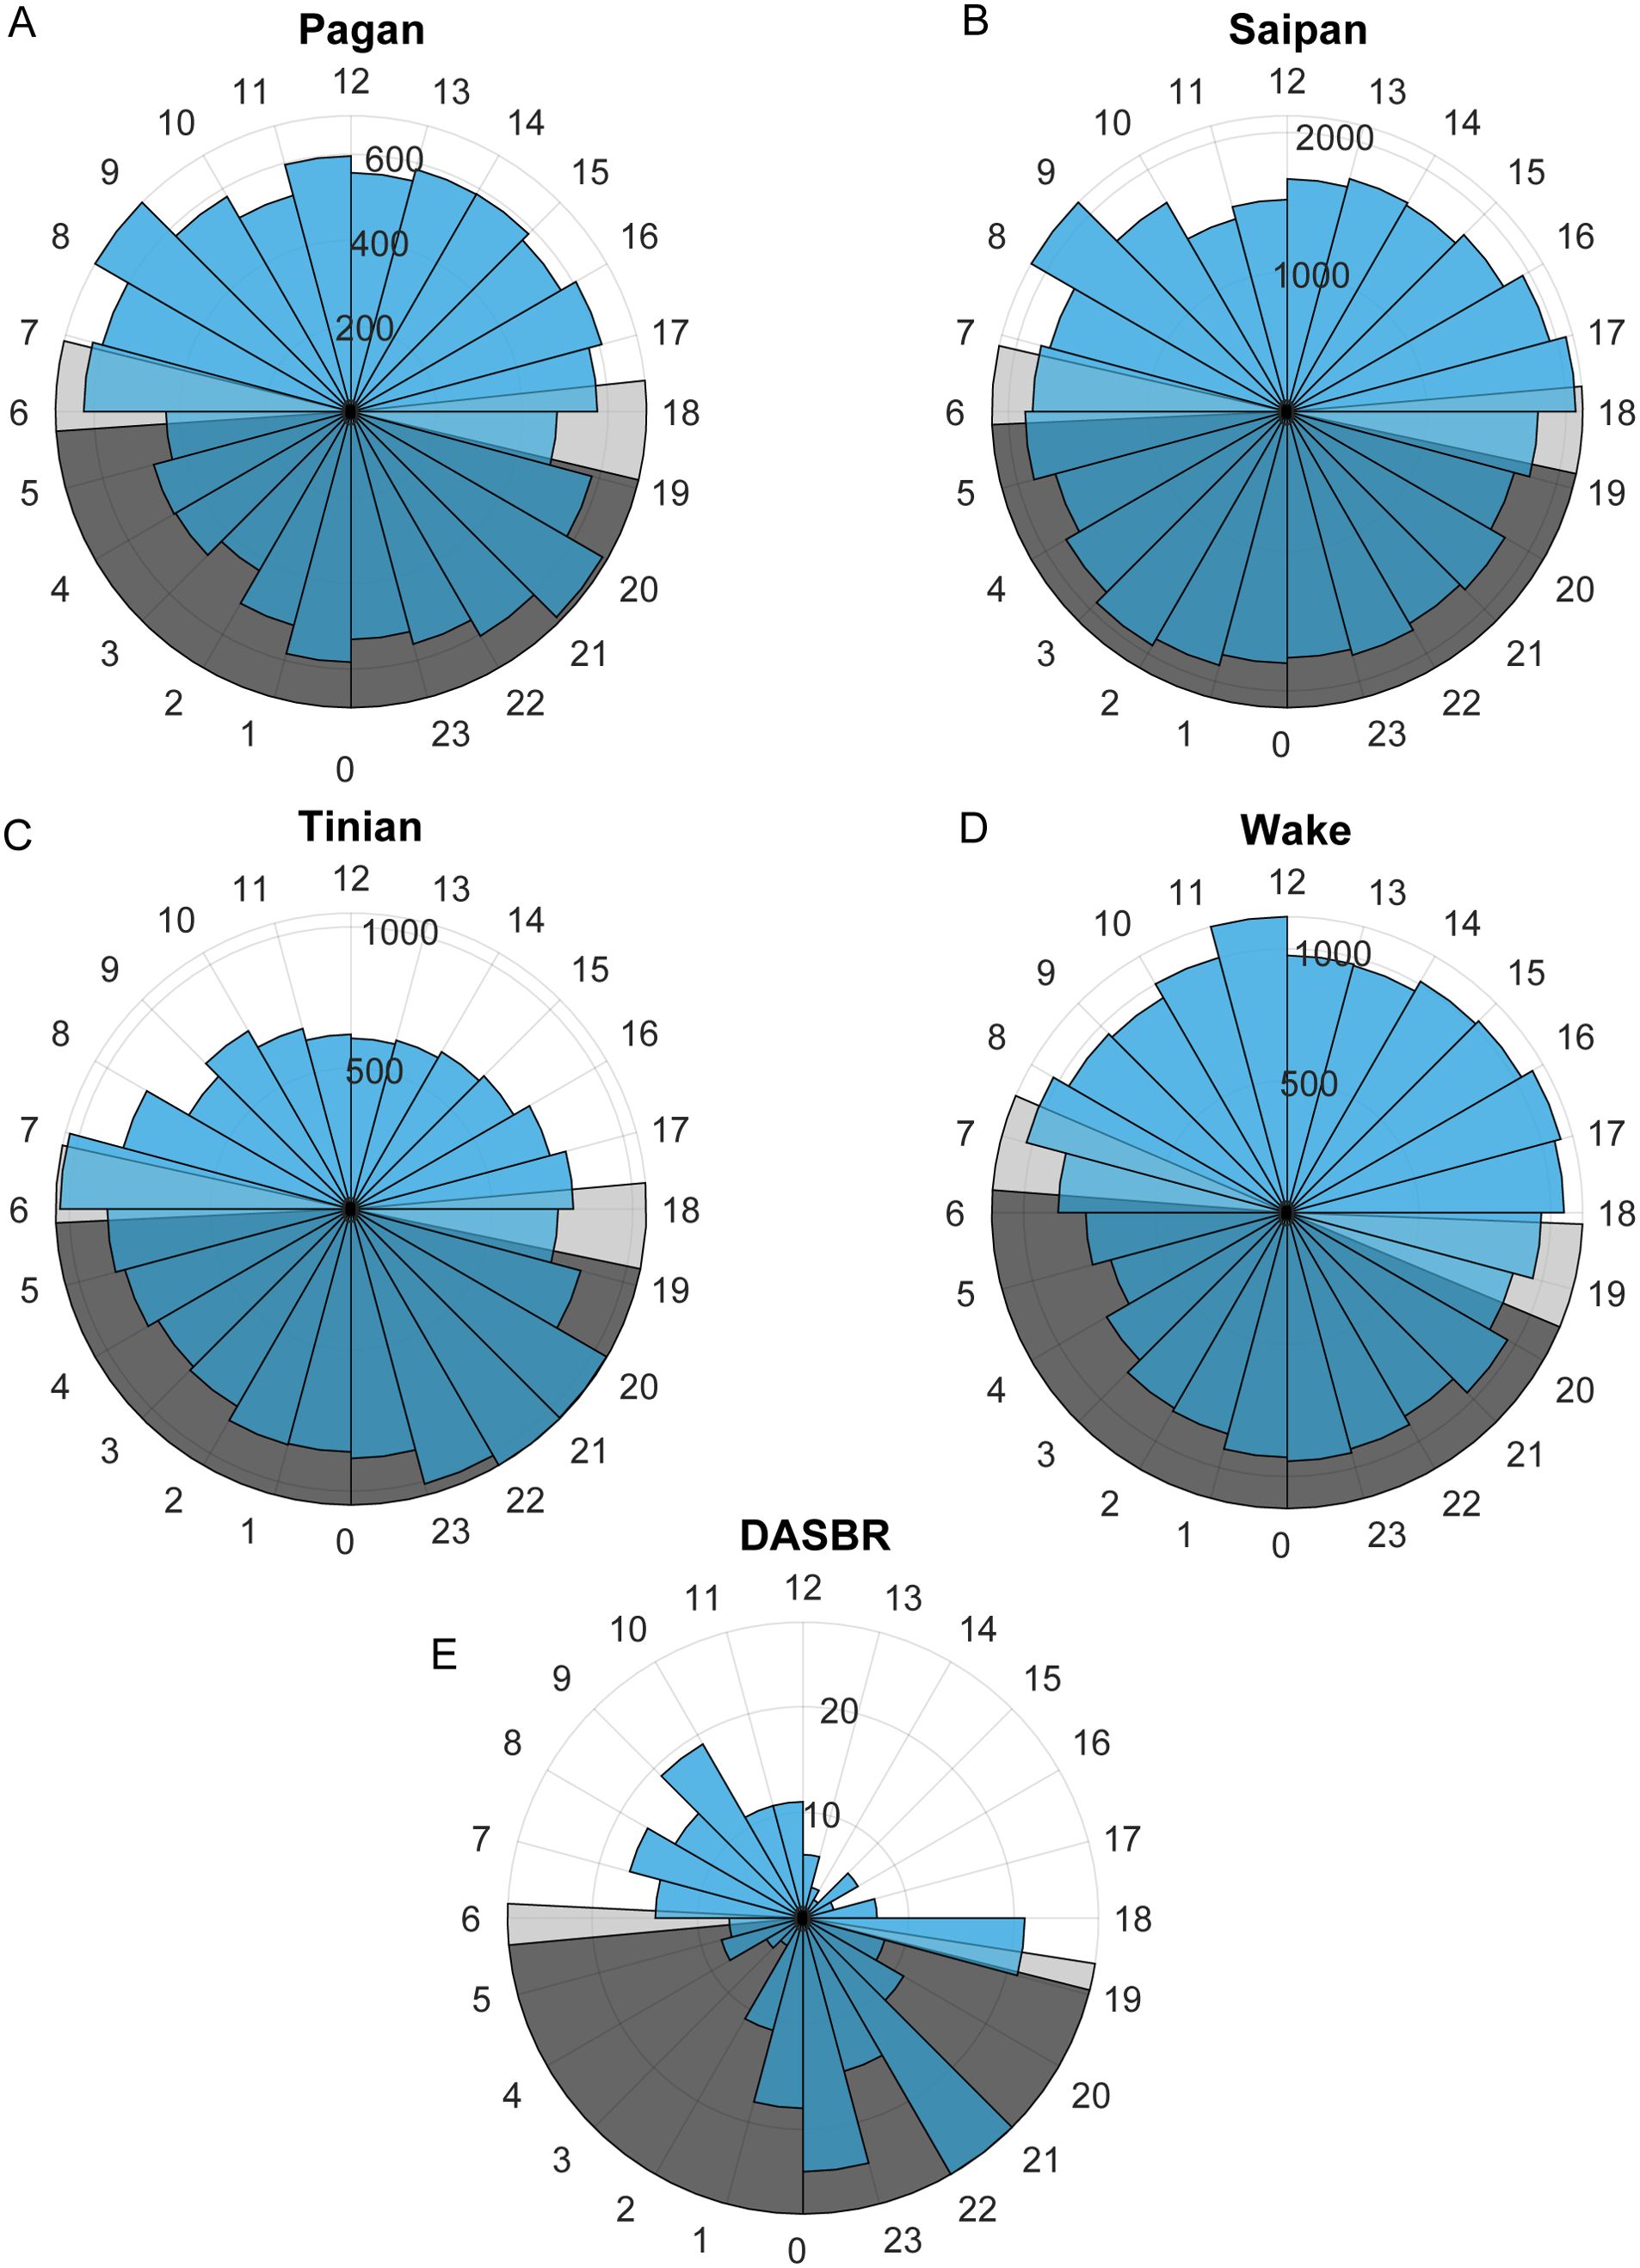
Figure 5. The number of calls per hour of the day for the DASBRs and for each site with biotwangs. The annual range of sunrise and sunset times is displayed in light grey and nighttime in dark grey. (A) Pagan, (B) Saipan, (C) Tinian, (D) Wake, (E) DASBR.
4 Discussion
4.1 Biotwangs are produced by Bryde’s whales
With nine confirmed Bryde’s whale sightings in conjunction with sonobuoy recordings we demonstrate that the previously identified Biotwang call is made by Bryde’s whales. Biotwangs were observed in association with a single whale, mom-calf pairs, and groups up to four individuals with and without a calf. The only Bryde’s whale sighting without Biotwang recordings was of the largest observed group (five animals), which was the only sighting of multiple individuals that did not contain a calf.
This is only the third identified call type of Bryde’s whales in the Western North Pacific. There is another unidentified nocturnal call type from the Mariana Archipelago that is theorized to belong to Bryde’s whales (Szesciorka et al., 2023) but without visual affirmation of the linkage. Other Bryde’s whale call types have been documented in the eastern North Pacific and Japanese coastal waters (Oleson et al., 2003; Chiu, 2009), in the Beibu Gulf between China and Vietnam (Wang et al., 2022), in New Zealand (McDonald, 2006), and in the Lau basin near Tonga in the Southern Hemisphere (Brodie and Dunn, 2015). None of these calls are similar to the complex multi-part Biotwang, which has mechanical sounding features that range up above 8 kHz. Many of the documented vocalizations have low frequency components (<100Hz) similar to the 37 Hz long downsweep that forms the principal component of the Biotwang, which is often the only component to appear in a spectrogram. Confirmation that Bryde’s whales are capable of producing Biotwangs suggests that they could be responsible for other unknown complex call types. Additionally, the positive linkage between Biotwangs and Bryde’s whales enables additional studies on the distribution of Bryde’s whales from the NP using PAM datasets.
The ICI of the Biotwangs had a peak around 4 min, which is similar to ICIs reported for other Bryde’s whale calls (Brodie and Dunn, 2015; Helble et al., 2016). In Hawaii, Helble et al. (2016) used swim tracks of calling animals to determine that whales traveling together had synchronous ICIs, which increased when one animal stopped calling, suggesting that Bryde’s whales may use the vocalizations to maintain group cohesion and spacing. No consistent pattern was found in the diurnal distribution of the Biotwangs, with slightly more Biotwangs during daytime hours at Pagan and Wake, slightly more nighttime calls at Tinian, and a peak in calling in the morning hours and at night in the DASBR data. Pagan and Wake are at similar latitudes at the northernmost range of the Biotwangs, Tinian is at the southernmost, and the DASBRs locations are spread throughout the range. This could suggest a shift in the production of Biotwangs as Bryde’s whales progress along their migration route, but recordings from more latitudes would be required to establish a pattern.
4.2 Spatio-temporal patterns of Bryde’s whale Biotwang detection
PIPAN data spans over a decade at sites in both the central and western North Pacific, but Biotwangs were only detected with any regularity at the sites west of the dateline, in the Mariana Archipelago and at Wake Atoll. They were infrequently detected in the Northwestern Hawaiian Islands, at Pearl and Hermes Reef, as well as near the equator at Howland Island, extending the overall known distribution of Biotwangs to just east of the dateline ranging from the equator to 27°N. Call detections were rare at these locations, suggesting they are outside of the common range of the Bryde’s whales that are producing them. Japanese whaling studies have gathered genetic data supporting that there is a Bryde’s population in the WNP distinct from those in the western South Pacific, eastern South Pacific and eastern Indian Oceans (Kanda et al., 2007). A recent study (Taguchi et al., 2023) further distinguished a Bryde’s whale stock in the WNP extending to about 170°E as genetically distinct from the stock found in the NW Hawaiian Islands. Some Bryde’s whale calls have been used to differentiate between stocks (Viloria-Gómora et al., 2021), and the regional distribution of Biotwangs aligns well with the genetic ID of a WNP stock suggesting it may also be a population specific call. However, this study does not include detection data for other known Bryde’s whale call types in the North Pacific. Future work identifying whether other call types are present in the long term recording data in conjunction with Biotwangs would aid in determining if the Biotwang is regionally specific to a WNP population.
The ML model generalized quite well with a high AUC-ROC at the Biotwang sites, but with some differences in performance across locations and years which could lead to varying recall rates. However, we see a clear bimodal pattern in the occurrence of Biotwangs (Figure 3) with a large peak in production in August through November, and then a smaller peak from February to April at some sites. It is generally thought that Bryde’s whales occupy low latitudes (0–10°N) from January to March and middle latitudes (20-40°N) from April to August (Kishiro, 1996). The PIPAN sites with the highest level of call detection were between these feeding and breeding latitudes (15-19°N). The bi-modal pattern of increased Biotwang occurrence in our data supports this migration model, with whales passing by the recording sites twice a year. At all sites, the peak in calling during August through November has a higher percentage of recording times with Biotwangs than the peak from February to April. This variation could be attributed to the whales increasing their call rates in the latter half of the year, switching to other call types, or using different travel routes during the two migratory periods.
While we do not know where this population breeds, Nishimoto et al. (1952) reported that Bryde’s whales were feeding on krill and fish as far south as Ogasawara in May and June. To the north, Sasaki et al. (2013) found that Bryde’s whales were feeding along the Kuroshio Current in an area of increased productivity called the Transition Zone Chlorophyll Front (TZCF). The TZCF is a zone of high chlorophyll and an enhanced foraging habitat for predators, driven by the zone of surface convergence between the North Pacific Subtropical Gyre and the Subarctic Gyre (Polovina et al., 2001). It spans more than 8000 km across the North Pacific, and seasonally moves north and south by about 1000 km, between 30-35°N in the winter to about 40-45°N in the summer (Polovina et al., 2001). During surveys between 2008 and 2021 Bryde’s whales were present in waters between 35-40°N in July to August (Hakamada and Matsuoka, 2016; Katsumata and Matsuoka, 2022), and were following the distribution of juvenile Japanese sardine and anchovy, which move north with the TZCF in spring and summer (Watanabe et al., 2012; Sasaki et al., 2013). However, Murase et al. (2016) deployed satellite tags on two Bryde’s whales offshore from Japan (37°36.5′N 155°10.4′E and 38°00.1′N 147°51.5′E), and both animals traveled away from the subarctic-subtropical transition area to subtropical latitudes in mid-July to mid-August, indicating that Bryde’s whales do not stay in feeding areas persistently in summer. Other populations of Bryde’s whales are known to have complex movement patterns, influenced by a wide range of oceanographic, physical, and biological variables, likely driven by changes in prey movements (Constantine et al., 2018; Kerosky et al., 2012; Tardin et al., 2017). Bryde’s whales are thought to be income breeders, feeding regularly throughout the year, and employing a wide array of novel behaviors to catch a large variety prey (Murase et al., 2007; Iwata et al., 2017; Izadi, 2018), allowing them greater plasticity in their foraging areas. Our acoustic data support a complex migration pattern of WNP Bryde’s whales, with some whales remaining at intermediate latitudes or beginning their southward migration before the TZCF shifts in the fall. There are low levels of calling from May to July and an increase in Biotwang presence beginning in August and continuing through November at most sites (Figure 3), although the timing and peaks of the migrations are variable between years. Additionally, Biotwangs were detected at our southernmost recording site at Howland Island (0°48’ N 176°36’ W) from April through September, when Bryde’s whales are typically expected to be at their mid-latitude feeding grounds. Some fluctuation in the timing of movements may also be related to age class and or the reproductive condition of individuals
In addition to variation in the timing of the migrations, there is considerable inter-annual variation in the detection rates of Biotwangs, with high detection rates at Mariana Archipelago and Wake Atoll sites in 2016, and very low detection rates at Pagan and Wake (the two sites with data) in 2021. The TZCF varies in location and intensity with the Pacific Decadal Oscillation (PDO), with more productive conditions and a more southerly boundary during positive phases of the PDO and during El Niño years (Bograd et al., 2004). This change in the boundary of the TZCF has been shown to have high trophic level impacts on the distributions of multiple species (Polovina et al., 2017). Only during positive PDO years is the TZCF known to reach the Northwestern Hawaiian Islands (Baker et al., 2007), and Biotwangs were only found with regularity at our Pearl and Hermes Reef site during the strongly positive PDO years of 2015-2016. Under accelerating climate change we expect more frequent and extreme El Niño and La Niña years, the TZCF to shift poleward by 500-1000 km (Polovina et al., 2011), and the Kuroshio extension current to be more variable (Navarra and Di Lorenzo, 2021), all of which may have large impacts on the migration patterns of Bryde’s whales. In 2021 Katsumata and Matsuoka (2022) documented WNP Bryde’s whales migrating further north (42°N vs 40°N) than ever recorded in previous survey years. Longer migrations could have population level impacts, as greater energy stores are required to travel farther distances to achieve the same food resource. Some species of baleen whales are known to forgo migration to the breeding grounds in favor of prolonging feeding opportunities (Stafford et al., 2009; Van Opzeeland et al., 2013; Magnúsdóttir et al., 2014), possibly to increase energy stores to improve future breeding opportunities. Given the Bryde’s whales strong ties to the TZCF for feeding and the accelerating impact of climate change on the locations and productivity of the TZCF, it merits future investigation whether the variability in the Biotwang occurrence in our PAM data is explainable by these changes in climatic regimes. As climate change impacts increase it will be important to monitor and mitigate phenology changes in WNP Bryde’s whales in order to maintain a healthy population.
Data availability statement
The datasets presented in this study can be found in online repositories. The names of the repository/repositories and accession number(s) can be found below: The entire acoustic dataset is available at: https://doi.org/10.25921/Z787-9Y54. The trained machine learning model is openly available at: https://www.kaggle.com/models/google/multispecies-whale.
Ethics statement
Ethical review and approval was not required for the animal study because no experimental studies or direct interactions with any vertebrate species were conducted. All data are purely observational.
Author contributions
AA: Writing – original draft, Visualization, Validation, Project administration, Methodology, Formal analysis, Data curation, Conceptualization. MH: Writing – review & editing, Visualization, Validation, Software, Formal analysis. LH: Writing – review & editing, Visualization, Methodology, Formal analysis, Conceptualization. MW: Writing – review & editing, Validation, Data curation. AS: Writing – review & editing, Validation, Data curation. JM: Writing – review & editing, Validation, Data curation. EO: Writing – review & editing, Supervision, Resources, Project administration, Funding acquisition.
Funding
The author(s) declare financial support was received for the research, authorship, and/or publication of this article. The funding for acoustic monitoring efforts and analysis was provided by the Protected Species and Ecosystems and Oceanography Divisions at NMFS and PIFSC, the Ocean Acoustics program at NMFS Office of Science and Technology, the US Navy CNO-N45, and the National Geographic Society. HARP deployments were permitted at Ladd Seamount and Pearl and Hermes Reef by the Papahanaumokuakea Marine National Monument under permits PMNM-2008-020 and PMNM-2010042, and the Co-Managers permit since 2015 and at Palmyra Atoll under USFWS Special-Use permit #12533. Funding for MACS 2018 was provided by PIFSC and U.S. Pacific Fleet, Environmental Readiness Division. MACS 2021 was funded by PIFSC and PacMAPPS partner, the U.S. Navy Pacific Fleet Environmental Readiness Division (IAA NMFS-PIC-20-002). Ship time aboard the R/V Sette was provided by PIFSC. All operations were conducted under National Marine Fisheries Service (NMFS) Marine Mammal Protection Act-Endangered Species Act (MMPA-ESA) take permit 20311 and Commonwealth of the Northern Mariana Islands-Division of Fish and Wildlife (CNMI-DFW) scientific research permits 03752-18 and 20311.
Acknowledgments
Special thanks for HARP development, deployment, recovery, and data processing to: Scripps Whale Acoustics Lab, Scripps Acoustic Ecology Lab, PIFSC technicians and field staff, Cascadia Research Collective, Ben Sablan, Dan McSweeney, The Nature Conservancy, Palmyra Atoll Research Consortium, the US Fish and Wildlife Service, and the officers and crews of the NOAA ships Sette and Hi’ialakai, as well as other “ships of opportunity.” We thank the NOAA officers and crew of the R/V Oscar Elton Sette for assistance in deploying, tracking, and recovering DASBRs, and to the visual and passive acoustics teams aboard for their assistance with assembling, tearing down, locating, and relocating DASBRs at sea. Many observers, acousticians, visiting scientists, and the officers and crew of the Sette made the visual surveys successful. We would like to thank Robert Brownell for comments that improved a previous version of this manuscript.
Conflict of interest
Authors MH and LH were employed by Google, Inc. Author MW was employed by Saltwater Inc.
The remaining authors declare that the research was conducted in the absence of any commercial or financial relationships that could be construed as a potential conflict of interest.
The reviewer AK declared a past co-authorship with the author MH to the handling editor.
Publisher’s note
All claims expressed in this article are solely those of the authors and do not necessarily represent those of their affiliated organizations, or those of the publisher, the editors and the reviewers. Any product that may be evaluated in this article, or claim that may be made by its manufacturer, is not guaranteed or endorsed by the publisher.
Supplementary material
The Supplementary Material for this article can be found online at: https://www.frontiersin.org/articles/10.3389/fmars.2024.1394695/full#supplementary-material
References
Baker J. D., Polovina J. J., Howell E. A. (2007). Effect of variable oceanic productivity on the survival of an upper trophic predator, the Hawaiian monk seal Monachus schauinslandi. Mar. Ecol. Prog. Ser. 346, 277–283. doi: 10.3354/meps06968
Barlow J. (2006). Cetacean abundance in hawaiian waters estimated from a summer/fall survey in 2002. Mar. Mammal Sci. 22, 446–464. doi: 10.1111/j.1748-7692.2006.00032.x
Bograd S. J., Foley D. G., Schwing F. B., Wilson C., Laurs R. M., Polovina J. J., et al. (2004). On the seasonal and interannual migrations of the transition zone chlorophyll front. Geophysical Res. Lett. 31. doi: 10.1029/2004GL020637
Brodie D., Dunn R. (2015). Low frequency baleen whale calls detected on ocean-bottom seismometers in the Lau basin, southwest Pacific Ocean. J. Acoustical Soc. America 137, 53–62. doi: 10.1121/1.4904556
Chiu P.-H. (2009). Studies on the population and acoustic signals of Bryde’s whales (Balaenoptera edeni) in Tosa Bay, Japan (Kaohsiung, Taiwan: I nstitute of Marine Biology, National Sun Yat-Sen University).
Constantine R., Iwata T., Nieukirk S. L., Penry G. S. (2018). Future Directions in Research on Bryde’s Whales. Front. Mar. Sci. 5, 333. doi: 10.3389/fmars.2018.00333
Cummings W. C., Thompson P. O., Ha S. J. (1986). Sounds from Bryde, Balaenoptera edeni, and finback, Balaenoptera-physalus, whales in the Gulf of California. Fishery Bull. 84, 359–370.
DeLong R. L., Brownell R. L. (1977). Hawaiian monk seal (Monachus schauinslandi) habitat and population survey in the Northwestern (Leeward) Hawaiian Islands. Available online at: https://repository.library.noaa.gov/view/noaa/23123 (Accessed January 5, 2024).
Edds P. L., Odell D. K., Tershy B. R. (1993). Vocalizations of a captive juvenile and free-ranging adult-calf pairs of bryde’s whales, balaenoptera edeni. Mar. Mammal Sci. 9, 269–284. doi: 10.1111/j.1748-7692.1993.tb00455.x
Hakamada T., Matsuoka K. (2016). The number of western North Pacific common minke, Bryde’s and sei whales distributed in JARPNII Offshore survey area. Int. Whaling Commission document SC F 16 13.
Heimlich S., Mellinger D., Nieukirk S., Fox C. (2005). Types, distribution, and seasonal occurrence of sounds attributed to Bryde’s whales (Balaenoptera edeni) recorded in the eastern tropical Pacifc 1999–2001. J. Acoustical Soc. America 118, 1830–1837. doi: 10.1121/1.1992674
Helble T. A., Henderson E. E., Ierley G. R., Martin S. W. (2016). Swim track kinematics and calling behavior attributed to Bryde’s whales on the Navy’s Pacific Missile Range Facility. J. Acoustical Soc. America 140, 4170–4177. doi: 10.1121/1.4967754
Hill M. C., Oleson E. M., Bradford A., Martien K. K., Steel D., Baker S. (2020). Assessing cetacean populations in the Mariana Archipelago: A summary of data and analyses arising from Pacific Islands Fisheries Science Center surveys from 2010–2019. U.S. Dept. of Commerce, NOAA Technical Memorandum NOAA-TM-NMFS-PIFSC-108. 98. doi: 10.25923/WRYE-6H14
International Whaling Commission (2007). Western North Pacific Bryde’s implementation: report of the first intersessional workshop. J. Cetacean Res. Manage. 9, 407–427.
Iwata T., Akamatsu T., Thongsukdee S., Cherdsukjai P., Adulyanukosol K., Sato K. (2017). Tread-water feeding of Bryde’s whales. Curr. Biol. 27, R1154–R1155. doi: 10.1016/j.cub.2017.09.045
Izadi S. (2018). Behavioural Ecology of Bryde’s Whales (University of Auckland, Auckland, New Zealand). Available at: https://researchspace.auckland.ac.nz/handle/2292/45049.
Kanda N., Goto M., Kato H., McPhee M., Pastene L. (2007). Population genetic structure of Bryde’s whales (Balaenoptera brydei) at the inter-oceanic and trans-equatorial levels. Conserv. Genet. 8, 853–864. doi: 10.1007/s10592-006-9232-8
Katsumata T., Matsuoka K. (2022). Report and highlights of the dedicated sighting surveys in the western North Pacific Ocean in 2021. Tech. Rep. Institute Cetacean Res., 36–45.
Kerosky S. M., Širović A., Roche L. K., Baumann-Pickering S., Wiggins S. M., Hildebrand J. A. (2012). Bryde’s whale seasonal range expansion and increasing presence in the Southern California Bight from 2000 to 2010. Deep Sea Res. Part I: Oceanographic Res. Papers 65, 125–132. doi: 10.1016/j.dsr.2012.03.013
Kershaw F., Leslie M., Collins T., Mansur R., Smith B., Minton G., et al. (2013). Population differentiation of 2 forms of bryde’s whales in the Indian and pacific oceans. J. Heredity 104, 755–764. doi: 10.1093/jhered/est057
Kishiro T. (1996). Movements of marked Bryde’s whales in the western North Pacific. Rep.-Int. Whal. Commun. 46, 421–428.
Kitakado T., Shimada H., Okamura H., Miyashita T. (2008). CLA abundance estimates for western North Pacific Bryde’s whales and their associated CVs with taking the additional variance into account (IWC/SC Santiago, Santiago), 1–25.
K. Lisa Yang Center for Conservation Bioacoustics (2022). Raven Pro: Interactive Sound Analysis Software (Ithaca, NY: The Cornell Lab of Ornithology). Available at: https://ravensoundsoftware.com/.
Konishi K., Matsuoka K., Tamura T. (2009). Density prediction modeling and mapping of common minke, sei and Bryde’s whales distribution in the western North Pacific using JARPN II, (2000–2007) data set. Paper Sc J. 2009, 9.
Magnúsdóttir E. E., Rasmussen M. H., Lammers M. O., Svavarsson J. (2014). Humpback whale songs during winter in subarctic waters. Polar Biol. 37, 427–433. doi: 10.1007/s00300-014-1448-3
McCullough J. L. K., Wren J. L. K., Oleson E. M., Allen A. N., Siders Z. A., Norris E. S. (2021). An acoustic survey of beaked whales and kogia spp. in the mariana archipelago using drifting recorders. Front. Mar. Sci. 8. doi: 10.3389/fmars.2021.664292
McDonald M. A. (2006). An acoustic survey of baleen whales off Great Barrier Island, New Zealand. New Z. J. Mar. Freshw. Res. 40, 519–529. doi: 10.1080/00288330.2006.9517442
Murase H., Tamura T., Kiwada H., Fujise Y., Watanabe H., Ohizumi H., et al. (2007). Prey selection of common minke (Balaenoptera acutorostrata) and Bryde’s (Balaenoptera edeni) whales in the western North Pacific in 2000 and 2001. Fish. Oceanogr. 16, 186–201. doi: 10.1111/j.1365-2419.2006.00426.x
Murase H., Tamura T., Otani S., Nishiwaki S. (2016). Satellite tracking of Bryde’s whales Balaenoptera edeni in the offshore western North Pacific in summer 2006 and 2008. Fish Sci. 82, 35–45. doi: 10.1007/s12562-015-0946-8
Navarra G. G., Di Lorenzo E. (2021). Poleward shift and intensified variability of Kuroshio-Oyashio extension and North Pacific Transition Zone under climate change. Clim Dyn 56, 2469–2486. doi: 10.1007/s00382-021-05677-0
Nieukirk S. L., Fregosi S., Mellinger D. K., Klinck H. (2016). A complex baleen whale call recorded in the Mariana Trench Marine National Monument. J. Acoustical Soc. America 140, EL274–EL279. doi: 10.1121/1.4962377
Nishimoto S., Tozawa M., Kawakami T. (1952). Food of sei whales (Balaenoptera borealis) caught in the Bonin Island waters. Sci. Rep. Whales Res. Inst 7, 79–85.
Oleson E. M., Barlow J., Gordon J., Rankin S., Hildebrand J. A. (2003). Low frequency calls of bryde’s whales. Mar. Mammal Sci. 19, 407–419. doi: 10.1111/j.1748-7692.2003.tb01119.x
Olsen O. (1913). On the External Characters and Biology of Bryde’s Whale (Balaenoptera brydei), a new Rorqual from the Coast of South Africa. Proc. Zoological Soc. London 83, 1073–1090. doi: 10.1111/j.1096-3642.1913.tb02005.x
Omura H. (1959). Bryde’s whale from the coast of Japan. Sci. Rep. Whales Res. Institute (Los Angeles: University of California Press) 14, 1–33.
Omura H., Fujino K. (1954). Sei whales in the adjacent waters of Japan. II. Further studies on the external characters. Sci. Rep. Whales Res. Inst 9, 89–103.
Omura H., Nemoto T. (1955). Sei whales in the adjacent waters of Japan. III. Relation between movement and water temperature of the sea. Sci. Rep. Whales Res. Inst 10, 79–87.
Pastene L. A., Goto M., Taguchi M., Kitakado T. (2016). Updated genetic analyses based on mtDNA and microsatellite DNA suggest possible stock differentiation of Bryde’s whales between management sub-areas 1 and 2 in the North Pacific 16. Paper SC. Available online at: https://www.icrwhale.org/pdf/SC-F16-JR44.pdf
Polovina J., Dunne J., Woodworth-Jefcoats P., Howell E. (2011). Projected expansion of the subtropical biome and contraction of the temperate and equatorial upwelling biomes in the North Pacific under global warming. ICES J. Mar. Sci. 68, 986–995. doi: 10.1093/icesjms/fsq198
Polovina J. J., Howell E., Kobayashi D. R., Seki M. P. (2001). The transition zone chlorophyll front, a dynamic global feature defining migration and forage habitat for marine resources. Prog. Oceanography 49, 469–483. doi: 10.1016/S0079-6611(01)00036-2
Polovina J., Howell E., Kobayashi D., Seki M. (2017). The Transition Zone Chlorophyll Front Updated: Advances from a decade of research. Prog. Oceanography 150, 79–85. doi: 10.1016/j.pocean.2015.01.006
Rankin S., Miller B., Crance J. L., Sakai T., Keating J. L. (2019). Sonobuoy Acoustic Data Collection during Cetacean Surveys (Raven Pro: Interactive Sound Analysis Software (Version 1.6.2). Available online at: https://ravensoundsoftware.com/ (Accessed May 16, 2022).
Sasaki H., Murase H., Kiwada H., Matsuoka K., Mitani Y., Saitoh S. (2013). Habitat differentiation between sei ( Balaenoptera borealis ) and Bryde’s whales ( B. brydei ) in the western North Pacific. Fish. Oceanogr. 22, 496–508. doi: 10.1111/fog.12037
Smultea M. (2012). Short note: bryde’s whale (Balaenoptera brydei/edeni) sightings in the Southern California bight. Aquat. Mamm. 38, 92–97. doi: 10.1578/AM.38.1.2012.92
Smultea M., Jefferson T., Zoidis A. (2010). Rare sightings of a bryde’s whale (Balaenoptera edeni) and sei whales. Pac. Sci. 64, 449–57. doi: 10.2984/64.3.449
Stafford K. M., Moore S. E., Spillane M., Wiggins S. (2009). Gray Whale Calls Recorded near Barrow, Alaska, throughout the Winter of 2003–04. ARCTIC 60, 167–172. doi: 10.14430/arctic241
Szesciorka A. R., McCullough J. L. K., Oleson E. M. (2023). An unknown nocturnal call type in the Mariana Archipelago. JASA Express Lett. 3, 011201. doi: 10.1121/10.0017068
Taguchi M., Goto M., Matsuoka K., Tiedemann R., Pastene L. A. (2023). Population genetic structure of Bryde’s whales (Balaenoptera brydei) on the central and western North Pacific feeding grounds. Can. J. Fish. Aquat. Sci. 80, 142–155. doi: 10.1139/cjfas-2022-0005
Tardin R., Chun Y., Simão S., Alves M. (2017). Modeling habitat use by Bryde’s whale Balaenoptera edeni off southeastern Brazil. Mar. Ecol. Prog. Ser. 576, 89–103. doi: 10.3354/meps12228
The MathWorks Inc. (2022). MATLAB version: 9.13.0 (R2022b), Natick, Massachusetts: The MathWorks Inc. Available online at https://www.mathworks.com.
Van Opzeeland I., Van Parijs S., Kindermann L., Burkhardt E., Boebel O. (2013). Calling in the cold: Pervasive acoustic presence of humpback whales (Megaptera novaeangliae) in antarctic coastal waters. PLoS One 8, e73007. doi: 10.1371/journal.pone.0073007
Viloria-Gómora L., Romero-Vivas E., Urbán R. (2015). Calls of Bryde’s whale (Balaenoptera edeni) recorded in the Gulf of California. J. Acoustical Soc. America 138, 2722–2725. doi: 10.1121/1.4932032
Viloria-Gómora L., Urbán R J., Leon-Lopez B., Romero-Vivas E. (2021). Geographic variation in bryde’s whale be4 calls in the gulf of California: an insight to population dynamics. Front. Mar. Sci. 8. doi: 10.3389/fmars.2021.651469
Wada S., Oishi M., Yamada T. K. (2003). A newly discovered species of living baleen whale. Nature 426, 278–281. doi: 10.1038/nature02103
Wade P. R., Genodette T. (1993). Estimates of cetacean abundance and distribution in the eastern tropical Pacific. Rep. Int. Whaling Commission 43, 477–493.
Wang Z., Duan P., Chen M., Mei Z., Sun X., Nong Z., et al. (2022). Vocalization of Bryde’s whales (Balaenoptera edeni) in the Beibu Gulf, China. Mar. Mammal Sci. 38, 1118–1139. doi: 10.1111/mms.12917
Wang Y., Getreuer P., Hughes T., Lyon R. F., Saurous R. A. (2017). “Trainable frontend for robust and far-field keyword spotting,” in Proceedings of the 2016 IEEE International Conference on Acoustics, Speech and Signal Processing (ICASSP). Conference paper. 5670–5674. doi: 10.1109/ICASSP.2017.7953242
Watanabe H., Okazaki M., Tamura T., Konishi K., Inagake D., Bando T., et al. (2012). Habitat and prey selection of common minke, sei, and Bryde’s whales in mesoscale during summer in the subarctic and transition regions of the western North Pacific. Fish Sci. 78, 557–567. doi: 10.1007/s12562-012-0480-x
Wiggins S. M., Hildebrand J. A. (2007). “High-frequency Acoustic Recording Package (HARP) for broad-band, long-term marine mammal monitoring,” in 2007 Symposium on Underwater Technology and Workshop on Scientific Use of Submarine Cables and Related Technologies, Tokyo, Japan. Conference paper. 551–557. doi: 10.1109/UT.2007.370760
Wiggins S. M., Roch M. A., Hildebrand J. A. (2010). TRITON software package: Analyzing large passive acoustic monitoring data sets using MATLAB. J. Acoustical Soc. America 128, 2299–2299. doi: 10.1121/1.3508074
Yano K. M., Hill M. C., Oleson E. M., McCullough J. L. K., Henry A. E. (2022). Cetacean and Seabird Data Collected During the Mariana Archipelago Cetacean Survey (MACS), May–July 2021 (Honolulu HI: NOAA Technical Memorandum NMFS-PIFSC128), 110 p. doi: 10.25923/7PBH-ZQ68
Yano K. M., Oleson E. M., Keating J. L., Ballance L. T., Hill M. C., Bradford A. L., et al. (2018). Cetacean and Seabird Data Collected during the Hawaiian Islands Cetacean and Ecosystem Assessment Survey (HICEAS), July-December 2017. (Honolulu HI: NOAA Tech. Memo. NMFS-PIFSC-72), 110.
Keywords: Bryde’s whale, passive acoustic monitoring, deep machine learning, seasonal occurrence, western North Pacific, Mariana archipelago, long-term monitoring
Citation: Allen AN, Harvey M, Harrell L, Wood M, Szesciorka AR, McCullough JLK and Oleson EM (2024) Bryde’s whales produce Biotwang calls, which occur seasonally in long-term acoustic recordings from the central and western North Pacific. Front. Mar. Sci. 11:1394695. doi: 10.3389/fmars.2024.1394695
Received: 01 March 2024; Accepted: 05 August 2024;
Published: 18 September 2024.
Edited by:
Leslie New, Ursinus College, United StatesReviewed by:
Fannie W. Shabangu, Fisheries and the Environment, South AfricaAnke Kügler, Syracuse University, United States
Copyright © 2024 Allen, Harvey, Harrell, Wood, Szesciorka, McCullough and Oleson. This is an open-access article distributed under the terms of the Creative Commons Attribution License (CC BY). The use, distribution or reproduction in other forums is permitted, provided the original author(s) and the copyright owner(s) are credited and that the original publication in this journal is cited, in accordance with accepted academic practice. No use, distribution or reproduction is permitted which does not comply with these terms.
*Correspondence: Ann N. Allen, ann.n.allen@gmail.com