 Muping Zhou
 Zheng Ling
 Changlin Chen3,4
- 1State Key Laboratory of Satellite Ocean Environment Dynamics, Second Institute of Oceanography, Ministry of Natural Resources, Hangzhou, China
- 2Key Laboratory of Climate, Resources and Environment in Continental Shelf Sea and Deep Sea of Department of Education of Guangdong Province, College of Ocean and Meteorology, Guangdong Ocean University, Zhanjiang, China
- 3Southern Marine Science and Engineering Guangdong Laboratory (Zhuhai), Zhuhai, China
- 4Department of Atmospheric and Oceanic Sciences and Institute of Atmospheric Sciences, Fudan University, Shanghai, China
This study utilized a three-dimensional ocean general circulation model to investigate the intensity, thickness, and width of the three-dimensional deep western boundary current (DWBC) in the South China Sea (SCS). The numerical results show that the DWBC begins near the inlet of the Luzon overflow, flows westward along the northern boundary, proceeds southward along the western boundary, and ultimately terminates at the southern boundary. The mean DWBC’s velocity, thickness, and width is 4.78 cm/s, 1645 m, and 140 km, respectively. Combined with the dynamic results, it is evident that the three-dimensional structure of the DWBC appears to have been visibly weakened after the closure of the deep Luzon overflow. Strong deep mixing has a significantly stronger, thicker, and wider effect on the intensity, thickness, and width of the DWBC. Both the bottom and lateral friction coefficients negatively impact the DWBC in the SCS.
1 Introduction
The deep western boundary current (DWBC) has attracted increasing attention as the most crucial deep ocean current since Swallow and Worthington (1957) first observed it in the Atlantic Ocean. It has been continuously observed in the global ocean (Johnson et al., 1991; Roemmich et al., 1996; Moore and Wilkin, 1998; Whitworth et al., 1999; Owens and Warren, 2001; Warren et al., 2002; Meinen et al., 2004; Reid, 2005; Schott et al., 2005; Wright et al., 2005; Schott et al., 2006; Peña-Molino et al., 2012). Johns et al. (1993) found that there is a significant southeastward DWBC in the Northeast Brazil Sea through the observation of anchor current meters. The thickness of the DWBC is greater than 2000 m and ranges from 2500 m to the bottom. Schott et al. (2006) observed significant southward DWBC near the Grand Banks using current meters and ADCP/LADCP. Their results also reveal a robust and consistent DWBC, with a maximum thickness of 3000 m and a width of 150 km. In general, the DWBC in the world ocean is strong and persistent, extending from the depths of 1000-2000 m to the seafloor.
The South China Sea (SCS) is the largest marginal sea in the Northwest Pacific Ocean (Figure 1). It is a completely closed basin below 2000 m with no water exchange with other oceans except for the deep Luzon overflow (Qu et al., 2005; Tian and Qu, 2012). The understanding of the DWBC in the SCS is mainly qualitative in the early due to the lack of observational data in the deep SCS (Qu, 2002; Qu et al., 2006; Wang et al., 2019). From the U.S. Navy generalized digital environment model (GDEM) data with a resolution of 0.25°, it was found that the deep SCS has a cyclonic circulation and is accompanied by an obvious DWBC (Wang et al., 2011). Recently, Zhou et al. (2017) identified the DWBC near the southwest of Zhongsha Island in the SCS by using six anchor sections. The average velocity of the DWBC is about 2 cm/s, and the width is about 50 km. Meanwhile, the results from three current moorings demonstrate that there is a narrow, almost barotropic western boundary current in the deep SCS (Zhou et al., 2020a). The width and thickness of the DWBC are between 20-32 km and 2000 m, respectively.
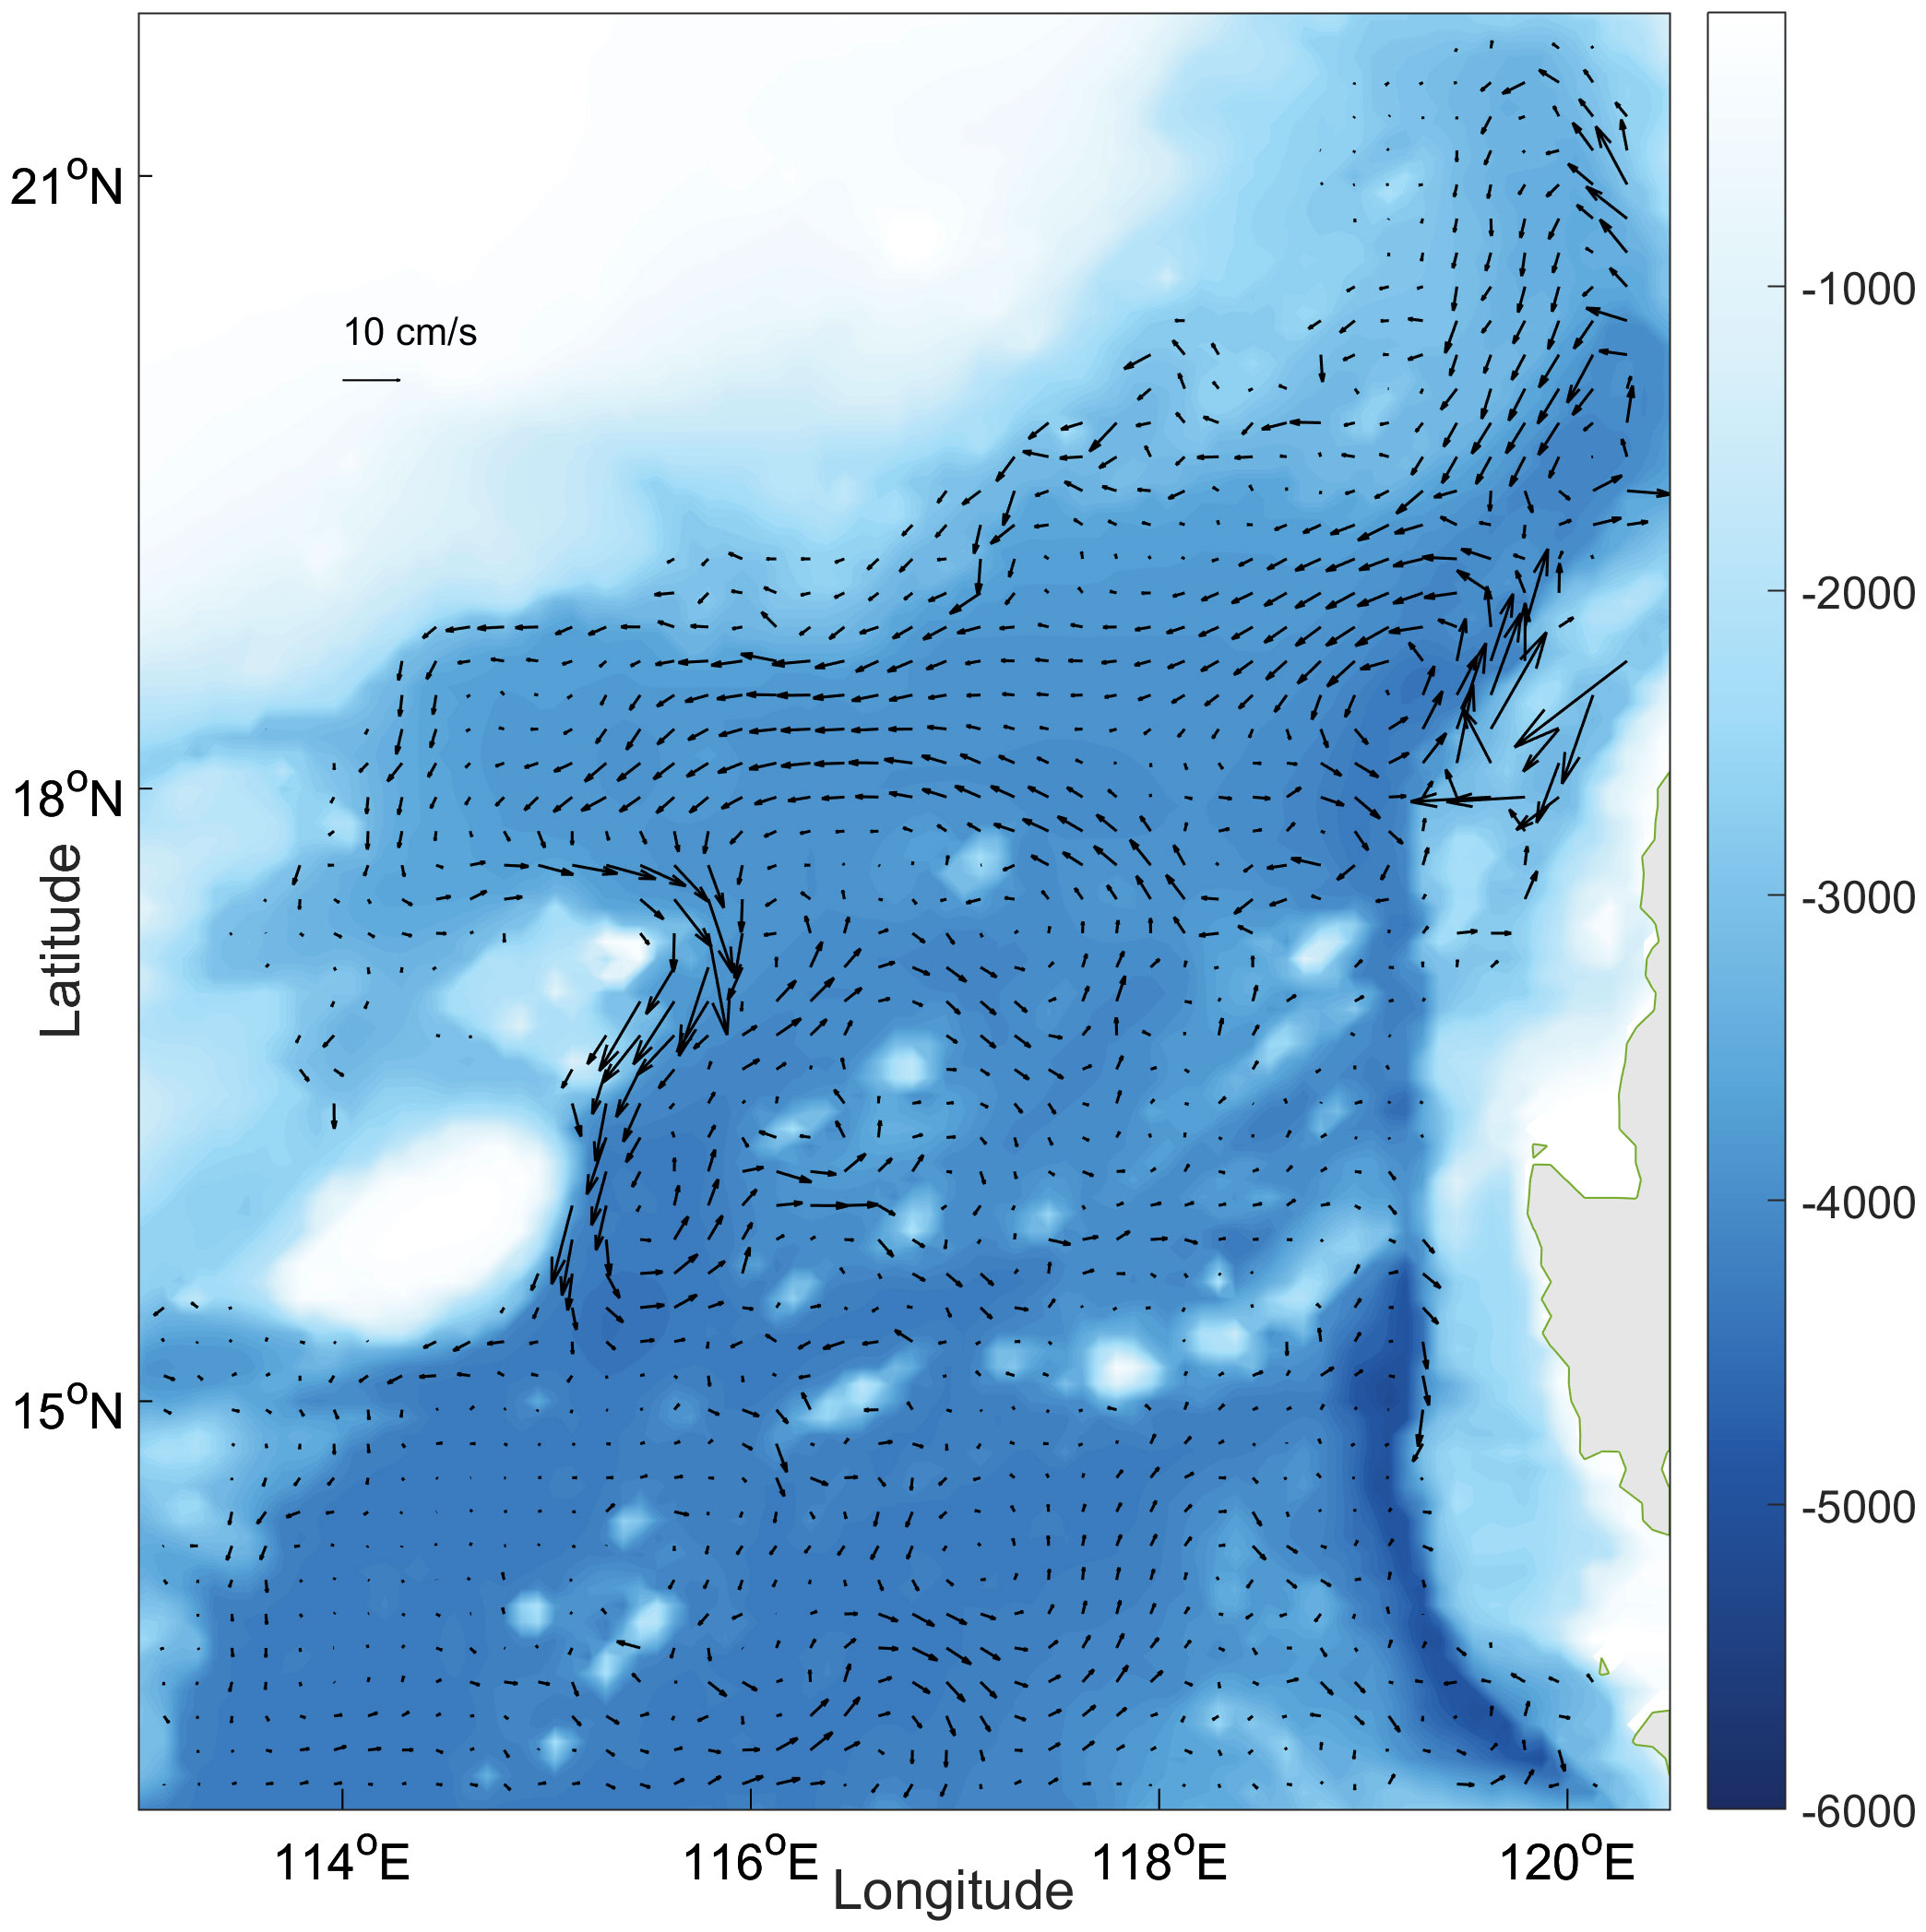
Figure 1 Spatial distribution of circulation at 3100 m layer in the SCS from the CTRL (vector, unit: cm/s), the color shaded represents the bottom topography.
According to Hopkins et al. (2019), the dynamics of the DWBC in the subpolar North Atlantic may be related to topographic Rossby waves and/or cyclonic eddies. Meinen et al. (2013) studied the structure of the DWBC based on five years mooring data in the Atlantic Ocean at 26.5°N, and suggested that some compensation of the DWBC in the western basin must occur in the eastern basin. Spingys et al. (2021) demonstrated that turbulent mixing plays an important role in the DWBC. Besides, the characteristics of the DWBC may be consistent with the atmospheric forcing in the North Atlantic (Pickart and Smethie, 1998; Handmann et al., 2018). Overall, the dynamical mechanism of DWBC is intricate and requires further investigation.
In this paper, we use an ocean general circulation model to discuss the three-dimensional characteristics of the DWBC and investigate the potential effect on the DWBC in the SCS. The paper is structured as follows: Section 2 presents a description of the ocean general circulation model. Section 3 describes the dynamics of the DWBC in the SCS. The three-dimensional features of the DWBC are then analyzed in section 4. In section 5, the simulated results of the factors on the DWBC are studied. Finally, a summary and discussion are provided in section 6.
2 Model
To study the three-dimensional DWBC in the SCS, we use the MIT General Circulation Model (MITgcm, Marshall et al., 1997) to simulate the deep SCS circulation. MITgcm is a numerical model designed for study of the atmosphere, ocean, and climate. It has a non-hydrostatic capability and can therefore be used to study both small-scale and large-scale processes; its adjoint capability allows it to be applied to parameter and state estimation problems. Finite volume techniques are employed yielding an intuitive discretization and support for the treatment of irregular geometries using orthogonal curvilinear grids and shaved cells in this model (Marshall et al., 1997). On the other hand, there are several uncertainties in MITgcm, such as atmospheric boundary conditions (Aran et al., 2016), geology and ice (Goldberg et al., 2020). In this study, these uncertainties are less important because the deep SCS circulation is not closely related to the atmosphere and sea ice.
The model domain extends from 99°E to 140°E in longitude and 5° S to 30°N in latitude with a horizontal resolution of 1/12°. A total of 30 vertical levels vary from 5 m at the top layer to 200 m below 500 m depth. Monthly mean climatological temperature and salinity data from GDEM (Carnes, 2009) were used to initialize the model. Additionally, surface flux data from the European Centre for Medium-Range Weather Forecasts (ECWMF) ERA-40 reanalysis for the period of 1996-2015 (Uppala et al., 2005) were used to force the model. The open boundary conditions were obtained from daily Simple Ocean Data Assimilation (SODA) data (Smith et al., 1992).
The control run (CTRL) involved running for 100 years to reach a steady state and then it was run for another 20 years. The climatological mean result is presented in Figure 1. It shows that the deep circulation in the SCS is significantly cyclonic with a substantial DWBC, indicating that the model can be applied to the deep SCS circulation (Wang et al., 2011; Tian and Qu, 2012; Lan et al., 2015).
3 Dynamics of the DWBC in the SCS
This section analyzes the factors affecting the DWBC in the SCS by using theories such as Stommel (1948); Munk (1950); Charney (1955), and Morgan (1956) that study the upper western boundary currents. The goal is to investigate the dynamic process of the DWBC in the SCS. Here is the equation that takes into account bottom friction and lateral friction (Equation 1):
Where x, y, and z are zonal, meridional, and vertical coordinates and u, v, and w are the horizontal and vertical velocity components, respectively; f =f0+βy is the Coriolis parameter; ρ and p are the density and pressure; r and Ah are the bottom and lateral friction coefficient. The streamfunction Ψ is introduced after cross differential vertical integration (Equation 2):
Then the quasi-geostrophic potential vorticity equation is obtained in the form of streamfunction:
In this formula, to In the Equation 3, the first term is the local time variation term, the second term is the inertia term (nonlinear term), J is the Jacobian determinant, and the third term is the β term. The fourth term is the vertical upwelling term, H is the thickness of the water column, the fifth term is the bottom friction term, and the sixth term is the lateral friction term. After dimensionless:
Where and . U, W, L are the dimensions of (u, v), w, and (x, y), respectively.
Assuming that the bottom friction is very important, Equation 4 becomes:
The above equation to The Equation 5 is a second-order ordinary differential equation, and the solution is:
The above formula shows that v increases as δS decreases, that is, the DWBC increases as bottom friction coefficient decreases. Similarly, when the lateral friction is important:
Equation 7 shows that the DWBC decreases as δM and the lateral friction coefficient increases. Assuming that the deep layer is strongly mixed (Tian et al., 2009; Yang et al., 2016; Wang et al., 2021), w is the large term in this case:
It shows that the intensity of the DWBC increases with the increase in the mixing (w). To better study the three-dimensional distribution characteristics of the DWBC in the SCS, this study will discuss its related dynamics with the MITgcm model, in combination with the dynamic processes mentioned above.
4 Three-dimensional features of the DWBC in the SCS
The DWBC, as the name suggests, is a stable, strong, and persistent current along the western boundary in the deep layers. The DWBC in the SCS should be considered as a system (Tian and Qu, 2012; Wang et al., 2019). Therefore, this study characterizes the DWBC system as having negative zonal velocity north of 18°N along the northern boundary, negative meridional velocity west of 116.5°E along the western boundary, and positive zonal velocity south of 16°N along the southern boundary deeper than 1900 m in the models. Based on these rules, the DWBC originates near the inlet of the Luzon overflow and flows westward along the northern boundary. It then turns and flows southward along the western boundary at the northwestern corner of the deep SCS. After reaching the southern boundary, the DWBC turns east and finally ends at the southern boundary (Figure 2).
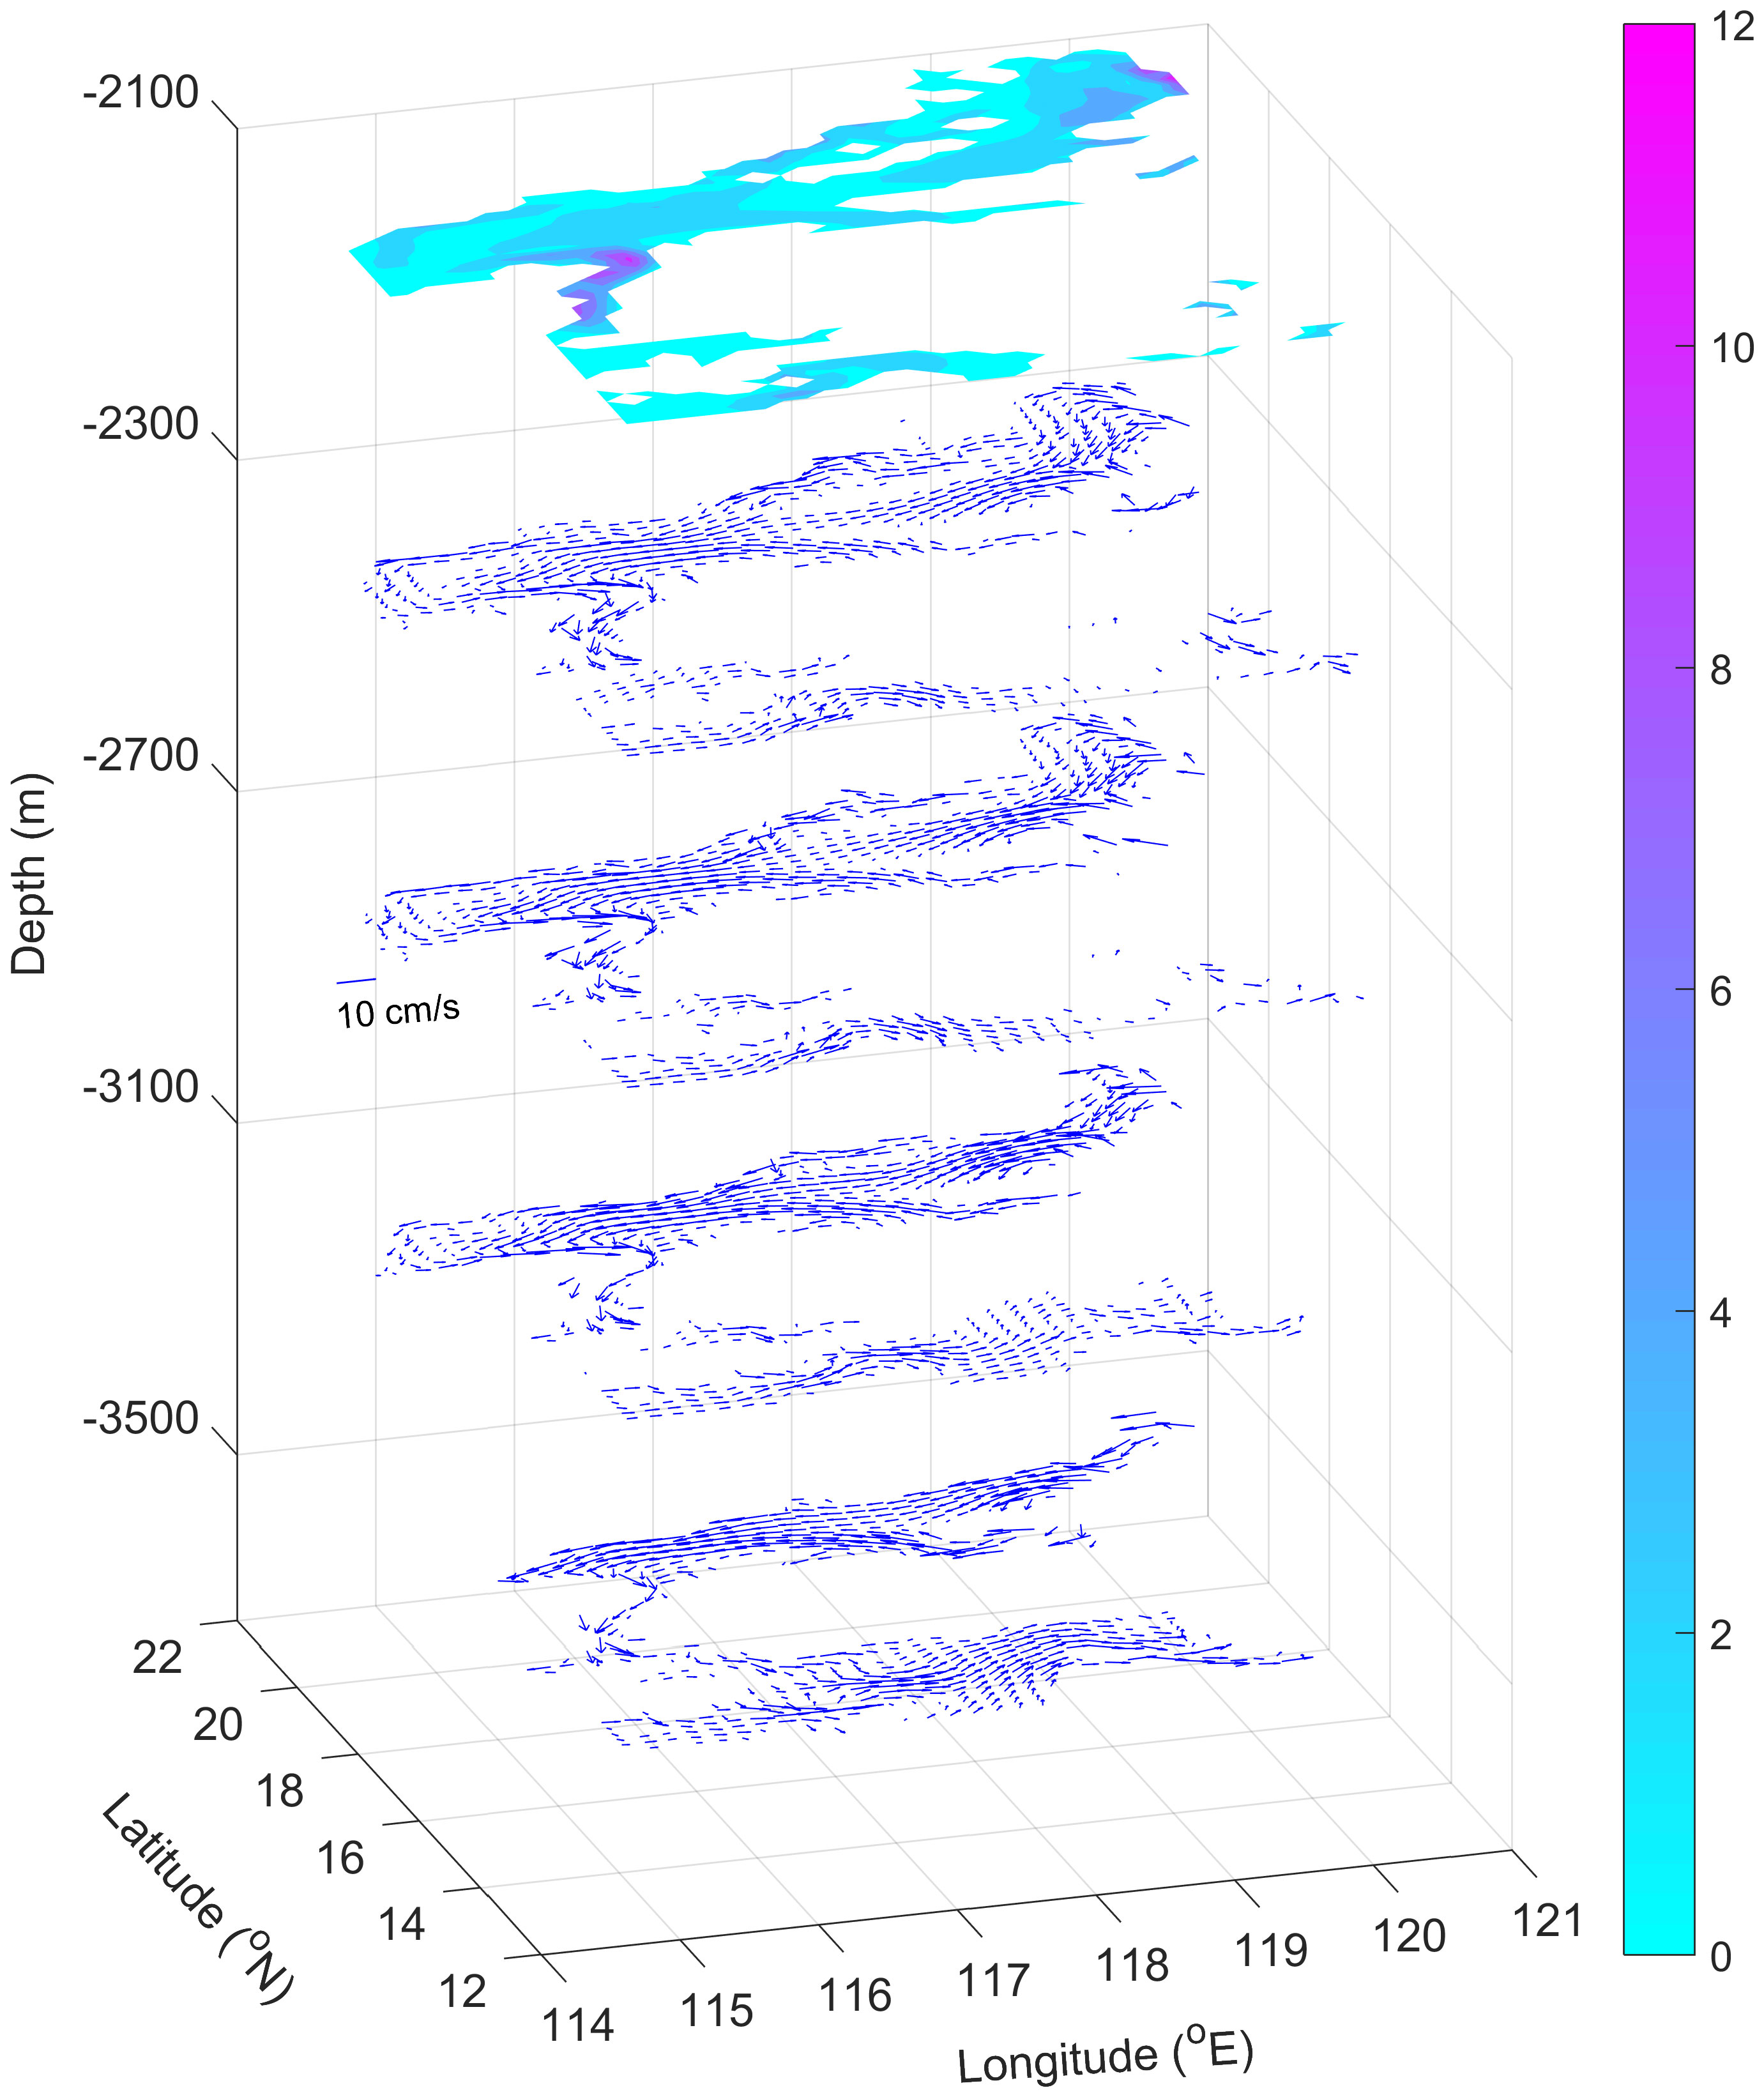
Figure 2 Three-dimensional DWBC velocity (vector and shaded, unit: cm/s) distribution in the SCS from CTRL.
The main characteristics of the DWBC in the SCS of CTRL are as follows: 1) Intensity, characterized by the current velocity. The mean current velocity is 4.78 cm/s, with the maximum velocity at the western boundary along 16-17°N, reaching up to 12 cm/s. 2) Thickness, the difference between the depth of the lower boundary and the upper boundary. It ranges from a minimum of 200 m, predominantly located at the shallow boundary, to a maximum of over 2000 m with an average thickness of about 1645 m. 3) Width, the width of the DWBC decreases from top to bottom and ranges from 18 km to 250 km, with an average width of 140 km. Coincidentally, the model results of the current velocity, thickness, and width of the DWBC are generally consistent with the mooring observations (Zhou et al., 2017; Zhou et al., 2020a). This further supports the feasibility of the model.
5 Factors of the DWBC in the SCS
A total of five experiments are conducted in this section to investigate the factors affecting the DWBC in the SCS. Table 1 provides a description of each experiment. In general, the results of all experiments indicate presence of the basic cyclonic circulation and the DWBC in the deep SCS. Specifically, when the deep Luzon overflow is closed, the structure of cyclonic circulation and the DWBC are significantly weakened (Case 1, Figure 3A). The strong mixing experiment (Case 2, strong vertical diffusion rate experiment, Figure 3B) shows a stronger deep circulation and a more significant DWBC. Results from the friction coefficient experiments (Case 3-4, Figures 3C, D) suggest that the increase in friction coefficient weakens the deep circulation, but the effect is not significant.
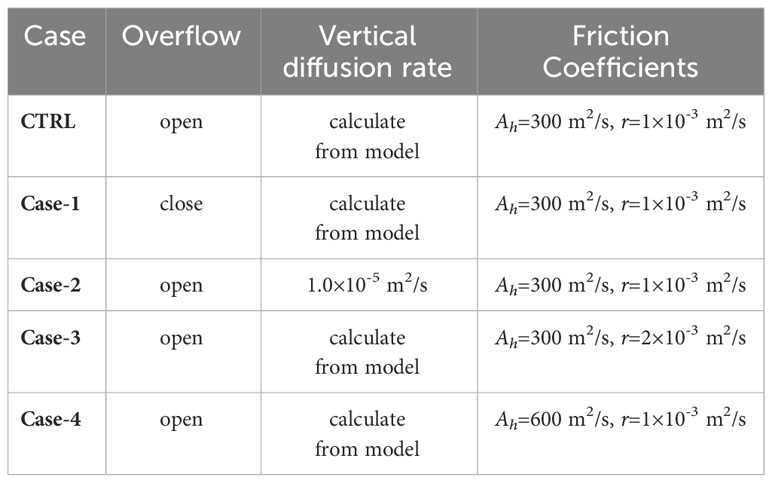
Table 1 Details of the numerical experiment.
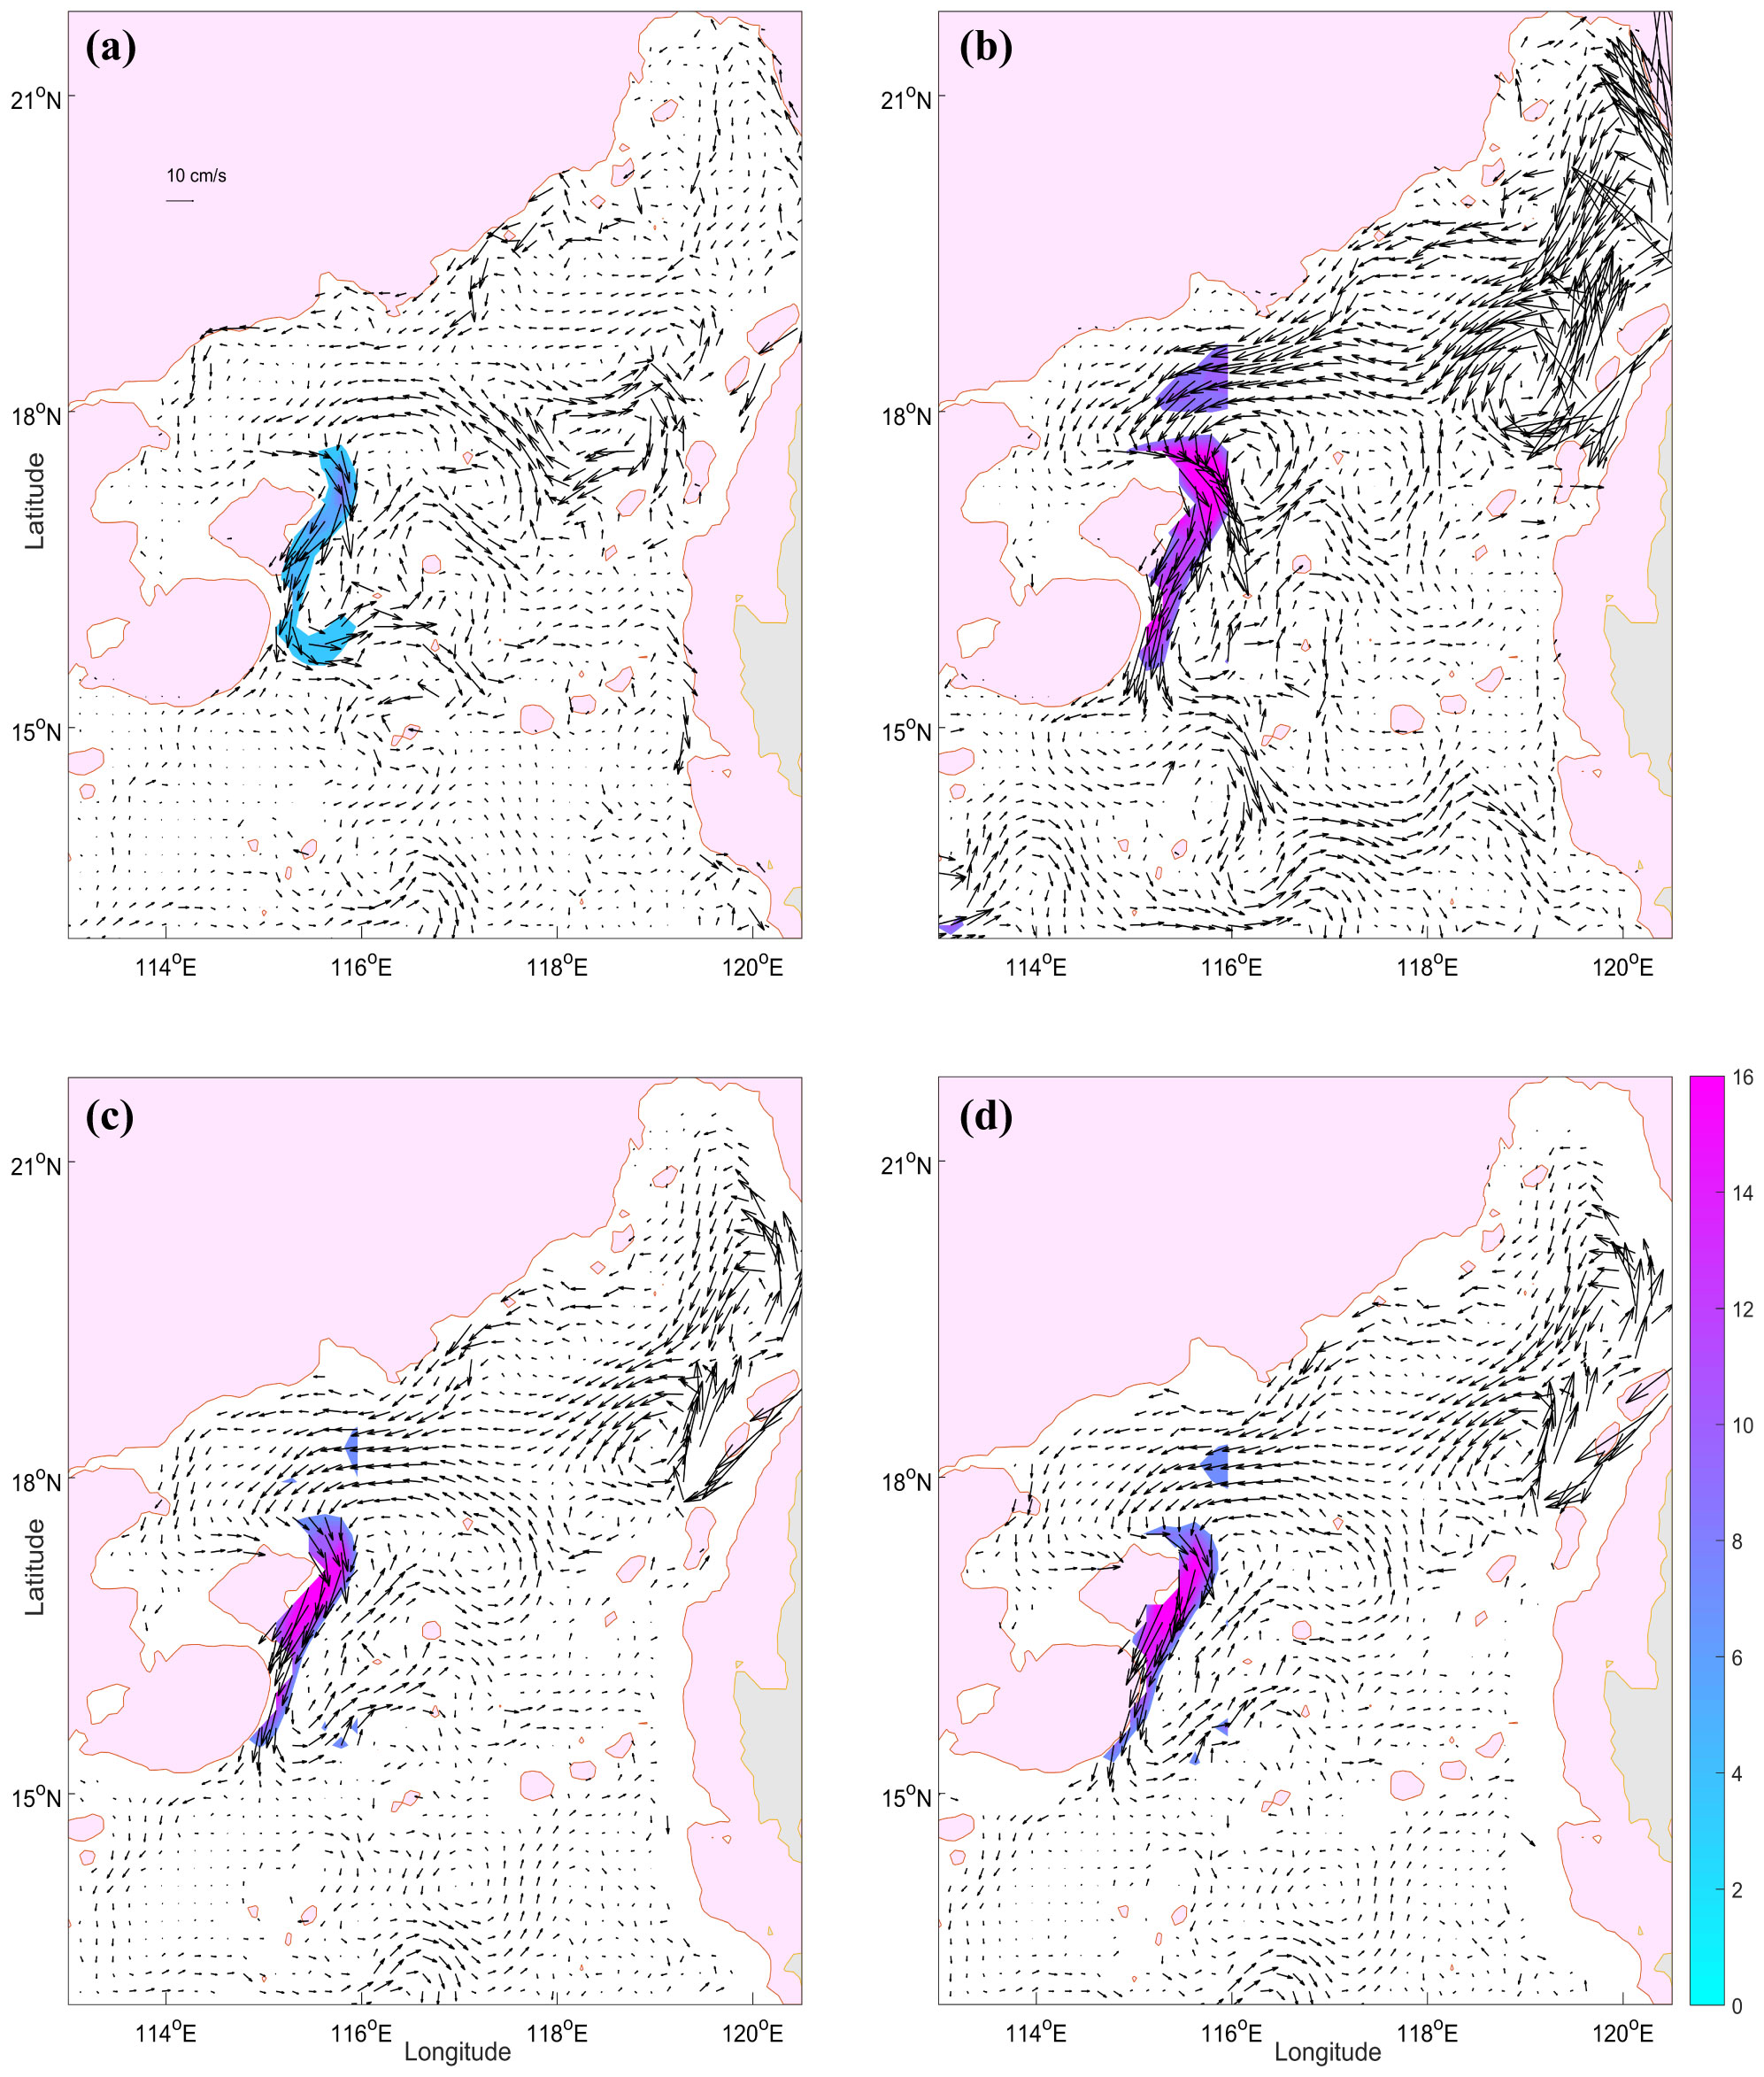
Figure 3 Spatial distribution of circulation at 3100 m layer in the SCS from Case 1-4 (A–D), unit: cm/s, the color shaded is the velocity of the significant DWBC along the western boundary.
5.1 Intensity
First, the influence on the intensity of the DWBC in the SCS is discussed. Here, the intensity of the DWBC was characterized by the averaged southward meridional velocity along the 16-17°N at 3100 m layer. The reason is that the DWBC along 16-17°N is significant (Figure 1 and color shaded in Figures 2, 3, Zhou et al., 2017; Zhou et al., 2020a), which is representative. The maximum velocity distribution of the whole DWBC system in the CTRL is calculated (Figure 4). It can also be seen that the maximum velocity of the DWBC appears between 16-17°N along the western boundary, with a velocity of about 12 cm/s. In this context, we have presented the strength of the DWBC from 2100 to 4100 m layer of each experiment (Figure 5). In general, the deeper the depth, the greater the velocity, and the stronger the intensity of the DWBC, which obviously shows the characteristics of bottom intensification. The average velocity of the DWBC in the CTRL is about 5.86 cm/s.
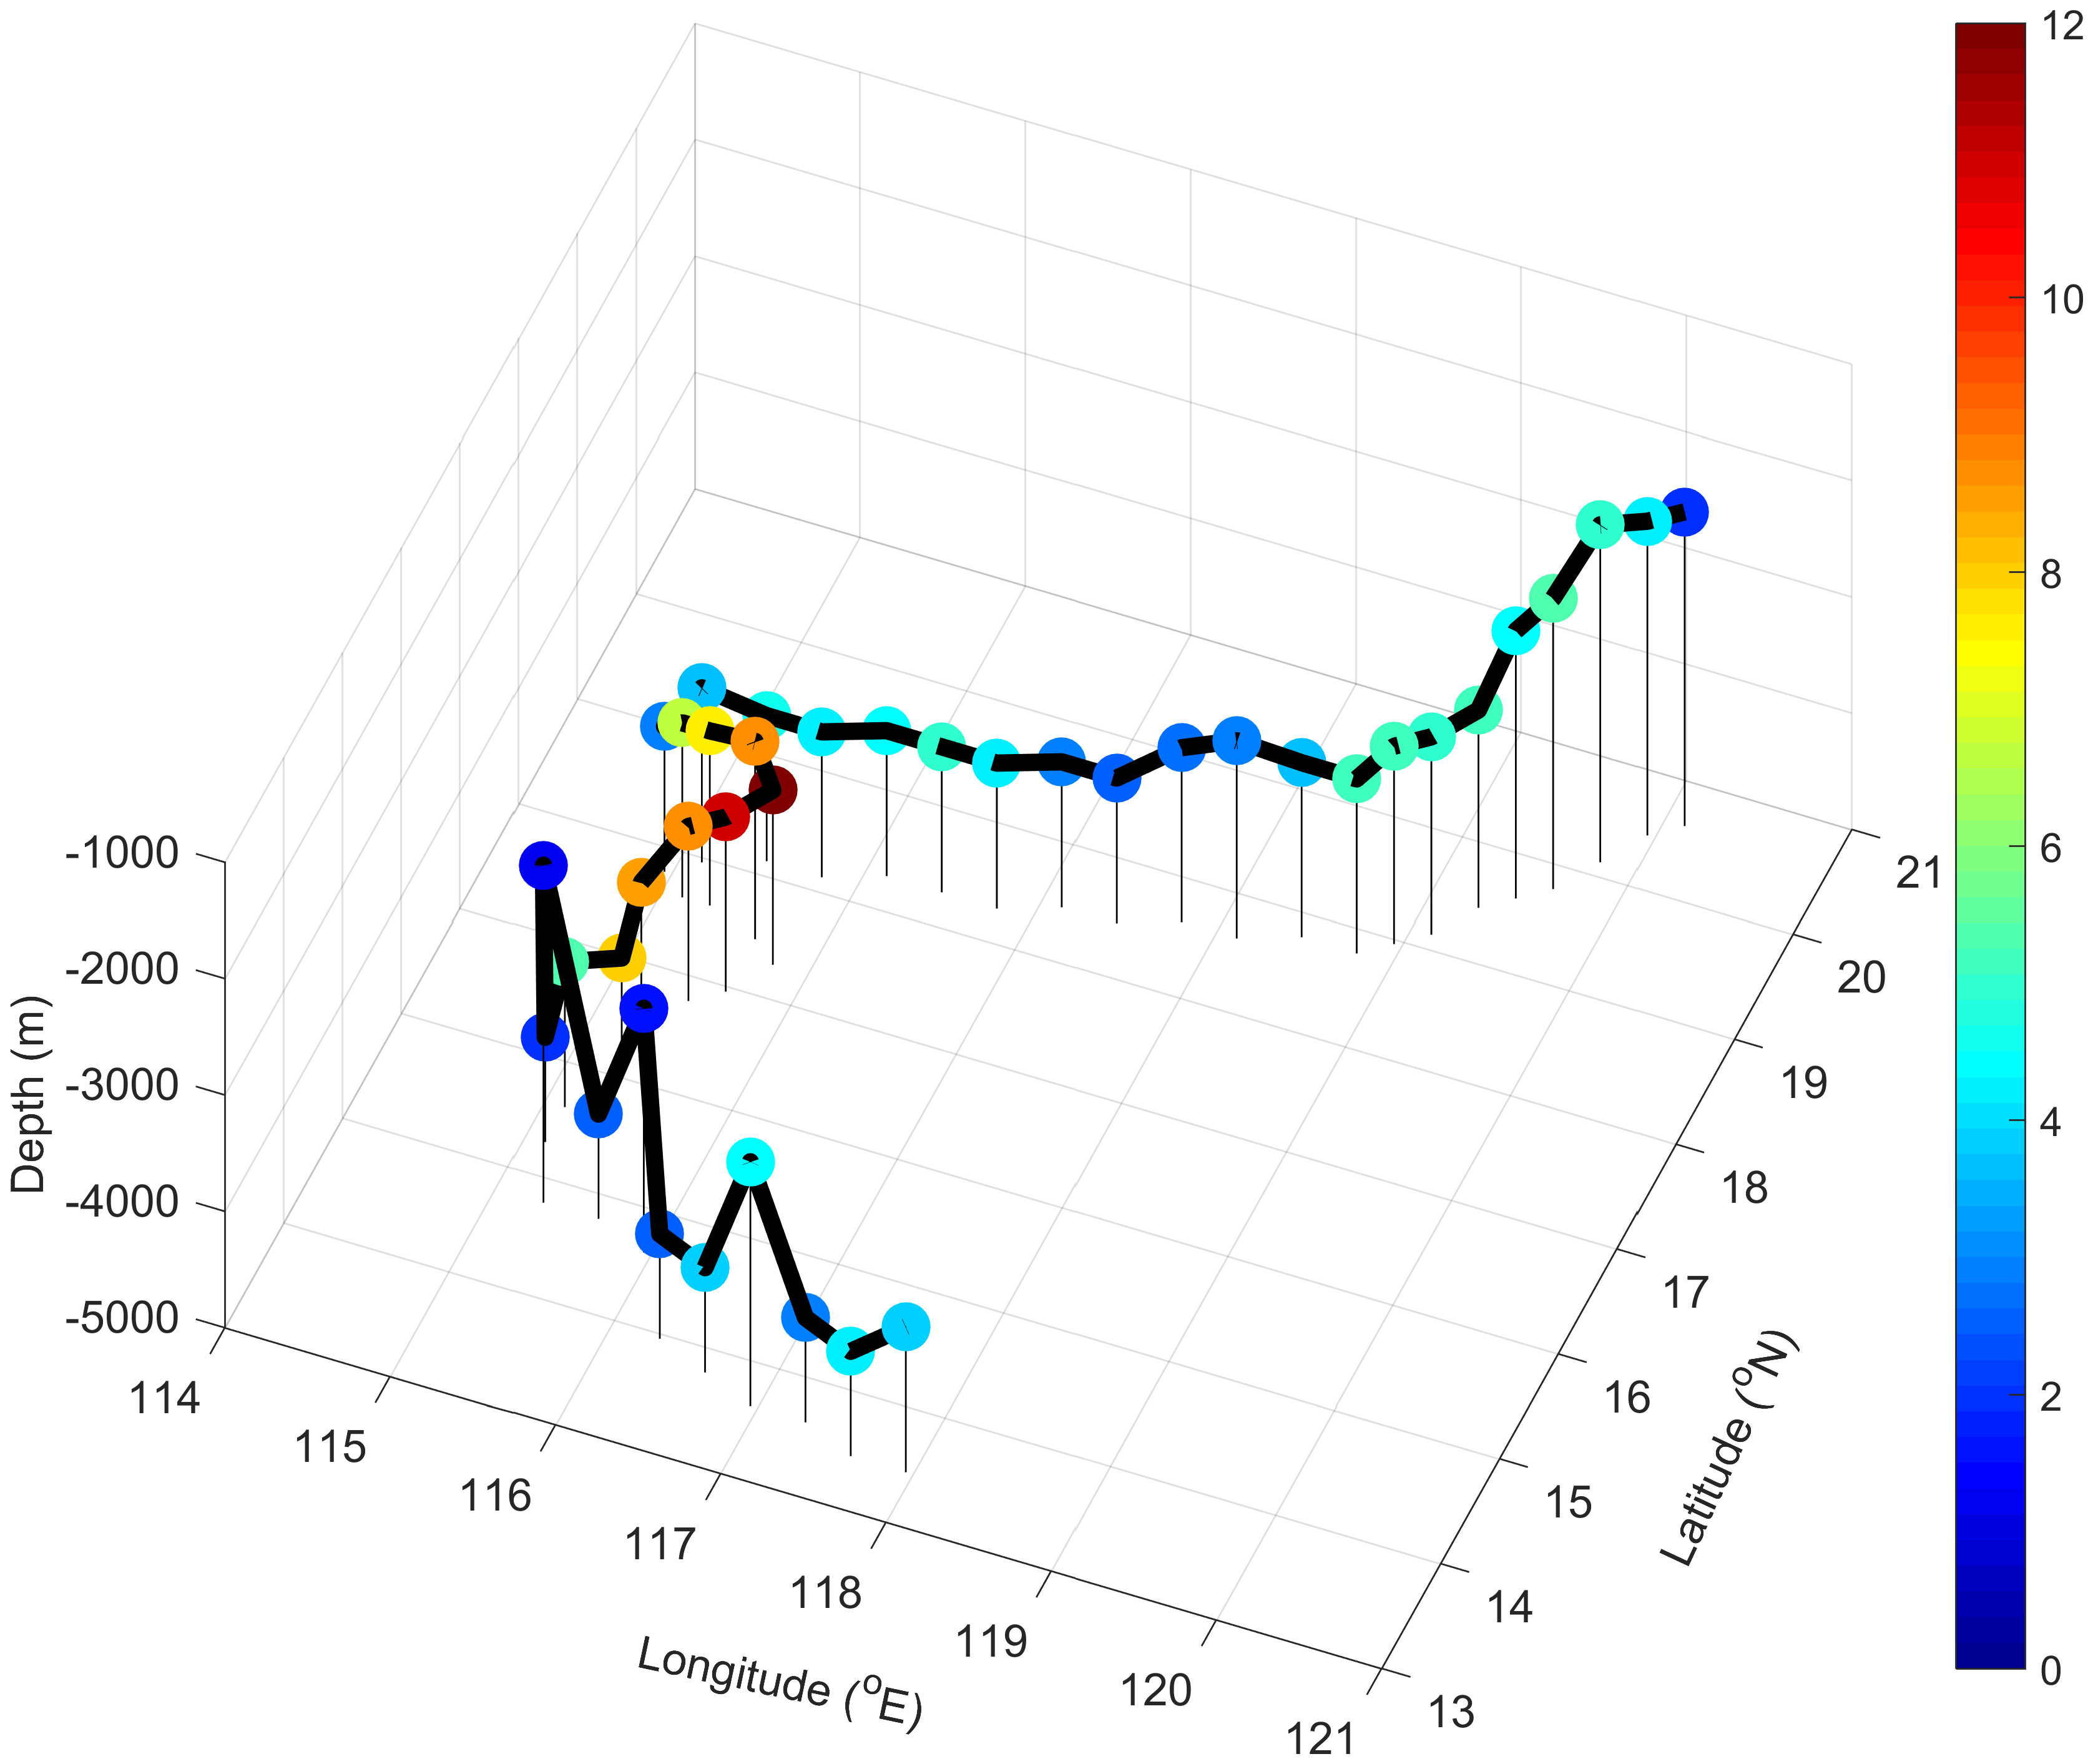
Figure 4 Three-dimensional maximum velocity of the DWBC in the SCS from CTRL (unit: cm/s).

Figure 5 Intensity statistics of the DWBC along 16°Nof each layer in each case (cm/s).
The DWBC, with an average velocity of 3.53 cm/s, is apparently weakened after the closure of the deep Luzon overflow (Figure 5). This indicates that the deep Luzon overflow plays a critical role in the DWBC. Once the deep Luzon overflow is closed, it means that the driving force (source) is significantly weakened, leading to a decrease in the intensity of the DWBC in the SCS. The strong mixing experiment remarkably enhances the DWBC as expected, with an average velocity of about 9.11 cm/s. Combined with the Equation 8, this suggests that the strong mixing can significantly enhance the DWBC in the deep SCS. The model results also show that the DWBC is weakened by the friction coefficient, with average velocities of 5.36 cm/s and 5.22 cm/s in Case 3 and Case 4, respectively. On the whole, both the bottom friction coefficient and the lateral friction coefficient cases show that a larger friction coefficient results in a weaker the DWBC intensity is, which is in line with the Equations 7, 8.
Further calculation of the transport of the DWBC reveals that the intensity of the CTRL, Case 1-4 is 3.2 Sv, 1.9 Sv, 4.9 Sv, 2.9 Sv, and 2.8 Sv, respectively, which corresponds to the results of the intensity of the DWBC. By integrating the model results with the Equations 6–8, the intensity function of the DWBC in the SCS can be derived: Intensity = F (source, mixing, -lateral friction, -bottom friction, other). This formula illustrates that the intensity of the DWBC is tied to the source, mixing, lateral friction, and bottom friction and has a positive, positive, negative, and negative correlation relationship, respectively. An increase in the source, stronger mixing, lower bottom friction, and lower lateral friction will result in a stronger DWBC in the SCS.
5.2 Thickness
This section discusses the thickness characteristics of the DWBC. In the CTRL, the DWBC’s upper boundary depths (referring to the interface between the DWBC and the middle SCS circulation, as well as the interface where the upper layer of the DWBC flows in the opposite direction) are primarily found at the 2100 m layer (indicated by the black circle in Figure 6), and the lower boundary depths (referring to the interface where the lower layer of the DWBC flows in the opposite direction, or the bottom boundary if the flow direction of the lower layer has not yet reversed) are usually situated below 3750 m (see the warm colored circle in Figure 6). The thickness distribution of the DWBC is obtained from the difference between the depth of the lower boundary and the upper boundary (the cold colored circle in Figure 6). The average thickness of the DWBC is approximately 1645 m.
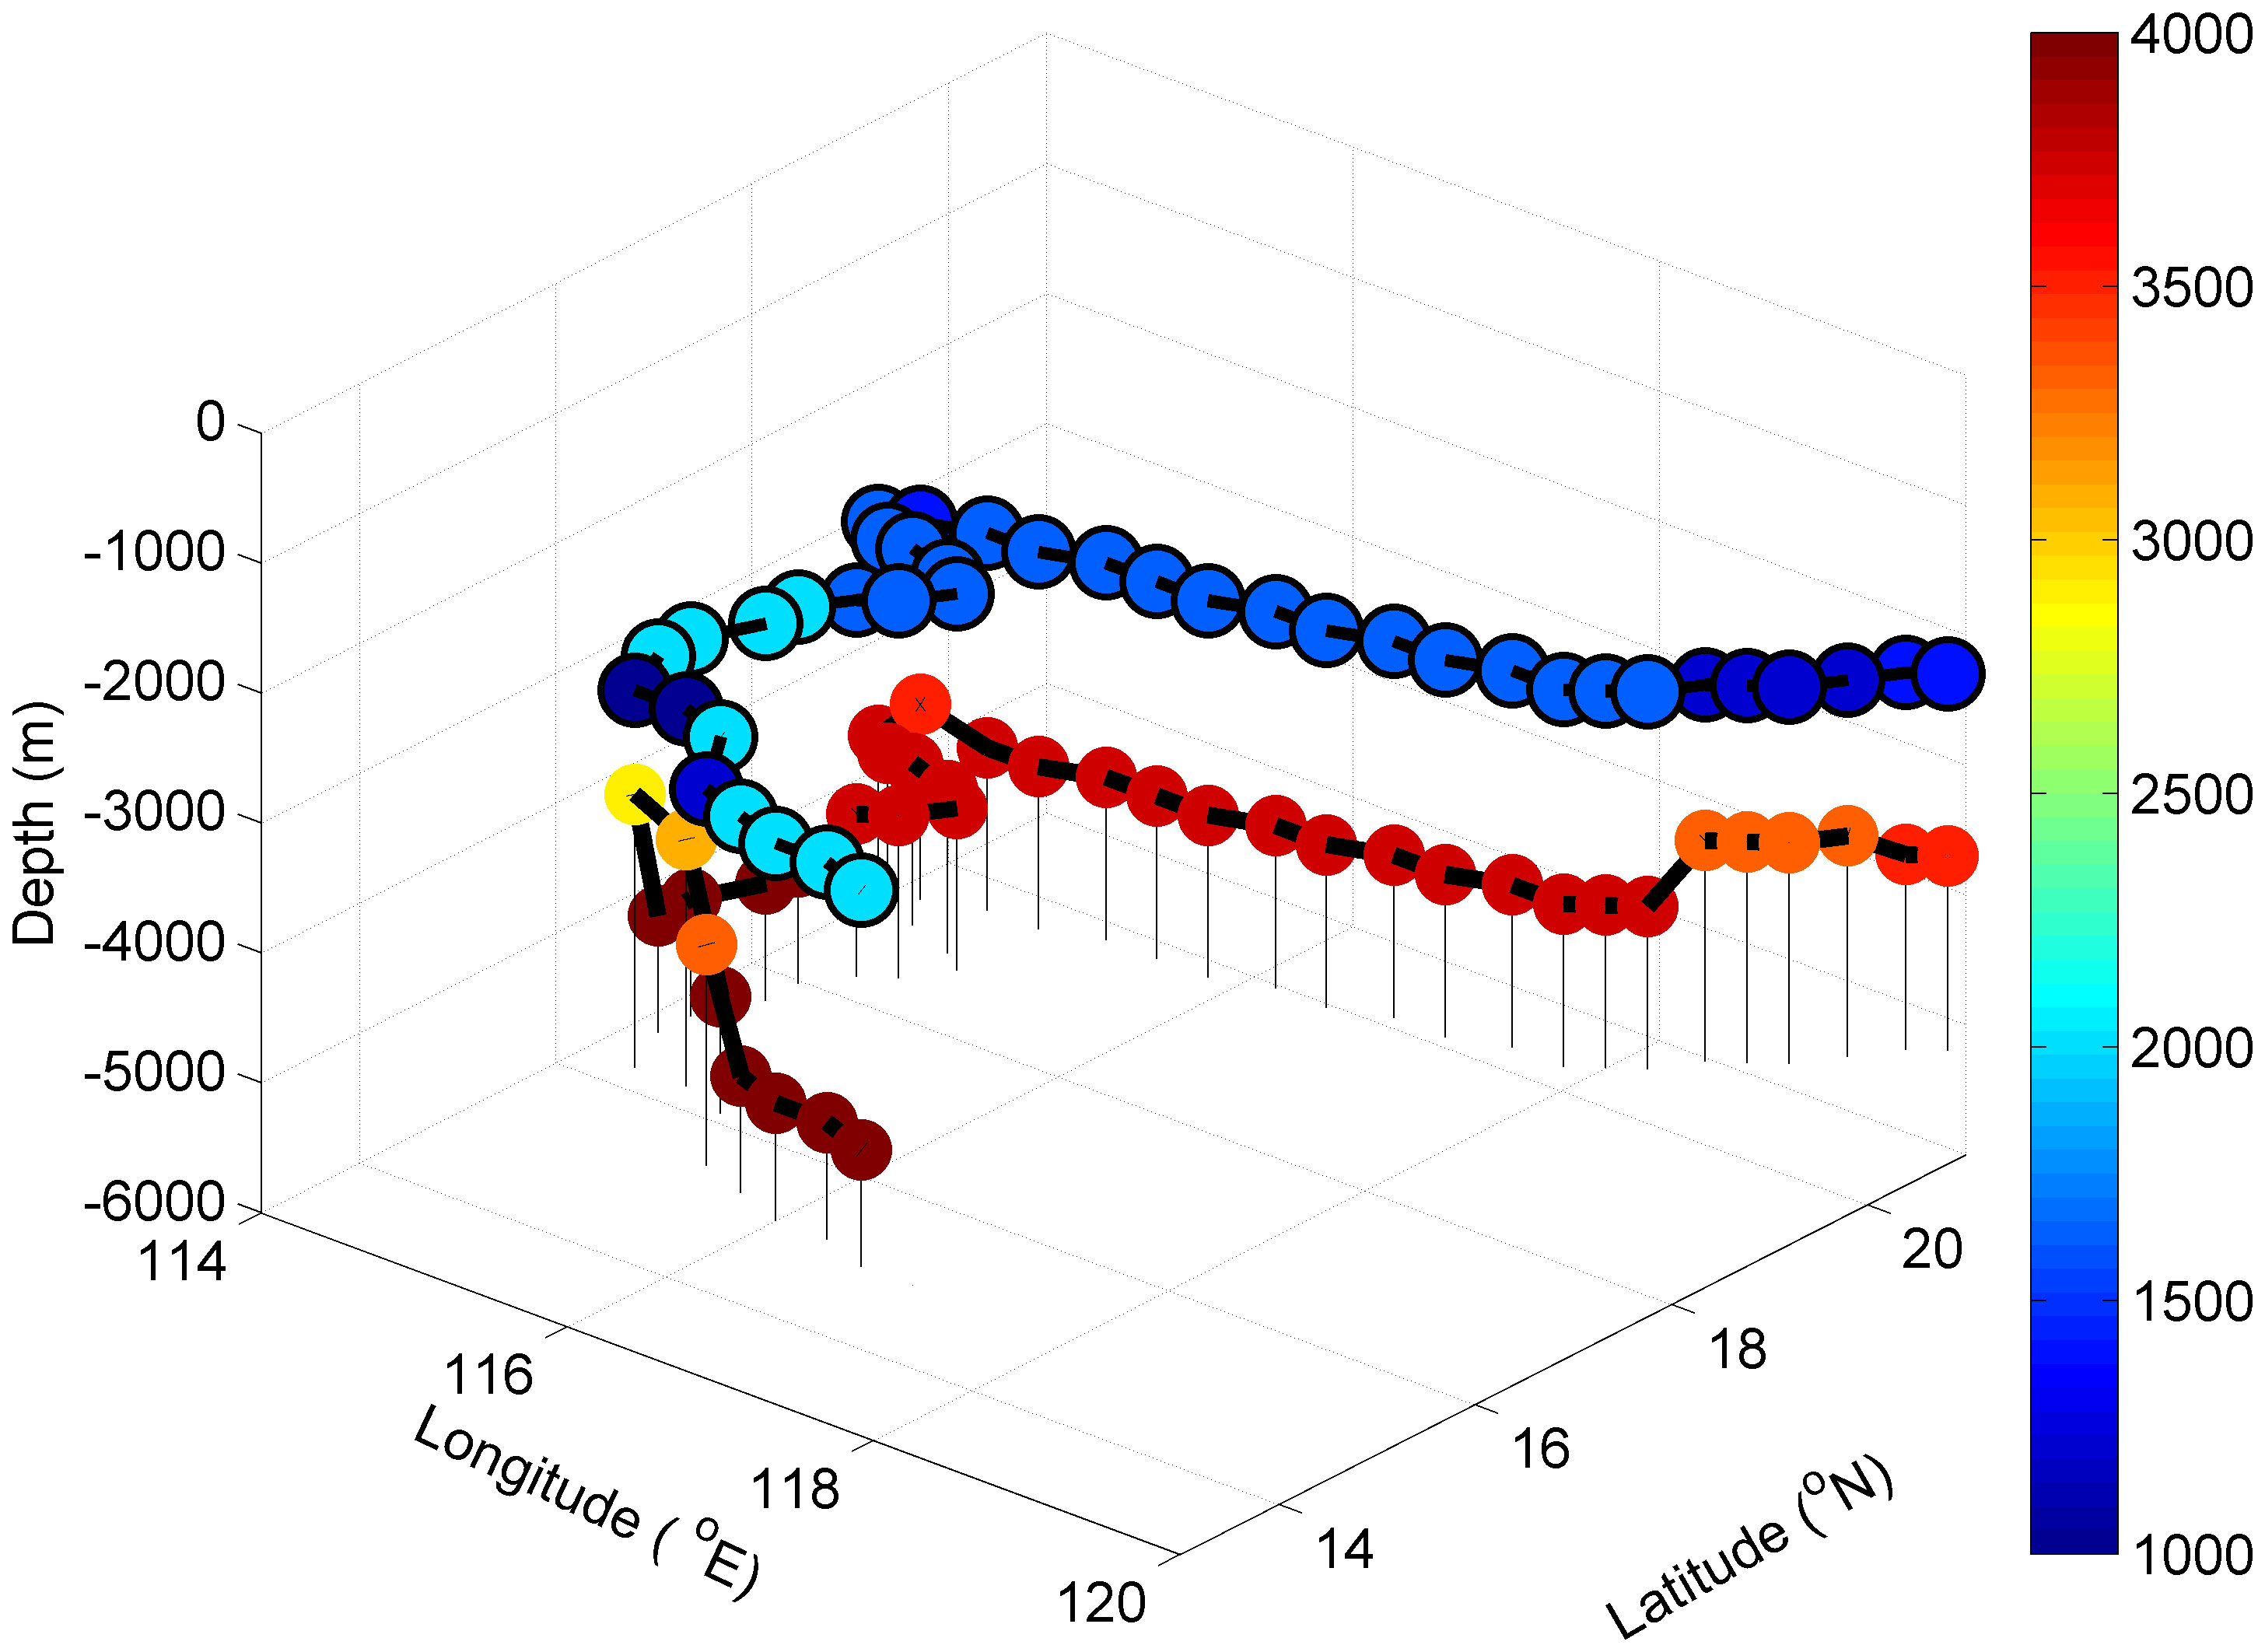
Figure 6 Three-dimensional upper boundary depth (the black circle), lower boundary depth (the warm color circle), and thickness (the cold color circle) of the DWBC in the SCS from CTRL (unit: m), the dots are from Figure 4.
Regarding the deep Luzon overflow closure, the thickness of the DWBC decreases with the weakening of its intensity. On average, the thickness is about 1264 m. In some places, the DWBC’s thickness cannot be measured due to its weakening. In the case of strong mixing, the DWBC has strengthened significantly, but its thickness has increased only slightly, with an average of 1702 m. As for Case 3 and Case 4, the mean thickness of the DWBC in the SCS is approximately 1590 m and 1585 m (Figure 7), which indicates that the thickness remains unaffected by the friction coefficients.
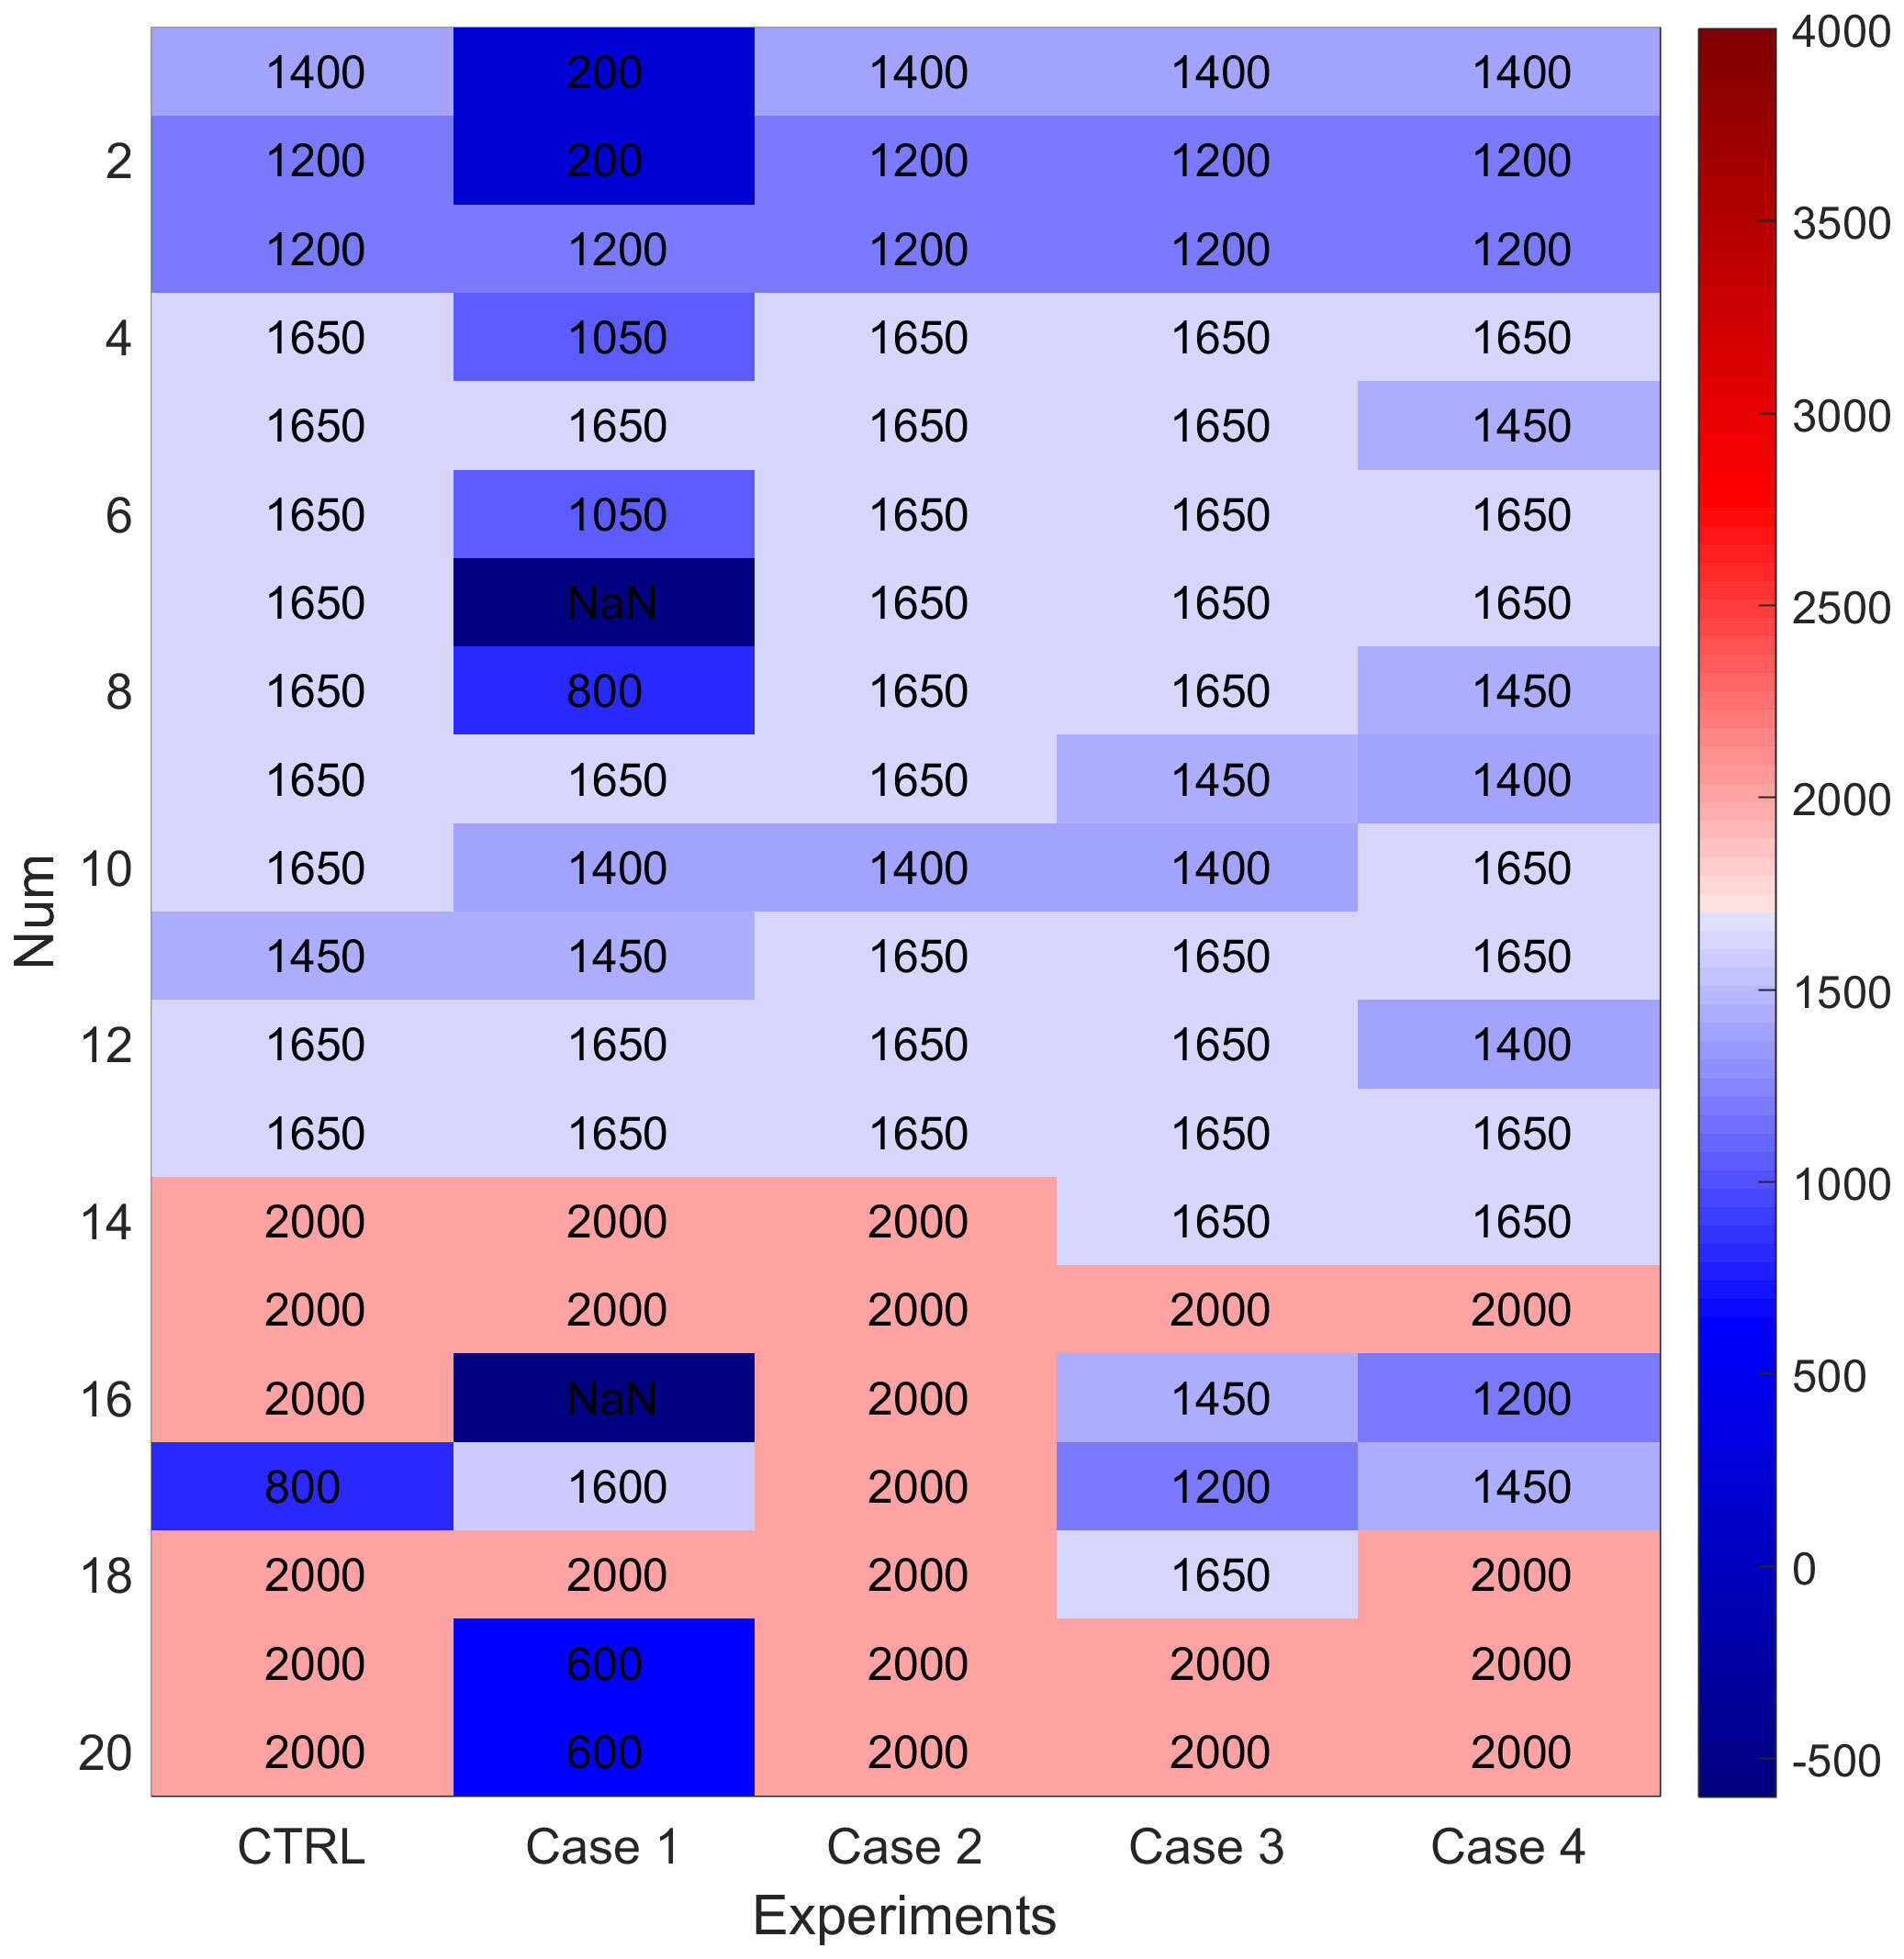
Figure 7 Mean thickness along the DWBC in each case (m), the Num is the number of dots in Figure 4 running from north to south.
In addition, a correlation between the water depth and the DWBC thickness was also calculated in the CTRL. The results show a high correlation coefficient of 0.8. In other words, there is a significant relationship between the DWBC thickness in the SCS and the water depth. As the water depth increases, the thickness of the DWBC also increases. In summary, it can be concluded that the water depth and source are the main factors impacting the DWBC thickness in the SCS. A thicker DWBC appears as the water depth increases and with more sources.
5.3 Width
The width of the DWBC in the SCS generally shows the characteristics of narrowing from shallow to deep (Figure 8). The width of the northern boundary is the widest at about 250 km, and the western boundary is the narrowest with a width of less than 50 km. The average width of the DWBC is about 141 km. Following the intensity of the DWBC, we also use the 16°N section as an illustration to discuss the influence on the DWBC’s width.
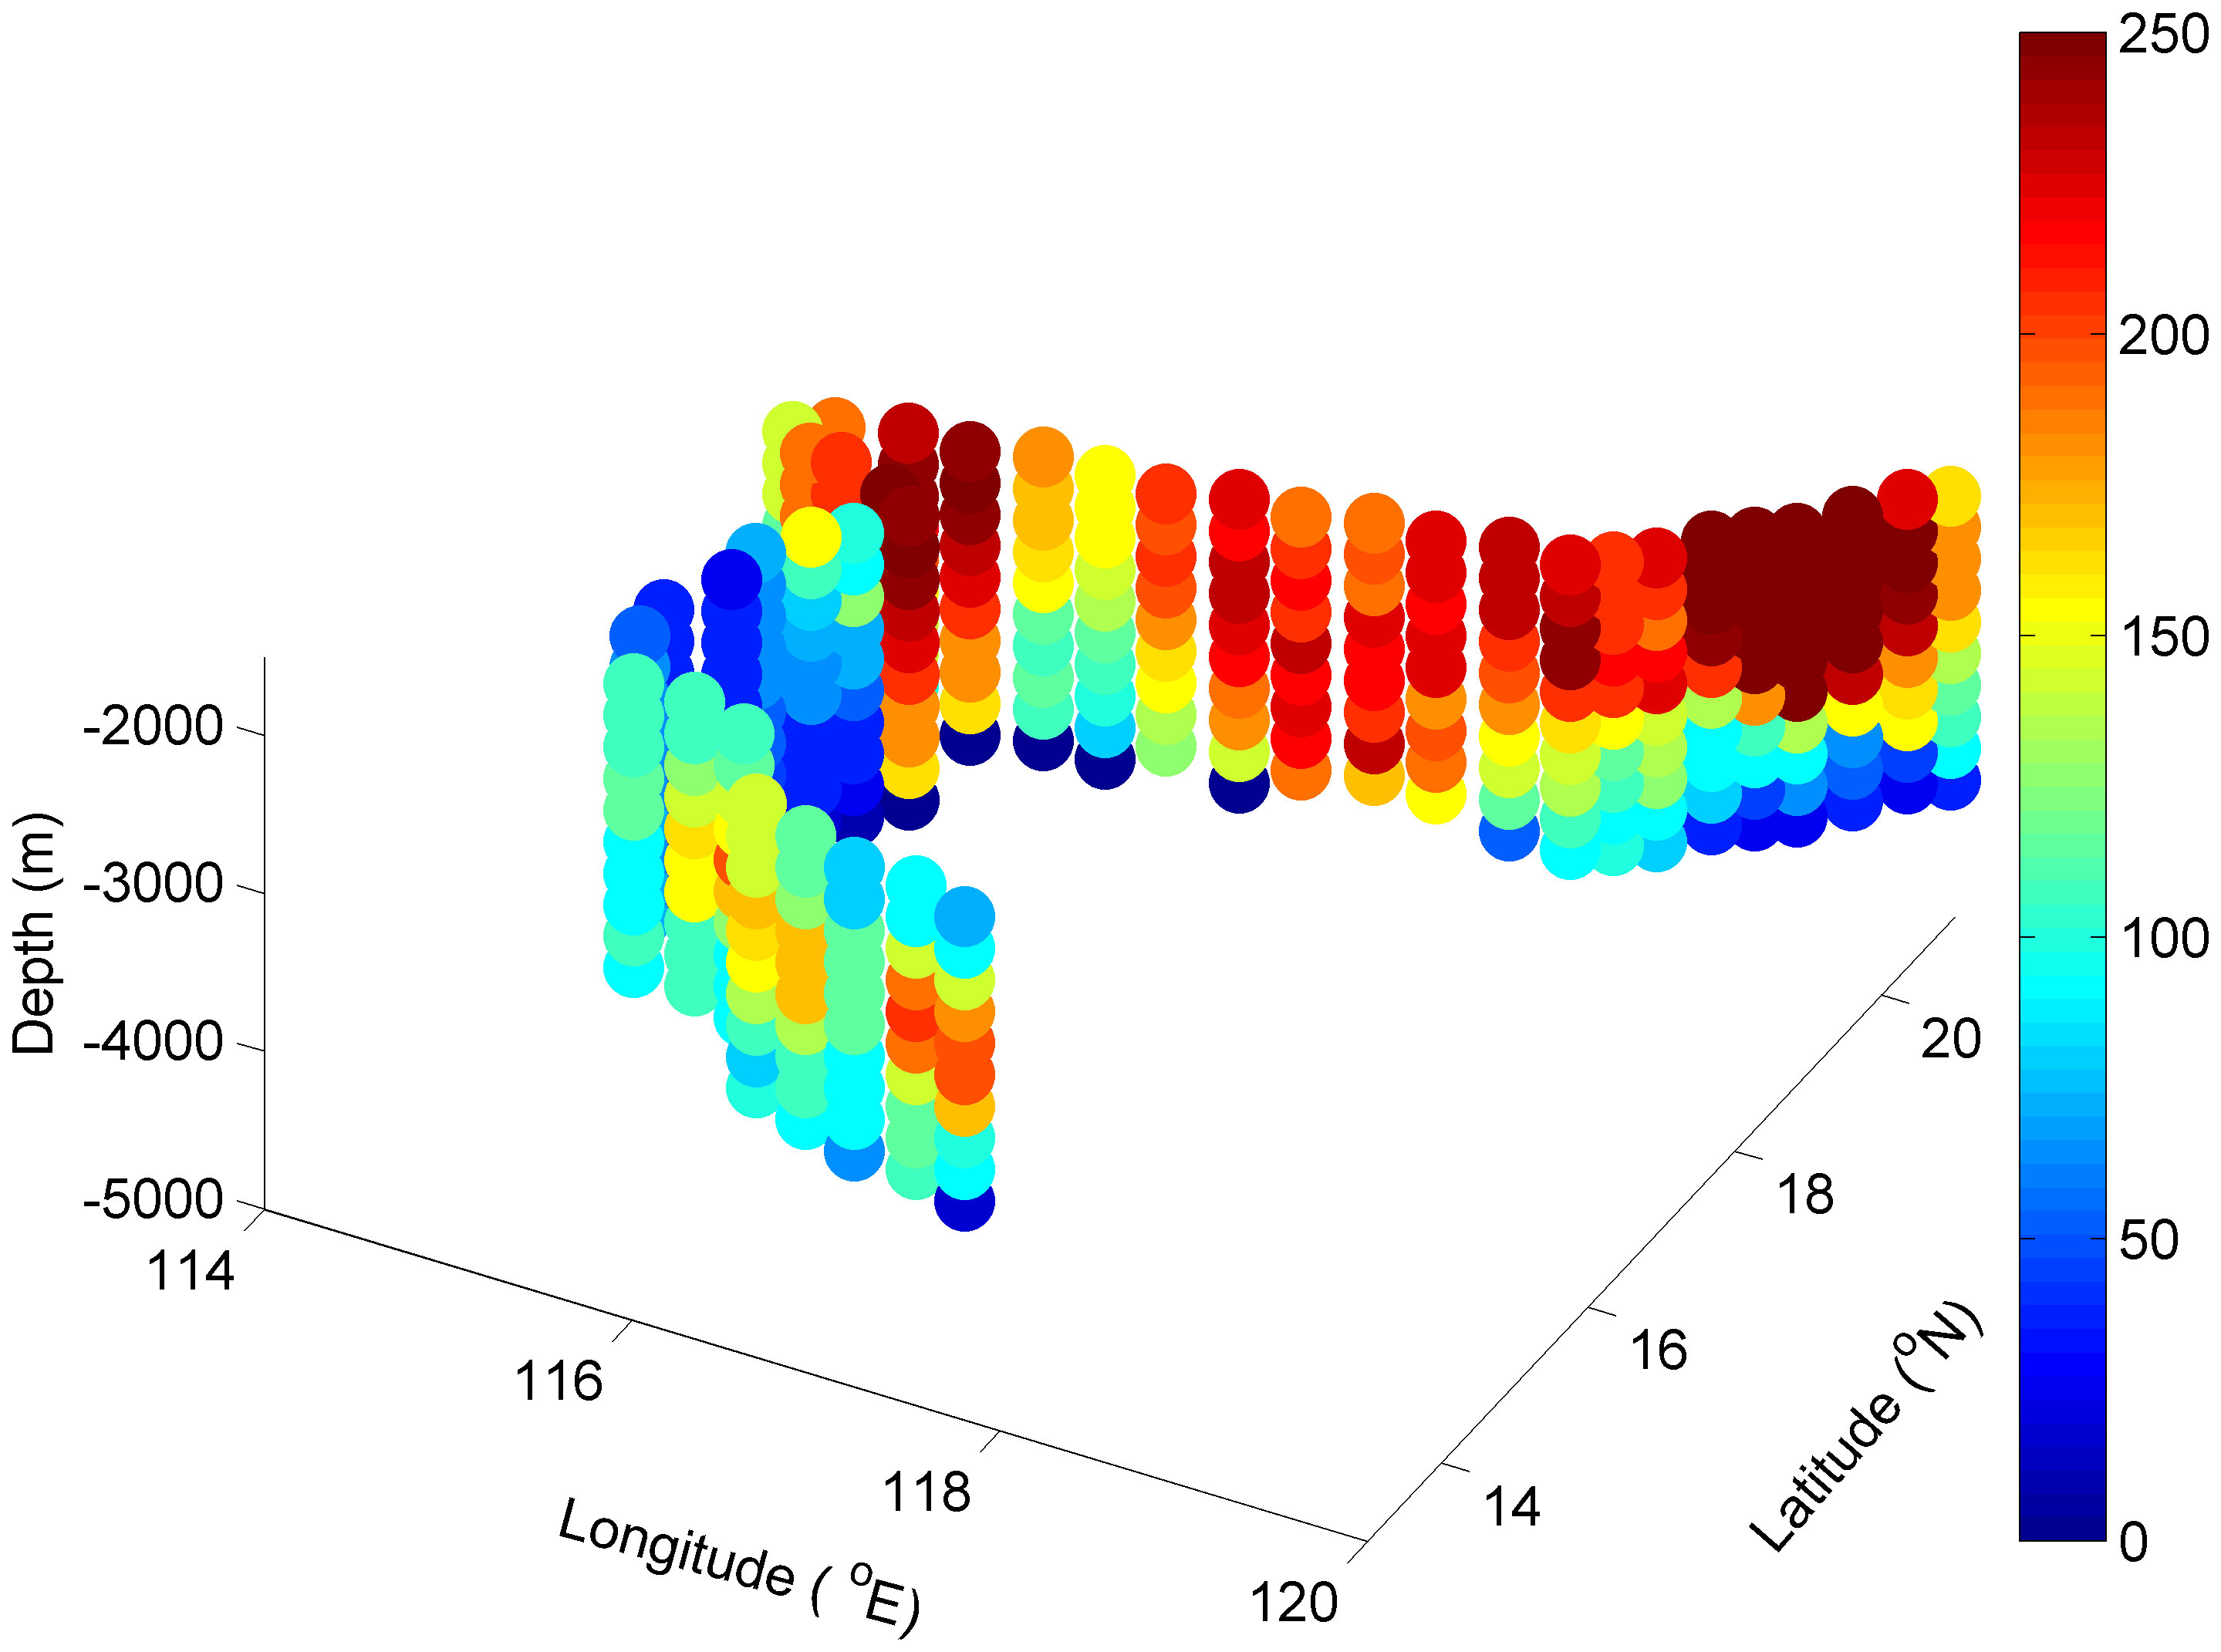
Figure 8 Three-dimensional width of the DWBC in the SCS from CTRL (unit: km), the dots are from Figure 4.
In the Case 1, the width of the DWBC narrows significantly with decreasing intensity and averages about 104 km (Figure 9). In the strong mixing experiment, the width of the DWBC increases with increasing intensity and averages about 149 km. For Case 3 and Case 4, the friction coefficients have a negative effect on the width of the DWBC, with average widths of about 138 km and 136 km, respectively. In general, the width of the DWBC increases with its strength.
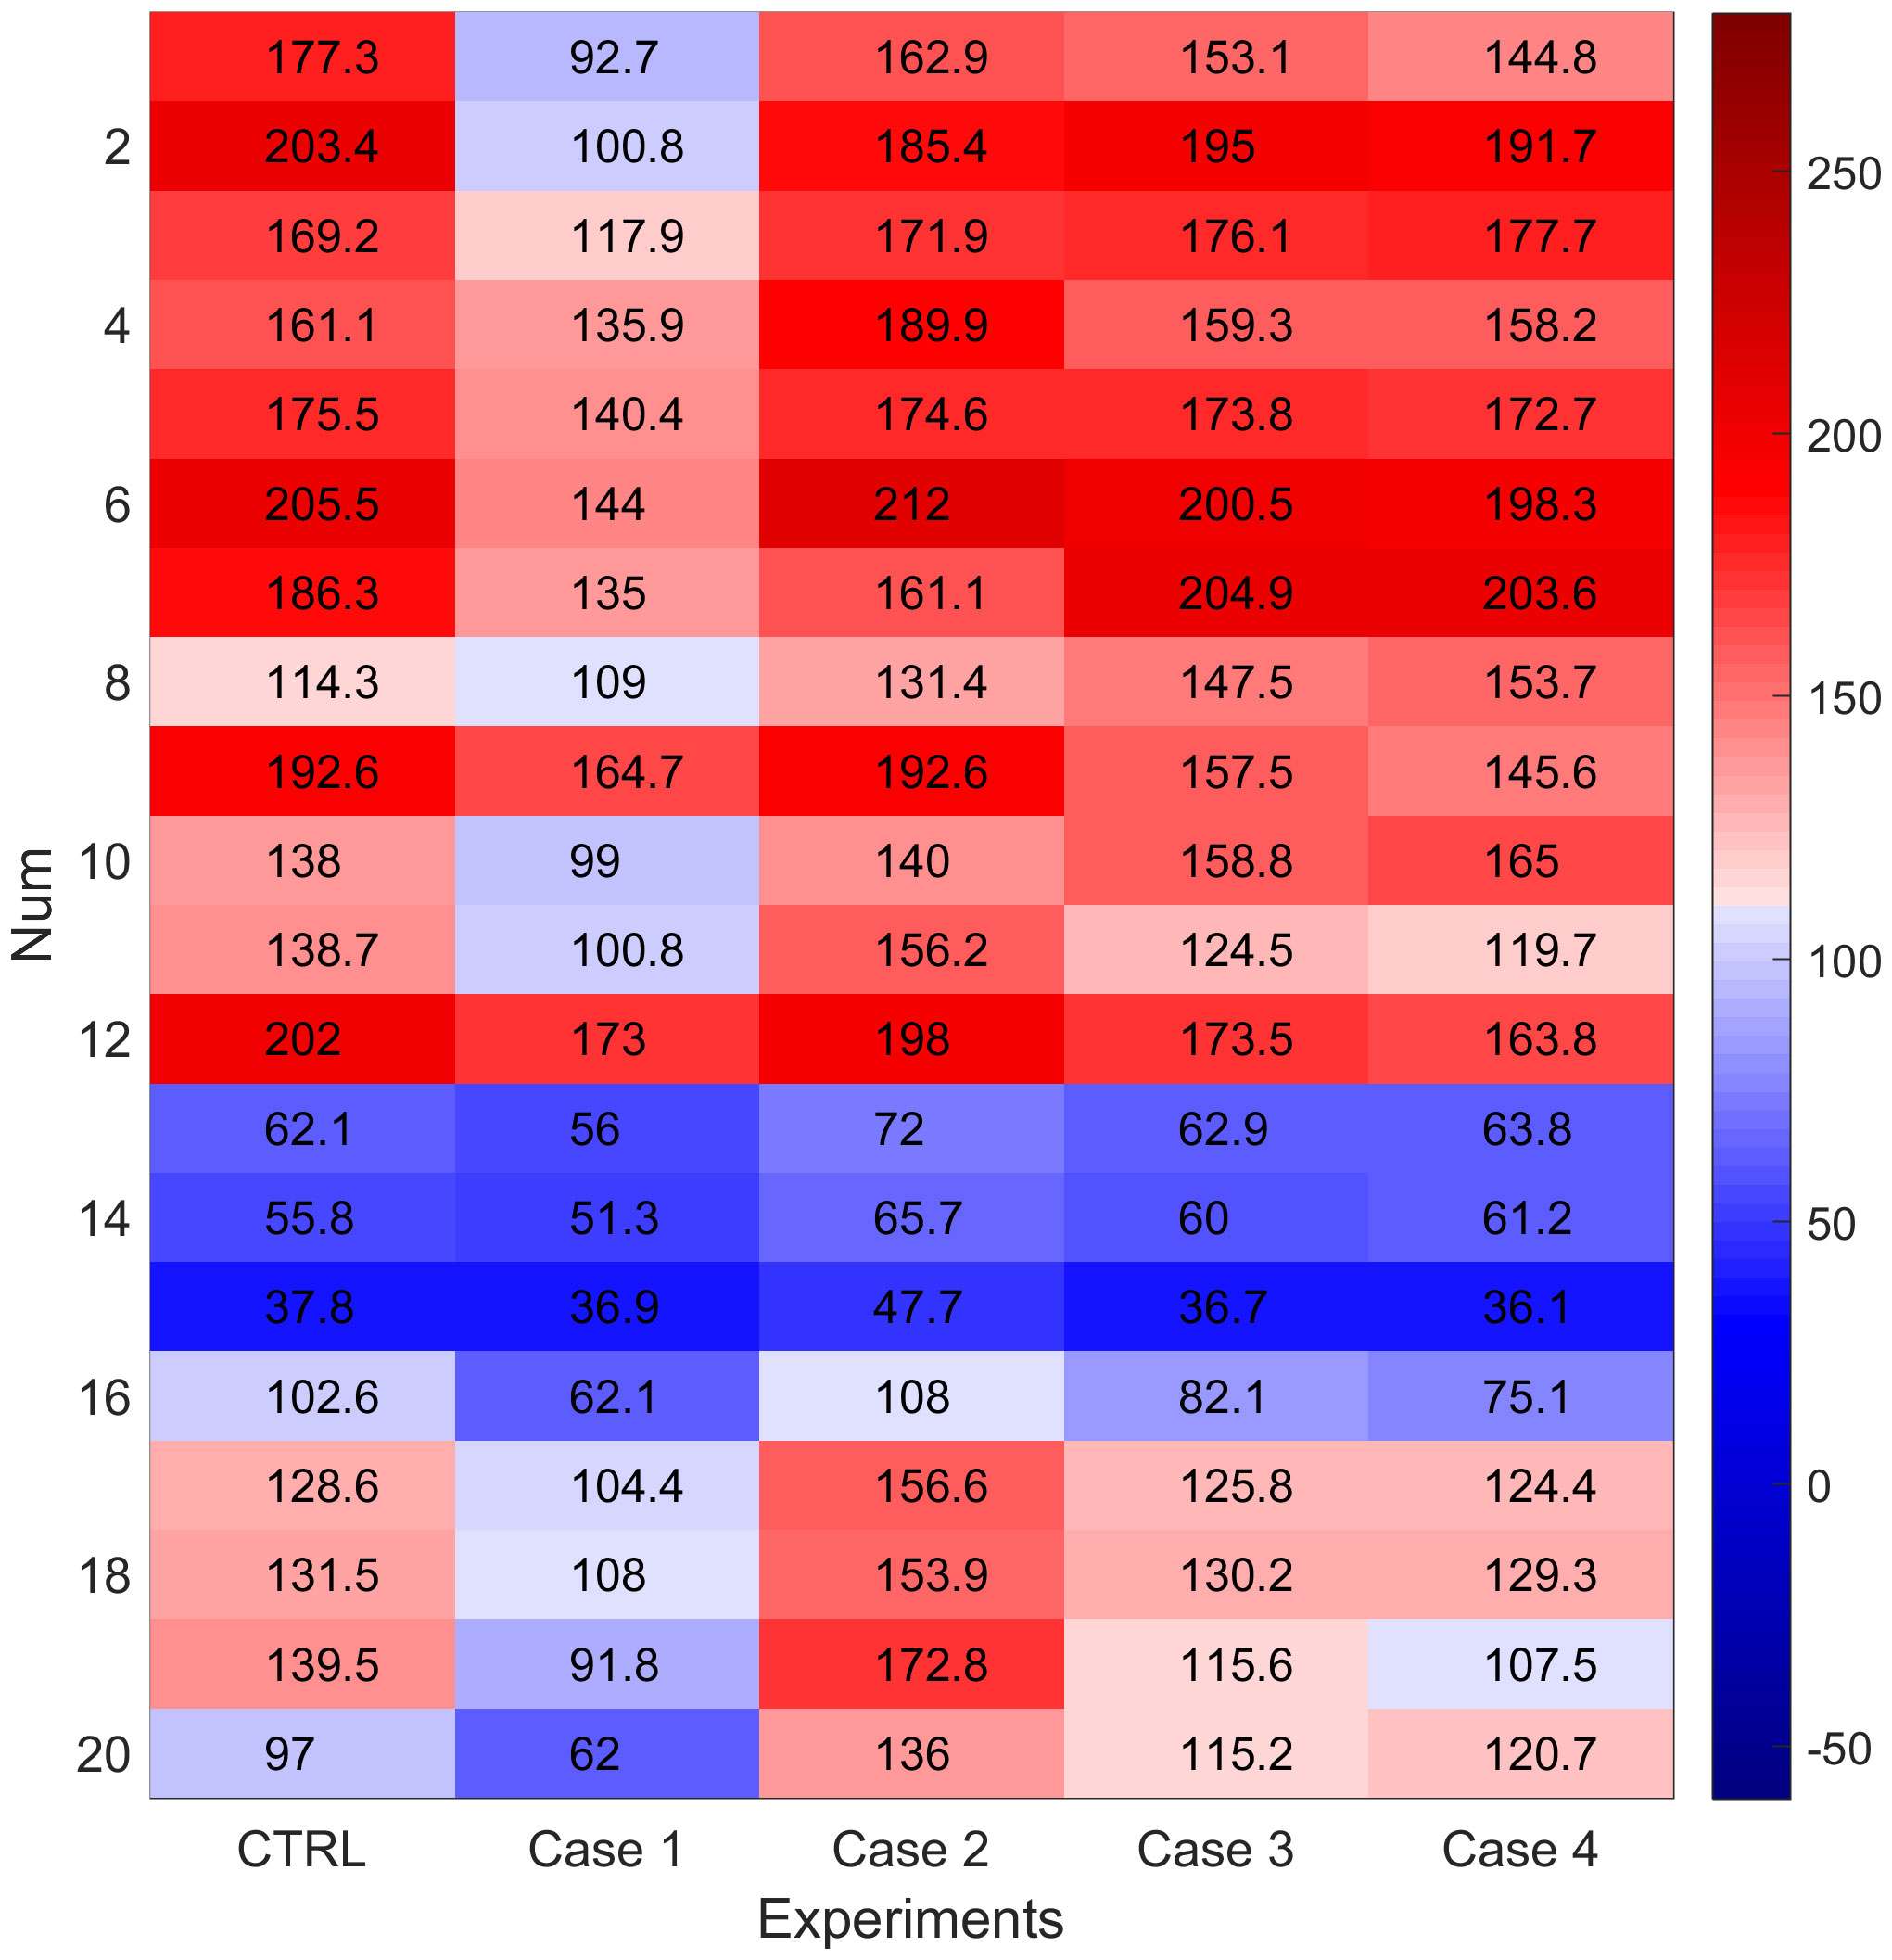
Figure 9 Width statistics of the DWBC of each case (km), the Num is the number of dots in Figure 4 running from north to south.
Likewise, the function that affects the width of the DWBC in the SCS can be derived from the aforementioned results and Equations 6-8: Width=G7 (source, mixing, -lateral friction, -bottom friction). This function implies that the width is influenced by the source, mixing, lateral friction and bottom friction. When the bottom friction and lateral friction decreases, the mixing increases, and with more deep water sources, leading to a widening of the DWBC in the SCS.
6 Summary and discussion
This study employs an ocean general circulation model to simulate and analyze the three-dimensional distribution of the DWBC in the SCS. The model results indicate that the average velocity of the DWBC is about 4.78 cm/s, with the maximum velocity occurring near the western boundary of 16-18°N, exceeding 10 cm/s. Additionally, the DWBC has an average thickness of about 1645 m and an average width of approximately 141 km. The effects of the deep Luzon overflow, the mixing rates, and the friction coefficients of the model on the DWBC are also discussed.
Generally, the deep mixing strengthens, thickens, and broadens the DWBC. It is noteworthy that the mixing rates near bottom seamounts and other submarine topography can be several orders of magnitude higher than in other areas (Kunze and Sanford, 1996; Ledwell et al., 2000; Heywood et al., 2002; Mauritzen et al., 2002; Wang et al., 2021). This demonstrates that seamounts in the SCS influence the DWBC by affecting deep mixing. And the deep mixing in the SCS is primarily caused by internal tides, internal waves, topography and so on (Qiu et al., 2024; Tian et al., 2009; Yang et al., 2016; Ye et al.,2022). Moreover, the DWBC significantly narrower along the western boundary compared to the northern boundary. The Stommel and Arons theory (Stommel and Arons, 1972) explains this phenomenon by suggesting that the submarine land slope broadens the boundary current. Besides, the model results also indicate that friction coefficients adversely impact the DWBC, which is in agreement with prior studies (Stommel, 1948; Munk, 1950).
The deep Luzon overflow also plays an important role in the DWBC. When the Luzon overflow closes, the source reduction significantly weakens, thins, and narrows the DWBC. In fact, the Luzon overflow exhibits significant intraseasonal and seasonal variability (Zhou et al., 2014; Ye et al., 2019), and has a great influence on the DWBC in the SCS through its transportation (Zhou et al., 2020b). As a result, the DWBC displays significant intraseasonal and seasonal variability (Lan et al., 2015; Shu et al., 2016; Zhou et al., 2020a).
Studies also suggest that intraseasonal and seasonal variability may originate from the deep eddies in the SCS, upper-layer eddy pairs, bottom-trapped topography Rossby waves, barotropic Rossby waves and Baroclinic Rossby Waves (Zhang et al., 2013; Shu et al., 2016; Zhou et al., 2017; Zhou et al., 2020a; Zheng et al., 2021; Quan et al., 2022; Xu et al., 2022), etc. Furthermore, the interannual or long-term scale variations of the DWBC are also of great scientific significance. However, the longest available observational research on the DWBC in the SCS is only a few years (Zhou et al., 2017; Zheng et al., 2021). Therefore, further research on longer observations is required.
Although a three-dimensional DWBC in the deep SCS has been simulated, completely simulating the deep SCS circulation using the MITgcm still remains challenging due to our limited understanding of the system’s complexity (Tian and Qu, 2012). To study the DWBC dynamics in the SCS more comprehensively, we will need more advanced model simulation capabilities, and especially enhanced observations.
Data availability statement
The raw data supporting the conclusions of this article will be made available by the authors, without undue reservation.
Author contributions
MZ: Conceptualization, Data curation, Formal analysis, Funding acquisition, Investigation, Methodology, Writing – original draft. ZL: Conceptualization, Supervision, Validation, Writing – review & editing. CC: Formal Analysis, Supervision, Writing – review & editing.
Funding
The author(s) declare financial support was received for the research, authorship, and/or publication of this article. This work is supported by the National Natural Science Foundation of China (42106010, 42076018), First-class Discipline Plan of Guangdong Province (080503032101, 231420003).
Acknowledgments
The authors would like to thank reviewers for their helpful and constructive comments on the earlier revision of this manuscript.
Conflict of interest
The authors declare that the research was conducted in the absence of any commercial or financial relationships that could be construed as a potential conflict of interest.
Publisher’s note
All claims expressed in this article are solely those of the authors and do not necessarily represent those of their affiliated organizations, or those of the publisher, the editors and the reviewers. Any product that may be evaluated in this article, or claim that may be made by its manufacturer, is not guaranteed or endorsed by the publisher.
References
Aran H. C., Rui M. P., Gael F. (2016). Impact of uncertainties in atmospheric boundary conditions on ocean model solutions. Ocean Model. 100, 96–108. doi: 10.1016/j.ocemod.2016.02.003
Carnes M. (2009). Description and evaluation of GDEM-V3.0, naval research laboratory (NRL) report NRL/MR/7330-09-9165 (Washington, D. C: Naval Research Laboratory).
Goldberg D. N., Smith T. A., Narayanan S. H. K., Heimbach P., Morlighem M. (2020). Bathymetric influences on Antarctic ice-shelf melt rates. J. Geophysical Research: Oceans 125, e2020JC016370. doi: 10.1029/2020JC016370
Handmann P., Fischer J., Visbeck M., Karstensen J., Biastoch A., Böning C., et al. (2018). The deep western boundary current in the Labrador Sea from observations and a high-resolution model. J. Geophysical Research: Oceans 123 (4), 2829–2850. doi: 10.1002/2017jc013702
Heywood K. J., Naveira Garabato A. C., Stevens D. P. (2002). High mixing rates in the abyssal Southern Ocean. Nature 415 (6875), 1011–1014. doi: 10.1038/4151011a
Hopkins J., Holliday N., Rayner D., Houpert L., Le Bras I., Straneo F., et al. (2019). Transport variability of the Irminger Sea Deep Western Boundary Current from a mooring array. J. Geophysical Research: Oceans 124 (5), 3246–3278. doi: 10.1029/2018jc014730
Johns W. E., Fratantoni D. M., Zantopp R. J. (1993). Deep western boundary current variability off northeastern Brazil. Deep Sea Res. Part I: Oceanographic Res. Papers 40 (2), 293–310. doi: 10.1016/0967-0637(93)90005-N
Johnson G. C., Warren B. A., Olson D. B. (1991). A deep boundary current in the Arabian Basin. Deep Sea Res. Part I: Oceanographic Res. Papers 38 (6), 653–661. doi: 10.1016/0198-0149(91)90004-Y
Kunze E., Sanford T. B. (1996). Abyssal mixing: where it is not. J. Phys. Oceanography 26 (10), 2286–2296. doi: 10.1175/1520-0485(1996)026<2286:AMWIIN>2.0.CO;2
Lan J., Wang Y., Cui F., Zhang N. (2015). Seasonal variation in the South China Sea deep circulation. J. Geophysical Res. 120 (3), 1682–1690. doi: 10.1002/2014JC010413
Ledwell J. R., Montgomery E. T., Polzin K. L., Laurent L. C., Schmitt R. W., Toole J. M. (2000). Evidence for enhanced mixing over rough topography in the abyssal ocean. Nature 403 (6766), 179–182. doi: 10.1038/35003164
Marshall J., Adcroft A. J., Hill C., Perelman L. T., Heisey C. W. (1997). A finite-volume, incompressible Navier Stokes model for studies of the ocean on parallel computers. J. Geophysical Res. 102 (C3), 5753. doi: 10.1029/96JC02775
Mauritzen C., Mauritzen C., Polzin K. L., Mccartney M. S., Millard R. C., West-Mack D. E. (2002). Evidence in hydrography and density fine structure for enhanced vertical mixing over the Mid-Atlantic Ridge in the western Atlantic. J. Geophysical Res. 107 (C10), 3147. doi: 10.1029/2001JC001114
Meinen C. S., Garzoli S. L., Johns W. E., Baringer M. O. (2004). Transport variability of the Deep Western Boundary Current and the Antilles Current off Abaco Island, Bahamas. Deep Sea Res. Part I: Oceanographic Res. Papers 51 (11), 1397–1415. doi: 10.1016/J.DSR.2004.07.007
Meinen C. S., Johns W. E., Garzoli S. L., Sebille E. V., Rayner D., Kanzow T., et al. (2013). Variability of the Deep Western Boundary Current at 26.5°N during 2004-2009. Deep Sea Res. Part II-topical Stud. Oceanography 85 (1), 154–168. doi: 10.1016/J.DSR2.2012.07.036
Moore M. I., Wilkin J. L. (1998). Variability in the South Pacific Deep Western Boundary Current from current meter observations and a high-resolution global model. J. Geophysical Res. Oceans 103 (C3), 5439–5457. doi: 10.1029/97JC03207
Morgan G. W. (1956). On the wind-driven ocean circulation. Tellus A 8, 301–320. doi: 10.3402/TELLUSA.V8I3.9021
Munk W. H. (1950). On the wind-driven ocean circulation. J. Meteorology 7 (2), 80–93. doi: 10.1175/1520-0469(1950)007<0080:OTWDOC>2.0.CO;2
Owens W. B., Warren B. A. (2001). Deep circulation in the northwest corner of the Pacific Ocean. Deep Sea Res. Part I: Oceanographic Res. Papers 48 (4), 959–993. doi: 10.1016/S0967-0637(00)00076-5
Peña-Molino B., Joyce T. M., Toole J. M. (2012). Variability in the Deep Western Boundary Current: Local versus remote forcing. J. Geophysical Res. 117 (C12), 1–17. doi: 10.1029/2012JC008369
Pickart R. S., Smethie W. M. (1998). Temporal evolution of the deep western boundary current where it enters the sub-tropical domain. Deep Sea Res. Part I: Oceanographic Res. Papers 45 (7), 1053–1083. doi: 10.1016/S0967-0637(97)00084-8
Qiu C., Yang Z., Feng M., Yang J., Rippeth T., Shang X., et al. (2024). Observational energy transfers of a spiral cold filament within an anticyclonic eddy. Progr. Oceanogr. 220, 103187. doi: 10.1016/j.pocean.2023.103187
Qu T. (2002). Evidence for water exchange between the South China Sea and the Pacific Ocean through the Luzon Strait. Acta Oceanologica Sin. 21 (2), 175–185.
Qu T., Du Y., Meyers G., Ishida A., Wang D. (2005). Connecting the tropical Pacific with Indian Ocean through South China Sea. Geophysical Res. Lett. 32 (24), L24609. doi: 10.1029/2005GL024698
Qu T., Girton J. B., Whitehead J. A. (2006). Deepwater overflow through Luzon Strait. J. Geophysical Res. 111, C01002. doi: 10.1029/2005JC003139
Quan Q., Liu Z. Q., Yang Y., Cai Z. Y., Zhang H., Liu X. H. (2022). Characterization of intraseasonal fluctuations in the abyssal South China Sea: An insight into the energy pathway. Prog. Oceanography 206, 2829. doi: 10.1016/j.pocean.2022.102829
Reid J. L. (2005). On the world-wide circulation of the deep water from the North Atlantic Ocean. J. Mar. Res. 63, 187–201. doi: 10.1357/0022240053693833
Roemmich D. H., Hautala S. L., Rudnick D. L. (1996). Northward abyssal transport through the Samoan passage and adjacent regions. J. Geophysical Res. 101 (C6), 14039–14055. doi: 10.1029/96JC00797
Schott F. A., Dengler M., Zantopp R. J., Stramma L., Fischer J., Brandt P. (2005). The shallow and deep western boundary circulation of the South Atlantic at 5-11°S. J. Phys. Oceanography 35 (11), 2031–2053. doi: 10.1175/JPO2813.1
Schott F. A., Fischer J., Dengler M., Zantopp R. J. (2006). Variability of the deep western boundary current east of the grand banks. Geophysical Res. Lett. 33 (21), L21S07. doi: 10.1029/2006GL026563
Shu Y., Xue H., Wang D., Chai F., Xie Q., Cai S., et al. (2016). Persistent and energetic bottom-trapped topographic Rossby waves observed in the southern South China Sea. Sci. Rep. 6, 24338. doi: 10.1038/srep24338
Smith R., Dukowicz J. K., Malone R. C. (1992). Parallel ocean general circulation modeling. Physica D: Nonlinear Phenomena 60, 38–61. doi: 10.1016/0167-2789(92)90225-C
Spingys C. P., Garabato A. N., Legg S., Polzin K. L., Abrahamsen E. P., Buckingham C. E., et al. (2021). Mixing and transformation in a deep western boundary current: A case study. J. Phys. Oceanography. 51 (4), 1205–1222. doi: 10.1175/JPO-D-20-0132.1
Stommel H. M. (1948). The westward intensification of wind-driven ocean currents. Eos Trans. Am. Geophysical Union 29 (2), 202. doi: 10.1029/TR029I002P00202
Stommel H., Arons A. B. (1972). On the abyssal circulation of the world ocean-V. The influence of bottom slope on the broadening of inertial boundary currents. Deep Sea Res. 19 (10), 707–718. doi: 10.1016/0011-7471(72)90062-9
Swallow J. C., Worthington L. V. (1957). Measurements of deep currents in the western north atlantic. Nature 179 (4571), 1183–1184. doi: 10.1038/1791183B0
Tian J., Qu T. (2012). Advances in research on the deep South China Sea circulation. Chin. Sci. Bull. 57 (24), 3115–3120. doi: 10.1007/S11434-012-5269-X
Tian J., Yang Q., Zhao W. (2009). Enhanced diapycnal mixing in the south China sea. J. Phys. Oceanography 39 (12), 3191. doi: 10.1175/2009JPO3899.1
Uppala S. M., Kållberg P. W., Simmons A., Andrae U., Bechtold V. D., Fiorino M., et al. (2005). The ERA-40 re-analysis. Q. J. R. Meteorological Soc. 131, 2961–3012. doi: 10.1256/QJ.04.176
Wang D., Wang Q., Cai S., Shang X., Peng S., Shu Y., et al. (2019). Advances in research of the mid-deep South China Sea circulation. Sci. China Earth Sci. 62 (12), 1992–2004. doi: 10.1007/s11430-019-9546-3
Wang G., Xie S., Qu T., Huang R. X. (2011). Deep south China sea circulation. Geophysical Res. Lett. 38 (5), L05601. doi: 10.1029/2010GL046626
Wang J., Yu F., Nan F., Ren Q., Chen Z., Zheng T. (2021). Observed three dimensional distributions of enhanced turbulence near the Luzon Strait. Sci. Rep. 11, 14835. doi: 10.1038/s41598-021-94223-3
Warren B. A., Whitworth T., LaCasce J. H. (2002). Forced resonant undulation in the deep Mascarene Basin. Deep Sea Res. Part II-topical Stud. Oceanography 49 (7), 1513–1526. doi: 10.1016/S0967-0645(01)00151-5
Whitworth T. I. I. I., Warren B. A., Nowlin W. Jr., Rutz S., Pillsbury R., Moore M. I. (1999). On the deep western-boundary current in the Southwest Pacific Basin. Prog. Oceanography 43 (1), 1–54. doi: 10.1016/S0079-6611(99)00005-1
Wright I. C., Graham I. J., Chang S. W., Choi H., Lee S. R. (2005). Occurrence and physical setting of ferromanganese nodules beneath the Deep Western Boundary Current, Southwest Pacific Ocean. New Z. J. Geology Geophysics 48 (1), 27–41. doi: 10.1080/00288306.2005.9515096
Xu Q., Zhou C., Zhao W., Hu Q., Xiao X., Zhang D., et al. (2022). Dynamics of the baroclinic rossby waves regulating the abyssal South China Sea. J. Phys. Oceanography 52 (5), 873–887. doi: 10.1175/JPO-D-21-0207.1
Yang Q., Zhao W., Liang X., Tian J. (2016). Three-dimensional distribution of turbulent mixing in the south China sea. J. Phys. Oceanography 46 (3), 769–788. doi: 10.1175/JPO-D-14-0220.1
Ye R., Zhou C., Zhao W., Tian J., Yang Q., Huang X., et al. (2019). Variability in the deep overflow through the heng-chun ridge of the luzon strait. J. Phys. Oceanography. 49 (3), 811–825. doi: 10.1175/JPO-D-18-0113.1
Ye R., Shang X., Zhao W., Zhou C., Yang Q., Tian Z., et al. (2022). Circulation driven by multihump turbulent mixing over a seamount in the South China Sea. Front. Mar. Sci. 8, 794156. doi: 10.3389/fmars.2021.794156
Zhang Z., Zhao W., Tian J., Liang X. (2013). A mesoscale eddypair southwest of Taiwan and its influence on deep circulation. J. Geophysical Res. Oceans 118, 6479–6494. doi: 10.1002/2013JC008994
Zheng H., Zhang C. Z., Zhao R. X., Zhu X. H., Zhu Z. N., Liu Z. J., et al. (2021). Structure and variability of abyssal current in northern South China Sea based on CPIES observations. J. Geophysical Res. Oceans 126, e2020JC016780. doi: 10.1029/2020JC016780
Zhou M., Chen C., Yan Y., Liu W. (2020b). Influence of two inlets of the Luzon overflow on the deep circulation in the northern South China Sea. Acta Oceanologica Sin. 39 (11), 16–23. doi: 10.1007/s13131-020-1621-1
Zhou M., Wang G., Wenhu L., Chen C. (2020a). Variability of the observed deep western boundary current in the South China Sea. J. Phys. Oceanography. 50 (10), 2953–2963. doi: 10.1175/jpo-d-20-0013.1
Zhou C., Zhao W., Tian J., Yang Q., Qu T. (2014). Variability of the deep-water overflow in the luzon strait. J. Phys. Oceanography 44 (11), 2972–2986. doi: 10.1175/JPO-D-14-0113.1
Keywords: South China Sea, deep western boundary current, numerical study, three-dimensional, dynamics
Citation: Zhou M, Ling Z and Chen C (2024) Three-dimensional numerical study of the deep western boundary current in the South China Sea. Front. Mar. Sci. 11:1346973. doi: 10.3389/fmars.2024.1346973
Received: 30 November 2023; Accepted: 02 January 2024;
Published: 18 January 2024.
Edited by:
Francisco Machín, University of Las Palmas de Gran Canaria, SpainReviewed by:
Chunhua Qiu, Sun Yat-sen University, ChinaJianfeng Wang, Chinese Academy of Sciences (CAS), China
Copyright © 2024 Zhou, Ling and Chen. This is an open-access article distributed under the terms of the Creative Commons Attribution License (CC BY). The use, distribution or reproduction in other forums is permitted, provided the original author(s) and the copyright owner(s) are credited and that the original publication in this journal is cited, in accordance with accepted academic practice. No use, distribution or reproduction is permitted which does not comply with these terms.
*Correspondence: Zheng Ling, bGluZ3pAZ2RvdS5lZHUuY24=