 Bjarta O. Johansen1,2*
 Svein-Ole Mikalsen2
 Eyðfinn Magnussen2
 Esbern J. Patursson3
 Gunnvør á Norði4
 Anni Djurhuus2*
- 1Environmental department, SMJ Consulting Engineers, Tórshavn, Faroe Islands
- 2Faculty of Science and Technology, University of the Faroe Islands, Tórshavn, Faroe Islands
- 3Department of Sea Farming, Hiddenfjord, Sandavágur, Faroe Islands
- 4Department of Ecology, Firum, Hvalvík, Faroe Islands
In recent years, the salmon farming industry has grown significantly worldwide, and in the Faroe Islands, it has become a major industry with an annual production of over 94,000 tonnes, yielding 24% of the GDP. According to environmental regulations, the ocean floor is monitored during every production cycle at all farming sites, involving macrofaunal, sensory, and chemical analyses. However, the impact of farming activity on microorganisms in the Faroe Islands remains unknown. This study aimed to assess the impact of Atlantic salmon farming on benthic microbial communities, giving a better understanding of the effects on the foundation of the benthic food web and to assess if these are more prone to environmental impact than traditional macrofaunal biomonitoring. Sediment cores were sampled along a transect from directly below the salmon cages to a background reference site. The sampling occurred prior to the release of salmon into the cages (‘before stocking’) and immediately before the salmon were harvested (‘peak biomass’). The 16S rRNA (V4-V5) gene was sequenced on an Illumina MiSeq from our sediment samples at the surface, 3 cm, and 10 cm depth. Significant shifts in microbial community composition were observed between ‘before stocking’ and ‘peak biomass’, as well as between different depth layers. Microbial diversity increased with increasing distance from the cages and was at its highest ‘before stocking’, indicating a significant impact of the salmon farming on the microbial community structure. In contrast to the regularly executed environmental monitoring, the results from this study showed an impact on the sediments by the salmon farming, underlining the powerful alternative of DNA-metabarcoding when biomonitoring an aquaculture area.
Introduction
Aquaculture has become a field of major worldwide industrial importance (Kawahara et al., 2009). Over the last decade, it has grown at an intense rate to match the continuously rising global demand for seafood (Stoeck et al., 2018; Leontidou et al., 2023). Globally, marine aquaculture production totalled 57,5 million tonnes in 2021 (FAO, 2022), with the majority being finfish (FAO, 2018). This large and growing industry has raised concerns about the impact of aquaculture on marine environments (Kawahara et al., 2009; Verhoeven et al., 2018; Ape et al., 2019). Most farmed finfish, like salmon, are carnivores with a diet rich in phosphates and proteins (Stoeck et al., 2018). While much of the carbon, phosphorus, and nitrogen supplied with food is recovered in harvested fish, large amounts are also released into the environment as dissolved effluents or feed and faecal particles that deposit at the seabed (Gowen and Bradbury, 1987; Folke and Kautsky, 1989; Price et al., 2015). Hence, during active fish farming, the seabed is enriched with organic particles in the form of uneaten food and faecal materials (Carroll et al., 2003; Holmer et al., 2005; Buschmann et al., 2006). Changes in the organic enrichment of sediment affect biogeochemical processes and benthic microbial communities (McCaig et al., 1999; Norði et al., 2011; Bannister et al., 2014; Sweetman et al., 2014). The effects of organic enrichment depend on several factors such as water currents, turbulence, and depth, as well as the duration, quality, and quantity of waste loading.
When waste deposition exceeds the natural decomposition rate of organic matter (OM), a layer of fine-grained material with a high content of particulate organic matter settles on top of the sediment. Over time, the ocean floor (seabed) becomes acidified, and oxygen gets depleted due to microbial degradation processes. Toxic gases like hydrogen sulphide and methane can be produced, which in turn, can influence the health of fish and other fauna (Gowen and Bradbury, 1987; Black et al., 1996; Forrest et al., 2007; Norði et al., 2011). These geochemical changes in the seabed structure usually lead to alterations in infaunal and epifaunal communities. This results in less resistant benthic animals being replaced by fewer, more opportunistic, and tolerant species. Under such extreme circumstances, layers of chemoautotrophic bacteria can form on sediment surfaces. With time, the sediments around farm cages can become azoic (Brown et al., 1987; Holmer et al., 2005; Keeley et al., 2013b), causing a reduction of seabed health (Hargrave et al., 1993; Hyland et al., 2005; Forrest et al., 2007).
The most severe ecological effects from marine salmon farms occur immediately below the cages. These effects exhibit a gradient of decreasing impact with increasing distance, which is consistent with organic enrichment gradients (Schendel et al., 2004; Hyland et al., 2005; Forrest et al., 2007). The depositional ‘footprint’ of typical salmon farms extends up to hundreds of meters from the point of discharge, which is typically at the centre of the cages and often occurs in an ovoid shape, skewed in the direction of prevailing currents (Brown et al., 1987; Forrest et al., 2007; Keeley et al., 2013a; Bannister et al., 2016). The surface aerobic sediment layer ranges from a few millimetres to centimetres and depends on the balance between oxygen penetration and consumption. However, if the overlaying waters become deoxygenated, the sediment surface becomes anaerobic (Kristensen, 2000; Hargrave et al., 2008; Norði et al., 2011). The sediment type and tendency to be organically enriched is mainly driven by hydrodynamics and site depth, which also controls the shape, intensity, and size of the footprint (Keeley et al., 2013b; Keeley et al., 2019).
Because eutrophication impacts biogeochemical processes in the sediments benthic communities, especially microbial communities are highly affected (Asami et al., 2005). High levels of OM enrichment right underneath farm cages are usually manifested via a group of different ‘indicators’, such as anoxic microorganisms or high abundance of enrichment-tolerant species, for example, the polychaete worm Capitella capitata (Brown et al., 1987; Karakassis et al., 2000; Neofitou et al., 2010; Gaard et al., 2011). Previous studies on microbial communities under aquaculture farms have shown that they can be highly sensitive to local environmental conditions (Quero et al., 2020; Frühe et al., 2021a; Keeley et al., 2021; Pawlowski et al., 2022). However, there are few studies, if any, that investigate microbial communities through different depth layers through the sediment. Because of their relatively rapid turnover, changes in microbial populations in sediments can serve as a more sensitive and precise indicator for assessing the impact on marine sediments over shorter time scales and can therefore be a more powerful environmental indicator than compared to meio- and megafauna (Kawahara et al., 2009; Stoeck et al., 2018; Frühe et al., 2021b).
To our knowledge, we present the first study from the Faroe Islands that focuses on microbial community structures through sediment columns with distance from aquaculture cages under regime shifts of organic matter from salmon farming.
Materials and methods
Sample collection and preparation
Sediment samples were collected on the 25th of September 2019 and 15th July 2020 at the fish farming area A-83 in Sørvágur, Faroe Islands (Figure 1). The first sampling effort was conducted after a three-month fallowing period and the second sampling effort was carried out when the salmon biomass was at its highest.
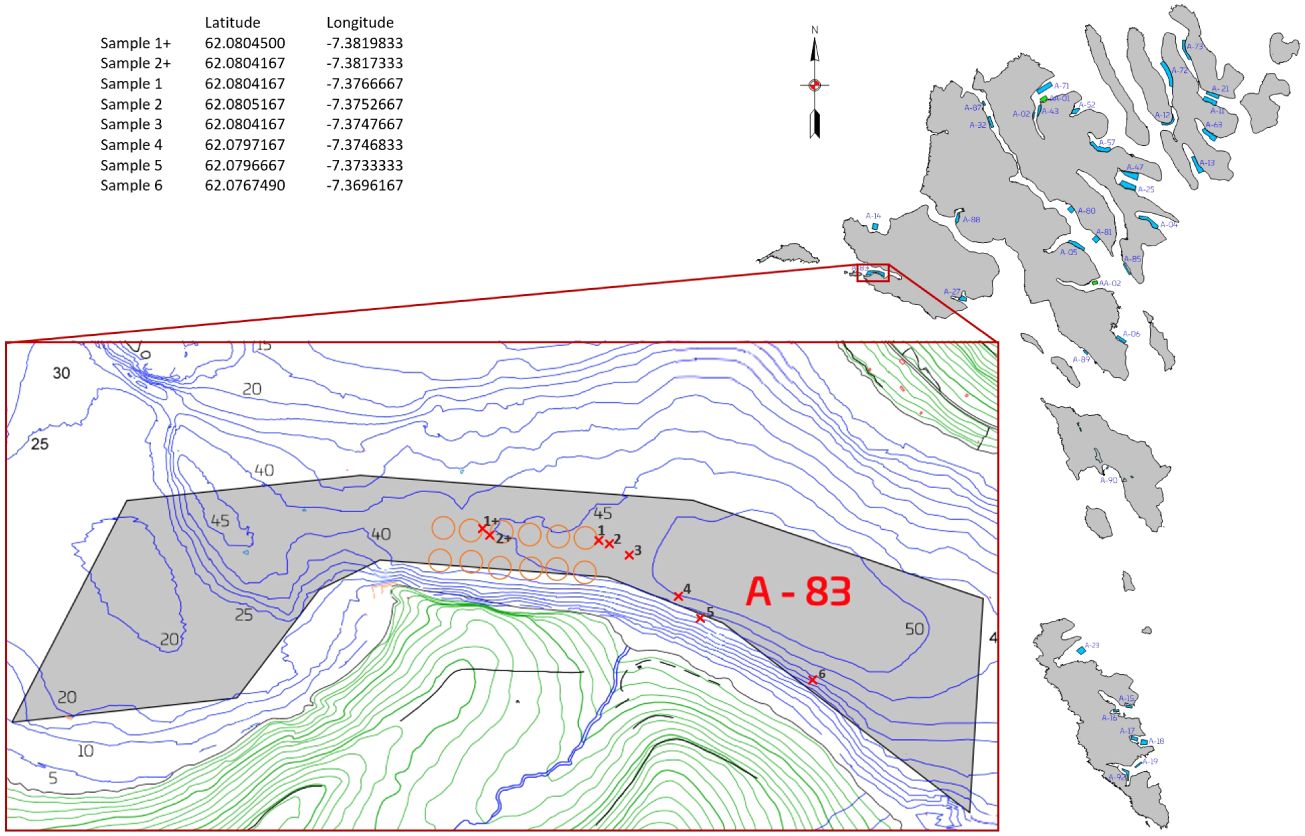
Figure 1. The location of the A-83 farming site in the Faroe Islands. Red x marks are sampling stations. Orange circles are the farming cages.
Starting from the cage station RS20, six stations were sampled along a transect (Figure 1). The first station was collected directly at the periphery of the cage (0 m), and then approximately at 12 m, 40 m, 150 m, 190 m, and 600 m from RS20. The transect into the fjord follows the prevailing current direction, measured approximately 225 m west of the farm (Norði et al., 2023) (Figure 1). The sampling station at 600 meters was designated as a background sample, based on findings from a study indicating that the maximum impact range of organic enrichment from fish farms in Faroese fjords is 200 m (Mortensen et al., 2021). Our background site, 600 meters away, was based on a threshold set by the Aquaculture Stewardship Council (ASC) of >500 m distance between fish farm and reference station (Mortensen et al., 2021). However, the 600 meters sampling station is taken at a slightly shallower depth (≈ 35 m depth) than the other samples (≈ 45 m depth). Due to the small size of the fjord, we chose the best fitting reference point in a 500 m radius. During the ‘peak biomass’ sampling effort, two additional samples (1+ and 2+, illustrated in Figure 1) due to the relocation of cages (RS20, RS22, RS24 and RS26) during farming cycles. To ensure consistent comparison with the ‘before stocking’ sampling effort, the additional samples were collected from RS28 (representing 0 m and 12 m distance), which was the outermost cage station on the same transect. Thus, samples were collected at stations 1, 2, 3, 4, 5, and 6 on both sampling events but only at stations 1+ and 2+ during ‘peak biomass’. This resulted in a total of 14 stations. Samples were collected with a kayak corer, consisting of 47 cm plex tubes with a diameter of 44 mm (Supplementary File 1). Each of the 14 sediment cores was sliced into 1 cm intervals down to a depth of 10 cm. Three sediment layers were analysed: the surface (scraping the surface), 3 cm depth, and 10 cm depth (Supplementary File 1). Three replicates were collected from each core and layer, resulting in a total of 126 samples. The 10 cm layer was the deepest layer that could be collected from all samples. The samples were stored at -18°C within 2-5 hours after collection and kept until DNA extraction, which was conducted 2-7 weeks later. Concurrently with our sample collection, an environmental condition assessment of the area was performed. This assessment is a statutory requirement before smolts are led into the cages and when the biomass is at its highest (i.e., before slaughter).
Samples for the legislated national environmental condition assessment, as described in ICES (2023), were collected by an impartial company. The environmental condition assessment was conducted in accordance with Norwegian Standard 9410:2016, which is also used by the Faroese Environmental Agency (Agency, 2018). The impact status is categorized as follows: ‘no impact’, ‘some impact’, ‘high impact’ and ‘very high impact’ (Agency, 2018).
DNA extraction
The samples were thawed at room temperature and then homogenized to ensure uniform consistency. Each sample was divided into three laboratory analyses replicates and DNA was extracted using the Qiagen DNeasy PowerSoil kit according to the manufacturer’s instructions. The DNA yields from the extractions were quantified using a nanophotometer (3117, Implen). Average DNA yields for the samples were 41 ± 62 ng/μL, with an average A260/A280 ratios of 1.863 ± 0.304. A schematic of the sampling and laboratory protocol is shown in Supplementary File 2.
PCR and sequencing
Sequencing was done of the V4-V5 region on the 16S rRNA gene, we used the primers 515F-Y and 926R according to Parada et al. (2015). PCR reactions were carried out in triplicate for each laboratory replicate, with a 1:10 dilution for all DNA extracts to reduce PCR inhibitors (Apprill et al., 2015; Djurhuus et al., 2017). In brief, 1 μL DNA template was added to the master mix, consisting of 12.5 μL 2X Phusion Master Mix (Thermo Fisher Scientific, USA), 10.50 μL nuclease-free water, and 0.5 μL of each primer (0.2 μM) (Parada et al., 2015), resulting in a 25 μL reaction. The PCR reaction occurred at 98°C for 30 s, followed by 27 cycles of 98°C for 10 s, 50°C for 30 s, and 72°C for 30 s, with a final extension at 72°C for 10 min. After PCR, the triplicates were pooled. To confirm the presence of targeted bands and to check for clean negative controls, the pooled amplicon products were run on 1.5% agarose gels using UView (Bio-Rad) for visualisation. All non-template controls (NTCs) and blanks tested negative. The pooled amplicon products were purified using 1x magnetic Agencourt AMPure XP beads (Beckman Coulter, USA), following the manufacturer’s protocols. The concentration of all clean PCR products was quantified using a nanophotometer. A second PCR reaction was conducted to attach dual barcode indices, and Illumina sequencing adapters with the Nextera XT Index Kit v2. In brief, 5 μL of each DNA amplicon was added to a master mix consisting of 25 μL 2X KAPA HiFi (Kapa Biosystems Inc., Woburn, U.S.) HotStart ReadyMix, 10 μL nuclease-free water, and 5 μL of primers Nextera XT Index 1 and Nextera XT Index 2, resulting in a total volume of 50 μL. PCR was performed with the following cycling conditions: 95°C for 3 min, 8 cycles of 95°C for 30 s, 55°C for 30 s, and 72°C for 30 s, followed by a final extension at 72°C for 5 min. Subsequently, the products were purified using AMPure XP beads and quantified using the Qubit 2.0 Fluorometer and the Qubit dsDNA HS Assay Kit (Invitrogen, USA). Following quantification, library normalisation was performed to get an even sequencing depth per sample. Sequencing libraries were verified using an Agilent Bioanalyzer 2100 (Agilent Technologies, USA) to check the sizes of PCR libraries. These were then sequenced on an Illumina MiSeq platform, generating 2 x 250 bp paired-end reads.
Bioinformatics and statistics
All samples were demultiplexed into paired-end fastq read files and all barcodes were removed. All downstream analyses were conducted using R software (R Core Team, 2020). The dada2 package (Callahan et al., 2016) was employed to perform quality filtering and trimming (including primer removal), error estimation, inference of sequence variants, read merging, and chimera removal. Taxonomy assignment was carried out using the SILVA132 reference database. The output included an amplicon sequence variants (ASV) table and a corresponding taxonomy table. The quality of the sequencing data was visually assessed through per sample rarefaction curves created with the vegan package (Oksanen et al., 2013). These rarefaction curves were used to determine whether the sequencing depth was sufficient to capture the microbial richness in the samples (Supplementary File 3).
Because our samples had a wide range of sequence reads per sample, we chose not to rarefy the data, as not to lose important information by removing sequence data (Love et al., 2014; Callahan et al., 2016). To maintain data resolution, we applied a Benjamini-Hochberg multi-inference correction to our data using the R package DESeq2 (Love et al., 2014). This method accounts for correcting uneven numbers of reads per sample and is appropriate for normalizing high-variance datasets from high-throughput sequencing (McMurdie and Holmes, 2014; Djurhuus et al., 2017).
To obtain an overview of mean diversity and richness, alpha diversity was examined through observed richness (number of ASVs) visualized in a richness plot generated using the phyloseq package (McMurdie and Holmes, 2013) (Figure 2). In the following analyses the data was rarefied to 19,000 reads/sample for an even comparison of richness across samples. The data was checked for normality using the Shapiro-Wilk’s normality test, indicating a non-normal distribution. To assess differences between microbial communities at the two sampling events (‘before stocking’ and ‘peak biomass’) and differences between all sampling stations, the Kruskal-Wallis rank sum test was applied. In cases where a statistical difference was found, pairwise comparisons were conducted using the Wilcoxon rank sum test for post-hoc analysis.
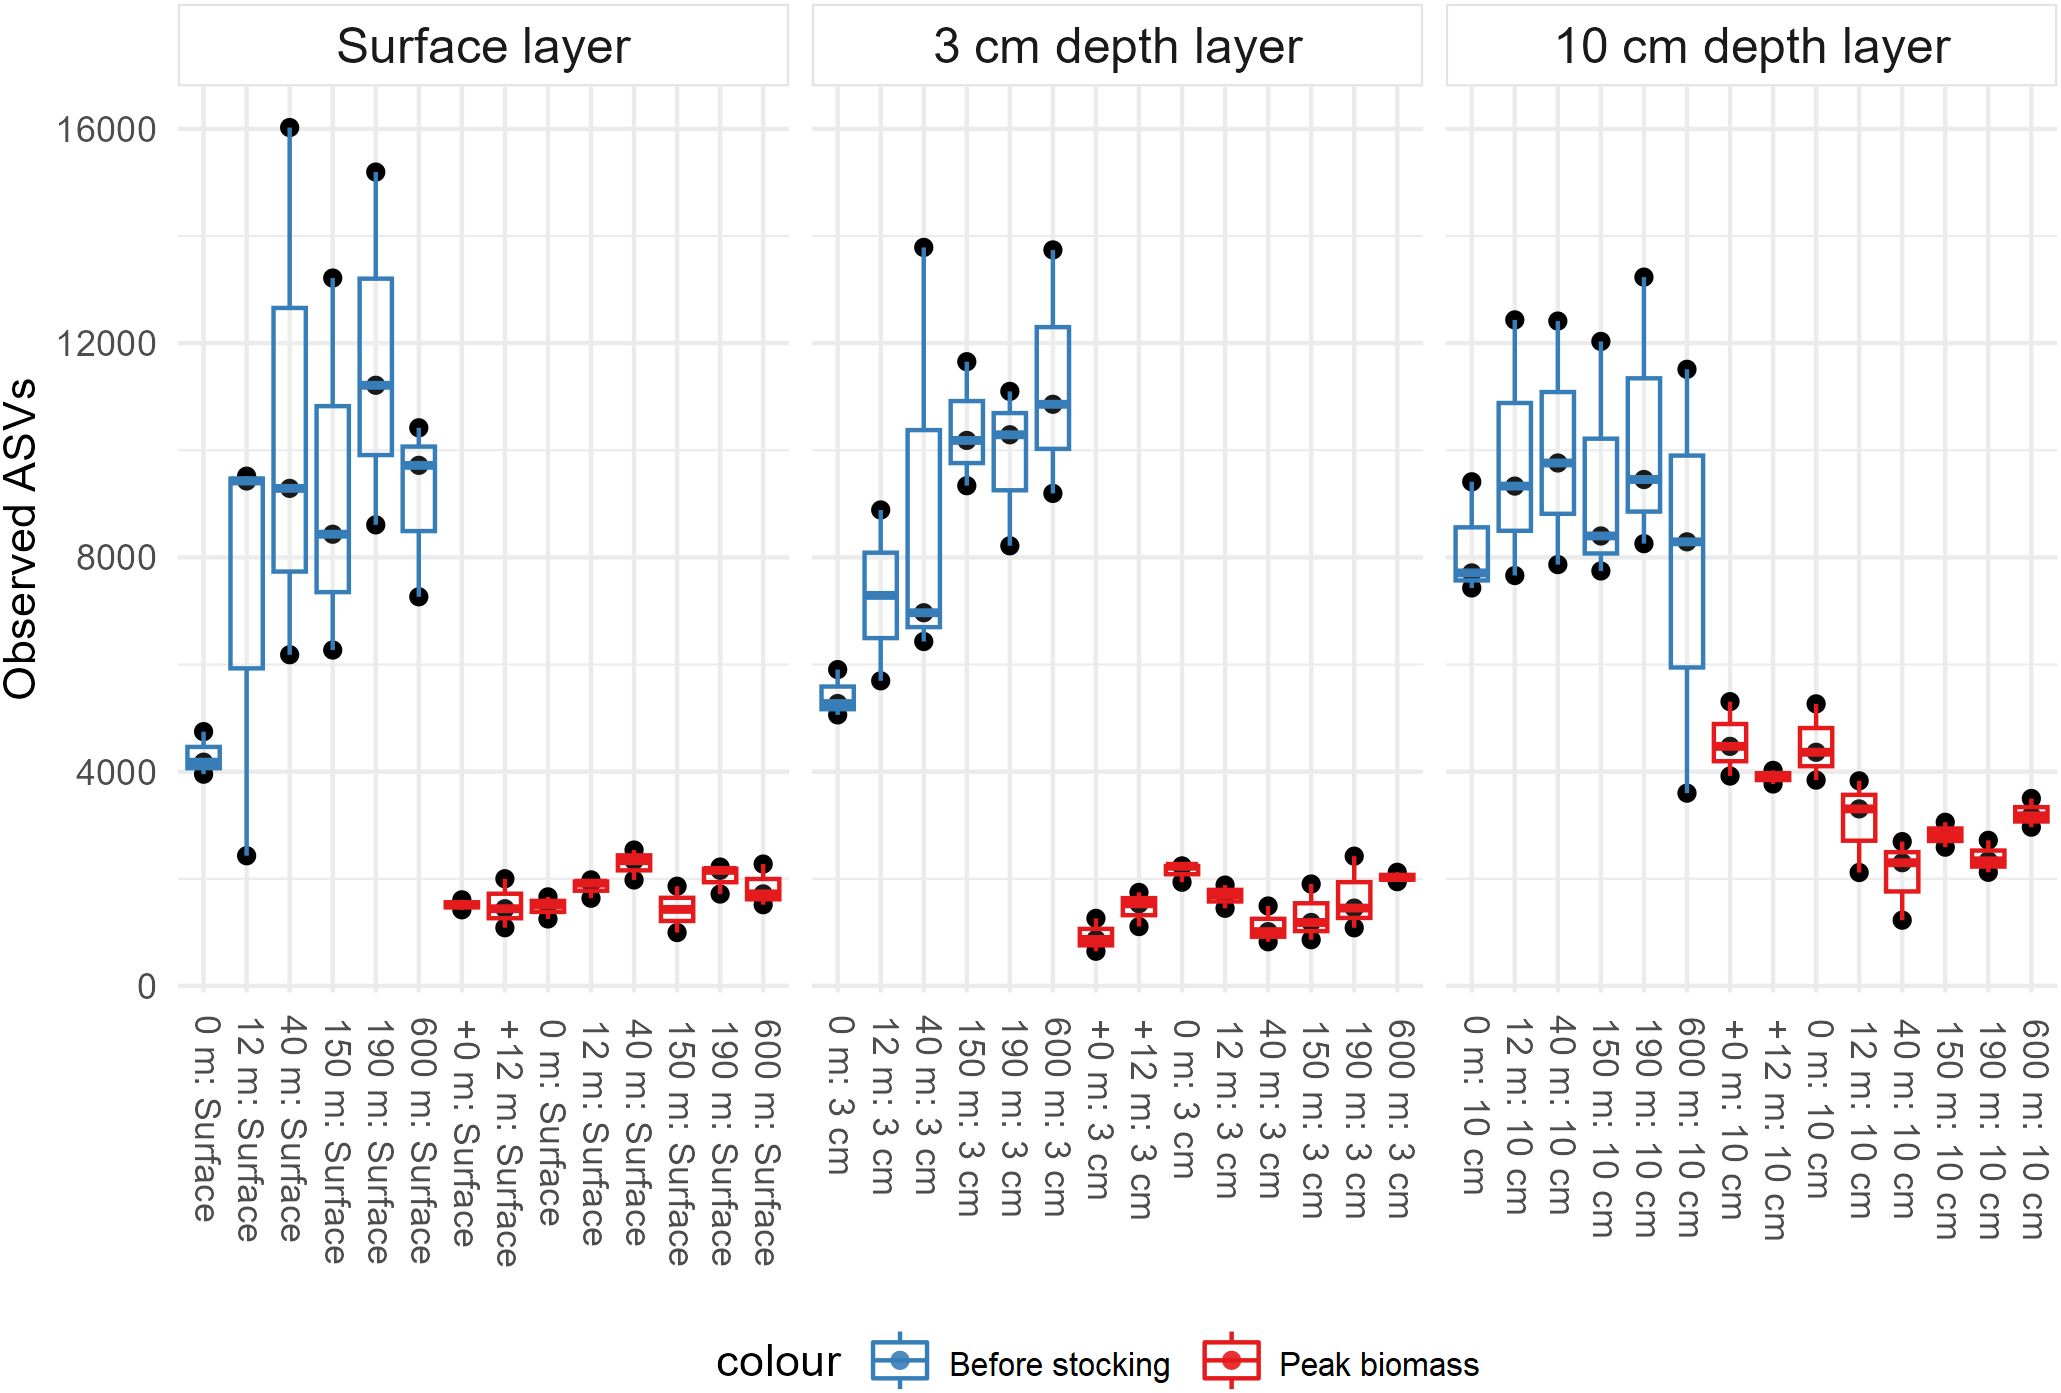
Figure 2. Alpha diversity measure of observed richness grouped by depth layer. Coloured by sampling events (before stocking = blue, peak biomass = red). X-axes show the samples and the y-axes the number of observed ASVs. Each sample shows replicates and their error bars.
To accurately represent ordinal distances between samples in two dimensions, the data was log transformed and a non-metric multidimensional scaling (NMDS) plot was generated using the Bray-Curtis dissimilarity indices as a distance measure (Figure 3A). Additionally, a scatter plot was created to investigate potential correlations between the distance from the cages and gamma/deltaproteobacteria ratio (Figure 3B).
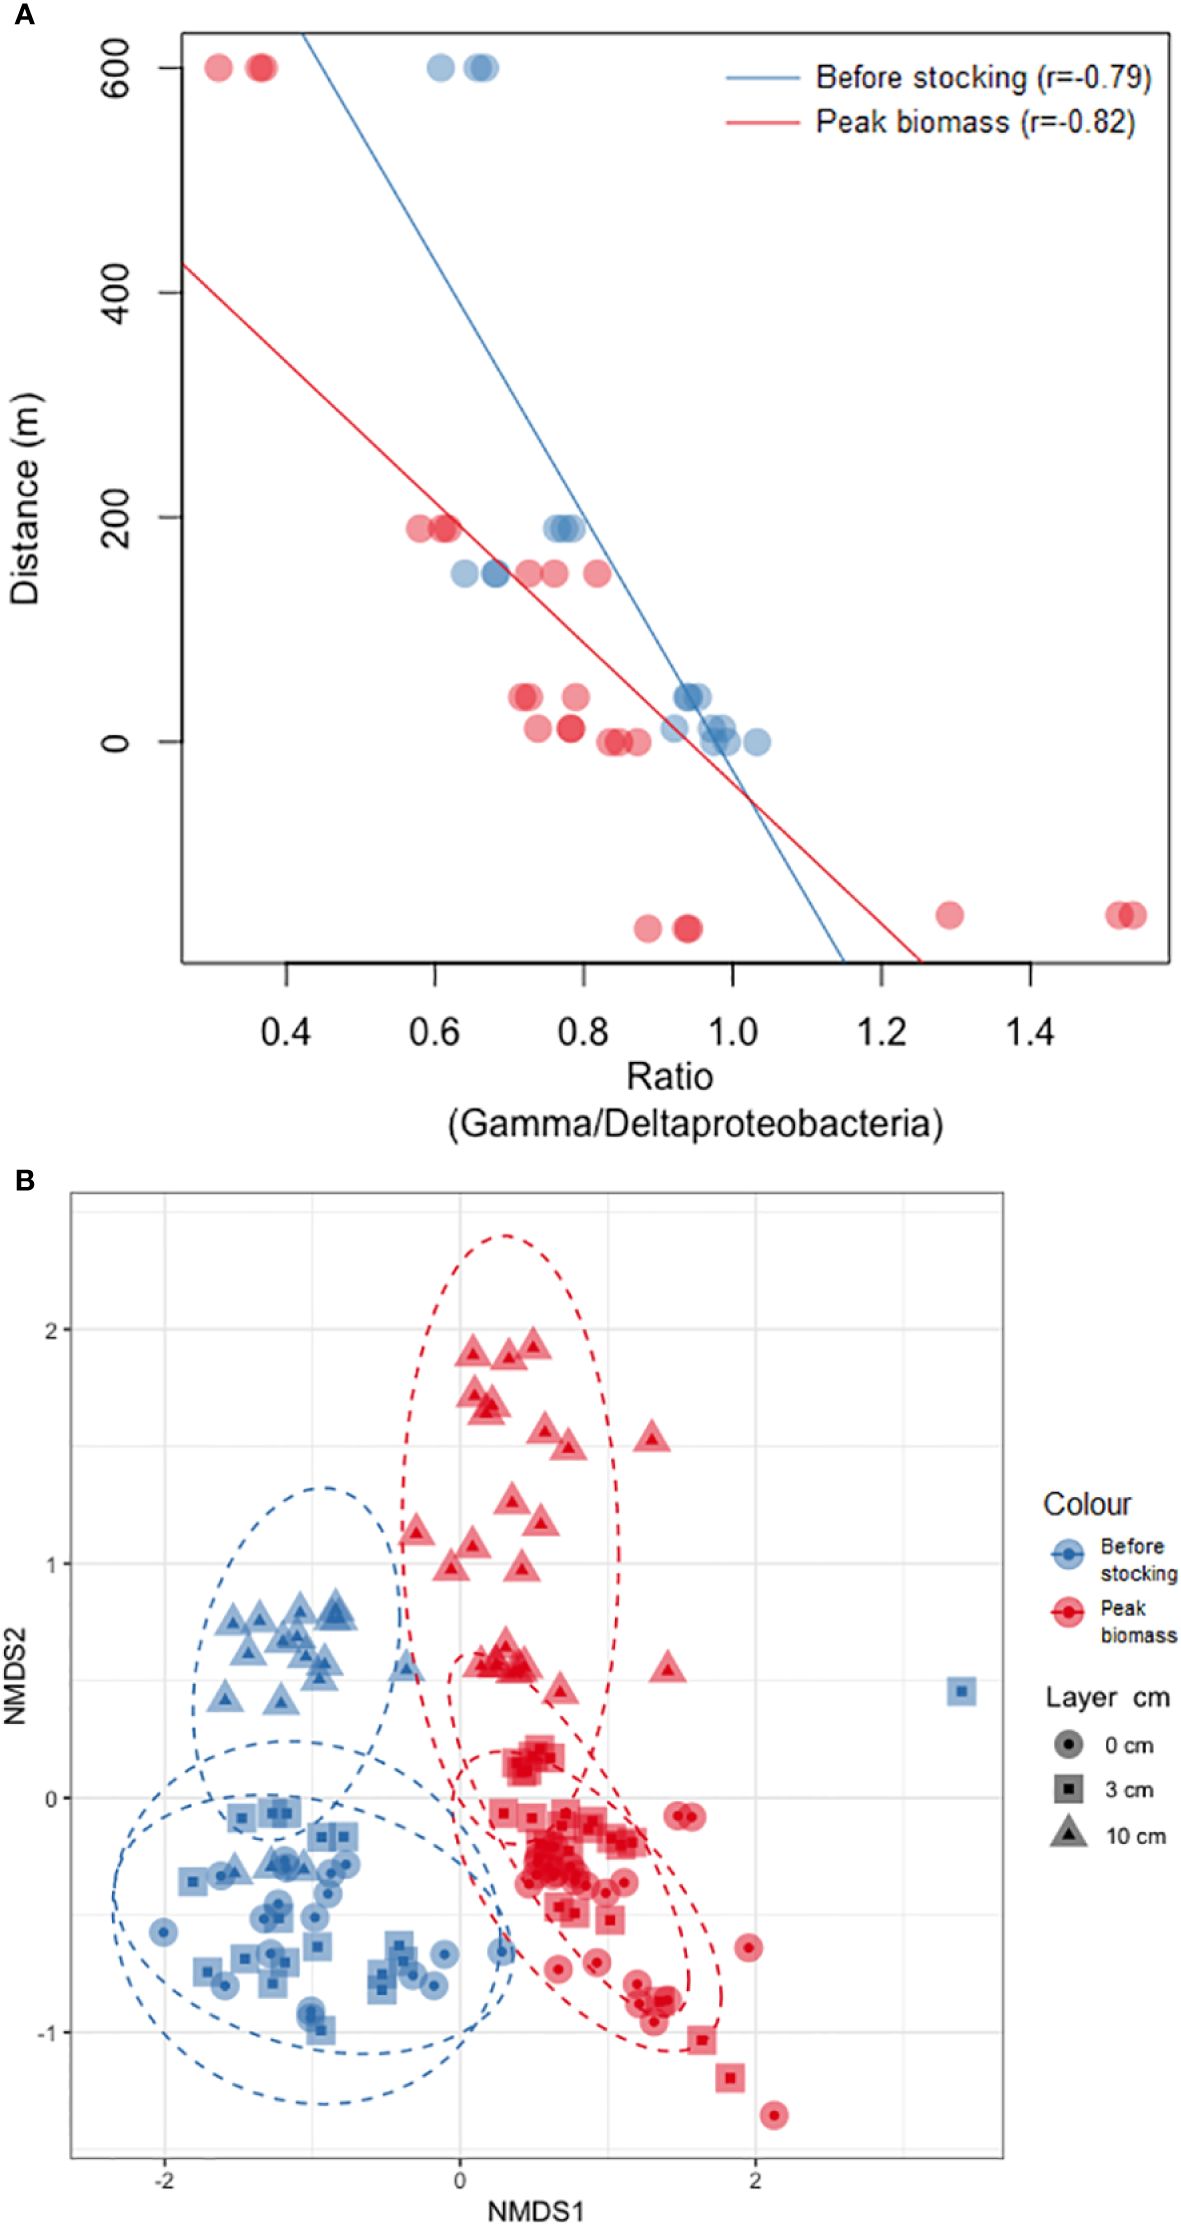
Figure 3. (A) NMDS-ordination of Bray Curtis dissimilarity distance matrix between microbial communities. Blue = before stocking and red = peak biomass. Circle = 0 cm, square = 3 cm, and triangle = 10 cm. The oval dots are ellipses. (B) Ratio plot of gamma/deltaproteobacteria. Blue = before stocking and red = peak biomass. X-axes ratio and y-axes distance in m.
To determine significant differences in microbial communities in salmon biomass, samples, and sample layers, we conducted an analysis of similarity (ANOSIM) using the R package vegan (Oksanen et al., 2013). We set the number of permutations to 9999. In addition, we did an indicator taxa analysis with the R package ‘indicspecies’ (Cáceres and Legendre, 2009) with 9999 permutations. The analysis was done on distance from cages and layer in the sediment core. This analysis was performed on data agglomerated at the family level due to the high number of species in our samples. The resulting data from this was used to interpret our data and elucidate some trends seen in our dataset (Figure 4; Supplementary Files 6, 8-10).
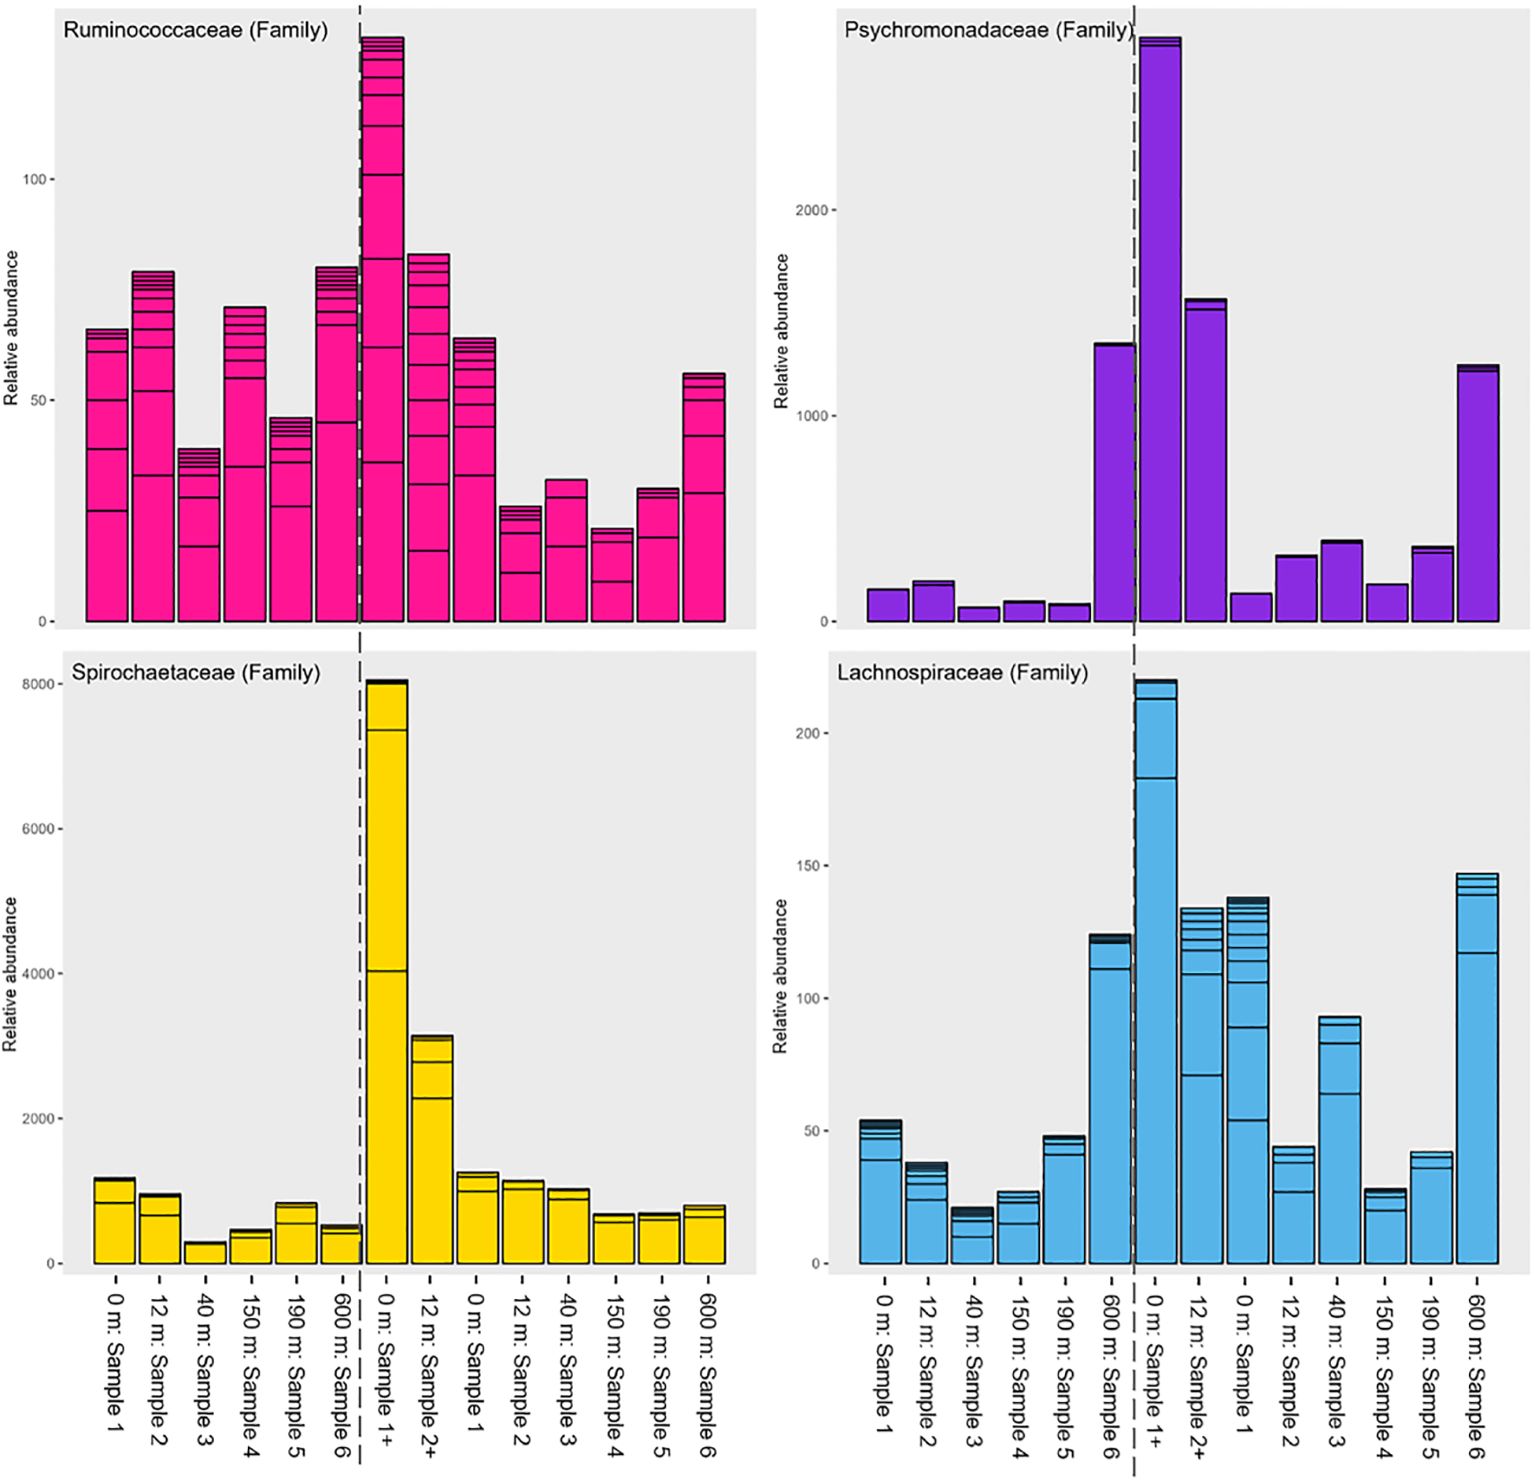
Figure 4. Relative abundance barplot of families Ruminococcaceae, Psychromonadaceae, Spirochaetaceae and Lachnospiraceae. Starting from the left ‘before stocking’ samples sites are followed by ‘peak biomass’ sample sites. X-axis show the distance from the cages and the y-axis show a quantitative display of the relative abundances.
Results
National environmental condition assessment
During the ‘before stocking’ sampling, all cage stations were generally categorized as ‘some impact’, except for one (RS21), which was categorized as having ‘no impact’ (environmental protection agency, unpublished data). The assessment also categorized the measurements of the sediment pH and redox values as ‘some impact’. The sediment appeared dark with a strong odour and had a semi-soft texture. At RS20, the organic-enrichment tolerant species Capitella capitata (gallery worm) and molluscs were found and identified on-site through visual observation as sediment from the grab was percolated through a sieve. Additionally, C. capitata was also found at RS28. During ‘peak biomass’, the overall condition was once again categorized as ‘some impact’ – one cage was categorized to have a ‘very high impact’ (RS30), two had a ‘high impact’ (RS29 and RS31), six had ‘some impact’ (RS24-RS28), and three had ‘no impact’ (RS20, RS22, RS23). At RS20, the pH- and redox values were categorized as having ‘no impact’, while the values for RS28 indicated a ‘high impact’. RS20 had a pale sediment colour, whereas the sediment in RS28 was dark with a strong smell. The sediment type was sand in all locations (unpublished data).
Microbial diversity and community structure
Overall, 14,407,470 high-quality reads were obtained after quality filtering. These reads were utilized for all downstream analyses. The blanks (no template controls) showed minimal to no reads (median = 5 reads), while DNA extraction negatives had a higher read count (median = 1,050 reads), though significantly lower compared to successful samples. Only a total of 30 ASVs were found in the blanks (Supplementary File 4). Out of the initial 138 samples, 122 remained after quality filtering, excluding blanks, DNA negatives, and three samples with fewer than 19,000 reads. The sequences were clustered into 201,345 ASVs, of which 9,440 (4.69%) could not be assigned to a phylum and were termed “NA”. The rest of the ASVs (191,928) could be assigned to phyla or lower taxonomic classes, and 48,930 ASVs (24.28%) could be taxonomically assigned to the genus level. Only 207 (0.11%) ASVs could be taxonomically assigned down to the species level. For the filtered data (all samples with > 19,000 reads), the average number of reads/sample was significantly higher at ‘before stocking’ with 173,693 compared to 75,387 reads/sample for ‘peak biomass’. Most samples contained between 50,000 and 200,000 reads. Although there were significantly higher reads/sample from ‘before stocking’ none of the samples reached an asymptote in the rarefaction curve (Supplementary File 3). In comparison, all samples in the ‘peak biomass’, with fewer reads/sample, reached an asymptote. This implies that, despite this sequencing run yielding an exceptionally high number of reads, the diversity is even greater than reported in this study (Figure 2). The observed richness was significantly higher at ‘before stocking’ (Figure 2). All the ‘before stocking’ sample sites were significantly higher than all the ‘peak biomass’ sites. Furthermore, ‘before stocking’ sample 0 m and 12 m were significantly different than all the other samples (Supplementary File 5).
Nonmetric multidimensional scaling (NMDS) based on Bray-Curtis dissimilarities revealed that benthic bacterial community patterns changed significantly between the two sampling events, with no visual overlap between ‘before stocking’ and ‘peak biomass’ (ANOSIM: p<0.001, Figure 3A). The bacterial community patterns were similar for both sampling events, with the 0 and 3 cm layer and the 10 cm sediment layer being distinctly different from each other (p<0.001). There is a strong negative correlation between distance from the salmon cages and gamma/deltaproteobacteria ratio at both ‘before stocking’ (r = -0.79) and ‘peak biomass’ (r = -0.82) (Figure 3B).
The following families: Spirochaetaceae, Marinifilaceae, Ruminococcaceae, Psychromonadaceae, and Lachnospiraceae, were among those with the largest shifts in relative abundance with distance from the cages to reference site, based on the indicator species test and figures (Figure 4; Supplementary Files 6, 8, 9). The same tendency was observed for Deltaproteobacteria, while Gammaproteobacteria showed the opposite pattern (Supplementary Files 7, 9). At the 600 m location during ‘peak biomass’, some of these bacterial families increased again.
The surface layer and the 3 cm depth layer exhibited similar trends. Both layers displayed a large variation in microbial biodiversity and abundance (Supplementary File 9) within and between sampling events and sites. The 10 cm depth layer displayed a more even distribution across all the sampling sites and events. The analysis of indicator taxa across depth layers revealed that the surface layer and the 3 cm depth layer shared more similar indicator taxa compared to the combination of the other two layers (3 + 10 cm depth layer, surface+10 cm depth layer). The ‘indicspecies’ analysis identified numerous indicator taxa across both distance and depth layers, consistently highlighting the previously mentioned bacterial families (e.g., Spirochaetaceae, Marinifilaceae, Psychromonadaceae).
Discussion
Microbial diversity
Taxa richness was significantly higher in all three sediment layers in ‘before stocking’ (Figure 2), and the microbial community structure was significantly different between ‘before stocking’ and ‘peak biomass’ (Figure 3). This aligns with recent studies, where they found a general tendency that richness increased from cage edge towards reference sites (Verhoeven et al., 2018; Dully et al., 2021; Frühe et al., 2021b). However, other research has reported opposite trends in richness patterns compared to our results (Bissett et al., 2007; Kawahara et al., 2009; Frühe et al., 2021b), or no change at all (Zhang et al., 2008; Kawahara et al., 2009). These contradictions likely arise from the complex relationship of environmental parameters influencing microbial diversity and community composition (Hornick and Buschmann, 2018; Dully et al., 2021), including factors such as seasonal variations, hydrology, biogeographic regions, sediment texture, and aquafarm-specific conditions (Frühe et al., 2021b).
The microbial richness also showed a consistent pattern of increasing with distance away from the cages (Figure 2), particularly in the 0 cm and 3 cm sediment layers in ‘before stocking’. These patterns are clear indications that the microbial communities in the sediments are affected by the aquaculture farming, most likely due to the decreasing effect of the aquaculture farming with distance from the source of organic material. Because the higher richness with distance pattern is most significant during ‘before stocking’ we believe that, although this is the lowest impact period of the salmon farming cycle, the microbial communities have not made a full recovery before the rings are re-stocked.
‘Before stocking’ samples also showed a high standard deviation (SD) among the replicates (Figure 2), which may be explained by some heterogeneity in the sediment that becomes more evident and prominent as the alpha diversity increases, i.e. microenvironments may not be distributed evenly in the three replicates from each sediment depth. However, the highest richness measurement is at least an order of magnitude higher from the lowest, making our results reliable. Although Sørvágsfjørður is a highly dynamic fjord and impact of organic input to Faroese fjords from aquaculture is thought to not exceed 200 m (Mortensen et al., 2021), these results indicate otherwise, at least regarding the microbial communities. Research conducted elsewhere shows that greater dispersal at dispersive sites results in larger benthic footprints, extending up to 300-500 meters from the farm (Keeley et al., 2013b; Keeley et al., 2013a; Keeley et al., 2019), compared to non-dispersive sites with effects typically within 150 meters (Brooks et al., 2002; Forrest et al., 2007; Keeley et al., 2019). The significantly different microbial community structure between the sampling events, including the 10 cm depth layer, indicates a significant impact on microbial communities extending to at least 10 cm below the sediment surface (Figure 3A). Although the habitat in coastal muddy sediments naturally undergo significant vertical changes, transitioning from aerobic conditions to anoxic sulfidic conditions (Jørgensen et al., 2019), it is not believed to mix sediments down to 10 cm. However, these results are most likely due to organic enrichment at the surface that somehow affects the biogeochemical processes deep into the sediments.
Microorganisms associated with salmon farming
Organic enrichment impacts biogeochemical processes and microbial community in the sediment beneath fish cages, consistent with prior research (Holmer et al., 2005; Bissett et al., 2007; Dully et al., 2021). Significant differences were between the microbial communities between the sampling events (Figure 3A), supporting previous studies (Bissett et al., 2007 and Hornick and Buschmann, 2018), however, a few groups showed some particular patterns. The Gammaproteobacteria dominated in more distant areas (190-600 m), while Deltaproteobacteria were more abundant closer to the cages (0-12 m), which is consistent with the findings of Kawahara et al. (2009), Stoeck et al. (2018), and Dully et al. (2021). This pattern was primarily observed in the sediment surface layer, suggesting that surface sediments may be more sensitive to changes from the cages above.
The bacterial families Spirochaetaceae, Clostridia (Lachnospiraceae, Ruminococcaceae, and Defluviitaleaceae), and Psychromonadaceae showed higher relative abundance at 0-12 m sample sites both ‘before stocking’ and during ‘peak biomass’ (Figure 4; Supplementary File 8), aligning with previous research (Verhoeven et al., 2018; Frühe et al., 2021b; Miranda et al., 2021). Frühe et al. (2021a) identified Psychromonadaceae, Ruminococcaceae, and Spirochaetaceae as ‘high impact’ indicators, consistent with our findings near salmon cages (Figure 4; Supplementary File 8). Several bacterial families that Frühe et al. (2021a) found most abundant far from the cages were more prevalent at moderate distances (40-150 m) in our study, such as Pirellulaceae (Supplementary File 8). The reference site located 600 m from the cages, was closer to land at shallower depths (≈35 m vs. ≈45 m at other sites), potentially influencing the results. Thus, compared to Frühe’s (2021) findings, the reference site may not accurately represent bacteria like Pirellulaceae but still appears to be slightly affected by aquaculture activities. Nonetheless, the Gamma/Deltaproteobacteria ratio (Figure 3B) showed a consistent pattern across all sample sites with Gammaproteobacteria peaking at the reference point where Deltaproteobacteria were least abundant (Supplementary File 7). Uniformity in the ratio for both sampling events strengthen the reference site’s suitability. Moreover, the pronounced disparity between the two sample events underscores the influence on the reference sample. The reference sample site adheres to ASC (Aquaculture Stewardship Council) requirements (>500 m) (Mortensen et al., 2021). However, transferring such measures across aquaculture sites worldwide can be challenging because Faroese fjords are highly dynamic. Moreover, Faroese fjords are small, making it difficult to find locations over 500 meters away that are neither too close to land nor in the open ocean for sample collection.
Verhoeven et al. (2018) reported large-scale phylum shifts, including increases in Bacteroidetes, Firmicutes, and Spirochaetes, as well as decreases in Proteobacteria and Epsilonbacteraeota near salmon cages, broadly corroborating with our findings (Figure 4; Supplementary Files 6, 8). These shifts occurred prominently from ‘before stocking’ to ‘peak biomass’, especially in surface layer (samples 1+ and 2+). However, in this study, all sample sites showed an increase in Epsilonbacteraeota (especially family Sulfurovaceae) from ‘before stocking’ to ‘peak biomass’, differing from Verhoeven et al. (2018) but consistent with Keeley et al. (2021) (Supplementary File 6). The Sulfurovaceae are sulphur producing bacteria that play key roles in sulphur, nitrogen, and hydrogen cycles, in marine sediments with high organic enrichment (Miranda et al., 2021), indicating a significant input of organic material into many of the studied sample sites.
Notably, Bacteroidia increased as biomass grew, particularly near the cages during ‘peak biomass’, with several Bacteroidia families notably abundant in the samples at 0-12 m, including Bacteroidetes-BD2-2, Lentimicrobiaceae, Prolixibacteraceae, Marinifilaceae, while Flavobacteriaceae showed lower relative abundance. This finding is consistent with Miranda et al. (2021) but contrasts with Frühe (2021). The contradicting results can be attributed to the metabolic versatility of Flavobacteriaceae, a taxonomic group widely distributed in various environments (Dully et al., 2021; Frühe et al., 2021b; Miranda et al., 2021). This versatility of Flavobacteriaceae is supported by observing the genus level, where various Flavobacteriaceae species dominated different locations (Supplementary File 10). Lutibacter exhibit higher abundance closer to the cages, while Actibacter prevailed in more distant sites. Lutimonas emerged as the predominant genus of Flavobacteriaceae across all sample sites, maintaining consistent abundance except for sample 1+, where it was notably lower. Leontidou et al. (2023) highlighted Lutimonas as a potential bioindicator of compromised environmental quality due to organic enrichment. To draw any concrete conclusions about Flavobacteriaceae genus patterns, further research is needed.
Using microorganisms as an environmental indicator
Our study highlights the changes in the microbial community structure over a salmon cycle, particularly near the cages (0 – 12 m). These structural changes might be associated with salmon size, as larger salmon release more faecal material and require more food for growth, leading to increased organic matter (OM) accumulation on the seabed (Quero et al., 2020). Although various unexplored factors, such as OM accumulation, sediment resuspension, seasonality, and biotic interactions, may contribute to prokaryotic assemblage variations, this study demonstrates microbial community changes over one salmon farming cycle (‘before stocking’ and ‘peak biomass’). Further analysis of these factors is warranted for a deeper understanding. However, the correlation of the Gamma/Deltaproteobacteria ratio (Figure 3B) with distance suggests that the ‘before stocking’ sampling area may still be affected by the previous production cycle, indicating a potentially insufficient 3-month fallowing period. Concurrently with this study, the environmental condition assessment concluded ‘some impact’ at both sampling events. However, an environmental assessment conducted when the biomass was half of the expected maximum (March 2020, between our two sampling events) observed ‘no impact’ on the sediment (unpublished data). This can be supported by the fact that the post-hoc analysis showed 0 m sample in ‘before stocking’ significantly differed from all other samples, except for ‘before stocking’ sample 12 m, suggesting the 0 m site might not have fully recovered from previous cycle(s) (Supplementary File 5). One possible explanation is the exposed farming conditions in the Faroe Islands (ICES, 2023) and the seasonal variations during the farming cycle (September 2019 to July 2020).
During winter, the area is exposed to ocean swells, with significant wave heights reaching 5-6 meters. Research indicates that ocean swells can resuspend sediments affected by fish farming, notably enhancing sediment conditions, particularly when wave heights exceed 1.5 m and depths shallower than 50 m (Norði and Patursson, 2012). Reduced biomass and feeding activity during winter result in less OM accumulation on the seabed. Considering seasonal variations and local factors (e.g., depth, temperature, currents, waves, wind, tides, bottom conditions) is essential when determining the fallowing period. This supports the utility of microbial communities for assessing these dynamic and exposed farming sites, given their rapid response time, making them sensitive to environmental change and thus an effective indicator for sediment health. For future research, prioritizing the utilization of multiple reference sites might be crucial for effective monitoring of microbial community data as indicators of ecosystem health. Robust baseline data reflecting environmental impacts, unaffected by anthropogenic influences, are essential. In this study, the positioning of the reference site closer to shore and at shallower depths may have influenced results. The overall trend, exemplified by e.g. Gamma/Deltaproteobacteria ratio, suggests some level of impact. However, determining whether this impact stems from aquaculture activities or from the reference site’s proximity to land and associated influences remains challenging and should be a priority for future research.
Prioritizing exposed locations for farming can help reduce environmental impacts, as OM becomes more dispersed across a larger area (Keeley et al., 2013b; Keeley et al., 2019). Transitioning from sheltered sites to locations with strong currents and wave exposure can enhance water quality, resulting in increased oxygen saturation and elevated water exchange. This, in turn, would reduce infection pressure due to the more rapid dispersal of infectious sea lice in areas with strong currents (Kragesteen et al., 2018; Johannesen et al., 2020). However, it is crucial to acknowledge that exposed conditions impose greater demands on the cages and may entail unforeseen costs for fish farms (Johannesen et al., 2020).
Environmental monitoring in the Faroe Islands includes various measurements, including pH, redox potential, OM chemistry, copper and zinc concentrations, sensorial measures of colour and odour, and macroinvertebrates studies. Although some of these standards are subjective, they are well-integrated into local aquaculture procedures and cycles. To optimize environmental assessment methodologies, analysing the microbial communities offers a promising alternative for future research. Microorganisms quickly respond to environmental changes, outpacing macroinvertebrates in their responsiveness to such fluctuations. These analyses provide more information using less material (approximately 3 g of sediment compared to 500-1000 g) and, if expanded to other genetic markers (e.g., 18S rRNA, 12S rRNA, COI), potentially yield diversity estimates of macroorganisms present in the same sample. Moreover, it proves cost-effective by providing more comprehensive data at a lower expense compared to traditional methods (Dully et al., 2021).
One current drawback is the time required to obtain sequencing results, often taking weeks to months. However, with integration into standard survey procedures and allocation of dedicated resources (including personnel, facilities, and bioinformatic pipelines), it should be possible to reduce this time to a few days or real-time with techniques such as nanopore sequencing. To fully replace current methods with DNA metabarcoding, national and international guidelines are essential for result comparisons across countries and aquaculture farms. These standardized methods should include indicator ASV databases focusing on microbial ASVs as universal bioindicators sensitive to salmon farm impacts, regardless of geospatial effects or natural seasonality (Keeley et al., 2018; Dully et al., 2021; Frühe et al., 2021a). DNA metabarcoding holds the potential to provide a powerful tool for adjusting aquaculture farming practices to be more sustainable, profitable, and environmentally friendly.
Data availability statement
The data presented in the study are deposited in the Dryad repository, accession number: doi:10.5061/dryad.s7h44j1g2. Link to Dataset: https://doi.org/doi:10.5061/dryad.s7h44j1g2.
Author contributions
BOJ: Investigation, Writing – original draft, Writing – review & editing. SOM: Investigation, Supervision, Writing – review & editing. EM: Supervision, Writing – review & editing. EJP: Funding acquisition, Writing – review & editing. GáN: Writing – review & editing. AD: Formal analysis, Investigation, Methodology, Supervision, Validation, Writing – review & editing.
Funding
The author(s) declare financial support was received for the research, authorship, and/or publication of this article. This study was funded by the aquaculture farming company Hiddenfjord and supported by the University of the Faroe Islands. Hiddenfjord allowed us to use their farming site as a study location and was not involved in the study design, collection, analysis, interpretation of data, the writing of this article, or the decision to submit it for publication.
Acknowledgments
Thanks to laboratory technicians Erla Eliasen and Marjun í Túni Mortensen for their guidance in the laboratory, and to Amanda Vang for her assistance with Illumina sequencing. A special thanks to Hiddenfjord for allowing us to investigate their aquaculture farm, and to BioFAR for their assistance on the boat when collecting the samples and lending their equipment, such as the kayak corer.
Conflict of interest
Author GáN is employed by the company Firum. EJP is employed by the company Hiddenfjord. BOJ is presently an employee of SMJ Consulting Engineers, which also deals with biology-relevant consultations.
The remaining authors declare that the research was conducted in the absence of any commercial or financial relationships that could be construed as a potential conflict of interest.
Publisher’s note
All claims expressed in this article are solely those of the authors and do not necessarily represent those of their affiliated organizations, or those of the publisher, the editors and the reviewers. Any product that may be evaluated in this article, or claim that may be made by its manufacturer, is not guaranteed or endorsed by the publisher.
Supplementary material
The Supplementary Material for this article can be found online at: https://www.frontiersin.org/articles/10.3389/fmars.2024.1266410/full#supplementary-material
References
Agency. (2018). Environmental Surveillance of Aquaculture at Sea. Available online at: https://www.us.fo/vernd/a-sjogvi/.
Ape F., Manini E., Quero G. M., Luna G. M., Sarà G., Vecchio P., et al. (2019). Biostimulation of in situ microbial degradation processes in organically-enriched sediments mitigates the impact of aquaculture. Chemosphere 226, 715–725. doi: 10.1016/j.chemosphere.2019.03.178
Apprill A., McNally S., Parsons R., Weber L. (2015). Minor revision to V4 region SSU rRNA 806R gene primer greatly increases detection of SAR11 bacterioplankton. Aquat. Microbial Ecol. 75, 129–137. doi: 10.3354/ame01753
Asami H., Aida M., Watanabe K. (2005). Accelerated sulfur cycle in coastal marine sediment beneath areas of intensive shellfish aquaculture. Appl. Environ. Microbiol. 71, 2925–2933. doi: 10.1128/AEM.71.6.2925-2933.2005
Bannister R. J., Johnsen I. A., Hansen P. K., Kutti T., Asplin L. (2016). Near- and far-field dispersal modelling of organic waste from Atlantic salmon aquaculture in fjord systems. ICES J. Mar. Sci. 73, 2408–2419. doi: 10.1093/icesjms/fsw027
Bannister R., Valdemarsen T., Hansen P., Holmer M., Ervik A. (2014). Changes in benthic sediment conditions under an Atlantic salmon farm at a deep, well-flushed coastal site. Aquaculture Environ. Interact. 5, 29–47. doi: 10.3354/aei00092
Bissett A., Burke C., Cook P. L. M., Bowman J. P. (2007). Bacterial community shifts in organically perturbed sediments. Environ. Microbiol. 9, 46–60. doi: 10.1111/j.1462-2920.2006.01110.x
Black K. D., Kiemer M. C. B., Ezzi I. A. (1996). The relationships between hydrodynamics, the concentration of hydrogen sulphide produced by polluted sediments and fish health at several marine cage farms in Scotland and Ireland. J. Appl. Ichthyology 12, 15–20. doi: 10.1111/j.1439-0426.1996.tb00053.x
Brooks K. M., Mahnken C., Nash C. (2002). Environmental effects associated with marine netpen waste with emphasis on salmon farming in the Pacific northwest. Responsible Marine Aquaculture. CABI Publishing, pp. 159–203. doi: 10.1079/9780851996042.0000
Brown J. R., Gowen R. J., McLusky D. S. (1987). The effect of salmon farming on the benthos of a Scottish sea loch. J. Exp. Mar. Biol. Ecol. 109, 39–51. doi: 10.1016/0022-0981(87)90184-5
Buschmann A. H., Riquelme V. A., Hernández-González M. C., Varela D., Jiménez J. E., Henríquez L. A., et al. (2006). A review of the impacts of salmonid farming on marine coastal ecosystems in the southeast Pacific. ICES J. Mar. Sci. 63, 1338–1345. doi: 10.1016/j.icesjms.2006.04.021
Cáceres M. D., Legendre P. (2009). Associations between species and groups of sites: indices and statistical inference. Ecology 90, 3566–3574. doi: 10.1890/08-1823.1
Callahan B. J., McMurdie P. J., Rosen M. J., Han A. W., Johnson A. J. A., Holmes S. P. (2016). DADA2: High-resolution sample inference from Illumina amplicon data. Nat. Methods 13, 581–583. doi: 10.1038/nmeth.3869
Carroll M. L., Cochrane S., Fieler R., Velvin R., White P. (2003). Organic enrichment of sediments from salmon farming in Norway: environmental factors, management practices, and monitoring techniques. Aquaculture 226, 165–180. doi: 10.1016/S0044-8486(03)00475-7
Djurhuus A., Port J., Closek C. J., Yamahara K. M., Romero-Maraccini O., Walz K. R., et al. (2017). Evaluation of filtration and DNA extraction methods for environmental DNA biodiversity assessments across multiple trophic levels. Front. Mar. Sci. 4. doi: 10.3389/fmars.2017.00314
Dully V., Balliet H., Frühe L., Däumer M., Thielen A., Gallie S., et al. (2021). Robustness, sensitivity and reproducibility of eDNA metabarcoding as an environmental biomonitoring tool in coastal salmon aquaculture – An inter-laboratory study. Ecol. Indic. 121, 107049. doi: 10.1016/j.ecolind.2020.107049
FAO. (2018). World Review. In The State of World Fisheries and Aquaculture. 1–83. doi: 10.18356/eeca78e4-en
FAO. (2022). The State of World Fisheries and Aquaculture 2022: Towards Blue Transformation. (Rome: FAO) 2022 266. doi: 10.4060/cc0461en
Folke C., Kautsky N. (1989). The role of ecosystems for sustainable development of aquaculture. AMBIO 18, 234–243.
Forrest B., Keel ey N., Gillespie P., Hopkins G., Kn ight B., Govier D. (2007). Review of the Ecological Effects of Marine Finfish Aquaculture: Final Report. Available online at: https://www.cawthron.org.nz/media_new/publications/pdf/2014_07/CR1285-Review_of_the_ecological_effects_of_marine_finfish_aquaculture_Final_report.pdf
Frühe L., Cordier T., Dully V., Breiner H., Lentendu G., Pawlowski J., et al. (2021a). Supervised machine learning is superior to indicator value inference in monitoring the environmental impacts of salmon aquaculture using eDNA metabarcodes. Mol. Ecol. 30, 2988–3006. doi: 10.1111/mec.15434
Frühe L., Dully V., Forster D., Keeley N. B., Laroche O., Pochon X., et al. (2021b). Global trends of benthic bacterial diversity and community composition along organic enrich. Front. Microbiol. 12. doi: 10.3389/fmicb.2021.637811
Gaard E., Norði G.Á., Simonsen K. (2011). Environmental effects on phytoplankton production in a Northeast Atlantic fjord, Faroe Islands. J. Plankton Res. 33, 947–959. doi: 10.1093/plankt/fbq156
Gowen R. J., Bradbury N. B. (1987). The ecological impact of salmonid farming in coastal waters: a review. Oceanogr Mar. Biol. 25, 563–575.
Hargrave B., Duplisea D., Pfeiffer E., Wildish D. (1993). Seasonal changes in benthic fluxes of dissolved oxygen and ammonium associated with marine cultured Atlantic salmon. Mar. Ecol. Prog. Ser. 96, 249–257. doi: 10.3354/meps096249
Hargrave B. T., Holmer M., Newcombe C. P. (2008). Towards a classification of organic enrichment in marine sediments based on biogeochemical indicators. Mar. pollut. Bull. 56, 810–824. doi: 10.1016/j.marpolbul.2008.02.006
Holmer M., Wildish D., Hargrave B. (2005). Organic enrichment from marine finfish aquaculture and effects on sediment biogeochemical processes. In Hargrave B. T. Environmental Effects of Marine Finfish Aquaculture 181–206. The Handbook of Environmental Chemistry, vol 5M. Berlin, Heidelberg: Springer. doi: 10.1007/b136010
Hornick K. M., Buschmann A. H. (2018). Insights into the diversity and metabolic function of bacterial communities in sediments from Chilean salmon aquaculture sites. Ann. Microbiol. 68, 63–77. doi: 10.1007/s13213-017-1317-8
Hyland J., Balthis L., Karakassis I., Magni P., Petrov A., Shine J., et al. (2005). Organic carbon content of sediments as an indicator of stress in the marine benthos. Mar. Ecol. Prog. Ser. 295, 91–103. doi: 10.3354/meps295091
ICES. (2023). Workshop on the Faroes Ecoregion Aquaculture Overview (WKFaroesAO) (Copenhagen: ICES Scientific Reports), 87. doi: 10.17895/ices.pub.21551541
Johannesen Á., Patursson Ø., Kristmundsson J., Dam S. P., Klebert P. (2020). How caged salmon respond to waves depends on time of day and currents. PeerJ 8, e9313. doi: 10.7717/peerj.9313
Jørgensen B. B., Findlay A. J., Pellerin A. (2019). The biogeochemical sulfur cycle of marine sediments. Front. Microbiol. 10. doi: 10.3389/fmicb.2019.00849
Karakassis I., Tsapakis M., Hatziyanni E., Papadopoulou K.-N., Plaiti W. (2000). Impact of cage farming of fish on the seabed in three Mediterranean coastal areas. ICES J. Mar. Sci. 57, 1462–1471. doi: 10.1006/jmsc.2000.0925
Kawahara N., Shigematsu K., Miyadai T., Kondo R. (2009). Comparison of bacterial communities in fish farm sediments along an organic enrichment gradient. Aquaculture 287, 107–113. doi: 10.1016/j.aquaculture.2008.10.003
Keeley N., Cromey C., Goodwin E., Gibbs M., Macleod C. (2013a). Predictive depositional modelling (DEPOMOD) of the interactive effect of current flow and resuspension on ecological impacts beneath salmon farms. Aquaculture Environ. Interact. 3, 275–291. doi: 10.3354/aei00068
Keeley N., Forrest B. M., Macleod C. K. (2013b). Novel observations of benthic enrichment in contrasting flow regimes with implications for marine farm monitoring and management. Mar. pollut. Bull. 66, 105–116. doi: 10.1016/j.marpolbul.2012.10.024
Keeley N., Laroche O., Birch M., Pochon X. (2021). A substrate-independent benthic sampler (SIBS) for hard and mixed-bottom marine habitats: A proof-of-concept study. Frontiers 8. doi: 10.3389/fmars.2021.627687
Keeley N., Valdemarsen T., Woodcock S., Holmer M., Husa V., Bannister R. (2019). Resilience of dynamic coastal benthic ecosystems in response to large-scale finfish farming. Aquaculture Environ. Interact. 11, 161–179. doi: 10.3354/aei00301
Keeley N., Wood S. A., Pochon X. (2018). Development and preliminary validation of a multi-trophic metabarcoding biotic index for monitoring benthic organic enrichment. Ecol. Indic. 85, 1044–1057. doi: 10.1016/j.ecolind.2017.11.014
Kragesteen T., Simonsen K., Visser A., Andersen K. (2018). Identifying salmon lice transmission characteristics between Faroese salmon farms. Aquaculture Environ. Interact. 10, 49–60. doi: 10.3354/aei00252
Kristensen E. (2000). Organic matter diagenesis at the oxic:anoxic interface in coastal marine sediments, with emphasis on the role of burrowing animals. Hydrobiologia 426, 1–24. doi: 10.1023/A:1003980226194
Leontidou K., Rubel V., Stoeck T. (2023). Comparing quantile regression spline analyses and supervised machine learning for environmental quality assessment at coastal marine aquaculture installations. PeerJ 11, e15425. doi: 10.7717/peerj.15425
Love M. I., Huber W., Anders S. (2014). Moderated estimation of fold change and dispersion for RNA-seq data with DESeq2. Genome Biol. 15, 550. doi: 10.1186/s13059-014-0550-8
McCaig A. E., Phillips C. J., Stephen J. R., Kowalchuk G. A., Harvey S. M., Herbert R. A., et al. (1999). Nitrogen cycling and community structure of proteobacterial beta-subgroup ammonia-oxidizing bacteria within polluted marine fish farm sediments. Appl. Environ. Microbiol. 65, 213–220. doi: 10.1128/AEM.65.1.213-220.1999
McMurdie P. J., Holmes S. (2013). phyloseq: an R package for reproducible interactive analysis and graphics of microbiome census data. PLoS One 8, e61217. doi: 10.1371/journal.pone.0061217
McMurdie P. J., Holmes S. (2014). Waste not, want not: why rarefying microbiome data is inadmissible. PLoS Comput. Biol. 10, e1003531. doi: 10.1371/journal.pcbi.1003531
Miranda R. M., Aguila-Torres P., Aranda C. P., Maldonado J., Casado A. (2021). Taxonomy and diversity of bacterial communities associated with marine sediments from Chilean salmonid farms. Aquaculture Res. 52, 1605–1620. doi: 10.1111/are.15014
Mortensen H., Carstensen J., Andreasen B., Johannesen T. T., Fjallstein B. V. T., Norði G.á. (2021). Benthic macrofauna classification system for Faroese fjords Vol. Fiskaaling Rit 2021-10 (Hvalvík: Fiskaaling), 54.
Neofitou N., Vafidis D., Klaoudatos S. (2010). Spatial and temporal effects of fish farming on benthic community structure in a semi-enclosed gulf of the Eastern Mediterranean. AQUACULTURE Environ. Interact 1, 95-105. doi: 10.3354/aei00010
Norði G. á., Glud R. N., Gaard E., Simonsen K. (2011). Environmental impacts of coastal fish farming: carbon and nitrogen budgets for trout farming in Kaldbaksfjør 7 ur (Faroe Islands). Mar. Ecol. Prog. Ser. 431, 223–241. doi: 10.3354/meps09113
Norði G., Lund I., Andreasen B., Taylor D., Johannesen T. T., Jacobsen B., et al. (2023). Modeling particulate waste assimilation by blue mussels within the spatial constraints of a commercial fish farm: implications for multitrophic aquaculture. Front. Mar. Sci. 10. doi: 10.3389/fmars.2023.1236294
Norði G., Patursson Ø. (2012). Influence of waves and current speed on resuspension of fish farm waste: Case study in Funningsfjørður (Faroe Islands). ICES CM 2012/Q:13.
Oksanen J., Blanchet F. G., Kindt R., Legendre P. (2013). Vegan: Community Ecology. R. Package Version 2.5-7.
Parada A. E., Needham D. M., Fuhrman J. A. (2015). Every base matters: assessing small subunit rRNA primers for marine microbiomes with mock communities, time series and global field samples. Environ. Microbiol. 18, 1403–1414. doi: 10.1111/1462-2920.13023
Pawlowski J., Bruce K., Panksep K., Aguirre F. I., Amalfitano S., Apothéloz-Perret-Gentil L., et al. (2022). Environmental DNA metabarcoding for benthic monitoring: A review of sediment sampling and DNA extraction methods. Sci. Total Environ. 818, 151783. doi: 10.1016/j.scitotenv.2021.151783
Price C., Black K., Hargrave B., Morris J. (2015). Marine cage culture and the environment: effects on water quality and primary production. Aquaculture Environ. Interact. 6, 151–174. doi: 10.3354/aei00122
Quero G. M., Ape F., Manini E., Mirto S., Luna G. M. (2020). Temporal changes in microbial communities beneath fish farm sediments are related to organic enrichment and fish biomass over a production cycle. Front. Mar. Sci. 7. doi: 10.3389/fmars.2020.00524
R Core Team. (2020). R: A language and environment for statistical computing. R Foundation for Statistical Computing, Vienna, Austria. Available at: https://www.R-project.org/.
Schendel E., Nordstrom S., Lavkulich L. (2004). Floc and sediment properties and their environmental distribution from a marine fish farm. Aquaculture Res. 35, 483–493. doi: 10.1111/j.1365-2109.2004.01042.x
Stoeck T., Frühe L., Forster D., Cordier T., Martins C. I. M., Pawlowski J. (2018). Environmental DNA metabarcoding of benthic bacterial communities indicates the benthic footprint of salmon aquaculture. Mar. pollut. Bull. 127, 139–149. doi: 10.1016/j.marpolbul.2017.11.065
Sweetman A. K., Norling K., Gunderstad C., Haugland B. T., Dale T. (2014). Benthic ecosystem functioning beneath fish farms in different hydrodynamic environments. Limnology Oceanography 59, 1139–1151. doi: 10.4319/lo.2014.59.4.1139
Verhoeven J. T. P., Salvo F., Knight R., Hamoutene D., Dufour S. C. (2018). Temporal bacterial surveillance of salmon aquaculture sites indicates a long lasting benthic impact with minimal recovery. Front. Microbiol. 9. doi: 10.3389/fmicb.2018.03054
Zhang W., Song L., Ki J.-S., Lau C.-K., Li X.-D., Qian P.-Y. (2008). Microbial diversity in polluted harbor sediments II: Sulfate-reducing bacterial community assessment using terminal restriction fragment length polymorphism and clone library of dsrAB gene. Estuarine Coast. Shelf Sci. 76, 682–691. doi: 10.1016/j.ecss.2007.07.039
Keywords: salmon farming, organic enrichment, aquaculture disturbance, microbial community composition, microbial diversity, community shifts, metabarcoding, environmental monitoring
Citation: Johansen BO, Mikalsen S-O, Magnussen E, Patursson EJ, á Norði G and Djurhuus A (2024) Impacts on microbial communities in sediments by aquaculture farming during one salmon cycle. Front. Mar. Sci. 11:1266410. doi: 10.3389/fmars.2024.1266410
Received: 25 July 2023; Accepted: 18 June 2024;
Published: 09 August 2024.
Edited by:
Michael Rappe, University of Hawaii at Manoa, United StatesReviewed by:
Sandi Orlic, Rudjer Boskovic Institute, CroatiaPrabhugouda Siriyappagouder, Nord University, Norway
Levente Bodrossy, Oceans and Atmosphere (CSIRO), Australia
Copyright © 2024 Johansen, Mikalsen, Magnussen, Patursson, á Norði and Djurhuus. This is an open-access article distributed under the terms of the Creative Commons Attribution License (CC BY). The use, distribution or reproduction in other forums is permitted, provided the original author(s) and the copyright owner(s) are credited and that the original publication in this journal is cited, in accordance with accepted academic practice. No use, distribution or reproduction is permitted which does not comply with these terms.
*Correspondence: Bjarta O. Johansen, b2piamFydGFAZ21haWwuY29t; Anni Djurhuus, QW5uaS5kanVyaHV1c0BnbWFpbC5jb20=