 Peng Li1
 Shenliang Chen
 Hongyu Ji
 Yaoshen Fan
 Yinghai Ke
95% of researchers rate our articles as excellent or good
Learn more about the work of our research integrity team to safeguard the quality of each article we publish.
Find out more
ORIGINAL RESEARCH article
Front. Mar. Sci. , 30 October 2023
Sec. Coastal Ocean Processes
Volume 10 - 2023 | https://doi.org/10.3389/fmars.2023.1234631
This article is part of the Research Topic Understanding Coastal Estuaries and Wetlands Modelling and Management Requirements under Climate Change Effects View all 8 articles
River deltas rank among the most ecologically and socio-economically valuable environments on the planet. The Yellow River Delta in China is not only home to young wetland ecosystem, but also to world-renowned tourism resources. One of these was the unique yellow-blue demarcation line (YBDL), formed in the Yellow River Estuary (YRE) as a result of the meeting of terrestrial sediment-laden river water and clear sea water, which had developed into a famous attraction and generated significant tourism revenues. Moreover, its distribution was of vital ecological and geomorphological importance due to association with the dynamics of estuarine turbidity plume. However, little is yet known about the dynamics and influencing factors of YBDL. In this study, we proposed an integrated method for extracting YBDL from satellite imagery and investigated the spatiotemporal distributions of YBDL during the flood season (June-October) from 2016 to 2022 using multi-source satellite imageries. The average relative error of our algorithm reached 10.53%. The results indicated that the YBDL started to frequently occur after 2018, mainly distributed within 10 km off the YRE, with two types of short straight and long curved shapes. July was the period with the highest frequency and most widespread distribution of YBDL. The riverine water and sediment discharge controlled 45.9% of the variations in YBDL length, and the extreme flooding, as well as the implementation of Water-Sediment Regulation Scheme, significantly increased the distribution extent of the YBDL. The morphology of river distributary mouths dominated the changes in the YBDL distribution centres, and the north distributary mouth experienced dramatic evolution in the last three years, with an increased YBDL distribution. Tidal currents could promote the development of YBDL at the front of the river mouth plumes while inhibiting the YBDL on the other side. This study is the first systematic investigation of the spatiotemporal evolutions and driving mechanisms of YBDL in the YRE, which could provide a reference for tourism planning and YRE National Park construction.
River deltas are densely populated areas in the global land-to-ocean interface, providing not only essential ecosystem goods and services, but also one of the most socially and economically valuable environments on the planet (Temmerman et al., 2013; Guo et al., 2021). However, they are highly sensitive to increasing risks resulting from human activity, land subsidence, regional water management, global sea level rise and climate change (Anthony et al., 2010; Tessler et al., 2015; Hoitink and Jay, 2016). Furthermore, river damming and land-use changes affected sediment supply to deltas and could lead to substantial changes to coastal landscapes, including coastal erosion, channel avulsions and loss of habitat and associated ecosystems (Latrubesse et al., 2017; Nienhuis et al., 2020; Fluet-Chouinard et al., 2023). The Yellow River Delta (YRD) in China is one of the most active deltas in the world and was classified as a National Nature Reserve, with not only a young wetland ecosystem but also a wealth of tourism resources (Lv and Liu, 2010; Ji et al., 2018; Zhi et al., 2023). The development of tourism resources was influenced by the evolution of YRD system and attention needed to be paid to balancing ecological conservation and socio-economics (Li and Meng, 2011; Li et al., 2017; Zhi et al., 2023).
The YRD Ecotourism Zone was home to three world-class tourism features, including nascent natural wetlands, rare and endangered bird species and river-sea confluence sites (Lv and Liu, 2010). One of these was magical and visually striking yellow-blue demarcation line (YBDL) off the estuary, which referred to the distinct dividing line between the yellow-coloured river water rich in suspended sediment and the clear blue-coloured sea water (Figure 1E). During the flood season (June to October), the cruise ships traveled down the river from the jetty (Figure 1D) to the estuary for visiting YBDL, which generated significant financial revenue for the local tourism industry (Zhi et al., 2023). In recent years, with the establishment of the Yellow River Estuary (YRE) National Park, the tourism development of YBDL has been given high attention by the local government (Li and Meng, 2011). However, little was yet known about the spatiotemporal dynamics of YBDL and its driving factors. Therefore, it is urgent needed to investigate the YBDL distributions to provide a scientific basis for planning the sustainable development of the tourism industry in YRD.
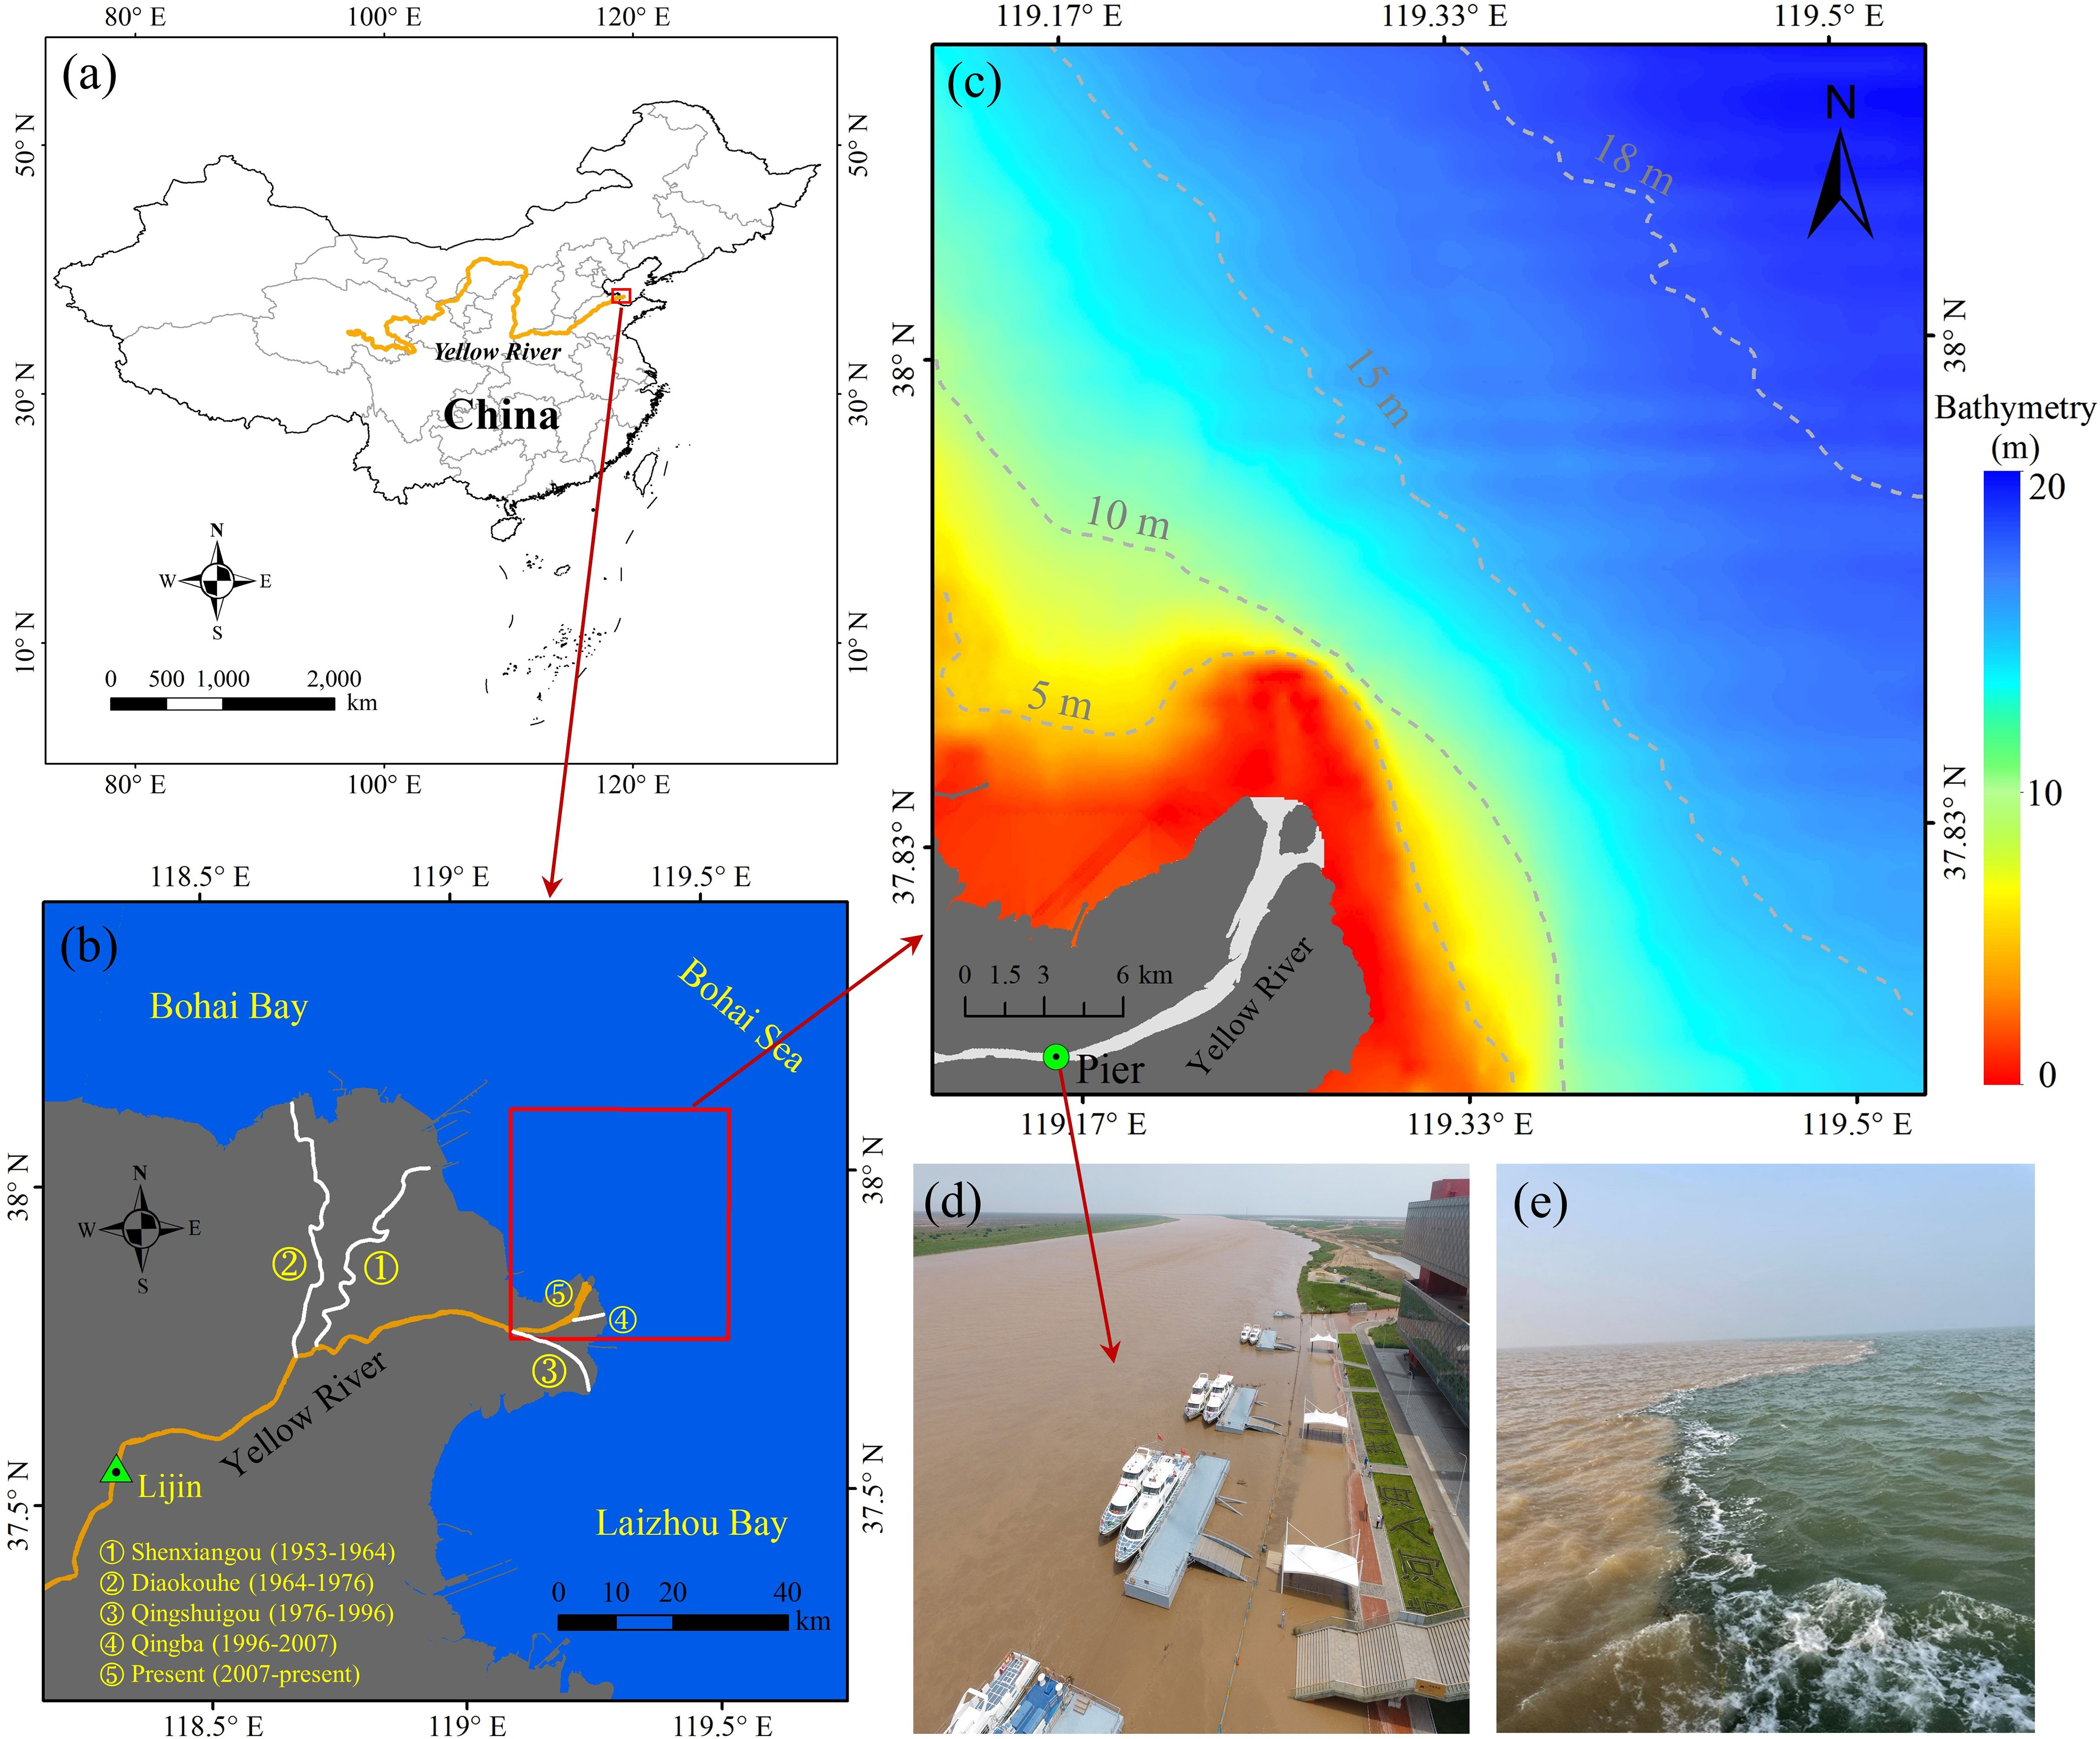
Figure 1 Geographic location of (A) the Yellow River Basin and (B) the Yellow River Delta, with the study area depicted by the red box. (C) Topography of the study area (depth in meter). The green circle indicates the location of tour ship’s dock. (D) Aerial photograph of the pier. (E) Field picture of YBDL in the estuary.
The YBDL was often found near the river mouth, located on the edge of the turbidity plume during the flood season (Figure S1B in Supplementary Material). Its distributions could not only characterize the dispersion extent of terrestrial suspended particulate matter (SPM) that had a significant impact on the aquatic ecosystem and morphological evolution of estuary (Chen et al., 2017; Wang et al., 2017a; Ji et al., 2018), but also indicate the variations in local hydrodynamic conditions (Luo et al., 2017). As a result of strong association with the estuarine plume, the distributions of YBDL were marked by dramatic changes and affected by various factors, such as riverine input, ocean dynamics and estuarine evolution (Wang et al., 2017b; Yao et al., 2020; Cheng et al., 2021; Li et al., 2021a). However, in the last few years there had been significant variations in the water discharge and sediment load from the Yellow River into the sea, resulting in a new river delivery regime under the influence of human activity (Figure S2 in Supplementary Material) (Ji et al., 2018; Wu et al., 2022). The water and sediment regulation scheme (WSRS) had been implemented continuously for 14 years (2002-2015), was disrupted in 2016 and 2017 dry years (Wang et al., 2022). During the WSRS, ~30% and ~50% of the annual water and sediment were discharged into the sea within 20 days, resulting in a huge high-turbidity plume in the estuary (Wang et al., 2017c; Li et al., 2021a). After 2018, the WSRS was implemented again and differed from the previous WSRS processes by discharging more runoff and sediment to the sea (Figure S2). In addition, several major flood events occurred during the flood seasons of 2020 and 2021 because of the extreme rainfall in the basin (Figure S3) (Fu et al., 2023). The rapid delivery of high-energy runoff and enormous amounts of sediment into the sea would not only reshape the estuarine morphology, but also inevitably have a profound impact on the spatiotemporal dynamics of YBDL (Li et al., 2021a; Li et al., 2022a; Lu et al., 2022).
The YBDL is essentially the dividing line between high-turbidity water and clear water, where abrupt changes in SPM concentrations are noticeable (Figure S1), making it possible to identify the location of YBDL from the SPM distribution derived from satellite imagery (Yao et al., 2020; Li et al., 2021a). The latest Landsat-8/9 Operational Land Imager (OLI) and Sentinel-2A/B MultiSpectral Instrument (MSI) had the advantages of high spatial resolution, high signal-to-noise ratio, high radiometric resolution, and narrower near-infrared bands compared to traditional high-resolution satellite sensors, which could provide higher-accuracy SPM in highly turbid coastal waters (Lymburner et al., 2016; Pahlevan et al., 2019). Moreover, the combination of the two sensors can easily achieve a revisit time of 2-3 days globally, which is essential to capture the dynamics of YBDL considering cloud cover (Kuhn et al., 2019). However, sun-synchronous satellites could only acquire the instantaneous SPM distributions at the time of satellite overpass and cannot provide intraday SPM variations. To deal with this problem, a spatiotemporal data fusion method specifically for YRE had recently been proposed to generate 30-m hourly SPM products by fusing OLI (MSI) and Geostationary Ocean Color Imager (GOCI) (Zhu et al., 2016; Li et al., 2021a). Edge detection was recognized as a tool to extract the boundary of a specific image. The classical Canny edge detection algorithm provided more stable and precise results compared to the Sobel detector, Laplacian detector, Robert detector and Prewitt detector because of its three criteria for optimizing edge detection (Canny, 1986; Hossain et al., 2021; Hu and Wang, 2022). Therefore, the algorithm might have the potential to accurately extract the locations of YBDL from SPM images.
The objectives of this study are to: (1) propose an integrated method to extract YBDL off the Yellow River estuary by combining SPM remote sensing inversion, spatiotemporal data fusion algorithm and Canny edge detection algorithm; (2) characterize the dynamics of YBDL in the flood seasons (June-October) of 2016-2022 based on the time-intensive satellite images; and (3) analyze the evolutionary mechanisms of YBDL variations, including river input, channel bifurcation and marine dynamics, and present recommendations for the YBDL tourism scheme.
The Yellow River Delta is located in the southwest of the Bohai Sea, sandwiched between Bohai Bay and Laizhou Bay (Figure 1B). It has a warm temperate continental monsoon climate, with an annual average temperature of 11.5-12.4°C and annual average rainfall of 590.9 mm. Since the 1950s, the deltaic channels shifted frequently, in the order of Shenxiangou channel (1953-1964), Diaokouhe channel (1964-1976), Qingshuigou channel (1976-present). The Qingshuigou channel was further shifted into Qingba channel (1996-2007) and bifurcated into the present distributary channels since 2007 (Bi et al., 2021). In the last 10 years, no major shifts occurred in the Qingba channel, but the estuarine branches were still undergoing frequent fine-tuning as a result of the accumulation of large amounts of sediment (Li et al., 2022a). Our study area was located in the present estuary, approximately 1500 km2, covering the regions where the YBDL were likely to appear (Figure 1C). In this area, the tides are irregular semi-diurnal, with the flood tide towards southeast and the ebb tide towards northwest (Wang et al., 2017b). Mild southerly winds (3-6 m/s) prevail in summer, while strong northerly winds (>10 m/s) occur frequently in winter. The suspended matter in the estuary is dominated by silt and clay (Wang et al., 2014).
In this research, we used 40 Landsat-8/9 OLI images and 73 Sentinel-2A/B MSI images acquired during the flood seasons of 2016-2022 (Figure 2). A total of 292 Sentinel-2 MSI images were actually used, as it took four images to provide complete coverage of the study area. Note that considering the less available images in summer caused by cloud cover, we did not discard the images with thin cloud cover, but extracted the YBDL from them by visual interpretation in order to increase the observation frequency of YBDL as much as possible. Furthermore, 16 hourly GOCI imageries acquired on October 4, 2018 and July 20, 2020 were selected to assess the impacts of flood and ebb tides on YBDL variations off the estuary.
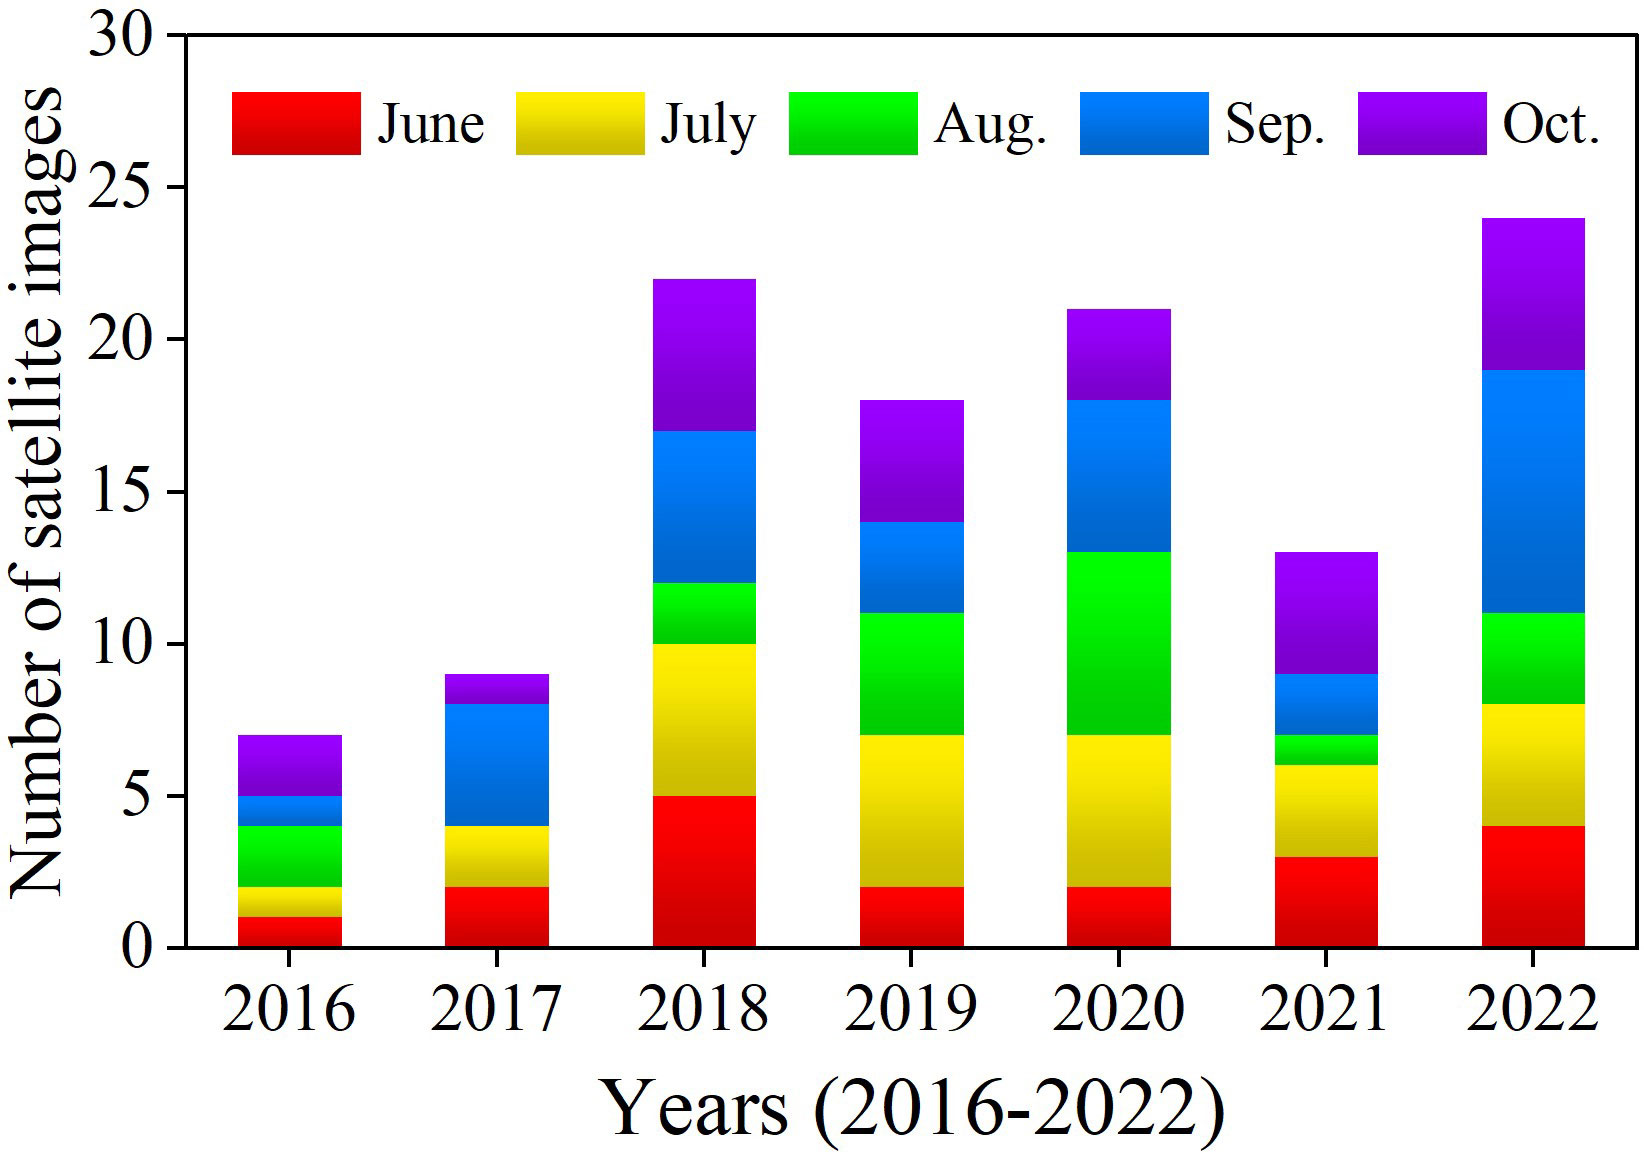
Figure 2 Number of Landsat OLI and Sentinel-2 MSI images used in each month.
The OLI is carried on two satellites, launched in February 2013 (Landsat-8) and December 2020 (Landsat-9), and have eight multispectral bands covering the visible near infrared (VNIR) to the shortwave infrared (SWIR) and a spatial resolution of 30 m. It overpasses the study area at about 10:40 local time, with a 16-day repeat cycle for a single satellite. The MSI is also carried on two satellites, Sentinel-2A launched in June 2015 and Sentinel-2B launched in March 2017, with a transit time of 10:40-10:50 and a revisit period of 5 days. It provides 13 spectral bands ranging from VNIR to SWIR with 10 to 60 m spatial resolutions. The bands involved in this study are all of 10-m spatial resolution. GOCI provides 8-band imagery covering visible to near-infrared (NIR) bands hourly from 08:30 to 15:30 local time every day with a spatial resolution of 500 m. It is carried on Communicate Ocean and Meteorological Satellite (COMS), launched in June 2010, and stopped transmitting data to the ground in March 2021.
We downloaded the Level-1b Landsat-8/9 OLI datasets from the U.S. Geological Survey’s remote sensing image database (http://earthexplorer.usgs.gov/), Level-1 Sentinel-2A/B MSI datasets from the European Space Agency (https://sentinel.esa.int/web/sentinel/), and Level-1b COMS GOCI images from the Korean Ocean Satellite Center (https://kosc.kiost.ac.kr/). Clouds in the OLI and MSI images were masked using the Quality Assessment (QA) bands of the Landsat and Sentinel-2 datasets. All images were re-projected to the WGS84 UTM 50N projection. Landsat OLI and Sentinel-2 MSI images were atmospherically corrected using the dark spectrum fitting (DSF) algorithm (Vanhellemont, 2019) embedded in the ACOLITE software package (http://odnature.naturalsciences.be/remsem/acolite/). GOCI imageries were atmospherically corrected using the Management Unit of the North Sea Mathematical Models (MUMM) (Ruddick et al., 2000) embedded in SeaWiFS Data Analysis System (SeaDAS, version 8.1.0) software (https://seadas.gsfc.nasa.gov/). The accuracy of the above atmospheric correction algorithms in the YRE had been validated using in-situ measurements (Li et al., 2019; Li et al., 2022b).
The daily riverine runoff and sediment load data at the Lijin Station, the closest hydrological gauging stations to estuary (green triangle in Figure 1B), were collected from the China River Sediment Bulletin (http://www.mwr.gov.cn/sj/tjgb/zghlnsgb/). Hourly wind speed data with the spatial resolution of 0.25° × 0.25° was obtained from the European Centre for Medium-Range Weather Forecasts (https://cds.climate.copernicus.eu/).
In this study, we employed the SPM retrieval models developed in our previous studies for Landsat-8 OLI, Sentinel-2 MSI and COMS GOCI, respectively (Li et al., 2021a). The validations of satellite-derived SPM demonstrated that our SPM retrieval models had high accuracy, with the average coefficient of determination R2 > 0.92, and the relative percent difference RPD< 22%. The models for Sentinel-2 MSI (Landsat-8 OLI) and COMS GOCI were expressed by Eqs. (1) and (2), respectively.
Where , , and were the Rrs at the red, green, and NIR bands of the OLI/MSI/GOCI, respectively. Note that Landsat 8 OLI and Sentinel-2 MSI shared the same model, as both Rrs and SPM derived from the two sensors agreed well (Pahlevan et al., 2019; Li et al., 2021b).
In this study, a combined strategy of SPM quantitative inversion model and Canny edge detection algorithm was used to extract the locations of YBDL. The flowchart for YBDL extraction was shown in Figure 3. The Canny algorithm was the key to the whole framework and consisted of four steps (Canny, 1986):
1. Smoothing the image with a Gaussian filter to eliminate noise. Considering that the sharp drop in SPM concentration at the river mouth would have an impact on the effectiveness of the Canny algorithm, we used image as the input to the algorithm (Figure 3C).
2. The gradient magnitude and direction of each pixel in the image were calculated using an effective gradient operator.
3. Non-maximum suppression was performed to accurately locate the position of the edge point.
4. Double thresholds were defined to determine potential edges. The pixel was excluded if its gradient magnitude was lower than the minimum threshold, and the pixel was defined as a strong edge and was kept for the final result if its gradient was higher than the maximum threshold. The pixel between the two thresholds was marked as weak edge. If the weak edge was adjacent to the strong edge, it was retained in the final result; otherwise, it was removed. In this study, we found that when the threshold was set at 0.05-0.20, the complete distribution of YBDL could be accurately extracted, while suppressing most of the spurious edges (Figure 3E).
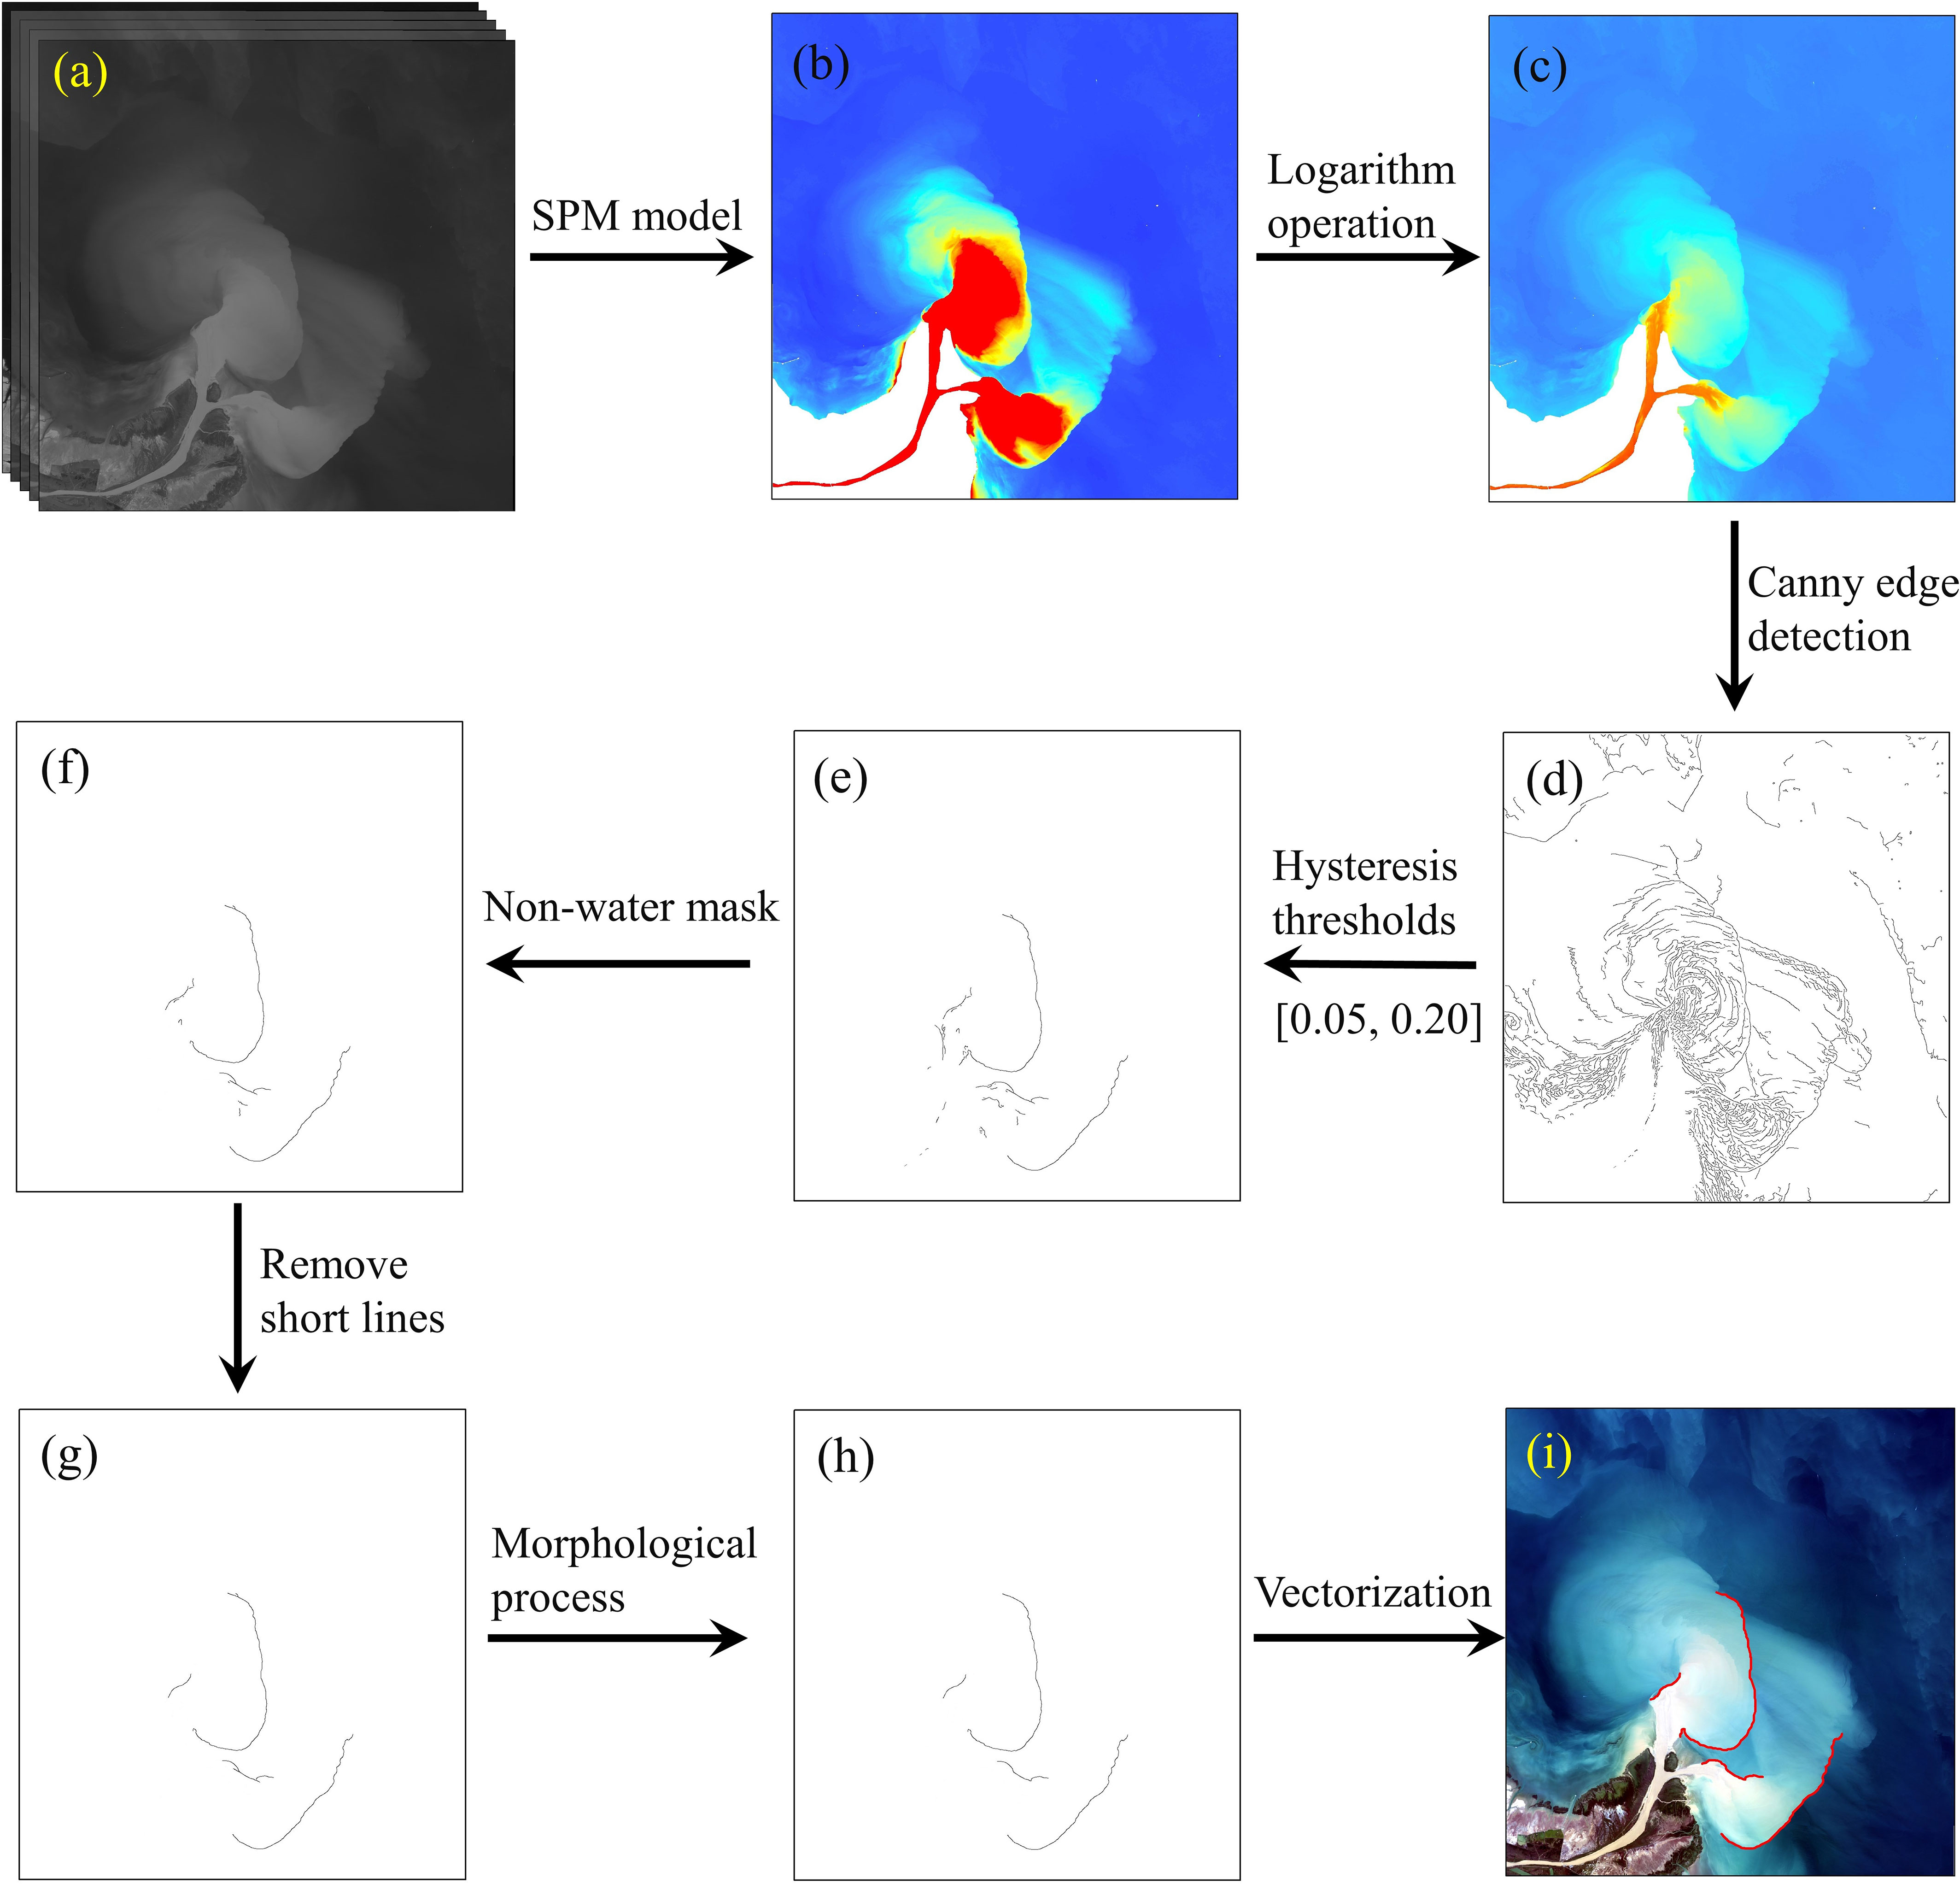
Figure 3 Flowchart of YBDL extraction in this study.
Several morphological approaches were used to further process the edge detection results, including non-water masking, short lines or pixels removing, dilation and erosion, and skeletal centreline extraction (Figures 3F–H). The initial non-water mask file was generated by overlaying the land layer, obtained using MNDWI and Otsu algorithm (Li et al., 2019), with the QA band layer. To eliminate spurious edges around non-aqueous pixels, the non-water layer was expended 1 km outwards to produce a new mask file (Figure 3F). Then, short line segments of less than 30 pixels or discrete points were removed. To deal with the disadvantage of line discontinuities caused by Canny algorithm (Hu and Wang, 2022), A series of morphological procedures were performed on the images using MATLAB software (Figure 3H).
To obtain the hourly YBDL distributions, a spatiotemporal data fusion strategy was used to generate hourly 30-m SPM results (Figure S4 in Supplementary Material). The method was improved on the classic Flexible Spatiotemporal Data Fusion (FSDAF) algorithm to adapt to the highly turbid and strongly variable waters in the YRE (Zhu et al., 2016; Li et al., 2021b). It took full account of the differences in imaging time and sensor radiance between fine-resolution imageries (OLI and MSI) and coarse-resolution imageries (GOCI), not only improving the accuracy of GOCI-derived SPM, but also providing the clear boundaries of the estuarine plume. More detailed algorithm descriptions were found in Li et al. (2021).
A depth-averaged hydrodynamic model which was set up based on TELEMAC suite centred at the YRE was utilized to investigate the tide dynamics and complex current field (Ji et al., 2020). The model considered the river-tide dynamics and was validated with the root-mean square error (RMSE) and the correlation efficient (CC) of 8.2-28.2 cm/s and over 0.84 in water levels, 5.6-30.2 cm/s and over 0.8 in current velocities, which was proved to perform well to simulate hydrodynamics at the YRE (Ji et al., 2020; Ji et al., 2022). In this study, the model was run for the period June-Oct. in 2018, June-Oct. in 2019 and June-Jul. in 2020 with prescribed flow discharge of 1500 m3/s. Hourly tide levels at the given location and current velocities were extracted to reveal the hydrodynamic conditions near the active YRE (Figure S5 in Supplementary Material).
To assess the accuracy of YBDL extraction, we randomly selected 15 images and compared the differences between the YBDL automatically extracted by our method and the results of visual interpretation (Figure 4). These imageries were typically representative, covering all the months involved in this study and the multiple distribution patterns of the YBDL. It could be seen that the locations of the YBDL extracted by our approach were in good agreement with the visual results, and the difference in YBDL length was also minor, with an average relative error of 10.53% (Figure 4). Furthermore, there were few omissions and redundancies for YBDL (Marked by black and purple ellipse in Figure 4). Thus, the comparisons indicated that our algorithm had high practicability and robustness for the YBDL at the YRE.
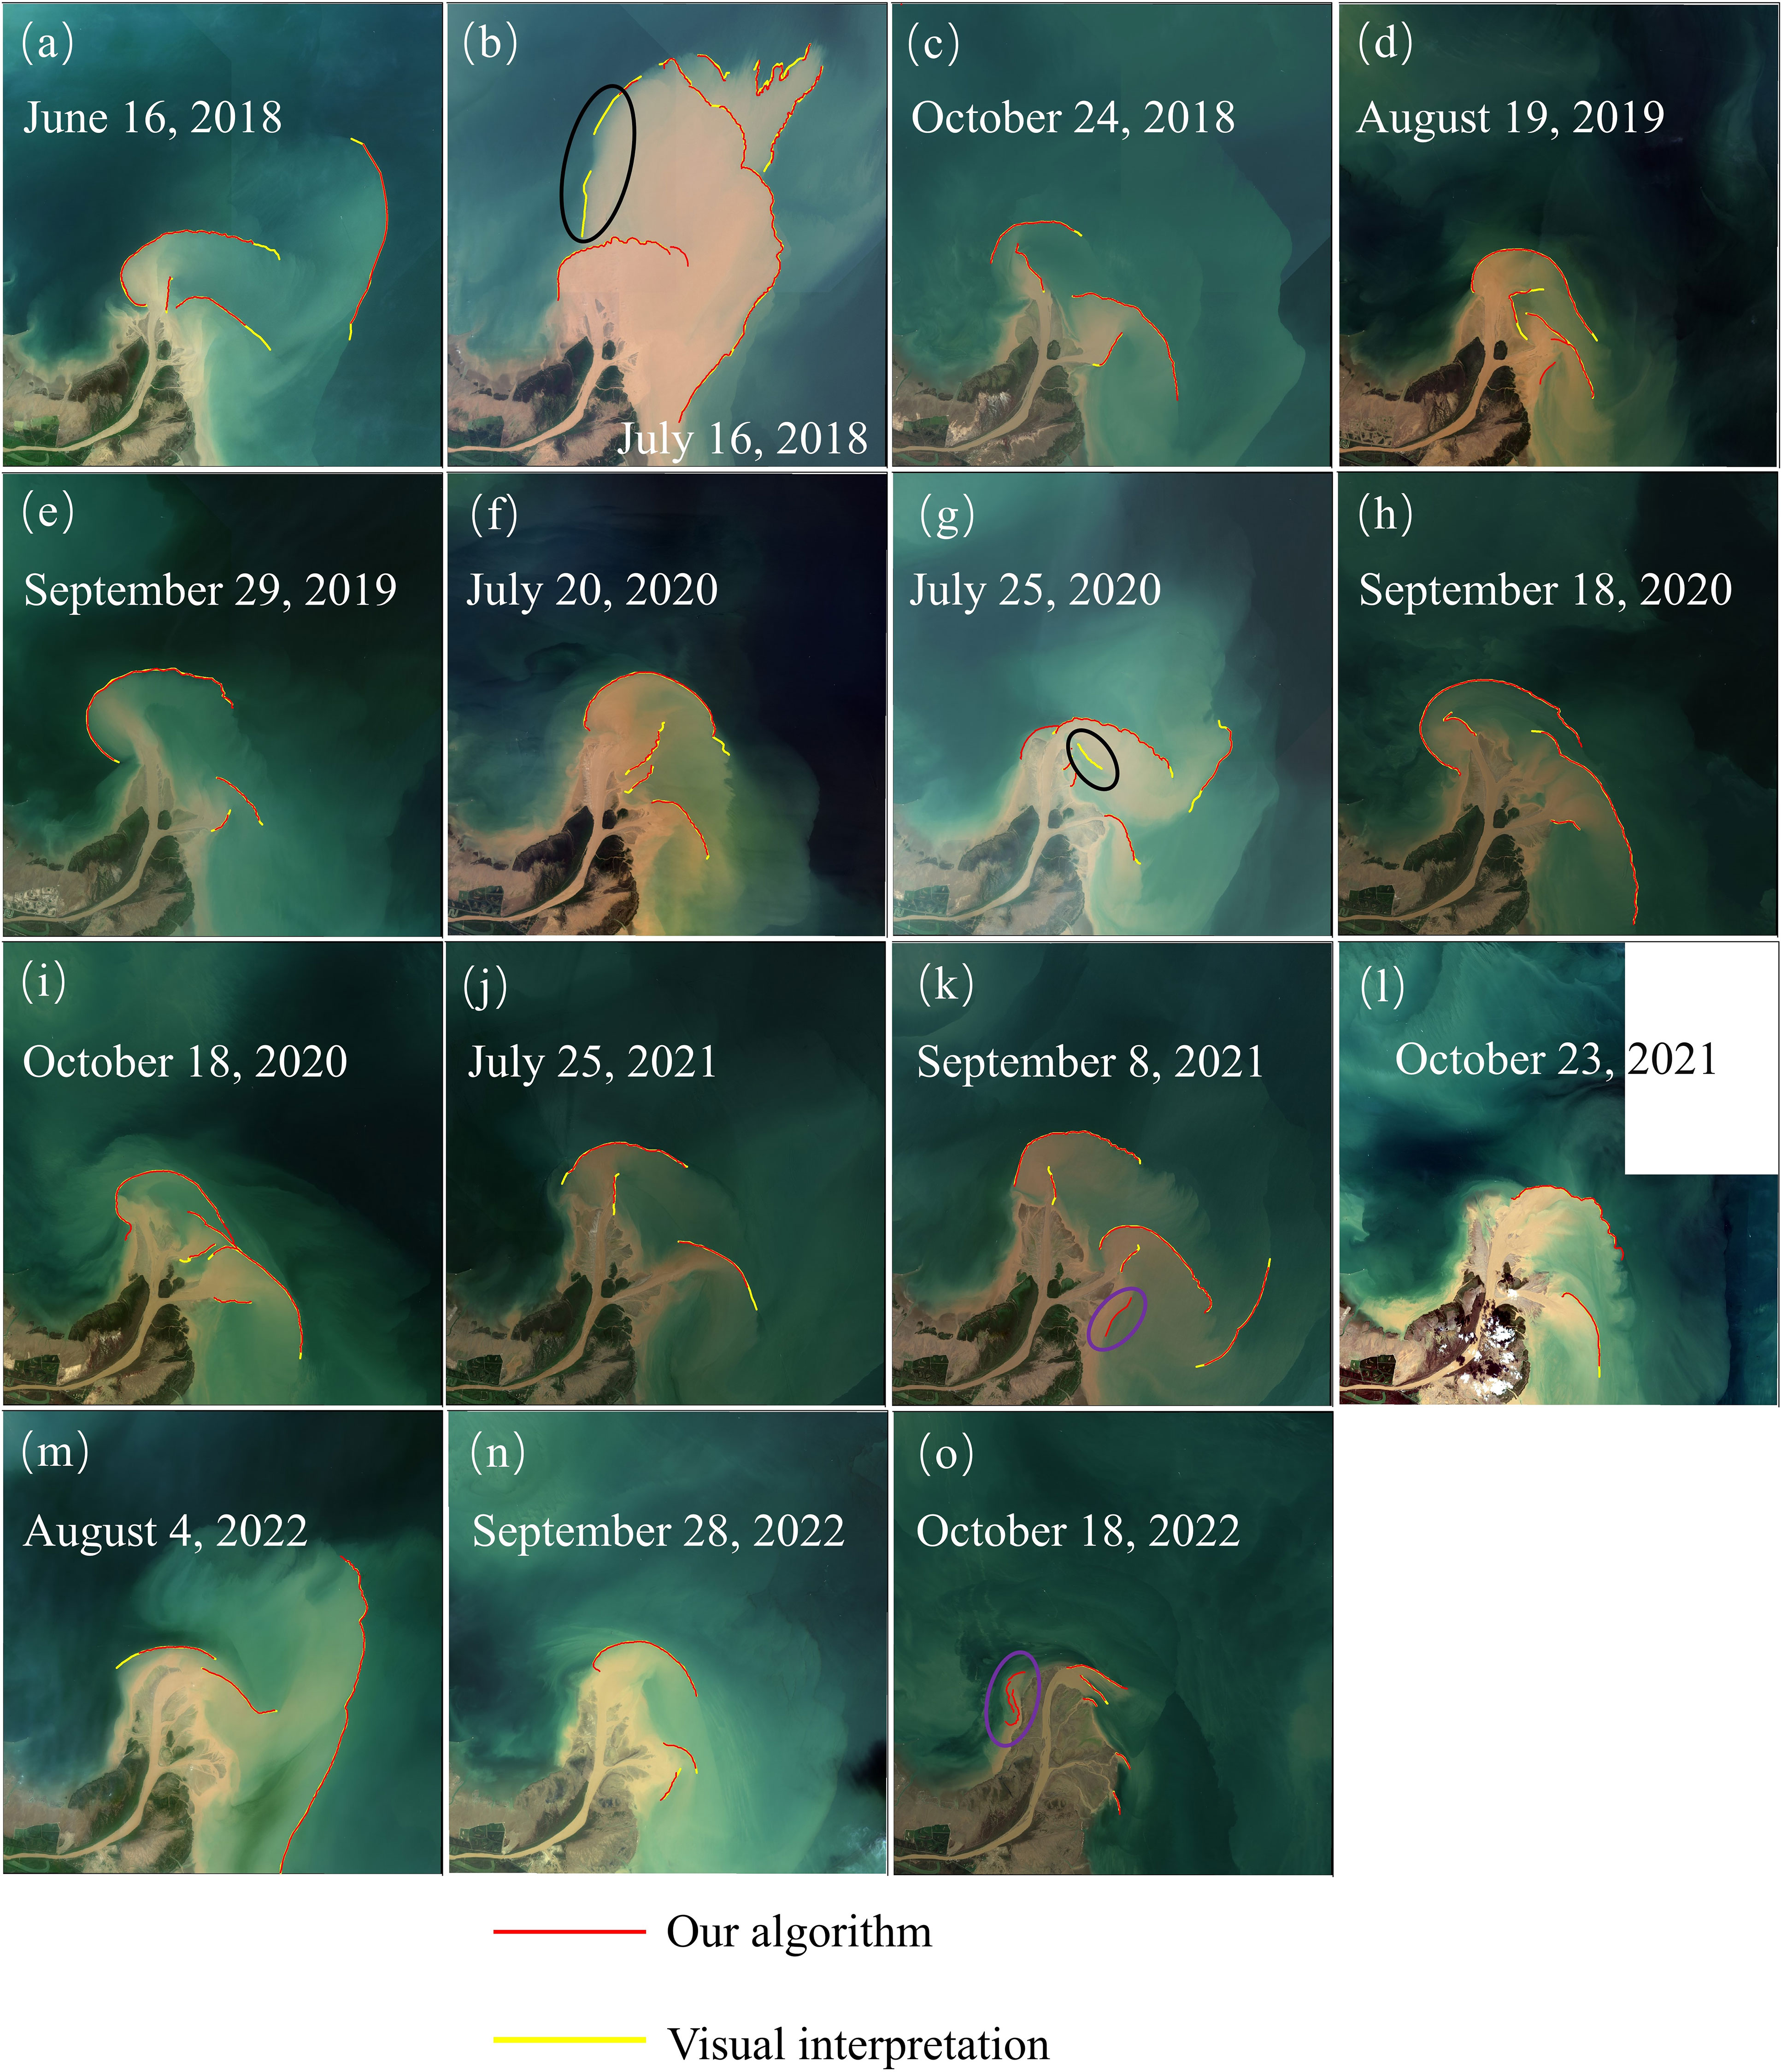
Figure 4 Presentation of YBDL distributions in the 15 randomly selected satellite images. The red lines were YBDL extracted by our algorithm and the yellow lines were YBDL outlined by manual visual interpretation. Those circled in black indicate missing YBDLs and those circled in purple indicate redundant YBDLs.
Figure 5 illustrated the interannual and monthly distributions of YBDL in the YRE from 2016 to 2022, as well as the variations in normalised length of YBDL within the grid of 2 km 2 km. Normalisation was the division of the total length of YBDL within the grid by the number of satellite images. Figure 6 demonstrated the variation in lengths of interannual and monthly YBDL, noting that since the YBDL was barely observed in 2016 and 2017 (Figures 5A, B), it was no longer counted in Figure 6A. In general, the YBDL occurred more frequently after 2018, mainly within 10 km near the river mouth, and the location of its distribution center shifted with the evolution of the active river mouth. The distribution patterns of YBDL could be divided into two types, including the short straight YBDL parallel to the direction of estuarine distributary and the long curved YBDL surrounding the river mouth (Figures 5C–G). The former was less numerous and was distributed at the edge of the extremely high SPM in the distributary mouth, and the latter was more numerous and could extend farther out to sea. Moreover, in addition to the vicinity of the river mouth, the long arc-shaped YBDLs were also observed on the sides further away from the river mouth and appeared more frequently in the southeastern region (northwestern Laizhou Bay) than in the northwestern part (Figure 5M).
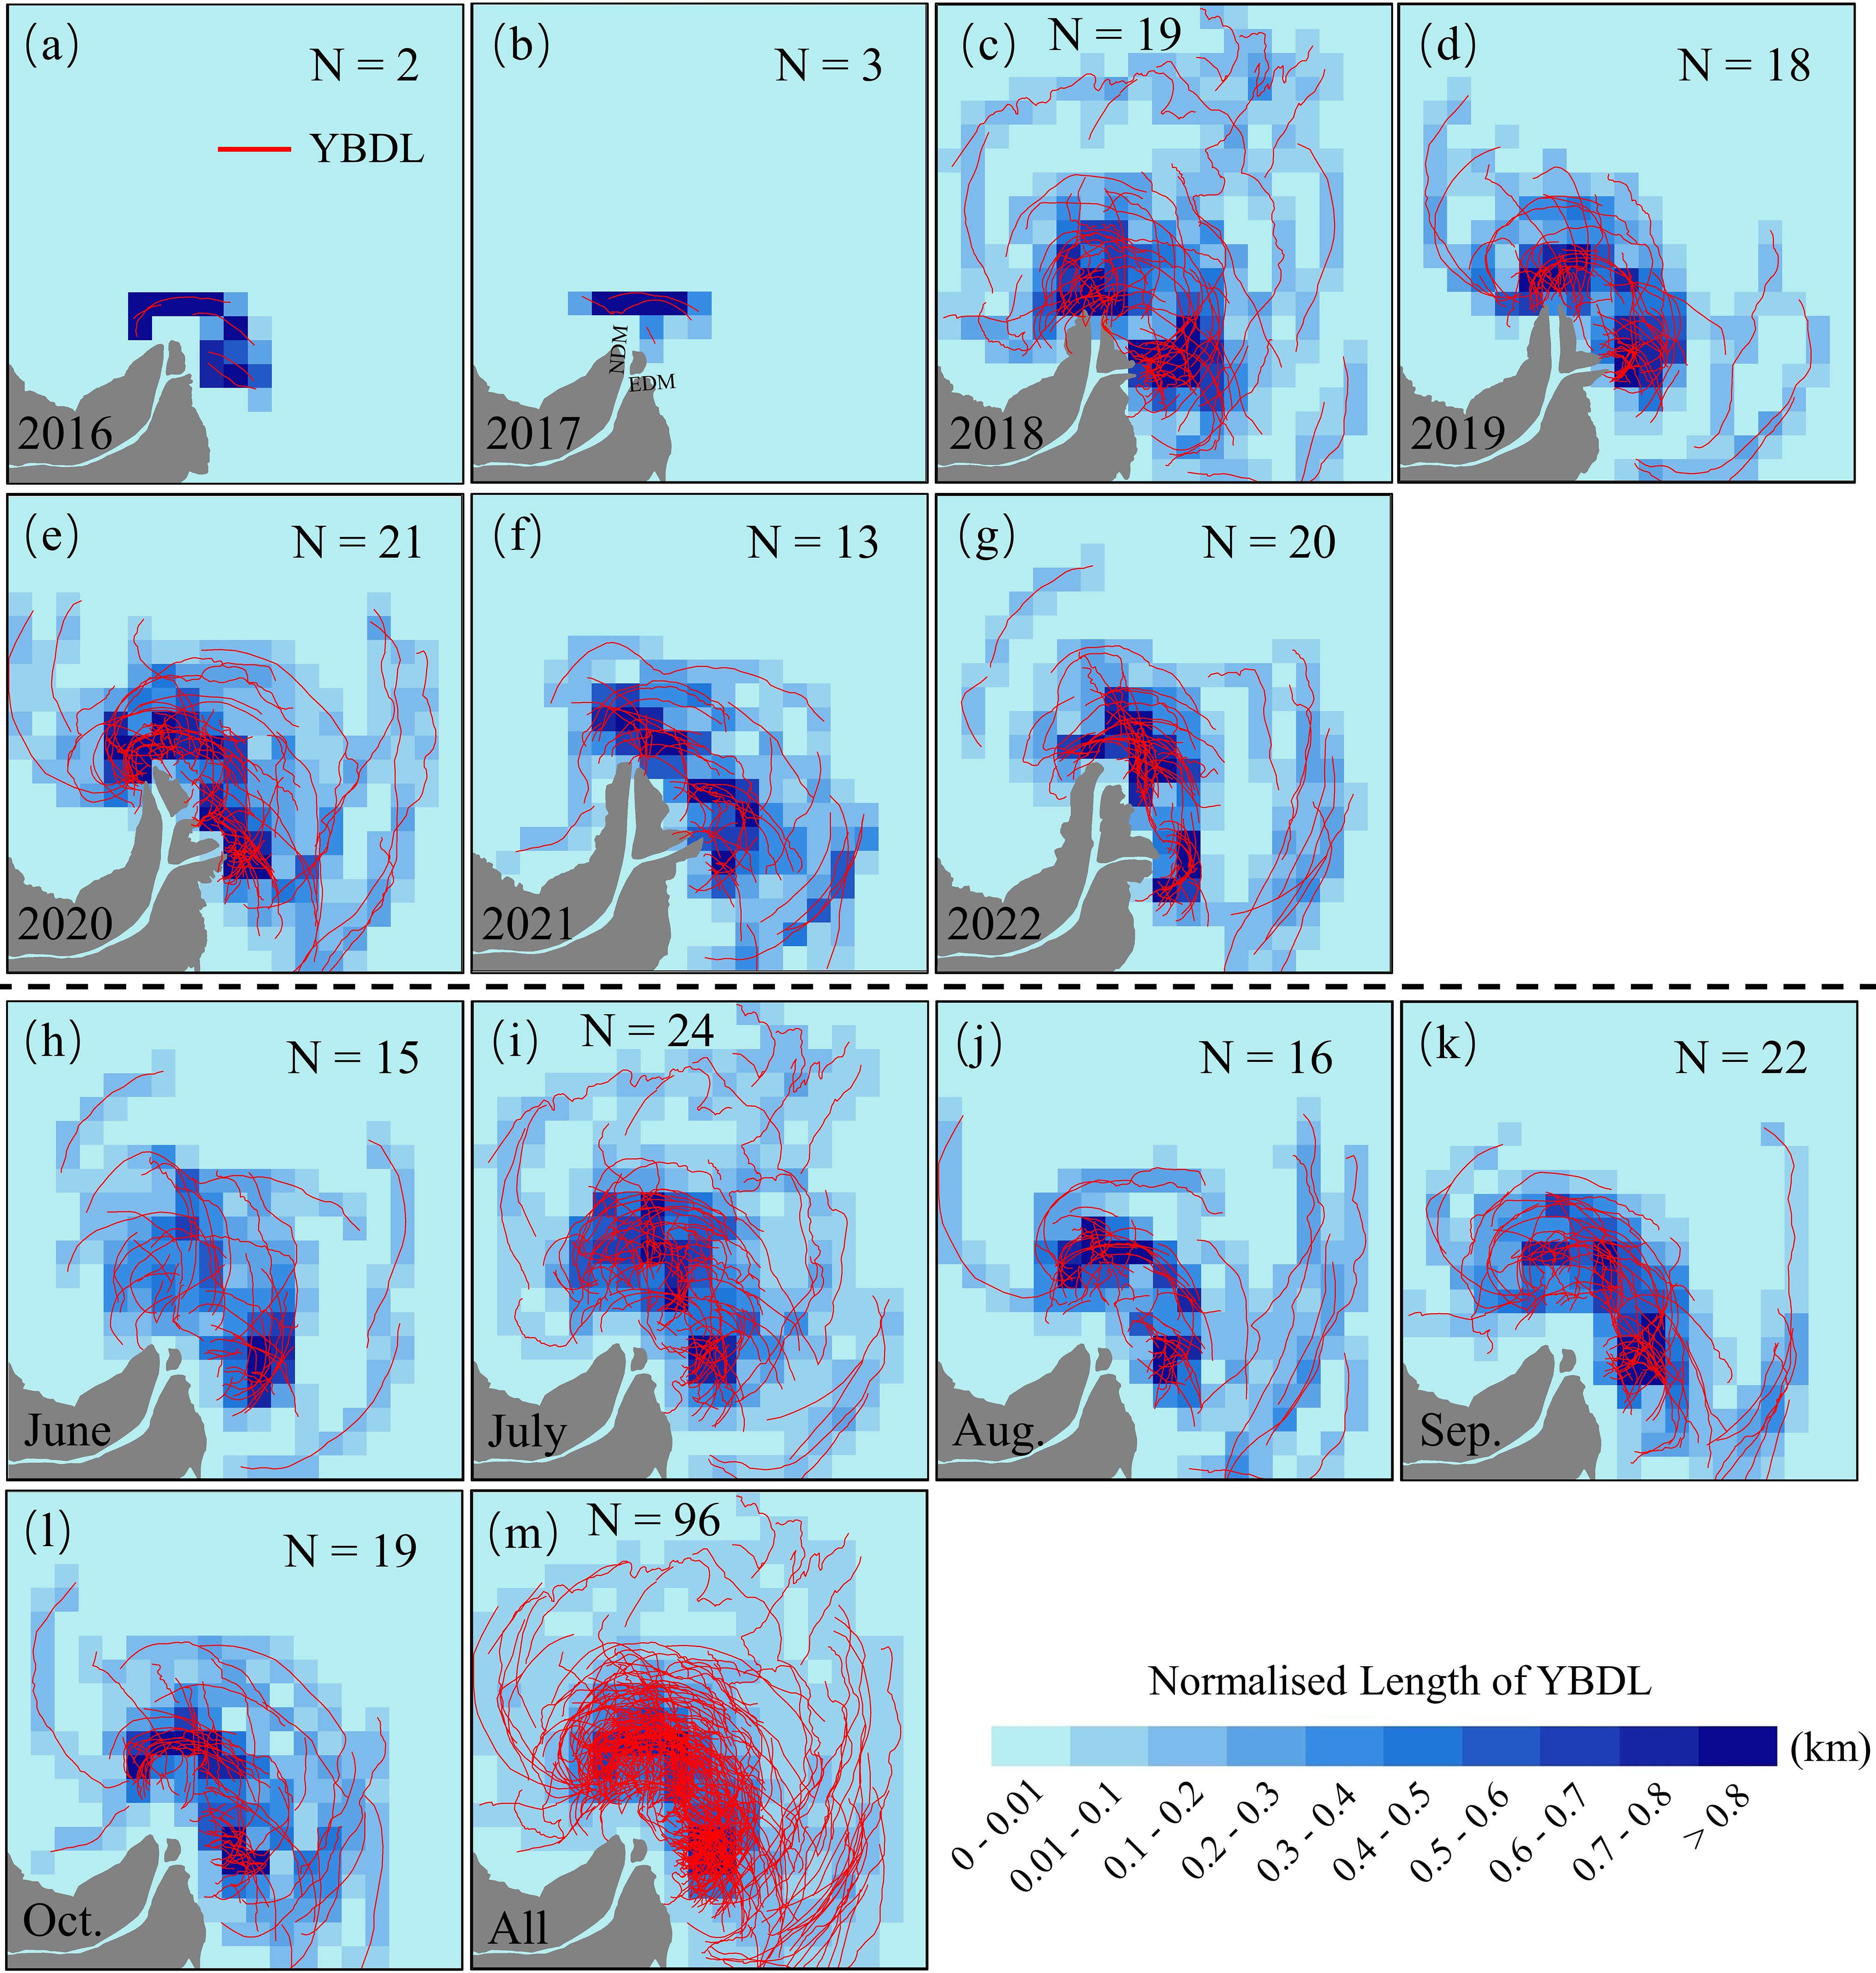
Figure 5 Spatial distributions of YBDL in the Yellow River estuary and normalised length of YBDL within the 2km 2km grid. (A–G) Annual YBDL distributions from 2016-2022. (H–L) Monthly YBDL distributions from June to October. (M) Stacked distribution of all YBDL. N denotes the number of satellite images for which YBDL can be detected. The NDM and EDM marked in (B) indicate the north distributary mouth and east distributary mouth, respectively.
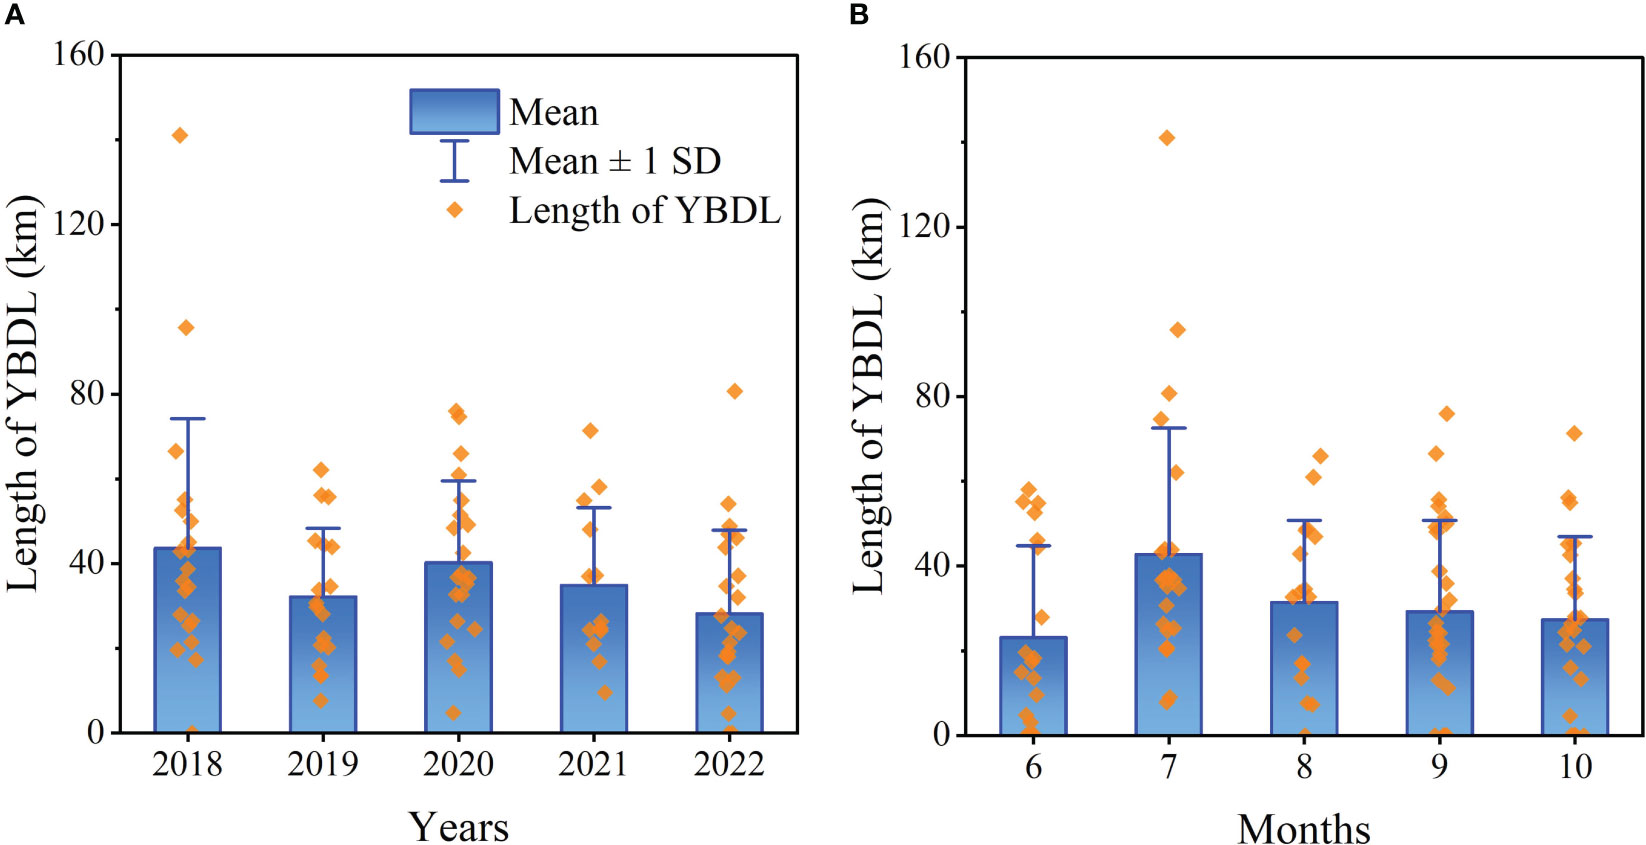
Figure 6 Statistics on the length of (A) interannual and (B) monthly YBDL. Data for 2016 and 2017 are not shown in (A).
As shown in Figure 5, the YBDL appeared less frequently in 2016 (only 2 occurrences in 7 images) and 2017 (only 3 occurrences in 9 images) and its average length did not exceed 14 km. The YBDL, contrastingly, experienced a period of widespread high-frequency emergence from 2018 to 2022 (Figures 5C–G). The YBDL was frequently observed near the two distributary mouths in 2018, with a mean length of 43.65 ± 30.59 km, and its distribution extended offshore away from the river mouth (>25 km) (Figures 5C, 6A). In 2019, the average length of YBDL decreased (32.14 ± 16.16 km) and the two centres of YBDL distribution off the mouth remained consistent with those in 2018, but the YBDL no longer occurred in the northeast away from the river mouth (Figure 5D). In addition, the distribution density of the YBDL showed another peak in 2020, when the average length increased to 40.25 ± 19.27 km, but then continued to decline in the following two years (Figure 6A). In 2020-2021, the two separate distribution centres of YBDL off the river distributary mouths evolved into a high frequency distribution belt surrounding the entire river mouth front (Figures 5E, F). It was noteworthy that the YBDL distributions off the two distributary mouths were of similar density in 2018 and 2019, while in 2022, the number and density of YBDL distributions off the north distributary mouth (NDM) were significantly higher than that off the east distributary mouth (EDM) (Figure 5G).
As illustrated in Figure 6, the YBDL occurred least frequently in June and had an average length of only 23.16 ± 21.61 km. In contrast, the YBDL was the most widely distributed and dynamically varied in July, with an average length of 42.75 ± 29.83 km and the longest reaching 141.02 km (Figures 5I, 6B). From August to October, the mean length of YBDL tended to gradually decrease and the intra-month dynamics were weak (standard deviation< 22 km). Moreover, the location of the high-frequency distribution zone of YBDL near the east distributary mouth was more stable, whereas the area of high-frequency distribution off the north distributary mouth was larger and more variable from June to October (Figures 5H–L). With the exception of July, the cases of non-detected YBDL occurred in all months, particularly in June and October (Figure 6B).
River inputs are the source of estuarine sediment, which are the basis for the generation of YBDL, and have a significant impact on the YBDL by controlling the dynamics of estuarine turbidity plume (Ji et al., 2020; Li et al., 2021a; Ody et al., 2022). The results of the correlation analysis showed that the length of YBDL was significantly correlated with the riverine water discharge (r = 0.58, p< 0.01) and sediment load (r = 0.64, p< 0.01). To further quantify the impact of riverine runoff and sediment on the YBDL off the river mouth, regression equation was developed:
(R2 = 0.459, P< 0.01)
where , , and denote the normalised YBDL length, water charge and sediment load respectively. It could be noticed that the runoff and sediment delivery from the Yellow River explained 45.9% of the variations in length of YBDL, and sediment load had a greater impact on the YBDL than water discharge.
River input affected not only the length of YBDL, but also its distribution extent. Two typical flood events (29 June - 31 July 2018 and 24 June - 15 July 2022) were selected to explore the effects of different flood processes on the YBDL dynamics (Figure 7). It could be found that at low water and sediment discharge (29 June, 1 July 2018, and 24 June and 15 July 2022), the YBDLs were mainly distributed within 10 km around the two river distributary mouths, while during floods (16-21 July 2018, 25 June - 5 July 2022), the YBDL could extend significantly seaward (>20 km). This was because not only could flooding processes provide large amounts of sediment, but high-energy riverine floods could alter the hydrodynamic conditions in the estuary, allowing the estuarine turbidity plume to diffuse more widely (Ji et al., 2020; Fu et al., 2023). However, it was worth noting that there was a distinct difference in the YBDL distributions during these two floods. The flood event of 2018 was actually an artificial flood (the first WSRS in 2018), which brought enormous amounts of additional sediment to the estuary by scouring Xiaolangdi Reservoir and downstream riverbed, causing the original two plumes at the mouths to merge into one huge single plume (Li et al., 2021a; Wu et al., 2022). As a result, the YBDL was not distributed near the two river mouths, but spread offshore with the plume (>30 km) and generated the most widespread distribution in the last seven years (Figure 7A). And during the flood of 2022, the sediment concentration in the river was extremely low (4.29 kg/m3), only one-tenth of that in 2018, which resulted in a limited seaward spread of the estuarine plume (Figure 7B).
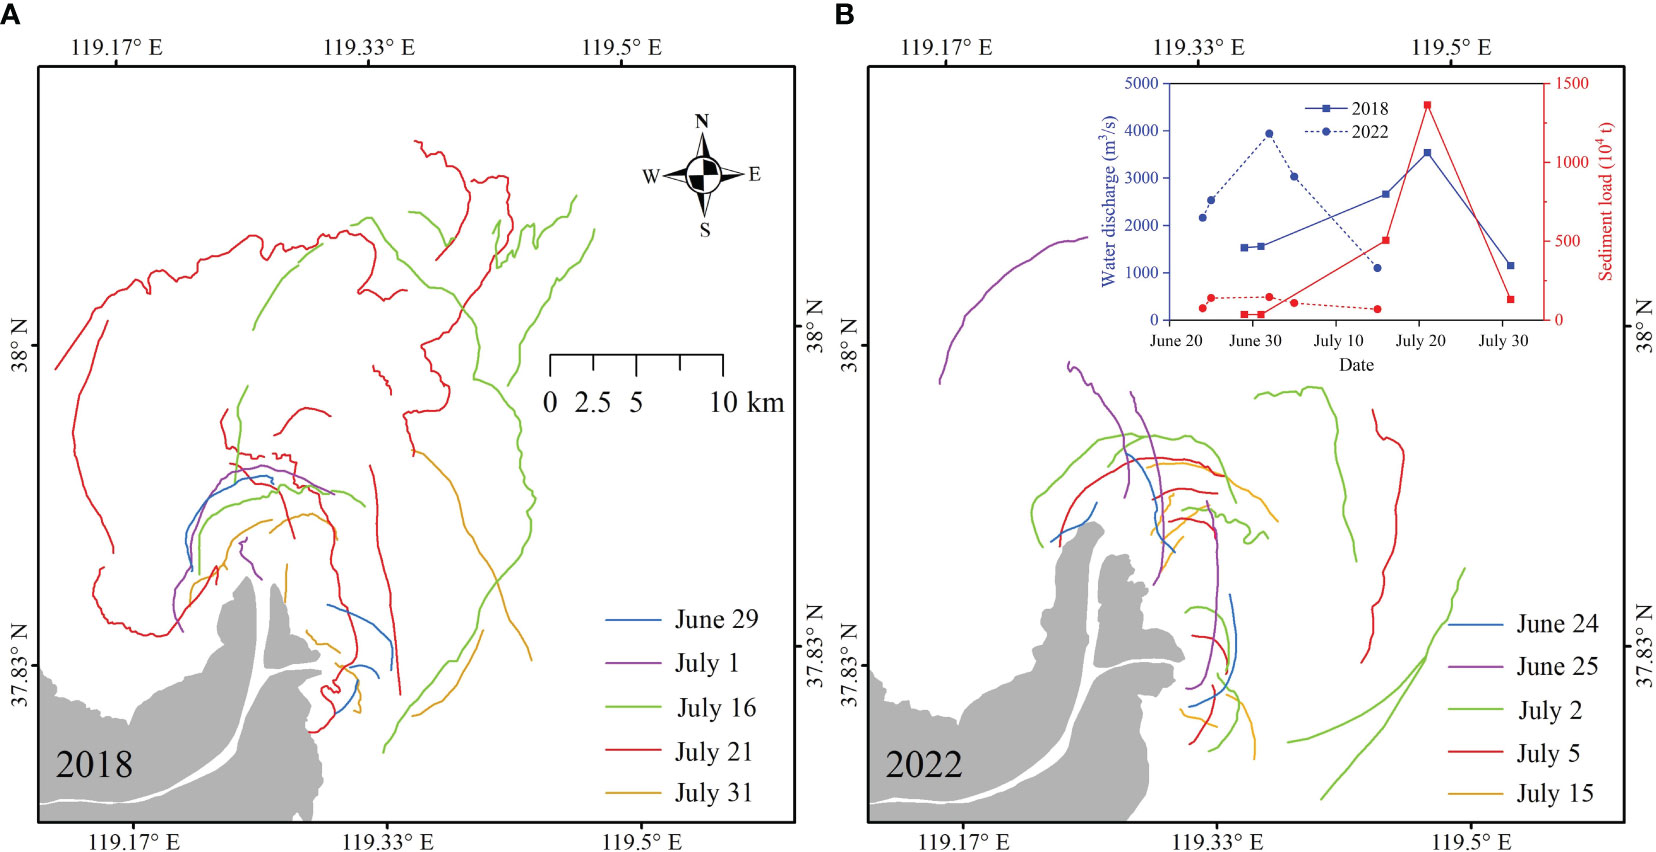
Figure 7 Spatial distributions of estuarine YBDL during the flood processes of (A) 29 June - 31 July 2018 and (B) 24 June - 15 July 2022.
Therefore, the interannual and monthly variations in the length of YBDL off the estuary from 2016-2022 could be explained by changes in riverine sediment load during the flood seasons (Figure S6 in Supplementary Material). In 2016-2017, the sediment discharged from the Yellow River was extremely low (daily mean < 6×10⁴ t) and no flooding occurred from June to October, making it difficult to produce YBDL near the estuary (Figures 5A, B). And in 2018, as well as having high sediment delivery (daily mean = 179.94×10⁴ t), the WSRS were carried out two times during the flood season, each lasting more than 20 days (Li et al., 2021a). However, although the WSRS had also been implemented in 2019-2020, it was difficult to achieve the sediment discharge rates like those during the first WSRS in 2018 again due to the reduced scouring efficiency on the reservoir and downstream riverbed (Figures 7, S2) (Bi et al., 2019; Li et al., 2021; Lu et al., 2022). Moreover, the continuous reduction of the sediment load from the Yellow River over the last three years led to a decrease in the estuarine YBDL (Figure S6B). As illustrated in Figure S5, since early July was the intensive period of WSRS implementation, the runoff and sediment discharge from the Yellow River reached the maximum in July, resulting in a widely distributed and dramatic change in the estuarine YBDL (Figure 6B) (Lu et al., 2022; Wang et al., 2022). And from August to October, the monthly averaged sediment load from the river continued to decline, echoed by the YBDL near the estuary (Figure S6D).
As could be seen from Figure 5, most of the YBDL was distributed around the river mouth, and the morphological evolution of the distributary mouths had an important influence on the distribution centres of YBDL. By reviewing all satellite imageries from 2016 to 2022, we found that the estuarine distributary mouths experienced dramatic shifts in recent years (Figure 8). In 2016 and 2017, there was little change in estuarine morphology due to minimal sediment supply, while the floods with rich sediment during 2018 caused the river distributary mouth to extend significantly seaward (Figure 8C). The topography projecting seaward increased the enrichment of wave energy, allowing the turbidity plume in the estuary to be more susceptible to marine dynamics (Yang et al., 2011). In 2019, the pattern of two distributary mouths remained in place, with the two noticeable YBDL distribution centres similar to those in 2018. However, the morphology of river mouth changed significantly in 2020, especially at the NDM, where the channel was torn under the impact of two major summer floods (Qw >4000 m3/s), creating a three-mouth pattern, which resulted in the YBDL distribution off the NDM becoming dispersed while the distribution centres of YBDL near the EDM remained stable (Figures 8E–G) (Li et al., 2022a). Furthermore, the maximum flood in nearly 40 years (Qw >5000 m3/s) occurred in 2021, and the topography evolved dramatically at both the northern and eastern distributary (Figures 8H–J). And the estuary reverted to the two-mouth pattern in 2022, but the channel width at the northern distributary was considerably greater than at the eastern distributary, meaning that more runoff and sediment was allocated to the northern distributary, which led to a higher YBL distribution density off the NDM than that in EDM (Figure 5G).

Figure 8 Morphological evolution of distributary mouths in the YRE from 2016 to 2022.
Tidal currents are also an important driver for the spatiotemporal dynamics of estuarine YBDL, as they could dominate the development direction and rapid evolution of YBDL by altering the hydrodynamic environment (Chen et al., 2017; Li et al., 2021a). Considering the tiny morphological evolution of estuarine distributary from 2018 to 2019, the YBDL for these two years were classified based on the tidal conditions during the first three hours of satellite imaging (Figure 9). The high-frequency tidal currents were simulated by the numerical hydrodynamic model embedded in the TELEMAC suite (Ji et al., 2020). It could be found that with a long-duration flood tide, a large number of clockwise long curved YBDLs were formed in the west of NDM and north of EDM, and the YBDLs in the west of NDM were more intensive (average length = 186.65 km) and had a larger curvature (Figure 9A). And, some short straight YBDLs occurred in the east of NDM and south of EDM, and not always. In contrast to the flood tide, numerous counter-clockwise long curved YBDLs appeared in the east of NDM and south of EDM after sustained ebb tide (Figure 9B). Furthermore, some long YBDLs could be observed in the southeast region away from the river mouth after constant flood tide and in the northwest area after sustained ebb tide.
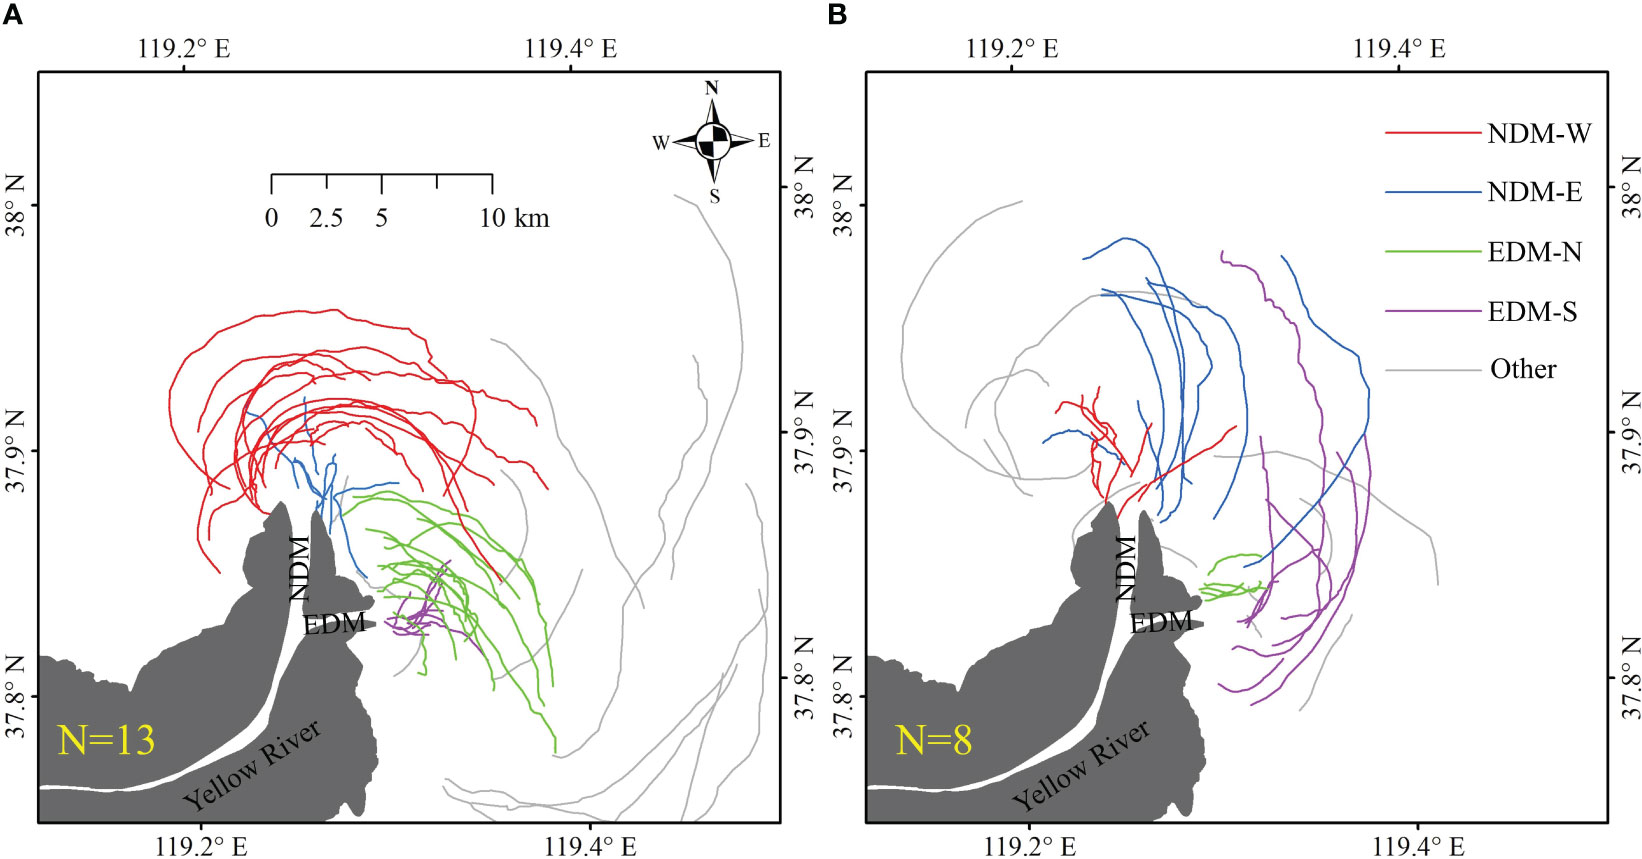
Figure 9 Spatial distributions of YBDL after continuous three-hours (A) flood tide and (B) ebb tide. NDM-W and NDM-E indicate the western and eastern sides of north distributary mouth, respectively; EDM-N and EDM-S denote the northern and southern sides of east distributary mouth, respectively.
Two typical periods (October 4, 2018 and July 20, 2020) were selected to analyze the tidal influence on the hourly variations in YBDL off the river mouth (Figure 10). The YBDLs were extracted from the hourly 30-m SPM images obtained by fusing OLI (MSI) imagery and GOCI imagery, and the hourly tidal velocity and direction were simulated by the numerical hydrodynamic model (Figures S4, S7 in Supplementary Material) (Ji et al., 2020). It could be found that during flood tide (October 4, 2018), the estuarine YBDLs generally shifted towards the southeast, and the YBDLs moved slowly when the tide was in ebb slack (8:30-10:30), while the moving speed was significantly faster during the flood maximum (11:30-12:30) (Figures 10A, S7A). In addition, the YBDLs in the west of NDM and the north of EDM gradually developed from the short straight shape to the clockwise long arc during the flood tide, whereas the YBDLs in the other side of the two river mouths showed the opposite evolution and even eventually disappeared after long-duration flood tide. On July 20, 2022, the YBDLs were predominantly distributed near the northern distributary mouth and moved northwestward with the ebb tide, with a rate of movement matching that of the tidal currents, and their morphology evolution was opposite to that during flood tide (Figures 10B, S7B). And the few YBDLs off the EDM were distributed close to the coast and were less affected by the ebb tide.
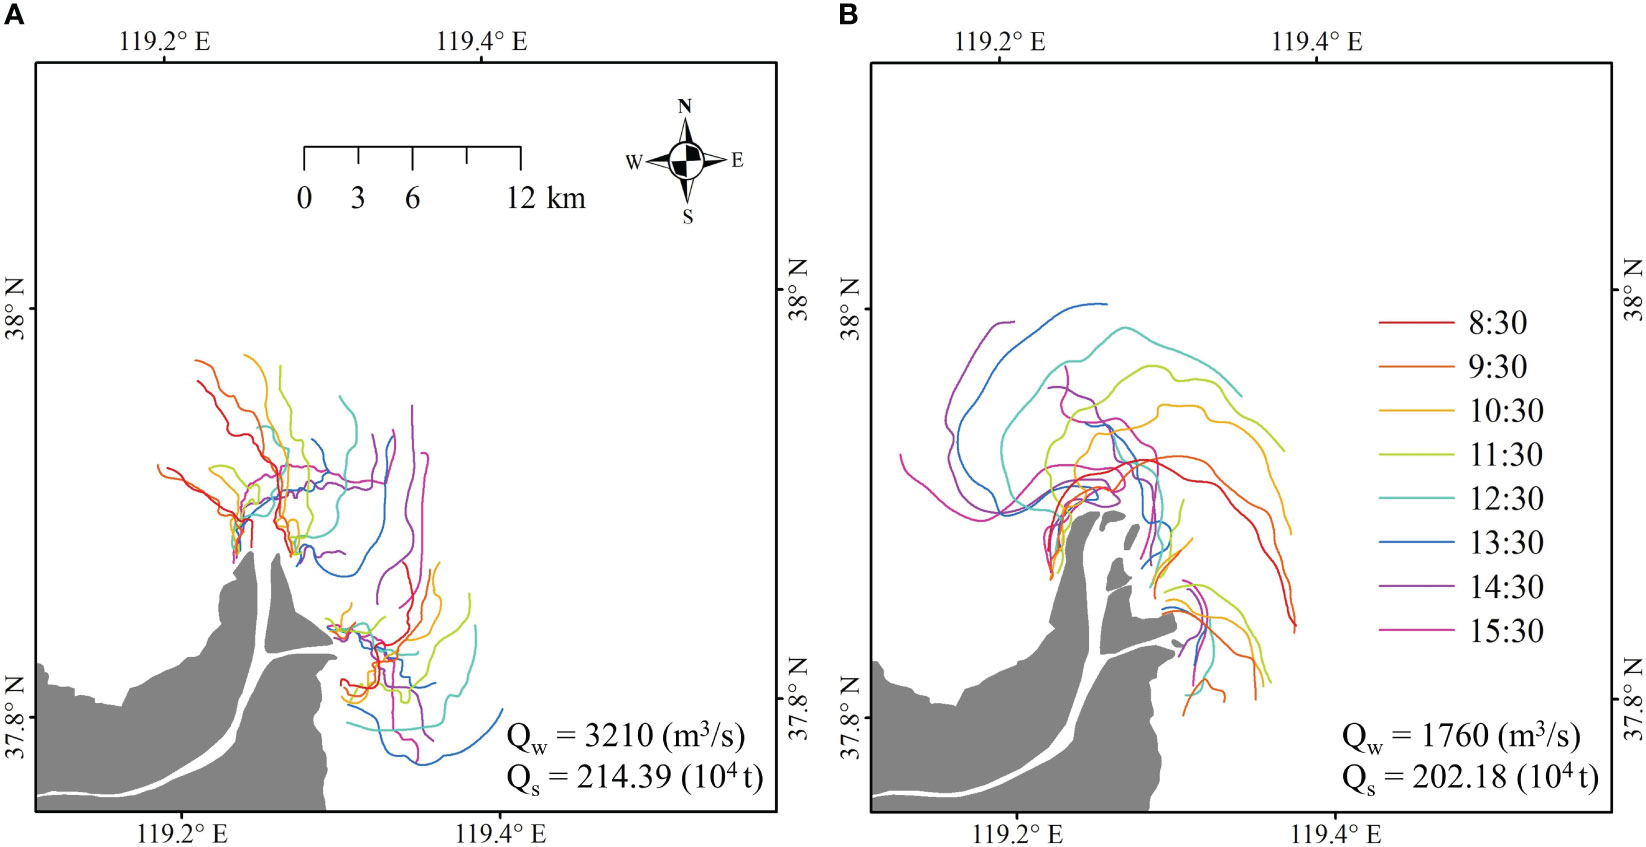
Figure 10 Hourly YBDL distributions off the river mouth on (A) October 4, 2018 and (B) July 20, 2020.
It was necessary to point out that the driving mechanisms of the spatiotemporal dynamics of estuarine YBDL were very complex, and although this study had analyzed the factors influencing the YBDL variability from multiple perspectives, involving river inputs, estuarine geomorphology and tidal currents, it might still be incomplete. Winds could induce resuspension of sediment in shallow sea and generate residual currents enhancing sediment dispersion, especially during storm surges (Du et al., 2022; Xu et al., 2022). However, the investigation period for YBDL in this study was the flood seasons (June to October), dominated by weak southerly winds (average wind speed< 5.3 m/s, Figure S8), which had a negligible effect on the sediment resuspension (Wang et al., 2014; Qiu et al., 2017). Therefore, the influence of winds on the YBDL was not considered and satellite imageries during storm surges were excluded in this study (Figure S9). Additionally, the tides could increase the vertical mixing of suspended sediment in the water column affecting the surface SPM concentration (Hao et al., 2018). But the Yellow River estuary had a weak tide, with a tidal range of 0.6-0.8 m, so the tide had less impact on the YBDL distributions in the study area.
What conditions allowed the magical YBDL to be viewed are of concern to both visitors and administrators. As could be deduced from section 4.1, the sediment discharge from Yellow River dominated the length of estuarine YBDL. Thus, a quantitative relationship between the YBDL length and riverine sediment load was established using the least squares method (Figure 11A). Based on this regression function, it could be known that the minimum daily sediment load of 46.1×10⁴ t was required to generate 30-km YBDL in the estuary. And the percentage of days with high sediment load (> 46.1×10⁴ t/d) in the last five years was considerably higher than that in 2003-2017, and the riverine sediment allocation in the flood seasons had also changed significantly (Figure 11B). However, regardless of any period, July was the time of year most prone to produce widespread YBDL, especially in early July when the WSRS was regularly implemented.
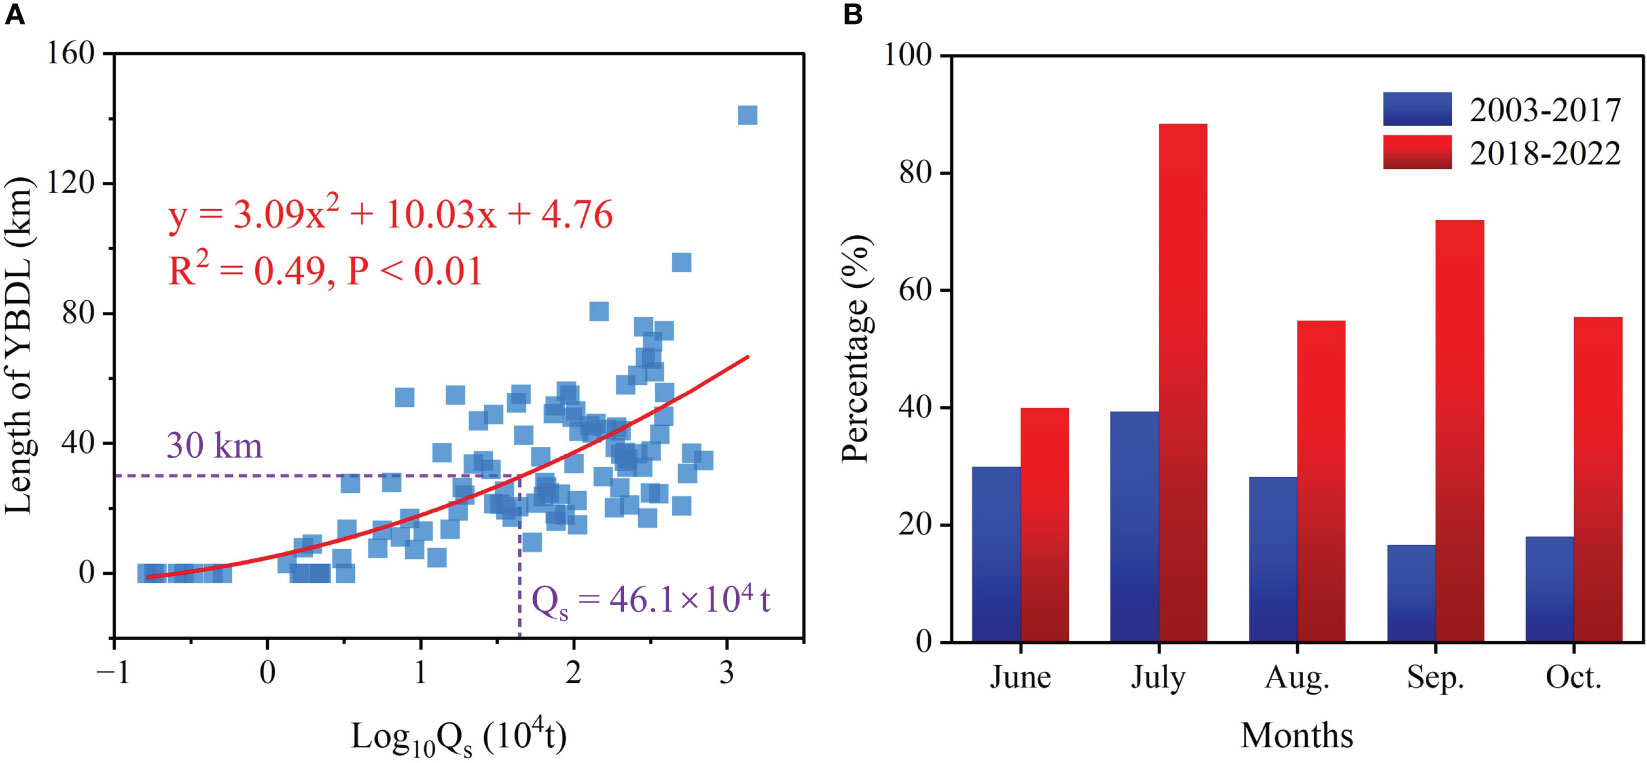
Figure 11 (A) Relationship between YBDL length and riverine sediment load. (B) Percentage of days with high sediment discharge (> 46.1×10⁴ t/d) during the flood season from 2003 to 2022.
In addition to avoiding periods with low sediment discharge and observing the direction of tidal currents, attention should also be paid to strong windy conditions, because the strong wind-wave forces, especially during storms that occasionally occurred in the flood season, could cause extensive high SPM distribution near the estuary, leaving the YBDL at the plume boundary ill-defined (Figure S9) (Fan et al., 2020; Li et al., 2022b). The statistics of hourly wind speeds in the Yellow River estuary over the past 20 years revealed that the percentage of strong winds (>10 m/s) was lowest in July (1.08%) and increased sequentially from August to October (1.38%-5.67%) (Figure S8). Moreover, it should be noted that although the proportion of strong winds was not great during flood season, the high-energy waves after a strong wind could last for several days, during which it was difficult to observe the YBDL off the estuary (Li et al., 2022b; Sun et al., 2022).
In general, the distributions of YBDL near the NDM were more intensive than that of the EDM in the last five years, but the geomorphology of northern distributary was prone to evolution due to more sediment accumulation (Figures 5, 8). Therefore, the managers chose the closer and topographically stable EDM as the site for YBDL visiting in recent years. However, we found that the new geomorphology led to more riverine sediment being allocated to the NDM, resulting in a substantial reduction in the YBDL distributions near the EDM (Figures 5E–G). Furthermore, satellite imageries showed visible channel siltation at the east distributary in late 2022 (Figures 8K, L), which could impede cruise ship navigation. These latest findings required a great deal of attention from administrators. In order to make this tourist industry sustainable, it was necessary to take new measures, either to choose the NDM as the alternative tourist site or to dredge the east distributary.
In this study, we proposed an integrated approach to extract the YBDL off Yellow River estuary from satellite images by combining SPM retrieval model, spatiotemporal data fusion algorithm and Canny edge detection algorithm. The method was demonstrated to have high accuracy, with a mean relative error of 10.53%. Based on multi-source satellite imageries (Landsat-8/9 OLI, Sentinel-2A/B MSI, and COMS GOCI), we obtained the spatiotemporal distributions of YBDL near the YRE during the flood season (June-October) from 2016 to 2022.
Our results revealed that the YBDLs were mainly distributed within 10 km off the estuary, with two types of short straight shape and long curved shape, and experienced considerable dynamic changes in recent years. The water discharge and sediment load from Yellow River controlled 45.9% of the variations in YBDL length and a minimum daily sediment load of 4.61×10⁵ t was required to generate 30-km YBDL off the estuary. The extreme flooding, as well as WSRS implementation, could significantly increase the distribution extent of the YBDL. The low sediment discharge from river in 2016 and 2017 made it difficult to generate YBDL near the estuary, whereas over the past five years (2018-2022), high-energy runoff and enormous sediment load resulted in extensive YBDL off the estuary with the restart of WSRS, especially in 2018. July was the period with the highest frequency and most widespread distribution of YBDL during the flood season, due to the implementation of WSRS and high sediment discharge. Moreover, the morphology of river distributary mouths dominated the shifts in the distribution centres of YBDL, and the YBDL distribution density in the evolving NDM was greater than that in the EDM after 2020. The long-duration flood tide or ebb tide could contribute to the gradual growth of YBDL at the front of the distributary mouth plumes into a long-curve pattern, while inhibiting the development of YBDL at the back of plumes. Furthermore, the recent channel siltation and reduction in the YBDL distributions near the EDM required the attention of administrators.
To the best of our knowledge, this was the first study to systematically reveal the spatiotemporal evolution and driving mechanisms of YBDL in YRE, and the results could not only contribute to the understanding of coastal sediment-transport process, but also provide a reference for tourism planning and Yellow River Estuary National Park construction.
The raw data supporting the conclusions of this article will be made available by the authors, without undue reservation.
PL: Writing-Original draft preparation, Methodology, Software, Validation, Writing-Reviewing and Editing. SC: Conceptualization, Funding acquisition, Writing-Reviewing and Editing. HJ: Visualization, Methodology, Software, Writing- Reviewing and Editing. YF: Investigation, Resources, Funding acquisition. YF: Investigation, Data curation. BR: Investigation, Resources. YK: Data curation, Validation, Funding acquisition. All authors contributed to the article and approved the submitted version.
The author(s) declare financial support was received for the research, authorship, and/or publication of this article. This study was supported by the National Natural Science Foundation of China (NSFC) (No. U1706214), the State Key Program of National Natural Science Foundation of China (NO. U2243207), and the National Natural Science Foundation of China (No. 42071396). The first foundation is provided by Professor Shenliang Chen from the State Key Laboratory of Estuarine and Coastal Sciences, East China Normal University, Shanghai, China. The second foundation is provided by Dr Yaoshen Fan from the Yellow River Institute of Water Resources Science, Ministry of Water Resources, Zhengzhou, China. The third fund is provided by Professor Yinghai Ke from the College of Resource Environment and Tourism, Capital Normal University, Beijing, China.
The authors declare that the research was conducted in the absence of any commercial or financial relationships that could be construed as a potential conflict of interest.
All claims expressed in this article are solely those of the authors and do not necessarily represent those of their affiliated organizations, or those of the publisher, the editors and the reviewers. Any product that may be evaluated in this article, or claim that may be made by its manufacturer, is not guaranteed or endorsed by the publisher.
The Supplementary Material for this article can be found online at: https://www.frontiersin.org/articles/10.3389/fmars.2023.1234631/full#supplementary-material
Anthony E. J., Gardel A., Gratiot N., Proisy C., Allison M. A., Dolique F., et al. (2010). The amazon-influenced muddy coast of south America: a review of mud-bank–shoreline interactions. Earth-Sci. Rev. 103 (3-4), 99–121. doi: 10.1016/j.earscirev.2010.09.008
Bi N., Sun Z., Wang H., Wu X., Fan Y., Xu C., et al. (2019). Response of channel scouring and deposition to the regulation of large reservoirs: a case study of the lower reaches of the yellow river (Huanghe). J. Hydrol. 568, 972–984. doi: 10.1016/j.jhydrol.2018.11.039
Bi N., Wang H., Wu X., Saito Y., Xu C., Yang Z. (2021). Phase change in evolution of the modern Huanghe (yellow river) delta: process, pattern, and mechanisms. Mar. Geol. 437, 106516. doi: 10.1016/j.margeo.2021.106516
Canny J. (1986). A computational approach to edge detection. IEEE T. Pattern Anal. 8, 679–698. doi: 10.1109/TPAMI.1986.4767851
Chen Z., Gong W., Cai H., Chen Y., Zhang H. (2017). Dispersal of the pearl river plume over continental shelf in summer. Estuarine Coast. Shelf Sci. 194, 252–262. doi: 10.1016/j.ecss.2017.06.025
Cheng X., Zhu J., Chen S. (2021). Dynamics of the extension of the yellow river plume in the Bohai sea. Cont. Shelf Res. 222, 104438. doi: 10.1016/j.csr.2021.104438
Du Y., Zhang J., Wei Z., Yin W., Wu H., Yuan Y., et al. (2022). Spatio-temporal variability of suspended sediment fronts (SSFs) on the inner shelf of the east China sea: the contribution of multiple factors. Geophys. Res: Oceans 127, e2021JC018392. doi: 10.1029/2021JC018392
Fan Y., Chen S., Pan S., Dou S. (2020). Storm-induced hydrodynamic changes and seabed erosion in the littoral area of yellow river delta: a model-guided mechanism study. Cont. Shelf Res. 205, 104171. doi: 10.1016/j.csr.2020.104171
Fluet-Chouinard E., Stocker B. D., Zhang Z., Malhotra A., Melton J. R., Poulter B., et al. (2023). Extensive global wetland loss over the past three centuries. Nature 614 (7947), 281–286. doi: 10.1038/s41586-022-05572-6
Fu Y., Bellerby R. G. J., Ji H., Chen S., Fan Y., Li P. (2023). Impacts of riverine floods on morphodynamics in the yellow river delta. Water-Sui 15 (8), 1568. doi: 10.3390/w15081568
Guo L., Zhu C., Xie W., Xu F., Wu H., Wan Y., et al. (2021). Changjiang delta in the Anthropocene: multi-scale hydro-morphodynamics and management challenges. Earth-Sci. Rev. 223, 103850. doi: 10.1016/j.earscirev.2021.103850
Hao Y., Cui T., Singh V., Zhang J., Yu R., Zhao W. (2018). Diurnal variation of light absorption in the yellow river estuary. Remote Sens.-Basel 10 (4), 542. doi: 10.3390/rs10040542
Hoitink A. J. F., Jay D. A. (2016). Tidal river dynamics: implications for deltas. Rev. Geophys. 54 (1), 240–272. doi: 10.1002/2015RG000507
Hossain M. S., Yasir M., Wang P., Ullah S., Jahan M., Hui S., et al. (2021). Automatic shoreline extraction and change detection: a study on the southeast coast of Bangladesh. Mar. Geol. 441, 106628. doi: 10.1016/j.margeo.2021.106628
Hu X., Wang Y. (2022). Monitoring coastline variations in the pearl river estuary from 1978 to 2018 by integrating canny edge detection and Otsu methods using long time series Landsat dataset. Catena 209, 105840. doi: 10.1016/j.catena.2021.105840
Ji H., Chen S., Pan S., Xu C., Jiang C., Fan Y. (2018). Morphological variability of the active yellow river mouth under the new regime of riverine delivery. J. Hydrol. 564, 329–341. doi: 10.1016/j.jhydrol.2018.07.014
Ji H., Chen S., Pan S., Xu C., Tian Y., Li P., et al. (2022). Fluvial sediment source to sink transfer at the yellow river delta: quantifications, causes, and environmental impacts. J. Hydrol. 608, 127622. doi: 10.1016/j.jhydrol.2022.127622
Ji H., Pan S., Chen S. (2020). Impact of river discharge on hydrodynamics and sedimentary processes at yellow river delta. Mar. Geol. 425, 106210. doi: 10.1016/j.margeo.2020.106210
Kuhn C., de Matos Valerio A., Ward N., Loken L., Sawakuchi H. O., Kampel M., et al. (2019). Performance of landsat-8 and sentinel-2 surface reflectance products for river remote sensing retrievals of chlorophyll-a and turbidity. Remote Sens. Environ. 224, 104–118. doi: 10.1016/j.rse.2019.01.023
Latrubesse E. M., Arima E. Y., Dunne T., Park E., Baker V. R., D Horta F. M., et al. (2017). Damming the rivers of the amazon basin. Nature 546 (7658), 363–369. doi: 10.1038/nature22333
Li D., Liu Y., Sun X., Lloyd H., Zhu S., Zhang S., et al. (2017). Habitat-dependent changes in vigilance behaviour of red-crowned crane influenced by wildlife tourism. Sci. Rep.-UK 7, (1). doi: 10.1038/s41598-017-16907-z
Li P., Chen S., Ji H., Ke Y., Fu Y. (2021b). Combining landsat-8 and sentinel-2 to investigate seasonal changes of suspended particulate matter off the abandoned distributary mouths of yellow river delta. Mar. Geol. 441, 106622. doi: 10.1016/j.margeo.2021.106622
Li P., Chen S., Ke Y., Ji H., Li P., Fan Y. (2022b). Spatiotemporal dynamics of suspended particulate matter in the Bohai sea, China over the past decade from the space perspective. Sci. Total Environ. 851, 158210. doi: 10.1016/j.scitotenv.2022.158210
Li P., Chen S. L., Liu Q. L., Zhang C. Y. (2022a). Responses of the processes in the Yellow River lowermost channel sandbars and estuary to the variation of water and sediment. J. Sediment Res. 47 (02), 57–64. doi: 10.16239/j.cnki.0468-155x.2022.02.009
Li P., Ke Y., Bai J., Zhang S., Chen M., Zhou D. (2019). Spatiotemporal dynamics of suspended particulate matter in the yellow river estuary, China during the past two decades based on time-series Landsat and Sentinel-2 data. Mar. pollut. Bull. 149, 110518. doi: 10.1016/j.marpolbul.2019.110518
Li P., Ke Y., Wang D., Ji H., Chen S., Chen M., et al. (2021a). Human impact on suspended particulate matter in the yellow river estuary, China: evidence from remote sensing data fusion using an improved spatiotemporal fusion method. Sci. Total Environ. 750, 141612. doi: 10.1016/j.scitotenv.2020.141612
Li S. J., Meng F. F. (2011). Health assessment of wetland ecosystems and tourism development in Shandong province. Resour. Sci. 33 (07), 1390–1397.
Lu M., Zhao Q., Ding S., Wang S., Hong Z., Jing Y., et al. (2022). Hydro-geomorphological characteristics in response to the water-sediment regulation scheme of the Xiaolangdi dam in the lower yellow river. J. Clean. Prod. 335, 130324. doi: 10.1016/j.jclepro.2021.130324
Luo Z., Zhu J., Wu H., Li X. (2017). Dynamics of the sediment plume over the Yangtze bank in the yellow and east China seas. J. Geophys. Res. Oceans 122 (12), 10073–10090. doi: 10.1002/2017JC013215
Lv J. S., Liu Y. (2010). Evaluation on exploitation potential of ecotourism resources of wetlands in Yellow River Delta. Wetland Sci. 8 (04), 339–346. doi: 10.13248/j.cnki.wetlandsci.2010.04.009
Lymburner L., Botha E., Hestir E., Anstee J., Sagar S., Dekker A., et al. (2016). Landsat 8: providing continuity and increased precision for measuring multi-decadal time series of total suspended matter. Remote Sens. Environ. 185, 108–118. doi: 10.1016/j.rse.2016.04.011
Nienhuis J. H., Ashton A. D., Edmonds D. A., Hoitink A. J. F., Kettner A. J., Rowland J. C., et al. (2020). Global-scale human impact on delta morphology has led to net land area gain. Nature 577 (7791), 514–518. doi: 10.1038/s41586-019-1905-9
Ody A., Doxaran D., Verney R., Bourrin F., Morin G. P., Pairaud I., et al. (2022). Ocean color remote sensing of suspended sediments along a continuum from rivers to river plumes: concentration, transport, fluxes and dynamics. Remote Sens.-Basel 14 (9), 2026. doi: 10.3390/rs14092026
Pahlevan N., Chittimalli S. K., Balasubramanian S. V., Vellucci V. (2019). Sentinel-2/landsat-8 product consistency and implications for monitoring aquatic systems. Remote Sens. Environ. 220, 19–29. doi: 10.1016/j.rse.2018.10.027
Qiu Z., Xiao C., Perrie W., Sun D., Wang S., Shen H., et al. (2017). Using Landsat 8 data to estimate suspended particulate matter in the yellow river estuary. J. Geophys. Res. 122 (1), 276–290. doi: 10.1002/2016JC012412
Ruddick K. G., Ovidio F., Rijkeboer M. (2000). Atmospheric correction of Seawifs imagery for turbid coastal and inland waters. Appl. Optics 6 (39), 897–912. doi: 10.1364/AO.39.000897
Sun H., Xu J., Zhang S., Li G., Liu S., Qiao L., et al. (2022). Field observations of seabed scour dynamics in front of a seawall during winter gales. Front. Mar. Sci. 9. doi: 10.3389/fmars.2022.1080578
Temmerman S., Meire P., Bouma T. J., Herman P. M. J., Ysebaert T., De Vriend H. J. (2013). Ecosystem-based coastal defence in the face of global change. Nature 504 (7478), 79–83. doi: 10.1038/nature12859
Tessler Z. D., Vorosmarty C. J., Grossberg M., Gladkova I., Aizenman H., Syvitski J. P., et al. (2015). Environmental science. Profiling risk and sustainability in coastal deltas of the world. Science 349 (6248), 638–643. doi: 10.1126/science.aab3574
Vanhellemont Q. (2019). Adaptation of the dark spectrum fitting atmospheric correction for aquatic applications of the Landsat and Sentinel-2 archives. Remote Sens. Environ. 225, 175–192. doi: 10.1016/j.rse.2019.03.010
Wang N., Li G., Qiao L., Shi J., Dong P., Xu J., et al. (2017b). Long-term evolution in the location, propagation, and magnitude of the tidal shear front off the yellow river mouth. Cont. Shelf Res. 137, 1–12. doi: 10.1016/j.csr.2017.01.020
Wang Y., Liu D., Lee K., Dong Z., Di B., Wang Y., et al. (2017a). Impact of water-sediment regulation scheme on seasonal and spatial variations of biogeochemical factors in the yellow river estuary. Estuarine Coast. Shelf Sci. 198, 92–105. doi: 10.1016/j.ecss.2017.09.005
Wang J., Shi B., Yuan Q., Zhao E., Bai T., Yang S. (2022). Hydro-geomorphological regime of the lower yellow river and delta in response to the water–sediment regulation scheme: process, mechanism and implication. Catena 219, 106646. doi: 10.1016/j.catena.2022.106646
Wang H., Wang A., Bi N., Zeng X., Xiao H. (2014). Seasonal distribution of suspended sediment in the Bohai sea, China. Cont. Shelf Res. 90, 17–32. doi: 10.1016/j.csr.2014.03.006
Wang H., Wu X., Bi N., Li S., Yuan P., Wang A., et al. (2017c). Impacts of the dam-orientated water-sediment regulation scheme on the lower reaches and delta of the yellow river (Huanghe): a review. Global Planet. Change 157, 93–113. doi: 10.1016/j.gloplacha.2017.08.005
Wu X., Wang H., Saito Y., Syvitski J., Bi N., Yang Z., et al. (2022). Boosting riverine sediment by artificial flood in the yellow river and the implication for delta restoration. Mar. Geol. 448, 106816. doi: 10.1016/j.margeo.2022.106816
Xu X., Gao J., Shi Y., Wu X., Lv J., Zhang S., et al. (2022). Cross-front transport triggered by winter storms around the Shandong peninsula, China. Front. Mar. Sci. 9. doi: 10.3389/fmars.2022.975504
Yang Z., Ji Y., Bi N., Lei K., Wang H. (2011). Sediment transport off the Huanghe (yellow river) delta and in the adjacent Bohai sea in winter and seasonal comparison. Estuarine Coast. Shelf Sci. 93 (3), 173–181. doi: 10.1016/j.ecss.2010.06.005
Yao R., Cai L., Liu J., Zhou M. (2020). Gf-1 satellite observations of suspended sediment injection of yellow river estuary, China. Remote Sens.-Basel 12 (19), 3126. doi: 10.3390/rs12193126
Zhi L. H., Zhang Z., Bai J. H., Li X. W. (2023). Research on the carrying capacity of tourism environment in the Yellow River Delta. Environ. Eng. 41 (01), 132–140. doi: 10.13205/j.hjgc.202301016
Keywords: yellow-blue demarcation line, yellow river estuary, satellite imagery, river inputs, marine dynamics
Citation: Li P, Chen S, Ji H, Fan Y, Fu Y, Ran B and Ke Y (2023) Detecting the magical yellow-blue demarcation off the Yellow River Estuary from the space. Front. Mar. Sci. 10:1234631. doi: 10.3389/fmars.2023.1234631
Received: 05 June 2023; Accepted: 16 October 2023;
Published: 30 October 2023.
Edited by:
Danial Khojasteh, University of New South Wales, AustraliaReviewed by:
Surya Prakash Tiwari, King Fahd University of Petroleum and Minerals, Saudi ArabiaCopyright © 2023 Li, Chen, Ji, Fan, Fu, Ran and Ke. This is an open-access article distributed under the terms of the Creative Commons Attribution License (CC BY). The use, distribution or reproduction in other forums is permitted, provided the original author(s) and the copyright owner(s) are credited and that the original publication in this journal is cited, in accordance with accepted academic practice. No use, distribution or reproduction is permitted which does not comply with these terms.
*Correspondence: Shenliang Chen, c2xjaGVuQHNrbGVjLmVjbnUuZWR1LmNu; Hongyu Ji, aHlqaUBza2xlYy5lY251LmVkdS5jbg==
Disclaimer: All claims expressed in this article are solely those of the authors and do not necessarily represent those of their affiliated organizations, or those of the publisher, the editors and the reviewers. Any product that may be evaluated in this article or claim that may be made by its manufacturer is not guaranteed or endorsed by the publisher.
Research integrity at Frontiers
Learn more about the work of our research integrity team to safeguard the quality of each article we publish.