 Hangqi Li1†
 Gang Mu2†Hanbing Zhang2Hao Wu1Fawei Liu2Zhenyin Sun2Qian Zhang2Yizhou Wang2Yurui Wang2Xiuchen Li2*Guochen Zhang1,2*
- 1College of Engineering, Shenyang Agricultural University, Shenyang, China
- 2College of Mechanical and Power Engineering, Dalian Ocean University, Dalian, China
Introduction: To enhance the application of mechanized harvesting and supplement research on harvesting theory in mudflat-buried shellfish harvesting in China, a brush-screen cooperative mudflat-buried shellfish vibration harvester was designed.
Methods: The harvester is primarily composed of a crank rocker double-layer vibrating screen, two stage rolling brush, and a conveyor chain. White clams (Mactra veneriformis) cultured in mudflats were used as the research objects in this paper, and the mechanics and motion states of the shellfish on the vibrating screen were analyzed. The shellfish harvesting simulation response surface experiments based on the discrete element method (DEM) were conducted to analyze the influence of the main operating parameters on the quantity of shellfish harvested.
Results: The results revealed that the number of shellfish harvested was significantly influenced (p< 0.01) by vibrating screen amplitude, first-stage spiral rolling stainless steel brush rotation rate, and harvester travel speed. The optimal combination of key parameters was 1.4 mm, 40 rpm, and 10 m/min, respectively. With these values, the projected shellfish crushing rate was 2.82% and the shellfish harvesting efficiency was 125 pieces/m2. The equipment was then manufactured and the shellfish harvesting verification test was performed under the same operating parameters as the simulation. Test results indicated that the harvesting efficiency of the equipment was 114 pieces/m2 and the shellfish crushing rate was 6.97%.
Discussion: The shellfish harvesting work could be completed by the equipment effectively and with low loss. The results of this study provide a theoretical reference for a novel mechanized method of harvesting mudflat-buried shellfish.
1 Introduction
Shellfish aquaculture is a key sector in the fisheries industry of China, with a production of 15 million tons in 2021 (Fisheries Administration Bureau of Ministry of Agriculture China, 2022). It accounts for 28.7% of total fishery aquaculture production nationwide and has significantly advanced the economic development of fishery aquaculture in China. Mudflats serve as the principal habitat for shellfish, and the area of mudflat shellfish culture in China was 562 thousand hectares in 2021 (Fisheries Administration Bureau of Ministry of Agriculture China, 2022). Shellfish production is directly influenced by harvesting efficiency, which is a crucial factor in shellfish culture. Traditional mudflat-buried shellfish (shellfish) harvesting is mostly performed manually and is ineffective, labor intensive, and involves high labor costs, among other drawbacks. This makes manual harvesting unsuitable for the large-scale aquaculture of shellfish.
Through years of development, commercial dredge (Miguel B. Gaspar et al., 2002; Yamasaki et al., 2002) and hydraulic dredge has become widely employed (Mu et al., 2020). It utilizes high-pressure water jets on the seafloor to spread the sediment and then catch shellfish using nets with rake teeth. Hydraulic dredge can be classified into several types, such as the hydraulic clam rake dredge (Glude et al., 1952), hydraulic escalator dredge (Kyte and Chew, 1975; Coen, 1995), hydraulic suction dredge (Meyer et al., 1981; Smolowitz, 1982; Morello et al., 2005; Fahy and Carroll, 2007), or tractor dredge (Hall et al., 1990; Beukema, 1995; Hall and Harding, 1997; Robinson and Richardson, 1998), depending on the depth of the marine environment. Despite the high efficiency of hydraulic dredge, it has been banned in China due to its negative impact on sustainable shellfish production (China, M. O. A, 2013), including the choking and death of shellfish, poor selectivity, and loss of mudflat sediment. Rotary tooth dredging and hydraulic vibratory dredging are the two basic categories of mechanized dredging method. The rotary tooth mechanized dredge is a type of bottom equipment towed by a fishing boat that is mainly used to catch buried shellfish and convey them to netting gear. Three main types of tooth harvesters include spring-loaded teeth (Haven et al., 1973; Haven et al., 1979), rotating conveyors (Collier and McLaughlin, 1983), and rotating drum teeth (Badino et al., 2004), depending on the rake tooth arrangement. Rotary tooth mechanized dredge offer low dragging resistance, high production, and adequate selectivity. However, their structure is more complex, they consume more energy, and they disturb the natural habitat of the seafloor. The development of vibratory harvesters has attracted much attention as shellfish production has grown in scope. Vibratory harvesting softens the mudflat sediment by using mechanized stimulation, and then the vibration of the mesh screen encourages the separation of shellfish and sediment as well as the subsequent collection of shellfish in the meshing gear. Vibratory harvesting offers several advantages such as high production, good selectivity, low ecological impact, etc. The hydraulic vibratory dredge manufactured in Netherlands, and the mixture of shellfish and sediment was rinsed with seawater by nozzles, and the shellfish was screened with a vibrating device in harvesting progress. (Rambaldi et al., 2001). The crank-rocker mechanism caused high-frequency vibration of the fixed rake teeth, which loosened the sediment and allowed the shellfish to be harvested and conveyed to the deck. The ebb tide bare mudflat clam vibratory harvester, designed by Dewey, lowered the cost of harvesting manila clams (Ruditapes philippinarum) by 3-5% (Pacific Shellfish Institute, 2014). The scale of manila clam farming on the west coast of the United States has increased by a considerable 40% in recent years due to the application of the vibratory harvester (Saurel et al., 2014). The British Columbia Shellfish Growers Association of Canada assessed the effects of the shellfish vibratory harvester manufactured by Taylor Shellfish Ltd. on mudflat ecology and found no appreciable difference between the environmental effects of manual harvesting and vibratory harvesting. The impact of vibratory harvesting was even less severe than that of natural factors such as wind and waves (Hoyseth, 2009; Stirling, 2013; Landry, 2017). The Nantong Agricultural Mechanization Technology Promotion Center in Jiangsu Province, China, manufactured a self-propelled hard clam (Meretrix meretrix) harvester that was towed by a crawler (Lu et al., 2021). The hard clams were first shoveled up along with sediment by the shovel plate teeth. Then, the hard clams were cleaned, screened, and conveyed with the aid of three cleaning roller brushes and a conveyor chain. Finally, the hard clams that met the harvesting specifications were conveyed into a collection basket. In summary, several researches from various countries worldwide have investigated shellfish harvesters and the mechanization of shellfish harvesting. There are now excellent evaluation systems for mudflat sediment damage, biological behavior, and water quality changes. However, the study of mechanized shellfish harvesting in China is rudimentary and still in the early stages of empirical design and testing. Several issues still require addressing, including the insufficient application of mechanized shellfish harvesting, paucity of research on harvesting theory, absence of design and manufacturing experience, and weak ecological evaluation system for mudflats. Consequently, shellfish harvesters and methods have become one of the fundamental factors limiting the healthy and sustainable development of the shellfish aquaculture industry in China (Mu et al., 2020).
To address the above issues, a brush-screen cooperative shellfish vibratory harvester was designed, and white clams (Mactra veneriformis) cultured in mudflats were used as the research objects. Besides, mechanics and kinematic models of shellfish on the vibrating screen were established through theoretical analysis. Mechanized shellfish harvesting was simulated using a combination of the discrete element method (DEM) and the response surface method, thereby achieving the design of the main harvesting mechanism and determining the operating parameters. After the simulations were completed, a shellfish vibratory harvester was manufactured and shellfish harvesting verification tests were conducted on shellfish farming mudflats. This project serves as a reference for the design and development of mechanized shellfish harvesters.
2 Harvesting structure and working principles
An illustration of the shellfish vibratory harvester is shown in Figure 1. The harvester is mainly composed of a first-stage spiral rolling stainless steel brush (first-stage brush), crank rocker double-layer vibrating screen, second-stage rolling plastic brush (second-stage brush), conveying chain, shellfish collection basket, power system, steering device, and other components. When the harvester is working, the harvesting depth of the vibrating screen can be manually adjusted using a handle according to the depth of the buried shellfish. Because mudflat sediment has high water content and easily clumps together, it can be efficiently screened and conveyed with the combined use of a first-stage brush, second-stage brush, and crank rocker type double-layer vibrating screen. The first layer vibrating screen works in tandem with the first-stage brush to excavate, loosen, and shovel the mudflat sediment and shellfish mixture into the first layer vibrating screen to realize the excavation and preliminary screening. The second-stage brush is placed at the connecting point of the first and second layers of the vibrating screen to crush the unbroken large pieces of sediment from the first layer vibrating screen and sweep the shellfish into the second layer vibrating screen. The mudflat sediment and juvenile shellfish are mostly screened out in the second layer vibrating screen, while the shellfish of the required size are retained for harvesting by being transferred to the conveyor chain at the end of the second layer vibrating screen. The screened shellfish are then transported along the conveying chain to the collection basket, thereby completing the harvesting process. To avoid mechanical interference between the screens during the reciprocating screening process of the double-layer vibrating screen and according to the design demand of each vibrating screen layer, the structure of each layer vibrating screen is designed with two inclination angles. Thus, the inclination angles of the tail ends of the first and second layers are equal.
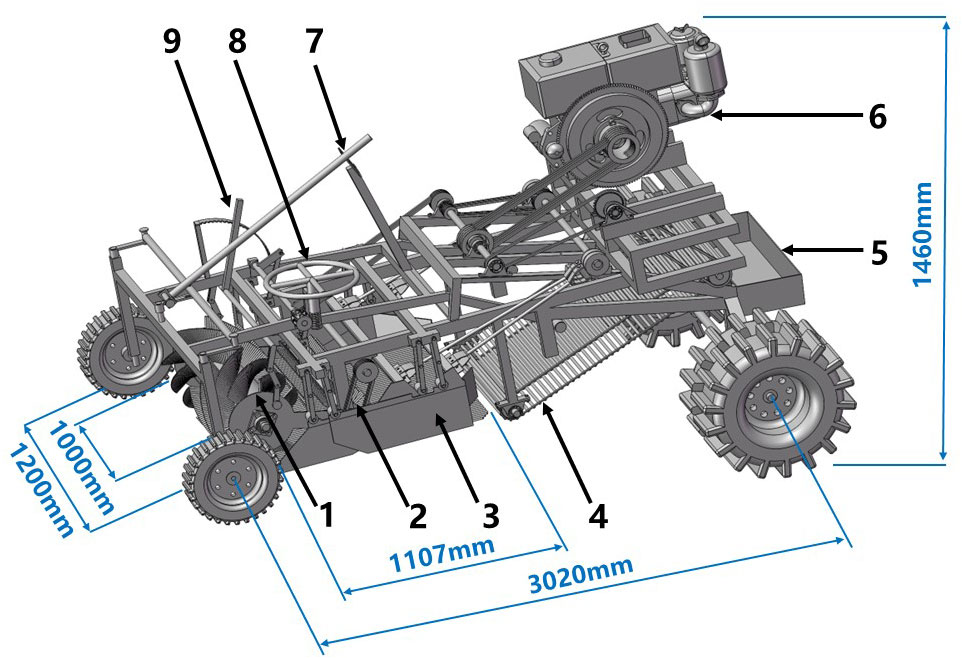
Figure 1 Structural diagram of the shellfish vibrating harvester. 1. First-stage brush; 2. Second-stage brush; 3. Crank rocker double-layer vibrating screen; 4. Conveying chain; 5. Shellfish collection basket; 6. Power system; 7. Steering device; 8. Catch depth adjustment handle; 9. First-stage brush adjustment device.
3 Motion analysis of shellfish on the vibrating screen
The crank rocker double-layer vibrating screen, an essential component of the vibratory shellfish harvester, mainly consists of a cylinder strip swing separating screen, an eccentric mechanism (eccentric bearing, bearing seat), a swing rod, and connecting rod, among other parts. The screening effect on the sediment and shellfish is directly influenced by the structural parameters and operating parameters of the crank rocker double-layer vibration screen. The screen is simplified into a planar six-rod mechanism, which comprises a crank rocker mechanism combined with a parallelogram mechanism, as shown in Figure 2. The cylinder strip swing separating screen (BC) is hinged on the frame through the front and rear pendulum (BE and CD), the crank (OA) performs a uniform circular motion with angular velocity ω, and the connecting rod AB pushes the cylinder strip swing separating screen (BC) to perform a reciprocating motion.
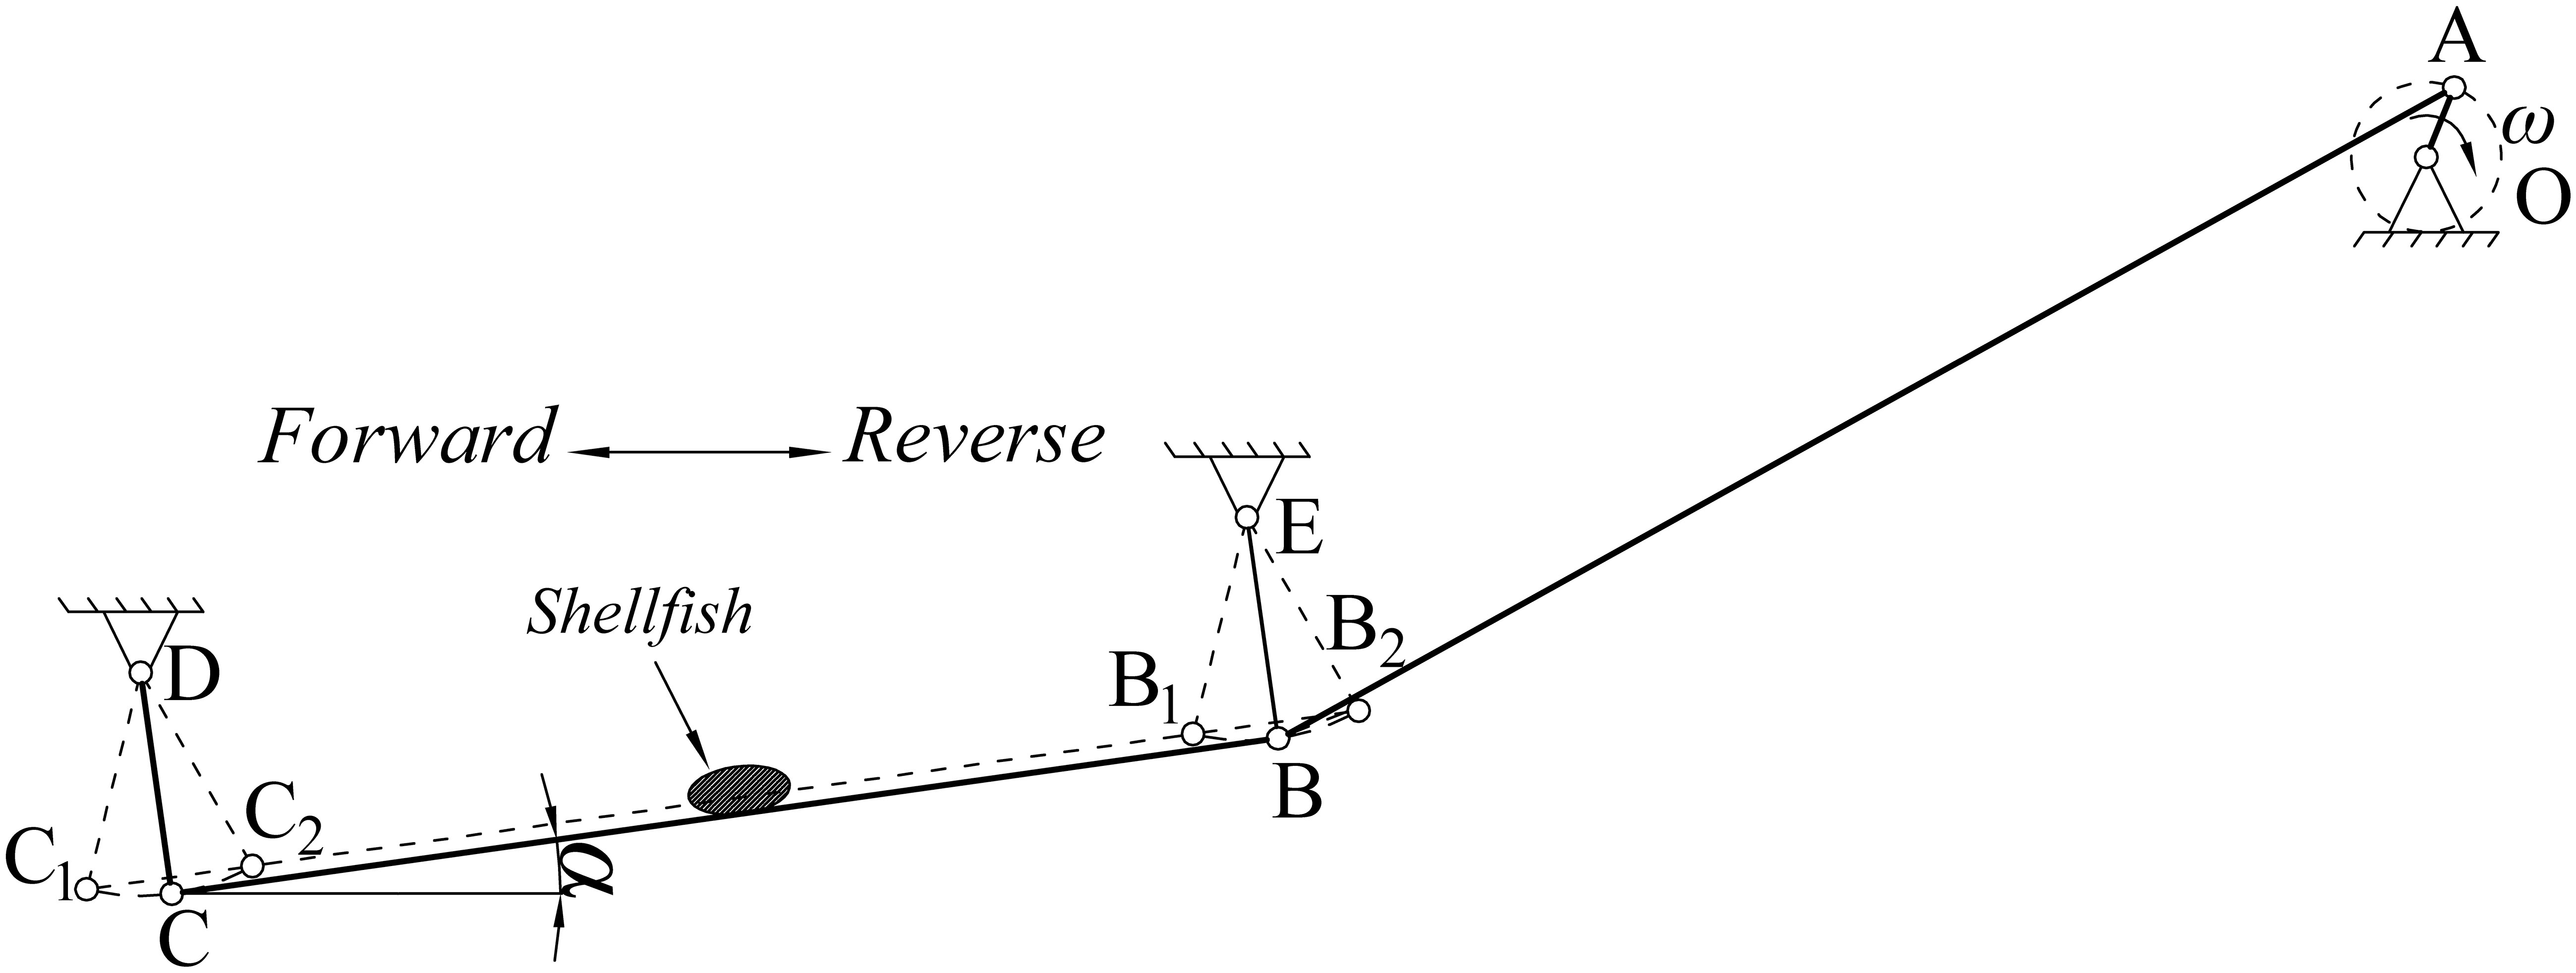
Figure 2 Vibrating screen mechanism diagram.
The force and relative motion state of a single shellfish mass on the vibrating screen were analyzed, ignoring the tumbling of the shellfish and their contact with one another. As Figure 3 shows, the principal forces acting on the shellfish on the vibrating screen are the screen surface support force Fn, gravity G, screen surface friction force Ff, and inertia force P. The movement of the shellfish is determined by the direction of the combined force on the shellfish. Due to uncertainty in the motion state of the shellfish on the vibrating screen, a motion analysis was carried out to obtain the displacement, velocity, and acceleration equations of the vibrating screen.
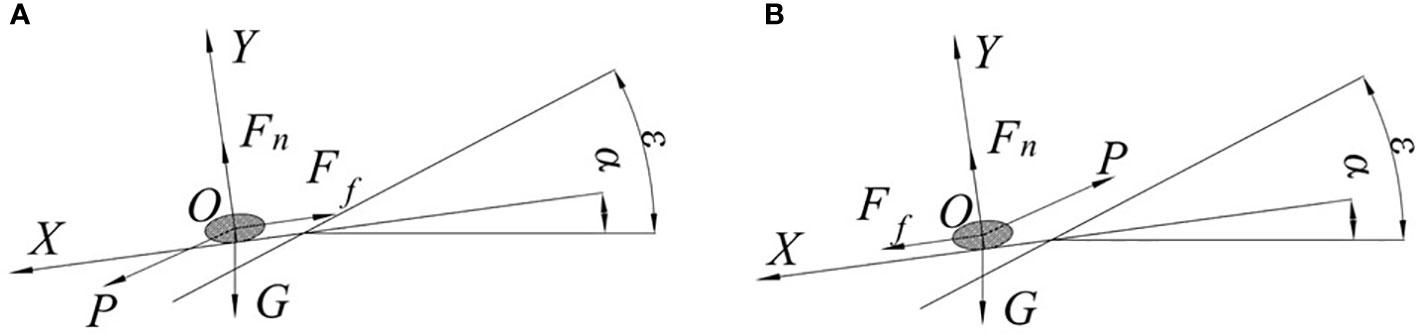
Figure 3 Force analysis of the shellfish motion state on the vibrating screen: (A) shellfish slides forward, (B) shellfish slides backward. The horizontal direction of the vibrating screen is set as the X-axis positive direction, while upward on the vertical screen surface is set as the Y-axis positive direction.
Displacement of the vibrating screen (x):
The velocity of the vibrating screen (v):
Acceleration of the vibrating screen (a):
where α is the screen inclination angle (°), r represents the crank length (m), ω denotes the crank angular velocity (rad/s), and t is the time (s).
In the shellfish harvesting process, the motion state of the shellfish on the vibrating screen can be divided into backward sliding (sliding toward the tail point B of the vibrating screen), forward sliding (sliding toward the front point C), and jumping states. Force analysis of the shellfish under the backward and forward sliding limit conditions is displayed in Figure 3. According to the results of the shellfish force analysis, the following conditions should be satisfied when the material slides forward, slides backward, or jumps on the vibrating screen.
When the shellfish slides forward, as shown in Figure 3A, the direction of inertia force is downward along the direction of vibration, and the acceleration is positive.
Combining Equations 4-8 yields Equation 9:
where m denotes the shellfish mass (kg), ϵ represents the horizontal swing direction angle (°), α is the inclination angle of the vibrating screen with a value range of 5-14°, μ signifies the static friction coefficient between the vibrating screen and the shellfish, φ represents the static friction angle between the vibrating screen and the shellfish (°), and g is the acceleration due to gravity (m/s2).
When the shellfish slides backward, as shown in Figure 3B, the inertia force direction is upward along the direction of vibration.
Equation 13 is generated by combining Equations 10-12:
When the shellfish jumps, the conditions required for the shellfish to leave the vibrating screen are expressed using Equation 14:
which can be simplified as:
The motion index D characterizes the motion state of the shellfish and makes it easier to analyze the impact of each structural parameter on the shellfish motion state.
Shellfish forward motion index Df:
Shellfish backward motion index Db:
Shellfish jumping motion index Dj:
where K denotes vibration intensity.
From Equations 17-19, it can be observed that the motion index D of the shellfish on the vibration screen is related to α, ϵ, r, ω, and φ. Due to the high-water content of mudflat sediment, it is difficult to separate shellfish and sediment. Thus, to improve screening efficiency, the shellfish and sediment mixture must undergo double movement on the vibration screen to increase the screening time, and ensure that Db is greater than Df. To improve the efficiency of shellfish conveying, the difference between Db and Df should be maximized. This leads to an increase in Dj, shortens the shellfish harvesting time, and improves shellfish conveying efficiency.
The average static friction angle (φ) between the shellfish and the vibrating screen surface (stainless steel) was measured using the inclined plate method (φ = 25°) (González-Montellano et al., 2012; Ramírez-Gómez et al., 2014). According to the empirical value of the picker design and the size of the harvester structure, the structural parameters were chosen as r = 0.01 m, ω = 30 rad/s, and ϵ1 = 30° for the first layer, ϵ2 = 35° for the second layer of the vibrating screen. The range of values for α is 5-14°. Figure 4 illustrates the change curve of the shellfish motion index (D) on the vibrating screen under various screen inclination angles (α).
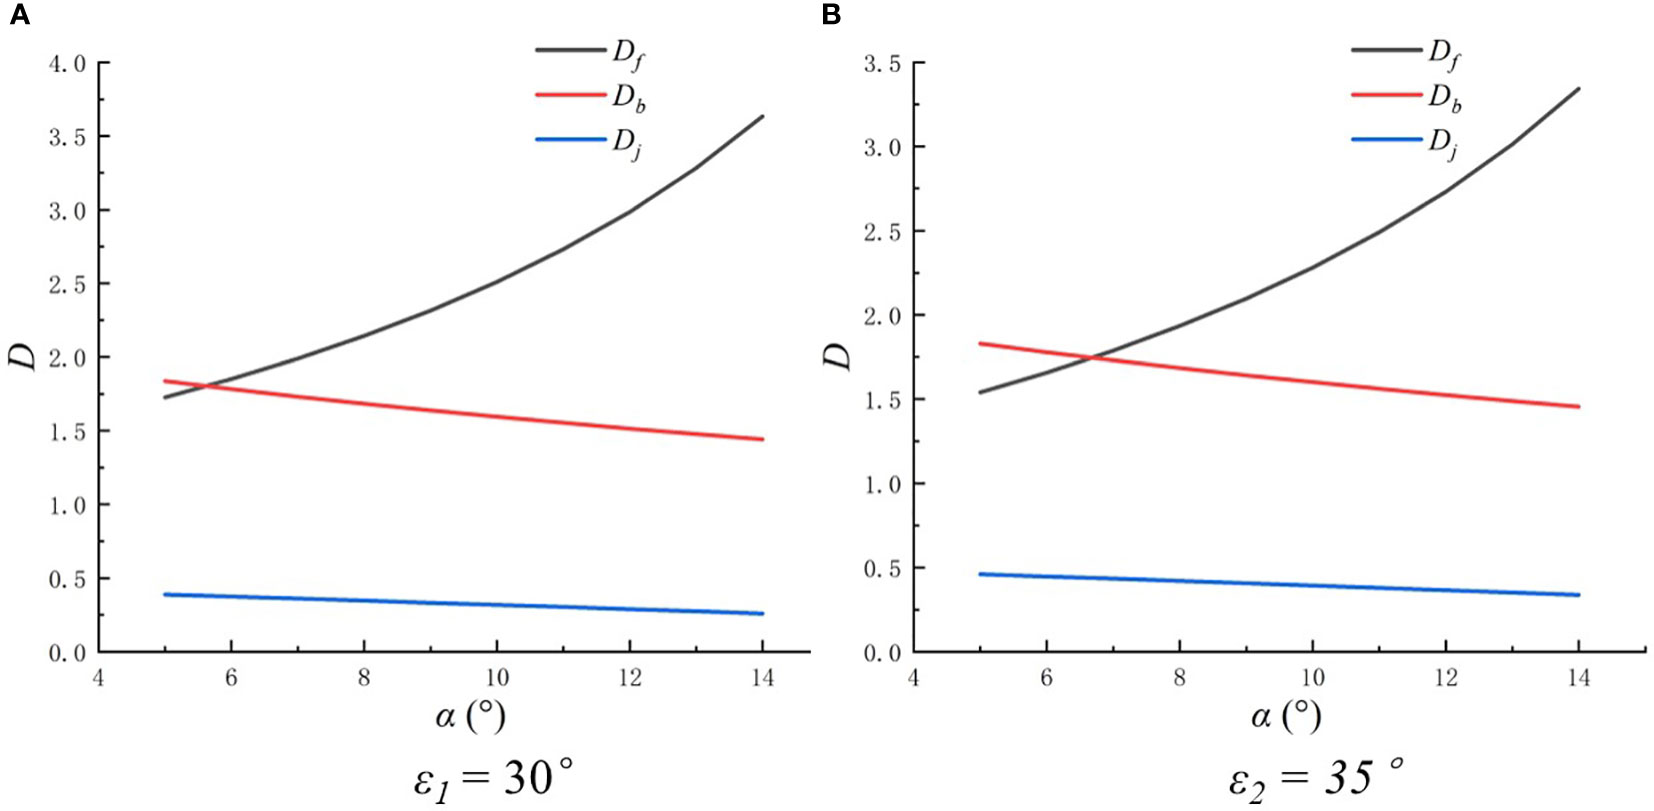
Figure 4 The shellfish motion index change curve under different horizontal swing direction angles: (A) ϵ1 =30°, (B) ϵ2 =35°.
As Figure 4 reveals, the Db value of the shellfish on the vibrating screen gradually decreases with increasing α, while Df steadily increases as α rises. Additionally, Dj falls slightly with an increase in α, but the change is insignificant. To improve the shellfish harvesting efficiency in the first layer of the vibrating screen and reduce harvesting energy consumption, it is necessary to reduce the length of the front section of the vibrating screen that receives the excavated mudflat sediment and increase the inclination of the front section in the first layer of the vibrating screen. Thus, we set the inclination of the front section in the first layer of the vibrating screen as α1-1 = 11° and the inclination of the screen at the tail end to α1-2 = 8°. To improve the efficiency of shellfish screening and conveying in the second layer of the vibrating screen, the inclination of the front section in the second layer of the vibrating screen was set as α2-1 = 8°, while the inclination of the screen at the tail end was selected as α2-2 = 5°.
4 Shellfish harvesting DEM simulation
4.1 DEM modeling of shellfish harvesting
In this study, the mudflat sediments and white clams in the shellfish culture area of Panjin City, Liaoning Province, China (40°42′4″N, 121°8′56″E) were used as the research objects. The mudflat DEM models (white clam DEM model (Mu, 2019; Liu et al., 2020; Li et al., 2021) and mudflat sediment DEM model (Asaf et al., 2007; Bahrami et al., 2020) were established accurately using EDEM software (EDEM, 2018, DEM Solutions Ltd., Edinburgh, UK), as Table 1 shows. According to shellfish harvesting requirements, stainless steel (Cabiscol et al., 2018; Bahrami et al., 2020) and plastic were selected as the contact material. Besides, the simulation contact parameters are shown in Table 2.
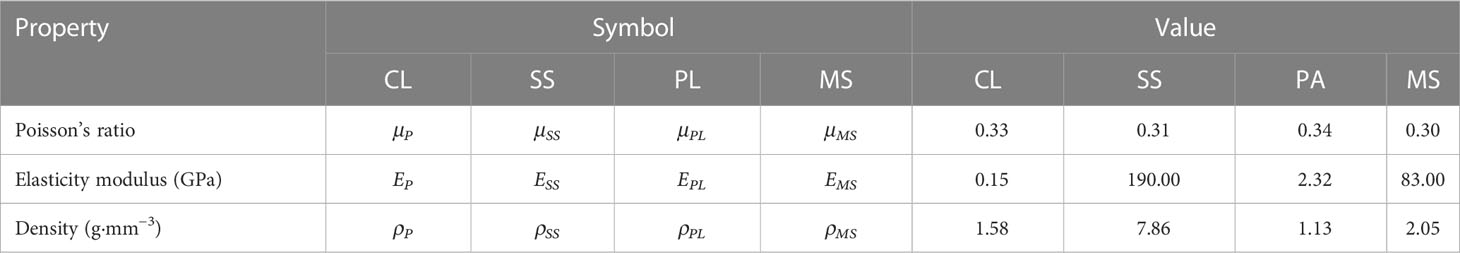
Table 1 Characteristic material parameters for white clams (CL), stainless steel (SS), plastic (PA), and mudflat sediment (MS).
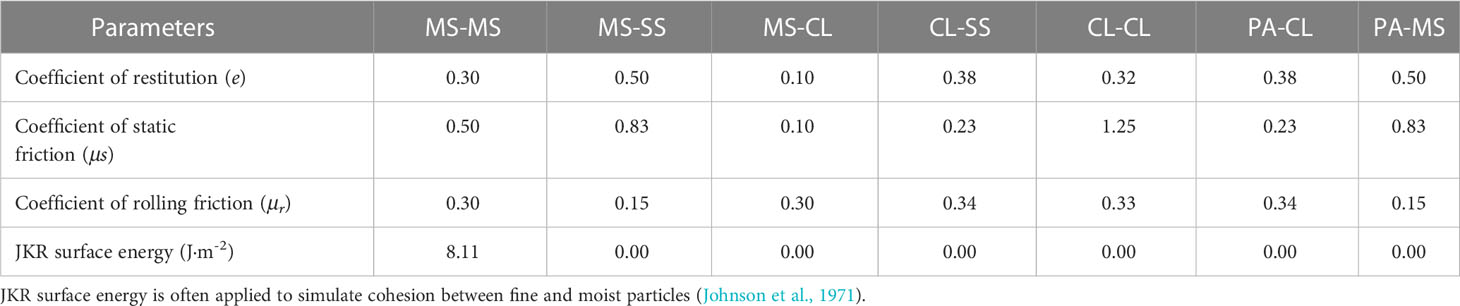
Table 2 Simulation contact parameters of different DEM models.
To improve simulation efficiency, the diameter of the mudflat sediment DEM model ( x1 = 0.14mm) was proportionally enlarged by five times to reduce the total number of particles in the soil box. In EDEM software, a virtual plane (length, width: 980mm, 190mm) was added 200mm above the soil box (length, width, and height: 1000 mm, 200 mm, and 200 mm) and two particle factories (30 pieces of shellfish particles and 60,000 pieces of mudflat sediment particles) were added to the virtual plane. The shellfish and mudflat sediment particles were evenly distributed in the soil box at the same time with an initial velocity of 5m/s, and the mudflat DEM model was established, as shown in Figure 5.
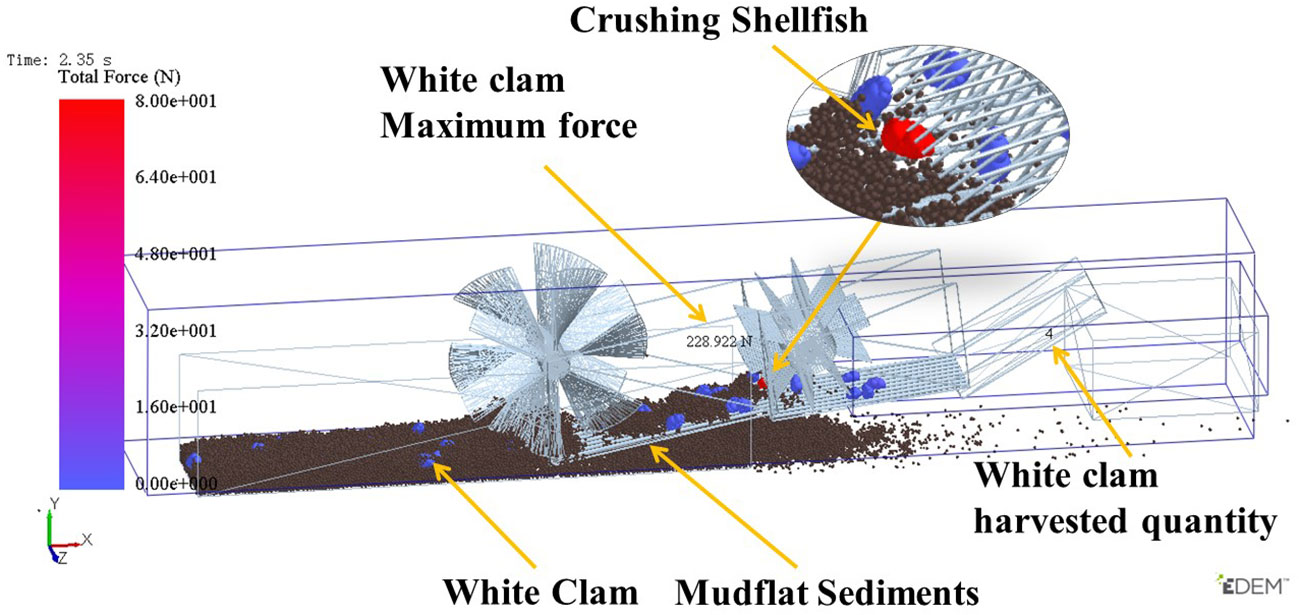
Figure 5 DEM simulation of shellfish vibratory harvesting.
The three-dimensional structure of the shellfish vibratory harvester was simplified. Ultimately, only the essential components were retained, including the double-layer vibrating screen, first-stage brush, second-stage brush, conveying chain, and collection basket. The width of the vibrating screen was also reduced to 200 mm (reduction ratio 5:1).
The simplified three-dimensional structures of the harvester were imported into EDEM software, then the inclination angles of the first and second vibrating screens were set according to the results obtained in Section 2. The axle centers of the first-stage brush and second-stage brush were subsequently added with the clockwise rotation motions respectively, the second-stage brush’s rotation rate was same as the first-stage brush’s rotation rate (Table 3). And two linear reciprocating motions (frequency: 15 Hz, Reciprocal motion displacement: 20 mm, amplitude in Table 3) were added to the double-layer vibrating screen, the conveyor speed was 0.2m/s. Further, a linear motion (parallel to the conveyor surface toward the oblique rear) was added to the conveying chain, and the linear motion in X- direction was added to all simplified key structures, respectively, and set the travel speed (Table 3).
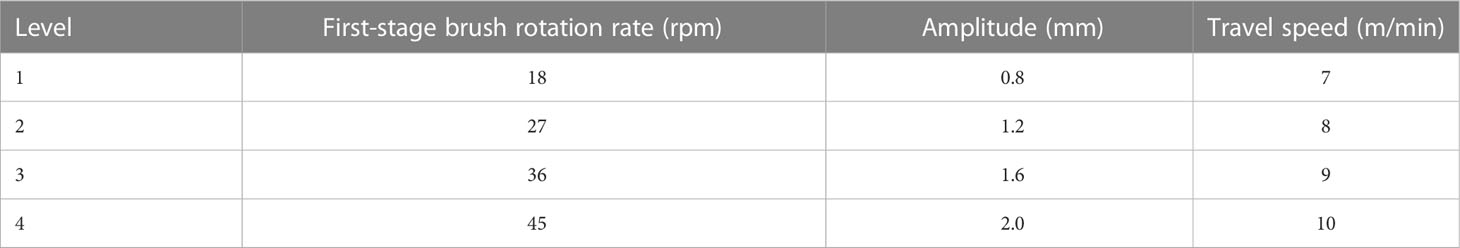
Table 3 Single-factor test for clam harvesting simulation.
To reduce the simulation time, the shellfish was defined to have been harvested upon reaching the end of the second layer vibrating screen. To count the quantity of shellfish harvested, a grin bin group was added to the tail of the equipment, as shown in Figure 5.
Electronic universal testing equipment was used to determine that the least force required to break a shellfish was 86 N and that a shellfish was damaged when it was subjected to a force greater than 80 N during the harvesting simulation process. To measure the maximum force of shellfish during the harvesting process, a grin bin group was added to the whole soil box. According to the shellfish force value, the number of shellfish forces greater than 80 N was counted, and the shellfish crushing rate was calculated. A reference legend representing the force applied to the shellfish was inserted on the left side of Figure 5 and run throughout the simulation. The force applied during the harvesting process was judged by where and how the shellfish were crushed by observing the change in color of the shellfish surface.
4.2 Shellfish harvesting single factor simulation test
4.2.1 Materials and methods
The yield of shellfish, screening effectiveness, and harvesting area was affected directly by the structure and operating paraments of the harvester. The parameters included the first-stage brush rotation rate, harvester travel speed, vibrating screen amplitude (vibration along the y-axis direction), etc.
The design of the single-component simulation for shellfish harvesting is presented in Table 3. The factor rotation method was used to determine the optimal range of values for each factor and the test indexes were the quantity of shellfish harvested and the shellfish crushing rate ϕc (Equation 18). The optimal range of values for each factor was obtained using the factor rotation method.
where Nc represents the number of crushed shellfish and Ntis the quantity of total shellfish harvested, according to the EDEM software.
4.2.2 Results and analysis
4.2.2.1 Influence of first-stage brush rotation rate
The quantity of shellfish harvested first increased and then decreased when the rotational rate of the first-stage brush increased and all other conditions remained constant. The maximum number of shellfish harvested was 14 pieces when the rotation rate of the first-stage brush was 27 rpm, as Figure 6 indicates. Additionally, the shellfish crushing rate initially declined and then grew as the first-stage brush rotational rate increased. When the first-stage brush rotational rate was 36 rpm, the shellfish crushing rate was 0%. Under the same conditions, the volume of mudflat sediment cut per unit of time was higher at a slow first-stage brush rotational rate. This made it more difficult to screen the shellfish and sediment effectively, thereby reducing the harvesting efficiency. Conversely, when the first-stage brush rotational rate was faster, the volume of sediment cut decreased and the efficiency of the vibrating screen increased. However, the shellfish were more easily broken by the brush, thus increasing the shellfish crushing rate. By considering the number of shellfish harvested and the shellfish crushing rate, the ideal first-stage brush rotational rate range was 27-45 rpm.
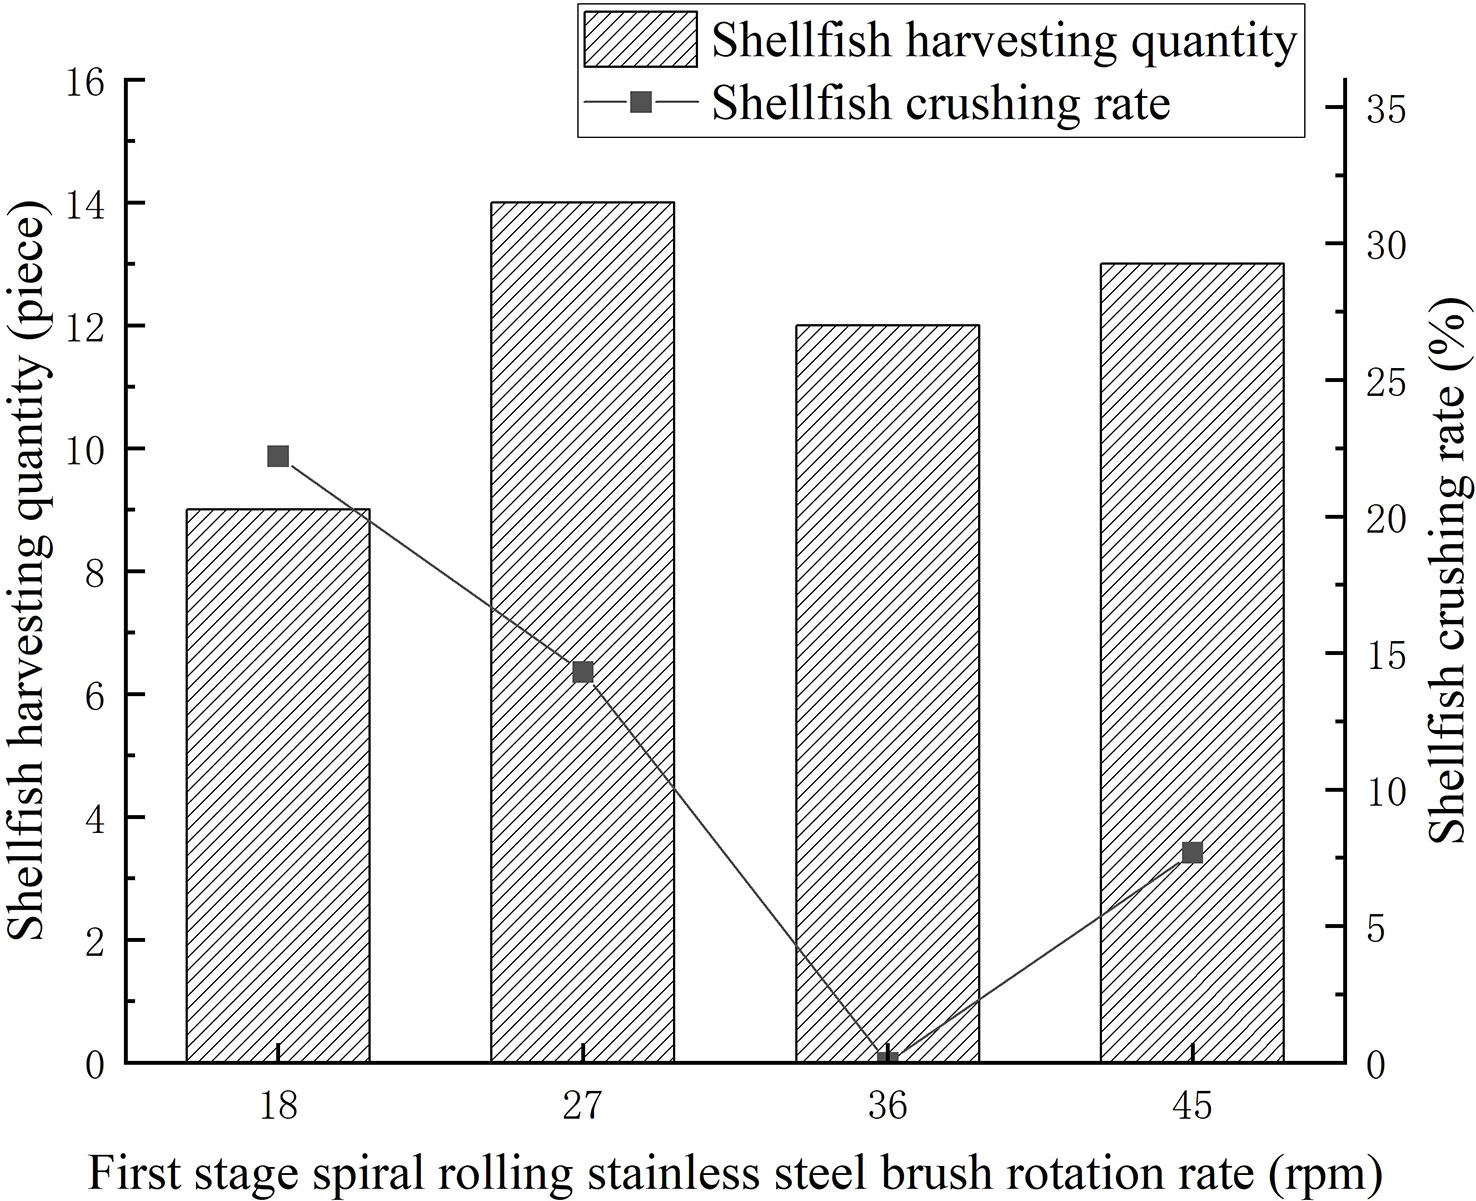
Figure 6 Influence of first-stage brush rotation rate on shellfish harvesting.
4.2.2.2 Influence of screen vibration amplitude
The effect of amplitude on shellfish harvesting simulation is shown in Figure 7. The quantity of shellfish harvested gradually rose as the amplitude increased, but the difference in the quantity of shellfish harvested between different amplitudes was negligible. Under constant conditions, higher vibration amplitudes led to greater heights from which the sediment and shellfish fell onto the vibrating screen. Also, they fell more quickly onto the screen surface, making them easier to sift and boosting shellfish harvesting efficiency. When the vibration amplitude was 1.2 mm, 1.6 mm, or 2.0 mm, the quantity of shellfish harvested was similar and the shellfish crushing rate was 0. However, larger amplitudes resulted in higher energy consumption and greater structural strength requirements for the machine. After comprehensive consideration, the amplitude range of the vibrating screen was established in the range of 0.8-1.6 mm.
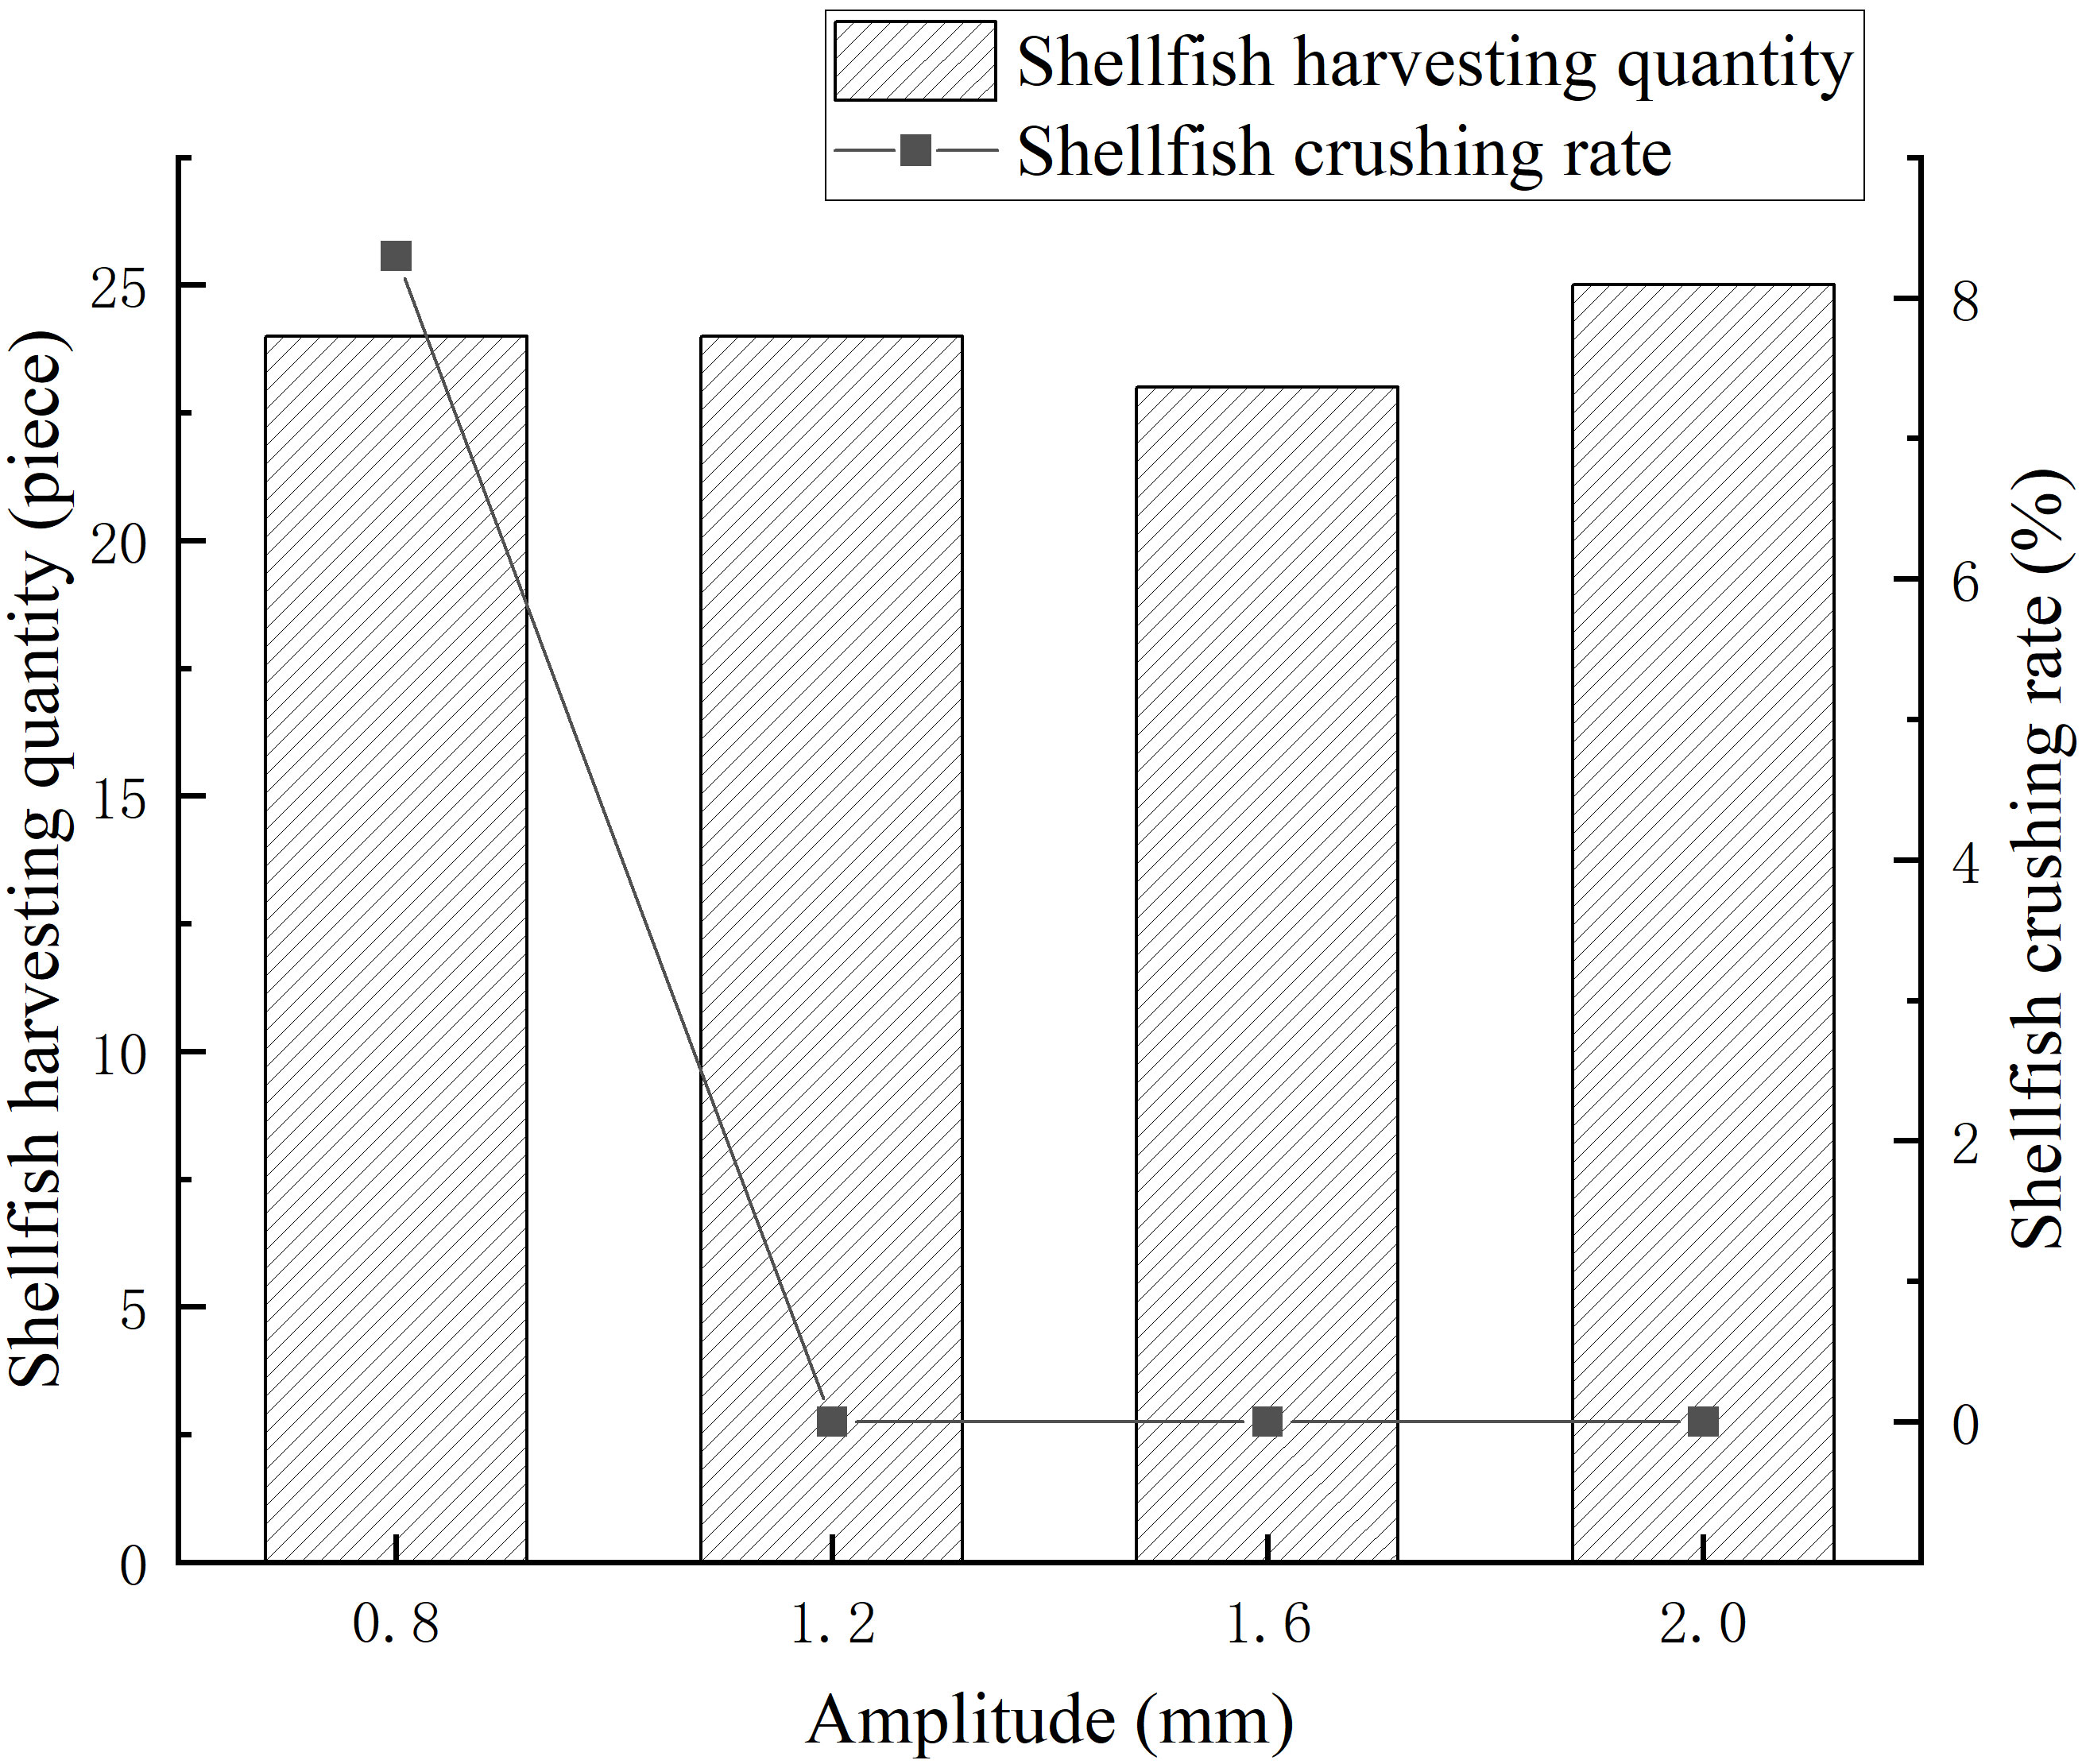
Figure 7 Influence of amplitude on shellfish harvesting.
4.2.2.3 Effect of harvester travel speed
The results for shellfish harvesting under various travel speeds are presented in Figure 8. When the travel speed of the harvester increased, the quantity of harvested shellfish gradually decreased, while the shellfish crushing rate remained constant at 0. The front end of the vibrating screen moved along an inclined sinusoidal vibration curve (Awuah et al., 2022), and as the harvesting equipment traveled faster, the sinusoidal curve cycle displacement became longer and the wave crests grew farther apart from one another. This resulted in shellfish leakage and reduced the quantity of shellfish harvested. However, as the harvester’s travel speed grew, the area it could harvest in a given amount of time and the harvesting efficiency also rose. Given the quantity of shellfish being harvested and the harvesting efficiency, the travel speed of the harvester was chosen in the range of 8-10 m/min.
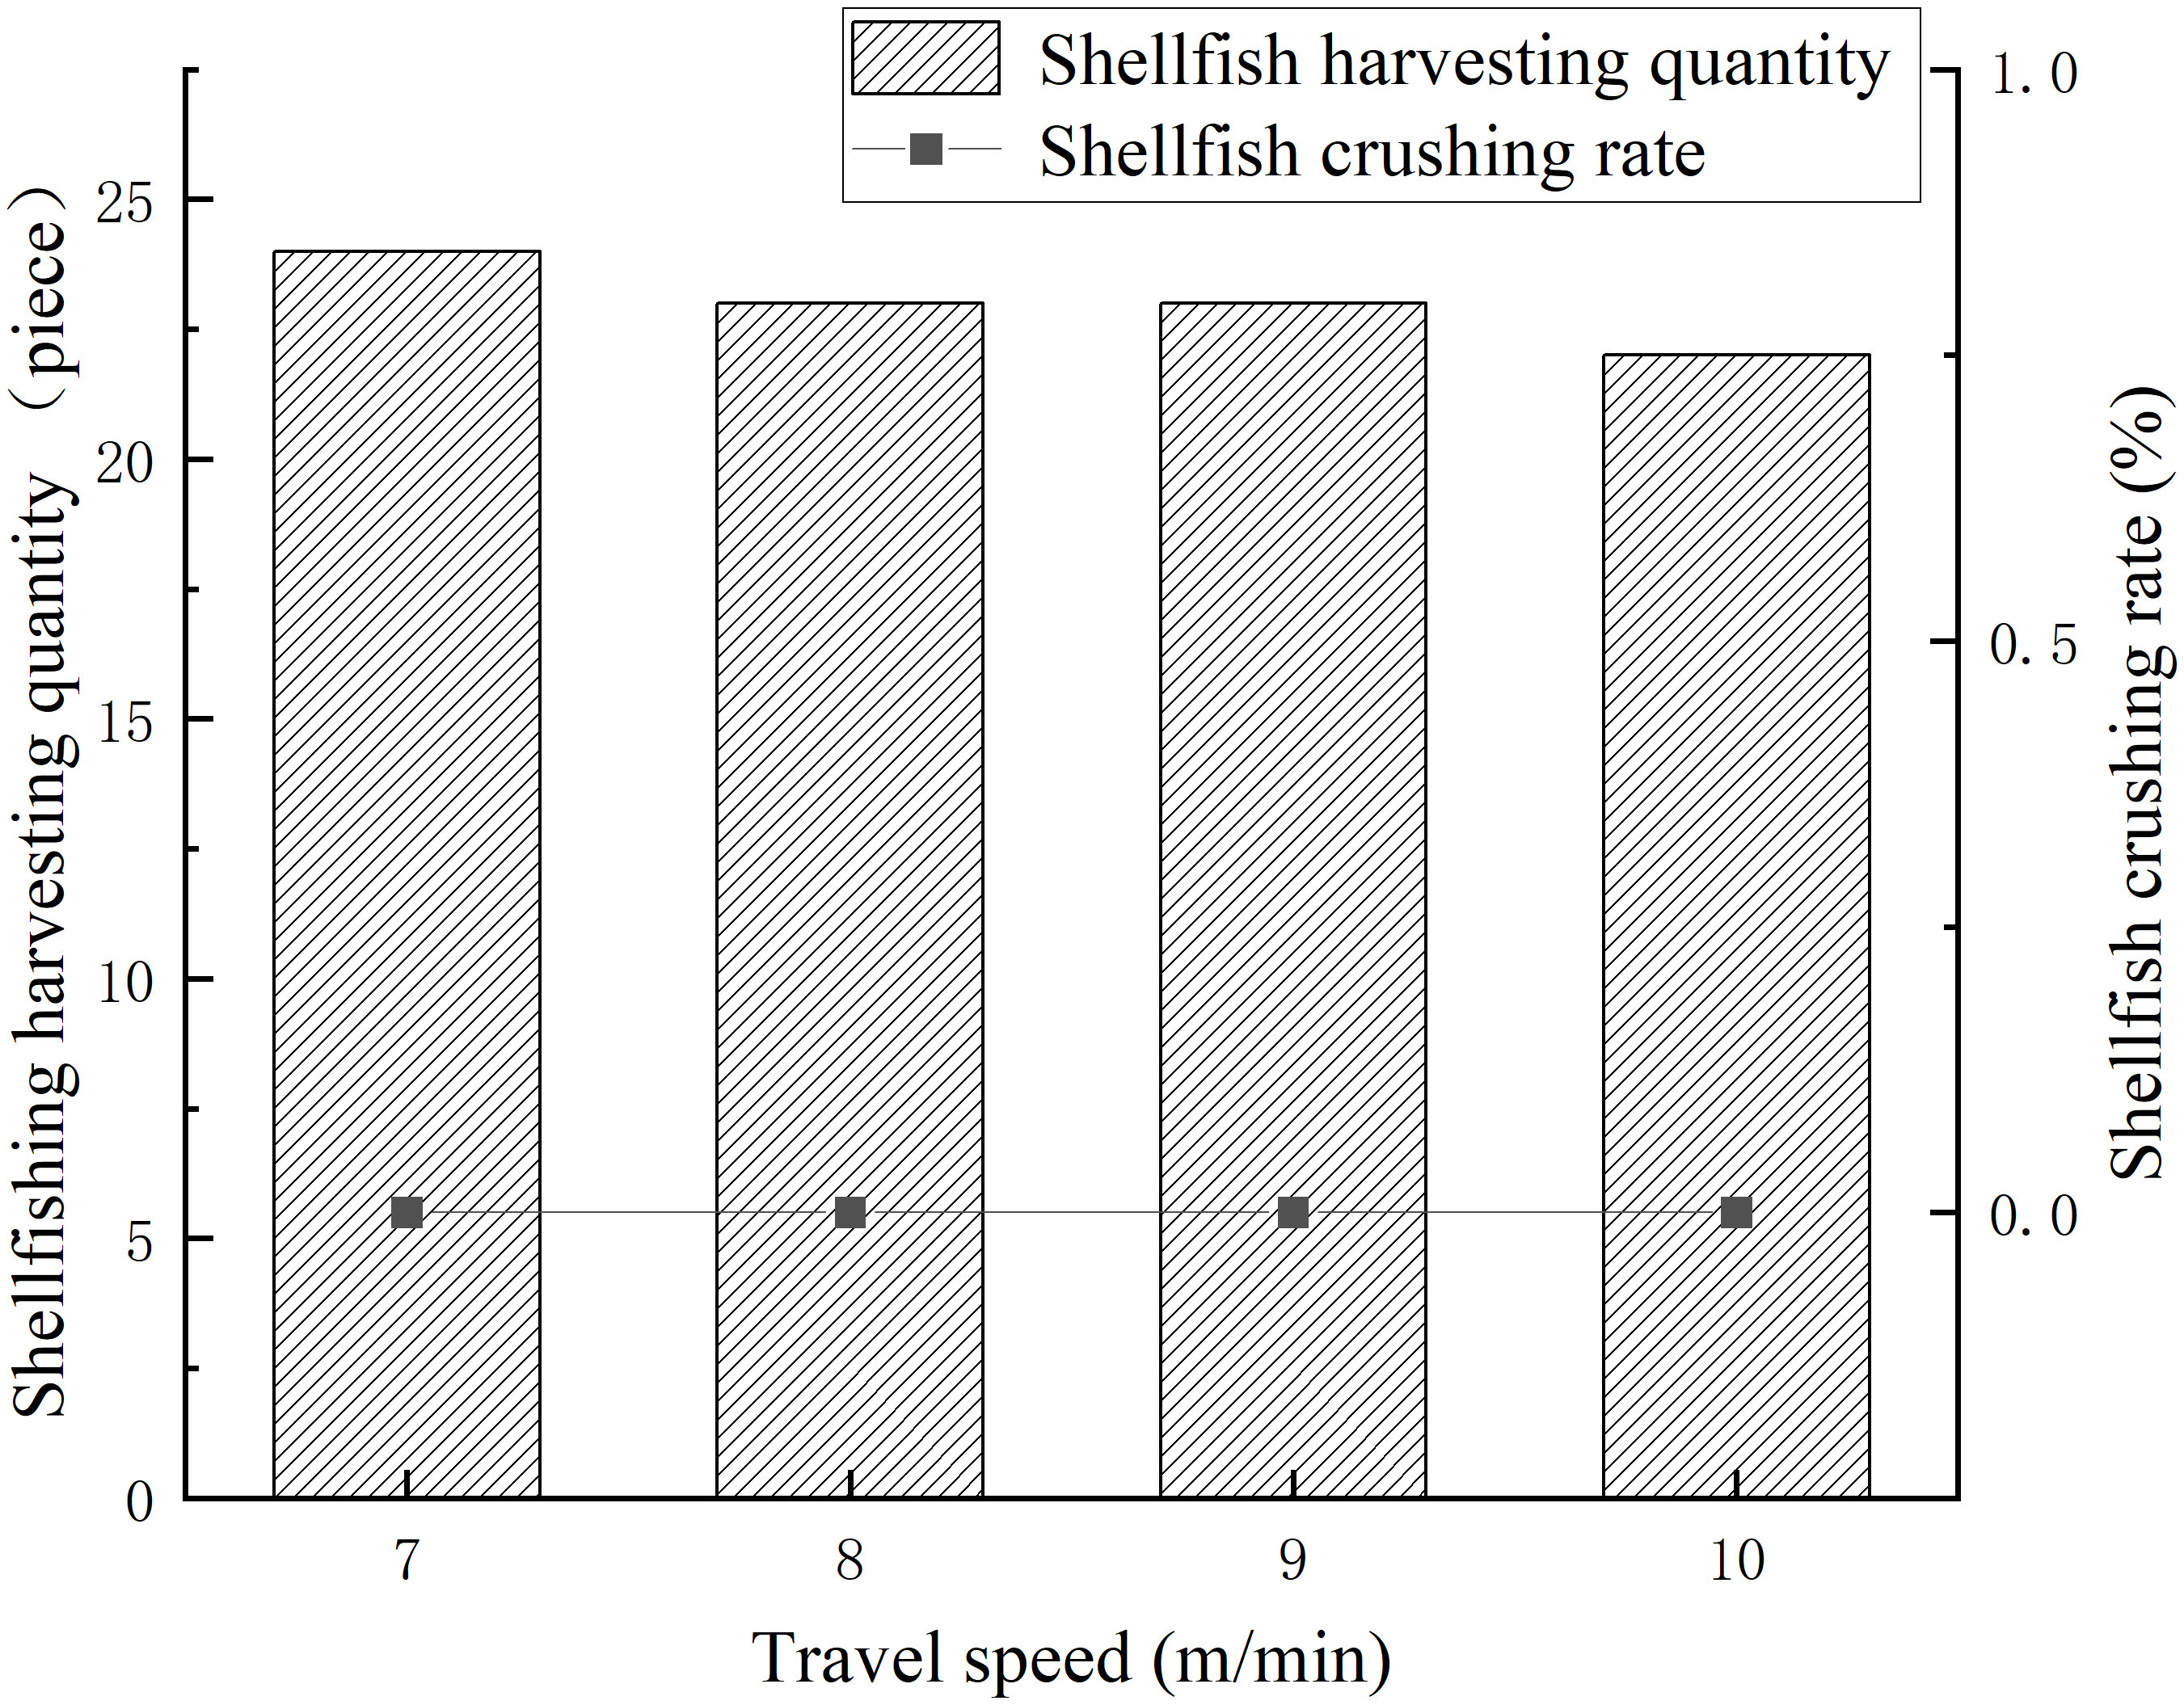
Figure 8 Influence of travel speed on shellfish harvesting.
4.3 Response surface simulation experiment
To obtain the optimal operating and structural parameters of the vibratory shellfish harvester, the Box-Behnken experimental design method was chosen in the design of the harvesting simulation response surface experiment with Design-Expert software (Design-Expert v8.0.6.1, Stat-Ease, Minneapolis, MN, USA). Besides, the response surface experiment factors were coded according to those listed in Table 4. Both the quantity of shellfish harvested (Nt) and the shellfish crushing rate (ϕc1) were employed as response variables.
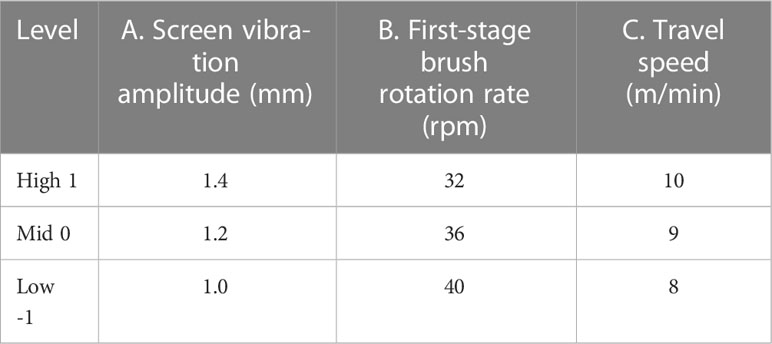
Table 4 Response surface experiment factor codes.
The results of the shellfish harvesting response surface simulation experiments are displayed in Table 5. The maximum and minimum number of shellfish harvested under various parameters were 25 pieces and 21 pieces, respectively, while the shellfish crushing rate varied from 0% to 8.7%.
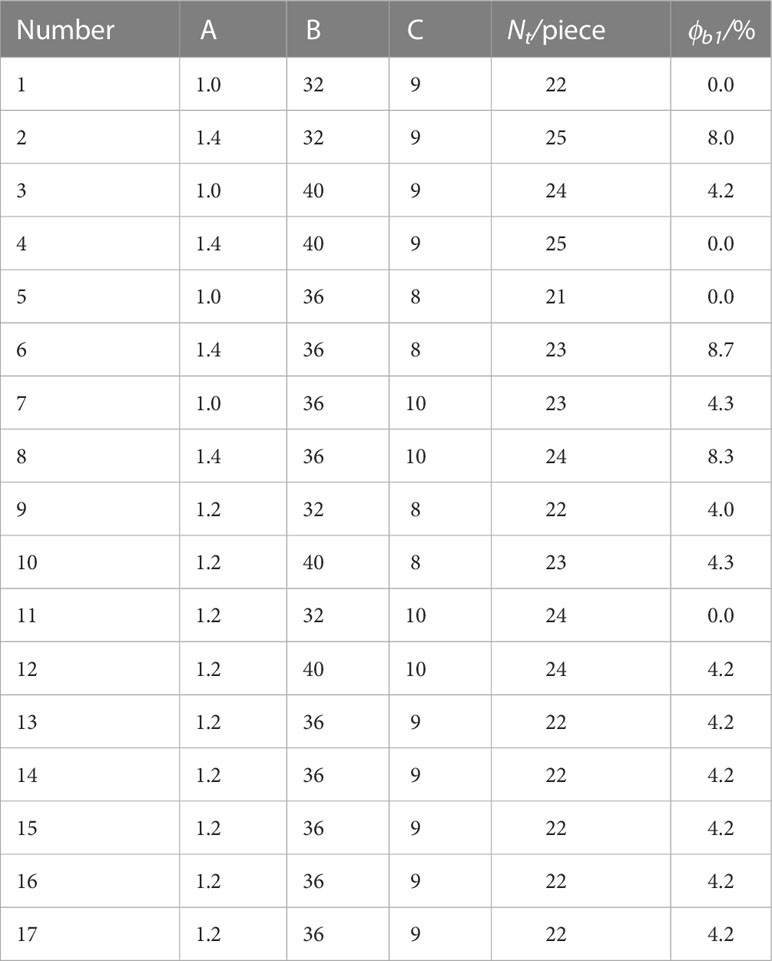
Table 5 Results of the shellfish harvesting response surface simulation tests.
4.3.1 Influence on shellfish harvesting quantity
A multivariate fitted regression equation (Eq. 21) between the quantity of shellfish harvested and each factor was created using Design-Expert software by removing insignificant factors from the analysis results of the shellfish harvesting simulation tests (Table 6).
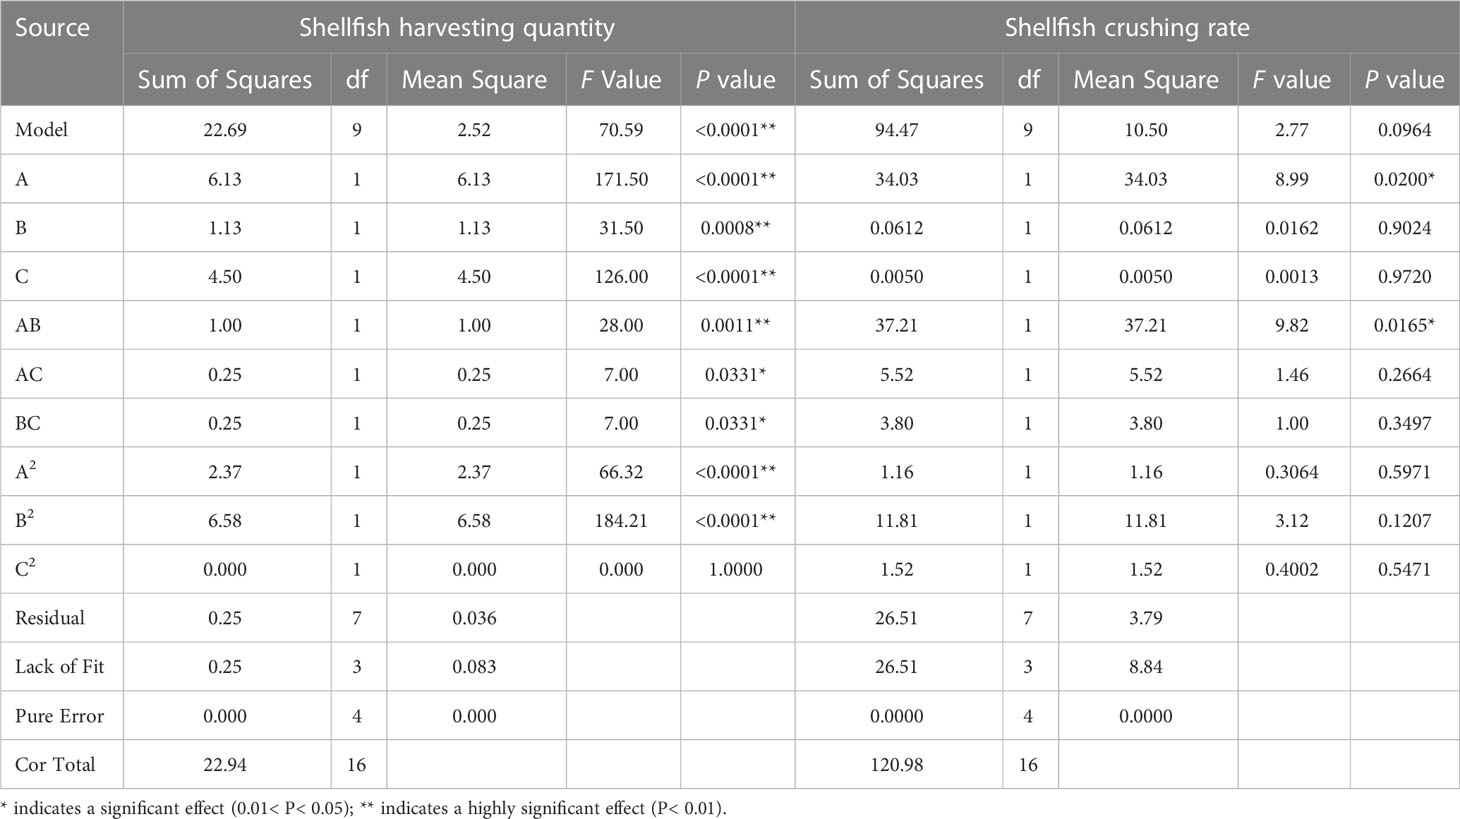
Table 6 ANOVA results of factors influencing shellfish harvesting quantity and shellfish crushing rate.
According to the results of the ANOVA model on the factors determining the quantity of shellfish harvested (Table 6), A, B, C, AB, A2, and B2 had significant effects on the quantity of shellfish harvested. Besides, AC and BC had insignificant effects on the quantity of shellfish harvested. Specifically, the three factors of B2, C, and A had the largest impact on the quantity of harvested shellfish. The fitted model for the quantity of harvested shellfish was highly significant (P< 0.0001), indicating that the significance level of the model was high. The results of the last five sets of replicate tests in Table 5 were the same because the shellfish vibration harvesting simulation test conditions remained constant. Moreover, the P values for lack of fit and pure errors of the misfit term for the shellfish harvesting quantity were all 0. The model coefficient of determination R2 = 0.9891 indicated a good fit between the actual and predicted values established by the regression equation. The determination correction coefficient = 0.9751 also indicated that the equation was reliable. The Adeq Precision was 28.460, suggesting excellent equation accuracy. The coefficient of variation (CV) of the multivariate fitted equation was 0.82%, indicating high experiment reliability.
The influence of test factors on the quantity of shellfish harvested is presented in Figure 9A. When the screen vibration amplitude was fixed, the quantity of harvested shellfish initially decreased and then increased as the rotational rate of the first-stage brush increased. The quantity of shellfish harvested rose with an increase in vibration amplitude, and the influence of amplitude was more pronounced. The bounce height and the falling speed of the shellfish and sediment both grew as the amplitude of the vibrating screen increased, thereby enhancing screening efficiency. The vibrating screen and the shellfish both experienced relative displacement while the harvester moved forward and the shellfish were bouncing up from the screen. When the shellfish bounced off the screen surface, the harvester advanced forward, and a relative displacement was generated between the vibrating screen and the shellfish. The greater the height at which the shellfish bounced and the further they were displaced backward, the more efficiently the shellfish were conveyed and harvested.
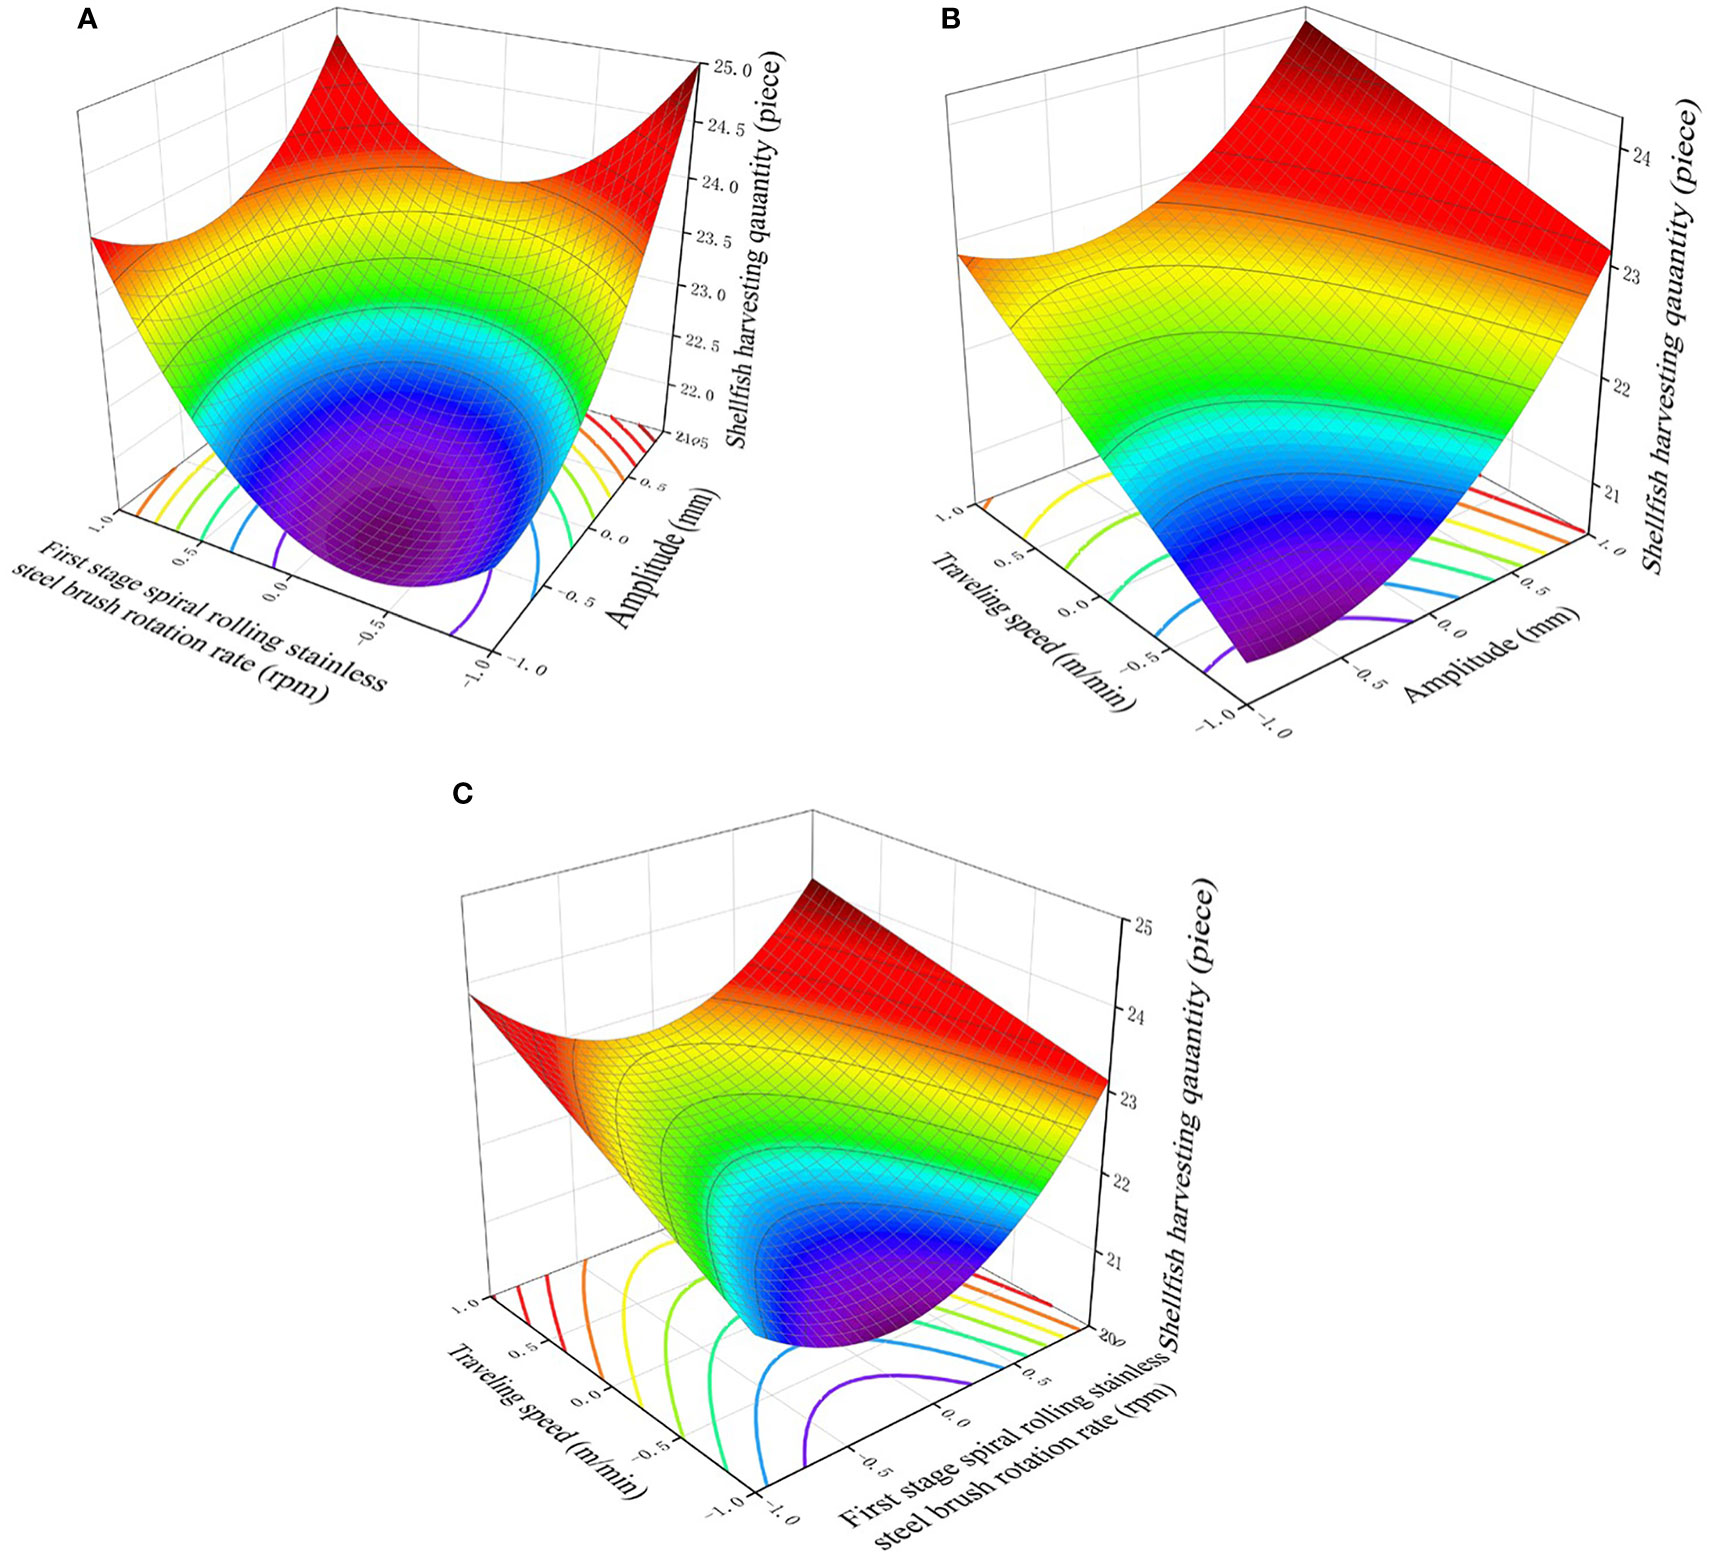
Figure 9 Influence of test factors on the quantity of shellfish harvested: (A) effect of first-stage brush rotation rate and amplitude on the number of shellfish, (B) effect of amplitude and travel speed on the number of shellfish, (C) effect of first-stage brush rotation rate and travel speed on the number of shellfish.
When the travel speed was fixed, as shown in Figure 9B, the quantity of shellfish harvested grew as the vibration amplitude increased. Additionally, the quantity of shellfish harvested increased with a rise in harvester travel speed when the amplitude was fixed. The quantity of shellfish harvested was optimal when both speed and amplitude were at their maximums, and amplitude had a greater influence on the quantity of shellfish harvested. When the travel speed was fixed, the quantity of shellfish harvested initially decreased and then increased with an increase in the rotational rate of the first-stage brush, as shown in Figure 9C. When the rotational rate of the rolling brush was fixed, the number of shellfish harvested rose with an increase in travel speed. Furthermore, the harvester’s travel speed had a more significant influence on the quantity of shellfish harvested.
4.3.2 Influence on shellfish crushing rate
The results of the shellfish crushing rate simulation tests are shown in Table 6. The shellfish crushing rate model is not statistically significant (P > 0.05), the precision (Adeq Precision) is 7.933, the model variance CV = 50.52%, the equation coefficient of determination R2 = 0.6665, and the correction coefficient of determination = 0.4664. These figures indicate because the reliability and precision of the shellfish crushing rate simulation test were low, the response surface experiment reliability was poor. The primary cause of shellfish crushing was that the shellfish were crushed between the rolling brush and the vibrating screen, which was not related to each test factor.
4.3.3 Simulation and optimization of key harvester parameters
The objective and constraint functions were established according to the requirements of shellfish harvesting. By combining the boundary conditions of the key factors, the results of the shellfish vibration harvesting simulation response surface experiments were optimally solved using the optimization module in Design-Expert software.
The optimal key factor combination of the shellfish vibration harvesting simulation was obtained through statistical analysis. The ideal screen vibration amplitude was 1.4 mm, the first-stage brush rotation rate was 40 rpm, and the harvester travel speed was 10 m/min. Subsequently, the quantity of shellfish harvested was calculated by unit area under simulation conditions as Nta = 125 pieces/m2, while the shellfish crushing rate ϕb1 = 2.90%.
5 Shellfish harvesting verification test
According to the results of the simulation, a brush-screen cooperative shellfish vibratory harvester was manufactured completely. Based on the optimized results of the response surface experiment, the harvester was debugged. A verification test of shellfish harvesting was carried out using the vibratory shellfish harvester in the white clam growing area of Panjin City, Liaoning Province, China, in September 2021, as depicted in Figure 10. The site environment in the test was a sandy mudflat, the moisture (Ws) was 45.55%, the average penetration force at 100mm depth was 3.8N, and the sediment average diameter x2 was 0.09mm. A rectangular test area of 15 m × 1 m was created on the mudflat. The test area was divided into three equal parts lengthwise and then marked. The quantity of shellfish harvested (Nr) and the shellfish crushing rate (ϕb2) in the collection baskets were counted every 5 m the harvester traveled. The quantity of shellfish harvested and the quantity of shellfish crushed was obtained by manual counting, and the shellfish crushing rate was calculated. Also, the relative error (E) in the quantity of shellfish harvested, the quantity of shellfish harvested per unit area (Nra), and the absolute value in the crushing rate error (△ϕb) were calculated according to Equations (24)-(26).
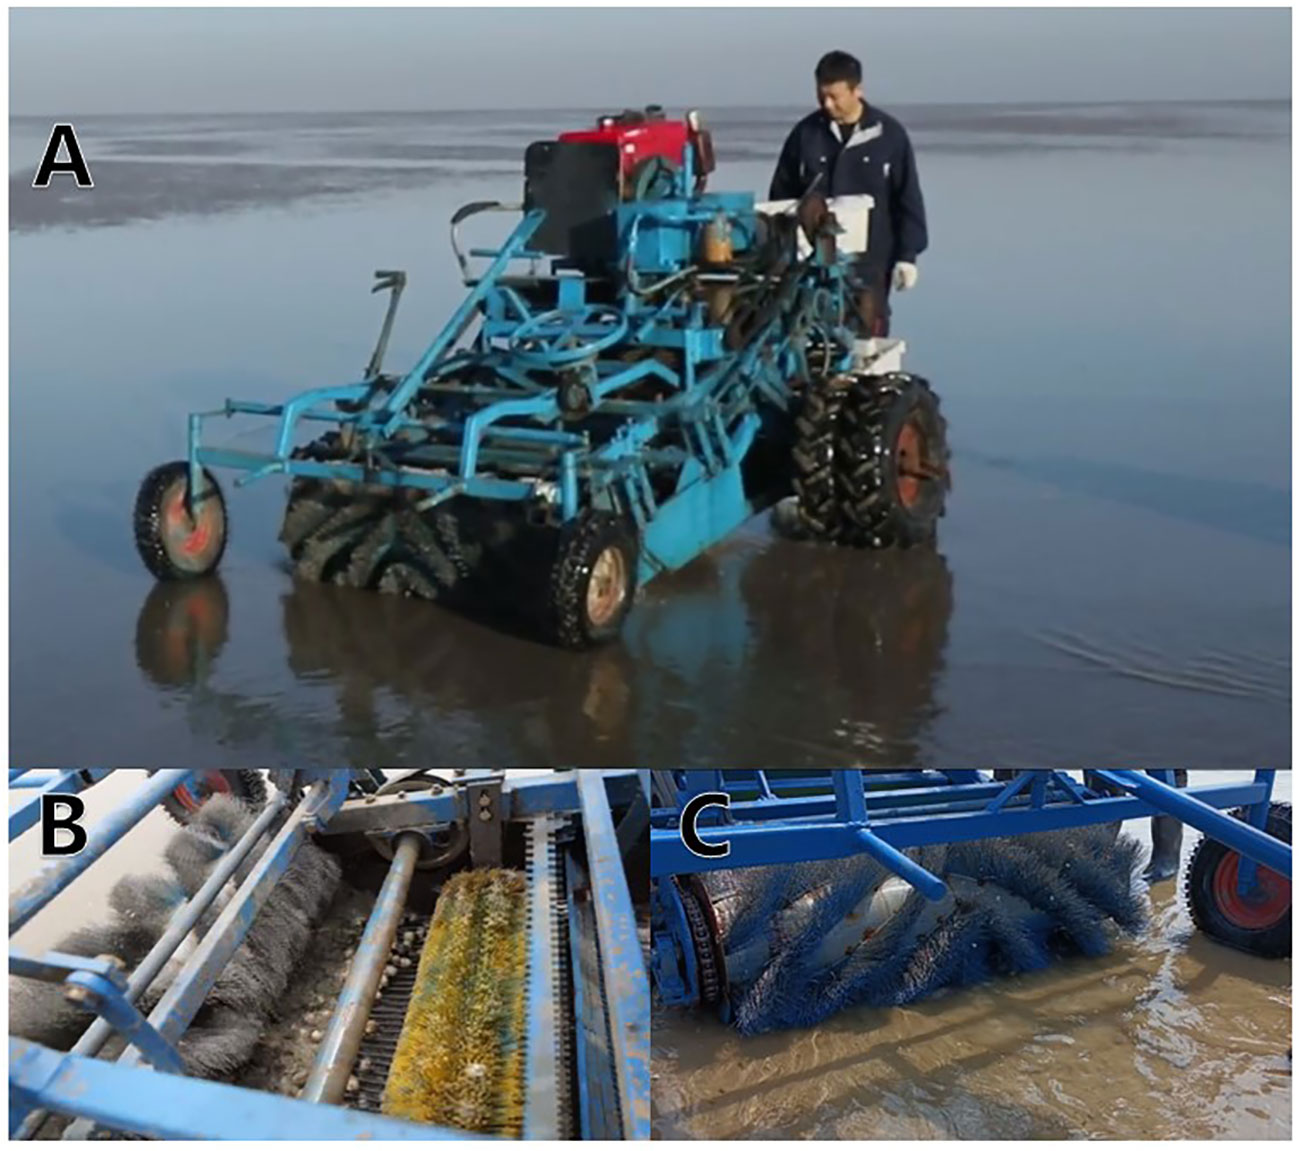
Figure 10 Shellfish vibration harvesting test: (A) The equipment harvesting operation, (B) The shellfish vibrating screening, (C) First-stage brush sediments cutting operation.
Here, E denotes the relative error, Nhrepresents the number of shellfish harvested in the harvesting verification test, Nha is the quantity of shellfish harvested per unit area (piece/m2), and △ϕb signifies the absolute value of the crushing rate error.
The results of the shellfish vibration harvesting verification test reveal that the average quantity of shellfish harvested (Na) was 571 pieces. Besides, as Figure 11 shows, Nha = 114 pieces/m2 and E = 8.80%. And the shellfish crushing rate was ϕb2 = 6.97% and △ϕb = 5.20%.
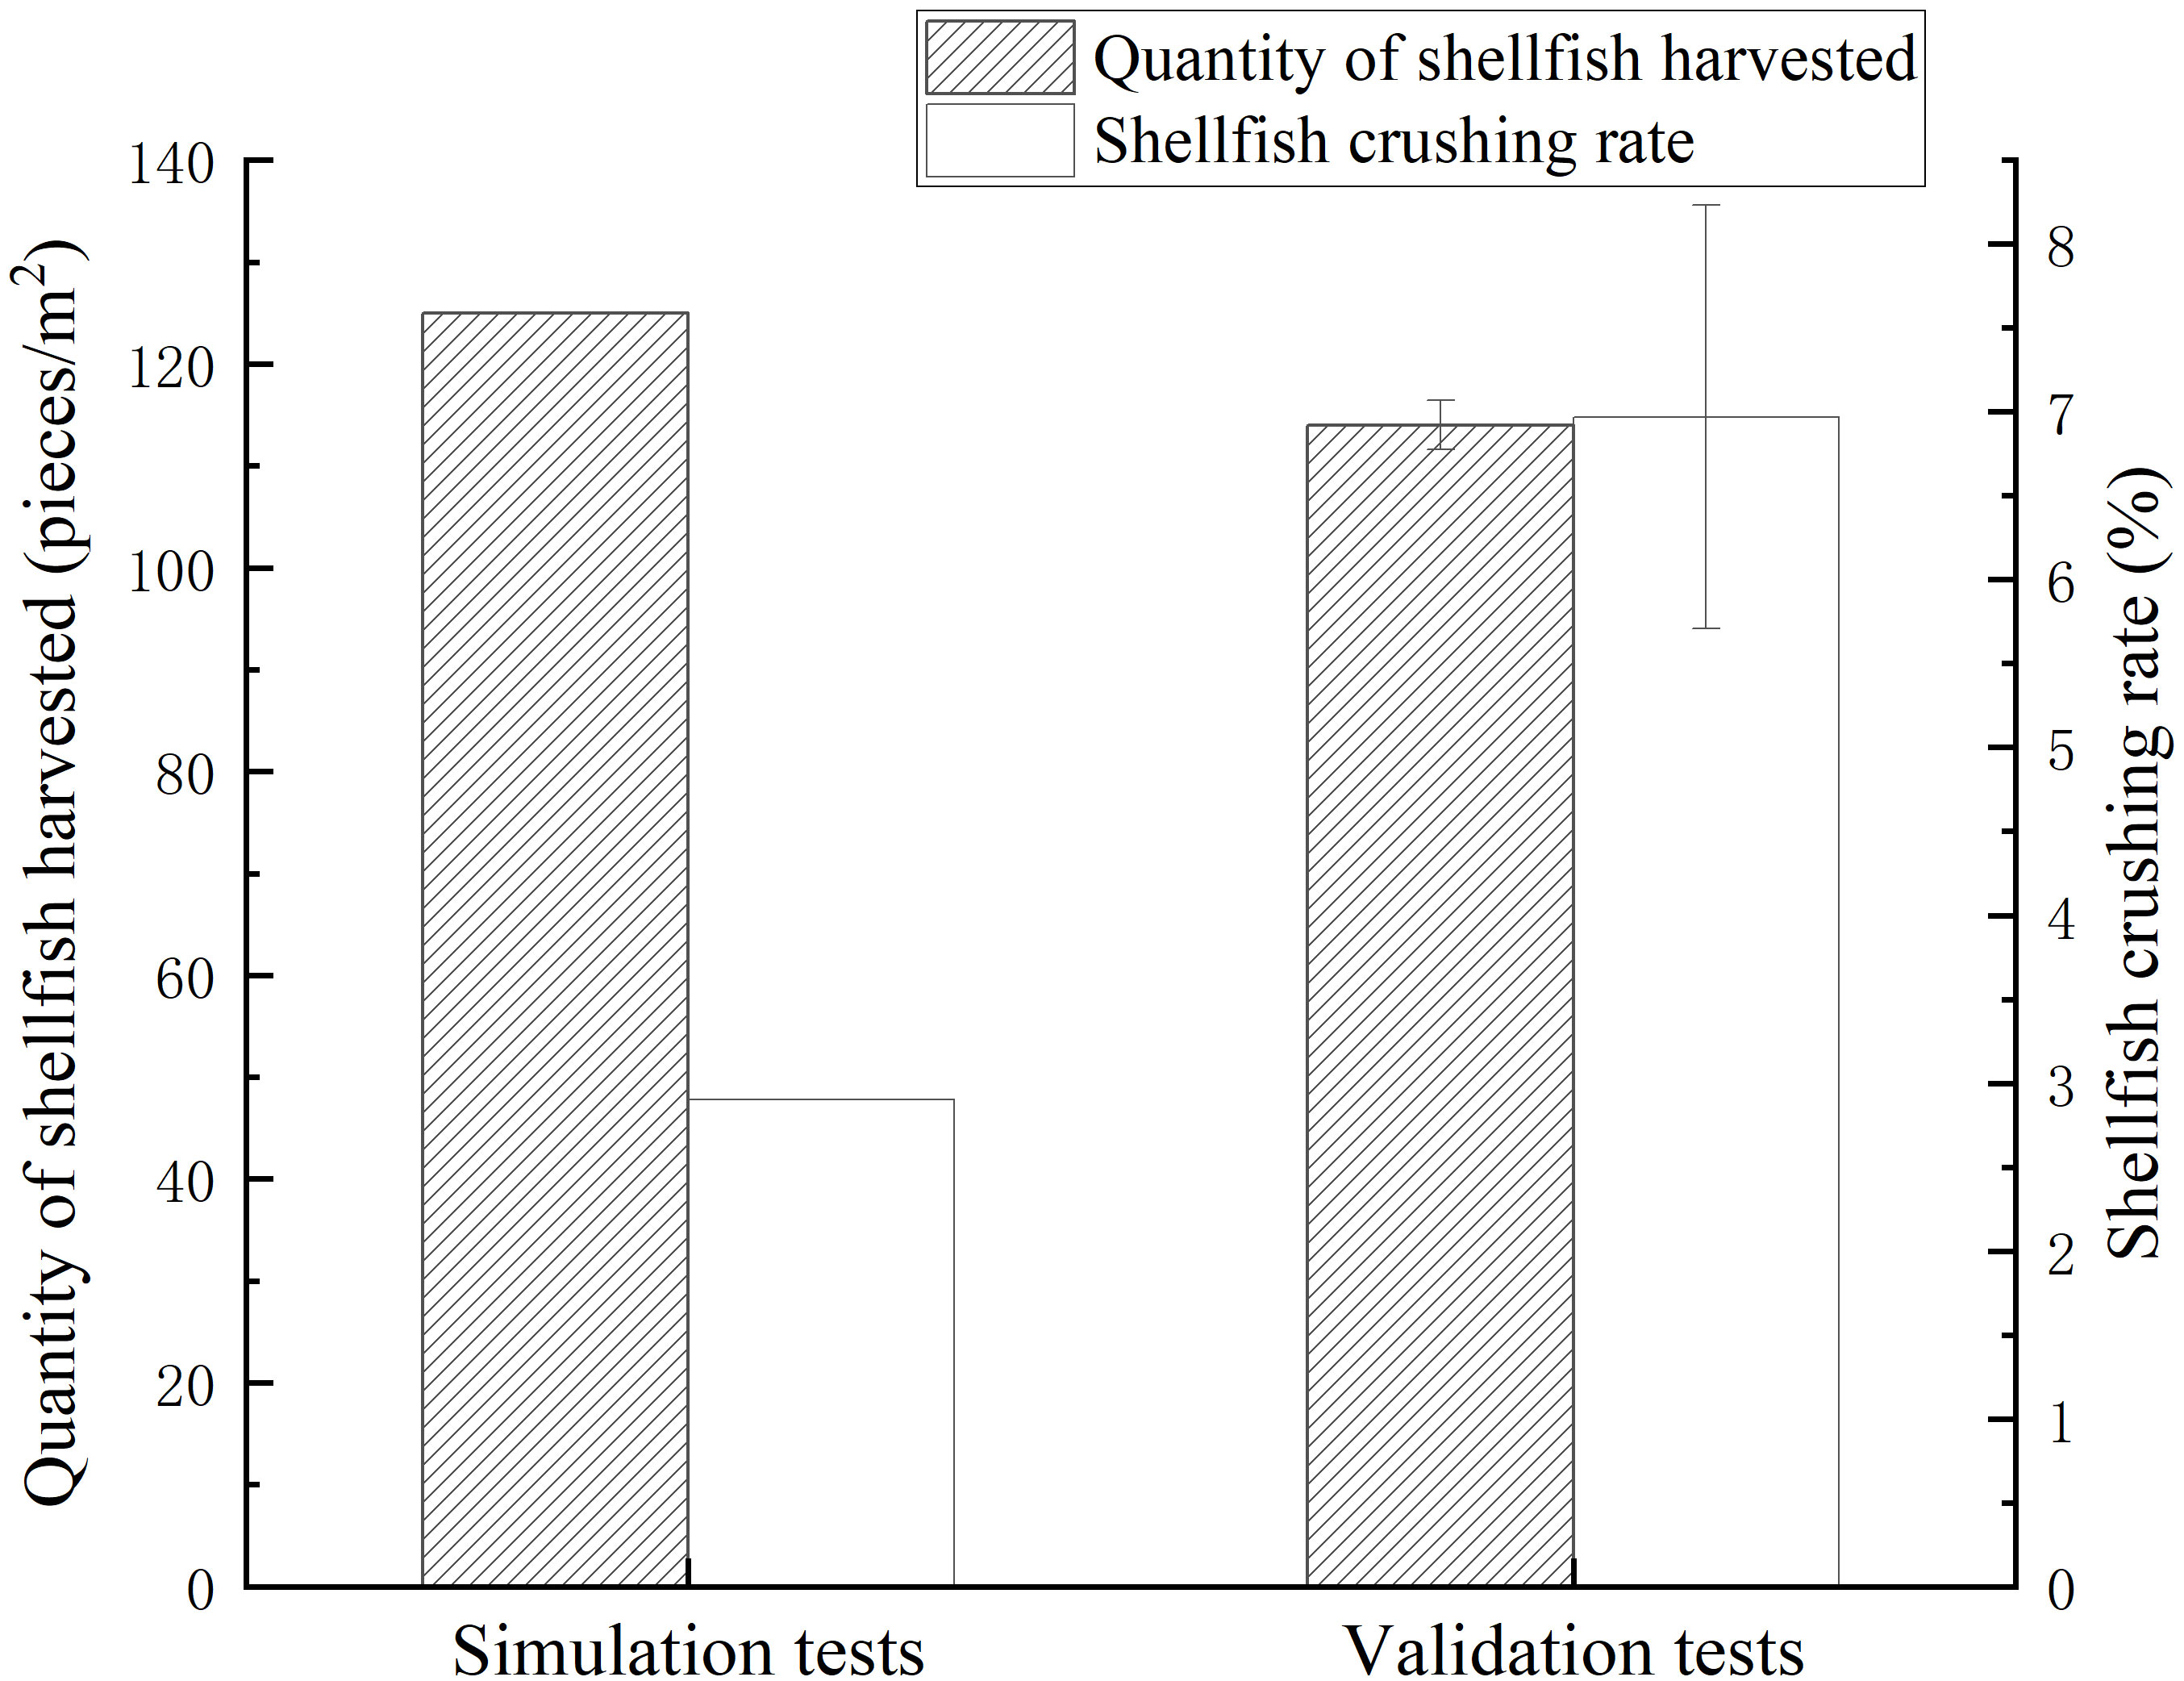
Figure 11 Results of shellfish harvesting simulation and verification test.
6 Discussion
6.1 Shellfish harvesting efficiency
The harvesting efficiency indicates the quantity (mass) of commercial shellfish harvested by the equipment per unit time in this paper. The quantity of shellfish harvested in the verification test was less than that in the simulation test, according to comparing the results of the simulation test and the verification test. The reason for the decreased in the quantity of harvested shellfish was possible that the shellfish density in the harvesting environments were smaller than that in the mudflat DEM model. Moreover, the juvenile shellfish were discarded onto the surface of the mudflat, leading to a decrease in shellfish harvesting quantity. The simulation results showed that the harvester’s travel speed and amplitude have significant effects on the quantity of shellfish harvested. Compared with the travel speed of other harvesters (Miguel B. Gaspar et al., 2002), the travel speed of the vibratory harvester is low (10 m/min), the lower shellfish harvesting efficiency. The main reason may be that the operating environment of vibratory harvester is “dry” mudflats, the adhesion force of sediments is strong, and it is difficult to separate sediments and shellfish. If the travel speed is too high, it is hard to effectively screen out sediment and shellfish, and there will be an accumulation in the vibrating screen. The operating environment of hydraulic dredge and commercial dredge are the submarine mudflats, sediment and shellfish are more easily to be separated in the action of seawater(Miguel B. Gaspar et al., 2002), with the faster travel speed (2 knots) and high harvesting efficiency. Vibration can speed up the screening efficiency, realize the separation of sediment and shellfish and the screening of juvenile shellfish back to the mudflats. Rambaldi et al. (2001) mentioned that the hydraulic vibratory dredge’s shellfish harvesting efficiency and commercial shellfish harvesting proportion are 2 times and 3 times of commercial dredge respectively. Vibration can improve the harvesting efficiency, and realize the sustainable harvesting of mudflat shellfish and low ecological impact (Stirling, 2013).
6.2 Shellfish crushing rate
The higher shellfish crushing rate in the verification test than that in the simulation test, which was probably caused by the more complex environment and more influencing factors during the actual shellfish harvesting operation. Comparing the shellfish crushing rate of different type of harvesters, it was found that the shellfish crushing rate was the highest under the hydraulic dredge (Miguel B. Kauwling and Bakus, 1979; Gaspar et al., 2002), which was about 3-4 times higher than that of the vibratory harvester in this paper. The shellfish crushing rate of the vibratory harvester was 5.13% lower than that of the hydraulic vibratory dredge (Rambaldi et al., 2001). Such findings could be attributed to the fact that the operating environment of the hydraulic vibratory dredge was subwater, and the surface of the harvested shellfish was cleaner and more directly affected by the mechanical force. The surface of the harvested shellfish by the vibratory harvester was attached to the sediment, which was an important factor in buffering the external force and protecting the shellfish. The lowest shellfish crushing rate of about 5% was observed under the commercial dredge(Miguel B. Gaspar et al., 2002). In addition, differences in shellfish hardness of different shellfish species may lead to different shellfish crushing results.
By observing the shellfish vibration harvesting process, it was found that the crushed shellfish is not directly caused by a single mechanism of the vibratory harvester, and the shellfish may be crushed at different stages of the shellfish harvesting process. In the initial stage of harvesting, when the first layer vibrating screen penetrates into the mudflat sediment, the shellfish are subjected to compaction forces exerted by the sediment and direct forces from the shovel of the first layer vibrating screen, which may cause some shellfish to be crushed(Vasconcelos et al., 2011). In the shellfish screening stage, the shellfish damage could be mainly attributed to the small gap size between the brush and the screen surface being small, the shellfish were subjected to the pressure of the bristles of the rolling brush, which might cause the shellfish to get crushed. Miguel B. Gaspar et al. (2002) indicated that the tooth spacing has a significant effect on the percentage of damaged and dead individuals (Yamasaki et al., 2002). In the shellfish vibratory harvesting process, when the shellfish moves to the combination part between the first layer vibrating screen and the second layer vibrating screen, the shellfish at the front end of the second layer vibrating screen was easily broken by the mechanical impact force, but the crushing is not caused by vibration (Rambaldi et al., 2001). In the early stages of harvesting, the large distance between the empty collection baskets and the drop opening of the conveyor chain creates the potential for crushing. As harvesting progresses and the drop height gradually decreases, the crushing problem can be alleviated. The same damage problem is also found in hydraulic dredging (Lambert and Goudreau, 2002). Through the analysis, it was found that the possibility of shellfish crushing exists in each of the above-mentioned harvesting links. In addition, the shellfish crushing may also be caused by the action of several links in the above-mentioned harvesting process together, leading to the accumulation of the crushing until the shellfish is completely broken. In the subsequent upgrade, the structure of the vibratory harvester should be further optimized that prioritizing the reduction of shellfish crushing rate.
7 Conclusion
In this paper, the white clam was taken as the research object, and a mechanized brush-screen cooperative shellfish vibration harvester was designed. The mechanical and kinematic models of shellfish on the vibrating screen were established. A mudflat DEM model was established and the single-factor and response surface experiments of shellfish harvesting simulation were conducted in EDEM. The verification test was conducted on the mudflat to determine the accuracy of the simulation results. The conclusions of this paper are as follows.
(1) A crank rocker double-layer vibrating screen structure was designed, and the structural and operating parameters of the crank rocker double-layer vibrating screen were determined as α1-1 = 11°, α1-2 = 8°, α2-1 = 8°, α2-2 = 5°, ϵ1 = 30°, ϵ2 = 35°, r = 0.01m, φ = 25°, and ω = 30 rad/s. The results provided a theory reference for shellfish harvesting simulation and harvester trial manufacturing.
(2) The quantity of shellfish harvesting was significantly influenced (p< 0.01) by vibrating screen amplitude, first-stage brush rotation rate, and harvester travel speed. The screen vibration amplitude was 1.4 mm, the first-stage brush rotation rate was 40 rpm, and the harvester travel speed was 10 m/min. Using these parameters, the error between the verification test and the simulation test is small and the shellfish harvesting work could be completed by the harvester effectively. For actual harvesting, it is recommended that the vibratory harvester be set to the above parameters for shellfish harvesting.
Data availability statement
The original contributions presented in the study are included in the article/supplementary material, further inquiries can be directed to the corresponding authors.
Author contributions
HL: Conceptualization, Methodology, data curation, performed research, writing - original draft. GM: Supervision, conceptualization, writing - review & editing. HZ: Methodology. HW: Investigation. FL: Performed research. ZS: Performed research. QZ: Data curation. YZW: Performed research. YZW: Performed research. XL: Project administration, funding acquisition, writing - review & editing. GZ: Supervision, writing - review & editing. All authors contributed to the article and approved the submitted version.
Funding
This research was funded by The National Key R&D Program of China, grant number 2019YFD0900701; The Science and Technology Innovation Project of Dalian, grant number 2021JJ12SN33; The Key Technology Projects of Dalian, grant number 2021JB11SN035.
Conflict of interest
The authors declare that the research was conducted in the absence of any commercial or financial relationships that could be construed as a potential conflict of interest.
Publisher’s note
All claims expressed in this article are solely those of the authors and do not necessarily represent those of their affiliated organizations, or those of the publisher, the editors and the reviewers. Any product that may be evaluated in this article, or claim that may be made by its manufacturer, is not guaranteed or endorsed by the publisher.
References
Asaf Z., Rubinstein D., Shmulevich I. (2007). Determination of discrete element model parameters required for soil tillage. Soil Tillage Res. 92, 227–242. doi: 10.1016/j.still.2006.03.006
Awuah E., Zhou J., Liang Z., Aikins K. A., Gbenontin B. V., Mecha P., et al. (2022). Parametric analysis and numerical optimisation of Jerusalem artichoke vibrating digging shovel using discrete element method. Soil Tillage Res. 219, 105344. doi: 10.1016/j.still.2022.105344
Badino G., Bona F., Maffiotti A., Giovanardi O., Pranovi F. (2004). Impact of mechanical clam harvesting on a benthic habitat: evaluation by means of sediment profile imaging. Aquat. Conservation: Mar. Freshw. Ecosyst. 14 (S1), S59−S67.
Bahrami M., Naderi-Boldaji M., Ghanbarian D., Ucgul M., Keller T. (2020). Simulation of plate sinkage in soil using discrete element modelling: Calibration of model parameters and experimental validation. Soil Tillage Res. 203, 203. doi: 10.1016/j.still.2020.104700
Beukema J. (1995). Long-term effects of mechanical harvesting of lugworms arenicola marina on the zoobenthic community of a tidal flat in the wadden Sea. Netherlands J. Sea Res. 33, 219–227. doi: 10.1016/0077-7579(95)90008-X
Cabiscol R., Finke J. H., Kwade A. (2018). Calibration and interpretation of DEM parameters for simulations of cylindrical tablets with multi-sphere approach. Powder Technol. 327, 232–245. doi: 10.1016/j.powtec.2017.12.041
China, M. O. A (2013) Notice of the ministry of agriculture on the prohibition of the use of thirteen types of fishing gear (China: Ministry of Agriculture and Rural Affairs of the People's Republic of China). Available at: http://www.moa.gov.cn/nybgb/2013/dseq/201805/t20180510_6141830.htm (Accessed November 21, 2022).
Coen L. D. (1995). A review of the potential impacts of mechanical harvesting on subtidal and intertidal shellfish resources (South Carolina: South Carolina Department of Natural Resources, Marine Resources Research).
Collier J., McLaughlin D. (1983). A mechanical oyster harvester for south Carolina estuaries. J. World Mariculture Soc. 14, 295–301. doi: 10.1111/j.1749-7345.1983.tb00085.x
Fahy E., Carroll J. (2007). Consequences of hydraulic dredging for a razor clam ensis siliqua (L.) bed in the north-west Irish Sea. Biol. Environment: Proc. R. Irish Acad. 107, 115–128.
Fisheries Administration Bureau of Ministry of Agriculture China (2022). China Fishery statistical yearbook 2022 (Beijing: China agriculture press).
Gaspar M. B., Leita˜o F., Santos M. N., Sobral M., Chı´Charo Luı´S, Chı´Charo A., et al. (2002). Influence of mesh size and tooth spacing on the proportion of damaged organisms in the catches of the Portuguese clam dredge fishery. ICES J. Mar. Sci. 59, 1228–1236. doi: 10.1006/jmsc.2002.1310
Glude J., Spear H., Wallace D. (1952). "The hydraulic clam rake, a new method of gathering seed clams". In:Proceedings of the National Shellfisheries Association, 163–166.
González-Montellano C., Fuentes J. M., Ayuga-Téllez E., Ayuga F. (2012). Determination of the mechanical properties of maize grains and olives required for use in DEM simulations. J. Food Eng. 111, 553–562. doi: 10.1016/j.jfoodeng.2012.03.017
Hall S., Basford D., Robertson M. (1990). The impact of hydraulic dredging for razor clams ensis sp. on an infaunal community. Netherlands J. Sea Res. 27, 119–125. doi: 10.1016/0077-7579(90)90040-N
Hall S. J., Harding M. J. (1997). Physical disturbance and marine benthic communities: the effects of mechanical harvesting of cockles on non-target benthic infauna. J. Appl. Ecol. 34, 497–517. doi: 10.2307/2404893
Haven D. S., Loesch J. G., Whitcomb J. P. (1973). An investigation into commercial aspects of the hard clam fishery and development of commercial gear for the harvest of molluscs: final contract report for the period 1 July 1970 through 30 June 1973 (William & Mary: Virginia Institute of Marine Science).
Haven D. S., Whitcomb J. P., Davis Q. C. (1979). A mechanical escalator harvester for live oysters and shell. Mar. Fisheries Rev. 41 (12), 17–20.
Hoyseth K. (2009) Archived-does mechanical clam harvesting in BC pose any environmental risk? (Canda: Government of Canada, Fisheries Oceans Canada, Communications Branch). Available at: https://www.dfo-mpo.gc.ca/aquaculture/rp-pr/acrdp-pcrda/projects-projets/P-08-03-005-eng.html (Accessed November 16, 2022).
Johnson K. L., Kendall K., Roberts A. (1971). "Surface energy and the contact of elastic solids". In:Proceedings of the royal society of London. A. mathematical, 301–313.
Kauwling T. J., Bakus G. J. (1979). Effects of hydraulic clam harvesting in the Bering Sea (North Pacific Fishery Management Counci).
Kyte M. A., Chew K. K. (1975). A review of the hydraulic escalator shellfish harvester and its known effects in relation to the soft-shell clam, mya arenaria (Washington: University of Washington).
Lambert J., Goudreau P. (2002). Performance of the new England hydraulic dredge for the harvest of stimpson's surf clams (Mactromeris polynyma) (Canada, Department of Fisheries Oceans).
Landry T. (2017) The ecological effects of clam harvesting by mechanical means in St mary's bay, Nova Scotia (Ottawa: Aquaculture Science Branch Fisheries and Oceans Canada). Available at: https://www.dfo-mpo.gc.ca/aquaculture/rp-pr/acrdp-pcrda/projects-projets/G-12-01-001-eng.html (Accessed November 15, 2022).
Li H., Zhang G., Li X., Zhang H., Zhang Q., Liu W., et al. (2021). Calibration of the discrete element method parameters in living juvenile Manila clam (Ruditapes philippinarum) and seeding verification. AgriEngineering 3, 894–906. doi: 10.3390/agriengineering3040056
Liu W., Zhang H., Li X., Zhang G., Zhang Q., Qu S., et al. (2020). Analysis of biomechanical properties of juvenile Manila clam for mechanization sowing. J. Dalian Ocean Univ. 35, 455–461.
Lu J., Zhou Y., Shen C., Lu S., Tu L., Xue A. (2021). Design and experiment of self-propelled shellfish harvester. Fishery modernization 48, 85–90.
Meyer T. L., Cooper R. A., Pecci K. J. (1981). The performance and environmental effects of a hydraulic clam dredge. Mar. fisheries Rev. 43, 14–22.
Morello E., Froglia C., Atkinson R. J., Moore P. (2005). Impacts of hydraulic dredging on a macrobenthic community of the Adriatic Sea, Italy. Can. J. Fisheries Aquat. Sci. 62, 2076–2087. doi: 10.1139/f05-122
Mu G. (2019). Study on key technology and design of chain-tine dredge for ruditapes philippinarum (Doctorate, Dalian University of Technology).
Mu G., Duan F., Yang J., Zhang H., Li X., Pan L., et al. (2020). Research progress on burying shellfish harvesters: a review. Journel Dalian Ocean Univ. 35, 19–30.
Pacific Shellfish Institute (2014) Evaluation and development of advanced farm management and harvesting tools for economically efficient and environmentally sustainable production of Manila clams (Olympia: Pacific Shellfish Institute). Available at: https://www.pacshell.org/pdf/SKManila.pdf (Accessed November 22, 2022).
Rambaldi E., Bianchini M. L., Priore G., Prioli G., Mietti N., Pagliani T. (2001). Preliminary appraisal of an innovative hydraulic dredge with vibrating and sorting bottom on clam beds (Chamelea gallina). Hydrobiologia 465, 169–173. doi: 10.1023/A:1014540824340
Ramírez-Gómez Á., Gallego E., Fuentes J. M., González-Montellano C., Ayuga F. (2014). Values for particle-scale properties of biomass briquettes made from agroforestry residues. Particuology 12, 100–106. doi: 10.1016/j.partic.2013.05.007
Robinson R., Richardson C. (1998). The direct and indirect effects of suction dredging on a razor clam (Ensis arcuatus) population. ICES J. Mar. Sci. 55, 970–977. doi: 10.1006/jmsc.1998.0356
Saurel C., Ferreira J. G., Cheney D., Suhrbier A., Cordell J. (2014). Ecosystem goods and services from Manila clam culture in puget sound: a modelling analysis. Aquaculture Environ. Interact. 5 (3). doi: 10.3354/aei00109
Smolowitz R. J. (1982). The design of an electrohydraulic dredge for clam surveys. Mar. Fish Rev. 44, 1–18.
Stirling D. (2013) Mechanized clam harvesting for coastal British Columbia - environmental implications (Canada: Fisheries and Oceans Canada). Available at: https://www.dfo-mpo.gc.ca/aquaculture/rp-pr/acrdp-pcrda/projects-projets/p-08-03-005-eng.html (Accessed November 21, 2022).
Vasconcelos P., Morgado-Andre A., Morgado-Andre C., Gaspar M. B. (2011). Shell strength and fishing damage to the smooth clam (Callista chione): simulating impacts caused by bivalve dredging. Ices J. Mar. Sci. 68, 32–42. doi: 10.1093/icesjms/fsq149
Keywords: mudflat-buried shellfish, vibratory screening, discrete element simulation, Mechanization harvester, response surface experiments
Citation: Li H, Mu G, Zhang H, Wu H, Liu F, Sun Z, Zhang Q, Wang Y, Wang Y, Li X and Zhang G (2023) Design and testing of a mechanized brush-screen cooperative vibration harvester for mudflat-buried shellfish based on the discrete element method. Front. Mar. Sci. 10:1134888. doi: 10.3389/fmars.2023.1134888
Received: 31 December 2022; Accepted: 20 February 2023;
Published: 16 March 2023.
Edited by:
Zhao Yunpeng, Dalian University of Technology, ChinaReviewed by:
Changsu Xu, Northeast Agricultural University, ChinaPeng Li, Harbin Engineering University, China
Copyright © 2023 Li, Mu, Zhang, Wu, Liu, Sun, Zhang, Wang, Wang, Li and Zhang. This is an open-access article distributed under the terms of the Creative Commons Attribution License (CC BY). The use, distribution or reproduction in other forums is permitted, provided the original author(s) and the copyright owner(s) are credited and that the original publication in this journal is cited, in accordance with accepted academic practice. No use, distribution or reproduction is permitted which does not comply with these terms.
*Correspondence: Guochen Zhang, emhhbmdndW9jaGVuQGRsb3UuZWR1LmNu; Xiuchen Li, bHhjQGRsb3UuZWR1LmNu
†These authors have contributed equally to this work and share first authorship