
94% of researchers rate our articles as excellent or good
Learn more about the work of our research integrity team to safeguard the quality of each article we publish.
Find out more
ORIGINAL RESEARCH article
Front. Mar. Sci. , 15 March 2023
Sec. Physical Oceanography
Volume 10 - 2023 | https://doi.org/10.3389/fmars.2023.1111541
 Dmitry Frey1,2,3*Viktor Krechik1,4Alexandra Gordey1Sergey Gladyshev1Dmitry Churin5Ilya Drozd1,6,7Alexander Osadchiev1,3Sergey Kashin8Eugene Morozov1,2,3Daria Smirnova1,7
Three-dimensional structure of currents in the Bransfield Strait (BS) was measured in 2017 over 50 transects across the strait using a Shipborne Acoustic Current Doppler Profiler (SADCP) onboard the R/V Akademik Sergey Vavilov and Akademik Ioffe. These data were used to determine local features of the three-dimensional velocity field of the currents. The sections crossed all three basins of the BS and the main flows in the strait including the Bransfield Current and the southwestward flow of Weddell Sea waters along the Antarctic Peninsula. Two vessels are equipped with different SADCP systems with frequencies of 76.8 kHz and 38.4 kHz, which allows us to compare the data from different SADCPs. The observations reveal that very dense waters from the Weddell Sea propagate in deep layers over the shelf break; this flow is usually not observed at the sea surface. Vertical structure of the Bransfield Current significantly differs from the flow of the Weddell Sea waters and its velocity maximum is located in the upper ocean layer. We also used two gridded altimetry products of 0.25° and 0.1° resolution for investigations of circulation in the BS. We analyzed the efficiency of satellite altimetry in reproducing currents in conditions of a narrow strait and evaluated its accuracy using field velocity observations. We found that satellite altimetry can be used for identification of the mean ocean circulation patterns within the BS. However, daily altimetry data contain significant discrepancies with the in situ data and require direct measurements for studies of the BS circulation.
The Bransfield Strait is a relatively deep and narrow channel between the South Shetland Islands (SSI) and the Antarctic Peninsula (Figure 1). The strait is approximately 120 km wide and extends over 460 km between Low Island in the southwest and Clarence Island in the northeast (Wilson et al., 1999). The Bransfield Strait region is important because of its high biological productivity (Veit-Köhler et al., 2018) including Antarctic krill (Euphausia Superba) (Spiridonov, 1996; Atkinson et al., 2004) which plays a key role in the ecosystems of the Northern Antarctic Peninsula (Loeb et al., 2009). The Antarctic Peninsula is also known as a region of strong climatic changes, that affect circulation in the BS (Vaughan et al., 2003; Huneke et al., 2016).
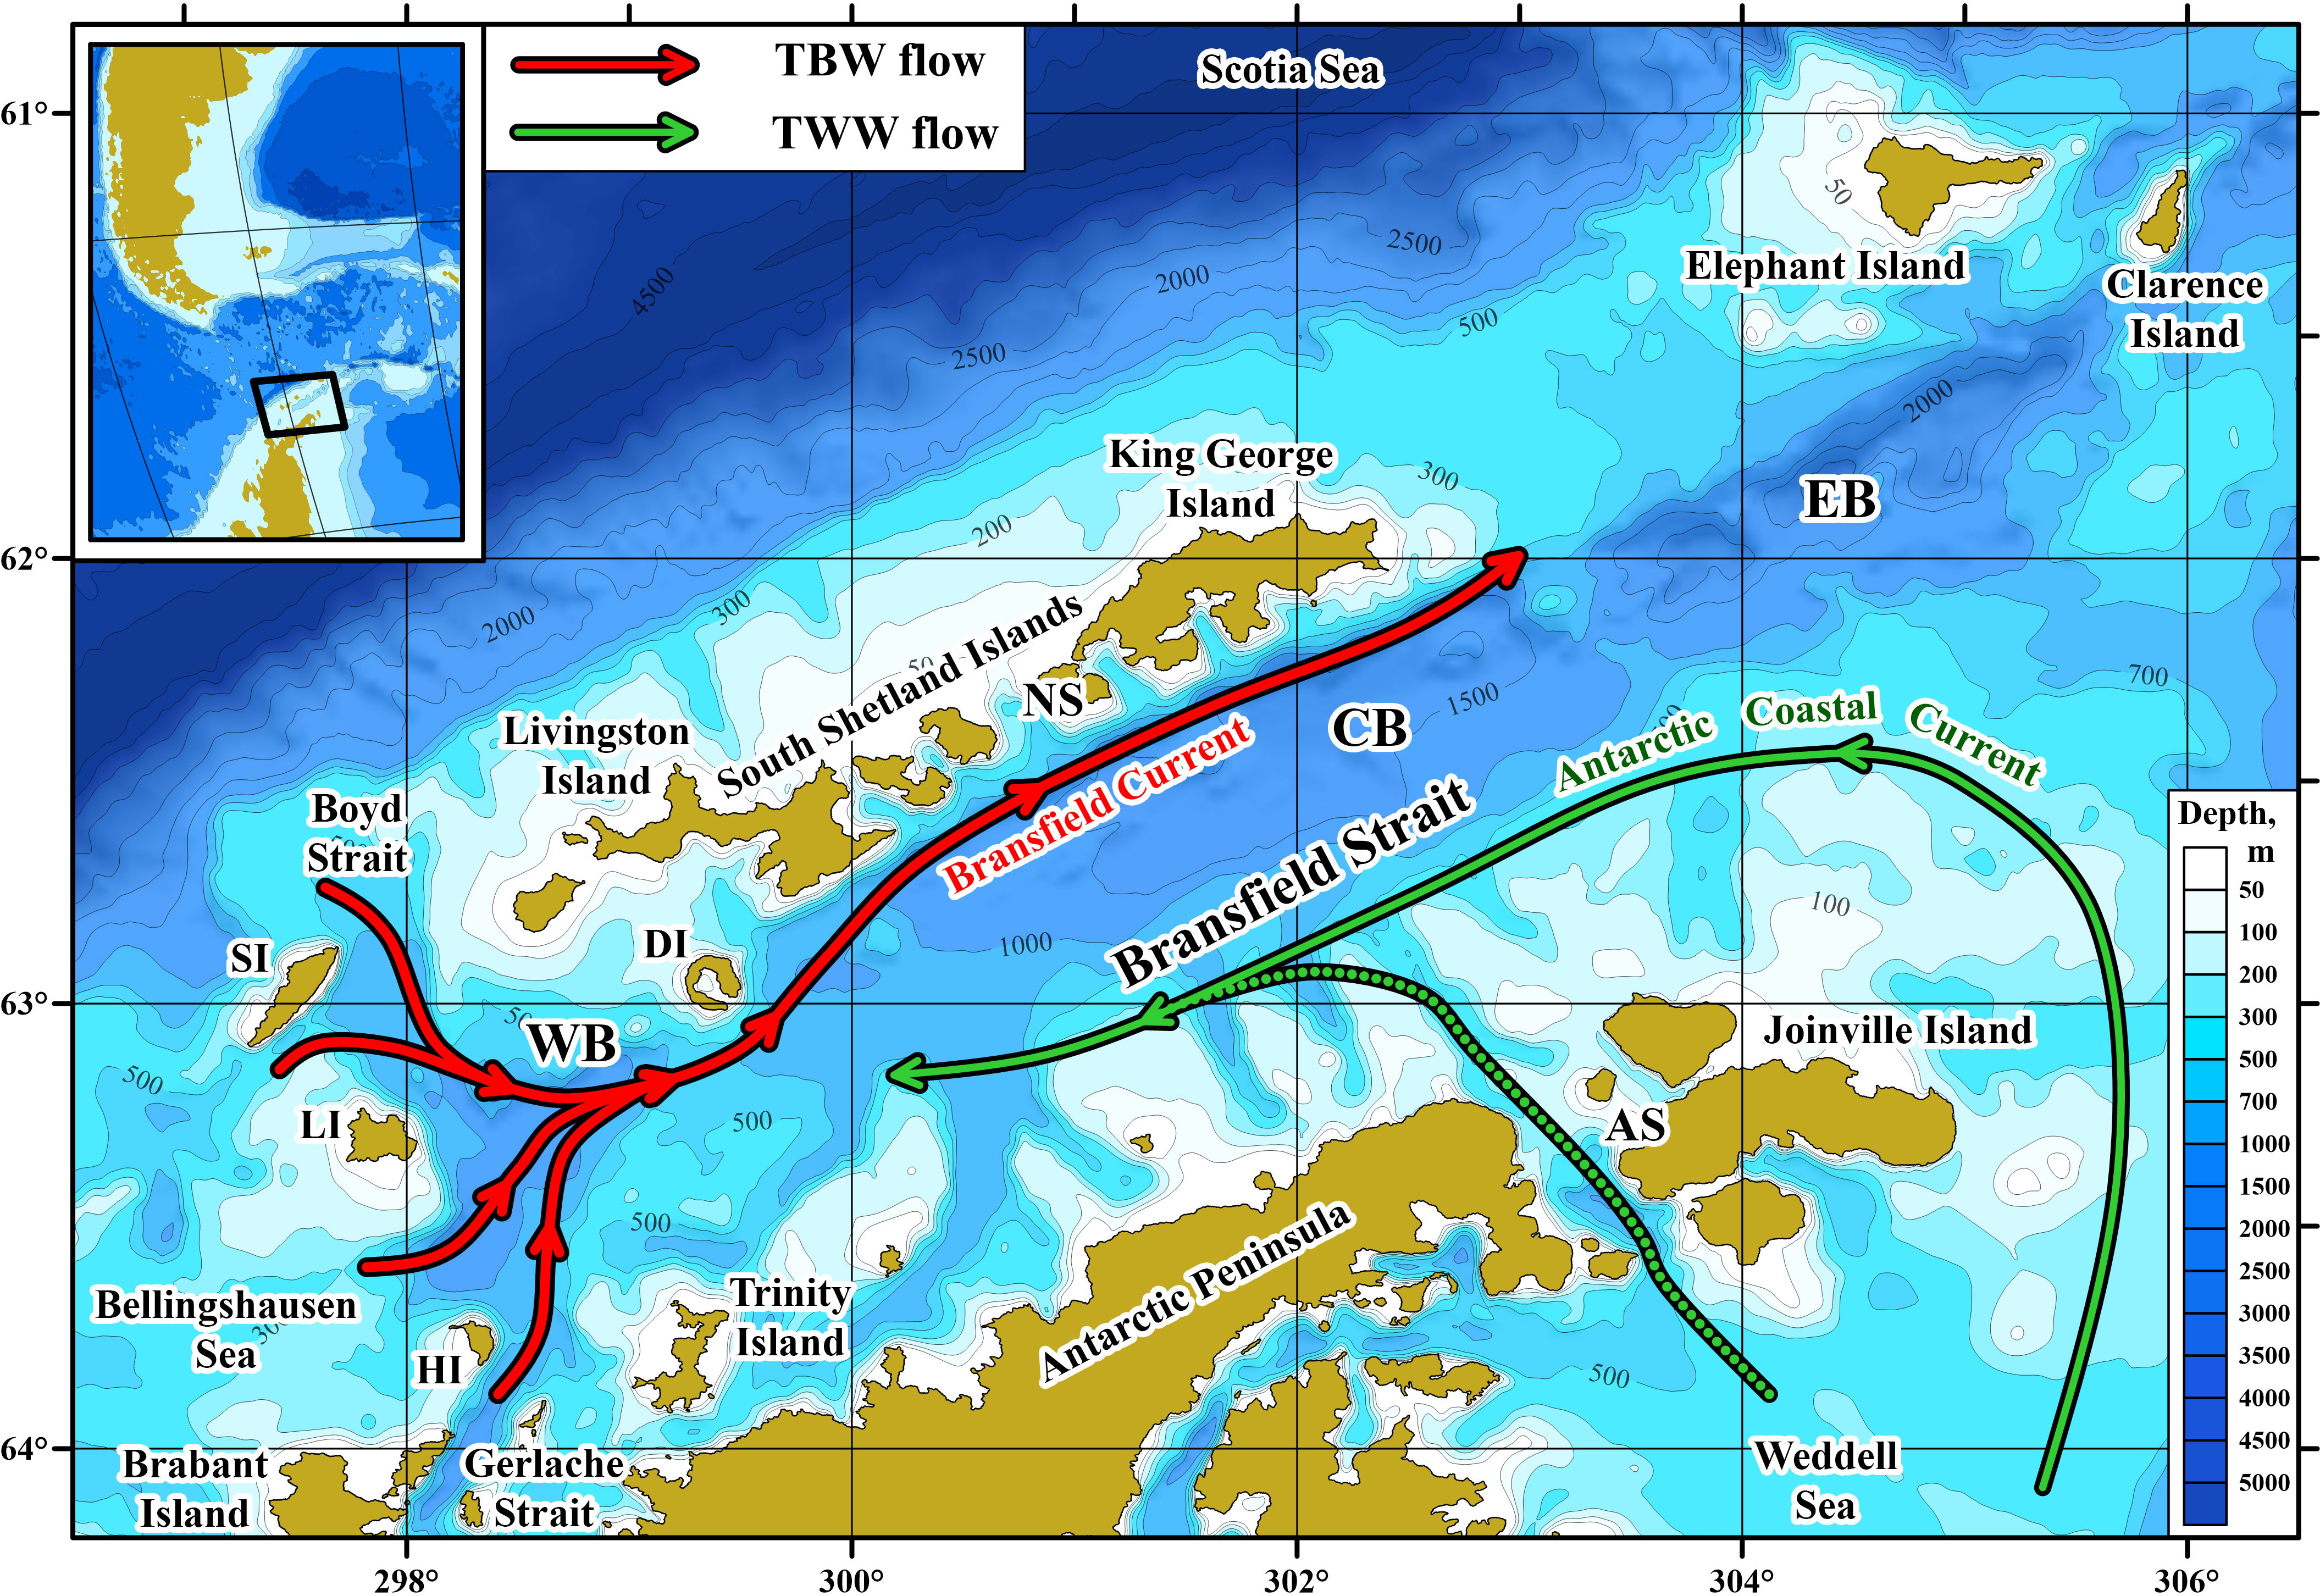
Figure 1 Schematic of mean surface circulation in the Bransfield Strait. The Bransfield and Antarctic Coastal currents are shown by red and green arrows, respectively. A green dotted line indicates possible inflow from the Weddell Sea to the strait (Sangrà et al., 2011). The bathymetry source is the GEBCO2019 database; the shoreline is shown according to the GSHHS data (Wessel and Smith, 1996). WB, Western Basin; CB, Central Basin; EB, East Basin of the Bransfield Strait; DI, Deception Island; SI, Smith Island; LI, Low Island; HI, Hoseason Island; NS, Nelson Strait; AS, Antarctic Sound.
The strait connects the Bellingshausen Sea in the west, the Weddell Sea in the east, and the Scotia Sea in the north. However, the inflow of deep waters from the adjacent seas is restricted by shallow underwater ridges; the depth of the sill between the strait and the Weddell Sea does not exceed 715 m, while the maximum depth of the sill limiting the strait from the west is 470 m. In addition, there are three major basins in the strait, namely, the eastern (EB), central (CB), and western (WB) basins (Gordon and Nowlin, 1978). Based on the GEBCO data, their maximum depths are 2750, 1960, and 1370 m, respectively. The maximum depth of the sill between the WB and CB is 630 m; the depths of the sill between the CB and EB slightly exceed 1000 m. Northern passages between individual SSI, and between King George Island and Elephant Island are much shallower. For example, the maximum depth of the Nelson Strait between the Livingston and King George islands is 56 m based on the GEBCO data; this strait is the deepest passage between individual SSI. The deepest point between King George and Elephant islands is 475 m (see Figure 1 for location of the islands and straits).
The hydrography of the strait has been repeatedly studied from the beginning of the 20th century (Clowes, 1934). The upper ocean layer in this region contains two main water masses: the Transitional Zonal Water with Bellingshausen Sea influence (TBW) and the Transitional Zonal Water with Weddell Sea influence (TWW) (Tokarczyk, 1987; García et al., 1994). TBW occupies the northern part of the strait and propagates northeastward along the SSI, TWW is observed in the southern part of the strait and spreads southwestward along the Antarctic Peninsula (Sangrà et al., 2011). Modified Circumpolar Deep Water (mCDW) also enters the BS through the northwestern passages between Livingston, Smith, and Low islands (Capella et al., 1992; Huneke et al., 2016; Ruiz Barlett et al., 2017). Bottom waters of the central and eastern basins of the Bransfield Strait are formed by a mixture of CDW and intermediate warm water from the Weddell Sea (Gordon et al., 2000). Long-term hydrographic data show freshening and lightening of these deep waters during the last decades (Garcia and Mata, 2005; Dotto et al., 2016). The same warming and lightening trends are observed in the western basin of the Bransfield Strait (Ruiz Barlett et al., 2017).
Circulation in the Bransfield Strait region has been studied based on geostrophic current calculations (Hofmann et al., 1996; Gomis et al., 2002), Shipborne Acoustic Doppler Current Profiler (SADCP) data (Thompson and Heywood, 2008; Savidge and Amft, 2009; Zhou et al., 2013), Lowered Acoustic Doppler Current Profiler (LADCP) data (Morozov, 2007; Polukhin et al., 2021), velocity measurements on moorings (López et al., 1999; Gyldenfeldt et al., 2002), surface drifters (Zhou et al., 2002; Thompson et al., 2009; Renner et al., 2012), and iceberg tracking (Madejski and Rakusa-Suszczewski, 1990); a review of ocean currents west of the Antarctic Peninsula is presented in (Moffat and Meredith, 2018). Based on drifter data and hydrographic calculations, it was shown that the circulation within the Bransfield Strait is characterized by a cyclonic gyre (e.g., Zhou et al., 2002; Sangrà et al., 2011). Its main peculiarity is the presence of a fast and narrow northeastward current along the SSI. Niiler et al. (1991) named this flow the Bransfield Current (BC); this flow also corresponds to the Bransfield Front and transports TBW and mCDW waters to the northeast (Sangrà et al., 2011; Sangrà et al., 2017). Based on SADCP measurements, the BC is 10-20 km wide and is observed during all seasons (Veny et al., 2022). The maximum velocity is estimated at 30-40 cm/s at the surface (Zhou et al., 2002; Zhou et al., 2006) and linearly decays towards the bottom, based on both LADCP and geostrophic observations (Poulin et al., 2014; Morozov et al., 2021; Polukhin et al., 2021). The transport of the current is estimated at 1 Sv (López et al., 1999). Zhou et al. (2020) showed that the diurnal tide constituents dominate the tidal residual current system in the shallow areas around the SSI. Strong internal vertical oscillations up to 30–40 m caused by the diurnal internal tide were revealed based on moored observations within the BC (Khimchenko et al., 2020). The second significant current in the BS is the Antarctic Coastal Current (CC) (Sangrà et al., 2011; Moffat and Meredith, 2018). The Peninsula Front observed in the central and eastern basins separates this TWW flow from the TBW flow (Sangrà et al., 2017). A system of mesoscale anticyclonic eddies with TBW characteristics is observed between the Bransfield Front and the Peninsula Front (Sangrà et al., 2011). Recent measurements show that intense deep currents are observed between neighboring basins of the BS basins (Frey et al., 2022).
Despite numerous works dedicated to studies of the circulation within the Bransfield Strait, most of our knowledge is based on calculations of geostrophic currents. It is well-known that this approach has some inaccuracies especially in conditions of a narrow strait with complex bottom topography. In addition, there are many small islands in the strait which can affect circulation. As for direct velocity measurements, they are still quite rare in the region of the Bransfield Strait. The only available detailed SADCP survey was collected between 1999 and 2014 (Savidge & Amft, 2009; Veny et al., 2022) and made possible investigations of ocean circulation patterns in much more detail in comparison with geostrophic calculations. The main difference of our dataset is the frequency of our SADCP systems; the usage of low-frequency 76.8 kHz and 38.4 kHz profilers allows us to increase the maximum measured depth down to 1000 m and focus on studies of vertical spatial structure of currents in the strait. Another focus of our work is a comparison between altimetry-derived velocities and results of field velocity measurements. Previously such studies were performed in the Drake Passage and along the Subantarctic Front (Barré et al., 2011; Ferrari et al., 2017; Frey et al., 2021) but were never carried out in the Antarctic Peninsula region.
The main goal of this work is to study the kinematic properties of the currents in the BS based on 50 SADCP transects across the strait in 2017. All transects were occupied during austral summer seasons. The maximum velocities, vertical shears, and horizontal gradients of velocity were estimated based on these in situ data individually at different transects across the strait. Both the Bransfield and Peninsula currents were permanently observed at these in situ data during austral summer. In addition, we performed validation of two gridded satellite altimetry products: the multi-satellite gridded altimetry available from CMEMS with a spatial resolution of 0.25° (Pujol et al., 2016), and the new version of these data with a spatial resolution of 0.1°. This comparison showed that the geostrophic altimetry-derived velocities qualitatively reproduce mean circulation patterns in the strait. In contrast to the mean fields, daily fields of geostrophic velocities contain significant discrepancies in the directions and magnitude of ocean currents. Moreover, both mean and daily geostrophic velocities are much lower than measured SADCP velocities. The altimetry-derived geostrophic velocities with a high spatial resolution of 0.1° provide more accurate reconstruction of the circulation in the narrow Bransfield Strait.
This study combines data from in situ velocity measurements in the Bransfield Strait and the geostrophic velocities calculated from satellite altimetry. The data were collected in January – March and November – December 2017 during austral summer seasons; the high-resolution altimetry data (0.1°) are also available only for 2017 (Ubelmann et al., 2021). These data allow us to compare all three datasets: in situ measurements and gridded geostrophic velocity data of 0.25° and 0.1° resolution. In the following subsections, we describe the equipment for direct measurements and the data processing techniques (section 2.1) and the altimetry-derived data of geostrophic velocities (section 2.2).
Direct velocity measurements were carried out from two research vessels, Akademik Sergey Vavilov (R/V ASV) and Akademik Ioffe (R/V AI) equipped with SADCP systems of different frequencies (see detailed information in Table 1; Figures 2, 3A). Teledyne RD Instruments Ocean Surveyor (TRDI OS) SADCPs with frequencies of 76.8 kHz (R/V ASV) and 38.4 kHz (R/V AI) were used for the data collection. Some aspects of SADCP measurements specific to the Southern Ocean are given in (Firing et al., 2011; Firing et al., 2012). In particular, one of the key factors limiting the profiling range is bubbles in water when the measurements are carried out in heavy seas typical of the Southern Ocean. The quality of measurements also depends on the number of small sound scatterers distributed in the water column, which reflect sound to the ADCP (Firing and Hummon, 2010). We set the standard quality parameter “Percent good” available with the raw data to 80% for discarding measurements which are not sufficiently reliable. The true heading was determined by Trimble Dual Antenna GA830 GPS receiver, which allows us to measure ship orientation with high accuracy. The SADCPs on both vessels were calibrated before measurements using standard procedure (Pollard and Read, 1989; Joyce, 1989) described in Ocean Surveyor technical guide. The transducer alignments were performed by collecting data over the same region in several directions during approximately 5 hours. The procedures were carried out over relatively shallow (approximately 300 m) area in the bottom track mode which allows us to calculate the angle between transducers and the ship centerline. This alignment procedure is critically important for the accuracy of SADCP measurements.

Table 1 Transects in the BS with SADCP measurements in 2017 analyzed in this work.
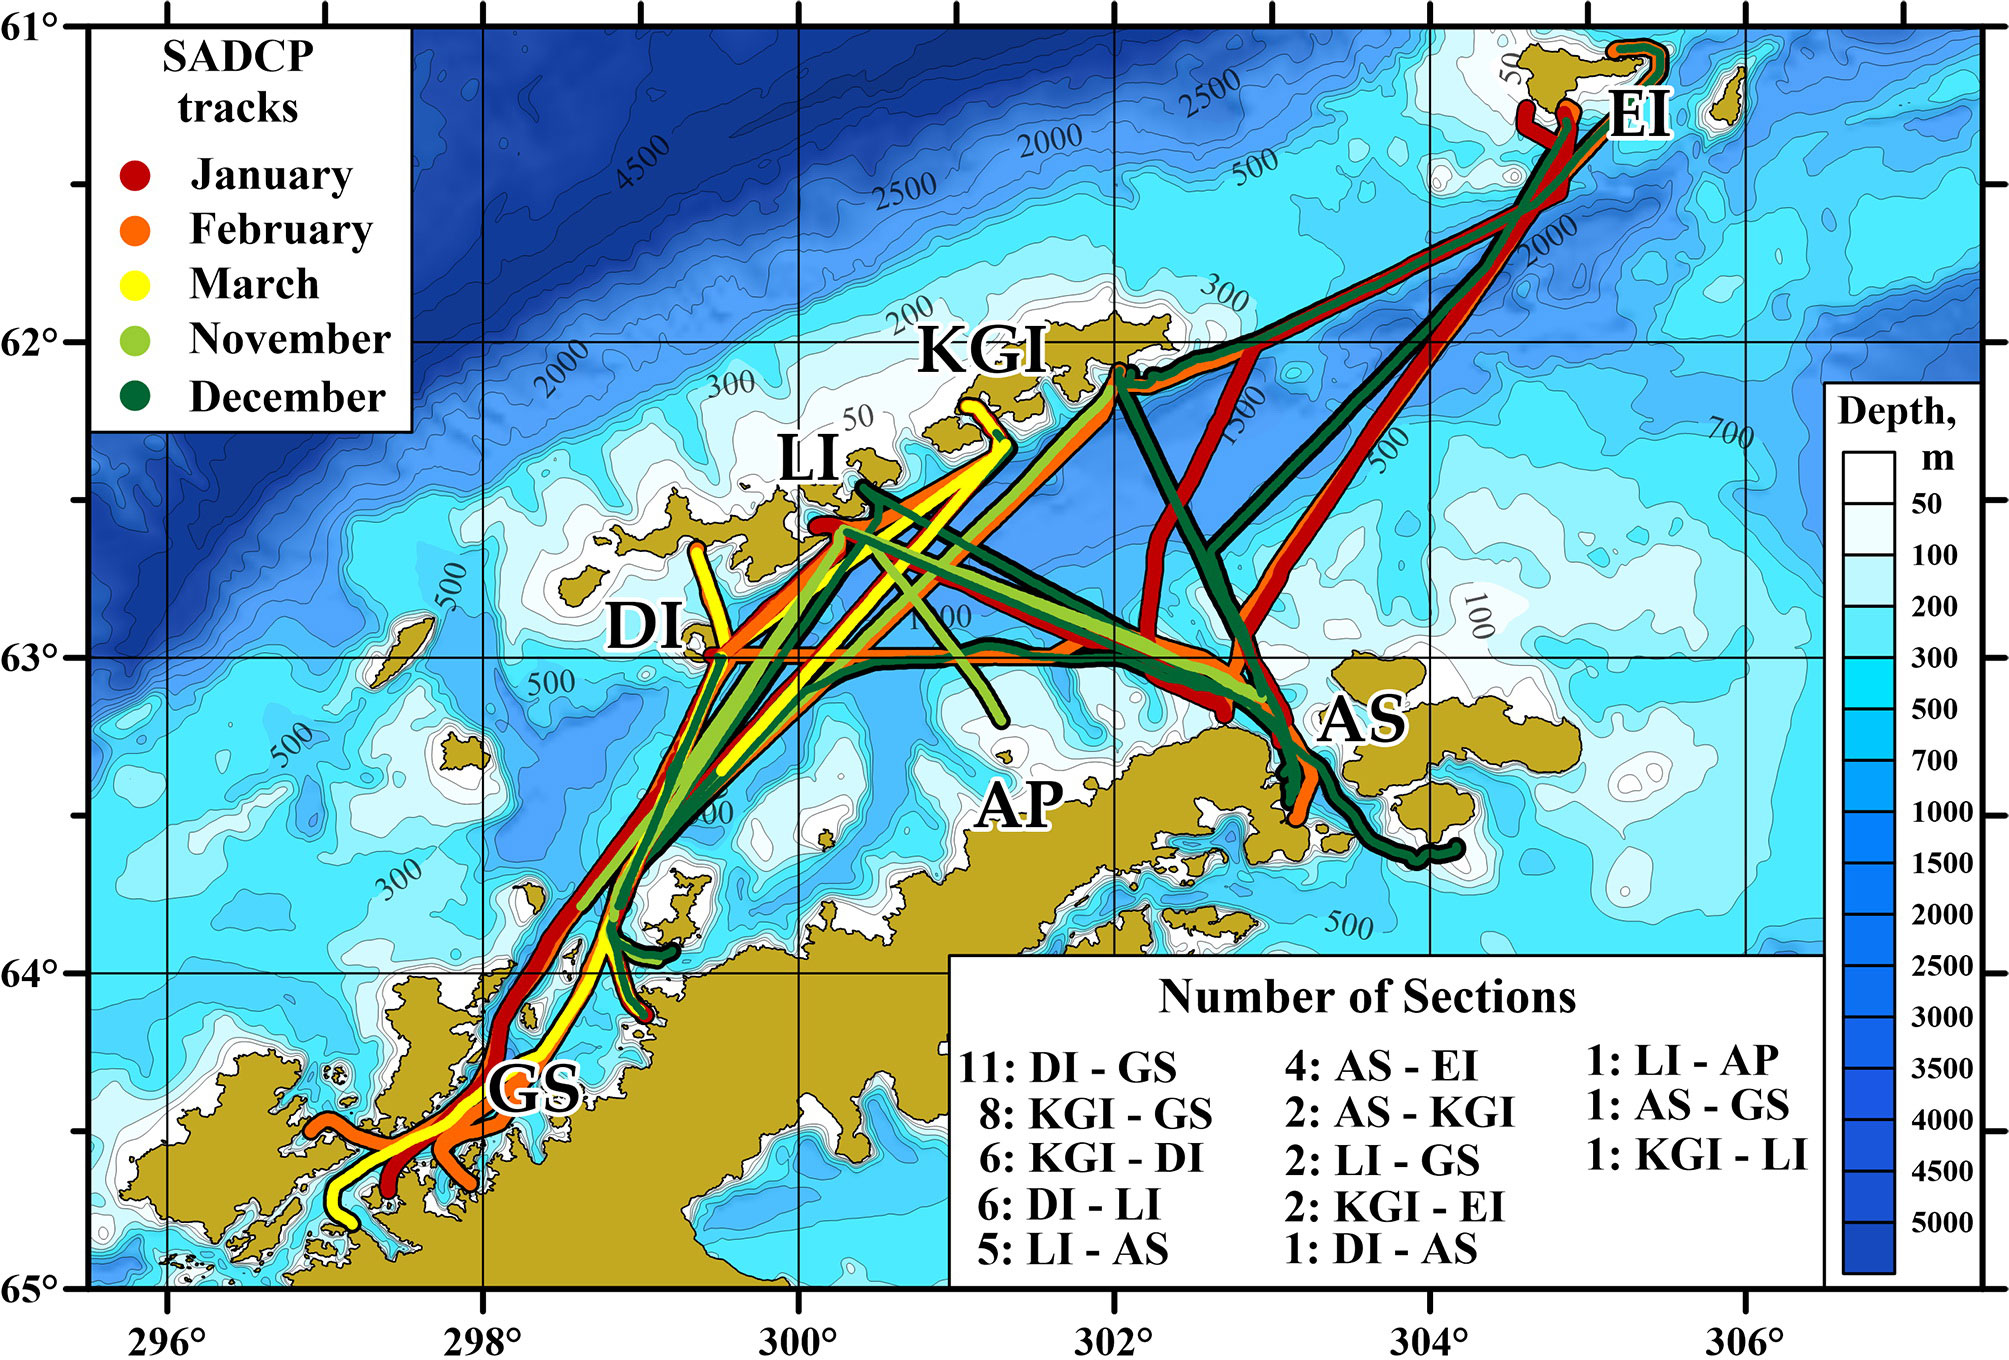
Figure 2 Ship tracks with SADCP measurements in the Bransfield Strait used in this work. Different colors indicate measurements performed in different months of 2017. Locations of starting and ending points of tracks are indicated: AS, Antarctic Sound; EI, Elephant Island; KGI, King George Island; DI, Deception Island; GS, Gerlache Strait; LI, Livingston Island; AP, Antarctic Peninsula (see Figure 1 for locations of the islands). Number of sections along different routes are presented; see Table 1 for more detailed information. Bathymetry is shown according to the GEBCO2019 database.
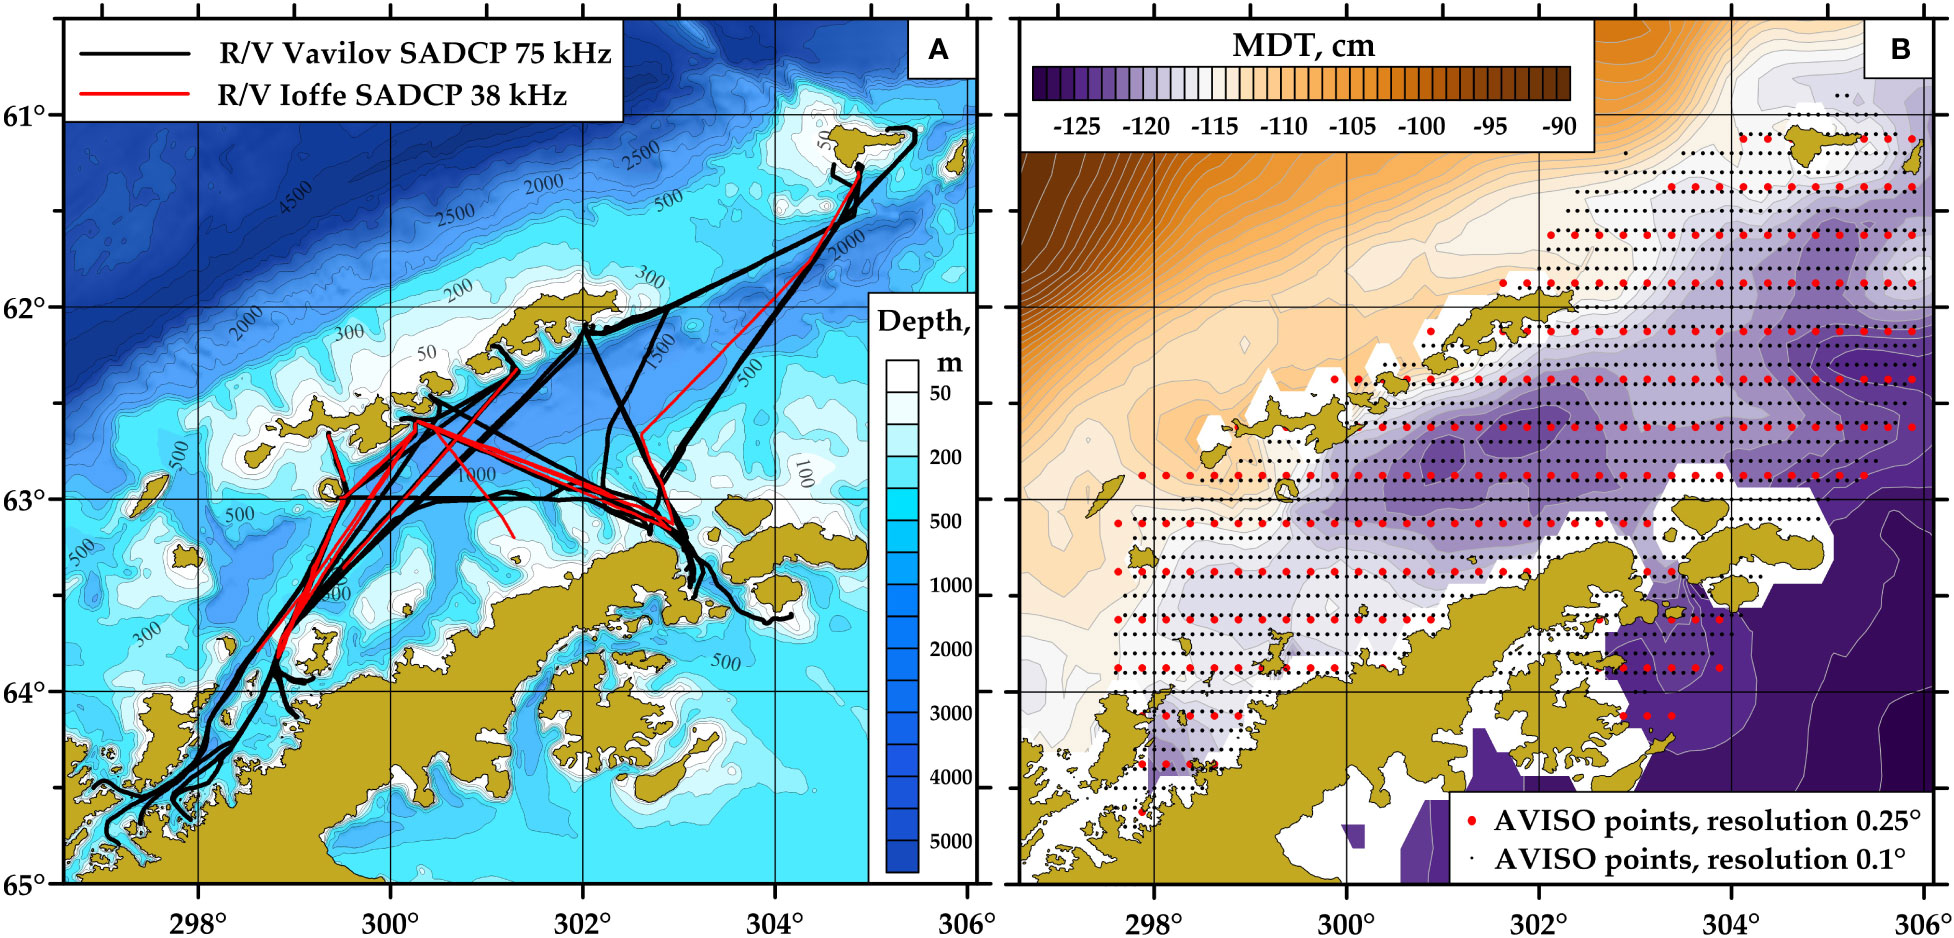
Figure 3 Distribution of in situ measurements (A) and AVISO data points (B) in the Bransfield Strait. Locations of the SADCP sections used in this study are indicated with black (measurements from the R/V Akademik Sergey Vavilov) and red (measurements from the R/V Akademik Ioffe) lines. Bathymetry is shown according to the GEBCO2019 database. The black and red dots denote locations of altimetry data points of 0.25° and 0.1° resolution, respectively; the mean sea level according to the MDT data is shown by the color scale in panel (B).
During all our surveys the profilers were set in the narrowband mode, which increases the profiling range down to 700 m depth for the 76.8 kHz SADCP and down to 1000 m depth for the 38.4 kHz SADCP. We set 60 vertical bins of 16 m each with 8 m blank distance immediately below the transducer on the R/V ASV. The equivalent parameters for the R/V AI were 60 bins of 24 m each and 10 m blank distance. The draught of both ships is 6 m, which gives 22 m (R/V ASV) or 28 m (R/V AI) depths for the center of the first bin (the depth of the uppermost layer with velocity measurements). Time averaging of the raw data was performed over 120 s intervals. Since the mean ship speed is 10 knots, this time average represents an along-track averaging of roughly 500 m. Measurement errors in the amplitudes of the horizontal velocities using the described technique do not exceed 2 cm/s (Chereskin and Harris, 1997). The SADCP measurements do not allow accurate velocity measurements near the surface and bottom. Depending on the SADCP frequency, the upper 22-28 m layer is not covered by measurements due to the draught of the ship and the blank distance below the transducers. Measurements in the near-bottom layer (15% of the ocean depth for the TRDI Ocean Surveyor transducers) were removed as they can be contaminated by the bottom echo; the GEBCO bottom topography dataset has been used for this purpose. We did not use extrapolation of the SADCP data in the analysis. For visualization of the spatial structure of the currents in the strait, we projected velocity into an east-north-east (60° east of north) and west-south-west coordinate system, to match the large-scale orientation of the SSI continental slope.
The TPXO model version 9.1 (Egbert and Erofeeva, 2002) was used to subtract the barotropic tidal velocities at the moment of measurements. The model can be downloaded at https://www.tpxo.net/global (accessed February 13, 2023). King and Padman (2005) validated the TPXO model in the Southern Ocean including the Bransfield Strait region using direct observations and compared it with other tidal models. It was shown that the TPXO6.2 is the optimum model for the entire circum-Antarctic seas with a root-mean-square deviation of 5–7 cm. In this work, we use the modern TPXO9 version of this model which should be better than its old version. Tidal velocities are significant in the BS and reach a few tens of centimeters per second near the shores of islands and the Antarctic Peninsula, which can significantly affect the current in the strait.
Analysis of the surface geostrophic velocities derived from satellite altimetry allows us to evaluate the difference between the velocity structure during the in situ observations and the time-averaged satellite-derived velocity and improves interpretation of the SADCP data within a wider regional context. In this work, we used two gridded altimetry products of different spatial resolution: the Data Unification and Altimeter Combination System (DUACS) delayed time altimeter gridded product of 0.25° (Pujol et al., 2016) available from Copernicus Marine Environment Monitoring Service (CMEMS, http://marine.copernicus.eu/) and gridded geostrophic velocities of 0.1° resolution (Ubelmann et al., 2021) computed with Multiscale Interpolation Ocean Science Topography (MIOST) available from Archiving, Validation and Interpretation of Satellite Oceanographic data service (AVISO, https://www.aviso.altimetry.fr/). Both datasets are open-access; the low-resolution altimetry dataset can be downloaded at https://data.marine.copernicus.eu/product/SEALEVEL_GLO_PHY_L4_MY_008_047/description (accessed April 17, 2021); high-resolution altimetry dataset can be downloaded at https://www.aviso.altimetry.fr/en/data/products/sea-surface-height-products/global/gridded-sea-level-heights-and-derived-variables-multiscale-interpolation.html (accessed April 17, 2021). These products include the data from all available altimeters and consist of Absolute Dynamic Topography (ADT), Sea Level Anomalies (SLA), surface-geostrophic velocities, and surface-geostrophic velocity anomalies on a Mercator regular grid and a daily sampling. The time coverage is 01.01.1993 – 03.06.2020 for the 0.25° resolution altimetry and 01.01.2017 – 31.12.2017 for the 0.1° resolution altimetry. The locations of data points for both grids are shown in Figure 3B. Approximately 4-5 points are available over the section across the channel for the 0.25° resolution product and 10-12 points for the 0.1° product. We also used the recently published Mean Dynamic Topography (MDT) data (Mulet et al., 2021) available from CMEMS for studying the mean surface geostrophic circulation in the region of the BS; this product can be downloaded at https://doi.org/10.48670/moi-00150 (accessed February 3, 2023). Similar comparison between field current measurements and satellite altimetry were performed in different regions including the Southern Ocean (Barré et al., 2011; Ferrari et al., 2017; Frey et al., 2021). There is a range of coastal altimetry products which give more accurate sea level data near the coasts (Passaro et al., 2014). However, these are along-track products, which have two disadvantages for the purposes of this study: they do not give information on the full current vector, and errors are introduced where the ship and satellite tracks do not coincide in both time and space (Barré et al., 2011).
The currents in the BS were analyzed at three locations: the BC in the western part of the strait (Section 3.1), two pronounced jets along the SSI and Antarctic Peninsula in the central part of the strait (Section 3.2), and the currents in the eastern basin between Elephant Island, the tip of the Antarctic Peninsula, and the SSI (Section 3.3).
Waters from the Bellingshausen Sea and the Drake Passage propagate to the BS through the Boyd Strait, Gerlache Strait, and several other straits between Smith, Low, Hoseason, and Brabant islands (see Figure 1 for the location of the islands). Further to the east, these flows merge and spread through the wide strait between Deception and Trinity islands. Most of the analyzed transects in this part of the BS were located across this wide strait. An additional inflow can be observed between Livingston and Deception islands; two sections between these islands were occupied in February and March 2017.
The section between Deception and Trinity islands was covered by measurements three times in February-March 2017 (Figure 4). The quasi-meridional section line is located over the shallowest sill between western and central basins; the line also crosses an underwater rise at 63.4°S with a minimum depth of 350 m. The maximum depths of the sill reach 600 m (Figure 4). The intense BC is clearly observed at all three crossings. The current is located at the northern part of the section over a steep bottom slope of Deception Island approximately between isobaths of 200 and 400 m. The width of the current, defined by a 15 cm/s isoline of the along-strait velocity, varies between 15.8 and 30.0 km. Along-strait velocity components reach 47 cm/s, 33 cm/s, and 37 cm/s on February 19-20, March 11-12, and March 25, respectively (Figure 4). The velocity maximum is observed at the sea surface (Figures 4A, C) or at a depth of 160 m (Figure 4B). The distance between this maximum and the 200-m isobath varies between 2.4 and 4.4 km. The mean vertical gradient of velocity calculated within the column of the maximum current speed is 0.7*10-3 s-1. All sections also show an opposite flow in the southern part of the section. This current is a continuation of the CC along the Antarctic Peninsula. The flow is more variable in time than the BC and its maximum speeds vary between 10 and 25 cm/s. The CC is relatively weak in the western basin due to the recirculation of this current within the central basin of the strait.
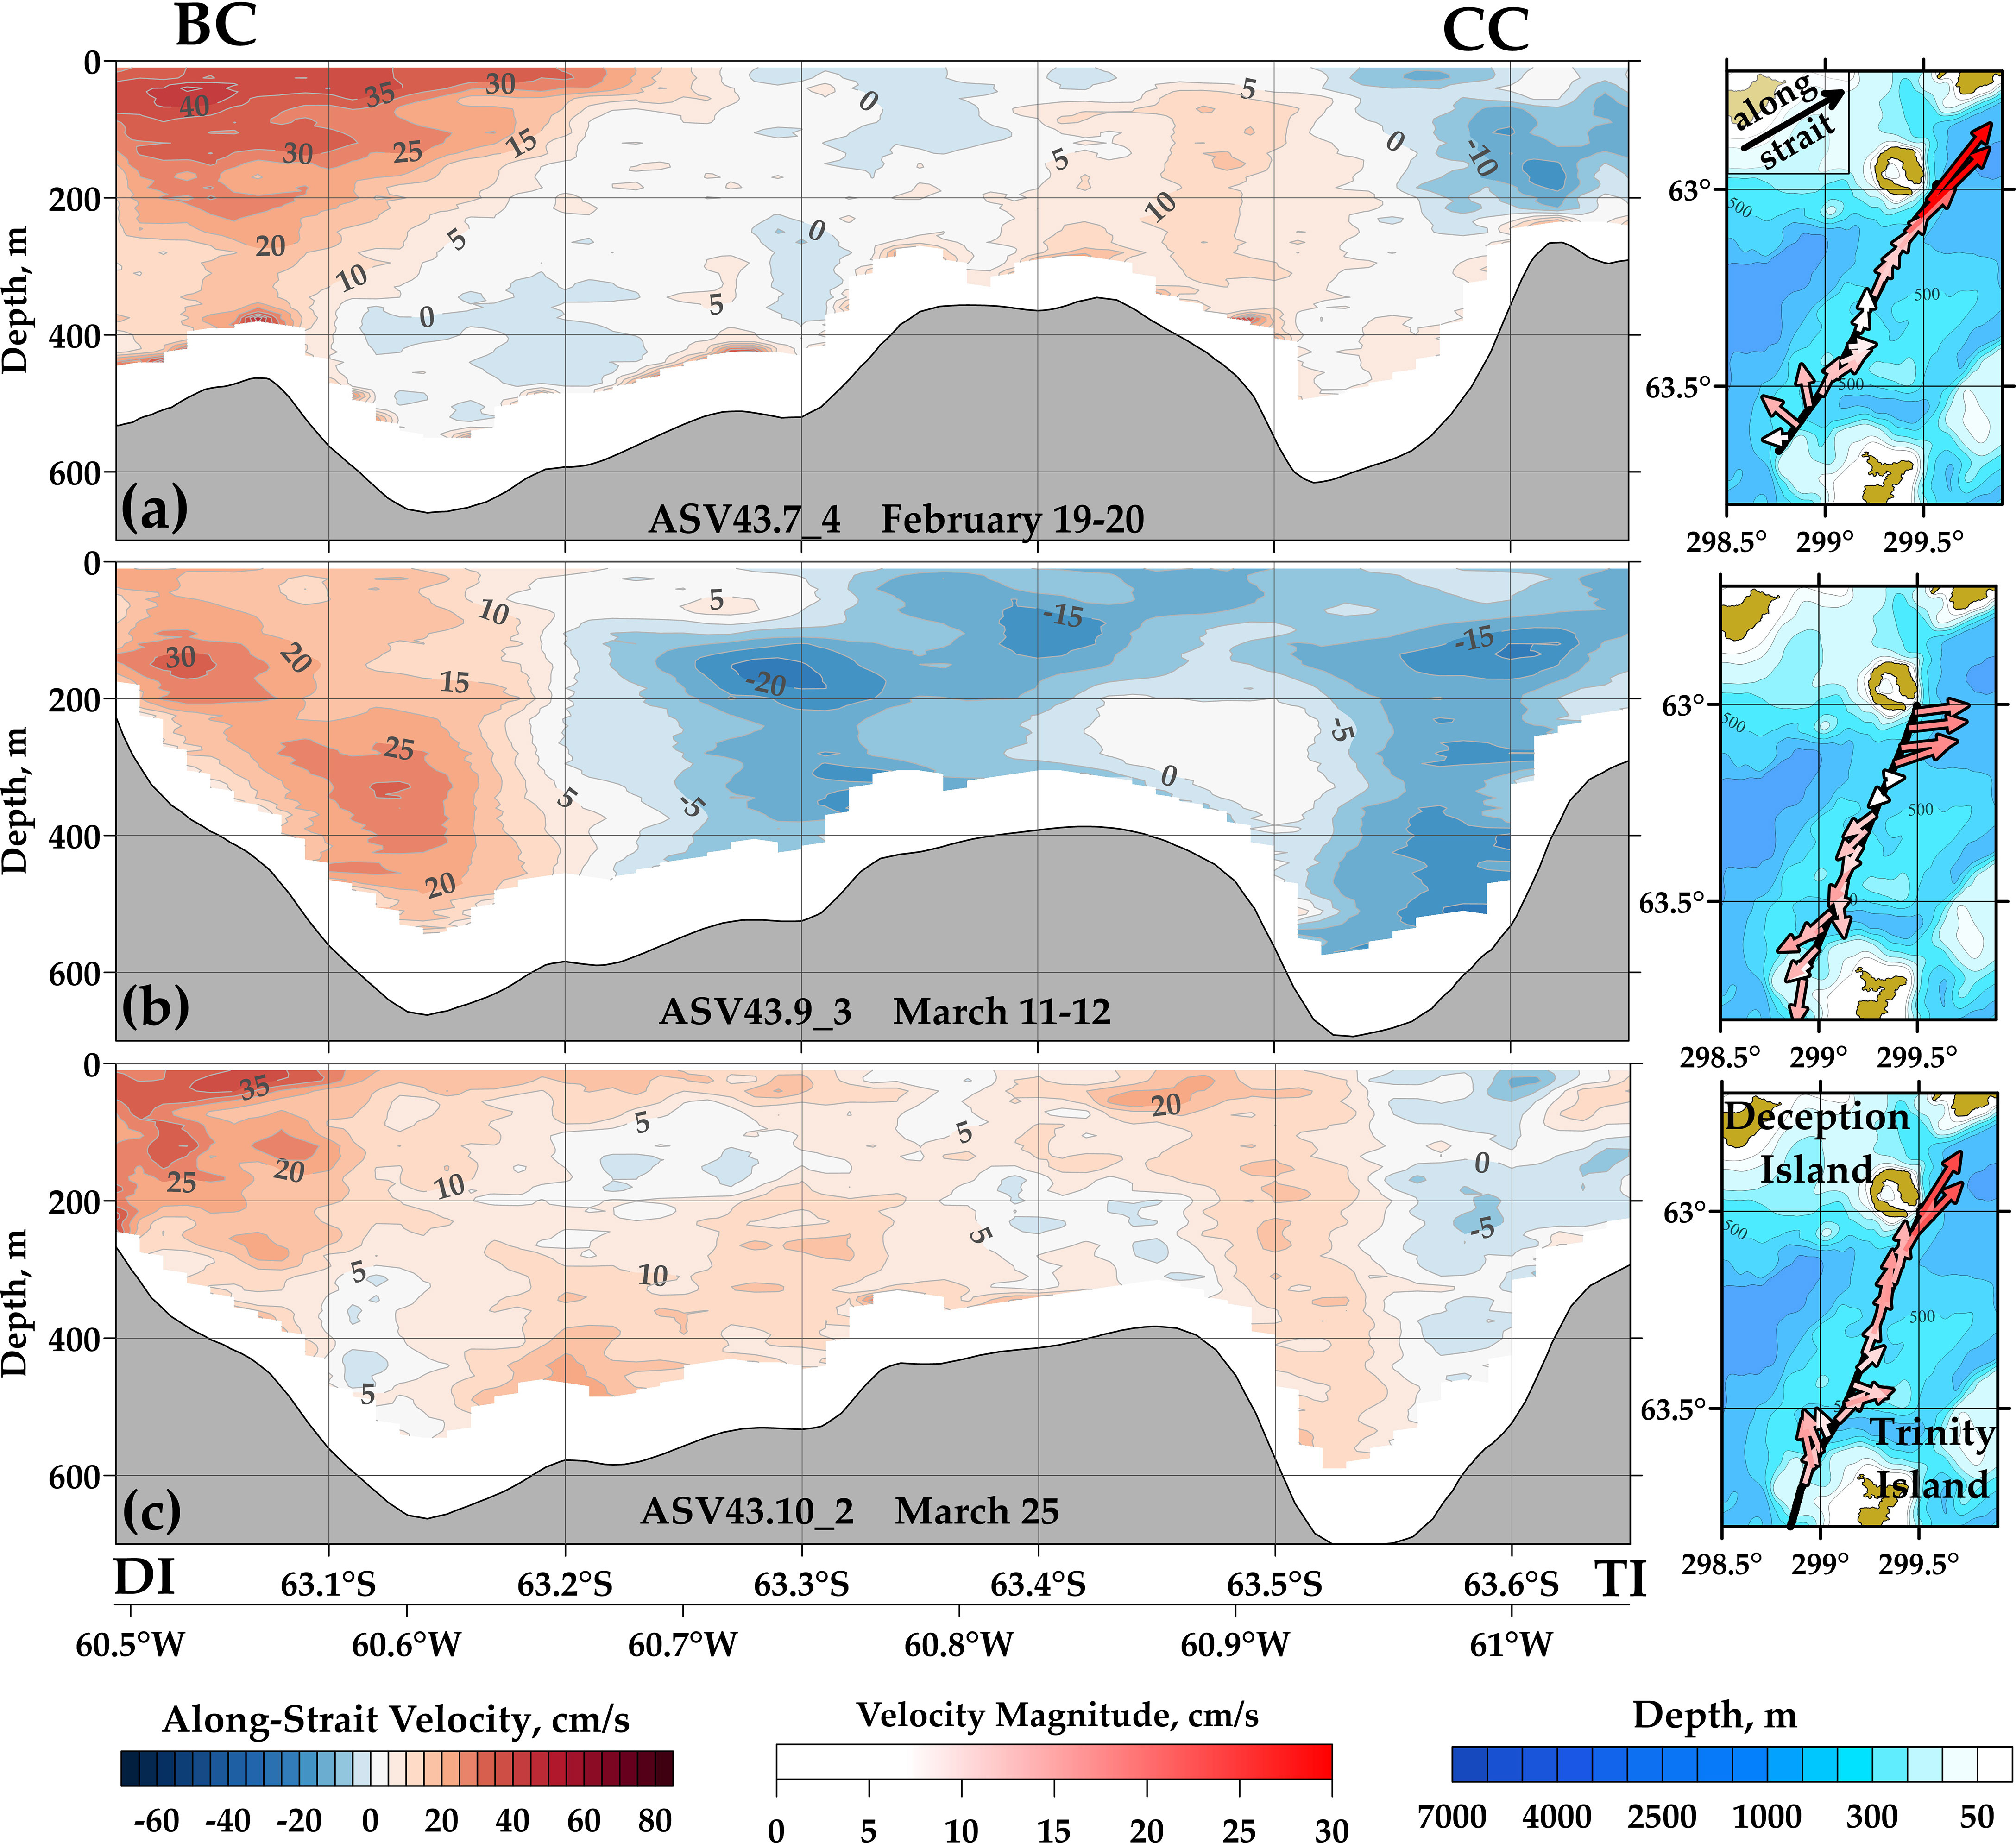
Figure 4 Distribution of along-strait velocity along the section between Deception and Trinity islands based on three SADCP crossings: on February 19-20 (A), March 11-12 (B), and March 25 (C), 2017. Positive values of velocity correspond to the east-north-east direction (the exact value is 60° relative to the north; this direction is shown by black arrow in the upper right panel). The velocities were projected to the direction along the strait independently on the orientation of transects. Locations of the crossings are shown in the right panels together with the depth-averaged SADCP velocities. Ocean bottom is shown by grey color. DI, Deception Island; TI, Trinity Island; BC, Bransfield Current; CC, Antarctic Coastal Current.
An additional inflow of waters to the BS from the west can be potentially observed between Deception and Livingston islands (Figure 5). However, our measurements performed on February 25 and March 11 of 2017 show only small inflowing currents in this strait. These two occupations of the section show similar velocity distributions; currents south of Deception Island are more variable (Figure 4). The depths north of the island are about 300 m with a 150-m underwater mountain in the middle part of the section. An inflow to the BS with velocities less than 25 cm/s at a depth of 200 m were recorded at the slope of this seamount.
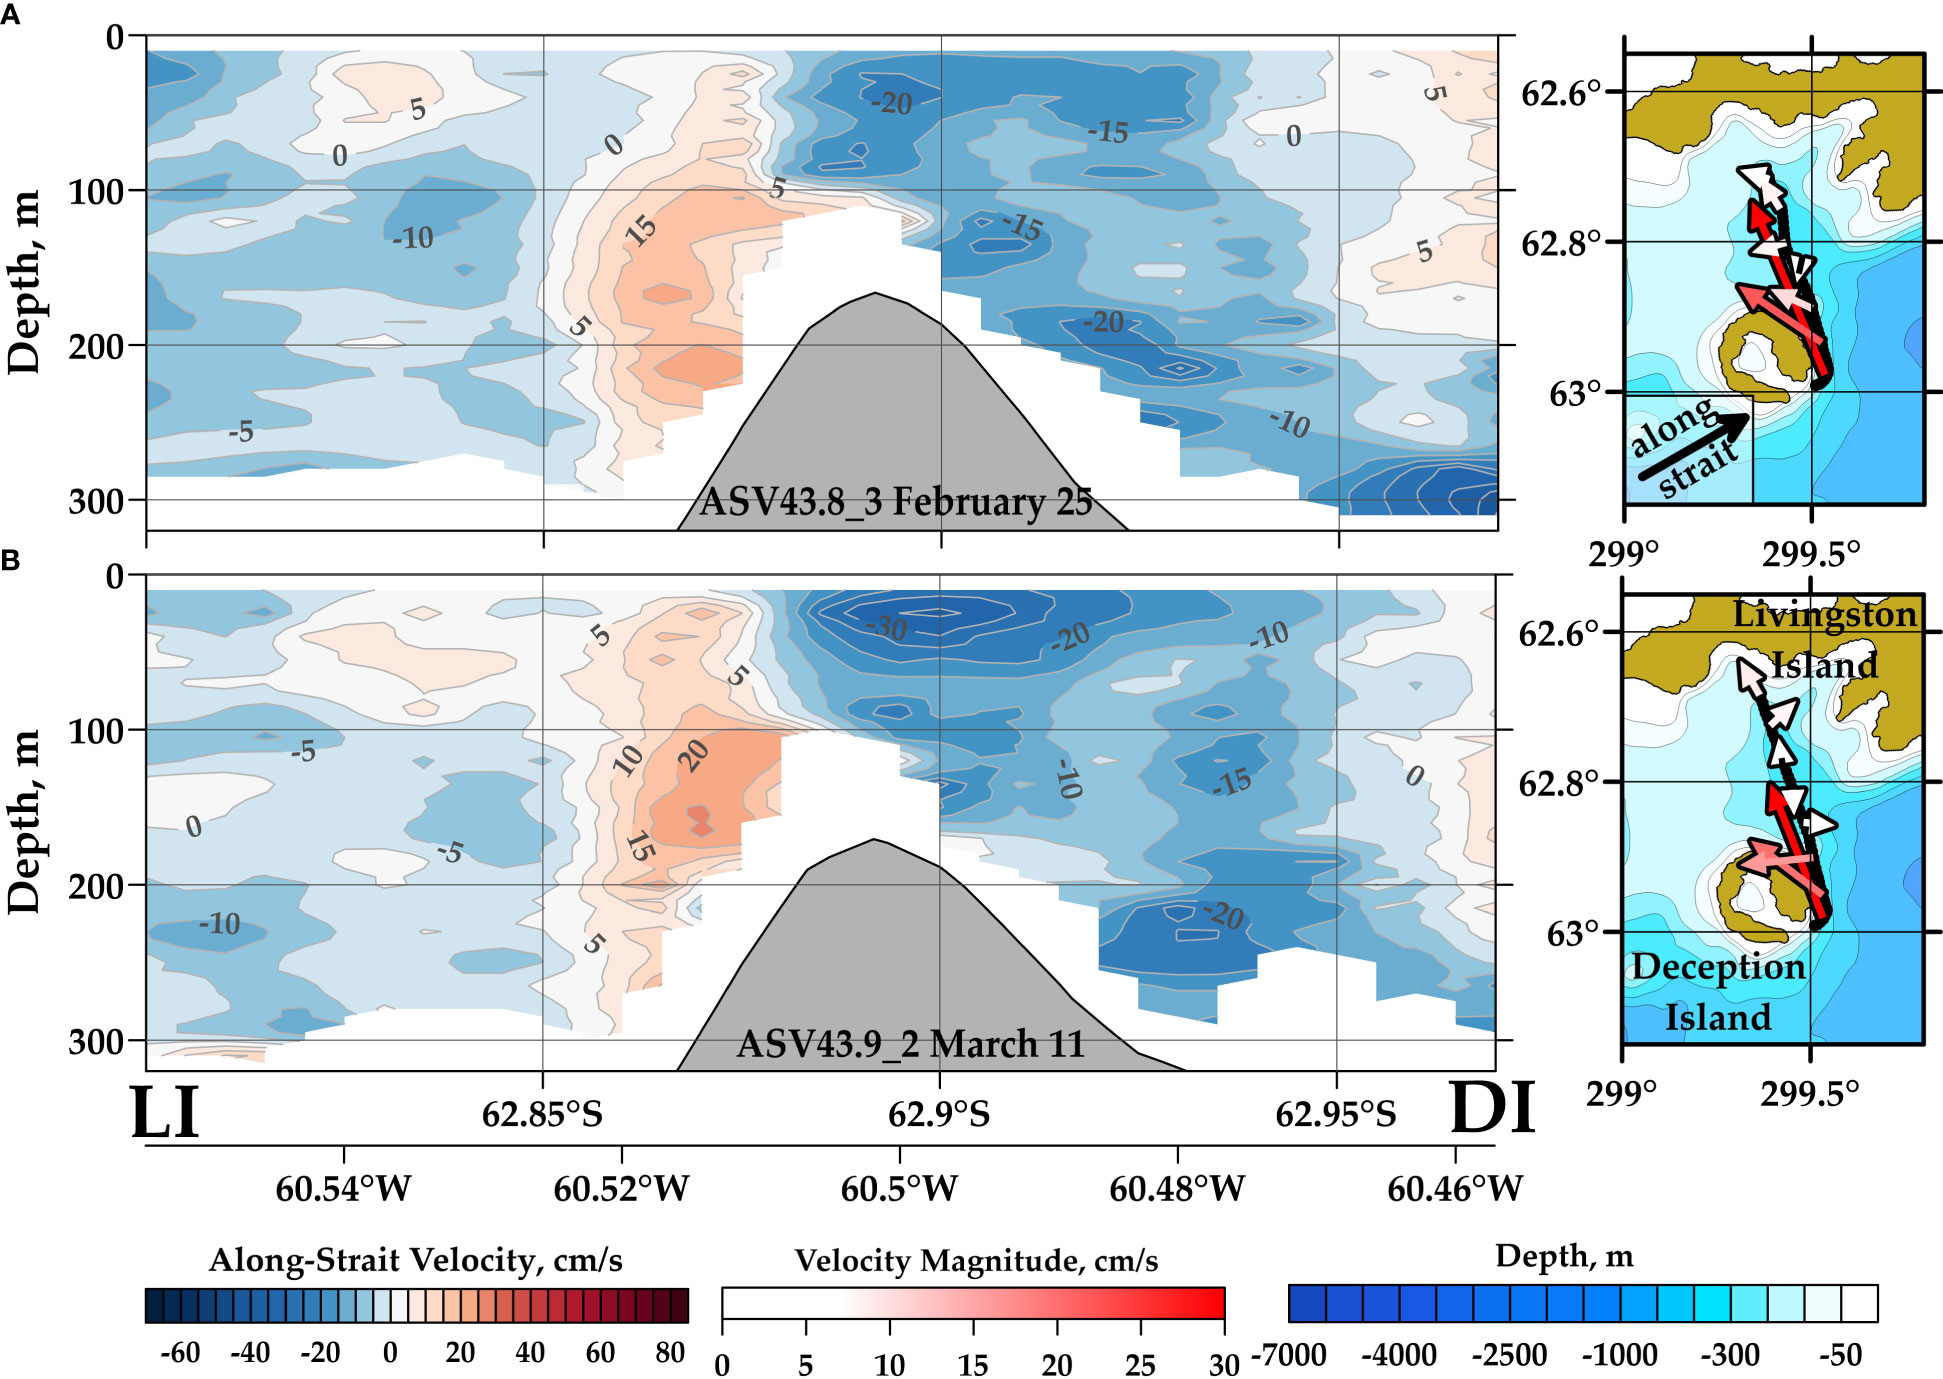
Figure 5 Distribution of the along-strait velocity on the section between Livingston and Deception islands based on two SADCP crossings: on February 25 (A) and March 11 (B) of 2017. Positive values of velocity correspond to the east-north-east direction (the exact value is 60° relative to the north; this direction is shown by black arrow in the upper right panel). The velocities were projected to the direction along the strait independently on the orientation of transects. Locations of the crossings are shown in the right panels together with the depth-averaged SADCP velocities. The ocean bottom is shown by grey color. LI, Livingston Island; DI, Deception Island.
Most of the analyzed sections in the BS crossed the central basin in different directions (Figure 2). Four of them were located along the same line between the tip of the Antarctic Peninsula near the Antarctic Sound and Livingston Island (Figure 6). The deepest point at this section is 1460 m based on the GEBCO2019 data. The northwestern slope along the SSI is much steeper than the slope of the Antarctic Peninsula. The width of the strait from the 700 m isobath on one side to that on the other is 75 km. The measurements on this section were performed on January 20-21 from the R/V ASV (Figure 6A) and on November 24-25, November 27, and December 13 from the R/V AI (Figures 6B–D).
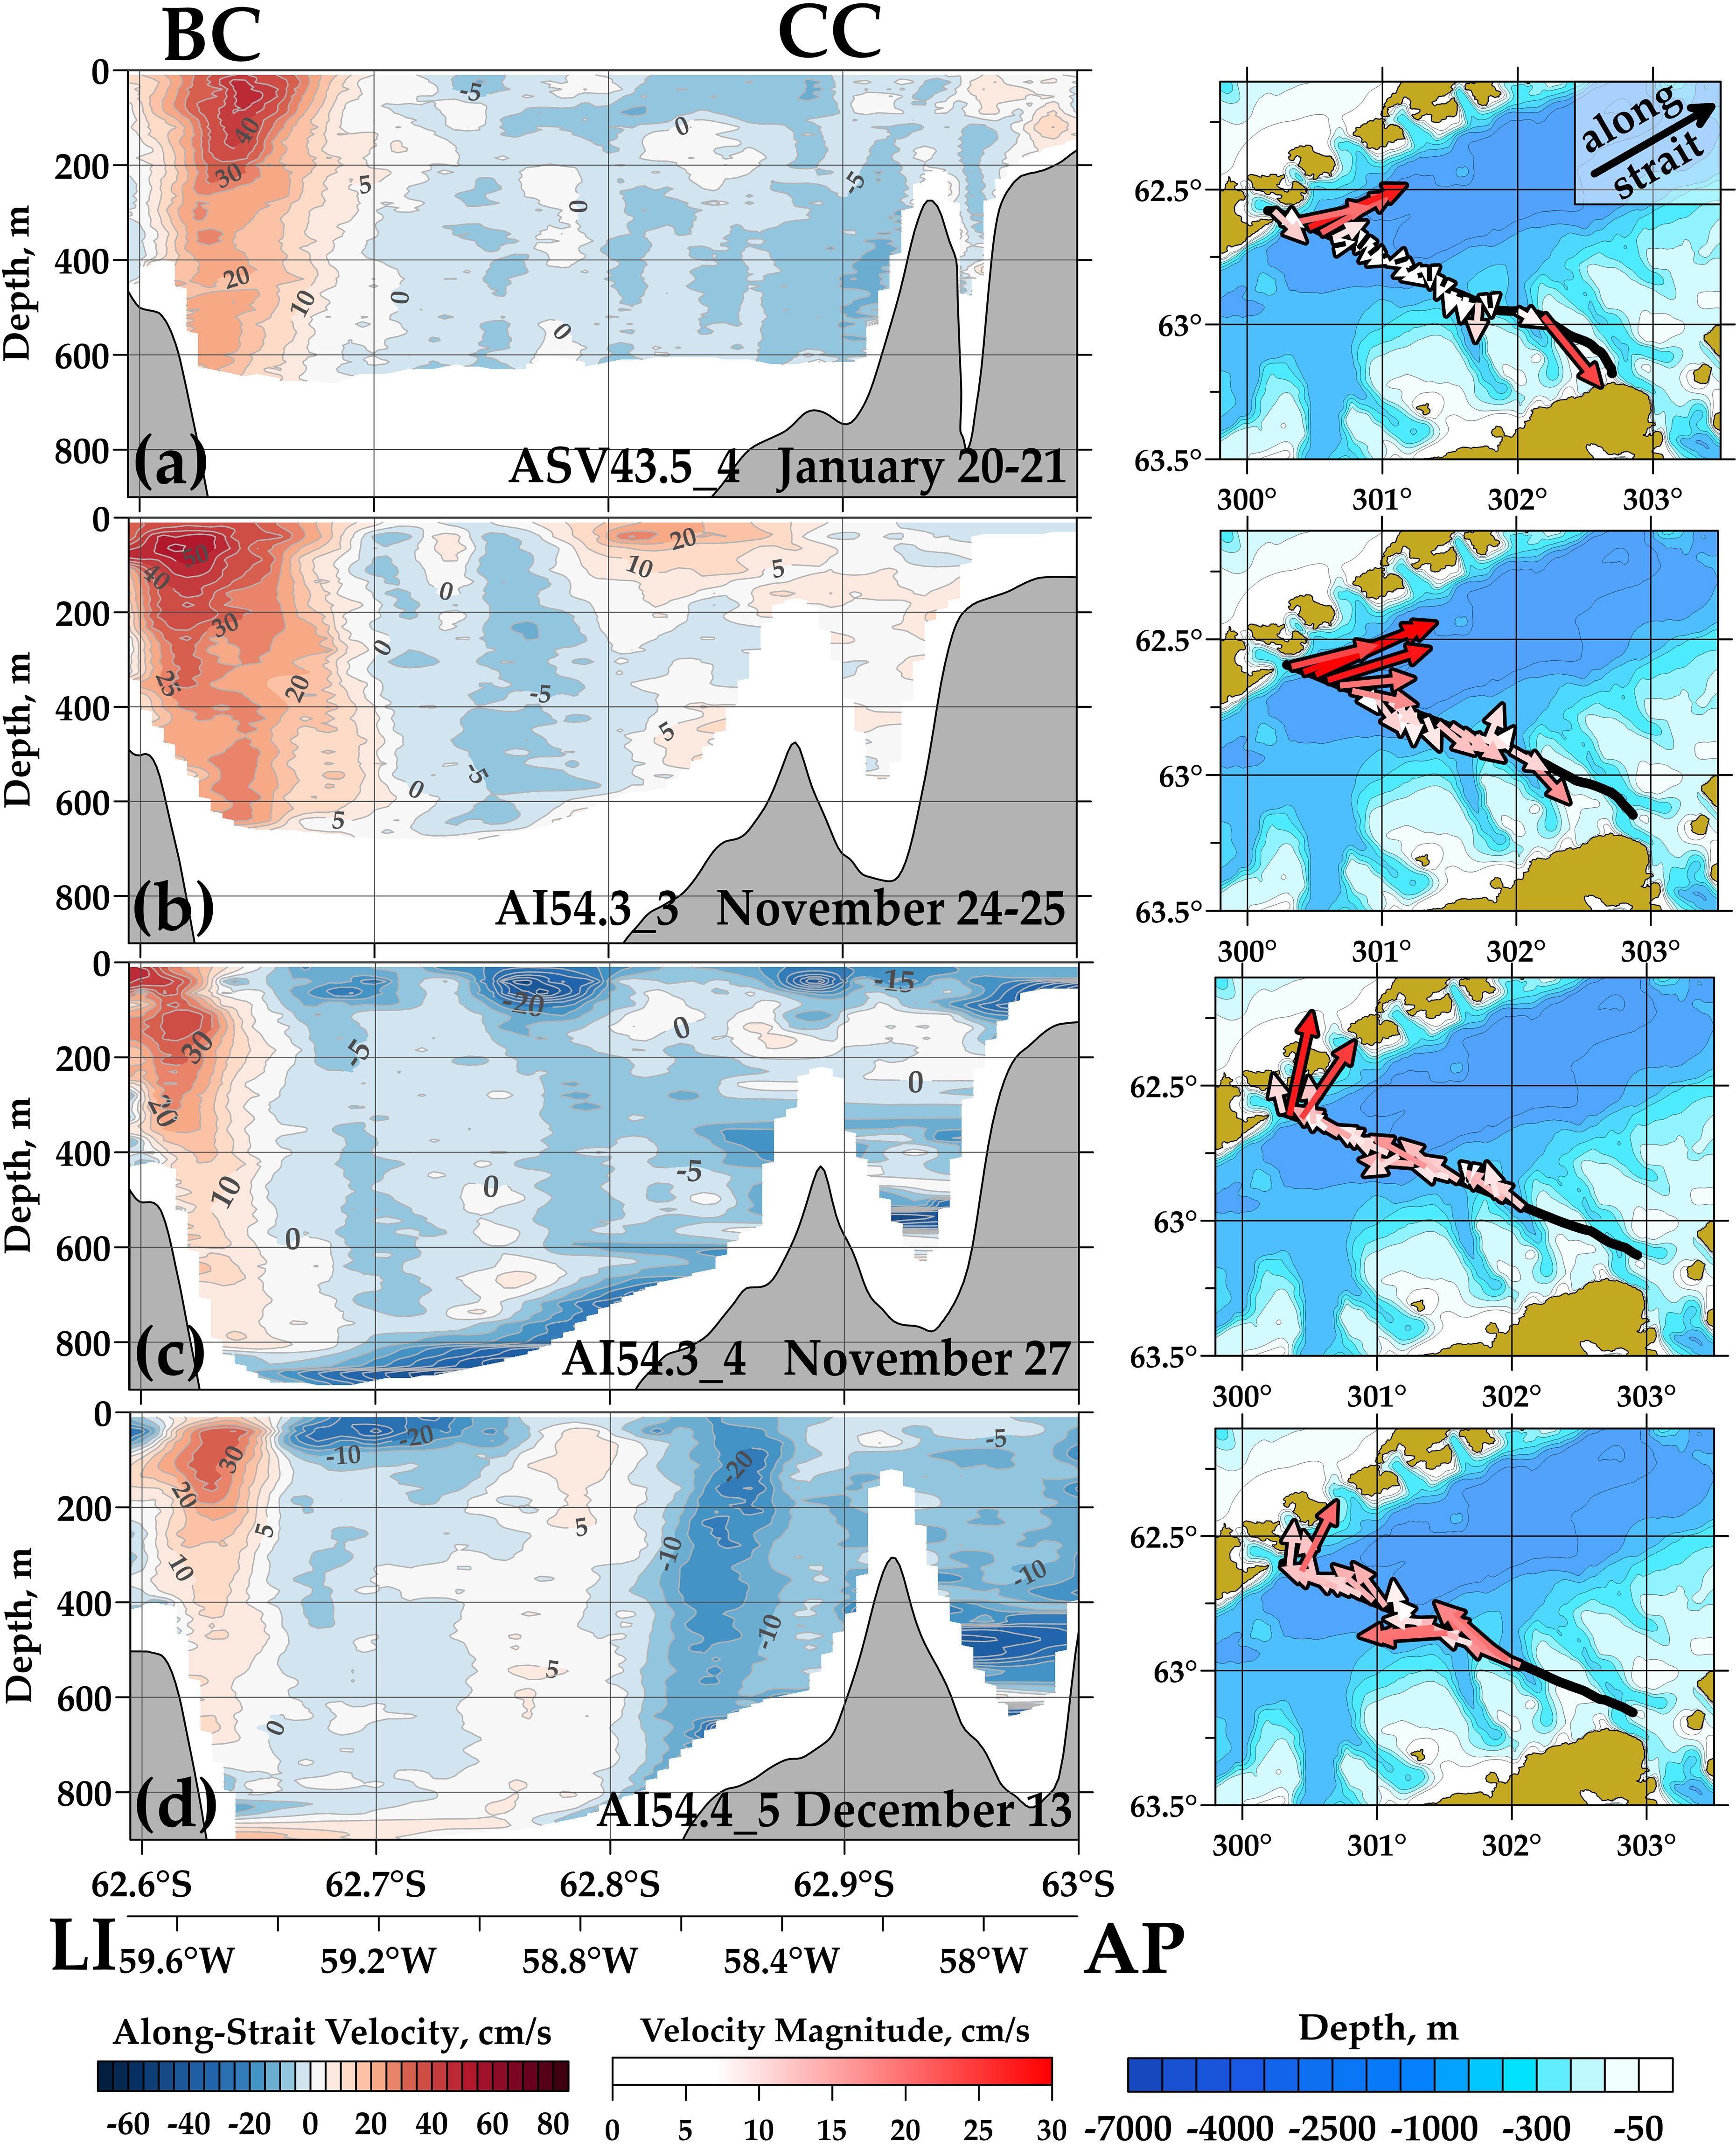
Figure 6 Along-strait velocity distributions at four crossings between Livingston Island (LI) and Antarctic Peninsula (AP) performed on January 20-21 (A), November 24-25 (B), November 27 (C), and December 13 (D). The measurements were performed from the R/V ASV (A) and R/V AI (B–D). Positive values of velocity correspond to the east-north-east direction (the exact value is 60° relative to the north; this direction is shown by black arrow in the upper right panel). The velocities were projected to the direction along the strait independently on the orientation of transects. Locations of the crossings are shown in the right panels together with the depth-averaged SADCP velocities. The ocean bottom is shown by grey color. LI, Livingston Island; AP, Antarctic Peninsula; BC, Bransfield Current; CC, Antarctic Coastal Current.
The BC has been observed near Livingston Island during all crossings. The distance between the velocity core and the 200-m isobath varies between 5.2 km and 12.1 km; thus, the current in the central basin is located further from the shore than near Deception Island. The velocity maximum is usually located over isobaths of 500-600 m; velocities reach 34 – 63 cm/s depending on the crossing. The mean vertical shear of velocity calculated over the 300-m layer varies between 0.7*10−3 s−1 and 1.2*10−3 s−1. The current in the central basin becomes narrower than over the previous section (Figure 4). The mean width of the maximum velocity core, defined as a band where the current speed exceeds 15 cm/s, is 12.3 – 19.2 km. A relatively weak opposite current is observed along the Antarctic Peninsula, which corresponds to the CC. Its velocity reaches 26 cm/s at the crossing on December 13. The width of this flow is much more variable. At some crossings, no opposite flow has been observed. For example, a northeastward current was recorded on November 24-25, 2017 with velocities exceeding 34 cm/s instead of the mean southwestward flow.
Figure 6 also shows the difference between measurements performed by 76.8 kHz (Figure 6A) and 38.4 kHz (Figures 6B–D) SADCPs. Generally, an increase in the SADCP frequency leads to a decrease in the range of measurements and improves spatial resolution. In this case, vertical resolution changes from 24 m (38.4 kHz) to 16 m (76.8 kHz). The vertical range of measurements depends on many factors including weather conditions and properties of the water column under the ship (the most important feature is the number of small sound scatterers distributed in the water column, which reflect signal to the SADCP receiver). In addition, the range depends on the narrowband or broadband mode of measurements. In these measurements, we used only the narrowband mode. As can be seen from Figure 6, the maximum depths of measurements change from approximately 600 m for the 76.8 kHz SADCP to more than 800 m for the 38.4 kHz SADCP.
Two crossings were carried out with a 2.5-day interval on November 24-25 and 27 (Figures 6B, C). Significant change of the flow structure has been observed between these two measurements. The maximum velocity of the BC decreases from 63 cm/s to 56 cm/s. Two strong opposite flows up to 34 cm/s were observed in the upper ocean layer at 62.75° – 62.85°S. These flows could be caused by an eddy that moved across the transect line during 2.5 days between measurements. We can see similar degrees of variability at seasonal scales (Figures 4, 6A, B) and within these 3 days (Figures 6B, C). This fact means that we cannot study seasonal variability using just 50 transects located in different parts of the strait; temporal variability on a seasonal scale will be addressed based on satellite altimetry in the next Section.
The velocity distributions presented in Figure 6 cross the Bransfield and Antarctic Coastal currents in the central part of the BS and are suitable for more detailed analysis of these currents. For this purpose, the horizontal gradients and vertical shear of measured SADCP velocities were calculated (Figure 7). One can see that the horizontal velocity gradients are the strongest within the BC at all crossings. The gradients reach 2.4 (cm/s)/km along the left and right boundaries of the current. The horizontal gradients outside the BC are much lower and do not exceed 0.5 (cm/s)/km. Zero horizontal gradient in Figures 7A, C–E clearly shows the position of the maximum velocity of the BC at different depths. Interestingly, this line is not strictly vertical indicating that the velocity maximum of current displaces to the left or right with depth. The CC is not seen in the distributions of the gradients. As for the vertical shears, they reach 0.4 (cm/s)/m in the upper ocean layer all over the sections. The smoothed vertical shear is larger in the BC area, though large shear extrema at a smaller scale are found throughout the section. The shear generally decays towards the bottom and does not exceed 0.1 (cm/s)/m at 300 m depth. One can assume that mixing in the strait related to high velocity shear is not concentrated in the area of the BC but can be observed at any point of the strait. Similarly, no high velocity shear has been observed in the area of the CC. Accurate comparison between geostrophic and SADCP velocities made in (Mukhametianov et al., 2022) shows that both approaches give almost the same depth-averaged vertical shear in the BC (the difference does not exceed 10%). In the CC, the geostrophic approximation fails to reproduce current velocities and vertical shears.
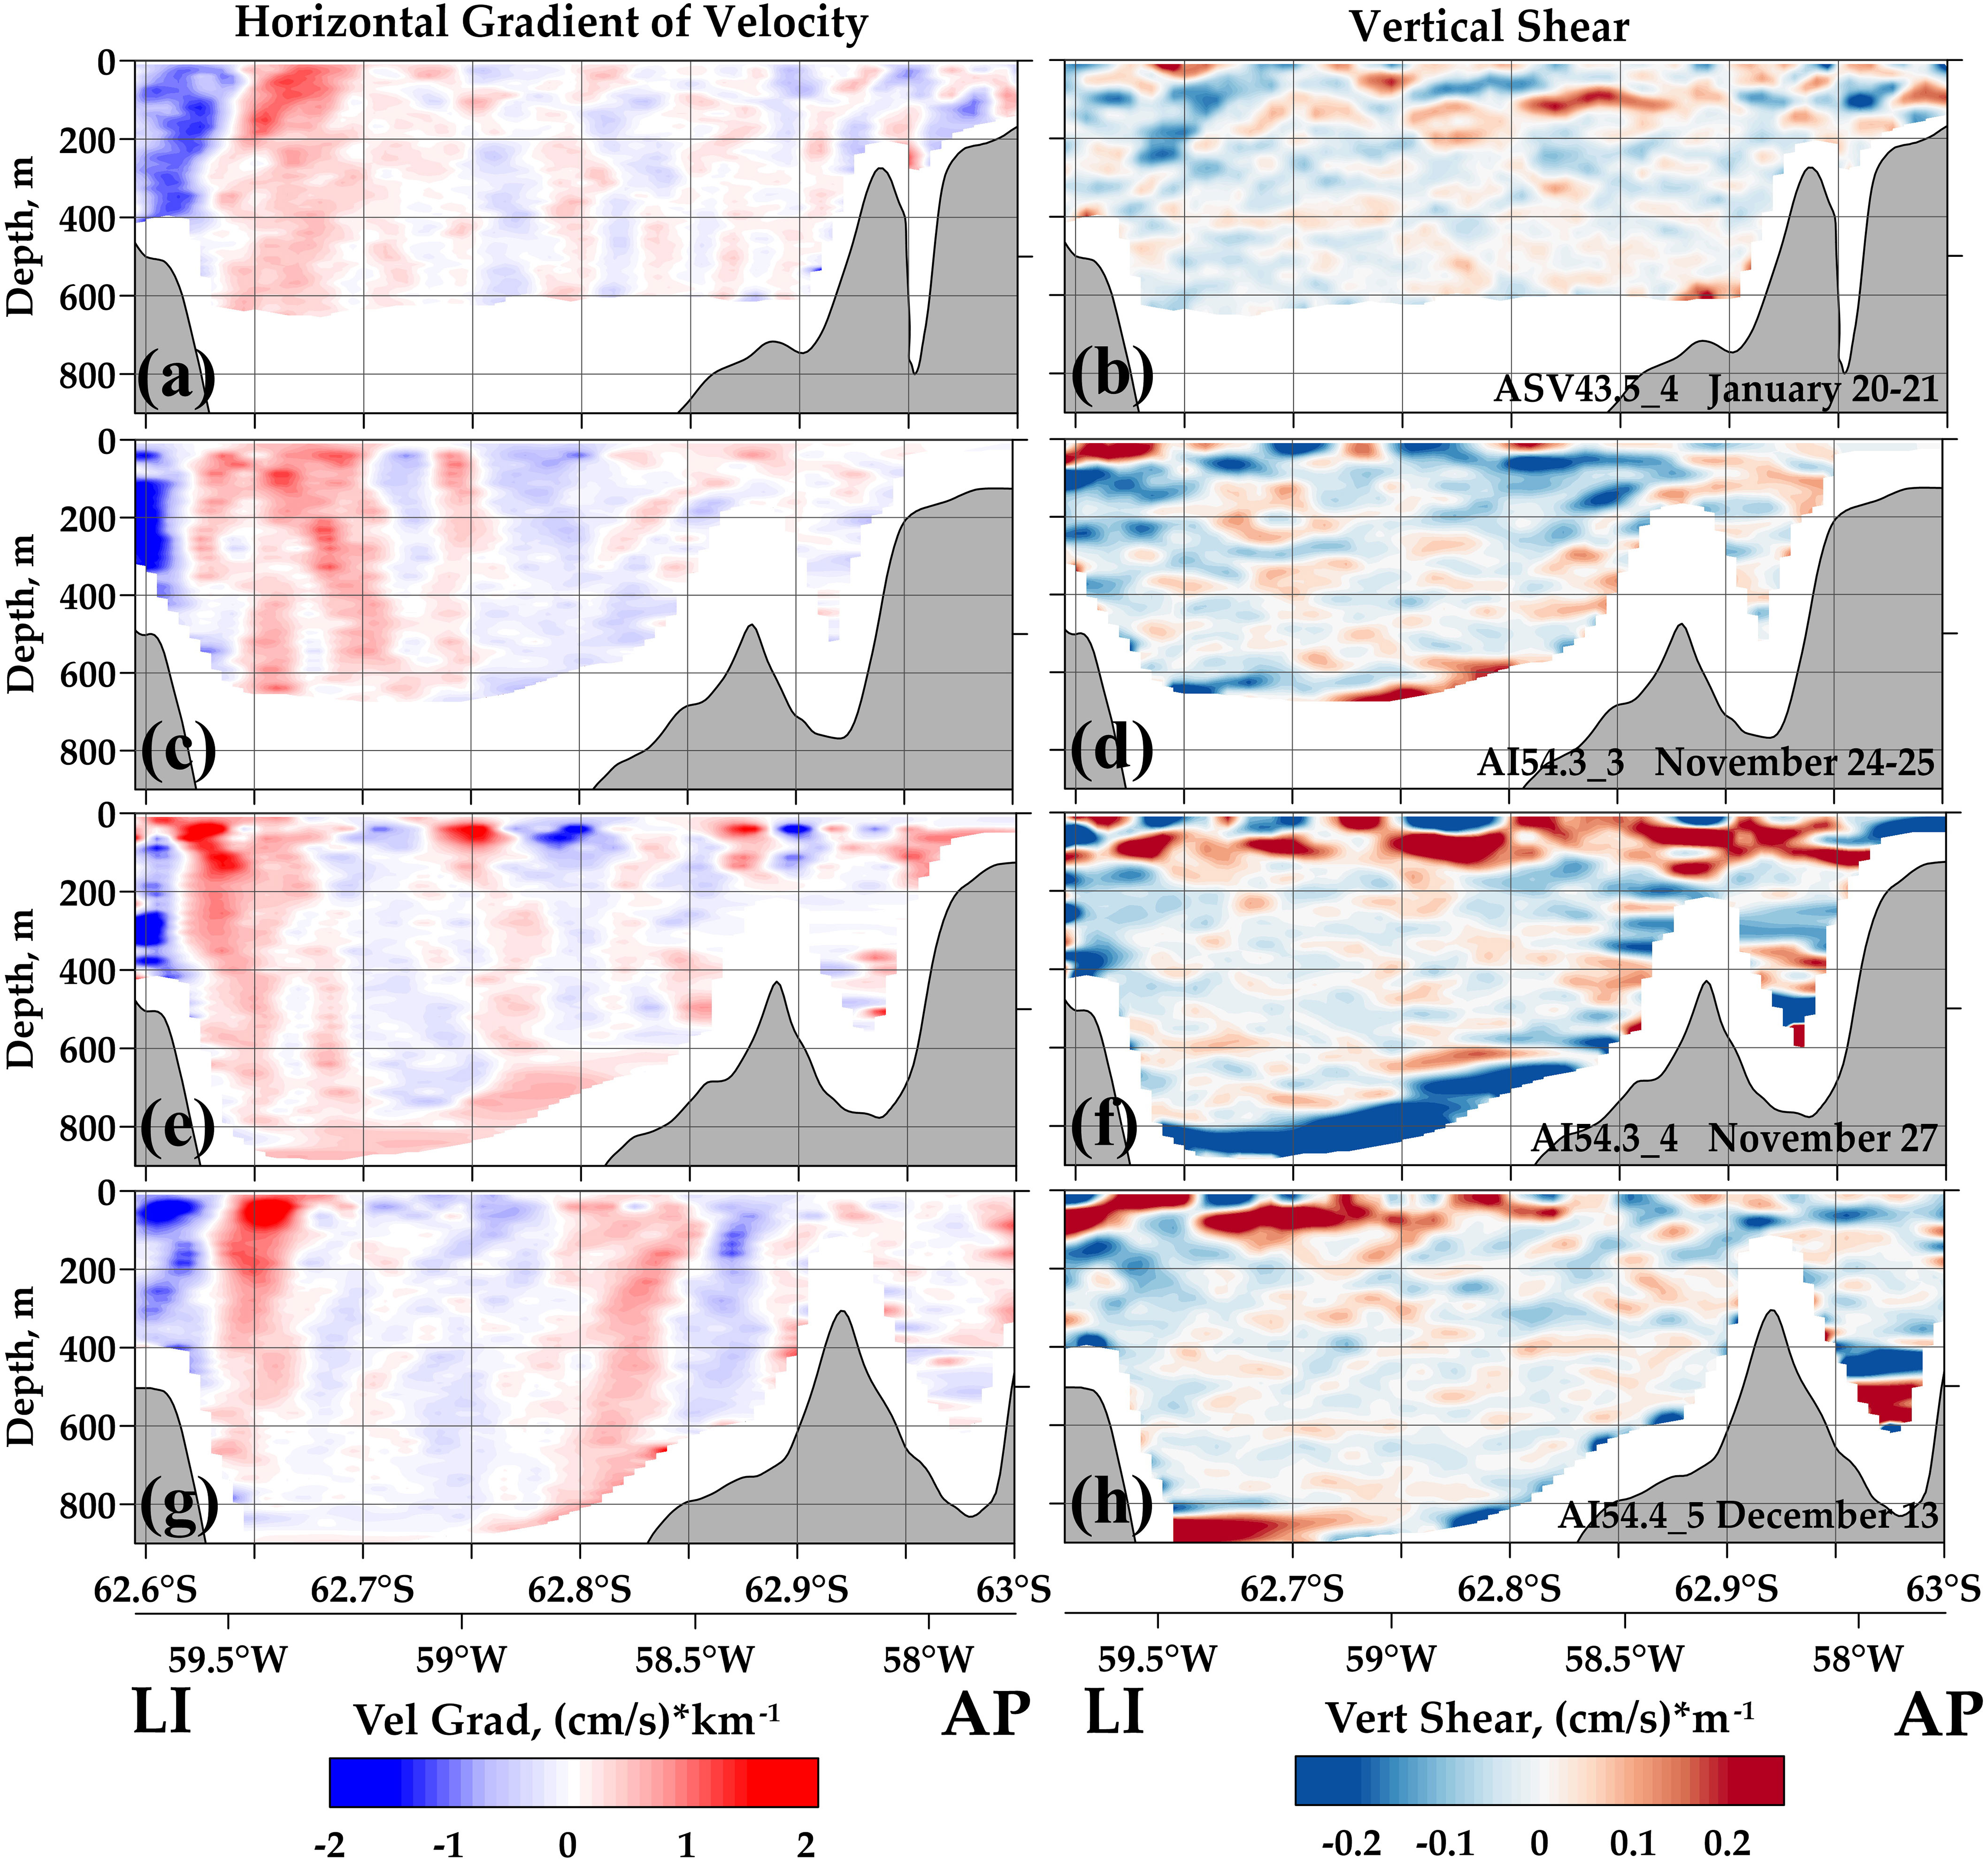
Figure 7 Distributions of horizontal gradient of velocity (left panels) and vertical shear (right panels) at four crossings between Livingston Island (LI) and Antarctic Peninsula (AP) performed on January 20-21 (A, B), November 24-25 (C, D), November 27 (E, F), and December 13 (G, H). The measurements were performed from the R/V ASV (A, B) and R/V AI (C–H). Locations of the crossings are shown in the right panels of Figure 6. The ocean bottom is shown by grey color.
Empirical orthogonal function (EOF) analysis has been applied for investigation of variability of currents in the Bransfield Strait. We used the data from the sections between the SSI and Antarctic Peninsula and averaged measured profiles within the BC and CC. Four sections were analyzed for the BC (Figure 6) and six sections for the CC (Figures 6, 8). Vertical velocity profiles of these currents were chosen from the sections as the following. First, the cores of both currents were detected in every section. The cores of the BC and CC were determined by the maximum flow velocity; the boundaries of the currents were determined by isolines of 5 cm/s and -5 cm/s, respectively. Then velocities were averaged within the limits of the currents at all depths separately for each transect. The result of averaging vertical profiles and their EOF first modes at depths from 24 to 616 m are shown in Figure 9.
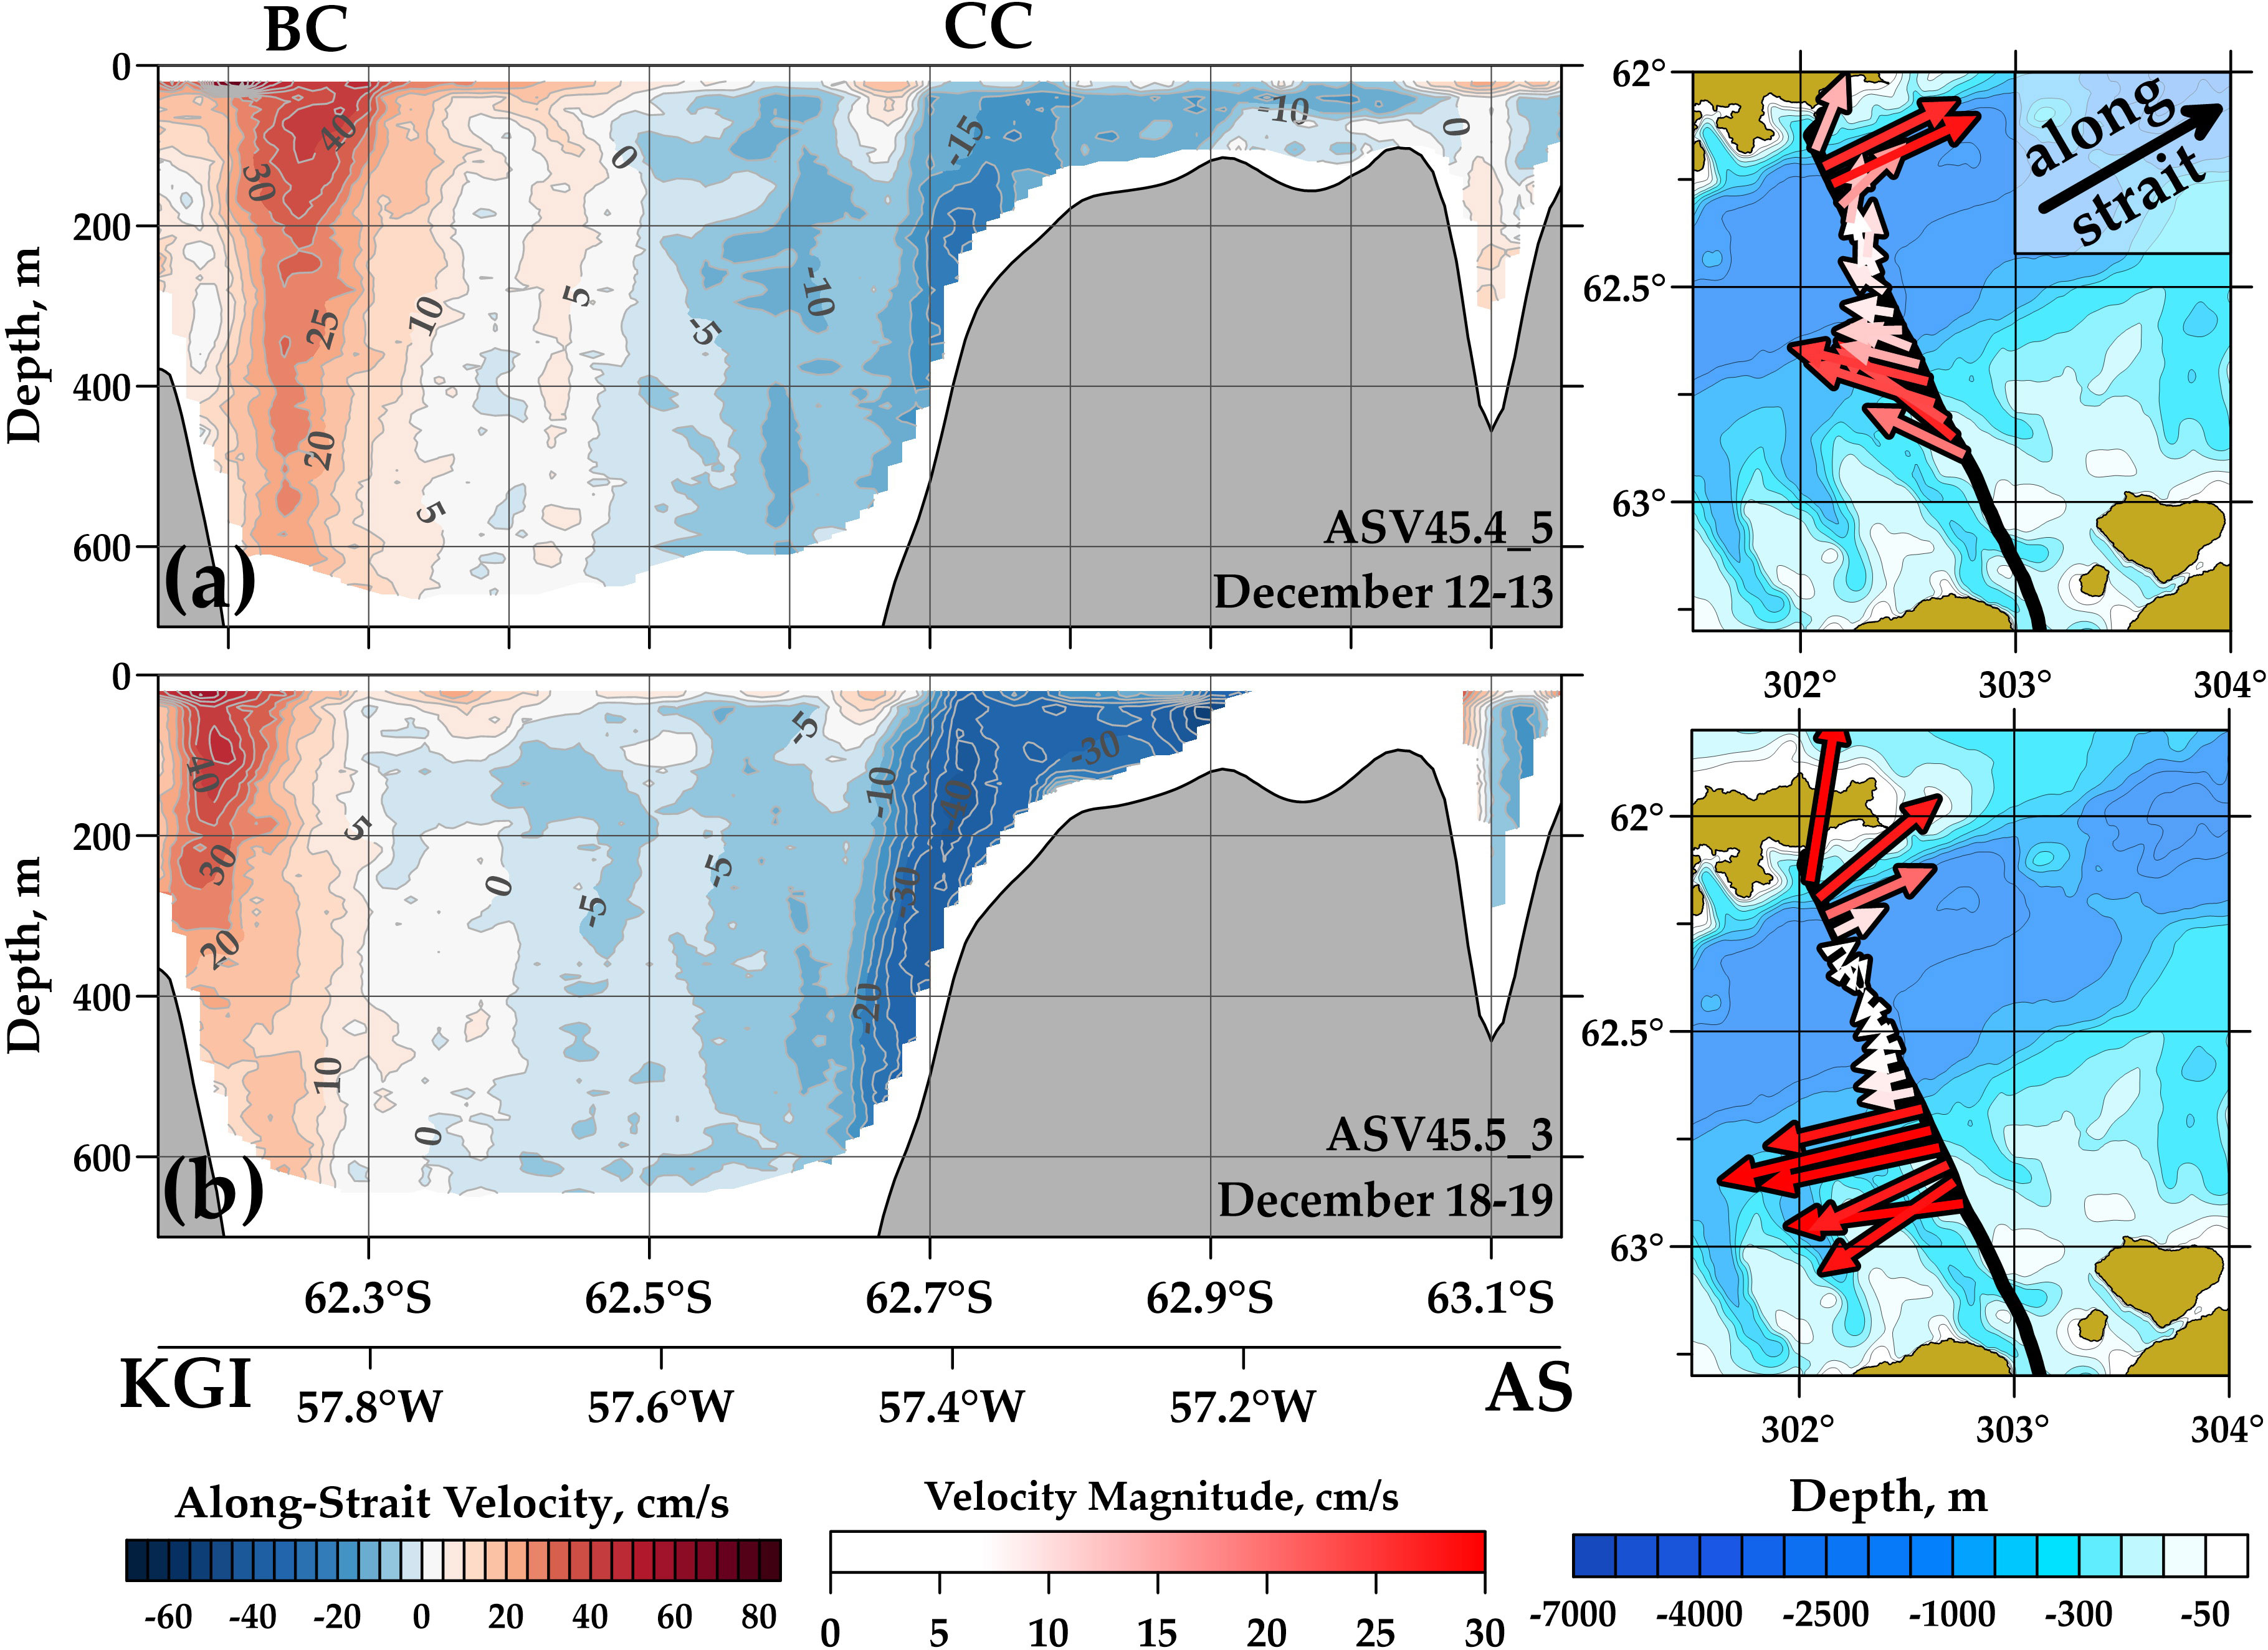
Figure 8 Along-strait velocity distributions at two crossings between King George Island (KGI) and Antarctic Peninsula near the Antarctic Sound (AS) performed on December 12-13 (A) and December 18-19 (B). Positive values of velocity correspond to the east-north-east direction (the exact value is 60° relative to the north; this direction is shown by black arrow in the upper right panel). The velocities were projected to the direction along the strait independently on the orientation of transects. The measurements were performed from the R/V ASV. Locations of the crossings are shown in the right panels together with the depth-averaged SADCP velocities. The ocean bottom is shown by grey color. KGI, King George Island; AS, Antarctic Sound; BC, Bransfield Current; CC, Antarctic Coastal Current.
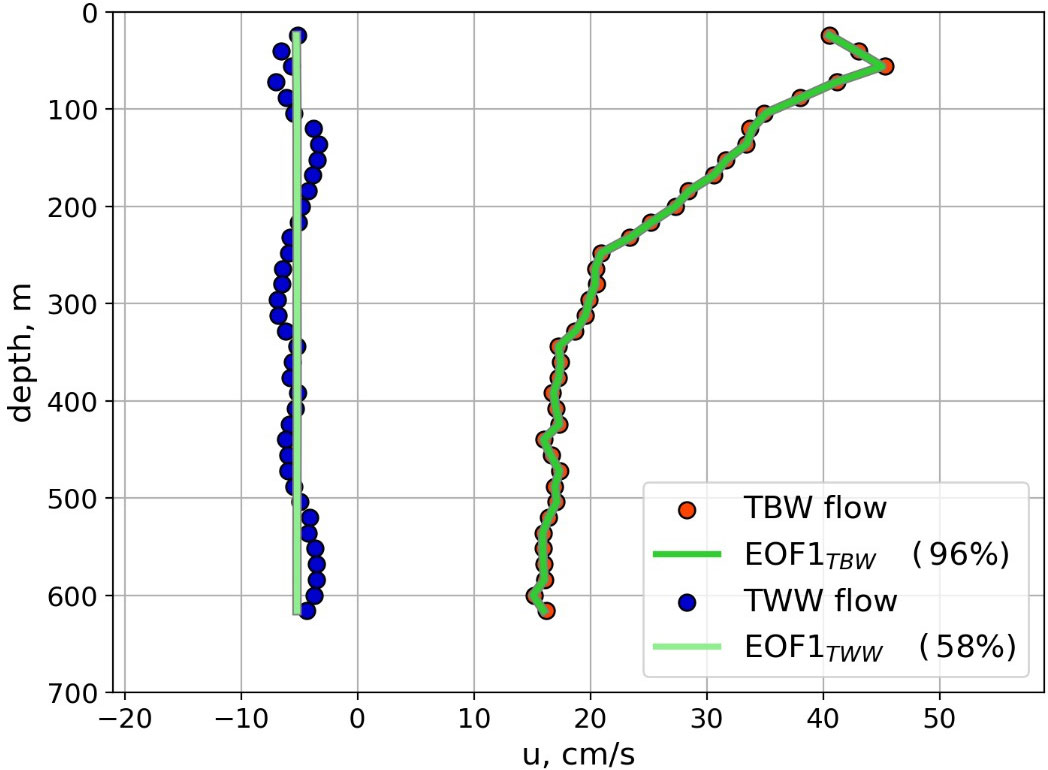
Figure 9 The averaged SADCP along-strait velocity profile in the BC (red dots) and CC (blue dots). Their first EOFs are shown by green and light green lines, respectively. The EOF first modes were scaled to match the mean speed profiles. The percentage of variability explained by the first empirical mode are shown in parentheses.
The BC is characterized by high vertical velocity inhomogeneity, the maximum of the current is located in the subsurface layer at a depth of 100 m and reaches 45 cm/s on average. At depths of 300-350 m, the speed decreases to 15 cm/s and then almost does not change with depth. The variability described by the first EOF mode was 96%, which shows that the vertical distribution of velocities is highly typical for all velocity profiles. This indicates the stability of the vertical structure of the BC. The used time series of observations does not allow us to analyze the variability of the EOF first mode of the BC. The average velocity profile shows that the CC varies slightly with depth and this current is barotropic; the mean velocity is approximately 5 cm/s at all depths. However, the first EOF mode describes only 58% of the dispersion, which indicates significant differences between the averaged and simultaneous velocity profiles. Thus, the vertical structure of the CC is much more variable than the structure of the BC. In addition, the mean profiles shown in Figure 9 indicate that the BC is baroclinic while more than half the variability in the CC is barotropic.
Another two crossings were performed between King George Island and the Antarctic Sound with a 6-day interval in December 2017 (Figure 8). These sections were located close to the previous section between Livingston Island and Antarctic Sound and show quite similar structure of the currents. The maxima of the SADCP velocity in the BC are observed at a distance of 8.1 – 19.0 km from the 200-m isobath; the current width is 17.6 – 26.9 km. The relatively long distance from the shore compared to previous sections can be partly explained by the presence of a deep bay near this section. Due to this bay, the 200-m isobath is located further away from the velocity maxima. The maximum velocity of the BC was 47 cm/s on December 12-13 and 46 cm/s on December 18-19. The CC was more variable. The corresponding maximum velocities were 25 cm/s on December 12-13 and 44 cm/s on December 18-19. The important difference between these two flows consists in their different depth: the BC core is located at the sea surface, while the CC is observed deeper with the maximum velocity at approximately 200-m depth.
The eastern basin of the BS is located between the tip of the Antarctic Peninsula, Joinville, King George, and Elephant islands. The maximum depths of the basin are 2640 m based on the GEBCO2019 database; the basin is confined by shallow ridges with the maximum depths of no more than 750 m. The maximum depth of the shallow northern ridge between King George and Elephant islands is 480 m. Water exchange between the Drake Passage and eastern BS occurs mainly through this passage. In addition, there is also a deeper (maximum depth is 860 m according to the GEBCO2019 database) though narrower pathway around the east side of Clarence Island. The kinematic structure of currents in the passage between King George and Elephant islands was measured three times: on January 21-22, February 13-14, and December 19-20 of 2017 (Figures 10A–C, respectively).
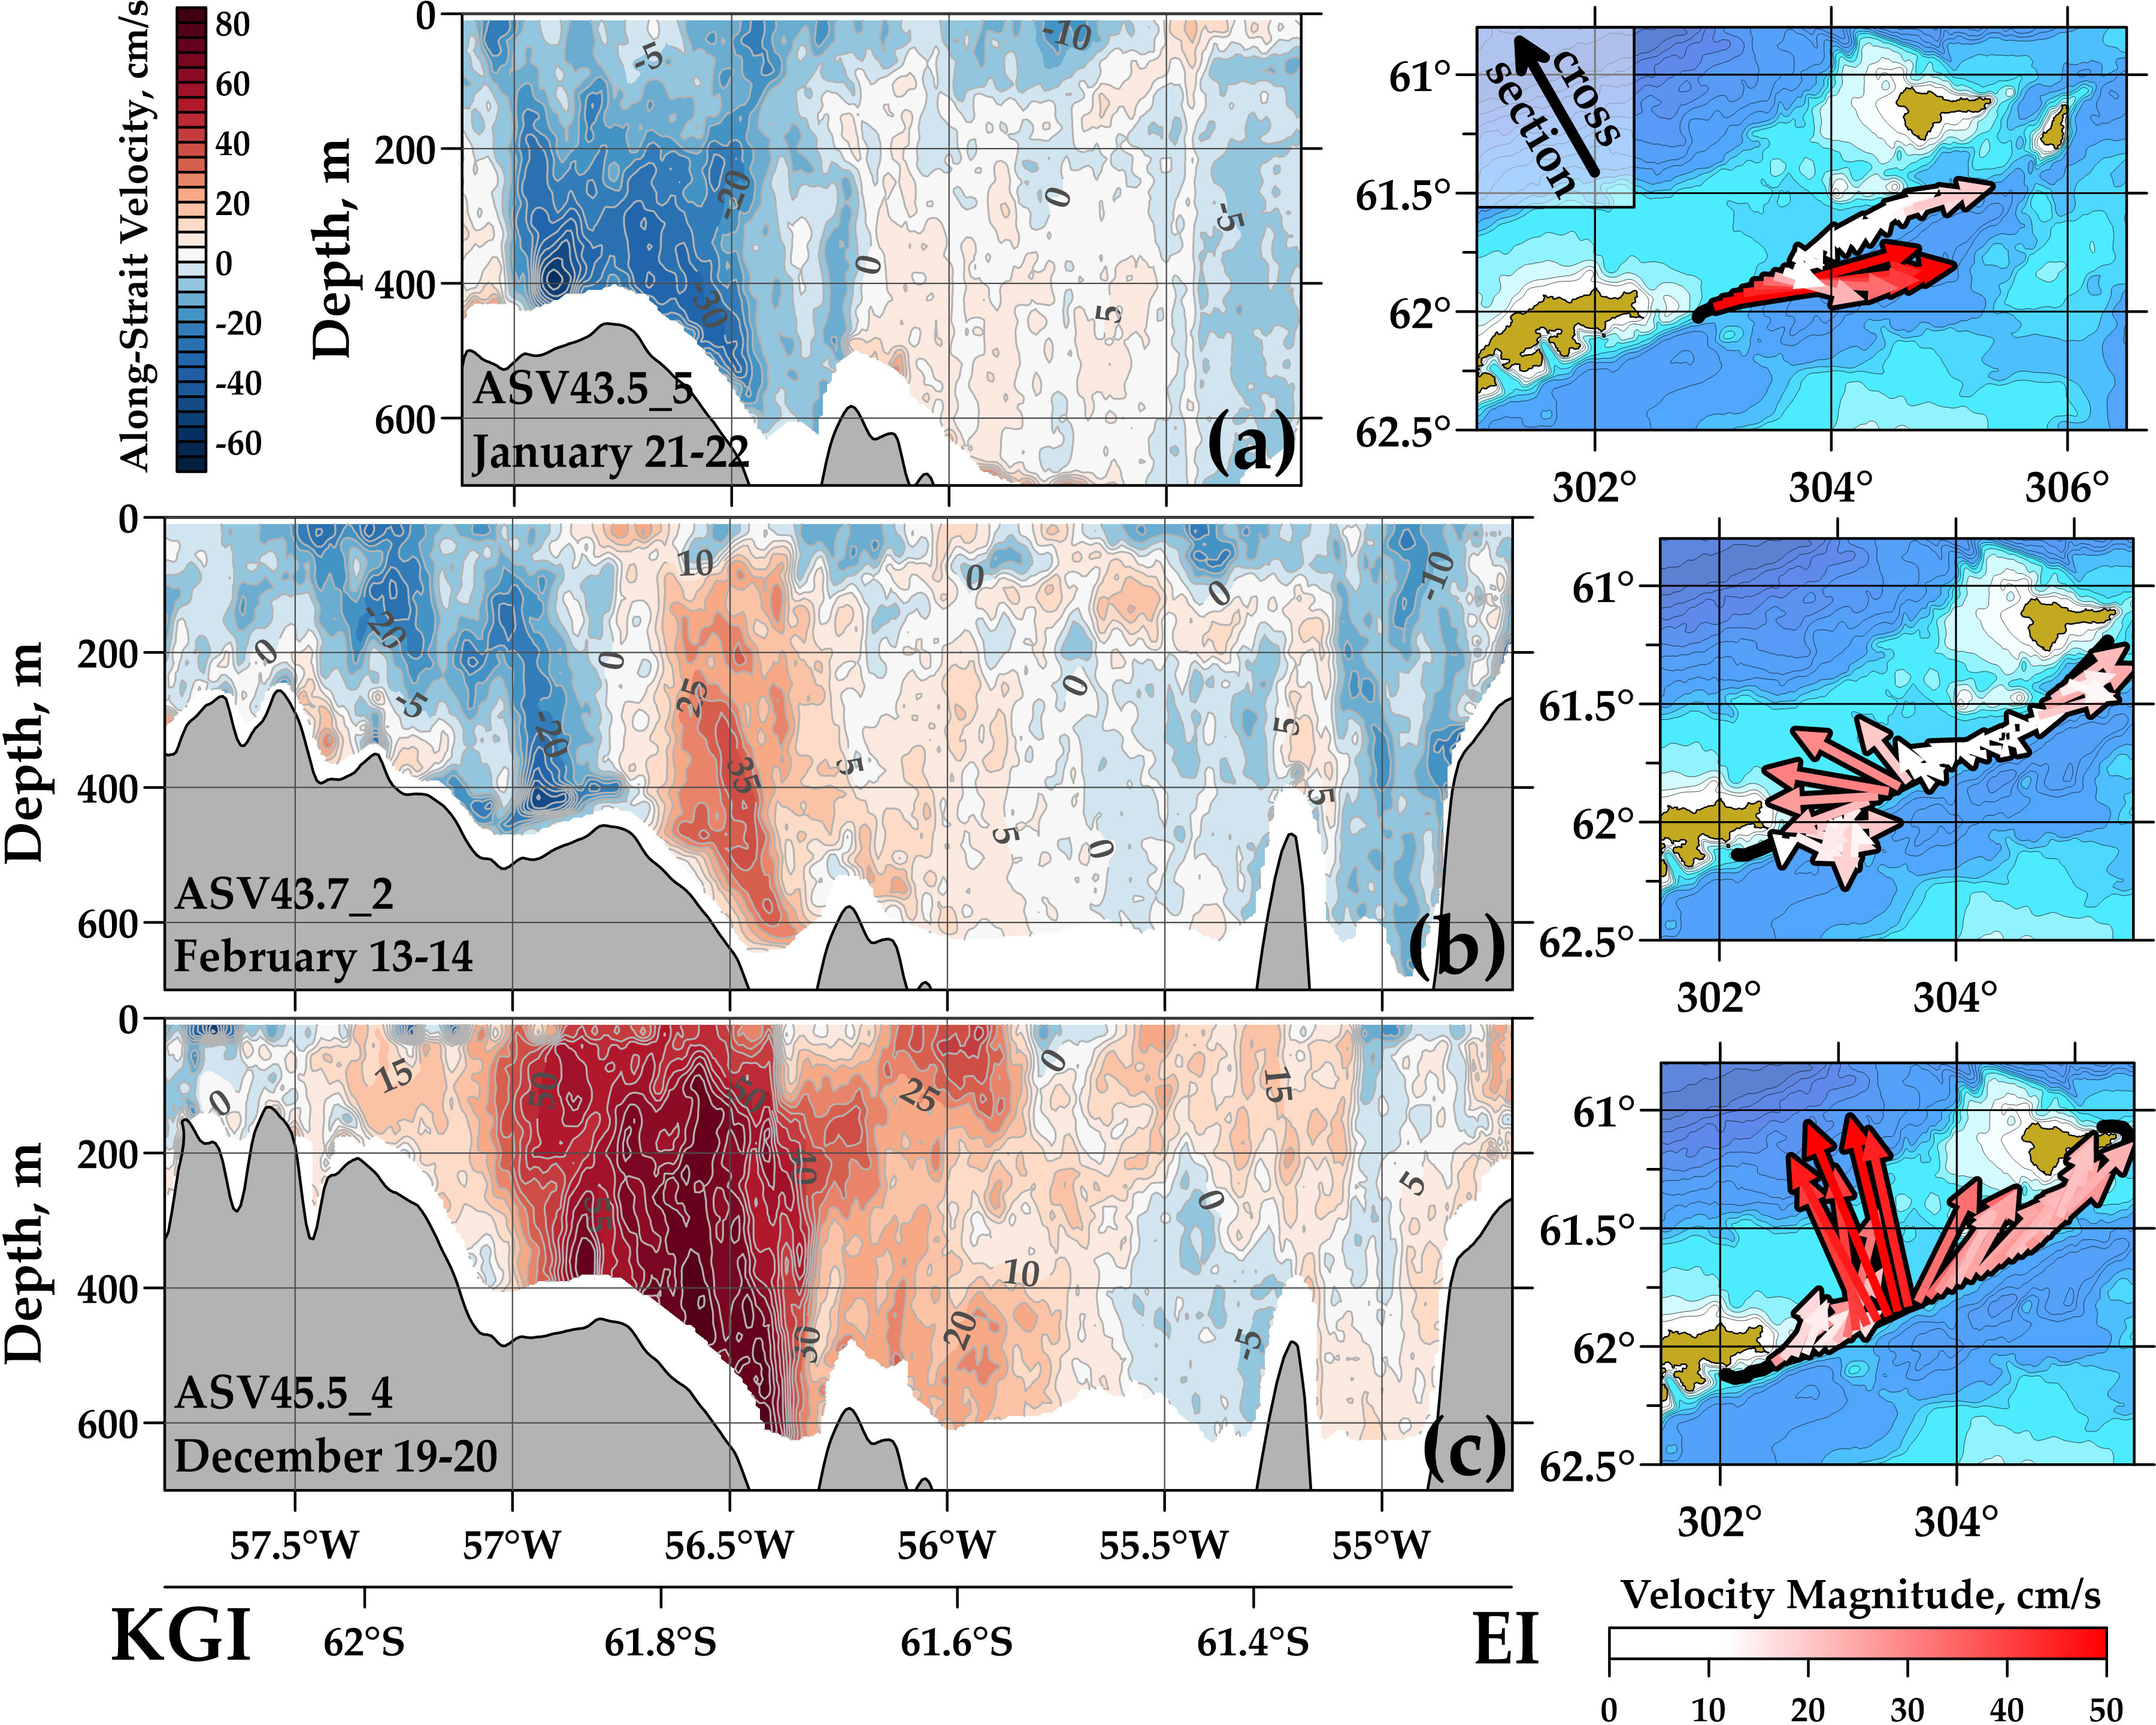
Figure 10 Cross-section velocity distributions at three crossings between King George Island (KGI) and Elephant Island (EI) performed on January 21-22 (A), February 13-14 (B), and December 19-20 (C), 2017. The measurements were carried out from the R/V ASV. Positive velocities correspond to the north-north-west direction (the exact value is 330° relative to the north; this direction is shown by black arrow in the upper right panel). The velocities were projected to the direction along the strait independently on the orientation of transects. Locations of the crossings are shown in the right panels together with the depth-averaged SADCP velocities. The ocean bottom is shown by grey color. KGI, King George Island; EI, Elephant Island.
Mean counterclockwise circulation around the SSI islands leads to the presence of a northward current through the section between King George and Elephant islands (Sangrà et al., 2017). This current intensifies over the slope of King George Island between isobaths of 400 and 700 m and sometimes reaches a velocity up to 82 cm/s (Figure 10C). Unlike the BC, the flows through this section are highly variable. The analyzed three measurements show totally different circulation patterns: the velocities of the current change from 58 cm/s southward to 82 cm/s northward. The current intensifies towards the bottom; the maximum is located over the 400-m isobath. Sangrà et al. (2017) also reported the presence of an anticyclonic eddy between King George and Elephant islands, which is observed in the SADCP data. The authors of this paper showed that the observed circulation is explained by the behavior of the BC as a buoyant gravity current. Our new SADCP data also show that this flow between the SSI and Elephant islands are much more variable than the upstream flow along King George Island. We can assume that, depending on external conditions, the BC sometimes propagates further east to Elephant Island, and sometimes turns north and recirculates around the SSI. However, more measurements are needed for the analysis of this variability.
Two crossings were performed along the section between the tip of the Antarctic Peninsula and Elephant Island (Figure 11). The CC is clearly seen at this section. The velocities of this flow reach 25-26 cm/s. The width of the current is 30 km during both crossings. High northeastern velocities in the northern part of the section correspond to the local circulation around Elephant Island. The depths of the velocity maximum are 200-300 m, which is the same as at sections across the central basin. Thus, we can conclude that the CC is located mainly at depths more than 100 m and usually it is not observed in the surface layer. On the contrary, the BC is pronounced at the sea surface. This difference is important for our further comparison between SADCP and altimetry-derived surface geostrophic velocities, which will be discussed in Section 4 in more detail.
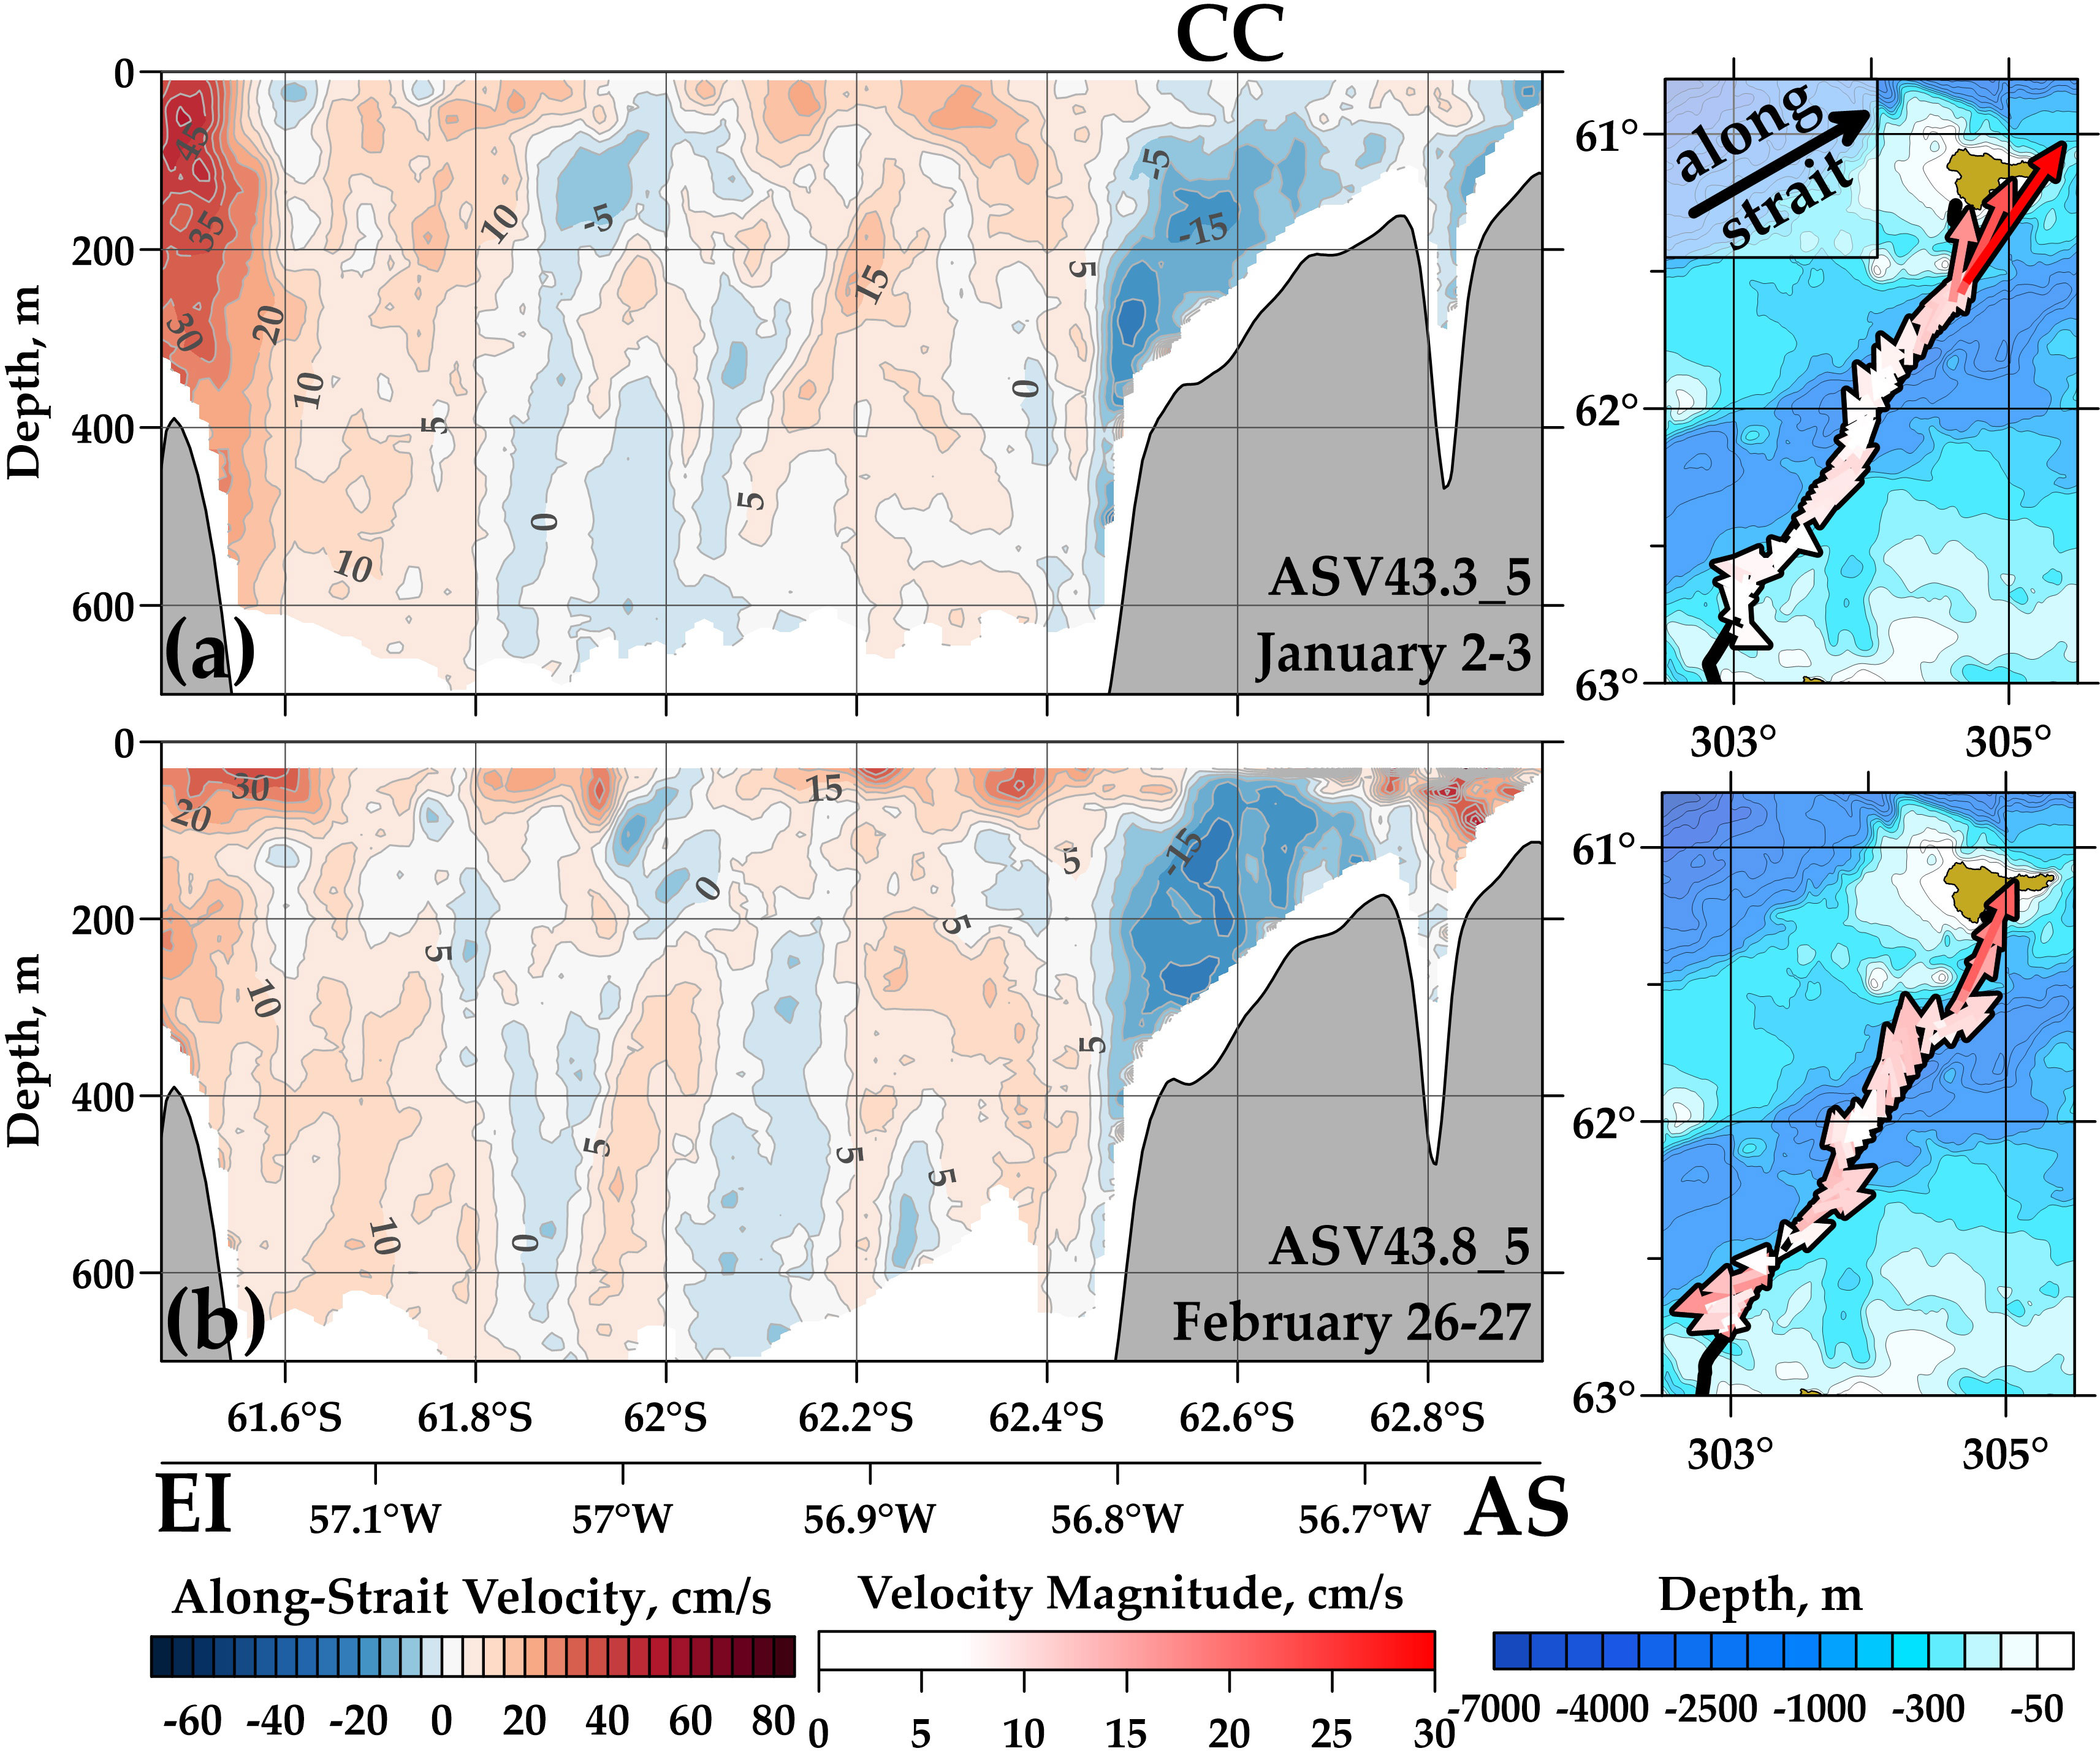
Figure 11 Along-strait velocity distributions at two crossings between Elephant Island (EI) and the Antarctic Sound (AS) performed on January 2-3 (A) and February 26-27 (B), 2017. Positive values of velocity correspond to the east-north-east direction (the exact value is 60° relative to the north; this direction is shown by black arrow in the upper right panel). The velocities were projected to the direction along the strait independently on the orientation of transects. The measurements were performed from the R/V ASV. Locations of the crossings are shown in the right panels together with the depth-averaged SADCP velocities. The ocean bottom is shown by grey color. EI: Elephant Island, AS: Antarctic Sound, CC: Antarctic Coastal Current.
Altimetry-derived surface circulation is known to reproduce the main circulation patterns at time scales longer than about 20 days and these data are widely used to investigate the spatial and temporal variability of the surface currents in the open and deep ocean. However, the use of altimetry for studies of circulation in narrow straits is restricted due to the low resolution of these data. In this work, we compare the SADCP data and the altimetry-derived geostrophic velocities along the sections within the BS. Mean surface geostrophic circulation in the BS region and southern Drake Passage reconstructed from the MDT2018 data (Mulet et al., 2021) is shown in Figure 12; only mean velocities higher than 3 cm/s are shown. The data southeast of the Antarctic Peninsula are not available because of ice cover in this region, which was present even in the austral summer during the considered periods. One can see that the mean altimetry-derived velocities reproduce the BC and spatial variations of its intensity. Observed geostrophic velocities are in a good agreement with the published data. Thus, the most intense part of the current is located to the south of King George Island; the velocities in the western Bransfield Strait and between King George and Elephant islands are much lower. Our direct velocity observations confirm this structure of the current. Both published data and satellite altimetry suggest anticyclonic circulation around the SSI. According to the altimetry data, the BC is the strongest flow in the BS. Its velocity reaches 23 cm/s south of KGI island and decays to the west and east of the island. In general, altimetry indicates anticyclonic circulation around the SSI. North of the SSI, the maximum velocities directed to the southwest are 9 cm/s. The same anticyclonic circulation is observed around islands and underwater rises. For example, mean velocities of currents around Elephant Island and a rise at 54°W; 61.8°S reach 16 cm/s. This anticyclonic circulation can be caused by the interaction between the eastward flow of the ACC and bottom topography. Conservation of potential vorticity leads to anticyclonic rotation over underwater mountains.
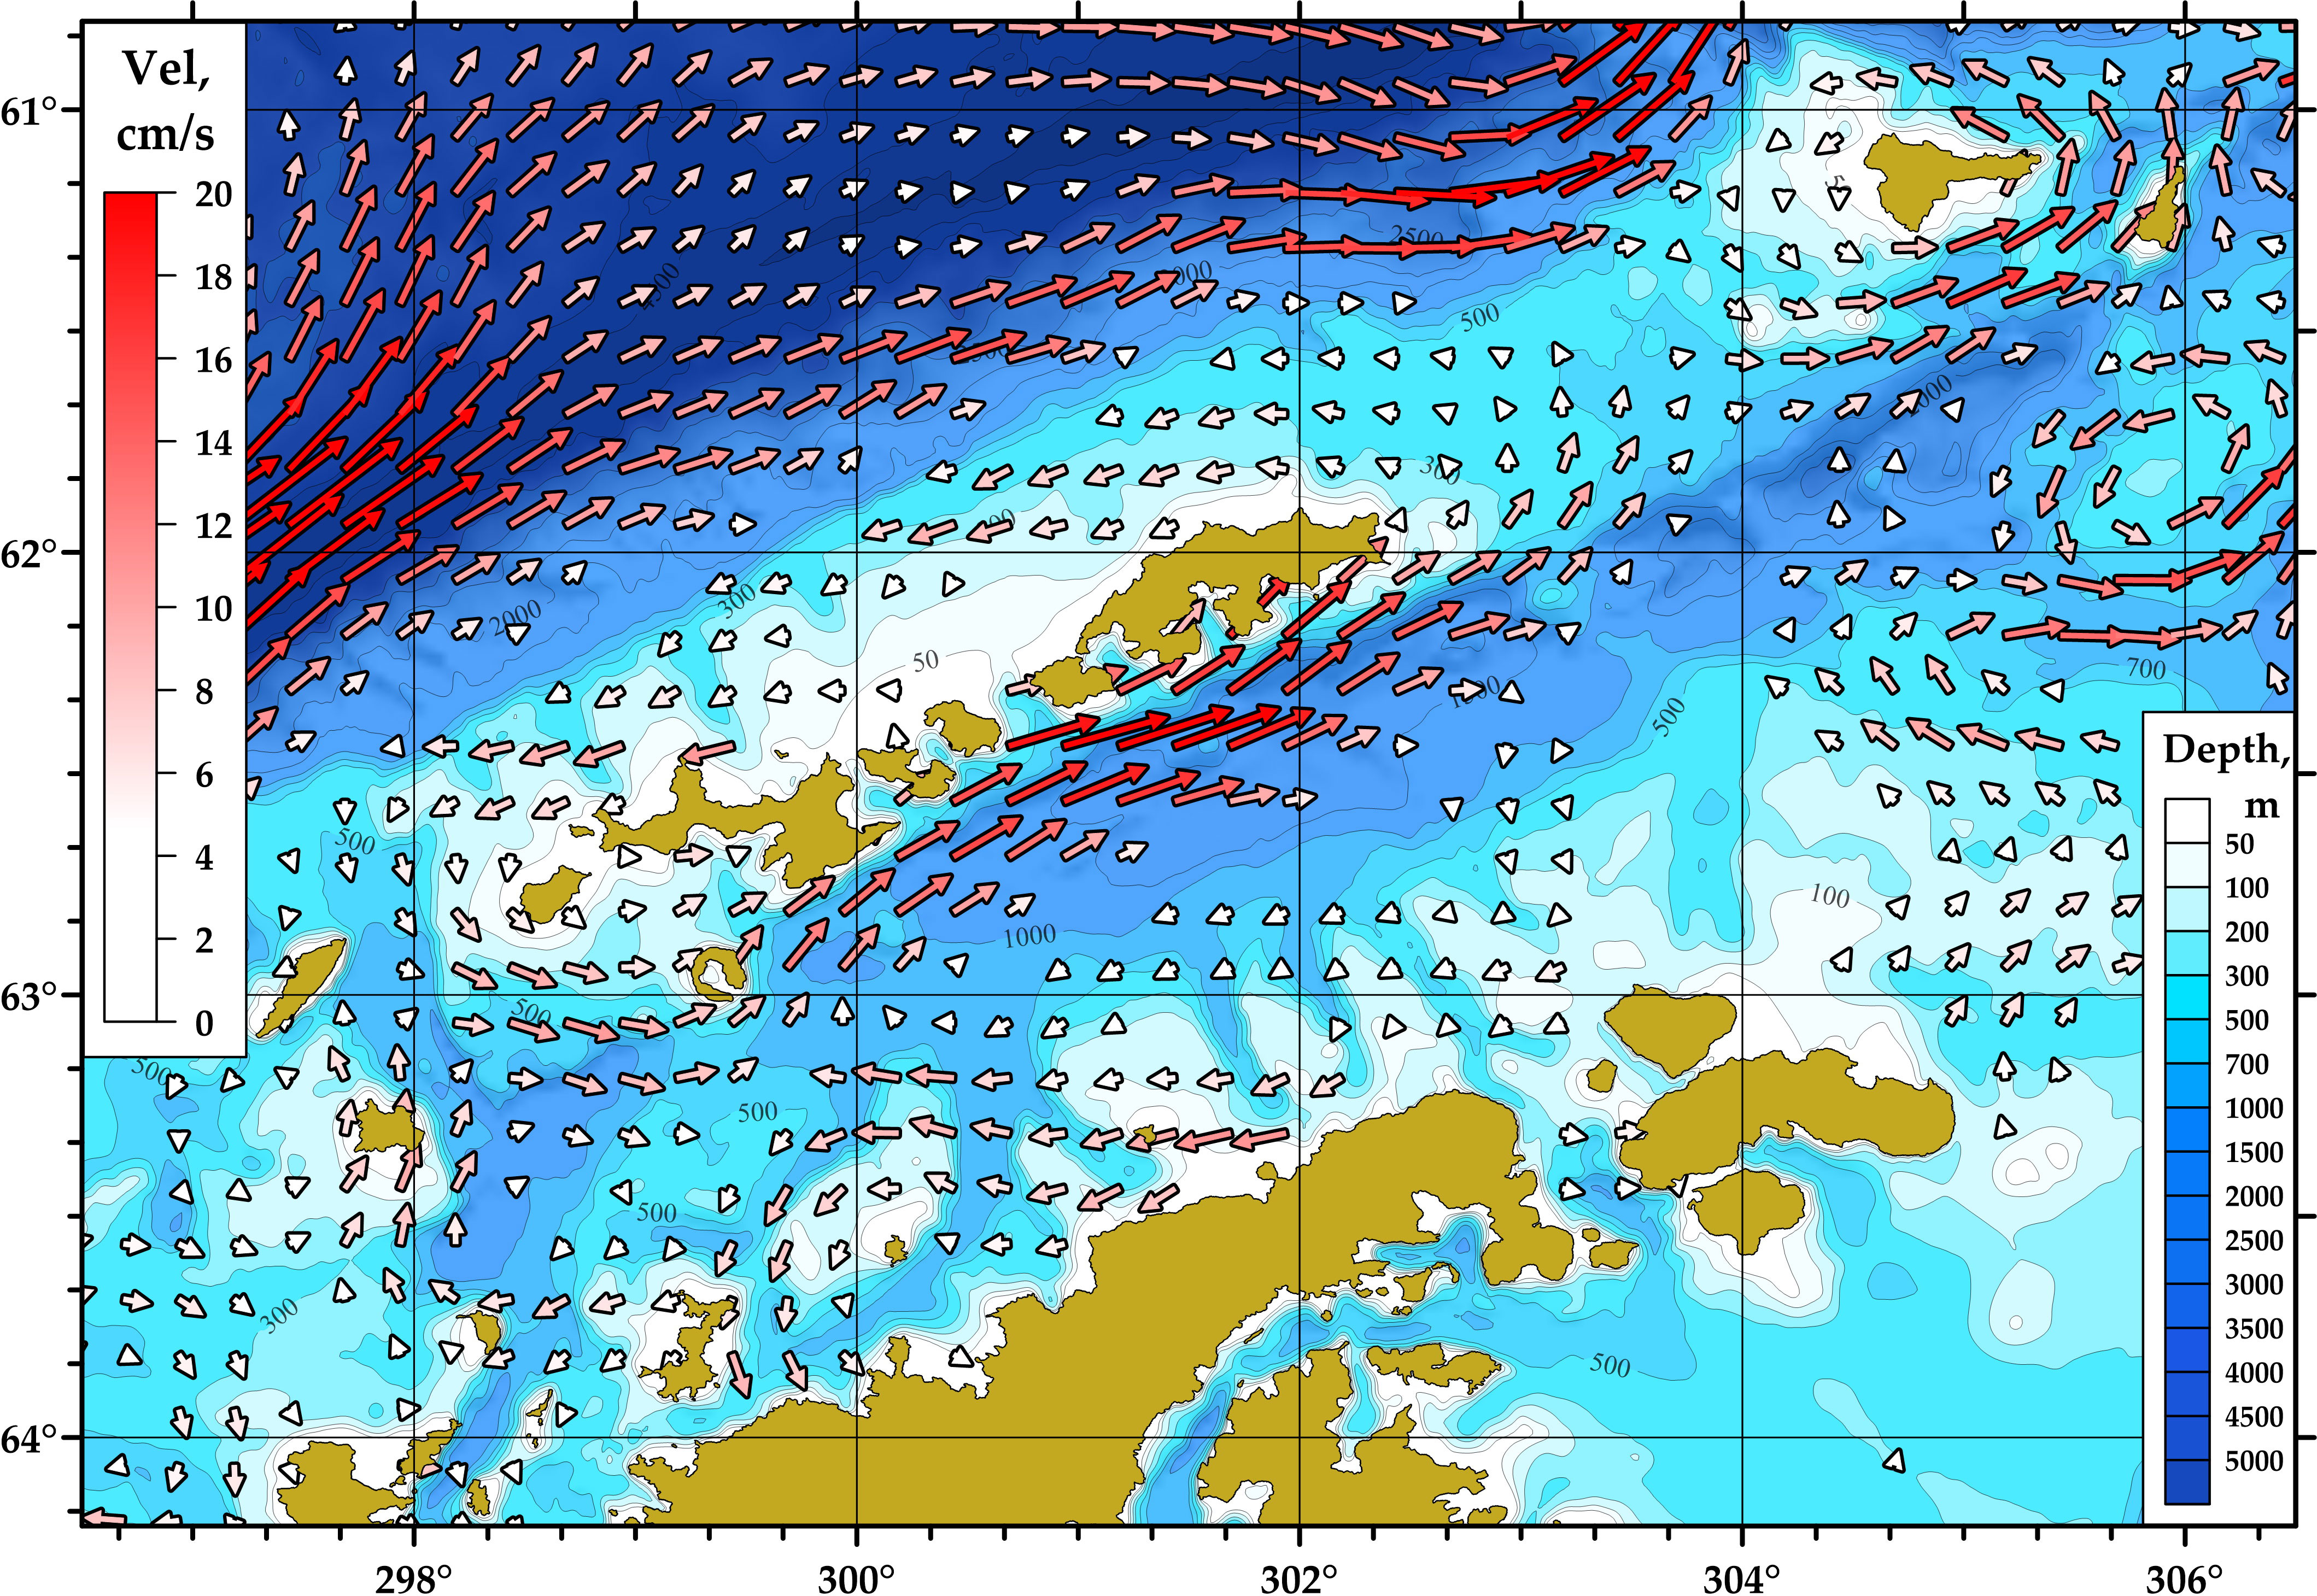
Figure 12 Mean geostrophic circulation in the region of the Bransfield Strait based on geostrophic velocities derived from the MDT data. Velocity magnitude is shown by colored arrows only for the mean speeds exceeding 3 cm/s.
Unlike the BC, the CC is not observed in the altimetry data despite relatively high velocities of this current. This flow transports relatively cold and saline waters in the deeper layers. These waters flow in deep layers due to high density while the velocities at the sea surface are not high (see Figures 8, 11). The altimetry data confirms that there is no significant surface flow around the Antarctic Peninsula. Thus, our analysis confirmed the baroclinic nature of the BC, whose maximum velocities are observed at the sea surface, and the more barotropic nature of the CC.
Comparison between SADCP velocities and synoptic mesoscale sea surface geostrophic velocities is shown in Figure 13. All these sections are located between the SSI and Antarctic Peninsula and crossed the Bransfield and Antarctic Coastal currents. We used two gridded altimetry products of 0.1° and 0.25° resolution. The SADCP data were averaged in the upper 700-m layer; the altimetry data were interpolated to the points of measurements. One can see that the differences between the mesoscale geostrophic velocities and in situ data are significant. However, there is a qualitative agreement between altimetry-derived and in situ velocities in the intense BC. The other parts of the sections are characterized by significant discrepancies between considered velocity data sets. Overall, the altimetric mapping tends to smooth the fronts and reduce the velocities of the associated currents, which is observed in the BS. The mean velocities of the BC based on different data are shown in Table 2; our analysis is based on all available 50 sections. Generally, the SADCP velocities are 1.8 times higher than the velocities derived from the altimetry data of 0.1° resolution and 2.2 times higher than the altimetry data of 0.25° resolution (Table 2). Thus, the altimetry of high 0.1° resolution reproduces circulation slightly better than the data of 0.25° resolution and should be used for the analysis of currents in narrow straits instead of standard low-resolution altimetry. As for directions of the currents, both datasets show high discrepancies between SADCP and geostrophic velocities. Standard deviations between satellite-derived and measured velocity directions are high for both altimetry datasets and vary between 43 and 75 degrees (Table 2). Depending on the basin of the BS, correlation coefficient between the geostrophic and SADCP velocities varies between 0.32 and 0.46 for the low-resolution altimetry and between 0.31 and 0.51 for the high-resolution altimetry. Thus, the observed discrepancies in the mesoscale values of velocity are high and time averaging is needed for the analysis of altimetry-derived surface circulation. We conclude that simultaneous satellite-derived geostrophic velocities cannot be used for studies of the circulation within the BS; however, after averaging these data over a month and more we get more reliable velocity data (Figure 12). One of the main reasons of these discrepancies are errors in tidal models which are used during processing of the altimetry data. It is known that numerical models reproduce tides in the region of the BS with high errors (King and Padman, 2005); these errors are important for daily altimetry maps but become insignificant after averaging data from several satellite flyovers.
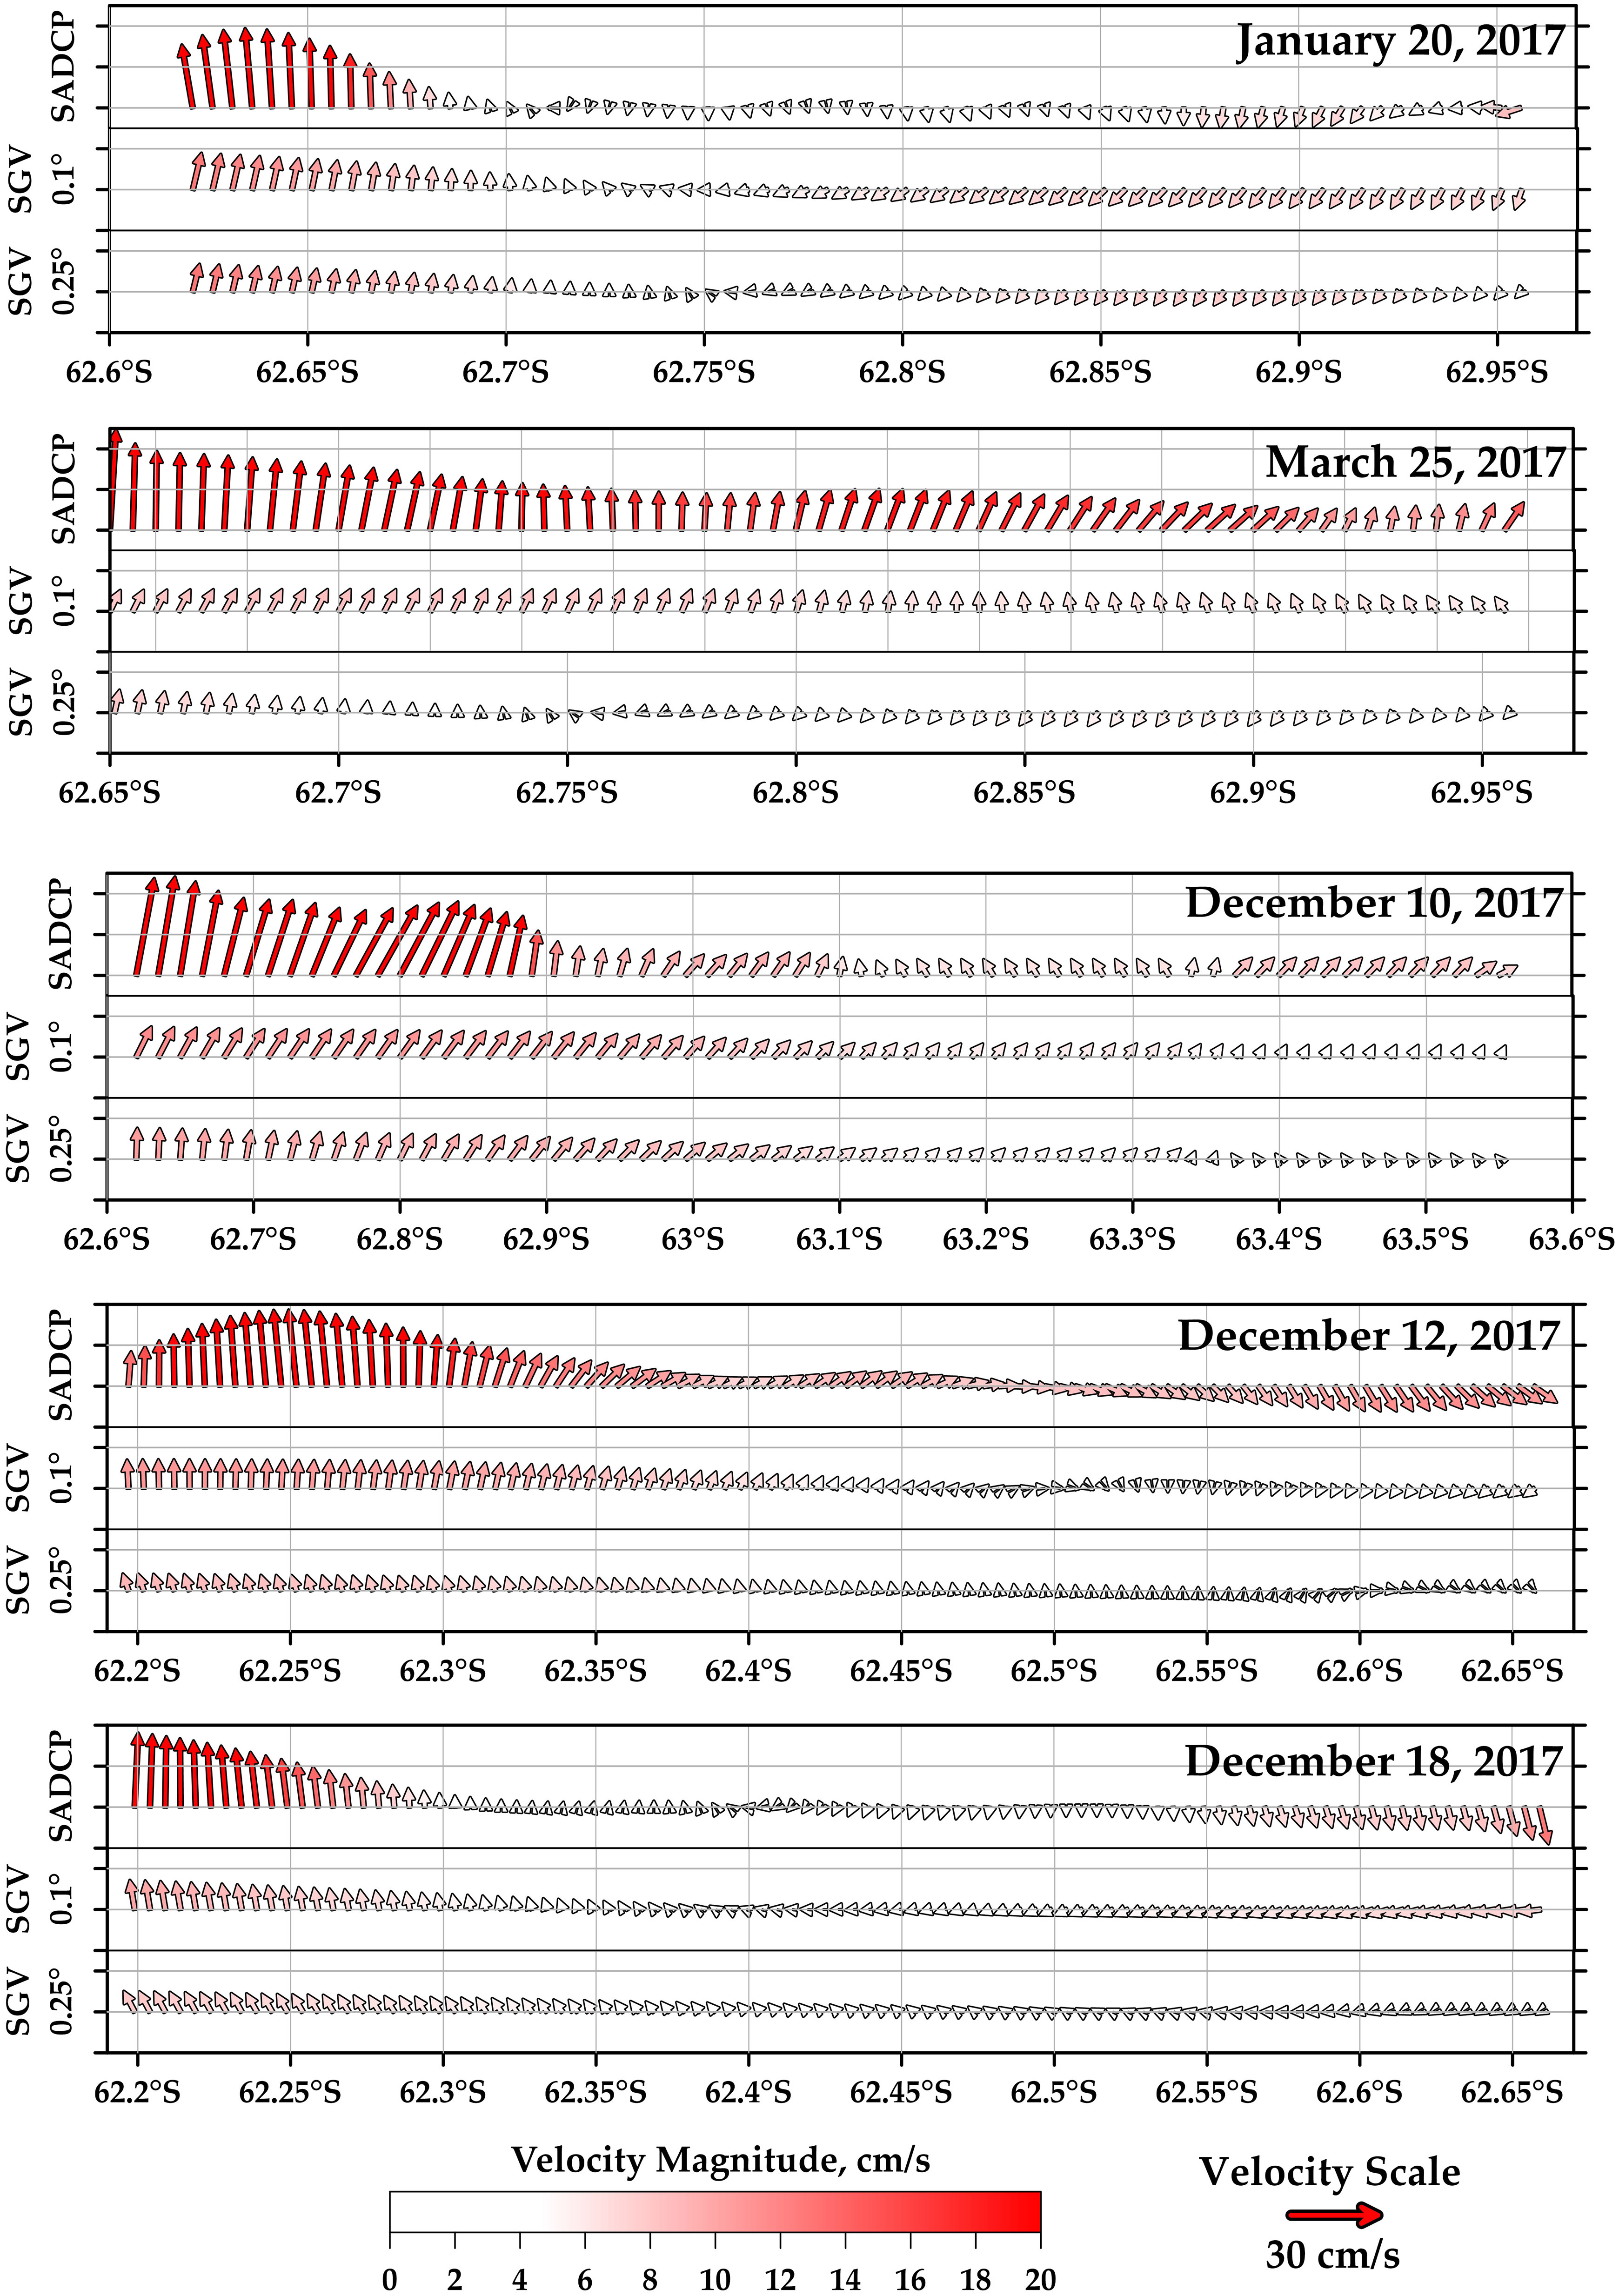
Figure 13 Comparison between SADCP velocities averaged over the upper 700 m and sea-surface geostrophic velocities derived from altimetry of 0.1° and 0.25° resolution along five sections in the Bransfield Strait.
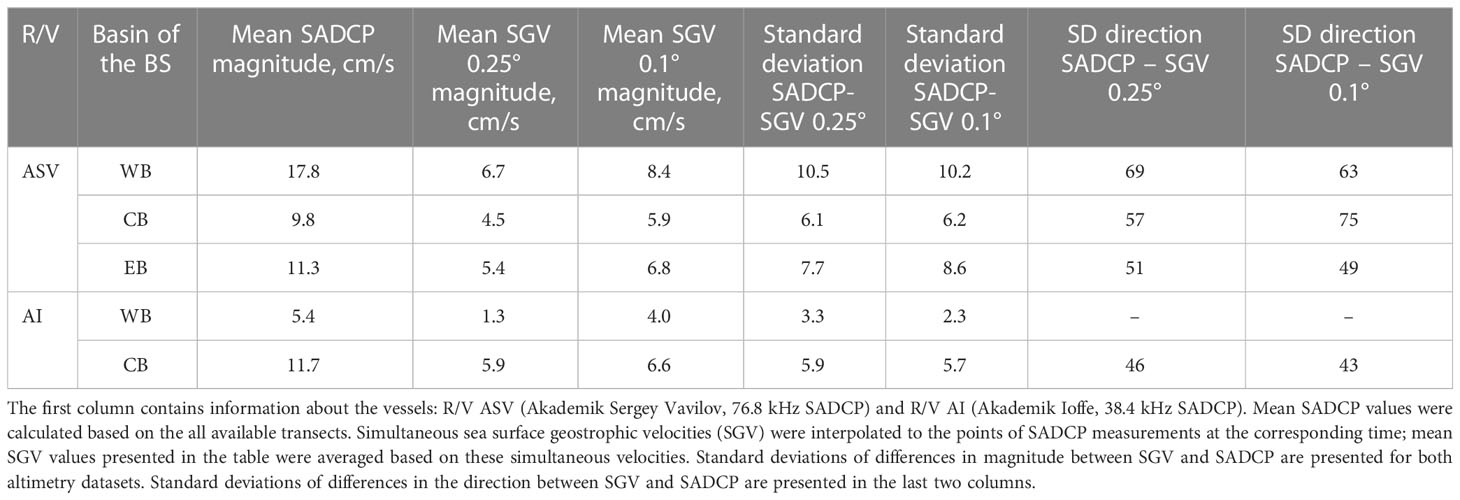
Table 2 Comparison between measured SADCP velocities and calculated geostrophic velocities based on satellite altimetry of 0.25° and 0.1° resolution.
Since the mean geostrophic velocities averaged over sufficient period of time reproduce the shape of the BC, we analyzed seasonal variability of the current based on satellite altimetry. The data were averaged over a period between 1993 and 2020 in different seasons, including January-March, April – June, July – September, October – December (Figure 14). One can see that qualitatively ocean circulation patterns in the strait remain quite similar all year round. However, there are quantitative variations of the intensity of currents between different seasons. Using averaged geostrophic velocity fields, we calculated the maximum surface velocity of the BC; this maximum is located to the south of King George Island. The maximum velocities are: 19.6 cm/s (January-March), 20.2 cm/s (April-June), 18.9 cm/s (July-September), and 17.0 cm/s (October-December). One can see that despite qualitative agreement between the velocity fields in different seasons, the observed change in velocity between different seasons exceed 15%.
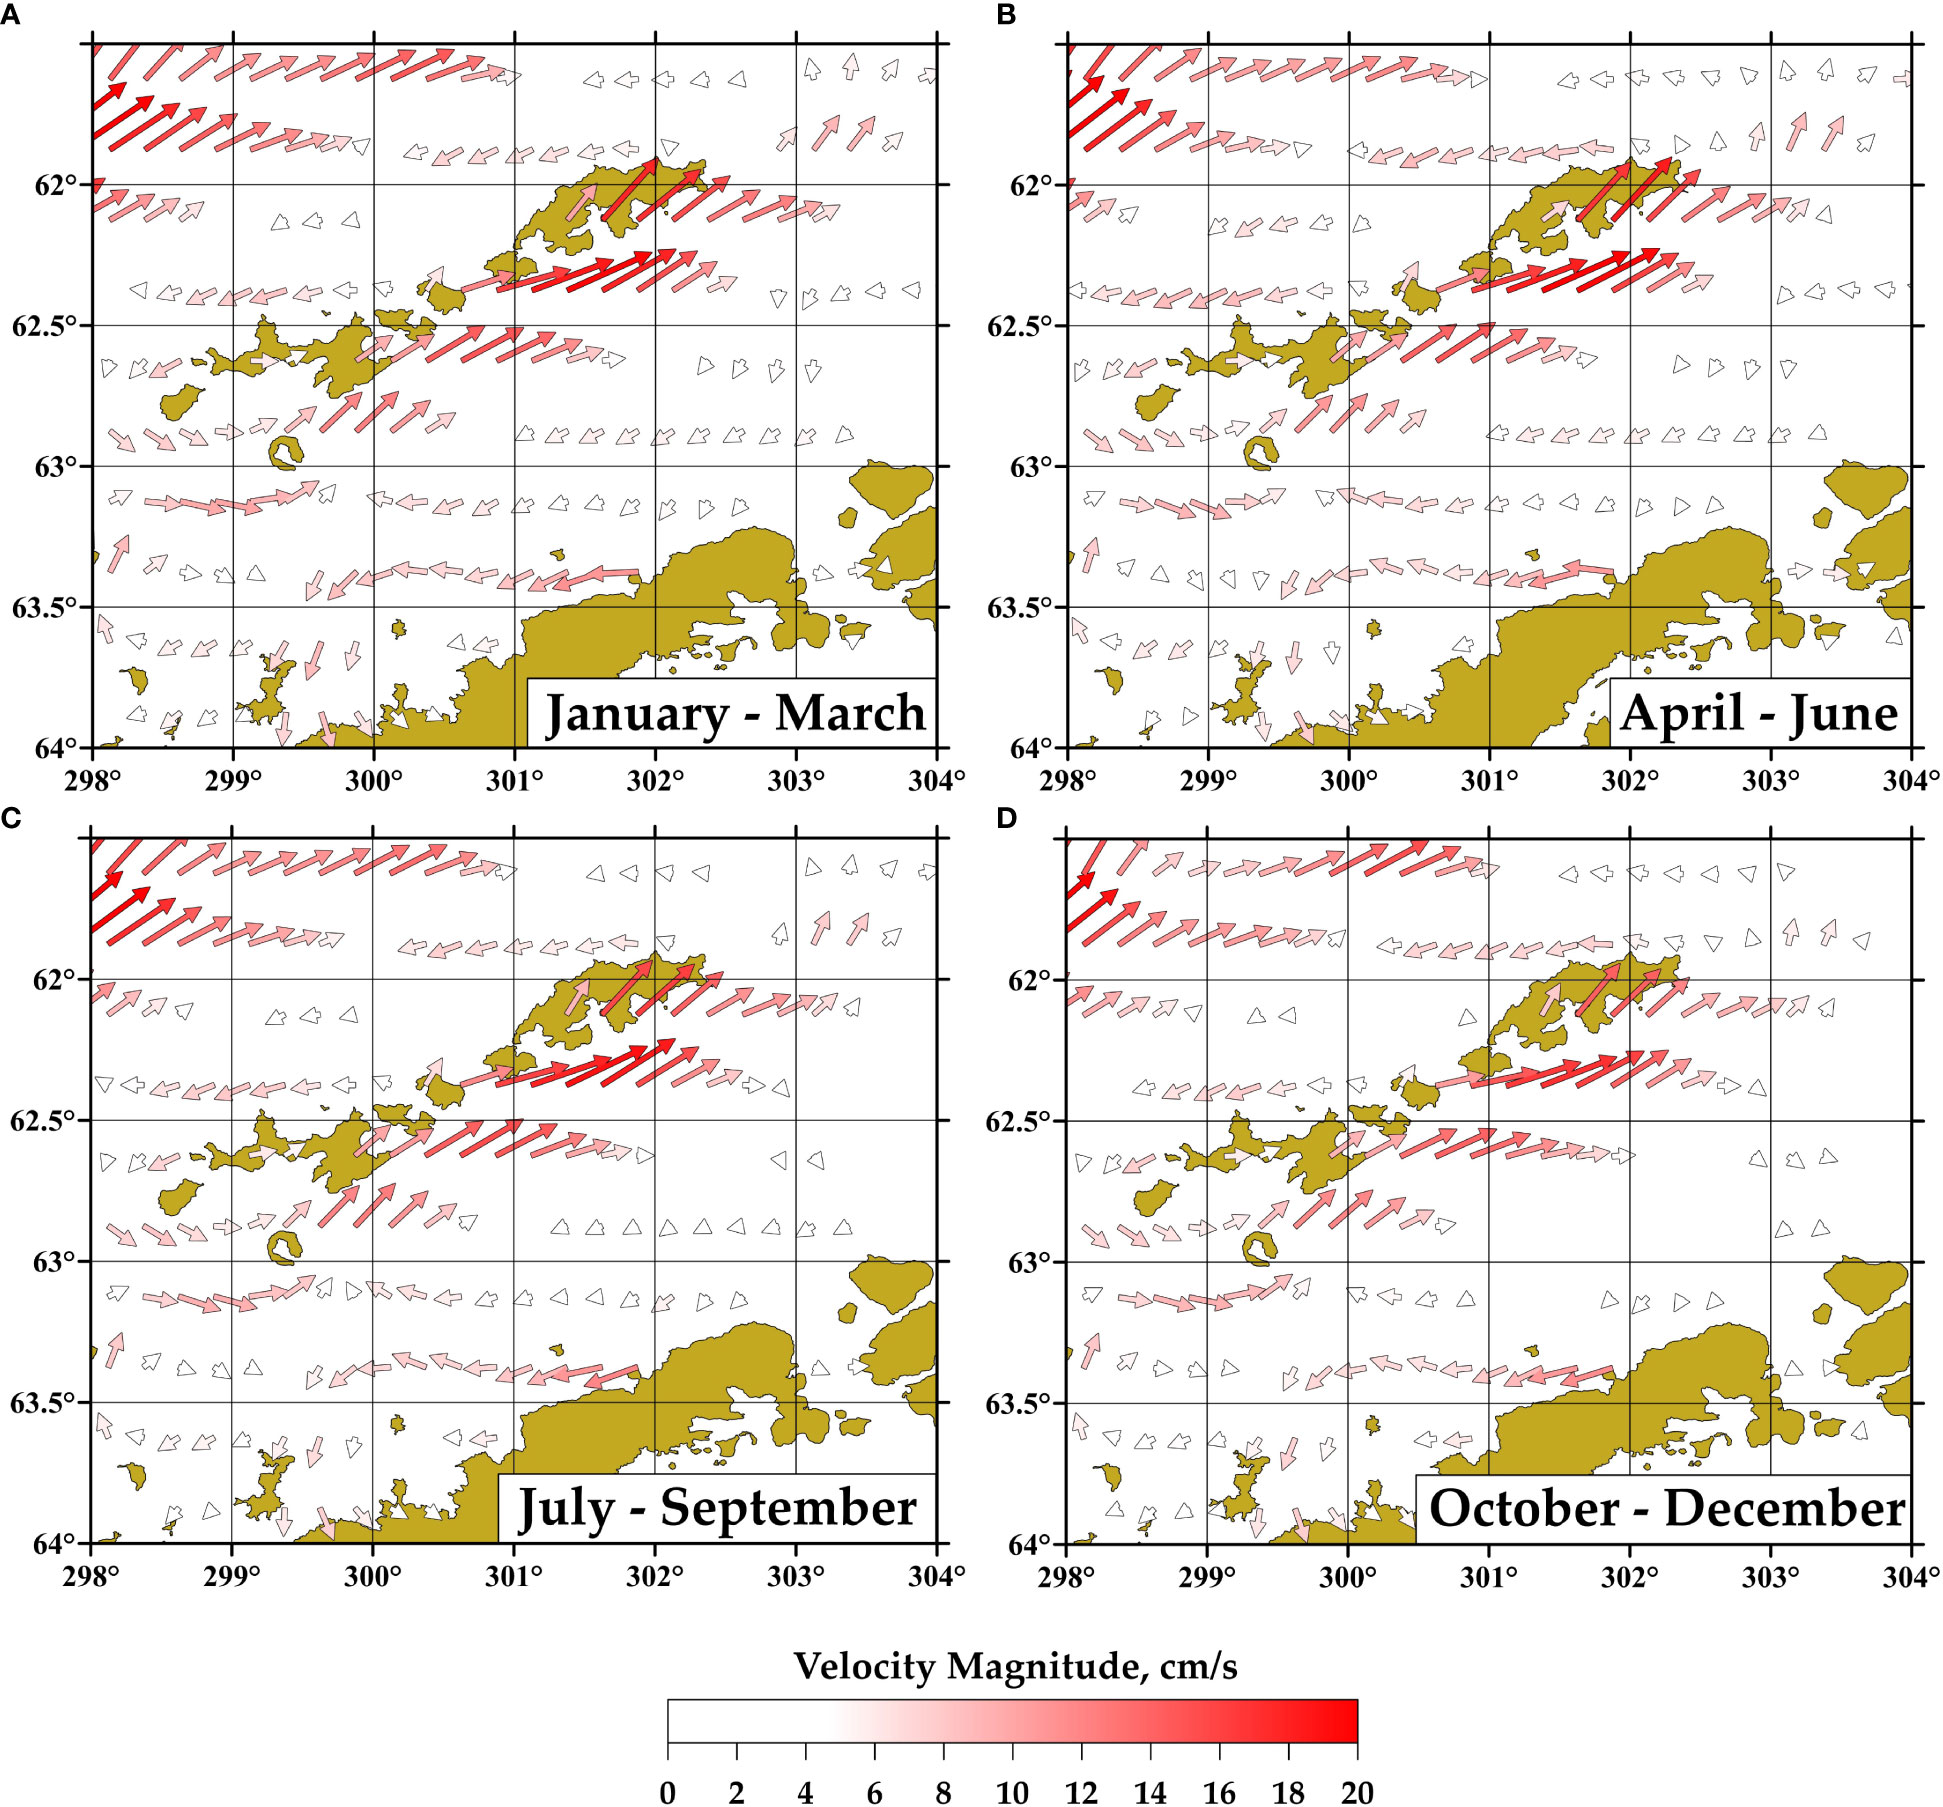
Figure 14 Austral summer (A), autumn (B), winter (C), and spring (D) geostrophic circulation at the sea surface derived from low-resolution 0.25° satellite altimetry data averaged over the 1993 – 2020 period. Velocity magnitude is shown by colored arrows only for the mean speeds exceeding 3 cm/s.
This study presents a new dataset of direct velocity measurements performed in a relatively well-studied region near the Antarctic Peninsula. Previously, ocean currents in the strait were studied using geostrophic calculations based on hydrographic data (Hofmann et al., 1996; López et al., 1999; Gomis et al., 2002; Sangrà et al., 2011; Sangrà et al., 2017; Mukhametianov et al., 2022). Such approach allowed the scholars to determine main currents in the region and estimate their velocities and transports along the strait. The geostrophic approximation was proved to be helpful at this stage; however, our study confirms that the currents in the strait have very complex vertical structure which are not revealed by the geostrophic calculations. The same result was shown in (Mukhametianov et al., 2022). The main causes of the limited accuracy of such approach are well-known. In particular, strong currents in the near-bottom layer are usually not revealed by the geostrophic calculations. These currents are especially strong between the SSI and Elephant Island (Sangrà et al., 2017) (Figure 10); strong currents are also observed along the Antarctic Peninsula (Figure 11). Very complex bathymetry in the strait makes the assumption of a layer of no motion inaccurate. These limitations lead to the importance of direct velocity observations in the strait.
Savidge and Amft (2009) and Veny et al. (2022) presented a large dataset of SADCP measurements in the West Antarctic Peninsula region. In particular, Veny et al. (2022) show that the BC is strong and present in all seasons, with a large barotropic component not revealed by the hydrography-based velocities. This study revealed several local ocean circulation patterns including currents in the Boyd and Gerlache straits and the area between Anvers and Brabant islands. This dataset was collected using 150 kHz SADCPs which allows us to study circulation in the upper 400 m ocean layer. The main difference of the dataset presented in this work is that we used the SADCP systems with frequencies of 75 kHz and 38 kHz. Such systems allow us to collect velocity data in the 1000 m upper layer. LADCP measurements allow us to study currents in the BS from the sea surface to the bottom (Morozov, 2007); these measurements were performed at one transect in the central basin and revealed the structure of the BC in deep layers. There are studies which are based on low-frequency SADCP (Morozov et al., 2021; Polukhin et al, 2021), but the authors of these studies analyze the currents only at one section between the SSI and Antarctic Peninsula and do not study spatial variations along the currents in the strait. Our measurements complement the existed data and show the spatial structure of currents in several locations of the strait not revealed in the previous studies. In particular, the presence of anticyclonic circulation around Deception Island was found. The velocity field observed at several crossings between the SSI and Elephant Island differ in some extent from the previously published results (Sangrà et al., 2017); the BC deepens and becomes more variable in this location. As for the western part of the strait, the CC is observed at the section between Trinity and Deception islands (Figure 4). This is the first signature that this flow can be observed as far west. Previously it was suggested that all waters of the Weddell Sea origin recirculate within the central basin (Damini et al., 2022; Wang et al., 2022). One of the interesting ocean circulation features is the presence of anticyclonic eddies in the central part of the BC (Sangrà et al., 2011). No such eddies were observed in our SADCP data. Further SADCP measurements accompanied by hydrographic measurements are needed for this purpose.
The comparison between field current measurements and satellite altimetry were performed in different regions of the Southern Ocean in numerous works. For example, Barré et al. (2011) compared SADCP measurements with altimetry-derived geostrophic velocities at a transect across the Antarctic Circumpolar Current in the Drake Passage. Similar analysis was performed at different sections across the Subantarctic Front (Ferrari et al., 2017; Frey et al., 2021). It was proved that satellite altimetry reproduces the ocean currents derived from SADCP measurements in studied locations. However, such a comparison has never been performed in the Bransfield Strait region, which was one of motivations of this work. Mean fields of altimetry-derived velocity confirms that the BC is observed all year round with low seasonal variability. Based on the altimetry, the maximum velocity is observed in April-June; the minimum velocity is 15% lower and is observed in October-December. Veny et al. (2022) suggest quite different seasonal variations of the BC with the maximum values during austral summer and weaker current during June-August. The altimetry-derived and SADCP velocities represent different ocean layers which can cause such discrepancies. The difference can be also caused by irregularity of the SADCP crossings; as variations of the BC at time scales of several days can be as high as seasonal variations; we need a very large velocity dataset for reliable estimation of seasonal variability of the current.
Unlike numerous previous studies dedicated to altimetry-derived geostrophic circulation and its comparison with the direct velocity measurements in different regions of the World Ocean (Barré et al., 2011; Ferrari et al., 2017; Frey et al., 2021; Lago et al., 2021), we did not find such a high correlation between geostrophic and in situ velocities in the Bransfield Strait. We suggest that in addition to the small spatial scale of the Bransfield Strait, ocean tides may be the main cause of the observed discrepancies. The tides in this region lead to variations in the sea level reaching several tens of centimeters (Zhou et al., 2020). Processing of satellite altimetry is based on tidal sea level variations predicted by numerical models. These models have significant discrepancies in the Bransfield Strait region (King and Padman, 2005), which affects the quality of the simultaneous altimetry-derived geostrophic currents. As a result, we cannot study the short-term variability of currents or their intermittency in the strait using satellite data, but these data can be helpful for estimates of long-term variations of the intense flows in this region.
We think that the next step in understanding the Bransfield Strait dynamics and evaluation temporal variability of the currents in the strait is the use of a high-resolution three-dimensional ocean circulation model specially adjusted and validated in this region using direct measurements. Such approach was implemented in different regions of the World Ocean including the Drake Passage (Rocha et al., 2016) and Subantarctic Front in the Southwestern Atlantic (Artana et al., 2018) and, to our knowledge, it has been never used in the region of the Bransfield Strait. Since modern ocean circulation models assimilate satellite altimetry data, it seems important to evaluate the altimetry data based on in situ velocity observations. The comparison performed in the frame of this work shows that simultaneous altimetry-derived geostrophic currents differ from in situ measurements stronger than in the open sea, which must be considered when these data are assimilated in ocean circulation models.
In this paper, we analyzed a set of recent velocity measurements performed by the Shirshov Institute of Oceanology at 50 sections in the BS in 2017. We focused on two main flows in the strait: the Brasfield Current transporting waters from the Bellingshausen Sea and the Drake Passage and the Antarctic Coastal Current which transports waters from the Weddell Sea. The results of this work are listed below:
1. SADCP measurements confirm general aspects of circulation in the Bransfield Strait known from the previous studies. In the western part of the strait, the BC is observed south of Deception Island. The flow north of Deception Island is directed in the opposite direction; its velocity reaches 35 cm/s. The BC speeds up along the SSI and the maximum velocity reaching 50 cm/s is observed south of King George Island at longitude 58°45’ W. Further to the east, the current slows down, turns to the north, and propagates further around the SSI. The SADCP velocities are usually 10-20 cm/s, but sometimes reach 40 cm/s.
2. Direct velocity measurements reveal complex circulation pattern between King George and Elephant islands and provide information about spatial structure of the previously reported currents in this region. SADCP data show that the BC deepens and becomes more variable, and a deep eddy is observed at this section. The velocities at this location exceed 80 cm/s; which is higher than in the central basin; such high velocities were not reported in the previous studies.
3. New SADCP measurements confirm that the BC is baroclinic while the CC is largely barotropic. Unlike the waters from the Bellingshausen Sea, the waters of the Weddell Sea origin propagate in deep layers due to their high density and this flow is usually not observed at the surface. The current core is usually located at a depth of 200 m near the shelf break. This flow spreads along the entire length of the strait and is observed as far as to Trinity Island.
4. The use of the low-frequency SADCPs, which generally provide measurements down to a depth of 700 m (76.8 kHz profiler) or 1000 m (38.4 kHz profiler) is helpful for studying the circulation in the Bransfield Strait and allows measurements of currents that are hidden from the high-frequency systems. On the other hand, high-frequency SADCPs provide better vertical resolution. High resolution can be important for specific studies of the fine structure of the flows in the strait and the vertical shear of the observed currents. In any case, a series of SADCP crossings along the same line is helpful for studies of the circulation in the strait due to the strong variability on different time scales.
5. The mean geostrophic circulation derived from satellite altimetry reveals fine spatial structure of the BC. On the contrary, the CC is not clearly represented in the analyzed satellite-derived geostrophic velocity fields. Further measurements in different years and more validation work are needed for the analysis of this issue. As for the BC, the satellite altimetry data suggest that the recirculation of this current around the SSI is observed all year round, which shows this circulation pattern for the first time.
The datasets presented in this study can be found in online repositories. The names of the repository/repositories and accession number(s) can be found in the article/supplementary material.
DF designed the study. SG, EM, and DF organized the field surveys. VK, AG, ID, AO, and DS performed the field work. VK, AG, and ID processed the in situ data and organized the database. DC, SK, AO, and AG performed the analysis of the satellite altimetry data. All authors contributed to the article and approved the submitted version.
This research was funded by the State Task of Russia FNNN-2021-0010 (collection and processing of in situ data from the BS) and the Russian Science Foundation, project 22-77-10004 (processing of satellite altimetry data).
We express our great appreciation to the crews of the R/V Akademik Sergey Vavilov and Akademik Ioffe, who have supported our fieldworks, especially captains Leonid Sazonov, Valery Beluga, and Andrey Zybin.
The authors declare that the research was conducted in the absence of any commercial or financial relationships that could be construed as a potential conflict of interest.
All claims expressed in this article are solely those of the authors and do not necessarily represent those of their affiliated organizations, or those of the publisher, the editors and the reviewers. Any product that may be evaluated in this article, or claim that may be made by its manufacturer, is not guaranteed or endorsed by the publisher.
Artana C., Lellouche J. M., Park Y. H., Garric G., Koenig Z., Sennéchael N., et al. (2018). Fronts of the Malvinas Current system: surface and subsurface expressions revealed by satellite altimetry, Argo floats, and Mercator operational model outputs. J. Geophysical Research: Oceans 123 (8), 5261–5285. doi: 10.1029/2018JC013887
Atkinson A., Siegel V., Pakhomov E., Rothery P. (2004). Long-term decline in krill stock and increase in salps within the Southern Ocean. Nature 432, 100–103. doi: 10.1038/nature02996
Barré N., Provost C., Renault A., Sennéchael N. (2011). Fronts, meanders and eddies in Drake Passage during the ANT-XXIII/3 cruise in January–February 2006: A satellite perspective. Deep Sea Res. Part II: Topical Stud. Oceanography 58 (25–26), 2533–2554. doi: 10.1016/j.dsr2.2011.01.003
Capella J. E., Ross R. M., Quetin L. B., Hofmann E. E. (1992). A note on the thermal structure of the upper ocean in the Bransfield Strait-South Shetland Islands region. Deep Sea Res. Part A. Oceanographic Res. Papers 39 (7-8), 1221–1229. doi: 10.1016/0198-0149(92)90065-2
Chereskin T. K., Harris C. L. (1997). Shipboard acoustic Doppler current profiling during the WOCE Indian ocean expedition: I10 (p. 137) (San Diego: Scripps Institution of Oceanography, University of California).
Damini B. Y., Kerr R., Dotto T. S., Mata M. M. (2022). Long-term changes on the Bransfield Strait deep water masses: Variability, drivers and connections with the northwestern Weddell Sea. Deep Sea Res. Part I: Oceanographic Res. Papers 179, 103667. doi: 10.1016/j.dsr.2021.103667
Dotto T. S., Kerr R., Mata M. M., Garcia A. E. (2016). Multidecadal freshening and lightening in the deep waters of the Bransfield Strait, Antarctica. J. Geophysical Res. 121. doi: 10.1002/2015JC011228
Egbert G. D., Erofeeva S. Y. (2002). Efficient inverse modeling of barotropic ocean tides. J. Atmospheric Oceanic Technol. 19 (2), 183–204. doi: 10.1175/1520-0426(2002)019<0183:EIMOBO>2.0.CO;2
Ferrari R., Artana C., Saraceno M., Piola A. R., Provost C. (2017). Satellite altimetry and current-meter velocities in the Malvinas Current at 41°S: Comparisons and modes of variations. J. Geophysical Research: Oceans 122, 9572–9590. doi: 10.1002/2017JC013340
Firing Y. L., Chereskin T. K., Mazloff M. R. (2011). Vertical structure and transport of the Antarctic Circumpolar Current in Drake Passage from direct velocity observations. J. Geophysical Res. 116, C08015. doi: 10.1029/2011JC006999
Firing E., Hummon J. M. (2010). “Ship-mounted acoustic Doppler current profilers,” in The GO-SHIP repeat hydrography manual: A collection of expert reports and guidelines. Eds. Hood E. M., Sabine C. L., Sloyan B. M. (IOCCP Report Number 14, ICP O Publication Series Number 134).
Firing E., Hummon J., Chereskin T. (2012). Improving the quality and accessibility of current profile measurements in the Southern Ocean. Oceanog 25 (3), 164–165. doi: 10.5670/oceanog.2012.91
Frey D. I., Krechik V. A., Morozov E. G., Drozd I. D., Gordey A. S., Latushkin A. A., et al. (2022). Water exchange between deep basins of the Bransfield Strait. Water 14, 3193. doi: 10.3390/w14203193
Frey D. I., Piola A. R., Krechik V. A., Fofanov D. V., Morozov E. G., Silvestrova K. P., et al. (2021). Direct measurements of the Malvinas Current velocity structure. J. Geophysical Research: Oceans 126, e2020JC016727. doi: 10.1029/2020JC016727
García M. A., López O., Sospedra J., Espino M., Gràcia V., Morrison G., et al. (1994). Mesoscale variability in the Bransfield Strait region (Antarctica) during austral summer. Annales Geophysicae 12 (9), 856–867. doi: 10.1007/s00585-994-0856-z
Garcia C. A. E., Mata M. M. (2005). Deep and bottom water variability in the central basin of Bransfield Strait (Antarctica) over the 1980–2005 period. CLIVAR Exchanges 10 (4), 48–50.
Gomis D., García M. A., López O., Pascual A. (2002). Quasi-geostrophic 3D circulation and mass transport in the western Bransfield Strait during austral summer 1995/96. Deep Sea Res. Part II: Topical Stud. Oceanography 49.4-5, 603–621. doi: 10.1016/S0967-0645(01)00114-X
Gordon A. L., Mensch M., Dong Z., Smethie W. M., de Bettencourt J. (2000). Deep and bottom water of the Bransfield Strait eastern and central basins. J. Geophysical Res. Atmospheres 105 (C5), 11337–11346. doi: 10.1029/2000JC900030
Gordon A. L., Nowlin W. D. (1978). The basin waters of the Bransfield Strait. J. Phys. Oceanography 8 (2), 258—264. doi: 10.1175/1520-0485(1978)008<0258:TBWOTB>2.0.CO;2
Gyldenfeldt A. B., Fahrbach E., Garcıía M. A., Schröder M. (2002). Flow variability at the tip of the Antarctic Peninsula. Deep Sea Res. Part II: Topical Stud. Oceanography 49 (21), 4743–4766. doi: 10.1016/S0967-0645(02)00157-1
Hofmann E. E., Klinck J. M., Lascara C. M., Smith D. A. (1996). “Water mass distribution and circulation west of the Antarctic Peninsula and including Bransfield Strait,” in Antarctic Research series, vol. 70 . Eds. Ross R. M., Hofmann E. E., Quetin L. B. (Washington DC: American Geophysical Union), 61–80. doi: 10.1029/AR070p0061
Huneke W., Huhn O., Schroeder M. (2016). Water masses in the Bransfield Strait and adjacent seas, austral summer 2013. Polar Biol. 39, 789–798. doi: 10.1007/s00300-016-1936-8
Joyce T. M. (1989). On in-situ ‘calibration’ of shipboard ADCPs, j. atmos. Oceanic Technol. 6, 164–172. doi: 10.1175/1520-0426(1989)006<0169:OISOSA>2.0.CO;2
Khimchenko E. E., Frey D. I., Morozov E. G. (2020). Tidal internal waves in the Bransfield Strait, Antarctica. Russian J. Earth Sci. 20, ES2006. doi: 10.2205/2020ES000711
King M. A., Padman L. (2005). Accuracy assessment of ocean tide models around Antarctica. Geophysical Res. Lett. 32, 23. doi: 10.1029/2005GL023901
Lago L. S., Saraceno M., Piola A. R,, Ruiz-Etcheverry L. A. (2021). Volume transport variability on the Northern Argentine continental shelf from in situ and satellite altimetry data. J. Geophys. Res. Oceans. 126, e2020JC016813. doi: 10.1029/2020JC016813
Loeb V. J., Hofmann E. E., Klinck J. M., Holm-Hansen O., White W. B. (2009). ENSO and variability of the Antarctic Peninsula pelagic marine ecosystem. Antarctic Sci. 21 (2), 135–148. doi: 10.1017/S0954102008001636
López O., Garcia M. A., Gomis D., Rojas P., Sospedra J., Sanchez-Arcilla A. (1999). Hydrographic and hydrodynamic characteristics of the eastern basin of the Bransfield Strait (Antarctica). Deep Sea Res. Part I: Oceanographic Res. Papers 46 (10), 1755–1778. doi: 10.1016/S0967-0637(99)00017-5
Madejski P., Rakusa-Suszczewski S. (1990). Icebergs as tracers of water movement in the Bransfield Strait. Antarctic Sci. 2 (3), 259–263. doi: 10.1017/S0954102090000347
Moffat C., Meredith M. (2018). Shelf–ocean exchange and hydrography west of the Antarctic Peninsula: A review. Philosophical Transactions of the Royal Society A: Mathematical, Physical and Engineering Sciences 376 (2122), 20170164. doi: 10.1098/rsta.2017.0164
Morozov E. G. (2007). Currents in Bransfield Strait. Doklady Earth Sci. 415A (6), 984–986. doi: 10.1134/S1028334X07060347
Morozov E. G., Frey D. I., Krechik V. A., Polukhin A. A., Sapozhnikov Ph. V. (2021). Water masses, currents, and phytoplankton in the Bransfield Strait in January 2020. Antarctic Peninsula region of the Southern Ocean. Oceanography Ecology., 55–64. doi: 10.1007/978-3-030-78927-5_4
Mukhametianov R. Z., Frey D. I., Morozov E. G. (2022). Currents in the Bransfield Strait based on geostrophic calculations and data of instrumental measurements. Izvestiya Atmospheric Oceanic Physics. 58 (5), 500–506. doi: 10.1134/S0001433822050061
Mulet S., Rio M.-H., Etienne H., Artana C., Cancet M., Dibarboure G., et al. (2021). The new CNES-CLS18 global mean dynamic topography. Ocean Sci. 17 (3), 789–808. doi: 10.5194/os-17-789-2021
Niiler P. P., Amos A., Hu J.-H. (1991). Water masses and 200 m relative geostrophic circulation in the western Bransfield Strait region. Deep-Sea Research Part A: Oceanographic Res. Papers 38 (8-9), 943–959. doi: 10.1016/0198-0149(91)90091-S
Passaro M., Cipollini P., Vignudelli S., Quartly G. D., Snaith H. M. (2014). ALES: A multi-mission adaptive subwaveform retracker for coastal and open ocean altimetry. Remote Sens. Environ. 145, 173–189. doi: 10.1016/j.rse.2014.02.008
Pollard R., Read J. (1989). A method for calibrating shipmounted acoustic Doppler profilers and the limitations of gyro compasses. J. Atmos. Oceanic Technol. 6, 859–865. doi: 10.1175/1520-0426(1989)006<0859:AMFCSA>2.0.CO;2
Polukhin A. A., Morozov E. G., Tishchenko P. P., Frey D. I., Artemiev V. A., Borisenko G. V., et al. (2021). Water structure in the Bransfield Strait (Antarctica) in January 2020: Hydrophysical, optical and hydrochemical features. Oceanology. doi: 10.31857/S0030157421050105
Poulin F. J., Stegner A., Hernández-Arencibia M., Marrero-Díaz A., Sangrà P. (2014). Steep shelf stabilization of the coastal Bransfield Current: Linear stability analysis. J. Phys. Oceanography 44 (2), 714–732. doi: 10.1175/JPO-D-13-0158.1
Pujol M.-I., Faugère Y., Taburet G., Dupuy S., Pelloquin C., Ablain M., et al. (2016). DUACS DT2014: The new multi-mission altimeter data set reprocessed over 20 years. Ocean Sci. 12 (5), 1067–1090. doi: 10.5194/os-12-1067-2016
Renner A. H., Thorpe S. E., Heywood K. J., Murphy E. J., Watkins J. L., Meredith M. P. (2012). Advective pathways near the tip of the Antarctic Peninsula: Trends, variability and ecosystem implications. Deep Sea Res. Part I: Oceanographic Res. Papers 63, 91–101. doi: 10.1016/j.dsr.2012.01.009
Rocha C. B., Chereskin T. K., Gille S. T., Menemenlis D. (2016). Mesoscale to submesoscale wavenumber spectra in Drake Passage. J. Phys. Oceanography 46 (2), 601–620. doi: 10.1175/JPO-D-15-0087.1
Ruiz Barlett E. M., Tosonotto G. V., Piola A. R., Sierra M. E., Mata M. M. (2017). On the temporal variability of intermediate and deep waters in the Western basin of the Bransfield Strait. Deep-Sea Res. Part II. doi: 10.1016/j.dsr2.2017.12.010
Sangrà P., Gordo C., Hernández-Arencibia M., Marrero-Díaz A., Rodríguez-Santana A., Stegner A., et al. (2011). The Bransfield Сurrent System. Deep-Sea Research Part I: Oceanographic Res. Papers 58 (4), 390–402. doi: 10.1016/j.dsr.2011.01.011
Sangrà P., Stegner A., Hernández-Arencibia M., Marrero-Díaz A., Salinas C., Aguiar-González B., et al. (2017). The Bransfield gravity current. Deep-Sea Research Part I: Oceanographic Res. Papers 119, 1–15. doi: 10.1016/j.dsr.2016.11.003
Savidge D. K., Amft J. A. (2009). Circulation on the West Antarctic Peninsula derived from 6 years of shipboard ADCP transects. Deep Sea Res. Part I: Oceanographic Res. Papers 56 (10), 1633–1655. doi: 10.1016/j.dsr.2009.05.011
Spiridonov V. A. (1996). A scenario of the late-Pleistocene-Holocene changes in the distributional range of Antarctic krill (Euphausia superba). Mar. Ecol. 17 (1-3), 519–541. doi: 10.1111/j.1439-0485.1996.tb00525.x
Thompson A. F., Heywood K. J. (2008). Frontal structure and transport in the northwestern Weddell Sea. Deep Sea Res. Part I: Oceanographic Res. Papers 55 (10), 1229–1251. doi: 10.1016/j.dsr.2008.06.001
Thompson A. F., Heywood K. J., Thorpe S. E., Renner A. H., Trasviña A. (2009). Surface circulation at the tip of the Antarctic Peninsula from drifters. J. Phys. Oceanography 39 (1), 3–26. doi: 10.1175/2008JPO3995.1
Tokarczyk R. (1987). Classification of water masses in the Bransfield Strait and southern part of the Drake Passage using a method of statistical multidimensional analysis. Polish Polar Res. 8, 333–336.
Ubelmann C., Dibarboure G., Gaultier L., Ponte A., Ardhuin F., Ballarotta M., et al. (2021). Reconstructing ocean surface current combining altimetry and future spaceborne Doppler data. J. Geophysical Research: Oceans 126, e2020JC016560. doi: 10.1029/2020JC016560
Vaughan D., Marshall G., Connolley W., Parkinson C., Mulvaney R., Hodgson D., et al. (2003). Recent rapid regional climate warming on the Antarctic Peninsula. Clim. Change 60, 243–274. doi: 10.1023/A:1026021217991
Veit-Köhler G., Durst S., Schuckenbrock J., Hauquier F., Durán Suja L., Dorschel B., et al. (2018). Oceanographic and topographic conditions structure benthic meiofauna communities in the Weddell Sea, Bransfield Strait and Drake Passage (Antarctic). Prog. Oceanography 162, 240–256. doi: 10.1016/j.pocean.2018.03.005
Veny M., Aguiar-González B., Marrero-Díaz Á., Rodríguez-Santana Á. (2022). Seasonal circulation and volume transport of the Bransfield Current. Prog. Oceanography 204, 102795. doi: 10.1016/j.pocean.2022.102795
Wang X., Moffat C., Dinniman M. S., Klinck J. M., Sutherland D. A., Aguiar-González B. (2022). Variability and dynamics of along-shore exchange on the West Antarctic Peninsula (WAP) continental shelf. J. Geophysical Research: Oceans 127, e2021JC017645. doi: 10.1029/2021JC017645
Wessel P., Smith W. H. F. (1996). A global, self-consistent, hierarchical, high-resolution shoreline database. J. Geophysical Res. 101 (B4), 8741–8743. doi: 10.1029/96JB00104
Wilson C., Klinkhammer G. P., Chin C. S. (1999). Hydrography within the central and east basins of the Bransfield Strait, Antarctica. J. Phys. Oceanography 29 (3), 465–479. doi: 10.1175/1520-0485(1999)029<0465:HWTCAE>2.0.CO;2
Zhou M., Niiler P. P., Hu J.-H. (2002). Surface currents in the Bransfield and Gerlache straits, Antarctica. Deep Sea Res. Part I: Oceanographic Res. Papers 49 (2), 267–280. doi: 10.1016/S0967-0637(01)00062-0
Zhou M., Niiler P. P., Zhu Y., Dorly R. D. (2006). The western boundary current in the Bransfield Strait, Antarctica. Deep Sea Res. Part I: Oceanographic Res. Papers 53 (7), 1244–1252. doi: 10.1016/j.dsr.2006.04.003
Zhou X., Zhu G., Hu S. (2020). Influence of tides on mass transport in the Bransfield Strait and the adjacent areas, Antarctic. Polar Sci. 23, 100506. doi: 10.1016/j.polar.2020.100506
Keywords: Bransfield Strait, Antarctic Peninsula region, SADCP, satellite altimetry, ocean circulation
Citation: Frey D, Krechik V, Gordey A, Gladyshev S, Churin D, Drozd I, Osadchiev A, Kashin S, Morozov E and Smirnova D (2023) Austral summer circulation in the Bransfield Strait based on SADCP measurements and satellite altimetry. Front. Mar. Sci. 10:1111541. doi: 10.3389/fmars.2023.1111541
Received: 29 November 2022; Accepted: 28 February 2023;
Published: 15 March 2023.
Edited by:
Weifeng (Gordon) Zhang, Woods Hole Oceanographic Institution, United StatesReviewed by:
Borja Aguiar-González, University of Las Palmas de Gran Canaria, SpainCopyright © 2023 Frey, Krechik, Gordey, Gladyshev, Churin, Drozd, Osadchiev, Kashin, Morozov and Smirnova. This is an open-access article distributed under the terms of the Creative Commons Attribution License (CC BY). The use, distribution or reproduction in other forums is permitted, provided the original author(s) and the copyright owner(s) are credited and that the original publication in this journal is cited, in accordance with accepted academic practice. No use, distribution or reproduction is permitted which does not comply with these terms.
*Correspondence: Dmitry Frey, dima.frey@gmail.com
Disclaimer: All claims expressed in this article are solely those of the authors and do not necessarily represent those of their affiliated organizations, or those of the publisher, the editors and the reviewers. Any product that may be evaluated in this article or claim that may be made by its manufacturer is not guaranteed or endorsed by the publisher.
Research integrity at Frontiers
Learn more about the work of our research integrity team to safeguard the quality of each article we publish.