
95% of researchers rate our articles as excellent or good
Learn more about the work of our research integrity team to safeguard the quality of each article we publish.
Find out more
ORIGINAL RESEARCH article
Front. Mar. Sci. , 09 February 2023
Sec. Marine Biogeochemistry
Volume 10 - 2023 | https://doi.org/10.3389/fmars.2023.1074474
This article is part of the Research Topic Biogeochemical, Ecological and Biophysical Dynamics in the Kuroshio, Oyashio and Their Extension Regions View all 17 articles
 Shi-Bo Yan1,2,3
 Xiao-Jun Li3
 Feng Xu3
 Hong-Hai Zhang1,3*
 Jian Wang3
 Yueqi Zhang4
 Gui-Peng Yang1,2,3*
 Guang-Chao Zhuang1,2
 Zhaohui Chen4
Ocean-derived dimethyl sulfide (DMS) is widely concerning because of its hypothesized influence on global climate change. This study aims to explore the distribution characteristics and influencing factors of DMS and partial pressure of carbon dioxide (pCO2) in the Northwest Pacific Ocean, as well as the potential relationship between DMS and pCO2. A high-resolution, underway, shipboard measurement device was used to determine the DMS and pCO2 of the surface seawater and atmosphere in the Northwest Pacific and its marginal seas during November 2019. The result show that atmospheric and surface seawater DMS concentrations ranged from 3 to 125 pptv and 0.63 to 2.28 nmol L-1, respectively, with mean values of 46 ± 19 pptv and 1.08 ± 0.34 nmol L-1. The average sea surface pCO2 was 371 ± 16 μatm (range from 332 to 401 μatm). The trends in the surface seawater DMS in different current systems were primarily associated with phytoplankton abundance and composition. Biological activity and physical processes such as cooling jointly influenced the sea surface pCO2. A cold eddy along the transect in the Northwest Pacific Ocean increased DMS at the sea surface by 10% and CO2 uptake by 3%. We found a significant negative correlation between DMS and pCO2 in the Northwest Pacific Ocean at the 0.1° resolution [DMS]seawater = -0.0161[pCO2]seawater + 7.046 (R2 = 0.569, P < 0.01). The DMS and pCO2 sea-air fluxes were estimated to range from 0.04 to 25.3 μmol m-2·d-1 and from -27.0 to 4.22 mmol m-2·d-1 throughout the survey area. The Northwest Pacific Ocean, especially the Oyashio Current, is an important sink of CO2 and a source of DMS.
Dimethyl sulfide (DMS) is the most important volatile biogenic sulfide in the ocean and its sea-air flux is estimated to be ~ 27.1 Tg·S·a-1 (Hulswar et al., 2022). DMS in the ocean is mainly produced by certain marine algae and by bacteria though the cleavage of the precursor compound dimethylsulfoniopropionate (DMSP) (Stefels et al., 2007; Todd et al., 2007; Alcolombri et al., 2015). More than 95% of the DMS in the atmosphere is released from the ocean (Kettle and Andreae, 2000). Atmospheric DMS can be rapidly oxidized by free radicals (Glasow and Crutzen, 2004). The produced DMS oxidants enhance the production of atmospheric sulfate aerosols, which can act as of cloud condensation nuclei (CCN) and regulate surface solar radiation, creating a negative feedback mechanism that counters the global greenhouse effect (Charlson et al., 1987; Gabric et al., 2004). Since the Industrial Revolution, human activities have rapidly increased the atmospheric CO2 concentration from 280ppm to 418ppm at present (Global Monitoring Laboratory - Carbon Cycle Greenhouse Gases (noaa.gov)), driving global warming and ocean acidification (Caldeira and Wickett, 2003; Allen et al., 2009; Landman, 2010). DMS concentrations in seawater are sensitive to ocean acidification (Mélançon et al., 2016; Gao et al., 2021), and because the carbon and sulfur cycles are both heavily influenced by phytoplankton activity, it is likely that the two cycles are closely linked (Suess, 1980; Chisholm, 2000; Riebesell et al., 2007; Mélançon et al., 2016; Dani and Loreto, 2017).
The Northwest Pacific Ocean is one of the most productive regions in the global ocean and an important global carbon sink (Honda, 2003; Takahashi et al., 2009; Friedlingstein et al., 2022). Under the influence of the strong western boundary current, the Northwest Pacific Ocean contains an abundance of dynamic marine processes, complex ecosystems, active biological processes, and strong exchanges of matter and energy at the air-sea interface (Sakurai, 2007; Hu et al., 2015; Karl and Church, 2017; Schlundt et al., 2017). The southward Oyashio Current of the subpolar gyre transports cold, low salinity, and nutrient‐rich water from high latitudes to low latitudes where it, meets the warm, high salinity, and nutrient‐deficient Kuroshio Current off the east coast of Japan, forming the Kuroshio-Oyashio Confluence Region (KOCR) (Mitsudera et al., 2004). Furthermore, the Northwest Pacific Ocean, especially the Kuroshio Extension Region, is one of the most active regions in terms of mesoscale eddies in the global ocean (Qiu and Chen, 2010; Xi et al., 2018). Mesoscale eddies are crucial to the vertical transport and horizontal distribution of nutrients (Vaillancourt et al., 2003) and can create quasi-enclosed mesoscale ecosystems with distinct features which have powerful influences on the distributions of dissolved active gases (Zindler et al., 2014).
Shipboard, underway, high-resolution observation methods for pCO2 have become reliable and well-established (Pierrot et al., 2009), while the underway analysis methods for DMS are relatively underdeveloped. Despite this, high-resolution, shipboard, underway DMS measurement methods have recently been applied (Asher et al., 2015; Zhang and Chen, 2015; Kim et al., 2017; Zhang et al., 2019). Kim et al. (2017) used a membrane inlet mass spectrometer (MIMS) to analyze the horizontal distribution of DMS in the Amundsen Sea Polynya region. Wohl et al. (2020); Wohl et al. (2022) used a segmented flow coil equilibrator coupled to a proton transfer reaction mass spectrometer (EI-PTR-MS) to measure dissolved gases (e.g., DMS and isoprene) in the Southern Ocean and the Canadian Arctic. However, there were few studies on the DMS of seawater and atmosphere in the Northwest Pacific Ocean at present, and DMS data were relatively discrete (Figure S1) (DMS data of Northwest Pacific surface seawater was obtained from NOAA-PMEL DMS database, https://saga.pmel.noaa.gov/dms/). At present, only Zhang et al. (2017) reported the underway data of DMS in the East and South China Seas. In the absence of high-resolution field observation data, the distribution characteristics and control mechanism of DMS at the air-sea interface in the Northwest Pacific Ocean are still not well understood. This is not conducive to accurately estimating the sea-air flux of the Northwest Pacific DMS. This variation in the DMS flux will in turn be used to force models of atmospheric sulfur to derive sulfate aerosols (Chin and Jacob, 1996) and their radiative forcing (Meehl, 1996).
Considering the massive amount of CO2 data in the surface Ocean CO2 Atlas database (https://www.socat.info/) and the inadequacy of DMS data in the Northwest Pacific Ocean from the NOAA-PMEL DMS database, it would be of immense value to establish a reliable indicator for DMS using pCO2. In this study, In this study, GC coupled with a custom-made purge and trap device (Zhang et al., 2019) was used to realize the underway observation of DMS. We performed high-resolution surface seawater DMS and pCO2 measurements in the Northwest Pacific Ocean in November 2019 to examine the factors driving the surface DMS and pCO2 distributions in different oceanic regions. The relationship between DMS and pCO2 in the Northwest Pacific Ocean was also examined in detail, providing a convenient method for predicting surface water DMS in the Northwest Pacific Ocean based on pCO2 data. We further calculated their sea-air fluxes to determine the source and sink patterns of DMS and CO2 in the surface ocean. It is also helpful to evaluate the impact of DMS release in the Northwest Pacific on global climate change.
Continuous, high-resolution, underway measurements of DMS and pCO2 in the surface seawater and atmosphere of the Northwest Pacific Ocean were taken on board the R/V “Dongfanghong 3” from 1 November to 29 November 2019. The research vessel crossed the Osumi-kaikyo straight to reach the Northwest Pacific Ocean and then followed a transect along the longitude of approximately 150°E southwards to the southernmost point (13° N) of the cruise. The sampling transect crossed many dynamic oceanographic features, including the Kuroshio Current, Kuroshio Extension, Oyashio Current, North Pacific Subtropical Gyre, and North Equatorial Current (Figure 1). To further investigate the distributions and influencing factors of DMS and pCO2, more thorough discrete sampling was performed every 1° along the 150° E transect. Fortunately, the ship passed through a cold eddy on November 3, which clearly had a great impact on the area and provided a convenient example of the influence of mesoscale eddies on active gases. At the same time, the biochemical parameters such as temperature, salinity, dissolved oxygen (DO), and chlorophyll a (Chl-a) were measured in the surface waters.
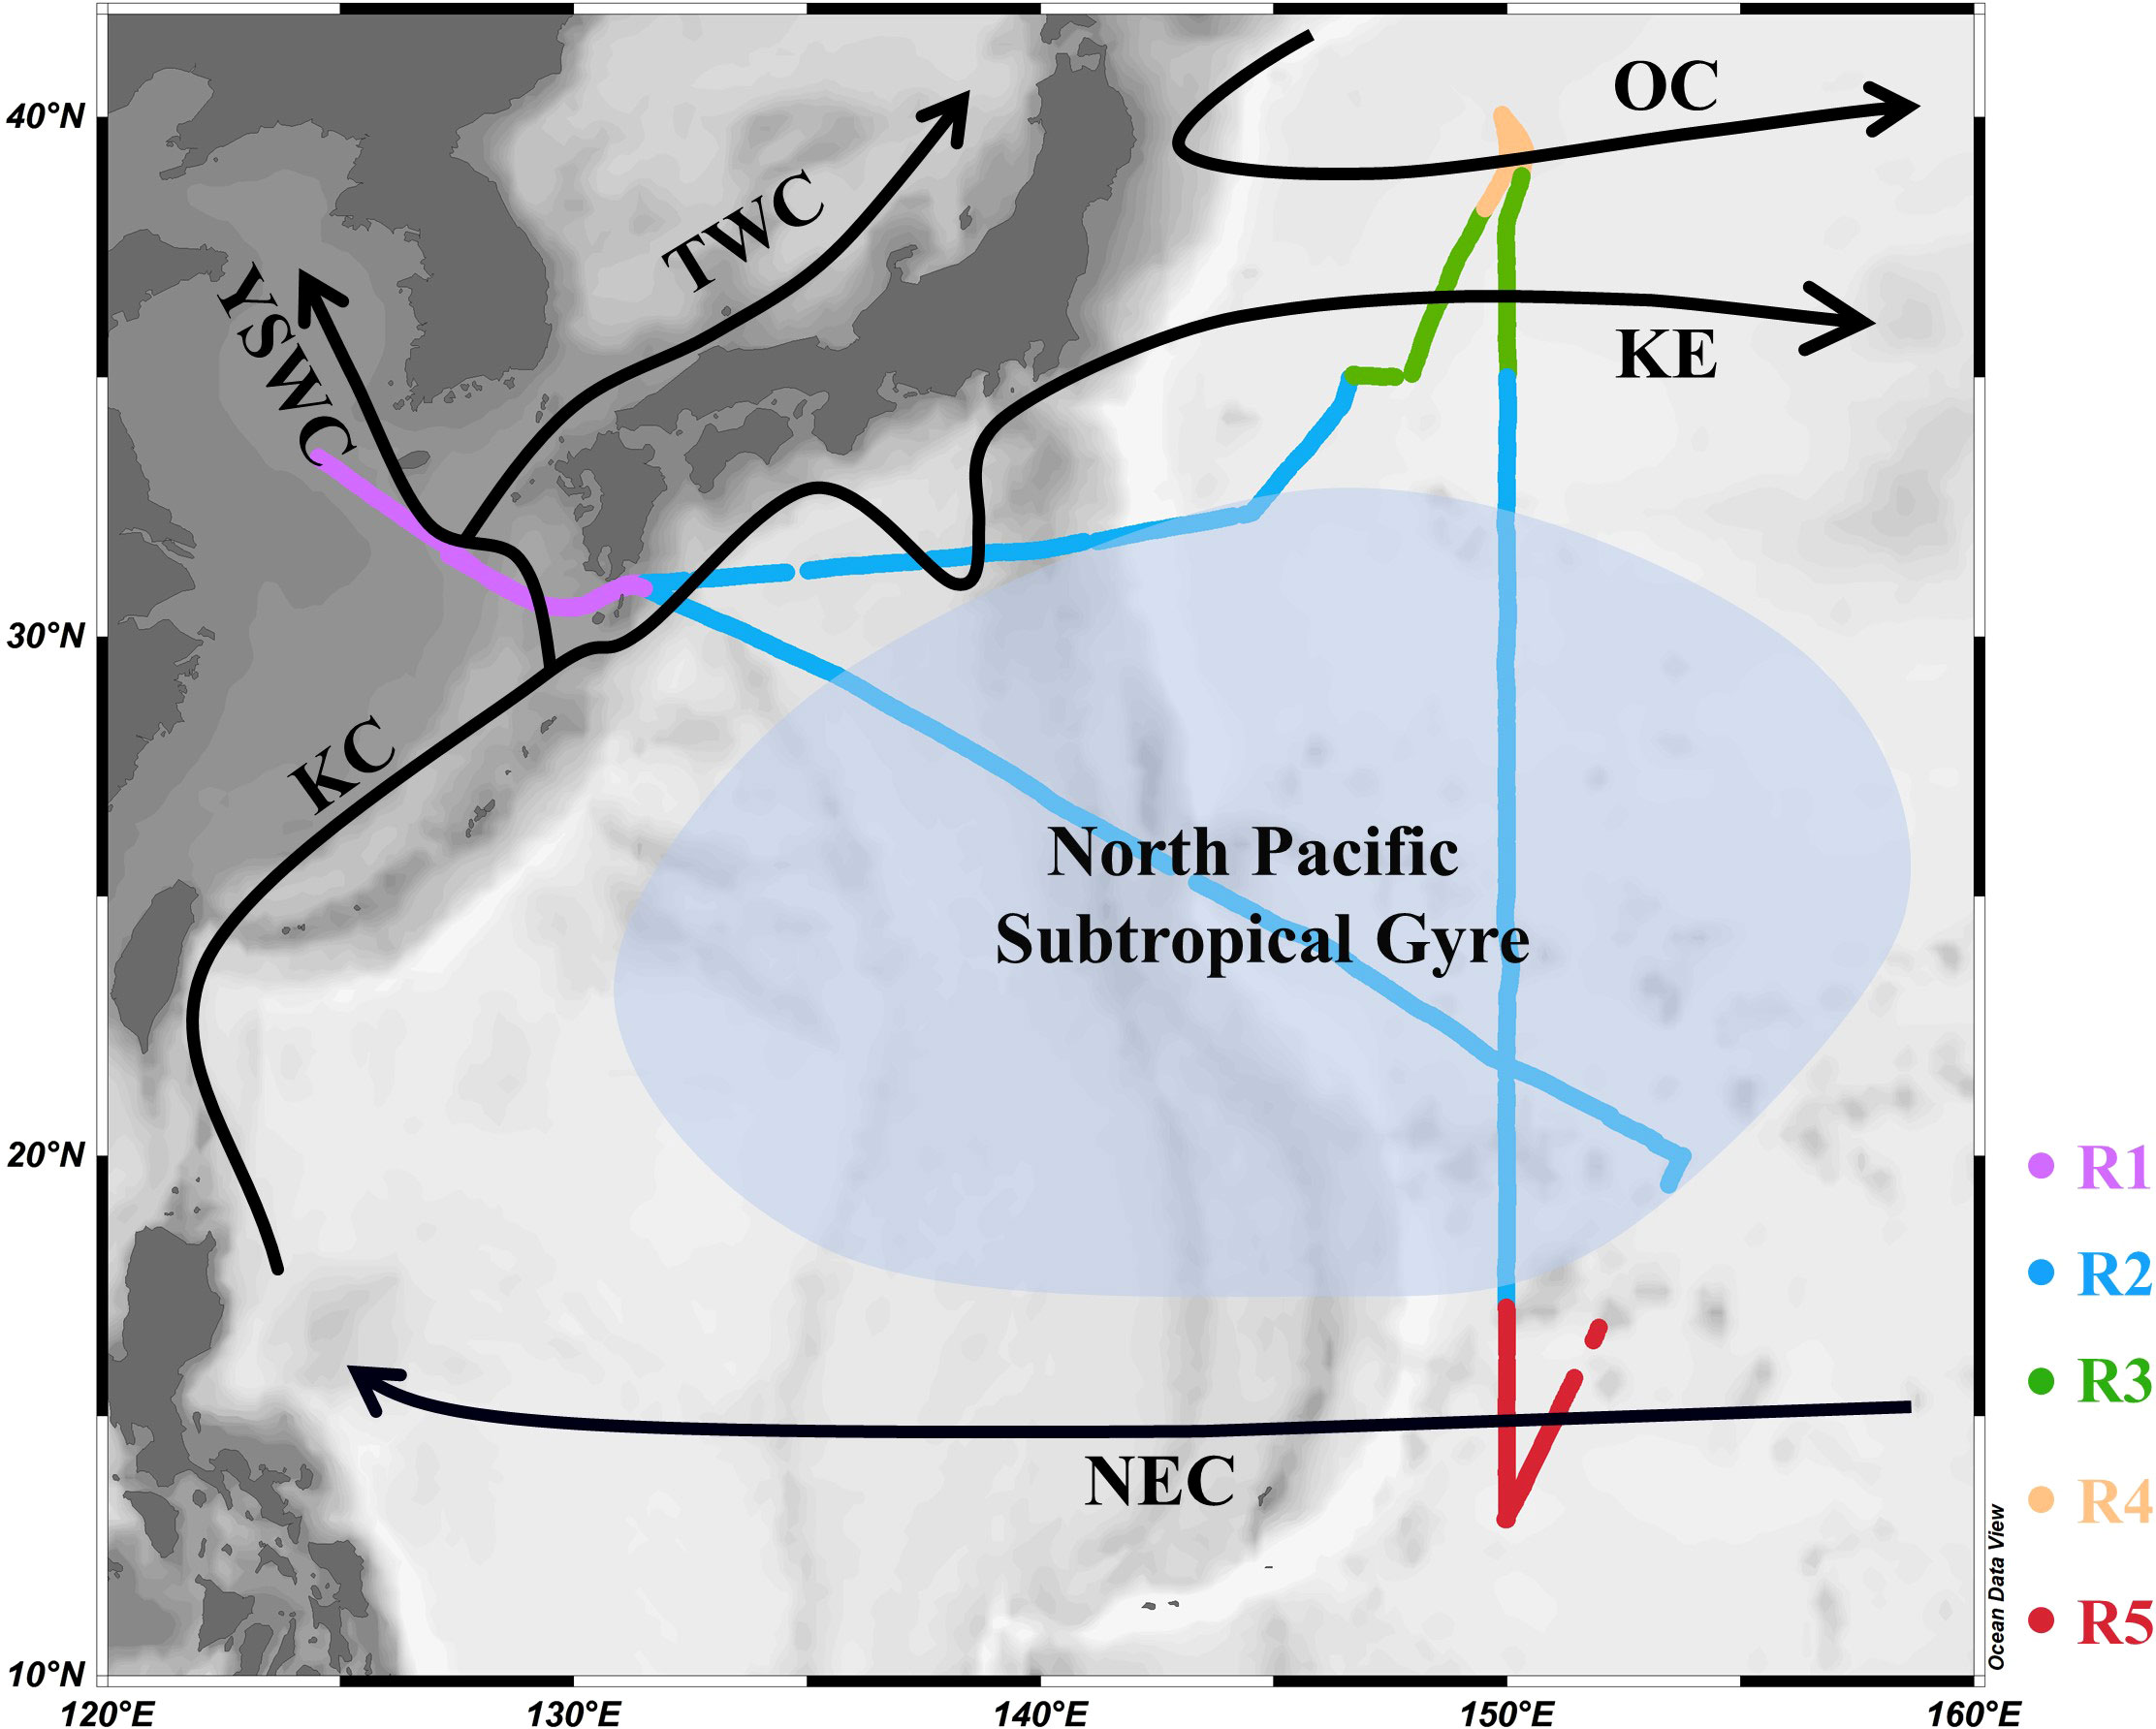
Figure 1 Track of the sampling cruise (R1 to R5) and the major surface currents (solid black arrows) in the Northwest Pacific Ocean (OC: Oyashio Current; KE: Kuroshio Extension; KC: Kuroshio Current; TWC: Tsushima Warm Current; YSWC: Yellow Sea Warm Current; NEC: North Equatorial Current; R1: shallow marginal sea region (SMSR); R2: North Pacific Subtropical Gyre (NPSG); R3: Kuroshio-Oyashio Confluence Region (KOCR); R4: OC region (OCR); R5: NEC region (NECR)).
DMS was determined using a gas chromatograph-flame photometric detector (GC-FPD, 7890B, Agilent Technologies, USA) coupled with a custom-made purge and trap device (Zhang et al., 2019). The analysis process was automated for both seawater and atmospheric samples. Surface seawater samples were collected from the ship’s seawater pump system at a depth of 5 m. The air sampling location was located at the vessel’s bow approximately 10 m above the sea surface to avoid contamination from the ship’s exhaust.
Surface seawater was continuously refreshed through a 5 ml sample loop. Seawater from the sample loop was pushed by flowing high-purity nitrogen (35 ml min-1) into an extraction chamber and purged for 5 min. The purged seawater DMS samples were dehydrated using Nafion drying tubes (Perma Pure, USA) and captured in a trap tube (below -15 °C) filled with Tenax-TA (80 mesh, Supelco, USA). At the same time, atmospheric DMS samples were dehydrated and captured in another trap tube for over 3.5 min at the sampling rate of 100 ml min-1. The trap tubes were heated to over 150 °C and the DMS was carried by N2 into GC-FPD for measurement. The analysis system was calibrated daily to examine the stability of the instrument during the cruise using a certified gas calibration standard (Dalian Special Gases Co., Ltd, China; nominal volume mixing ratio of 1 ppmv for DMS). The relative deviations of the calibration peak areas were typically within 6% of each other. To prevent biofouling, the water tubes and purge vessels were cleaned daily. The large volume of nitrogen purging may cause oxygen depletion in the seawater sample and additional DMS emission in the purging bottle (Omori et al., 2013). Therefore, our results of DMS measurements were possibly slightly higher than those in seawater. However, we believe that these errors are acceptable in field observation given the description by Zhang and Chen (2015).
An infrared ray detector (LI-COR Model LI-7000, Lincoln, USA) based underway pCO2 measuring system (Model 8050, General Oceanics Inc., USA) was installed onboard for the underway automatic measurements of pCO2 in surface seawater and atmosphere (Pierrot et al., 2009). Calibration was performed using CO2 standard gases from the National Research Center for Certified Reference Materials, China (NRCCRM) with concentrations of 0, 200, 400, 600, and 1000 ppmv (CO2/N2). The sampling frequency of the system was about 3 min and the system was calibrated every 2 ~ 2.5 h. The accuracy was estimated to be better than 0.1 μatm for atmospheric pCO2 and 2 μatm for seawater pCO2. The pCO2 observations () were corrected for pCO2 in the equilibrator ( ) as follows:
where peq represents barometric pressure at equilibration at the measured temperature; and pH2O represents the saturated water vapor pressure, calculated according to the equilibrium temperature and in-situ salinity (Weiss and Price, 1980), the calculation formula is as follows:
where Teq is the temperature in the equilibrator; and S is the seawater salinity. Finally, was converted into in-situ pCO2 ( ) by correcting for temperature using the equation from Takahashi et al. (1993):
where, SST is sea surface temperature measured by the temperature sensor installed at the ship’s surface seawater intake. This correction accounts for temperature changes in samples as they transit through the supply lines.
Sea surface temperature (SST), sea surface salinity (SSS), Chl-a, and dissolved oxygen (DO) were monitored continuously with a sampling interval of 1 min by the shipboard underway surface multielement measurement system (Seabird Corporation, USA). Underway Chl-a and DO data were linearly validated using the field-measured Chl-a and DO in discrete seawater samples taken from the same seawater sampling source as for the DMS and pCO2 measurements. Meteorological data, including air temperature, pressure, and wind speed were measured from a meteorological observation instrument (approximately 20 m above sea level) located on the compass deck of the ship. All hydrographic and pCO2 data along the cruise track were averaged into 10 min bins and matched with DMS data according to time. Monthly mean sea level anomaly and geostrophic currents were calculated based on daily satellite-observed sea surface heights data from Copernicus Marine Environment Monitoring Service (CMEMS) accessed at https://resources.marine.copernicus.eu/product-detail/SEALEVEL_GLO_PHY_L4_MY_008_047/DATA-ACCESS.
Discrete seawater samples were obtained using 12 L Niskin bottles mounted on a Seabird 911-plus conductivity-temperature-depth (CTD) rosette system (Seabird Corporation, USA), which simultaneously monitored the salinity and temperature of seawater. Samples for phytoplankton community analysis and Chl-a concentrations were collected, treated, and analyzed according to Zhang et al. (2022). Phytoplankton abundance is expressed as the number of phytoplankton cells per liter of seawater (cells L-1). DO samples were measured on board following the Winkler titration method (Hansen and Koroleff, 1999). DO saturation (DO% = [O2]obs/ [O2]eq × 100%, where [O2]obs is in-situ DO concentration, and [O2]eq is the concentration at equilibrium with the atmosphere) and apparent oxygen utilization (AOU = [O2]eq - [O2]obs) were also calculated (Benson and Krause, 1984). Discrete dissolved inorganic carbon (DIC), pCO2, and Revelle factor (RF) were calculated from the measured pHT, 25 and TA data, using CO2SYS v2.1 program (Pierrot et al., 2006), together with the in-situ temperature and salinity, and with the equilibrium constants of the carbonate acid K1 and K2 from Mehrbach et al. (1973) refit by Dickson and Millero (2007), the KHSO4 was from (Dickson, 1990), and the [B]T value from Uppström (1974), where pHT, 25 and TA data were obtained from Mou et al. (2022).
The sea-air fluxes (F, μmol m-2 d-1) of gases were generally determined using the bulk flux equation proposed by Liss and Merlivat (1986) as follows:
where k (units: cm h-1) is the gas transfer velocity; and Cw and Ca are the gas concentrations in surface seawater and marine atmosphere, respectively.
For DMS sea-air flux, the equation proposed by Liss and Merlivat (1986) was used:
where kDMS (units: cm h-1) is the gas transfer velocity of DMS; [DMS]w and [DMS]a are the surface seawater and marine atmosphere DMS concentrations, respectively, [DMS]w is usually several orders of magnitude higher than that [DMS]a and [DMS]a/H is often ignored; and H is the solubility of DMS in seawater, which varies with temperature and can be calculated using the following equation (Dacey et al., 1984):
The kDMS is parameterized using wind speed (U, m s-1) and the Schmidt number (Sc), according to commonly used equation (Nightingale et al., 2000) as follows:
where Sc for DMS can be calculated from the SST (°C) according to Saltzman et al. (1993).
For estimating sea-air CO2 flux (FCO2, mmol m-2 d-1), the equation is as follows:
where kCO2 (units: cm h-1) is the gas transfer velocity of CO2; KH (mol kg-1 atm-1) is the solubility of CO2 in seawater; and ΔpCO2 is the air-sea pCO2 difference. The kCO2 was calculated based on the Wanninkhof (2014) empirical function:
where Sc for CO2 was based on Wanninkhof (2014).
The wind speeds were measured at 20 m above sea level, and corrected for speeds at 10 m (U10) based on the logarithmic wind profile established by Hsu et al. (1994) and calibrated according to the speed of the ship’s passage:
where Ux is observed wind speed at 20 m; Zx and Z10 are heights of 20 m and 10 m, respectively; and p is set to 0.11 (Hsu et al., 1994).
The circulation features of the dominating surface current systems and the horizontal distributions of SST and SSS in the Northwest Pacific Ocean are shown in Figures 1, 2A, B. SST ranged from 13.99 to 29.64 °C, which was a wide range that illustrated the dynamic nature of the study region. The data were divided into five oceanic regions (i.e., R1 to R5) according to the characteristics of the sea areas and water masses using S-T data and the criteria established by Hanawa and Mitsudera (1987) (Figure S2). The marginal sea region with low SST and SSS, which was mainly affected by the Yellow Sea warm current (Yanagi and Takahashi, 1993), was designated R1. The North Pacific Subtropical Gyre (NPSG), designated R2, was oceanographically characterized by high temperatures and high salinity and mainly influenced by Kuroshio Current. The lowest temperature occurred in the Oyashio Current Region (R4, OCR), where the temperature was 16.26 ± 1.75°C on average, while the North Equatorial Current Region (R5, NECR) experienced the highest temperatures of any region, with an average SST of 29.43 ± 0.16°C. Strong latitudinal gradients in SST and SSS were present through the Kuroshio-Oyashio Confluence Region (Figure 3A, R3, KOCR), which may have been connected to the subarctic front formed by the convergence of the Kuroshio and Oyashio currents (Sugimoto et al., 2014).
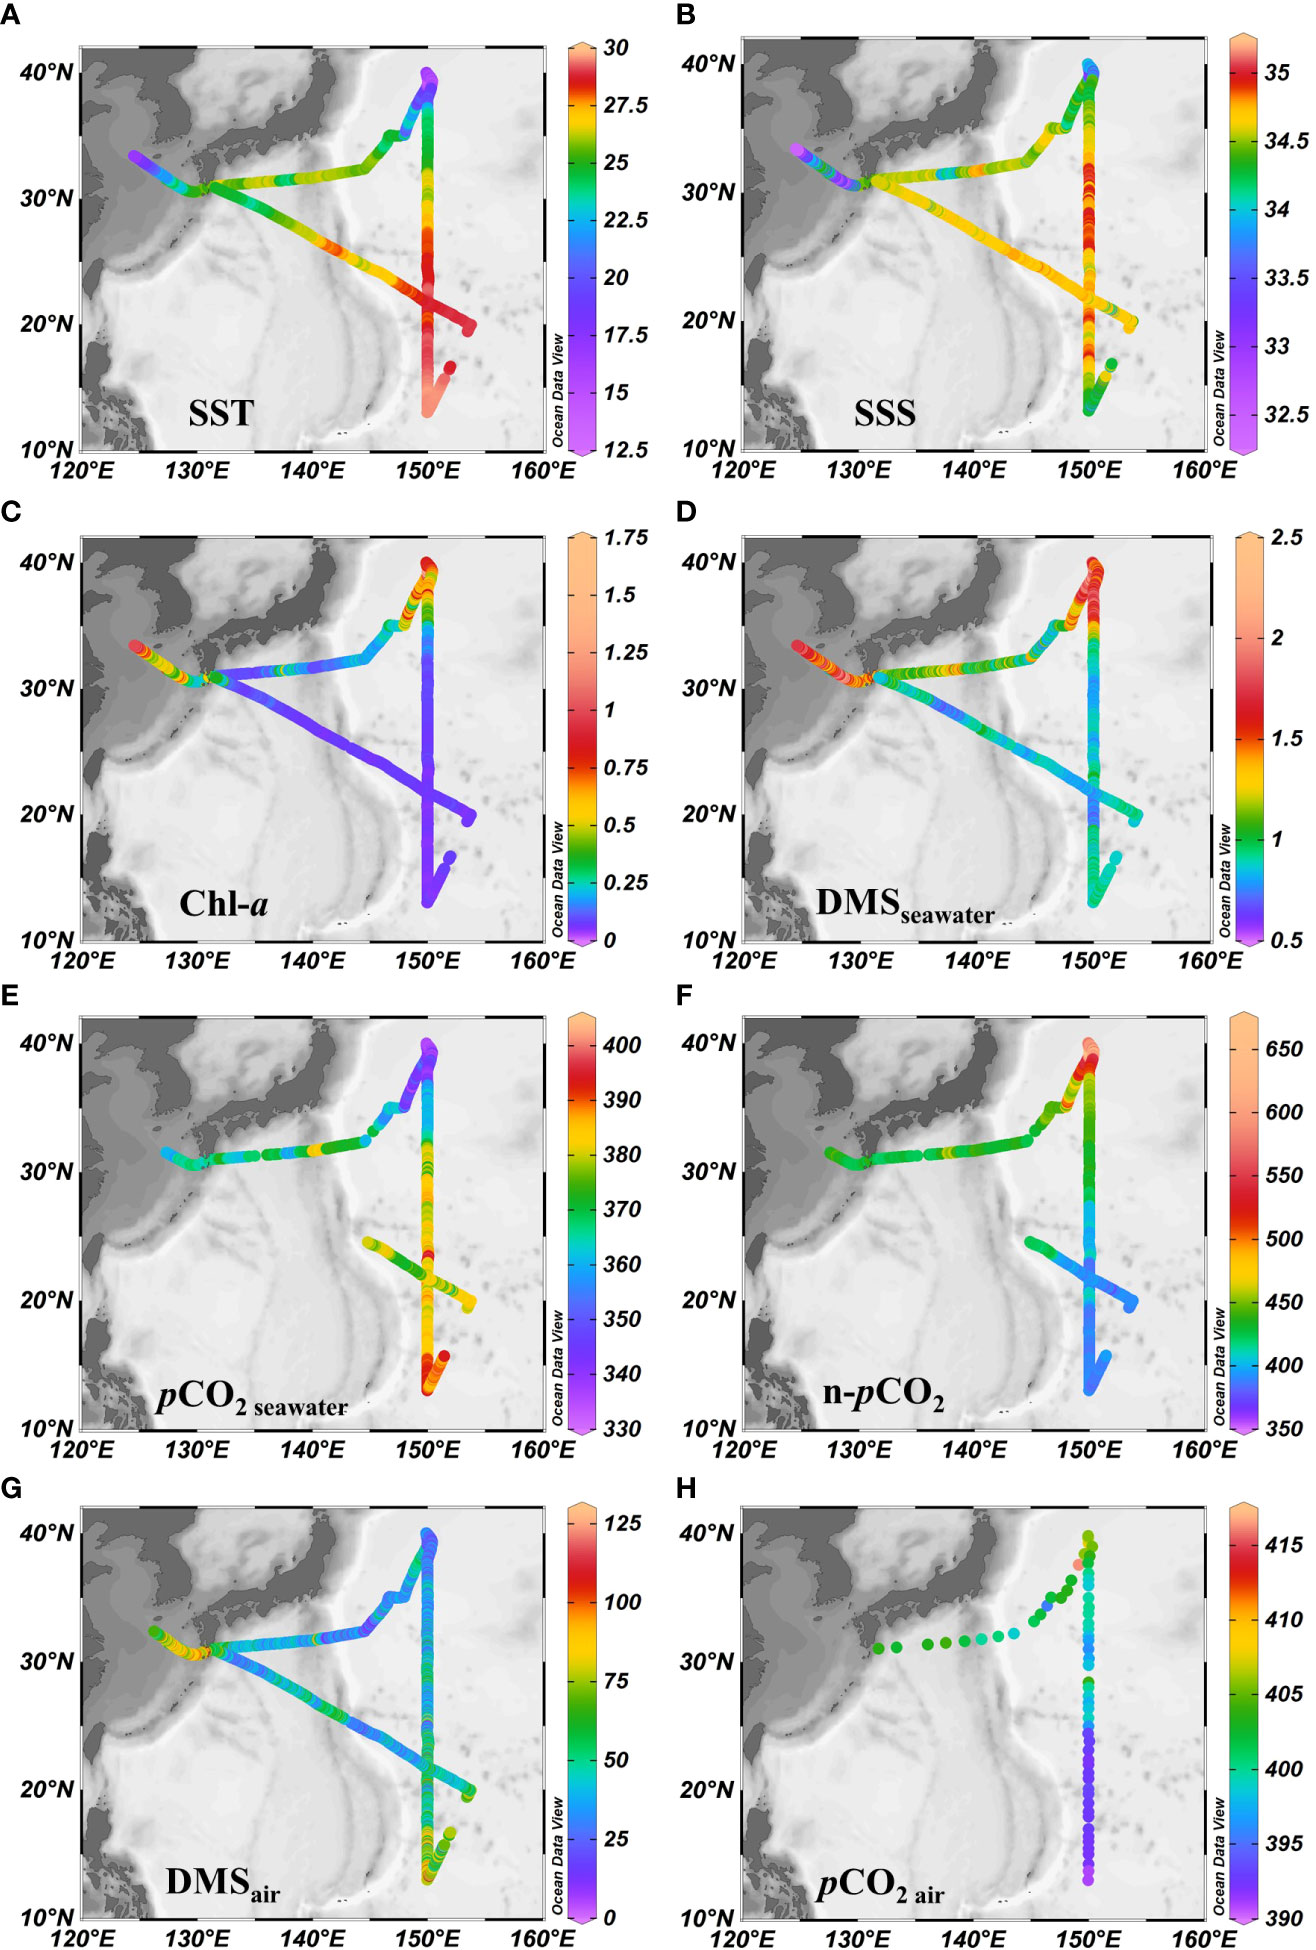
Figure 2 Horizontal distributions of underway (A) SST (°C), (B) SSS, (C) Chl-a (μg L-1), (D) DMSseawater (nmol L-1), (E) (μatm), (F) n-pCO2 (μatm), (G) DMSair (pptv), and (H) (μatm). Note that n-pCO2 was calculated using the formula n-pCO2 = pCO2 × exp [0.0423 × (29.5 - SST)]) following Takahashi et al. (2002), where n-pCO2 is the sea surface pCO2 when the temperature is normalized to the mean temperature of NECR (29.5°C).
The concentrations of DMS (Figure 2D) followed similar trends to those of Chl-a (Figure 2C), they both showed obvious gradients along the ocean front (Figures 3C, F), roughly matching the discrete nutrient measurements which exhibited cliff-like changes (Figure 3B). The mean concentrations of DMS and Chl-a were 1.08 ± 0.34 nmol L-1 (range: 0.63-2.28 nmol L−1) and 0.22 ± 0.24 μg L-1 (range: 0.04-1.60 μg L-1), respectively. It is worth noting that the observations from our cruise track filled in the gaps of previous observations in the same area during the same period (Figure S1). The concentrations of Chl-a and DMS in the five regions are summarized in Table 1. The average concentrations of Chl-a increased from 0.10 ± 0.06 μg L-1 and 0.05 ± 0.01 μg L-1 in the oligotrophic NPSG and NECR to 0.44 ± 0.21, 0.51 ± 0.15, and 0.86 ± 0.24 μg L-1 in the nutrient rich marginal sea, KOCR, and OCR. Meanwhile, the concentrations of DMS in the marginal sea, KOCR, and OCR were about twice than those in the NPSG and NECR. The highest DMS values occurred alongside the highest Chl-a levels in the OCR. The abundant nutrients of the Oyashio Current promoted the growth of phytoplankton in this area, which promoted the production and release of DMS. The concentrations of DMS in the NPSG and NECR were relatively low and did not exhibit significant change, which was related to the limited nutrient availability that restricted phytoplankton growth (Yasunaka et al., 2014; Lin et al., 2020; Wang et al., 2022). The Northwest Pacific Ocean is a significant contributor to the global DMS.
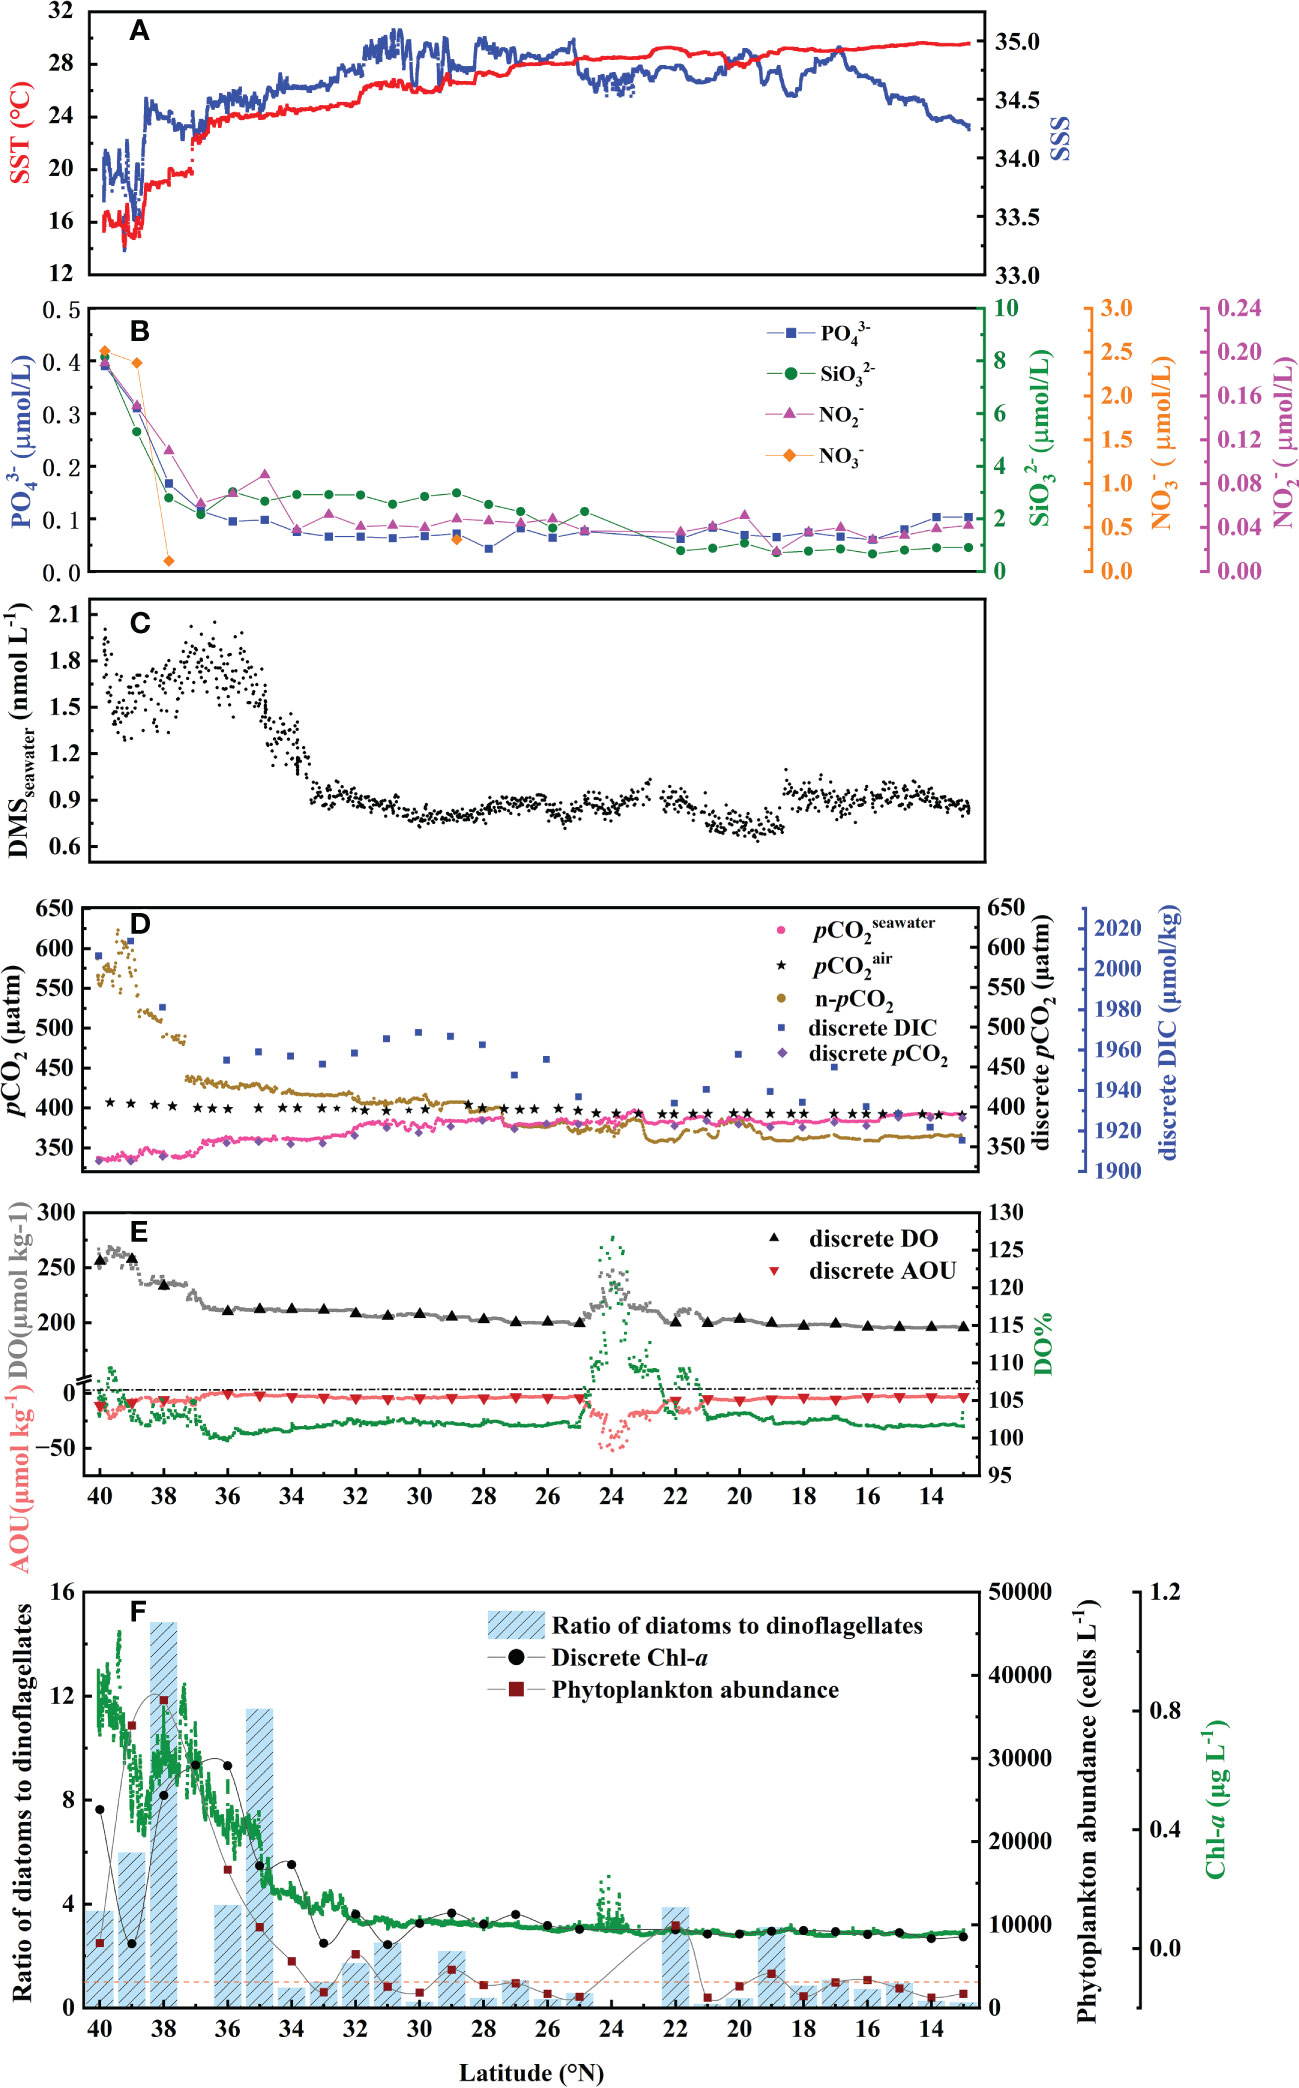
Figure 3 Latitudinal change along the 150°E transect in November 2019 in (A) underway SST and SSS, (B) discreate , , , and , (C) underway DMSseawater, (D) underway , , and n-pCO2; discreate DIC and pCO2, (E) underway DO, AOU and DO%; discreate DO and AOU, and (F) underway Chl-a, discreate Chl-a, ratio of diatoms to dinoflagellates, and phytoplankton abundance. Samples for discrete parameters were collected at each station.
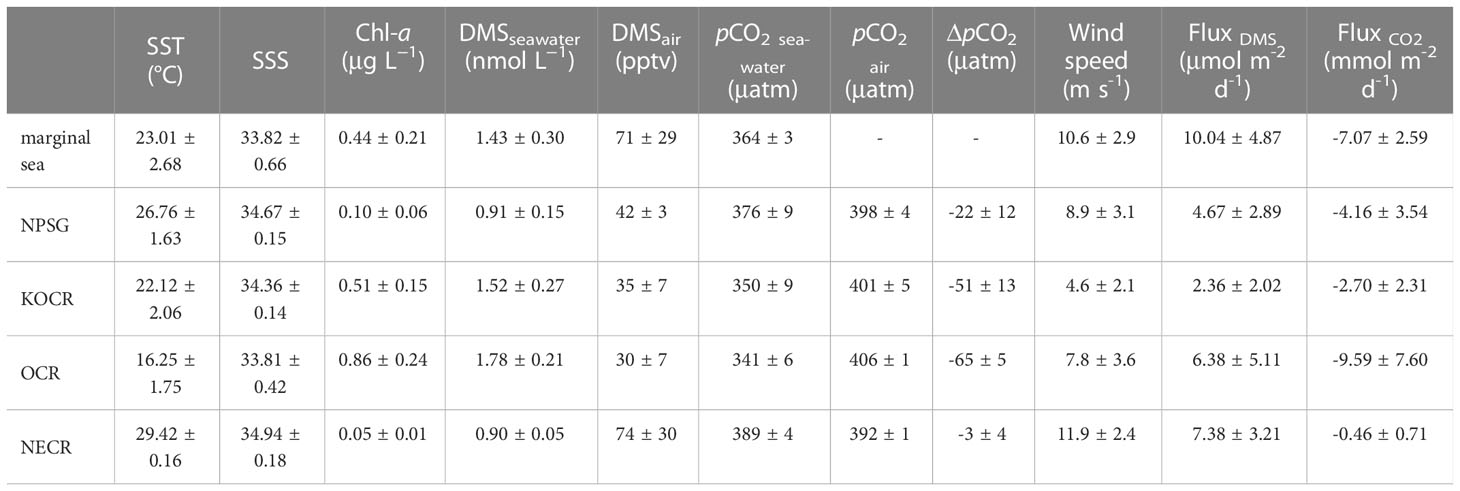
Table 1 SST, SSS, DO, Chl-a, DMSseawater, DMSair, pCO2 seawater, and pCO2 air levels in different regions.
We explored the relationship between the DMS and Chl-a in the Northwest Pacific Ocean (Figure 4B) and showed that there was a strong correlation between DMS and Chl-a in the surface seawater of the Northwest Pacific Ocean (Figure 4B), [DMS]seawater = 0.604[Chl-a]seawater + 0.834 (R2 = 0.658, P< 0.01). The discrete phytoplankton abundance of the three stations (P1: 40° N, P2: 39° N, and P3: 38° N) in the OCR were very high, reaching 7800, 33950, and 37000 cells L-1, respectively. However, the concentrations of DMS (P1: 1.91 nmol L-1, P2: 1.67 nmol L-1, and P3: 1.82 nmol L-1) did not change according to the increase of phytoplankton abundance (Figures 3C, F). In the OCR region, the dominance of diatoms increased from north to south (Figure 3F), with the ratios of diatoms to dinoflagellates at P1, P2, and P3 stations being 3.7, 6.0, and 14.8, respectively. However, diatoms are generally considered to be inefficient producers of DMS, the dinoflagellates contributed much more to DMS production (Liss et al., 1994; Stefels et al., 2007). This is why the high phytoplankton abundance in P2 and P3 stations did not correspond to extremely high DMS values. These results indicated that, in addition to phytoplankton abundance, the composition of the phytoplankton community also affects the distribution of DMS in the Northwest Pacific Ocean. The difference in phytoplankton community only existed between the OCR and other regions, which had little effect on the relationship between DMS and Chl-a in the whole survey area.
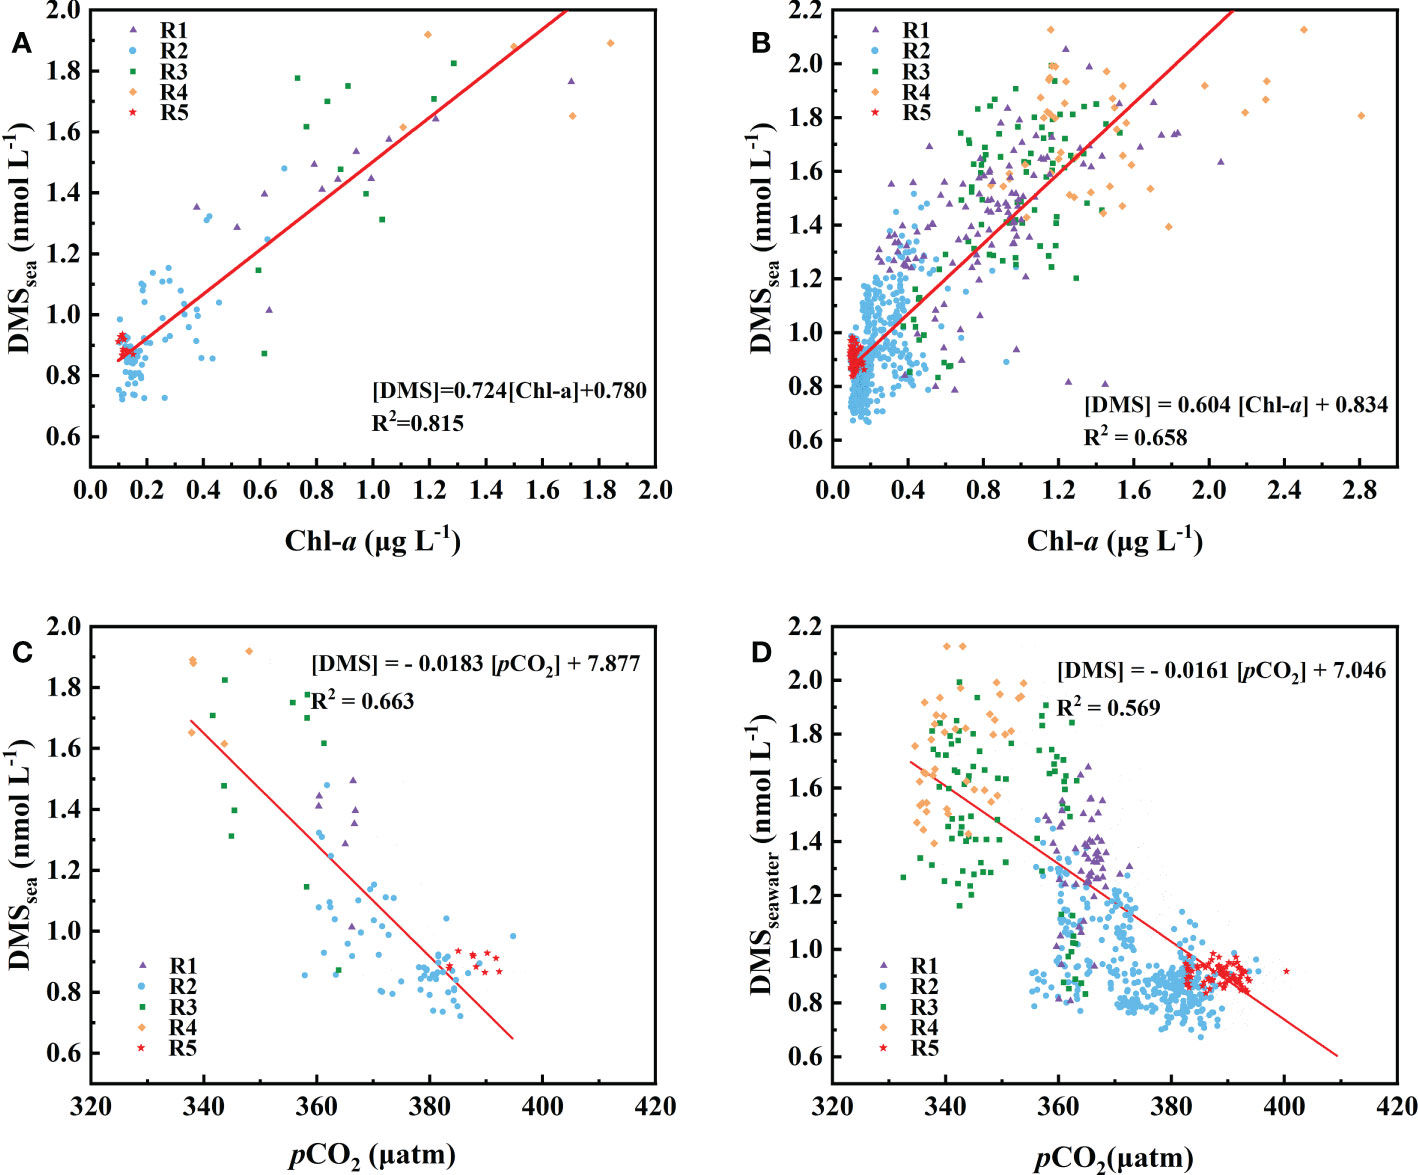
Figure 4 Relationship between Chl-a (A, B) and pCO2 (C, D) with observed DMS concentrations. The data presented are means of (A, C) 1° and (B, D) 0.1° grids.
A strong cold eddy, which was accompanied by low SST and SSS, was observed where the cruise track crossed the Kuroshio large meander (Figures 5A, B). This indicated that the cold eddy might be mainly composed of the coastal water mass in southern Japan. The maximum differences in SST and SSS between the center of the cold eddy and the surrounding sea area were 2.9 °C and 0.83, respectively. Correspondingly, the DO increased from 205 ± 1 μmol Kg-1 outside the cold eddy to 215 ± 1 μmol Kg-1 inside the cold eddy. The seawater DMS concentrations increased slightly with the elevation of Chl-a along the path through the cold eddy (Figure 5B). In contrast to the Kuroshio waters, the Japanese coastal waters north of the Kuroshio have abundant nutrients that promote phytoplankton reproduction and DMS release. Meanwhile, surface seawater pCO2 decreased from 370 ± 1 ppm to 360 ± 3 ppm (Figure 5B). Coastal waters generally have lower DIC concentrations than the Kuroshio, which may be the cause of the low pCO2 (Ishii et al., 2001). Overall, the cold eddy increased DMS levels by 10% and the carbon sink intensity by 3%. These rapid changes in DMS levels occurred over a short time (under 0.5 h) and distance (about 9 km), and could not be observed by traditional sampling methods. The high-resolution underway measurements enhance the synchronous changes of DMS with various physical and biological parameters on small spatial scale features. These observations showed that, when estimating the DMS and CO2 air-sea budgets in the Northwest Pacific, the influence of eddies should be taken into consideration.
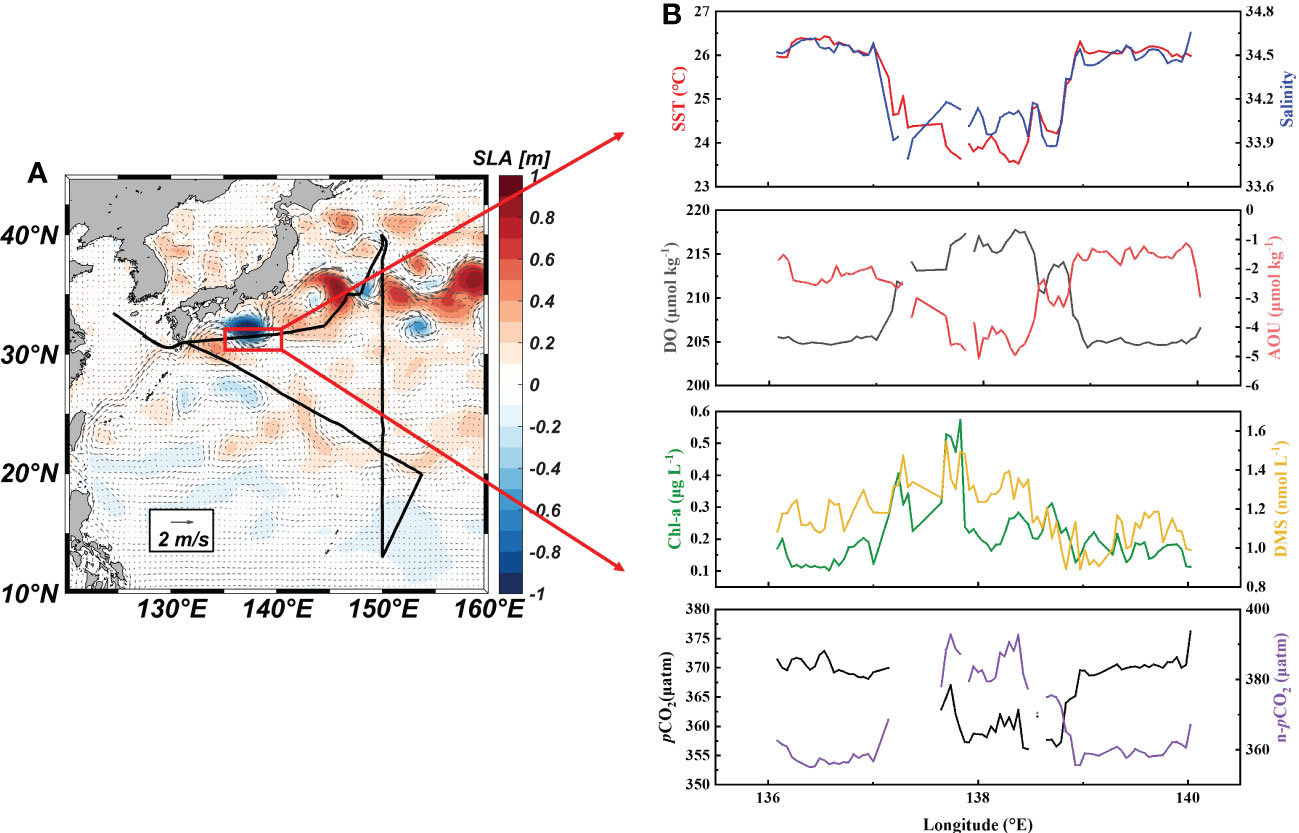
Figure 5 Monthly mean sea level anomaly and geostrophic currents in the Northwest Pacific Ocean (A) and underway parameters (SST, SSS, DO, AOU, Chl-a, DMS, pCO2 and n- pCO2) through the cold eddy (B).
The surface seawater pCO2 in the study region ranged from undersaturated at 332 μatm to highly supersaturated at 401 μatm with an average of 371 ± 16 μatm, and showed a spatial distribution pattern similar to SST, with an abrupt drop occurring at 37° N at the Kuroshio front (Figure 2E). In addition, sea surface pCO2 (390 ± 4 μatm) was at or close to equilibrium with the atmosphere (392 ± 1 μatm) in the NECR. The sea surface pCO2 levels of the NPSG, KOCR, and OCR were 376 ± 9 μatm, 350 ± 9 μatm, and 341 ± 6 μatm. Along the 150°E transect, the pCO2 difference between seawater and air () ranged from - 3 ± 12 μatm, - 22 ± 12 μatm, - 51 ± 13 μatm, and - 65 ± 5 μatm in the NECR, NPSG, KOCR, and OCR, respectively (Table 1). The surface seawater pCO2 was normalized to the mean temperature of the NECR (29.5 °C), and the changes in normalized pCO2 (n- pCO2, n-pCO2 = pCO2 × exp [0.0423 × (29.5 - SST)]) (Takahashi et al., 1993) was symmetric with the changes in in-situ surface pCO2 (Figures 2F, 3D) (Note that the average temperature in the NECR was selected as the normalized temperature, which was consistent with the NECR as the “starting area” when discussing the effects of pCO2 distribution below). The latitudinal variation characteristic of n-pCO2 was consistent with that of discrete DIC (Figure 3D), and the difference in n-pCO2 between NECR and OCR might be due to the DIC regional variation. In KOCR and OCR, low surface pCO2 corresponded to relatively high Chl-a and oversaturated DO (Figures 2C, E, 3D and E), indicating that biological activities (photosynthesis) partly induced DO addition and depleted sea surface CO2 (reduce pCO2).
The SST of the survey area had a 15°C change, which may have influenced the spatial distribution of pCO2. Therefore, to further reveal the controlling factors of surface seawater pCO2 distribution in the study area, we plotted the relationship between surface pCO2 and SST using the equation from Takahashi et al. (1993): pCO2 = 390 × exp [0.0423 × (SST - 29.5)], where 390 μatm is the mean surface pCO2 in the “starting zone”. In general, the latitudinal variation in surface pCO2 was roughly controlled by SST change, especially in the NECR where the surface pCO2 had a strong relationship with temperature (Figure S3A). In the NPSG, KOCR, and OCR, the surface pCO2 values were higher than the values forecasted based on SST (Figure S3A), demonstrating that non-thermal processes were elevating the surface pCO2. In other words, DIC concentrations were higher in those areas compared to NECR. In addition, the surface pCO2 in NPSG, KOCR, and OCR was lower than the atmospheric equilibrium pCO2, the process of sea-air exchange also increased their surface pCO2 (Figure S3B).
To quantify the regulators of latitudinal variation in , from the “starting area” to the OCR, the decomposition of can be expressed as follows according to Li et al. (2022):
where and were both 390 μatm in the starting zone, respectively. The , , and represent the contributions of cooling, biological activities, and atmospheric pCO2 changes to , respectively, and primarily indicates contributions of vertical mixing and air-sea exchange on . Note that the effect of air-sea exchange on pCO2 in the Northwest Pacific is weak (Ishii et al., 2001; Li et al., 2022), and can be understood to be mainly contributed by vertical mixing which brings CO2 (DIC)-rich waters from depth to the surface layer. The calculation method of each process contribution is shown in the supporting material. The results showed that changed from 0 ± 2 μatm in NECR to -32 ± 22 μatm in NPSG to -97 ± 25 μatm in KOCR, and -173 ± 3 μatm in OCR, while the changes of and were not obvious (Figure S4 and Table S2). However, values were 0 ± 2 μatm in NECR, 23 ± 17 μatm in NPSG, 62 ± 18 μatm in KOCR, and 132 ± 2 μatm in OCR, respectively. In summary, physical processes such as cooling and vertical mixing mostly influenced the latitudinal changes in . In the Northwest Pacific, the OCR and KOCR acted as significant carbon sinks.
Although previous simulation of surface seawater DMS presented relatively high R2 (0.68 to 0.84) by using the mixed layer depth and Chl-a (Simó and Dachs, 2002), there are few practical data to construct this model, especially the data from the Northwest Pacific Ocean. In addition, the relative uncertainty in quantifying the annual mean concentrations of surface seawater DMS in temperate regions was up to 50% (Belviso et al., 2004). The empirical equation of sea surface DMS in the North Pacific Ocean was constructed using SST, sea surface nitrate (SSN), and latitude (Watanabe et al., 2007). However, due to the lack of observation time series of DMS and other hydrological parameters (especially SSN), the algorithm may be difficult to be applied to future DMS prediction. A comparison of the time series for DMS and pCO2 showed that they tended to exhibit opposing trends (Figures 2D, E). Tortell et al. (2012) and Zhang et al. (2017) compared DMS concentrations and pCO2 in surface seawater and observed a large range of negative correlations (r value ranged from -0.03 to -0.73) in the Southern Ocean, but they were never tested in the Northwest Pacific Ocean. The n-pCO2 could be used as an indicator of net community production (NCP) when the effects of vertical mixing and air-sea gas exchange were negligible (Kameyama et al., 2014), and previous studies also found a good correlation between DMS and NCP (Kameyama et al., 2013). However, our results indicate that vertical mixing was an important factor affecting pCO2 distribution in the Northwest Pacific Ocean (Section 3.3). The NCP calculation process limited the application of this method in a wide range, especially in areas with deep water upwelling, such as OCR.
We explored the relationship between the DMS and pCO2 in the Northwest Pacific Ocean, and plotted DMS concentrations against pCO2 for the 1°-grid and 0.1°-grid mean data sets (Figure 4). There was a significant negative correlation between DMS and pCO2 for both the 1°-grid data set ([DMS]seawater = -0.0183 × + 7.877, R2 = 0.663, P< 0.01, Figure 4C) and 0.1°-grid data set ([DMS]seawater = -0.0161 × + 7.0, R2 = 0.569, P< 0.01, Figure 4D). The consistency of the slopes and intercepts between data sets at different spatial resolutions suggested that the influences of controlling factors such as SST, sea-air exchange, and biological activity were consistent over different spatial scales. In the surface seawater of the Northwest Pacific Ocean, the DMS concentration and SST exhibited a significant negative correlation (r = -0.744, p<0.01, Table S1), while there was a significant positive correlation between pCO2 and SST (r = 0.847, p<0.01, Table S1). SST inversely affected the surface ocean DMS and pCO2 values. The surface seawater of the Northwest Pacific Ocean released DMS to the atmosphere and absorbed CO2 through air-sea exchange, which contributed to the negative correlation between DMS and pCO2. High phytoplankton abundance and strong biological activity can enhance the uptake of CO2 from seawater while simultaneously synthesizing more DMS precursor. A significant correlation was found between DMS and Chl-a in the surface seawater of the Northwest Pacific Ocean (Figures 4A, B). Although the variation of its slope (16.5%) with sampling frequency is slightly greater than that between DMS and pCO2 (12%), the correlation between DMS and Chl-a (R2 = 0.658, Figure 4B) is slightly higher than that between DMS and pCO2 (R2 = 0.569, Figure 4C). In the Northwest Pacific Ocean, Chl-a, as an indicator of phytoplankton standing stock, seems to have a more directly effect on DMS concentration than pCO2. Hence, the DMS-vs-Chl-a correlation appears to be useful for estimating the distribution of DMS in the Northwest Pacific Ocean, given the easy availability of remote sensing Chl-a data. On the other hand, direct measurements of pCO2 are relatively abundant (usually below 0.1°) in the SOCAT database and the data were strictly quality controlled, which were better than the Chl-a data obtained from the satellite remote sensing. In addition, our algorithm can explain 56.9% of surface seawater DMS variance in the Northwest Pacific Ocean. Although the use of data with high temporal resolution in the algorithm leads to partial dispersion and underestimation (less than 20%) of the predicted values (Figure S5A), the standard deviation (SD) of the observed DMS value of 0.34 is 1.8 times that of the algorithm the root mean square error (RMSE=0.19), suggesting that the algorithm is also satisfactory in predicting DMS. (Ritter and Muñoz-Carpena, 2013). Note that the RMSE is used to quantify the prediction error of the variable unit calculated by the model, and its definition is , where Oi and Pi represent the sample (of size N) containing the observations and the model estimates, respectively. Therefore, pCO2 has great potential as an indicator for the distribution of surface seawater DMS in the Northwest Pacific Ocean and may be simpler than previously used DMS parameterization methods. This algorithm may not be suitable for reconstructing more productive spring and summer surface water DMS in the Northwest Pacific (R2 = 0.14, May-June 2021, unpublished). In spring and summer, phytoplankton blooms and changes in phytoplankton community structure leaded to latitude decoupling of DMS, Chl-a and pCO2. However, in OCR and KOCR with the highest biological activity, the relationship between DMS and pCO2 will still be applicable due to the shallower mixing layer in summer, the reduced vertical mixing effect, and the greater influence of thermodynamic effects and biological activities on pCO2.
The mean atmospheric DMS mixing ratios (range) were 46 ± 19 (3- 125) pptv throughout the survey area (Figure 2G). The KOCR region had the lowest mean wind speed (mean: 5 ± 2 m s-1), which was accompanied by a relatively low DMS mixing ratio, despite the DMS concentration being relatively high in this region (Table 1). The concentrations of sea surface DMS did not correlate with atmospheric DMS mixing ratios (r = -0.017, P > 0.05) (Table S1), likely because, the transport of air mass was much faster than that of seawater, leading to a decoupling between atmospheric and seawater DMS concentrations (Aranami and Tsunogai, 2004; Wohl et al., 2020). The surface seawater DMS concentrations were roughly uniform and generally low in the NECR, but the atmospheric DMS mixing ratios were high (mean: 74 ± 30 pptv), due to the high DMS sea-air flux caused by the high wind speeds (mean: ~12 m/s).
The continuous underway DMS sea-air flux, CO2 sea-air flux, and wind speed measurements during the cruise are shown in Figure 6. The DMS sea-air flux varied over a wide range, from 0.04 to 25.3 μmol m-2 d-1, with an average flux of 5.37 ± 3.86 μmol m-2 d-1. In addition, based on the DMS concentration in the Northwest Pacific Ocean derived from the algorithm in Section 3.4, the sea-air flux of DMS was predicted (Fluxpre). The values of Fluxpre correspond well to the Flux values (Figure S5B), and the SD (3.86) of Flux is 3.6 times that of RMES (1.07) of this algorithm, that is, the algorithm provides a very good prediction of DMS air-sea flux in the Northwest Pacific (Ritter and Muñoz-Carpena, 2013). The DMS sea-air flux was high in the OCR region, which might have been because this area had the highest DMS levels (mean: 1.78 ± 0.21 nmol L-1) and relatively high wind speeds (mean: 7.8 ± 3.6 m s-1). The marginal sea region accounted for only 0.21% of the global ocean area (based on the area of the East China Sea), but contributed to 0.64% of global annual DMS emissions due to the highest sea-air flux of DMS (10.0 ± 4.87 μmol m-2 d-1), making it an important source of global DMS emissions. Although the mean DMS sea-air flux in the open waters of the Northwest Pacific Ocean was only half that in the marginal sea, it remained 5.2% of global DMS emissions given its vast area (3.2% of the global area). Although seasonal variations were not taken into account in the calculation of DMS sea-air fluxes based on one-shot survey data, the season of this observation was at the end of autumn, when biological activity and DMS concentrations were at lower all the year round, which may underestimate the contribution to global DMS emissions. The survey area was more productive and released more DMS in spring and summer, we speculated that the sea-air flux of DMS in spring and summer in the Northwest Pacific Ocean would be higher.
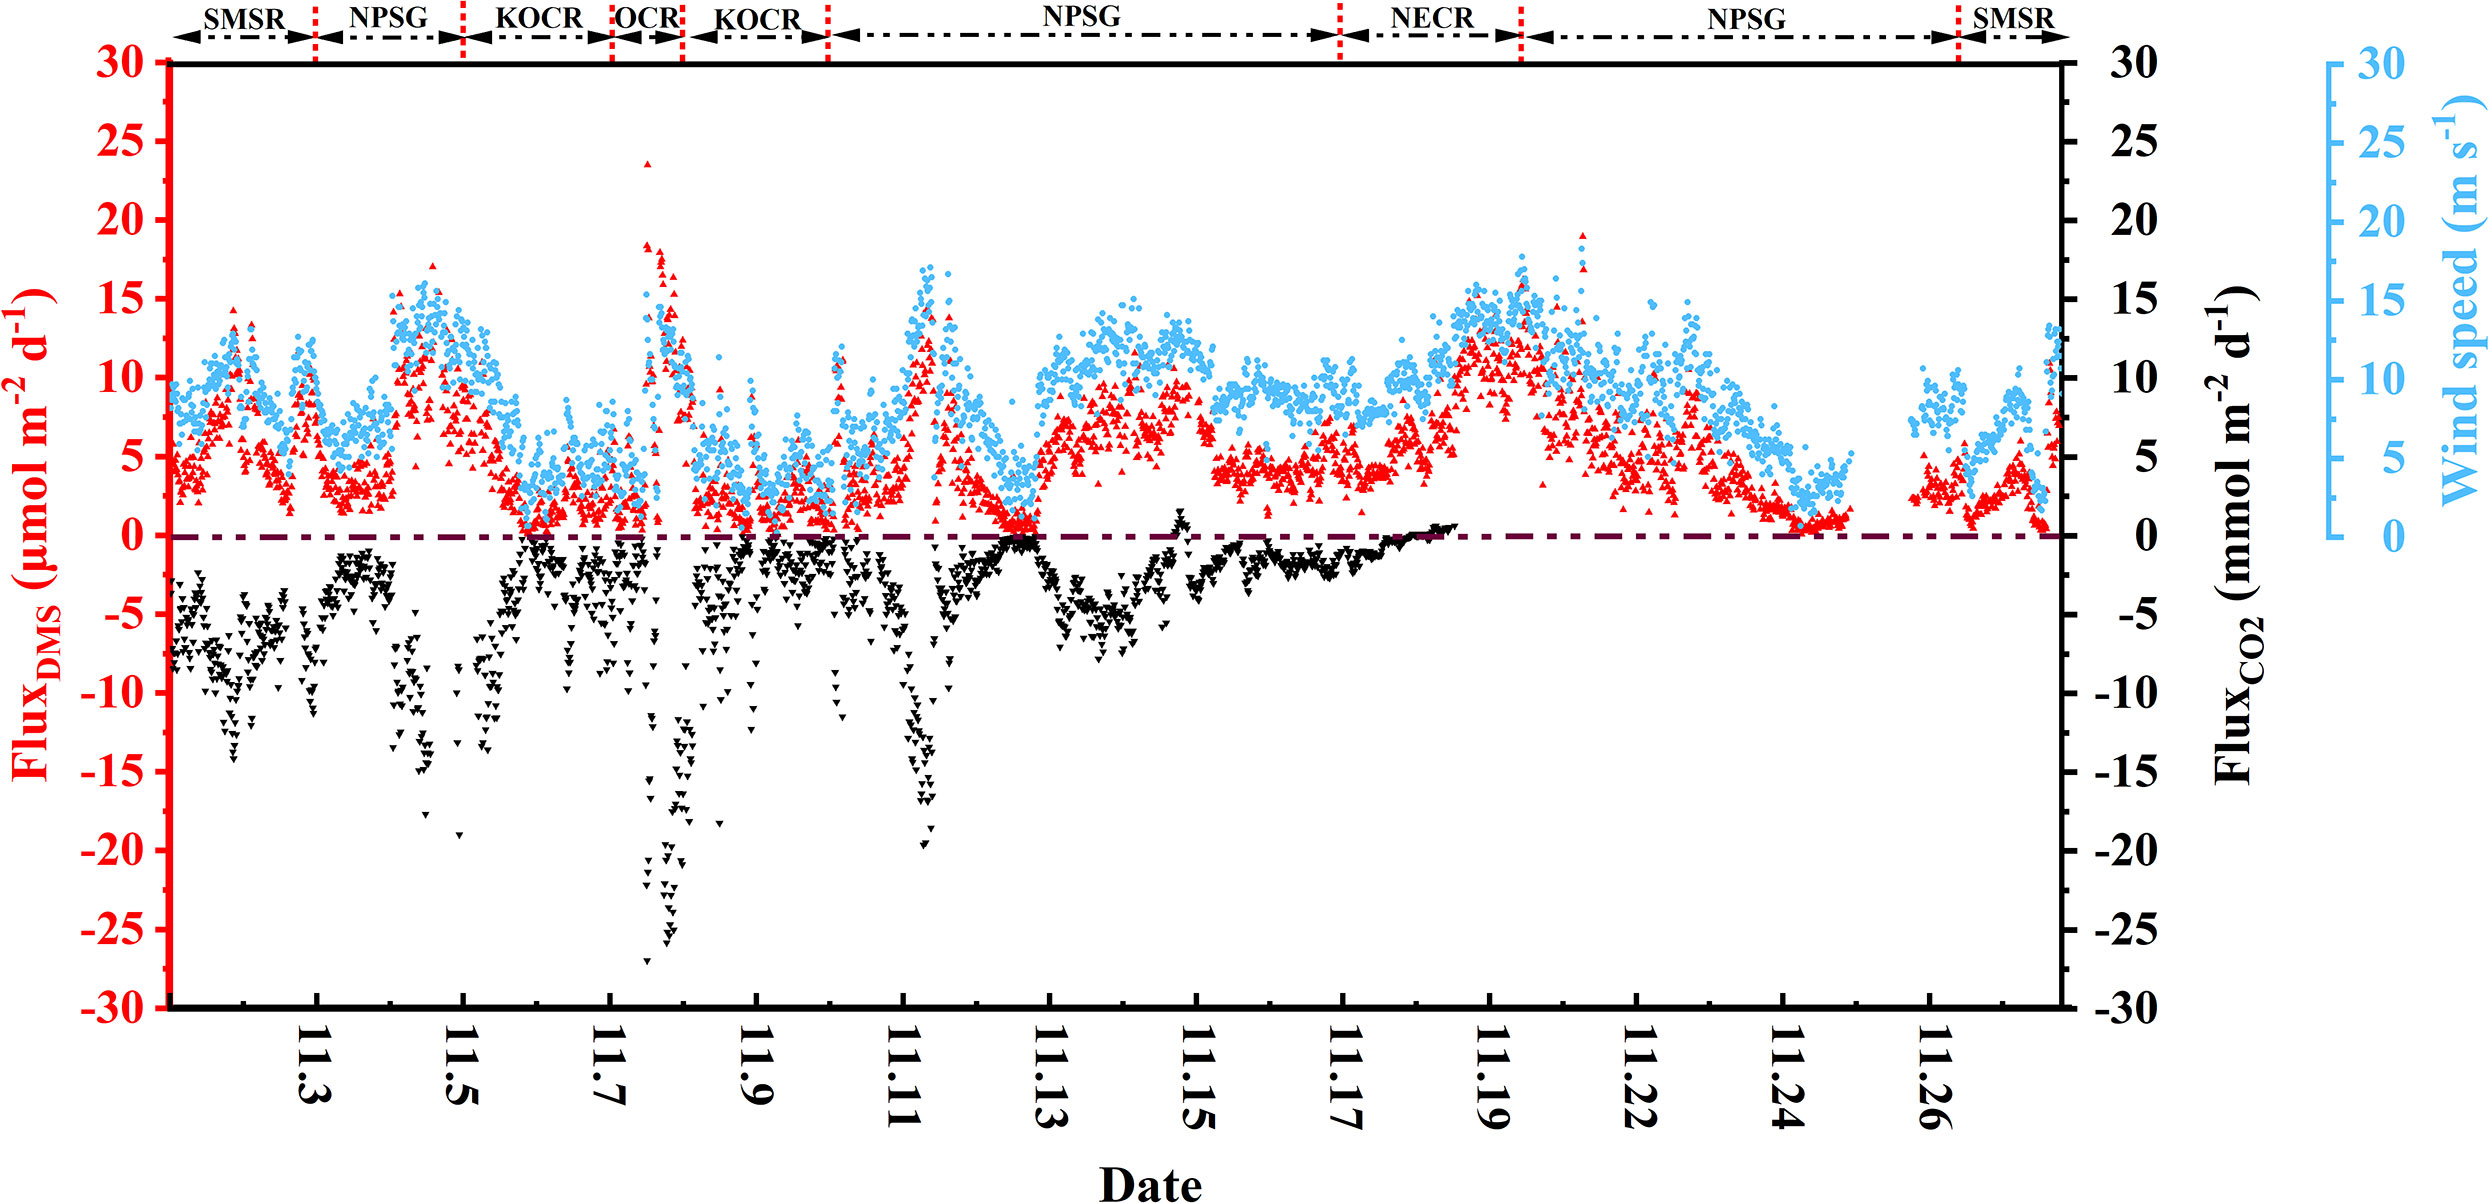
Figure 6 Time series of DMS and CO2 sea-air fluxes with wind speed in the Northwest Pacific Ocean.
The atmospheric pCO2 in the Northwest Pacific Ocean ranged from 391 to 416 μatm and showed a decreasing trend from high latitudes to low latitudes (Figures 2H, 3D), and the mean CO2 sea-air flux was -4.20 ± 4.21 mmol m-2 d-1 (range: -27.0 to 4.22 mmol m-2 d-1). In the NECR, atmospheric pCO2 (392 ± 1 μatm) was close to the seawater pCO2 (389 ± 4 μatm). The OCR had a much higher flux (mean: -9.59 ± 7.60 mmol m-2 d-1) compared to the NPSG (mean: -4.16 ± 3.54 mmol m-2 d-1) and NECR (mean: -0.46 ± 0.71 mmol m-2 d-1), because the OCR had both higher wind speed (mean: 7.8 ± 3.6 m s-1) and a much larger ΔpCO2 (mean: -65 ± 5 μatm). Although ΔpCO2 was large in the KOCR (mean: -51 ± 13 μatm, Table 1), the pCO2 air-sea flux in this area was only -2.70 ± 2.31 mmol m-2 d-1 because it had the lowest wind speed (mean: 4.6 m s-1). The carbon sink intensity was weak in the low latitude region (NECR), which was even a carbon source in some areas (Figure 6). However, the Northwest Pacific Ocean remains one of the most important carbon sinks in the world, especially in the Oyashio Current Region.
Continuous underway measurements of DMS and pCO2 in the surface water and air of the Northwest Pacific Ocean were taken between 1 November to 29 November 2019. There was much larger variability in the DMS and pCO2 in the surface seawater than in the atmosphere. The highest surface seawater DMS concentration occurred in the region co-influence by the Kuroshio-Oyashio Currents, which had the highest Chl-a levels and the lowest pCO2. The trends in DMS of surface seawater in the Northwest Pacific Ocean under different current systems were primarily associated with phytoplankton abundance and community composition. The distribution of surface seawater pCO2 in the Northwest Pacific Ocean was influenced by both temperature and biological activity. The observed cold eddy in the Northwest Pacific Ocean promoted the growth of phytoplankton, resulting in the elevation of DMS and reduction of pCO2 in the surface layer. By comparing biophysical and chemical parameters, we found a significant negative relationship between the distributions of DMS and pCO2 in surface seawater, which may be helpful in reconstructing the distributions of DMS in surface seawater of the Northwest Pacific Ocean and the sea-air flux of DMS in the Northwest Pacific Ocean. The Northwest Pacific Ocean, especially the OCR, is an important source of DMS and an important sink of CO2.
The original contributions presented in the study are included in the article/Supplementary Material. Further inquiries can be directed to the corresponding authors.
H-HZ and G-PY designed the study. S-BY performed the experiments, with assistance from X-JL, FX and JW. X-JL provided pCO2 data. S-BY organized and analyzed the database, wrote the manuscript and prepared the tables and figures. H-HZ, FX, G-PY, G-CZ, YZ, and ZC provided comments on data analysis and revised the manuscript. All authors contributed to the article and approved the submitted version.
This work was financially supported by the National Natural Science Foundation of China (42276042, 41976038 and 41876082); the Fundamental Research Funds for the Central Universities (202072001), the Special Fund of Qingdao Pilot National Laboratory for Marine Science and Technology from Shandong Province (2022QNLM010103-1).
We thank the chief scientist, captain and crews of the R/V “Dongfanghong 3” for assistance and cooperation during the investigation. We gratefully acknowledge Mi-Ming Zhang for providing technical guidance on DMS underway observation equipment, Jia-Wei Zhang for providing the phytoplankton abundance data, and Yu-Bin Hu for providing the discreate DIC and pCO2.
The authors declare that the research was conducted in the absence of any commercial or financial relationships that could be construed as a potential conflict of interest.
All claims expressed in this article are solely those of the authors and do not necessarily represent those of their affiliated organizations, or those of the publisher, the editors and the reviewers. Any product that may be evaluated in this article, or claim that may be made by its manufacturer, is not guaranteed or endorsed by the publisher.
The Supplementary Material for this article can be found online at: https://www.frontiersin.org/articles/10.3389/fmars.2023.1074474/full#supplementary-material
Alcolombri U., Ben-Dor S., Feldmesser E., Levin Y., Tawfik D. S., Vardi A. (2015). Identification of the algal dimethyl sulfide–releasing enzyme: A missing link in the marine sulfur cycle. Science 348, 1466–1469. doi: 10.1126/science.aab1586
Allen M. R., Frame D. J., Huntingford C., Jones C. D., Lowe J. A., Meinshausen M., et al. (2009). Warming caused by cumulative carbon emissions towards the trillionth tonne. Nature 458, 1163–1166. doi: 10.1038/nature08019
Aranami K., Tsunogai S. (2004). Seasonal and regional comparison of oceanic and atmospheric dimethylsulfide in the northern north pacific: Dilution effects on its concentration during winter. J. Geophys. Res. D.: Atmos. 109, 1–15. doi: 10.1029/2003JD004288
Asher E. C., Dacey J. W. H., Jarniková T., Tortell P. D. (2015). Measurement of DMS, DMSO, and DMSP in natural waters by automated sequential chemical analysis. Limnol. Oceanography: Methods 13, 451–462. doi: 10.1002/lom3.10039
Belviso S., Bopp L., Moulin C., Orr J. C., Anderson T. R., Aumont O., et al. (2004). Comparison of global climatological maps of sea surface dimethyl sulfide. Global Biogeochem. Cycles 18, GB3013. doi: 10.1029/2003GB002193
Benson B. B., Krause D. (1984). The concentration and isotopic fractionation of oxygen dissolved in freshwater and seawater in equilibrium with the atmosphere 1. Limnol. Oceanography 29, 620–632. doi: 10.4319/lo.1984.29.3.0620
Caldeira K., Wickett M. E. (2003). Oceanography: Anthropogenic carbon and ocean pH. Nature 425, 365. doi: 10.1038/425365a
Charlson R. J., Lovecook J. E., Andreae M. O., Warren S. G. (1987). Ocean phytoplankton, atmospheric sulfur, cloud albdeo and climate. Nature 326, 655–661. doi: 10.1038/326655a0
Chin M., Jacob D. J. (1996). Anthropogenic and natural contributions to tropospheric surfate : A global model analysis primarily by dry deposition wet is relatively more anthropogenic influence on SO42- decreases rapidly with altitude because of efficient scavenging of SO : and in de. J. Geophys. Res. 101, 18691–18699. doi: 10.1029/96JD01222
Chisholm S. W. (2000). Stirring times in the southern ocean. Nature 407, 685–687. doi: 10.1038/35037696
Dacey J. W. H., Wakeham S. G., Howes B. L. (1984). Henry’s law constants for dimethylsulfide in freshwater and seawater. Geophys. Res. Lett. 11, 991–994. doi: 10.1029/GL011i010p00991
Dani K. G. S., Loreto F. (2017). Trade-off between dimethyl sulfide and isoprene emissions from marine phytoplankton. Trends Plant Sci. 22, 361–372. doi: 10.1016/j.tplants.2017.01.006
Dickson A. G. (1990). Standard potential of the reaction: AgCl(s) + 1/2H2(g) = ag(s) + HCl(aq), and the standard acidity constant of the ion in synthetic sea water from 273.15 to 318.15 K. J. Chem. Thermodyn. 22 (2), 113–127. doi: 10.1007/978-1-61779-117-8_26
Friedlingstein P., Jones M. W., Sullivan M. O., Andrew R. M., Bakker D. C. E., Hauck J., et al. (2022). Global carbon budget 2021. Earth system science data. 14, 1917–2005. doi: 10.48350/168229
Gabric A. J., Simó R., Cropp R. A., Hirst A. C., Dachs J. (2004). Modeling estimates of the global emission of dimethylsulfide under enhanced greenhouse conditions. Global Biogeochem. Cycles 18, GB2014. doi: 10.1029/2003GB002183
Gao X. X., Zhang H. H., Mao S. H., Yang G. P. (2021). Responses of biogenic sulfur compound concentrations to dust aerosol enrichment and ocean acidification in the Western pacific ocean. Geophys. Res. Lett. 48, 1–10. doi: 10.1029/2021GL095527
Glasow R. V., Crutzen P. J. (2004). Model study of multiphase DMS oxidation with a focus on halogens. Atmos Chem. Phys. 4, 589–608. doi: 10.5194/acp-4-589-2004
Hanawa K., Mitsudera H. (1987). Variation of water system distribution in the sanriku coastal area. J. Oceanography 42, 435–446. doi: 10.1007/BF02110194
Hansen H. P., Koroleff F. (1999). “Determination of nutrients,” in Methods of seawater analysis. Eds. Grasshoff K., Kremling K., Ehrhardt M. (Hoboken: wiley), 159–228. doi: 10.1002/9783527613984.ch10
Honda M. C. (2003). Biological pump in northwestern north pacific. J. Oceanography 59, 671–684. doi: 10.1023/B:JOCE.0000009596.57705.0c
Hsu S. A., Meindl E. A., Gilhousen D. B. (1994). Determining the power-law wind-profile exponent under near-neutral stability conditions at Sea. J. Appl. Meteorol. Climatol. 33, 757–765. doi: 10.1175/1520-0450(1994)033,0757:DTPLWP.2.0.CO;2
Hulswar S., Simó R., Galí M., Bell T. G., Lana A., Inamdar S., et al. (2022). Third revision of the global surface seawater dimethyl sulfide climatology (DMS-Rev3). Earth Syst. Sci. Data 14, 2963–2987. doi: 10.5194/essd-14-2963-2022
Hu D., Wu L., Cai W., Gupta A.S., Ganachaud A., Qiu B., et al. (2015). Pacific western boundary currents and their roles in climate. Nature 522, 299–308. doi: 10.1038/nature14504
Ishii M., Inoue H. Y., Matsueda H., Saito S., Fushimi K., Nemoto K., et al. (2001). Seasonal variation in total inorganic carbon and its controlling processes in surface waters of the western north pacific subtropical gyre. Mar. Chem. 75, 17–32. doi: 10.1016/S0304-4203(01)00023-8
Kameyama S., Tanimoto H., Inomata S., Yoshikawa-Inoue H., Tsunogai U., Tsuda A., et al. (2013). Strong relationship between dimethyl sulfide and net community production in the western subarctic pacific. Geophys. Res. Lett. 40, 3986–3990. doi: 10.1002/grl.50654
Kameyama S., Yoshida S., Tanimoto H., Inomata S., Suzuki K.Yoshikawa-Inoue H. (2014). High-resolution observations of dissolved isoprene in surface seawater in the Southern Ocean during austral summer 2010-2011. J. Oceanogr. 70, 225–239. doi: 10.1007/s10872-014-0226-8
Karl D. M., Church M. J. (2017). Ecosystem structure and dynamics in the north pacific subtropical gyre: New views of an old ocean. Ecosystems 20, 433–457. doi: 10.1007/s10021-017-0117-0
Kettle A. J., Andreae M. O. (2000). Flux of dimethylsulfide from the oceans: A comparison of updated data sets and flux models. J. Geophys. Res. Atmos. 105, 26793–26808. doi: 10.1029/2000JD900252
Kim I., Hahm D., Park K., Lee Y., Choi J. O., Zhang M., et al. (2017). Characteristicsof the horizontal and vertical distributions of dimethyl sulfide throughout the amundsen Sea polynya. Sci. Total Environ, 584, 154–163. doi: 10.1016/j.scitotenv.2017.01.165
Landman W. (2010). Climate change 2007: the physical science basis. South Afr. Geograph. J. 92, 86–87. doi: 10.1080/03736245.2010.480842
Lin G., Chen Y., Huang J., Wang Y., Ye Y., Yang Q. (2020). Regional disparities of phytoplankton in relation to different water masses in the Northwest pacific ocean during the spring and summer of 2017. Acta Oceanol. Sin. 39, 107–118. doi: 10.1007/s13131-019-1511-6
Liss P. S., Malin G., Turner S. M., Holligan P. M. (1994). Dimethyl sulphide and Phaeocystis: A review. J. Mar. Syst. 5, 41–53. doi: 10.1016/0924-7963(94)90015-9
Liss P. S., Merlivat L. (1986). “Air-Sea gas exchange rates: Introduction and synthesis,” in The role of air-Sea exchange in geochemical cycling, vol. 185 . Ed. Buat-Ménard P. (Dordrecht: Springer), 113–127. doi: 10.1007/978-94-009-4738-2_5
Li C., Zhai W., Qi D. (2022). Unveiling controls of the latitudinal gradient of surface pCO2 in the kuroshio extension and its recirculation regions ( northwestern north pacific ) in late spring. Acta Oceanol. Sin. 41, 1–37. doi: 10.1007/s13131-021-1949-1
Meehl G. A. (1996). Climate change from increased CO2 and direct and indirect effects of sulfate aerosols. Geophys. Res. Lett. 23, 3755–3758. doi: 10.1029/96GL03478
Mehrbach C., Culberson C. H., Hawley J. E., Pytkowicz R. M. (1973). Measurement of the apparent dissociation constants of carbonic acid in seawater at atmospheric pressure. Limnol. Oceanography 18 (6), 897–907. doi: 10.4319/lo.1973.18.6.0897
Mélançon J., Levasseur M., Lizotte M., Scarratt M., Tremblay J.É., Tortell P., et al. (2016). Impact of ocean acidification on phytoplankton assemblage, growth, and DMS production following fe-dust additions in the NE pacific high-nutrient, low-chlorophyll waters. Biogeosciences 13, 1677–1692. doi: 10.5194/bg-13-1677-2016
Millero F. J. (2007). The marine inorganic carbon cycle. Chem. Rev. 107 (2), 308–341. doi: 10.1021/cr0503557
Mitsudera H., Taguchi B., Yoshikawa Y., Nakamura H., Waseda T., Qu T. (2004). Numerical study on the oyashio water pathways in the kuroshio-oyashio confluence. J. Phys. Oceanography 34, 1174–1196. doi: 10.1175/1520-0485(2004)034<1174:NSOTOW>2.0.CO;2
Mou L., Zhang H. H., Chen Z. H., Hu Y. B. (2022). Processes controlling the carbonate chemistry of surface seawater along the 150 ˚ e transect in the Northwest pacific ocean. J. Ocean Univ. China 21, 1672–5182. doi: 10.1007/s11802-022-5207-
Nightingale P. D., Malin G., Law C. S., Watson A. J., Liss S., Liddicoat M. I., et al. (2000). In situ evaluation of air-sea gas exchange parameterizations using novel conservative and volatile tracers. Global Biogeochem. Cycles 14, 373–387. doi: 10.1029/1999GB900091
Omori Y., Tanimoto H., Inomata S., Kameyama S., Takao S., Suzuki K. (2013). Evaluation of using unfiltered seawater for underway measurement of dimethyl sulfide in the ocean by online mass spectrometry. Limnol. Oceanogr. Methods 11, 549–560. doi: 10.4319/lom.2013.11.549
Pierrot D., Lewis E., Wallace D. W. R. (2006). “MS excel program developed for CO2 system calculations. ORNL/CDIAC105a,” in Carbon dioxide information analysis center (Oak Ridge, Tennessee: Oak Ridge National Laboratory, U.S. Department of energy). doi: 10.3334/CDIAC/otg.CO2SYS_XLS_CDIAC105a
Pierrot D., Neill C., Sullivan K., Castle R., Wanninkhof R., Lüger H., et al. (2009). Recommendations for autonomous underway pCO2 measuring systems and data-reduction routines. Deep-Sea Res. Part II: Topic. Stud. Oceanography 56, 512–522. doi: 10.1016/j.dsr2.2008.12.005
Qiu B., Chen S. (2010). Eddy-mean flow interaction in the decadally modulating kuroshio extension system. Deep-Sea Res. Part II: Topic. Stud. Oceanography 57, 1098–1110. doi: 10.1016/j.dsr2.2008.11.036
Riebesell U., Schulz K. G., Bellerby R. G. J., Botros M., Fritsche P., Meyerhöfer M., et al. (2007). Enhanced biological carbon consumption in a high CO2 ocean. Nature 450, 545–548. doi: 10.1038/nature06267
Ritter A., Muñoz-Carpena R. (2013). Performance evaluation of hydrological models: Statistical significance for reducing subjectivity in goodness-of-fit assessments. J. Hydrol. 480, 33–45. doi: 10.1016/j.jhydrol.2012.12.004
Sakurai Y. (2007). An overview of the oyashio ecosystem. Deep-Sea Res. Part II: Topic. Stud. Oceanography 54, 2526–2542. doi: 10.1016/j.dsr2.2007.02.007
Saltzman E. S., King D. B., Holmen K., Leck C. (1993). Experimental determination of the diffusion coefficient of dimethylsulfide in water. J. Geophys. Res. 98, 481–486. doi: 10.1029/93jc01858
Schlundt C., Tegtmeier S., Lennartz S. T., Bracher A., Cheah W., Krüger K., et al. (2017). Oxygenated volatile organic carbon in the western pacific convective center: Ocean cycling, air-sea gas exchange and atmospheric transport. Atmos Chem. Phys. 17, 10837–10854. doi: 10.5194/acp-17-10837-2017
Simó R., Dachs J. (2002). Global ocean emission of dimethylsulfide predicted from biogeophysical data. Global Biogeochem. Cycles 16, 26-1-26–10. doi: 10.1029/2001gb001829
Stefels J., Steinke M., Turner S., Malin G., Belviso S. (2007). Environmental constraints on the production and removal of the climatically active gas dimethylsulphide (DMS) and implications for ecosystem modelling. Biogeochemistry 83, 245–275. doi: 10.1007/s10533-007-9091-5
Suess E. (1980). Particulate organic carbon flux in the oceans - surface productivity and oxygen utilization. Nature 288, 260–263. doi: 10.1038/288260a0
Sugimoto S., Kobayashi N., Hanawa K. (2014). Quasi-decadal variation in intensity of the western part of the winter subarctic SST front in the Western north pacific: The influence of kuroshio extension path state. J. Phys. Oceanography 44, 2753–2762. doi: 10.1175/JPO-D-13-0265.1
Takahashi T., Olafsson J., Goddard J. G., Chipman D. W., Sutherland S. C. (1993). Seasonal variation of CO2 and nutrients in the high-latitude oceans: A comparative study. Global Biogeochem. Cycles 7, 843–878. doi: 10.1029/93GB02263
Takahashi T., Sutherland S. C., Wanninkhof R., Sweeney C., Feely R. A., Chipman D. W., et al. (2009). Climatological mean and decadal change in surface ocean pCO2, and net sea-air CO2 flux over the global oceans. Deep-Sea Res. Part II: Topic. Stud. Oceanography 56, 554–577. doi: 10.1016/j.dsr2.2008.12.009
Todd J. D., Rogers R., Li Y. G., Wexler M., Bond P. L., Sun L., et al. (2007). Structural and regulatory genes required to make the gas dimethyl sulfide in bacteria. Science 315, 666–669. doi: 10.1126/science.1135370
Tortell P. D., Long M. C., Payne C. D., Alderkamp A. C., Dutrieux P., Arrigo K. R. (2012). Spatial distribution of pCO2, ΔO2/Ar and dimethylsulfide (DMS) in polynya waters and the sea ice zone of the amundsen Sea, Antarctica. Deep-Sea Res. Part II: Topic. Stud. Oceanography 71–76, 77–93. doi: 10.1016/j.dsr2.2012.03.010
Uppström L. R. (1974). Boron/chlorinity ratio of deep-sea water from pacific ocean. Deep-Sea Res. 21 (2), 161–162. doi: 10.1016/0011-7471(74)90074-6
Vaillancourt R. D., Marra J., Seki M. P., Parsons M. L., Bidigare R. R. (2003). Impact of a cyclonic eddy on phytoplankton community structure and photosynthetic competency in the subtropical north pacific ocean. Deep-Sea Res. Part I: Oceanogr. Res. Pap. 50, 829–847. doi: 10.1016/S0967-0637(03)00059-1
Wang Y., Bi R., Zhang J., Gao J., Takeda S., Kondo Y., et al. (2022). Phytoplankton distributions in the kuroshio-oyashio region of the Northwest pacific ocean: Implications for marine ecology and carbon cycle. Front. Mar. Sci. 9. doi: 10.3389/fmars.2022.865142
Wanninkhof R. (2014). Relationship between wind speed and gas exchange over the ocean revisited. Limnol. Oceanography: Methods 12, 351–362. doi: 10.4319/lom.2014.12.351
Watanabe Y. W., Yoshinari H., Sakamoto A., Nakano Y., Kasamatsu N., Midorikawa T., et al. (2007). Reconstruction of sea surface dimethylsulfide in the north pacific during 1970s to 2000s. Mar. Chem. 103, 347–358. doi: 10.1016/j.marchem.2006.10.004
Weiss R. F., Price B. A. (1980). Nitrous oxide solubility in water and seawater. Mar. Chem. 8, 347–359. doi: 10.1016/0304-4203(80)90024-9
Wohl C., Brown I., Kitidis V., Jones A. E., Sturges W. T., Nightingale P. D., et al. (2020). Underway seawater and atmospheric measurements of volatile organic compounds in the southern ocean. Biogeosciences 17, 2593–2619. doi: 10.5194/bg-17-2593-2020
Wohl C., Jones A. E., Sturges W. T., Nightingale P. D., Else B., Butterworth B. J., et al. (2022). Sea Ice concentration impacts dissolved organic gases in the Canadian arctic. 1021–1045. Biogeosciences 19, 1021–1045. doi: 10.5194/bg-19-1021-2022
Xi C., Dong H., Ke-feng M., Yan L. (2018). Detailed investigation of the three-dimensional structure of a mesoscale cold eddy in the kuroshio extension region. J. Oper. Oceanography 11, 87–99. doi: 10.1080/1755876X.2018.1505069
Yanagi T., Takahashi S. (1993). Seasonal variation of circulations in the East China Sea and the yellow Sea. J. Oceanography 49, 503–520. doi: 10.1007/BF02237458
Yasunaka S., Nojiri Y., Nakaoka S., Ono T., Whitney F. A., Telszewski M. (2014). Mapping of sea surface nutrients in the north pacific: Basin_wide distribution and seasonal to interannual variability. J. Geophys. Res.: Oceans 119, 7756–7771. doi: 10.1002/2014JC010318
Zhang M., Chen L. (2015). Continuous underway measurements of dimethyl sulfide in seawater by purge and trap gas chromatography coupled with pulsed flame photometric detection. Mar. Chem. 174, 67–72. doi: 10.1016/j.marchem.2015.05.006
Zhang J., Chen Y., Ren X., Patil V., Sun L., Li X., et al. (2022). Distribution of phytoplankton in the East China Sea and the southern yellow Sea in spring in relation to environmental variables and dimethylsulfide compounds. Acta Oceanol. Sin. 41, 41–53. doi: 10.1007/s13131-021-1913-0
Zhang M., Gao W., Yan J., Wu Y., Marandino C. A., Park K., et al. (2019). An integrated sampler for shipboard underway measurement of dimethyl sulfide in surface seawater and air. Atmos Environ. 209, 86–91. doi: 10.1016/j.atmosenv.2019.04.022
Zhang M., Marandino C. A., Chen L., Sun H., Gao Z., Park K., et al. (2017). Characteristics of the surface water DMS and pCO2 distributions and their relationships in the southern ocean, southeast Indian ocean, and northwest pacific ocean. Global Biogeochem. Cycles 31, 1318–1331. doi: 10.1002/2017GB005637
Keywords: dimethyl sulfide, pCO2, shipboard underway measurements, sea-air flux, Northwest Pacific Ocean
Citation: Yan S-B, Li X-J, Xu F, Zhang H-H, Wang J, Zhang Y, Yang G-P, Zhuang G-C and Chen Z (2023) High-resolution distribution and emission of dimethyl sulfide and its relationship with pCO2 in the Northwest Pacific Ocean. Front. Mar. Sci. 10:1074474. doi: 10.3389/fmars.2023.1074474
Received: 19 October 2022; Accepted: 30 January 2023;
Published: 09 February 2023.
Edited by:
Jun Sun, China University of Geosciences Wuhan, ChinaCopyright © 2023 Yan, Li, Xu, Zhang, Wang, Zhang, Yang, Zhuang and Chen. This is an open-access article distributed under the terms of the Creative Commons Attribution License (CC BY). The use, distribution or reproduction in other forums is permitted, provided the original author(s) and the copyright owner(s) are credited and that the original publication in this journal is cited, in accordance with accepted academic practice. No use, distribution or reproduction is permitted which does not comply with these terms.
*Correspondence: Hong-Hai Zhang, aG9uZ2hhaXpoYW5nQG91Yy5lZHUuY24=; Gui-Peng Yang, Z3B5YW5nQG1haWwub3VjLmVkdS5jbg==
Disclaimer: All claims expressed in this article are solely those of the authors and do not necessarily represent those of their affiliated organizations, or those of the publisher, the editors and the reviewers. Any product that may be evaluated in this article or claim that may be made by its manufacturer is not guaranteed or endorsed by the publisher.
Research integrity at Frontiers
Learn more about the work of our research integrity team to safeguard the quality of each article we publish.