- 1Division of Environmental Science and Engineering, Pohang University of Science and Technology, Pohang, South Korea
- 2Institute for Convergence Research and Education in Advanced Technology, Yonsei University, Seoul, South Korea
- 3Ocean Climate and Ecology Research Division, National Institute of Fisheries Science, Busan, South Korea
- 4Department of Aquaculture and Aquatic Science, Kunsan National University, Gunsan, South Korea
- 5Department of Oceanography, Chonnam National University, Gwangju, South Korea
- 6Ecological Restoration Division, Korea Fisheries Resources Agency, Busan, South Korea
- 7Ballast Water Research Center, Korea Institute of Ocean Science and Technology, Geoje, South Korea
Photosynthetic organisms shift the dynamics of surface pCO2 driven by the sea surface temperature change (thermodynamic driver) by assimilating inorganic C from seawater. Here we measured net C uptake in a macroalgal habitat of coastal Korea for two years (2019-2020) and found that the macroalgal habitat contributed 5.8 g C m−2 month−1 of the net C uptake during the growing period (the cooling period, September−May). This massive C uptake changed the thermodynamics-driven seasonal dynamics such that the air−sea equilibrium of pCO2 was pushed into disequilibrium. The surface pCO2 dynamics during the cooling period was mostly influenced by the seasonal decrease in temperature and the proliferation of macroalgae, while the dynamics during the warming period (the stagnant period, June−August) closely followed that predicted based solely on the change in sea surface temperature (thermodynamic driver). In contrast to the phytoplankton-dominated off-shore waters (where phytoplankton populations are large in spring and summer), the impact of coastal macroalgae on surface pCO2 dynamics was most pronounced during the cooling period, when the magnitude of pCO2 change was as much as twice that resulting from temperature change. Our study shows that the distinctive features of the macroalgal habitat—in particular the seasonal temperature extremes (~18°C difference), the active macroalgal metabolism, and anthropogenic nutrient inputs—collectively influenced the seasonal decoupling of seawater and air pCO2 dynamics.
Introduction
Decades of research on the ocean carbon cycle have improved our understanding of the mechanisms underlying variations of seawater carbonate (C) parameters in diverse ocean regimes. Seasonal variations in ocean temperature largely determine the pCO2 distributions in the open ocean. Another key process is air-sea CO2 exchange, which substantially reduces the temperature-induced air-sea disequilibrium. Consequently, the rate of pCO2 increase in the open ocean is broadly consistent with the rate of increase in atmospheric pCO2, although episodic biological activity and lateral and vertical mixing still act to induce the air-sea pCO2 disequilibrium (Takahashi et al., 2006; Takahashi et al., 2009).
In contrast to the factors controlling carbonate dynamics in the open ocean, various processes (e.g., wind-driven upwelling, freshwater input, eutrophication, massive biological production and respiration) complicate the dynamics in coastal environments (Borges, 2011; Cai et al., 2011; Kim et al., 2020; Li et al., 2022). A study using a global C database showed that the latitudinal distributions and seasonality of global coastal surface pCO2 are regulated by nonthermal factors (i.e., water mixing and net primary production) (Laruelle et al., 2017). Moreover, Cai et al. (2020) reported on the comparative effects of different drivers (i.e., upwelling and biological production) on the local variability of pCO2 in a range of domains along North American ocean margins. Other studies in the South China Sea revealed distinctive differences between ocean-dominated and river-dominated ocean systems (Cao et al., 2019).
In particular, the processes occurring in coastal environments act in concert to increase phytoplankton biomass: pico- and microalgae (phytoplankton) in off-shore waters; phytoplankton and macrophytes (including macroalgae and angiosperm species) in nearshore waters. To assess the biological influence on the coastal carbonate dynamics, studies to date have examined the biological contribution to air−sea CO2 fluxes at individual coastal systems and diagnosed the CO2 source and sink nature of the coastal oceans (Dai et al., 2013; Laruelle et al., 2014). Despite the diverse dependency of the C flux on the biological productivity and disparities in air−sea CO2 fluxes at regional scales (Signorini et al., 2013; Gruber, 2015; Kubo et al., 2017), nearshore macroalgal habitats (occupying ~3.5 million km2 globally) were identified as an important CO2 sink (Ikawa and Oechel, 2015; Krause-Jensen and Duarte, 2016; Watanabe et al., 2020). Globally, the macroalgal habitats account for a net primary production of 1020−1960 Tg C yr−1 and thus have the potential to export of 61−268 Tg C yr−1 (Krause-Jensen and Duarte, 2016). By comparison, blue carbon (referring to organic C sequestered by seagrass meadows, tidal marshes, and mangrove forests) was reported to account for a maximum annual organic C burial rate of 329 Tg C yr-1 globally (Nellemann et al., 2009; Macreadie et al., 2019). A thorough mechanistic understanding of the biological contribution is urgently needed to fully characterize the C dynamics in the macroalgal ecosystems (Duarte et al., 2022).
We here assess the significance of biological control in regulating the dynamics of the carbonate parameters—pCO2, pH, CT (total dissolved inorganic carbon), and Ωarag (the seawater calcium carbonate saturation state with respect to aragonite)—in a productive macroalgal habitat of Korea. We highlight the extreme dynamics of surface water pCO2, which can represent productive nearshore ecosystems with natural and anthropogenic forcings (including large seasonal temperature variations, biological community metabolism, and anthropogenic nutrient inputs). We also provide a framework that explains the thermodynamically driven variations of carbonate parameters to facilitate data interpretation. These parameters include continuous time-resolved (1-h intervals) carbonate parameter measurements using an autonomous pCO2 sensor and discrete (weekly intervals) measurements for the two year period (2019−2020). Using these observations of carbonate parameters, we further explore the sensitivities of individual carbonate parameters to changes in the major environmental factors in the macroalgal habitat.
Materials and methods
Survey data
The study site was a shallow macroalgal habitat (36.154°N, 129.401°E) bound by tidal barriers in the East Sea (Figures 1A, B), in which carbonate chemistry has been well characterized in terms of seasonality and locality (Park et al., 2006; Lee et al., 2011). Surface-water pCO2 was continuously measured using an autonomous pCO2 system (Supplementary Text 1) from January to September in 2019 and from March to December in 2020. The pCO2 mooring system was anchored to the bottom of the macroalgal habitat (10 m depth; dominated by canopy forming species (e.g., Ecklonia cava, Sargassum horneri, Saccharina japonica and understory species; Figure 1C), and the pCO2 sensor package was submerged ~0.5 m below the surface. Surface-water pCO2 (or pH), temperature and salinity were measured at 1-h intervals for the entire period of 2019−2020.
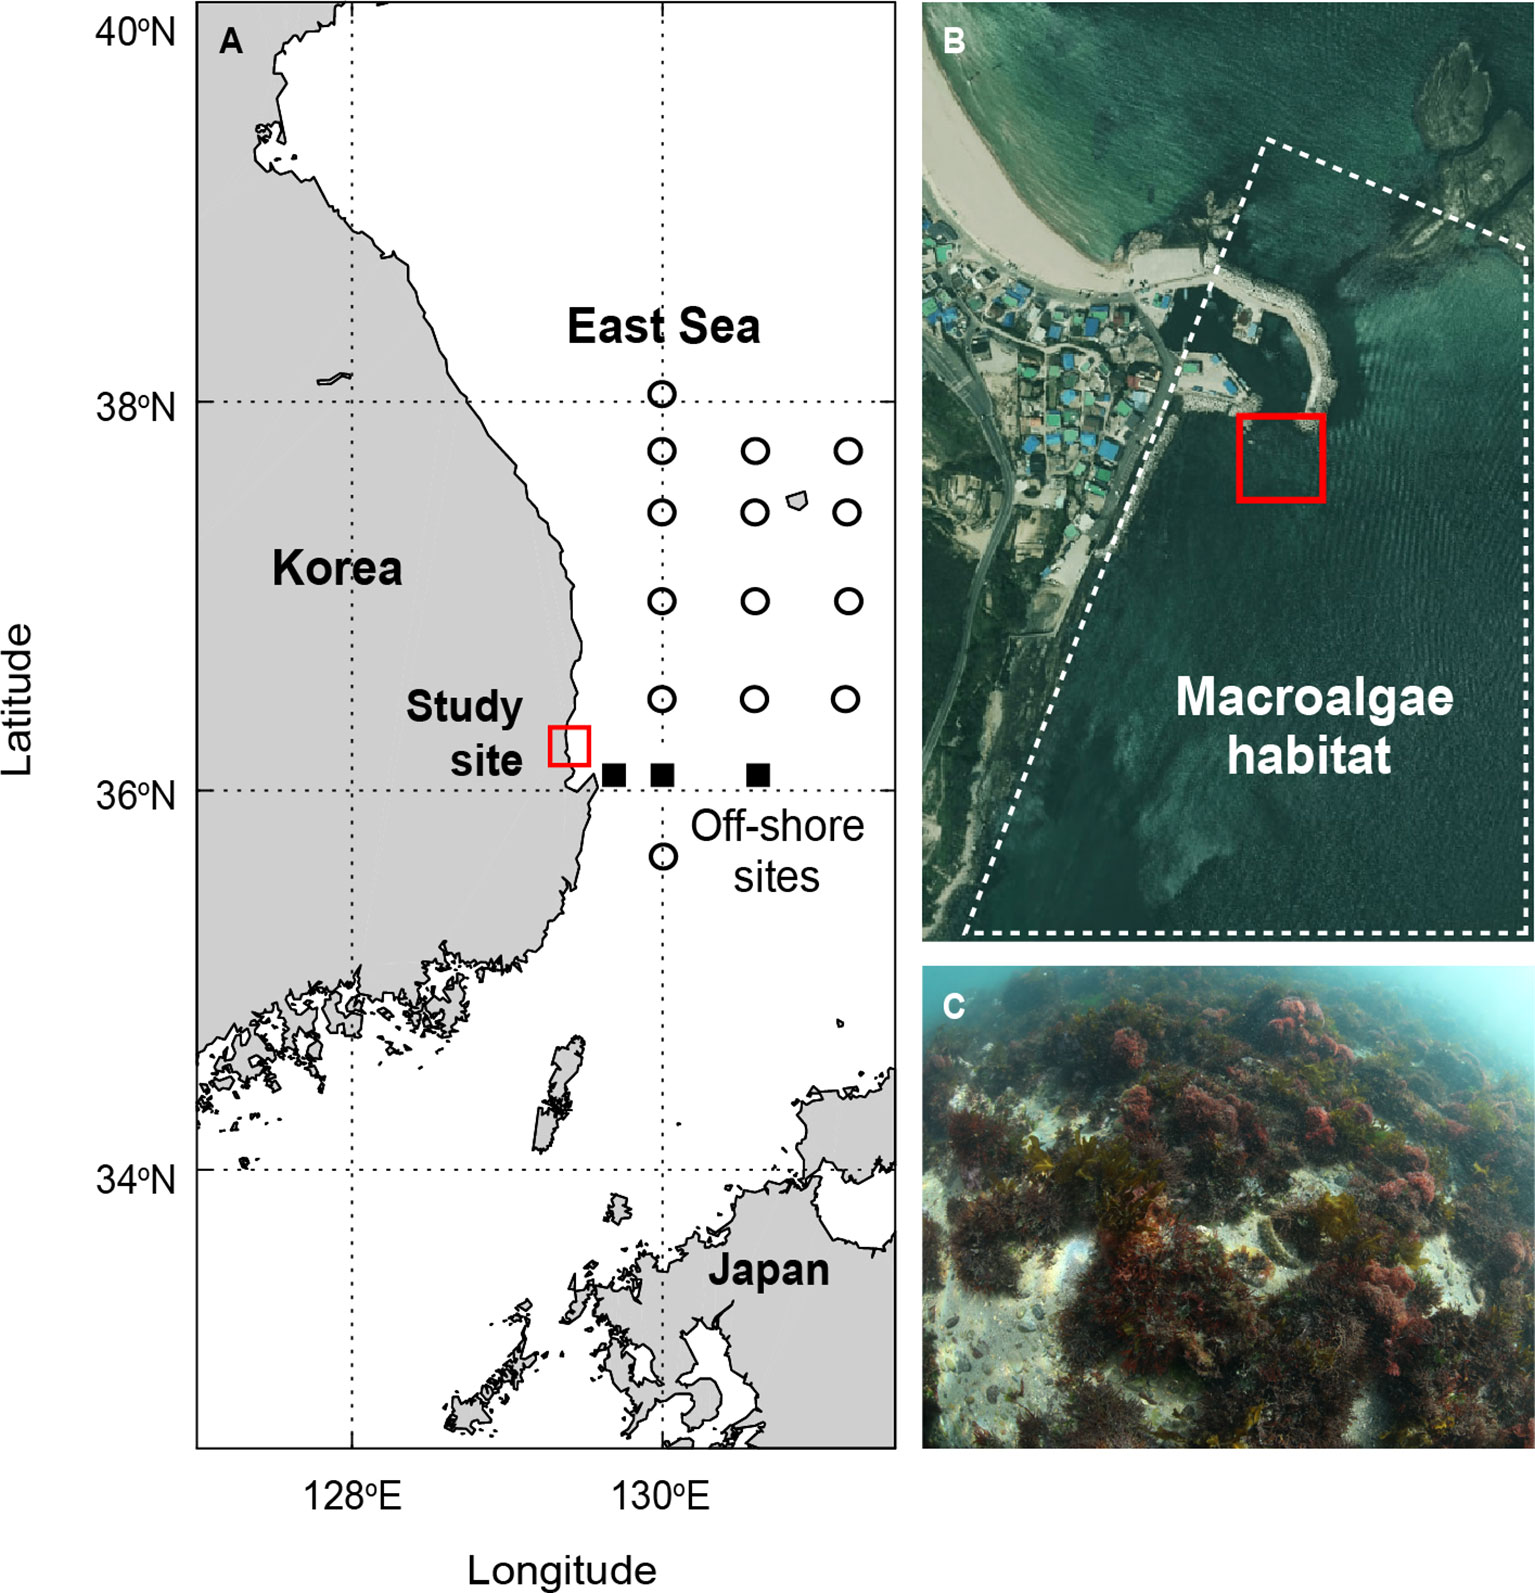
Figure 1 (A, B) Sampling site of this study (red box), and (C) dominant macroalgal species in the habitat. The off-shore sites in (A) indicate the location of the sampling site dominated by microalgae for comparison. The seawater carbonate data measured at three sampling stations (squares) in the off-shore sites were used to estimate the effects of off-shore water intrusion.
During the observation period, we also collected discrete surface samples for seawater carbonate parameters—pH, AT (total alkalinity), and CT—and nutrients (, and Si(OH)4) at 3−4 d intervals (the number of samples = 184). The chosen parameters were determined using spectrophotometry for pH (Clayton and Byrne, 1993; Lee et al., 1996), and using potentiometric and coulometric titration for AT and CT, respectively, and using colorimetry for nutrients (Zhang et al., 2001) (Supplementary Text 1).
For comparison, off-shore waters in the vicinity of the macroalgal habitat were sampled for the measurement of AT and CT at 17 hydrographic stations in the East Sea (Figure 1A) in February, April, August, and October 2019−2020, as part of the National Institute of Fisheries Science Serial Oceanographic Observation project. For each sample, the salinity, temperature, and nutrient concentrations were measured.
Carbonate parameters
For the continuous measurements, the values for seawater carbonate parameters—pH, CT, and Ωarag—at in situ conditions (Cin situ) were calculated from the measured values of pCO2 and AT (interpolated from the discrete AT values) (Dickson et al., 2007) using the CO2SYS program applying the carbonic acid dissociation constants of Mehrbach et al. (1973) (as refitted into different functional forms by Dickson and Millero, 1987), the total boron-molality-to-chlorinity ratio reported by Lee et al. (2010), and other ancillary constants tabulated by Millero (1995). This group of input parameters and thermodynamic constants yielded the errors of ±0.003 pH, ±2.3 µmol kg−1 CT, and ±0.02 Ωarag. For the discrete and off-shore seasonal measurements, we used the pair of CT and AT to calculate the Cin situ because direct measurements agreed with calculations (Lueker et al., 2000; Fong and Dickson, 2019).
C flux and uptake by biology
Net air−sea C fluxes were determined using the formula of flux , where K0 (mol L−1 atm−1) is the CO2 gas solubility (Weiss, 1974) and k (cm hr−1) is the gas transfer velocity (= 0.251· (Sc/660)−0.5, where U10 (m s−1) is the windspeed at 10 m above sea level, and Sc is the Schmidt number (Wanninkhof, 2014). A positive value of the resulting flux represents C sink; vice versa, C source. Daily mean (µatm) data were obtained from Ulleung observatory (37.48°N, 130.90°E). Hourly mean windspeed data for estimating U10 at the sampling site were measured in the vicinity of the macroalgal habitat (36.35°N and 129.78°E).
The amounts of CT uptake by biology () were computed from the rate of CT changes after the CT values were normalized to an annual mean salinity (nCT in the unit of µmol C kg seawater−1 = CT × SMEAN/SIN SITU, where SMEAN and SIN SITU are the annual mean and in situ salinity values, respectively) (Supplementary Figure 1A) and corrected for the effects of off-shore water intrusion (Supplementary Text 2) and the total C changes via fluxair−sea () during the period of analysis (). The annual net was calculated as the sum of values measured for the growing (photosynthesis dominant) and stagnant (respiration active) periods. The division between the growing (cooling; September−May) and the stagnant (warming; June−August) periods was made based on the temporal changes in nitrate concentration reflecting consumption (a decrease in concentration) and regeneration (an increase in variability) (Supplementary Figure 1B). In addition, seasonal variations in the net primary production (NPP), showing a rapid decrease starting from June (personal communication) because of a decrease in algal biomass, were used as criteria for dividing the periods.
Calculations of pCO2 changes arising from changes in seawater temperature, biology, and net air−sea C flux
Changes in the seawater carbonate parameters arising from changes in the sea surface temperature (SST) (Ctemp) were thermodynamically calculated using the experimentally determined pCO2–SST relationship of 4.23% pCO2 change °C−1 (Lee and Millero, 1995; Takahashi et al., 2002). The pair of AT and pCO2 temp (= annual mean pCO2 × exp [0.0423 (SSTIN SITU – SSTMEAN)]) were used as input parameters to CO2SYS at SSTIN SITU. To calculate the equilibrium values of the seawater carbonate parameters (Ceq, assuming is fully equilibrated with ), the pair of AT and were used instead.
The monthly cumulative changes in pCO2 arising from changes in temperature, biology, and air−sea C flux were estimated on an hourly basis from the beginning of each month (; t=0, at midnight of the first day of each month). Analogously, the accumulated changes in pCO2 during the cooling and warming periods were calculated on a monthly basis from the beginning month of the period (t=0, the monthly mean of September and June, respectively) as follows:
where Δnet, Δtemp, Δbio, and Δflux are the accumulated changes of pCO2 resulting from the effect of all factors (i.e., measured changes), temperature, biology, and C flux, respectively, and Δnet flux corr is the cumulative change in pCO2 after removing the influence of C flux. To obtain this value, the flux corrected pCO2 was estimated using a model calculation with an input pair of AT and CT flux corr .
Results and discussion
Dynamics of carbonate parameters and the amounts of C uptake by the macroalgal habitat
For 2019−2020, seasonal variations in air temperature over the East Sea resulted in a 17.5°C seasonal amplitude in the SST (Figure 2A). Much of the net increase in surface pCO2 during the warming period (the stagnant period, June–August) was driven by temperature elevation (Figures 2B, C), whereas the pCO2 decrease during the cooling period (the growing period, September–May) was attributed more to the combined effects of decreasing temperature and the net growth of dominant macroalgal species (See Discussion below). The seawater pCO2 values being lower than the atmosphere level (~80 µatm) during this period resulted in the influx of atmospheric C (220 µmol CT kg−1) into the macroalgal habitat (Figure 2D and Supplementary Figure 2B). The net CT uptake by the macroalgal habitat () was found to be 4.4 g C m−2 month−1 in the cooling period (Supplementary Table 1). This value was further corrected for the effects of lateral intrusion of off-shore water using the residence time of water at the study site (10 days; Park et al., 2015) and seasonal changes in off-shore water nCT. The revised was then increased to 5.8 g C m−2 month−1 (See details in Supplementary Table 1, Supplementary Text 2 and Supplementary Figure 3). During the cooling period, dissolved inorganic C was assimilated into macroalgae bodies (transforming into particulate organic C) at a rate of 22.5 µmol kg seawater−1 month−1 (Supplementary Figure 2A), whereas only a fraction of the assimilated C was slowly released in dissolved form, with a net increase of 6.6 µmol kg seawater−1 month−1 in seawater during the later months of this period (from February to May) (Supplementary Figure 2C). Subsequently, the concentration of dissolved organic C during the warming (stagnant growth) period increased with that of nCT at a similar rate of 14.6 µmol kg seawater−1 month−1. Compared with the varying dynamics of pCO2 (i.e., changes in pH mirroring pCO2; Supplementary Figure 1C), the variation of CT was not strongly affected by the seasonal temperature changes (Supplementary Figure 1D). The seasonal variation of Ωarag was relatively constant (with an annual mean value of 2.6 ± 0.4; Supplementary Figure 1E).
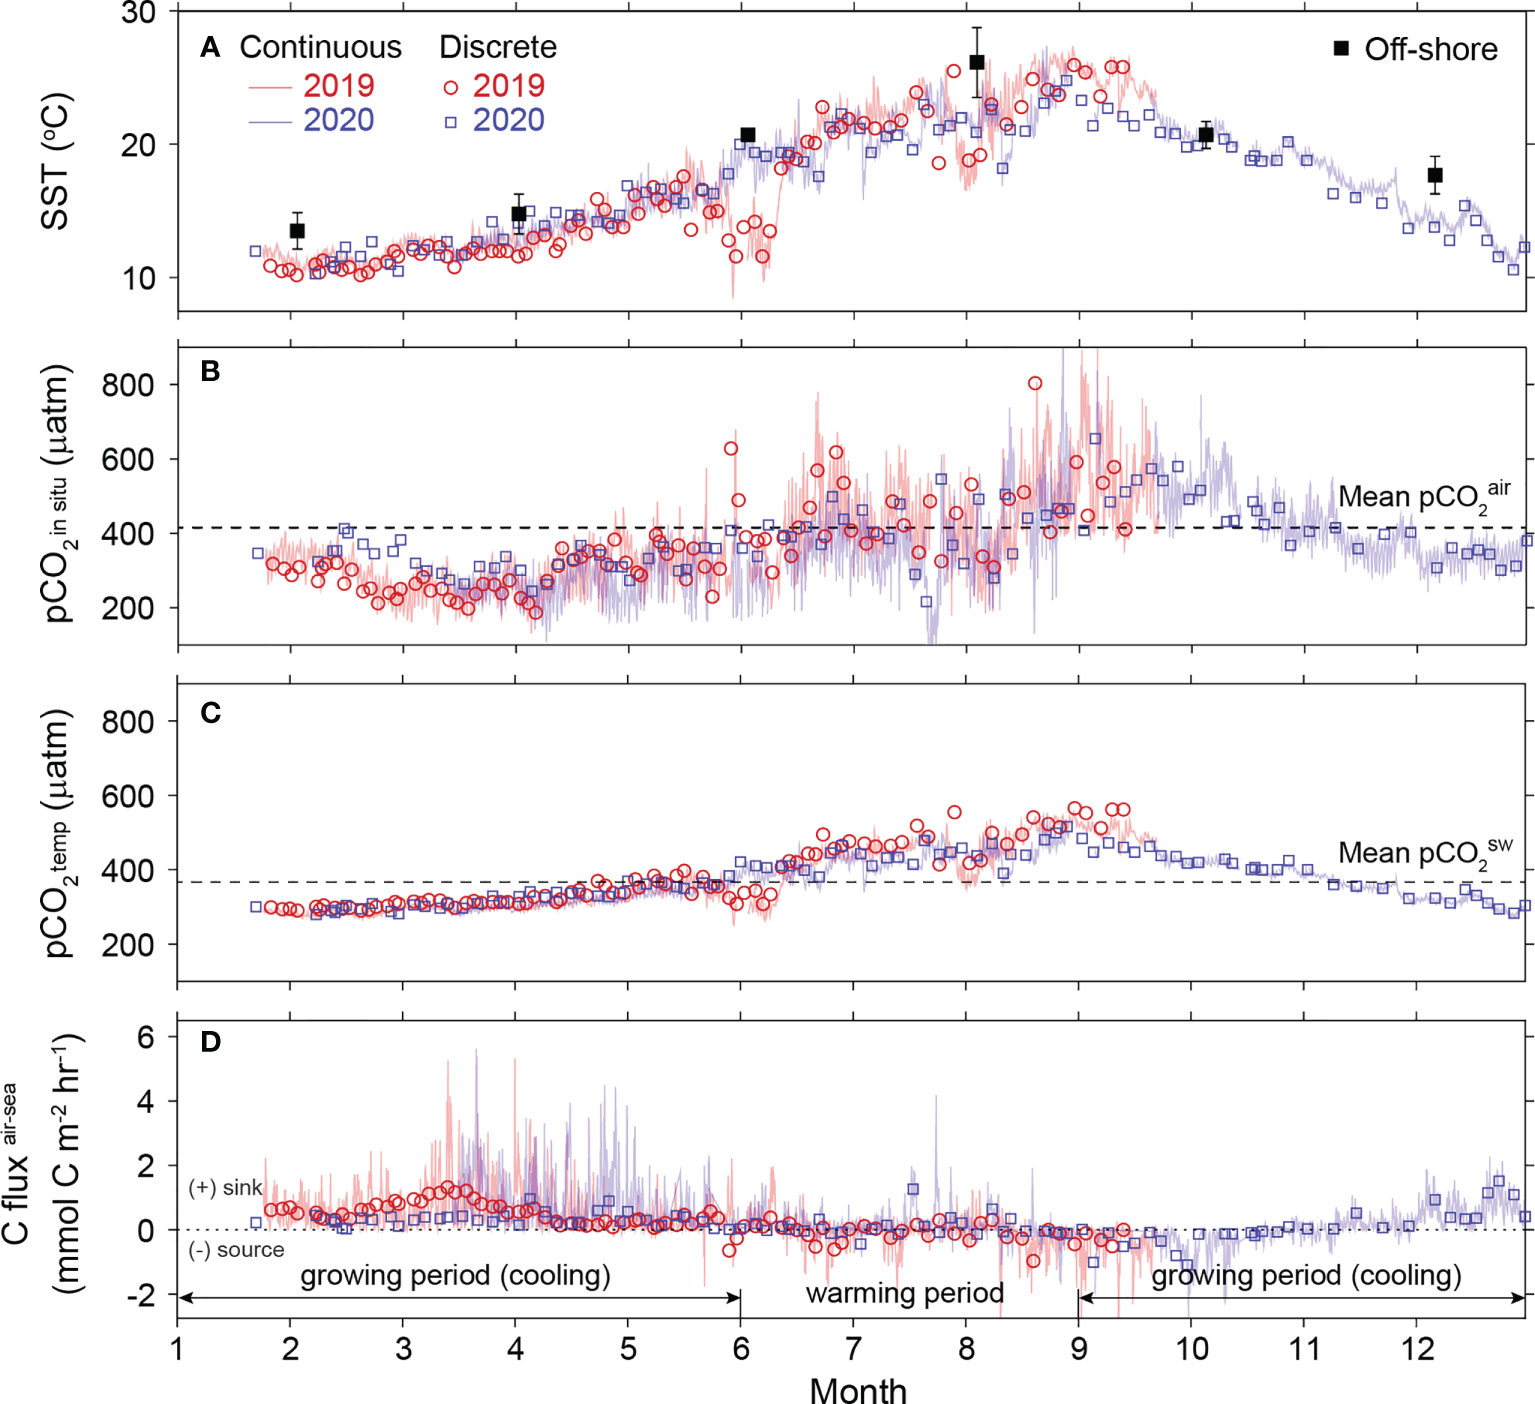
Figure 2 Temporal changes in (A) sea surface temperature (SST), (B) seawater pCO2, (C) seawater pCO2 arising from SST change only, and (D) air-sea C flux for the period 2019−2020. Lines and open symbols indicate the continuous and discrete data, respectively, obtained in 2019 (red) and 2020 (blue). Solid symbols (black) in (A) represent the seasonal changes in off-shore SST. Horizontal line in (B, C) show the level of mean pCO2 of the air (415 µatm) and seawater (367 µatm), respectively.
The annual net C uptake of 48 g C m−2 yr−1 () represents the CT utilization by all biological communities at the study site, and thus corresponds to the net community production (NCP, defined as the difference between net primary production of autotrophs and respiration of heterotrophs) (Supplementary Table 1). Therefore, the estimated is lower than the NPP (C assimilated only by autotrophs via photosynthesis, excluding net ecosystem primary production) values reported for other macroalgal habitats: for example, annual mean NPP values of 910 g C m−2 yr−1 and 1270 g C m−2 yr−1 for Ecklonia cava and Saccharina japonica-dominant habitats in Japan, respectively (Nakawaki et al., 2001; Tominaga et al., 2004); 90–490 g C m−2 yr−1 for Sargassum horneri-dominant habitats in Korea (Choi et al., 2020); and a global mean of 273 g C m−2 yr−1 for total rocky habitats (Duarte et al., 2022). Moreover, the thermal stress on algal metabolism in summer accelerated the transformation of organic C to CO2, thereby lowering the net C uptake by the macroalgal habitat investigated here. This is another factor causing our C uptake value to be lower than the values in the literature.
Temperature dependence of carbonate parameters
Variations in seawater temperature are the primary driver of the dynamics of carbonate parameters in the surface ocean because they control the acid-base equilibria in seawater (Weiss, 1974; Lueker et al., 2000; Zeebe and Wolf-Gladrow, 2001) (Supplementary Text 3). In a closed system, without air-sea CO2 exchange (the red solid lines in Figure 3 and Supplementary Figure 4), an increase in temperature rapidly increases the level of pCO2 but lowers the pH, whereas it does not change the CT—the total C concentration which is not altered by the speciation changes of individual carbonate species. The temperature increase contributed to a minor increase in the Ωarag when the salinity, CT, and AT remained unchanged. In a hypothetical open system, by contrast, which instantaneously reaches the full equilibration of seawater pCO2 with the atmospheric pCO2 (the black solid lines in Figure 3), the seawater pCO2 (to which pH directly correlates) did not increase with increasing temperature, largely because of the complete compensation for changes in C via CO2 efflux, further decreasing CT but increasing carbonate ion concentration ([], which is directly proportional to Ωarag). The dynamics of in situ carbonate parameters at the macroalgal habitat did not entirely follow the two trends predicted by either temperature change or the full equilibrium with respect to the atmospheric pCO2 via infinitely fast C exchange. However, the observed trends of carbonate parameters as functions of temperature were explicitly closer to the dynamics expected for a closed system. Our finding is solid evidence that the air-sea C flux was not sufficiently large to completely offset the air-sea disequilibrium of pCO2.
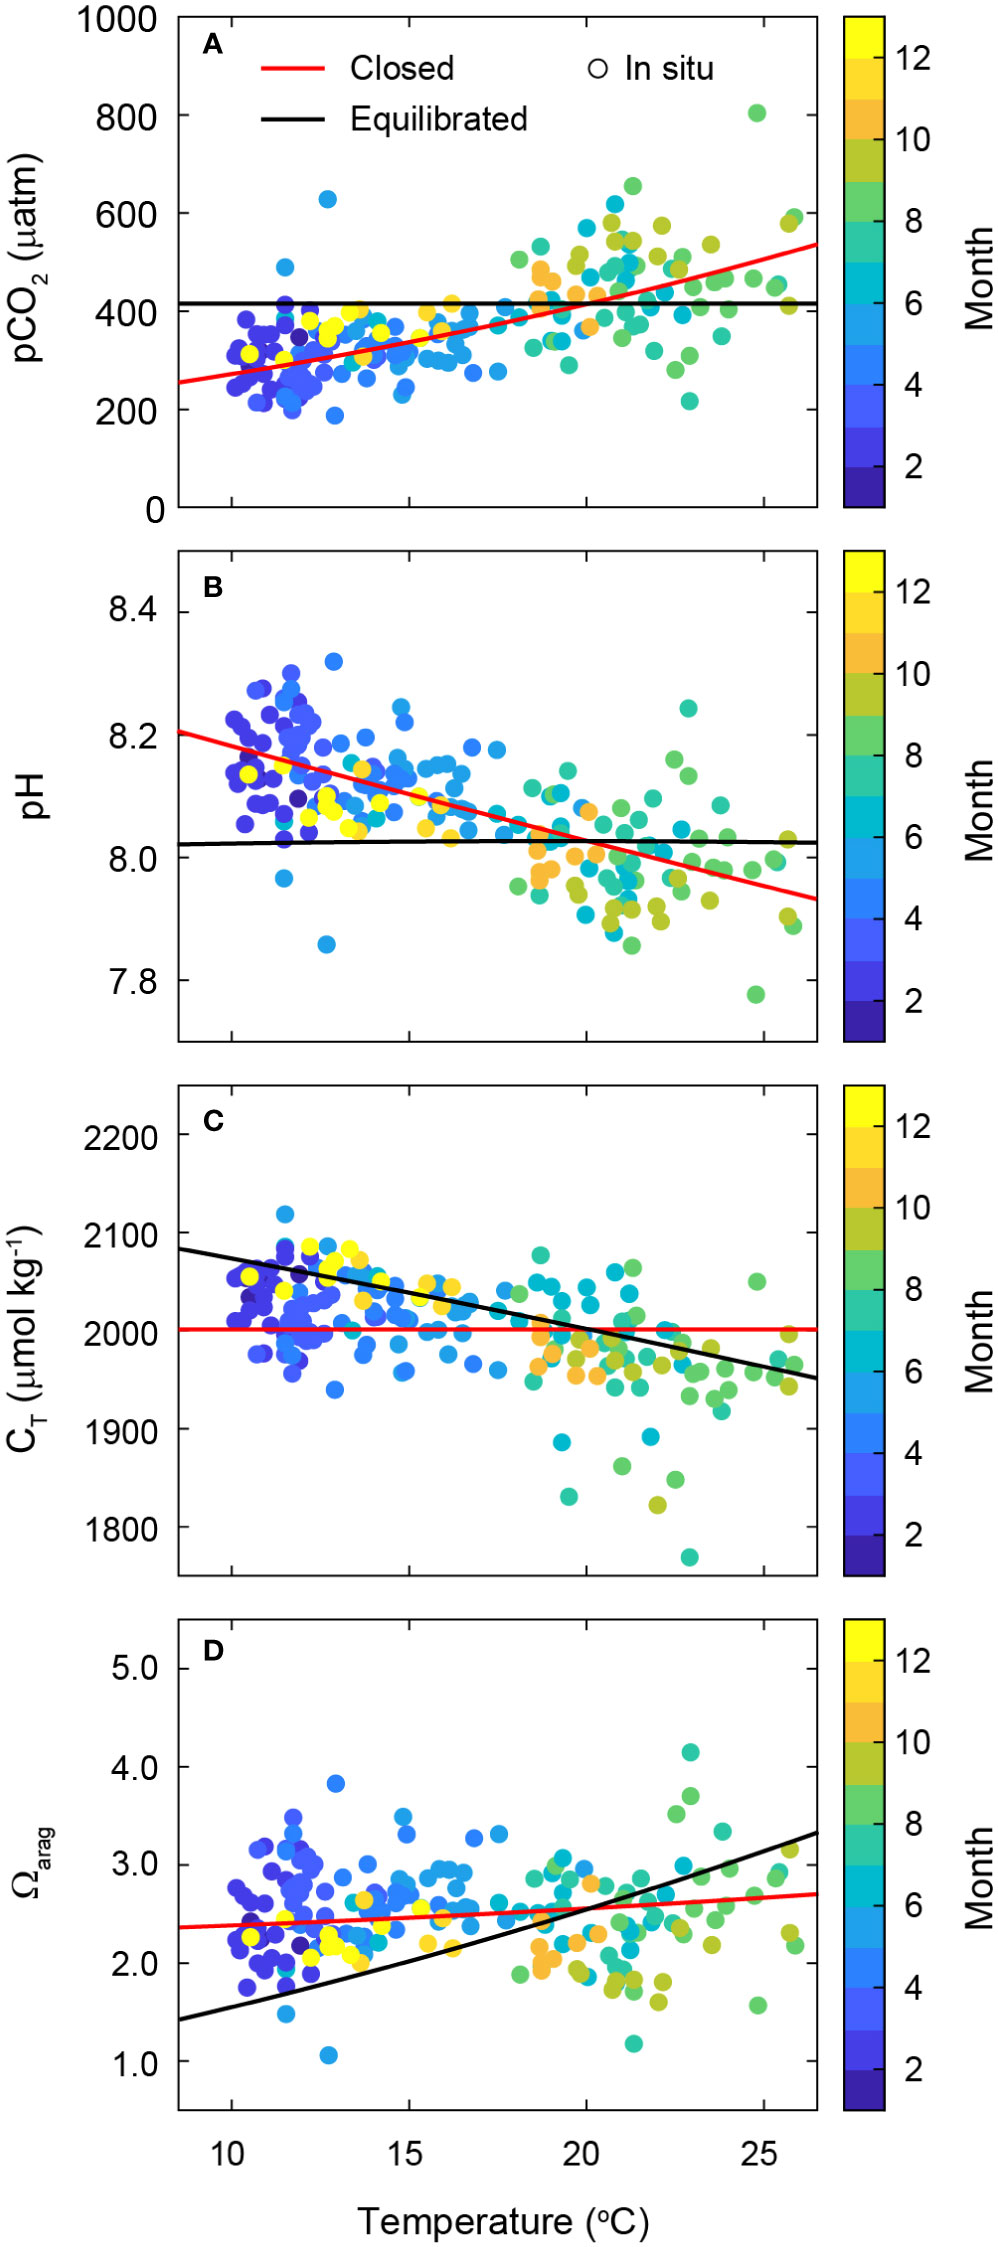
Figure 3 Temperature dependence of seawater carbonate parameters: (A) pCO2, (B) pH, (C) CT, and (D) Ωarag. Thermodynamic changes with varying temperature in the closed system (red lines) are calculated at the constant values of CT (2001.9 µmol kg−1), AT (2239.2 µmol kg−1), and salinity (33.5), which were the mean concentrations of the discrete measurements. Theoretical changes in the equilibrated system (black lines) are estimated under the assumption of complete equilibration of with (415.0 µatm) (with the constant AT of 2239.2 µmol kg−1). Colored circles overlaid by month indicate the measured values of carbonate parameters at in situ conditions during the discrete measurements (2019−2020).
Biological activities altering temperature-driven carbonate dynamics
Large deviations (colored circles in Figure 3) of the C parameters from the thermodynamic estimation (the solid red lines) indicate that factors other than temperature (i.e., biological activities and air-sea C flux) were also the key driver of the carbonate dynamics in the macroalgal habitat. We highlight the changes in daily extreme carbonate parameters (the maximum and minimum) associated with the non-thermal processes in plots (Figure 4 and Supplementary Figure 5) by showing changes in the in situ carbonate parameters (Cin situ) against those of the same parameters arising solely from the temperature change (Ctemp) (Figures 4A–D), and in plots showing the differences between Cin situ and Ctemp against months or hours (Figures 4E–H). Both in situ values of pCO2 and pH generally followed the 1:1 trends with pCO2 temp and pHtemp, with considerable deviations from pCO2 temp and pHtemp (Figures 4A, B). By contrast, the values of CT temp and Ωarag temp showed narrow dynamic ranges, which were attributed primarily to the insensitivities of CT and lower sensitivity of Ωarag to changes in temperature (Supplementary Text 3). The dynamic range of CT temp was greater than that of Ωarag temp because some of the variations in CT temp in our study site were caused by variations in AT in situ, but not by variations in temperature (Figures 4C, D).
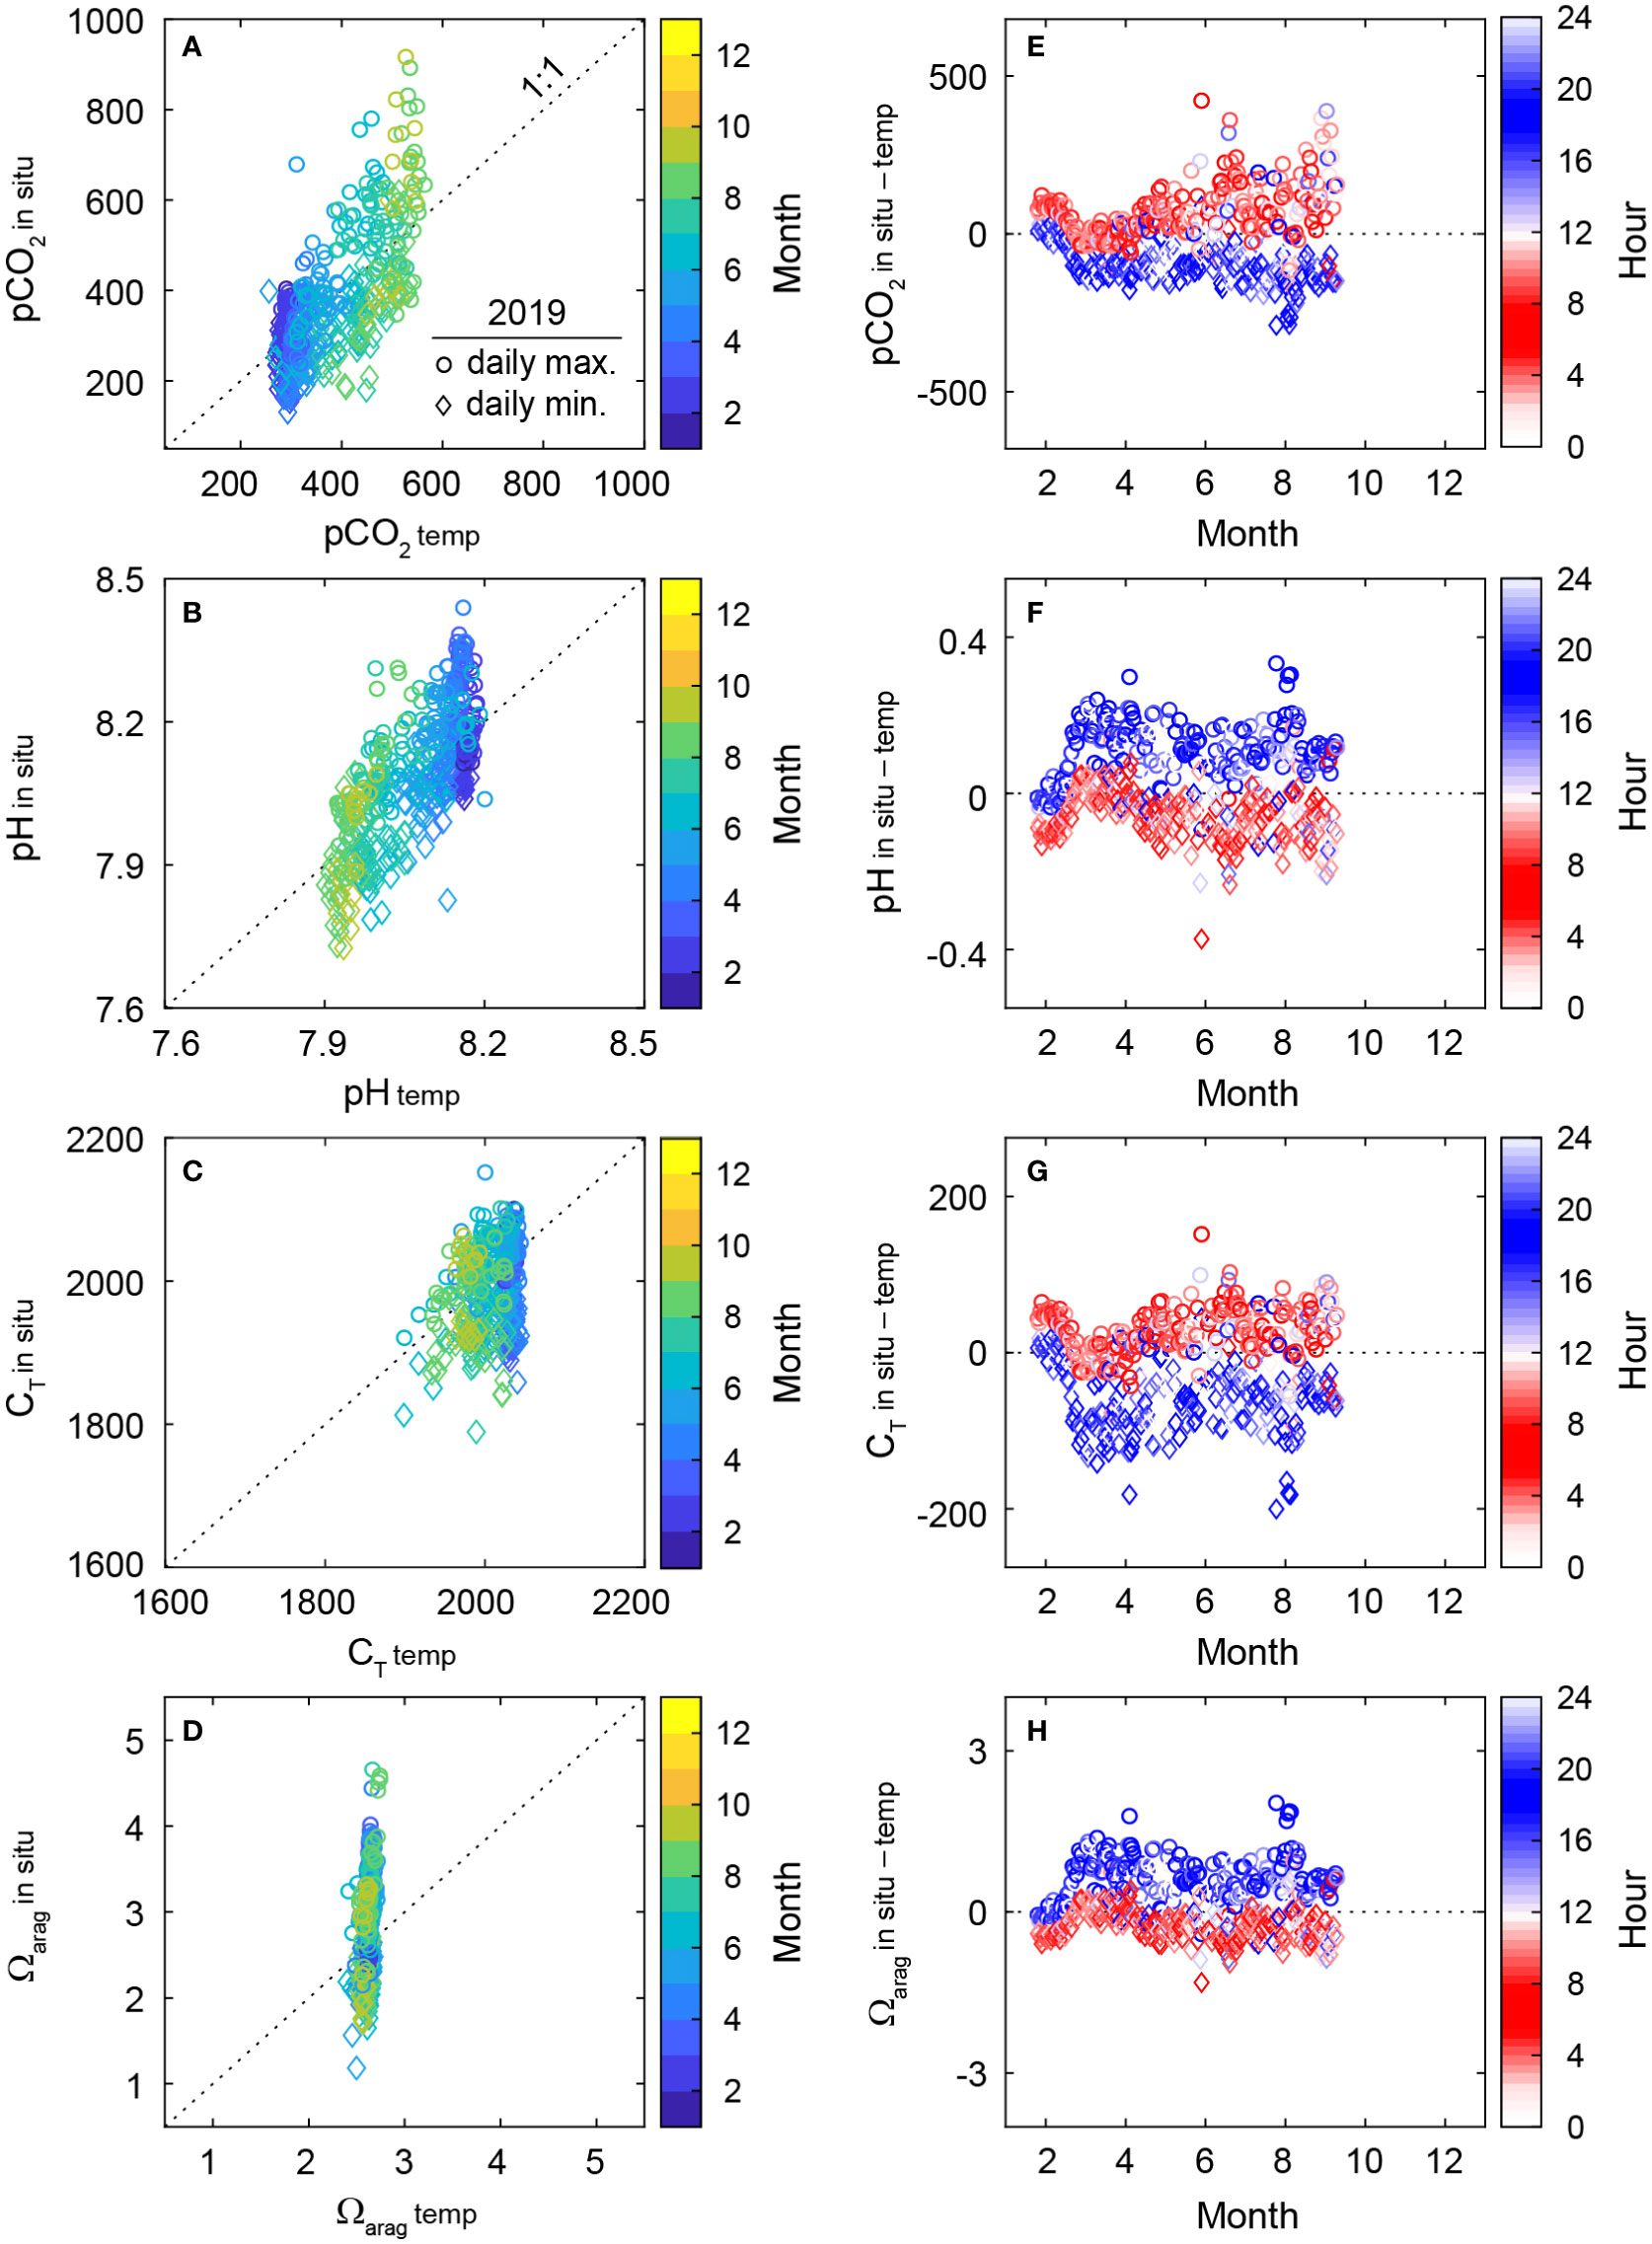
Figure 4 (A–D) Relationship between the in situ carbonate parameters (Cin situ) obtained during the continuous measurements and the parameters resulted from the change of temperature (Ctemp: calculated from the estimated pCO2 based on thermodynamic shifts in the closed system and AT under the in situ conditions). Only the daily extremes (circles: maximum; diamonds: minimum) observed in 2019 are displayed to conserve space with a color-coding by month. (E–H) The daily extreme differences between Cin situand Ctemp during the continuous measurements in 2019. The color of the symbols overlaid by the time of measurement. The data for the year 2020 is shown in Supplementary Figure 5.
To confirm that the deviations of Cin situfrom Ctemp (observation – calculation) mostly originated from biological metabolisms—photosynthesis and respiration—we plotted the daily extreme offsets of the four carbonate parameters measured continuously at 1-h intervals against months (x-axis) or hours (red dots for the time window for respiration dominant and blue dots for photosynthesis dominant) (Figures 4E–H). Most of the extreme offsets were observed at hours when the dissolved oxygen concentration (a good indicator of primary production and respiration of biology) reached the daily maxima or minima (Supplementary Figure 6), albeit with a lag of a few hours arising from for influence of metabolisms on the carbonate chemistry to be fully accumulated in the water column.
Contributions of key factors to seawater pCO2 variations
Factors responsible for the dynamics of pCO2 in the macroalgal habitat include temperature, biological activities, and C flux at the air−water interface. The monthly contribution of each factor to pCO2 in situvariations was highly variable over months and occasionally changed the sign (Figure 5). The contribution of temperature variations was more pronounced in summer and late fall (50−60%); however, their monthly contribution (17%) was, on average, only one-third of the contributions of biology or three-quarters the contributions of the air−sea C flux each month. The contributions of biology and the air−sea C flux were generally pronounced throughout the year.
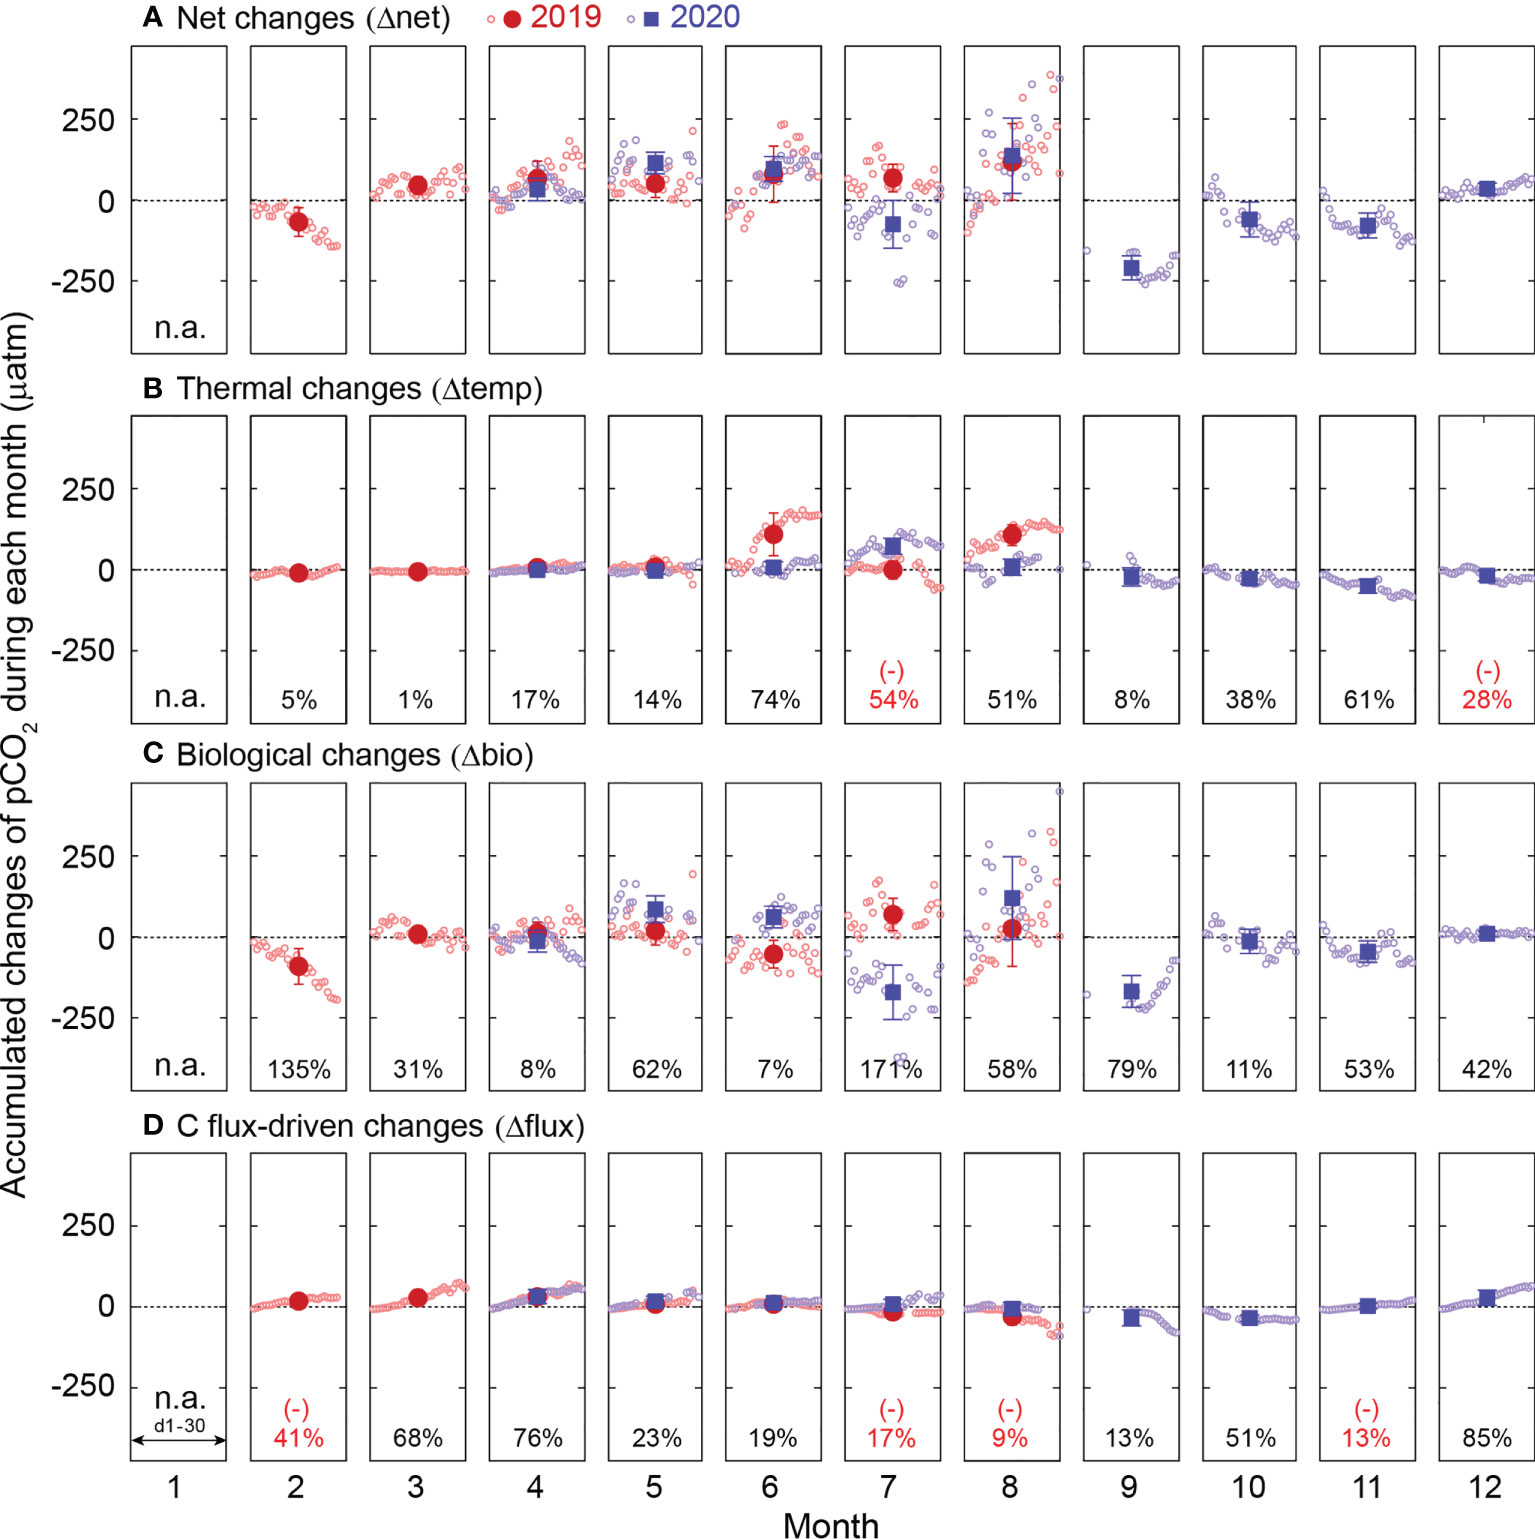
Figure 5 The monthly accumulated changes in pCO2 from the beginning of each month driven by (A) all factors (Δnet), (B) temperature (Δtemp), (C) biological activity (Δbio), and (D) C flux (Δflux) during the continuous measurements in 2019 (red) and 2020 (blue). Open circles represent the accumulated hourly changes of pCO2. Filled symbols and error bars indicate the monthly mean values of the accumulated hourly changes during a month and the standard deviation of the daily means, respectively. The relative contribution (%) of each factor was derived from the proportion of the calculated two-year monthly mean value to that of the Δnet. Negative values (numbers in red) indicate the opposite direction of change to the Δnet. n.a. indicates 'data not available'.
During the cooling period (the growing period, September−May), the net accumulated change in pCO2 was primarily associated with the seasonal decrease in seawater temperature and the proliferation of macroalgae (Figures 6A–C). For most of the cooling months the contribution to pCO2 change resulting from seawater temperature change (%Δtemp) was greater than that driven by other factors. The pronounced seasonal temperature effect on pCO2 appeared to be ubiquitous in the coastal waters around Korea (Lee et al., 2022). However,the contribution of temperature change became smaller than the biological contribution (%Δbio) in the latter growing months, as the macroalgal growth remained strong. At the end of the growing season, Δbio was a factor of three greater than the net non-thermal changes (= the differences between Δnet and Δtemp). During the warming period (the stagnant period, June−August) (Figures 6D–F), the net accumulated change (Δnet) approximately followed the Δtemp, with negligible net contributions from non-thermal factors.
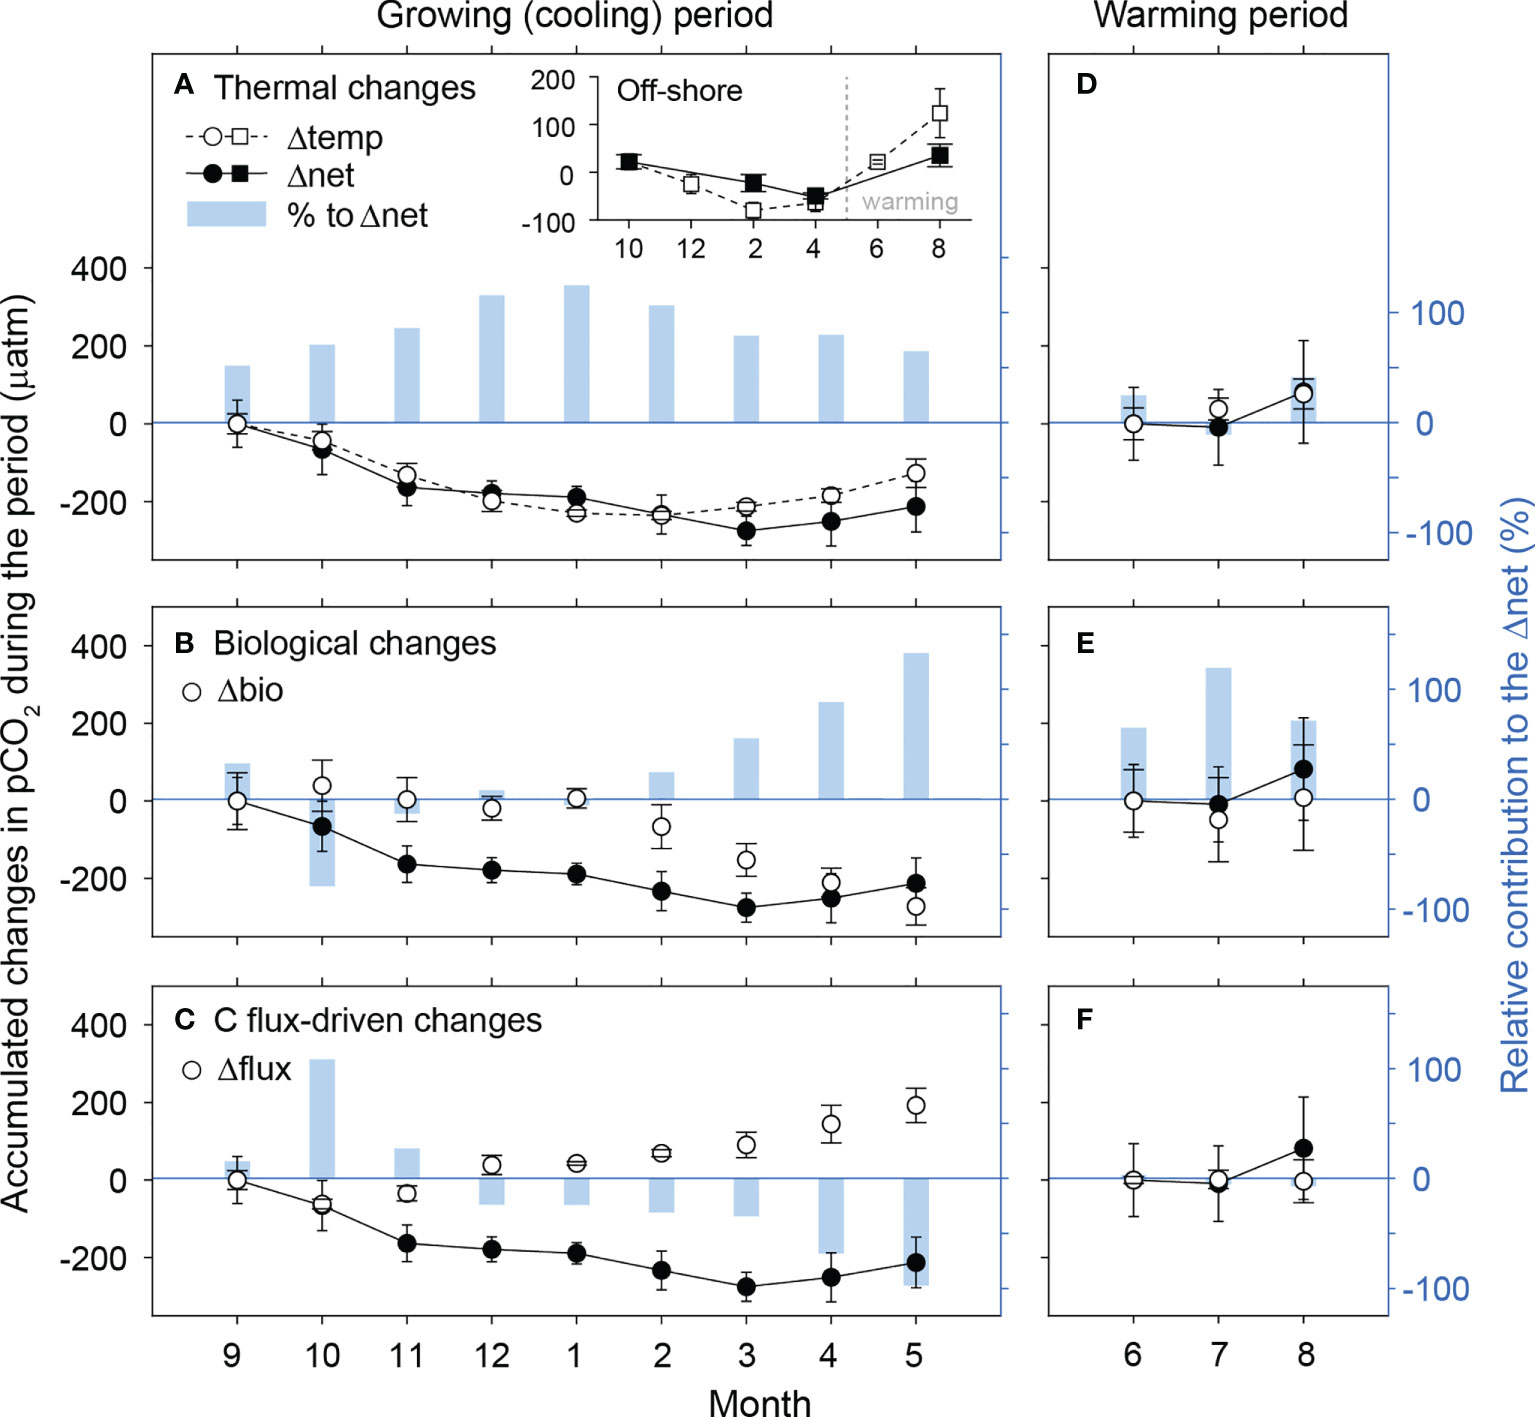
Figure 6 Accumulated changes in pCO2 during (A–C) the cooling and (D–F) the warming periods (2019−2020) from the first month of each period (September and June, respectively), driven by temperature (Δtemp; A, D), biological activity (Δbio; B, E), and C flux (Δflux; C, F). Solid symbols indicate the changes resulting from all factors (Δnet). The right y-axis shows the relative contribution (%) of each factor to Δnet. Negative values indicate the opposite direction of change to the Δnet. Inset: Δtemp and Δnet for off-shore waters along the latitude 36.08°N (129.69, 130.00 and 130.62°E) over the cooling and warming periods from October (2019−2020).
Contrary to the non-thermal pCO2 change in the phytoplankton-dominated off-shore waters (the inset in Figure 6A), the non-thermal change observed in the macroalgal habitat (primarily driven by the biological production) was maximal during the cooling period. This difference was caused by the temperature-dependent metabolic rate of macroalgae, which generally have an optimum growth temperature condition of 7−17°C in case of canopy forming species (Fortes and Lüning, 1980; Serisawa et al., 2003; Skriptsova et al., 2004; Gao et al., 2017). Exposure to temperatures higher than those optimal for growth, the macroalgal bodies tended to disintegrate into dissolved organic matter. Factors involved in maintaining macroalgal structure (turgidity, vacuoles, and plasmolysis) deteriorate considerably under thermal stress (> 20°C) (Kakinuma et al., 2006), (Supplementary Figure 7).
Correlation between seawater pCO2in situand atmospheric pCO2
The impacts of major controlling factors on the sign and magnitude of pCO2 variations differ in different ocean regimes and time scales (diel to annual). In most ocean environments, the seasonal seawater temperature variations are primary deriver of surface pCO2 changes; therefore, the seasonal temperature extremes (ΔSST) would strongly affect the overall directions. When the pCO2 in situvalues were correlated to the (low in summer and high in winter due to photosynthesis and respiration of the terrestrial ecosystem, respectively), negative correlations (i.e., the seasonal decoupling between air versus seawater pCO2 variations) were common in diverse ocean regions but considerably varied: −11.9 in our in-shore macroalgal habitat (18°C ΔSST), −5.6 in the off-shore water (13°C ΔSST), and −1.2 in the open ocean (5°C ΔSST), respectively (Figures 7B–D). The slopes (i.e., the magnitude of seasonal difference between air versus seawater pCO2) found in the studied macroalgal habitat were much steeper than those found in the Hawaii Ocean Time-series site, where seasonal temperature changes are small. Because the biological activity can lead to the deviation of the surface pCO2 dynamics, the magnitude of deviation from the temperature-governed slope was more prominent in productive environments: the macroalgal habitat (where both micro-and macroalgae dominant) > off-shore (microalgae dominant) > open ocean (low biomass); Figure 7.
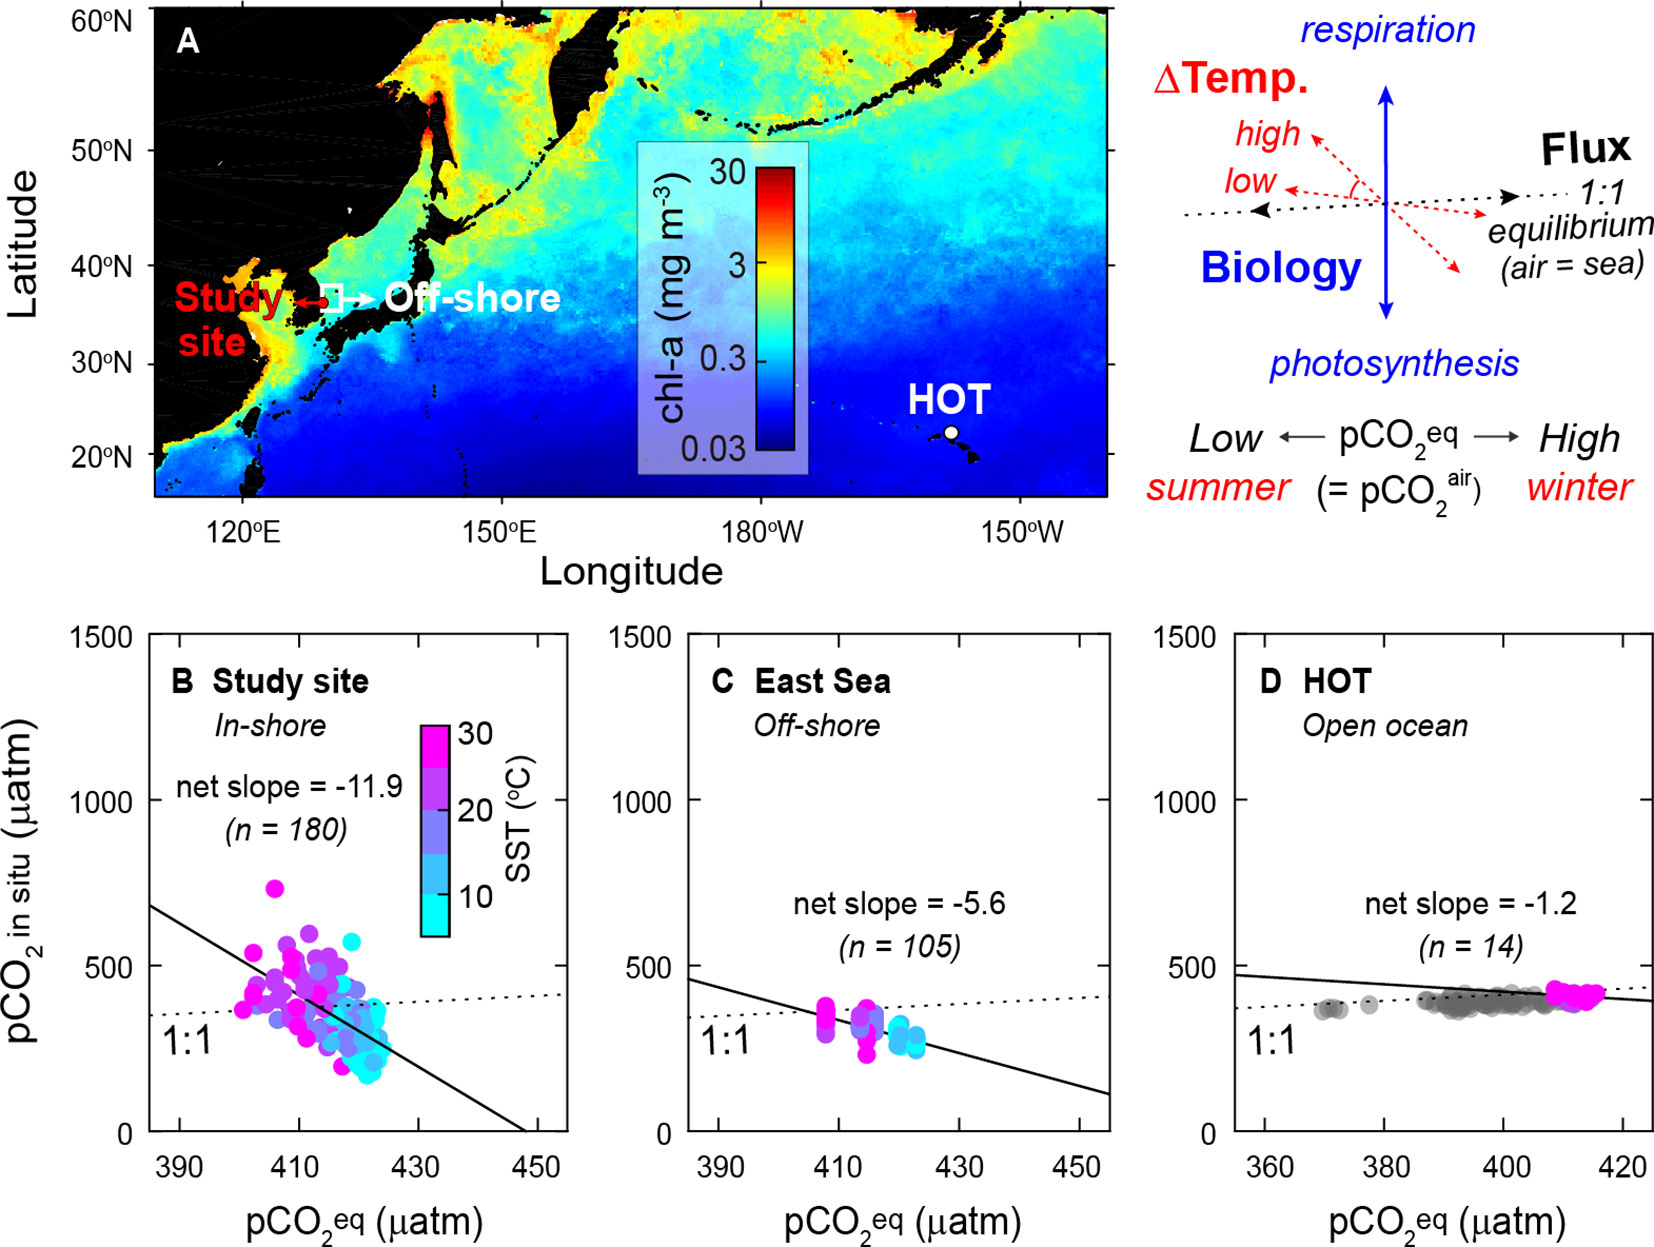
Figure 7 (A) Distribution of the annual mean chlorophyll-a concentration of 2019 in the northwestern Pacific Ocean, (B–D) correlations between the fully equilibrated pCO2 with atmospheric and in situ seawater pCO2 measured in the regions with different seasonal temperature extremes and biological activities: (B) the macroalgal habitat (plotted data were obtained during the discrete measurements during 2019−2020; r2 = 0.403, p = 1.1 ×10⁻²¹), (C) the East Sea: the off-shore of coastal Korea (in February, April, August, and October for 2019−2020; r2 = 0.494, p = 6.6 ×10⁻¹⁷), and (D) Station ALOHA of the Hawaii Ocean Time-series measurements (2019−2020; r2 = 0.035, p = 0.52; gray symbols for 2000−2019). The colored symbols indicate the sea surface temperature. The diagram displays the factors determining the correlations between pCO2 eq and pCO2 in situ (the x-axis and y-axis of B–D, respectively): the seasonal temperature extremes and the air−sea C flux regulate an overall slope of the correlation (combined angle of the dotted red and black arrows), and the biological metabolisms affect the magnitude of deviations (length of blue arrow), which affects the net slope.
In the absence of strong temperature and biology effects, the air−sea C flux would eventually remove the air−sea pCO2 disequilibrium in decadal time scales. However, on a seasonal scale the CO2 gas exchange is not fast enough to fully compensate for the seawater pCO2 changes caused by multiple factors. The air−sea C flux would contribute to the relationship between pCO2 in situand (yielding a 1:1 trend) on a decadal scale by shifting the observed seasonal trends upward over the years, specifically in the regions where the effects of other controlling factors are marginal (gray circles in Figure 7D). Contrarily, the dynamics of surface pCO2 in our study site—reflecting the additional features of a nearshore ecosystem, such as the influence of increasing loads of anthropogenic nutrients—were reinforced by high biological activity. Our 2 year observations are not sufficient to estimate inter-annual variations; however, with increasing biological production, a decadal decrease in surface pCO2 might occur as in other regions, including the southern Bering Sea and the peripheries of the Okhotsk Sea, where a substantial increase in primary production due to increasing input of nutrients via river and atmospheric deposition was reported (Takahashi et al., 2006).
Conclusion
Our results show that the biological perturbations are as significant as the thermal factors in affecting the pCO2 dynamics in Korean coastal macroalgal habitats, although temperature changes have the greatest effect on the ocean C cycle. To fully characterize diverse ocean margin C systems, it is necessary to identify local processes involved and to quantify their impacts in ecosystems using highly resolved temporal and spatial data for coastal waters. Our results provide observational evidence for marked biological impacts on seawater carbonate dynamics in a coastal macroalgal habitat, and particularly their significant effects in the cooling period. Major effects of biological factors are likely to be found in many nutrient-rich marginal ocean waters, associated with rapidly increasing impact of human activity on coastal systems.
Data availability statement
The datasets presented in this study can be found in online repositories. The names of the repository/repositories and accession number(s) can be found below: Dryad (https://doi.org/10.5061/dryad.5qfttdz85) and GOA-ON (http://portal.goa-on.org/Explorer?action=oiw:mobile_platform:STS_667:observations:).
Author contributions
KL formulated the research question and designed the field survey. MK, HK, BJ, and I-SH supported the development of infrastructure for the C measurement system at the study site and conducted the field survey. J-MK and MK analyzed the data and J-MK and KL wrote the paper together. J-HK, T-HK, and KS measured dissolved oxygen, dissolved organic carbon, nutrients, respectively, and provided data for analysis. All authors contributed to the article and approved the submitted version.
Funding
This work was supported by the National Institute of Fisheries Science (R2022056), and the Korea Fisheries Resources Agency.
Acknowledgments
The 2 year-long field observations would not have been possible without critical logistics from the Korea Fisheries Resources Agency and support from POSCO. We thank Gyeong-Seok Lee, Min-Ji Park, and Seung-Ha Kim for sampling and analysis.
Conflict of interest
The authors declare that the research was conducted in the absence of any commercial or financial relationships that could be construed as a potential conflict of interest.
Publisher’s note
All claims expressed in this article are solely those of the authors and do not necessarily represent those of their affiliated organizations, or those of the publisher, the editors and the reviewers. Any product that may be evaluated in this article, or claim that may be made by its manufacturer, is not guaranteed or endorsed by the publisher.
Supplementary material
The Supplementary Material for this article can be found online at: https://www.frontiersin.org/articles/10.3389/fmars.2022.963193/full#supplementary-material
References
Borges A. V. (2011). “Present day carbon dioxide fluxes in the coastal ocean and possible feedbacks under global change,” in Oceans and the atmospheric carbon content. Eds. Duarte P., Santana-Casiano J. M. (Dordrecht: Springer Netherlands), 47–77.
Cai W.-J., Hu X., Huang W.-J., Murrell M. C., Lehrter J. C., Lohrenz S. E., et al. (2011). Acidification of subsurface coastal waters enhanced by eutrophication. Nat. Geosci. 4 (11), 766–770. doi: 10.1038/ngeo1297
Cai W.-J., Xu Y.-Y., Feely R. A., Wanninkhof R., Jönsson B., Alin S. R., et al. (2020). Controls on surface water carbonate chemistry along north American ocean margins. Nat. Commun. 11 (1), 2691. doi: 10.1038/s41467-020-16530-z
Cao Z., Yang W., Zhao Y., Guo X., Yin Z., Du C., et al. (2019). Diagnosis of CO2 dynamics and fluxes in global coastal oceans. Natl. Sci. Rev. 7 (4), 786–797. doi: 10.1093/nsr/nwz105
Choi S. K., Oh H.-J., Yun S.-H., Lee H. J., Lee K., Han Y. S., et al. (2020). Population dynamics of the ‘Golden tides’ seaweed, Sargassum horneri, on the southwestern coast of Korea: The extent and formation of golden tides. Sustainability 12 (7), 2903. doi: 10.3390/su12072903
Clayton T. D., Byrne R. H. (1993). Spectrophotometric seawater pH measurements: total hydrogen ion concentration scale calibration of m-cresol purple and at-sea results. Deep Sea Res. Part I: Oceanographic Res. Papers 40 (10), 2115–2129. doi: 10.1016/0967-0637(93)90048-8
Dai M., Cao Z., Guo X., Zhai W., Liu Z., Yin Z., et al. (2013). Why are some marginal seas sources of atmospheric CO2? Geophysical Res. Lett. 40 (10), 2154–2158. doi: 10.1002/grl.50390
Dickson A. G., Millero F. J. (1987). A comparison of the equilibrium constants for the dissociation of carbonic acid in seawater media. Deep Sea Res. Part A. Oceanographic Res. Papers 34 (10), 1733–1743. doi: 10.1016/0198-0149(87)90021-5
Dickson A. G., Sabine C. L., Christian J. R. (Eds.) (2007). Guide to best practices for ocean CO2 measurements (Sidney, BC, Canada: North Pacific Marine Science Organization).
Duarte C. M., Gattuso J.-P., Hancke K., Gundersen H., Filbee-Dexter K., Pedersen M. F., et al. (2022). Global estimates of the extent and production of macroalgal forests. Global Ecol. Biogeography 31 (7), 1422–1439. doi: 10.1111/geb.13515
Fong M. B., Dickson A. G. (2019). Insights from GO-SHIP hydrography data into the thermodynamic consistency of CO2 system measurements in seawater. Mar. Chem. 211, 52–63. doi: 10.1016/j.marchem.2019.03.006
Fortes M. D., Lüning K. (1980). Growth rates of north Sea macroalgae in relation to temperature, irradiance and photoperiod. Helgoländer Meeresuntersuchungen 34 (1), 15–29. doi: 10.1007/BF01983538
Gao X., Endo H., Nagaki M., Agatsuma Y. (2017). Interactive effects of nutrient availability and temperature on growth and survival of different size classes of Saccharina japonica (Laminariales, phaeophyceae). Phycologia 56 (3), 253–260. doi: 10.2216/16-91.1
Gruber N. (2015). Carbon at the coastal interface. Nature 517 (7533), 148–149. doi: 10.1038/nature14082
Ikawa H., Oechel W. C. (2015). Temporal variations in air-sea CO2 exchange near large kelp beds near San Diego, California. J. Geophysical Research: Oceans 120 (1), 50–63. doi: 10.1002/2014JC010229
Kakinuma M., Coury D. A., Kuno Y., Itoh S., Kozawa Y., Inagaki E., et al. (2006). Physiological and biochemical responses to thermal and salinity stresses in a sterile mutant of ulva pertusa (Ulvales, chlorophyta). Mar. Biol. 149 (1), 97–106. doi: 10.1007/s00227-005-0215-y
Kim J.-M., Lee K., Han I.-S., Lee J.-S., Choi Y.-H., Lee J. H., et al. (2020). Anthropogenic nitrogen-induced changes in seasonal carbonate dynamics in a productive coastal environment. Geophysical Res. Lett. 47 (17), e2020GL088232. doi: 10.1029/2020GL088232
Krause-Jensen D., Duarte C. M. (2016). Substantial role of macroalgae in marine carbon sequestration. Nat. Geosci. 9 (10), 737–742. doi: 10.1038/ngeo2790
Kubo A., Maeda Y., Kanda J. (2017). A significant net sink for CO2 in Tokyo bay. Sci. Rep. 7 (1), 44355. doi: 10.1038/srep44355
Laruelle G. G., Landschützer P., Gruber N., Tison J. L., Delille B., Regnier P. (2017). Global high-resolution monthly pCO2 climatology for the coastal ocean derived from neural network interpolation. Biogeosciences 14 (19), 4545–4561. doi: 10.5194/bg-14-4545-2017
Laruelle G. G., Lauerwald R., Pfeil B., Regnier P. (2014). Regionalized global budget of the CO2 exchange at the air-water interface in continental shelf seas. Global Biogeochemical Cycles 28 (11), 1199–1214. doi: 10.1002/2014GB004832
Lee K., Chris S., Tanhua T., Kim T.-W., Feely R., Kim H.-C. (2011). Roles of marginal seas in absorbing and storing fossil fuel CO2. Energy Environ. Sci. 4, 1133–1146. doi: 10.1039/C0EE00663G
Lee K., Kim T.-W., Byrne R. H., Millero F. J., Feely R. A., Liu Y.-M. (2010). The universal ratio of boron to chlorinity for the north pacific and north Atlantic oceans. Geochimica Cosmochimica Acta 74 (6), 1801–1811. doi: 10.1016/j.gca.2009.12.027
Lee K., Kim J.-M., Lee G.-S., Lee E., Jeong J.-Y., Lee J., et al. (2022). Persistent continental shelf carbon sink at the ieodo ocean research station in the northern East China Sea. Front. Mar. Sci. 9. doi: 10.3389/fmars.2022.919249
Lee K., Millero F. J. (1995). Thermodynamic studies of the carbonate system in seawater. Deep Sea Res. Part I: Oceanographic Res. Papers 42 (11), 2035–2061. doi: 10.1016/0967-0637(95)00077-1
Lee K., Millero F. J., Campbell D. M. (1996). The reliability of the thermodynamic constants for the dissociation of carbonic acid in seawater. Mar. Chem. 55 (3), 233–245. doi: 10.1016/S0304-4203(96)00064-3
Li H., Moon H., Kang E. J., Kim J.-M., Kim M., Lee K., et al. (2022). The diel and seasonal heterogeneity of carbonate chemistry and dissolved oxygen in three types of macroalgal habitats. Front. Mar. Sci. 9. doi: 10.3389/fmars.2022.857153
Lueker T. J., Dickson A. G., Keeling C. D. (2000). Ocean pCO2 calculated from dissolved inorganic carbon, alkalinity, and equations for K1 and K2: Validation based on laboratory measurements of CO2 in gas and seawater at equilibrium. Mar. Chem. 70 (1), 105–119. doi: 10.1016/S0304-4203(00)00022-0
Macreadie P. I., Anton A., Raven J. A., Beaumont N., Connolly R. M., Friess D. A., et al. (2019). The future of blue carbon science. Nat. Commun. 10 (1), 3998. doi: 10.1038/s41467-019-11693-w
Mehrbach C., Culberson C. H., Hawley J. E., Pytkowicx R. M. (1973). Measurement of the apparent dissociation constants of carbonic acid in seawater at atmospheric pressure. Limnology Oceanography 18 (6), 897–907. doi: 10.4319/lo.1973.18.6.0897
Millero F. J. (1995). Thermodynamics of the carbon dioxide system in the oceans. Geochimica Cosmochimica Acta 59 (4), 661–677. doi: 10.1016/0016-7037(94)00354-O
Nakawaki T., Agatsuma Y., Taniguchi K. (2001). Annual life cycle and productivity of the Laminaria japonica population in onagawa bay, northeastern Honshu, Japan. Suisanzoshoku 49 (4), 439–444.
Nellemann C., Corcoran E., Duarte C., Valdes L., Young C., Fonseca L., et al. (2009). “Blue carbon,” in A rapid response assessment (Norway: United Nations Environment Programme).
Park K.-S., Heo K.-Y., Jun K., Kwon J.-I., Kim J., Choi J.-Y., et al. (2015). Development of the operational oceanographic system of Korea. Ocean Sci. J. 50 (2), 353–369. doi: 10.1007/s12601-015-0033-1
Park G.-H., Lee K., Tishchenko P., Min D.-H., Warner M. J., Talley L. D., et al. (2006). Large Accumulation of anthropogenic CO2 in the East (Japan) Sea and its significant impact on carbonate chemistry. Global Biogeochemical Cycles 20 (4):GB4013. doi: 10.1029/2005GB002676
Serisawa Y., Aoki M., Hirata T., Bellgrove A., Kurashima A., Tsuchiya Y., et al. (2003). Growth and survival rates of large-type sporophytes of Ecklonia cava transplanted to a growth environment with small-type sporophytes. J. Appl. Phycology 15 (4), 311–318. doi: 10.1023/A:1025183100958
Signorini S. R., Mannino A., Najjar R. G. Jr., Friedrichs M. A. M., Cai W.-J., Salisbury J., et al. (2013). Surface ocean pCO2 seasonality and sea-air CO2 flux estimates for the north American east coast. J. Geophysical Research: Oceans 118 (10), 5439–5460. doi: 10.1002/jgrc.20369
Skriptsova A., Khomenko V., Isakov V. (2004). Seasonal changes in growth rate, morphology and alginate content in Undaria pinnatifida at the northern limit in the Sea of Japan (Russia). J. Appl. Phycology 16 (1), 17. doi: 10.1023/B:JAPH.0000019049.74140.61
Takahashi T., Sutherland S. C., Feely R. A., Wanninkhof R. (2006). Decadal change of the surface water pCO2 in the north pacific: A synthesis of 35 years of observations. J. Geophysical Research: Oceans 111, C07S05. doi: 10.1029/2005JC003074
Takahashi T., Sutherland S. C., Sweeney C., Poisson A., Metzl N., Tilbrook B., et al. (2002). Global sea–air CO2 flux based on climatological surface ocean pCO2, and seasonal biological and temperature effects. Deep Sea Res. Part II: Topical Stud. Oceanography 49 (9), 1601–1622. doi: 10.1016/S0967-0645(02)00003-6
Takahashi T., Sutherland S. C., Wanninkhof R., Sweeney C., Feely R. A., Chipman D. W., et al. (2009). Climatological mean and decadal change in surface ocean pCO2, and net sea–air CO2 flux over the global oceans. Deep Sea Res. Part II: Topical Stud. Oceanography 56 (8), 554–577. doi: 10.1016/j.dsr2.2008.12.009
Tominaga H., Serisawa Y., Ohno M. (2004). Seasonal changes in net production of the bladelets and size of the eproximal blade of Ecklonia cava in tosa bay, kochi prefecture. Japanese J. Phycology 52 (1), 13–19.
Wanninkhof R. (2014). Relationship between wind speed and gas exchange over the ocean revisited. Limnology Oceanography: Methods 12 (6), 351–362. doi: 10.4319/lom.2014.12.351
Watanabe K., Yoshida G., Hori M., Umezawa Y., Moki H., Kuwae T. (2020). Macroalgal metabolism and lateral carbon flows can create significant carbon sinks. Biogeosciences 17 (9), 2425–2440. doi: 10.5194/bg-17-2425-2020
Weiss R. F. (1974). Carbon dioxide in water and seawater: the solubility of a non-ideal gas. Mar. Chem. 2 (3), 203–215. doi: 10.1016/0304-4203(74)90015-2
Zeebe R. E., Wolf-Gladrow D. (2001). “Equilibrium,” in CO2 in seawater: Equilibrium, kinetics, isotopes (San Diego, CA, USA: Elsevier Science), 1–83.
Keywords: coastal ocean carbon, biological community metabolisms, diel carbon dynamics, East Sea, air-sea CO2 flux, macroalgal habitat, seaweed habitat
Citation: Kim J-M, Lee K, Han I-S, Kim M, Kim J-H, Kim T-H, Kim H, Jeon BH and Shin K (2022) Factors governing seawater carbonate dynamics in a macroalgal habitat. Front. Mar. Sci. 9:963193. doi: 10.3389/fmars.2022.963193
Received: 07 June 2022; Accepted: 30 September 2022;
Published: 03 November 2022.
Edited by:
Chen-Tung Arthur Chen, National Sun Yat-sen University, TaiwanReviewed by:
Qianguo Xing, Yantai Institute of Coastal Zone Research (CAS), ChinaFrancisco Arenas, University of Porto, Portugal
Copyright © 2022 Kim, Lee, Han, Kim, Kim, Kim, Kim, Jeon and Shin. This is an open-access article distributed under the terms of the Creative Commons Attribution License (CC BY). The use, distribution or reproduction in other forums is permitted, provided the original author(s) and the copyright owner(s) are credited and that the original publication in this journal is cited, in accordance with accepted academic practice. No use, distribution or reproduction is permitted which does not comply with these terms.
*Correspondence: Kitack Lee, a3RsQHBvc3RlY2guYWMua3I=
 Ja-Myung Kim
 Kitack Lee
 In-Seong Han3
 Ju-Hyoung Kim
 Tae-Hoon Kim