 Paola Rivaro
 Davide Vivado
 Pasquale Castagno
 Pierpaolo Falco
 Enrico Zambianchi
 Carmela Ianni1
95% of researchers rate our articles as excellent or good
Learn more about the work of our research integrity team to safeguard the quality of each article we publish.
Find out more
ORIGINAL RESEARCH article
Front. Mar. Sci. , 08 December 2022
Sec. Marine Biogeochemistry
Volume 9 - 2022 | https://doi.org/10.3389/fmars.2022.957060
This article is part of the Research Topic The Changing Carbonate Systems in Coastal, Estuarine, Shelf Areas and Marginal Seas View all 7 articles
The eastern Ross Sea is a key area to understand the role of the Amundsen Sea inflow of freshwater that can influence the Ross Sea water properties and salt budget. A survey was carried out in the eastern Ross Sea during the austral summer 2019–20 to evaluate the contribution of the Amundsen Sea Water (ASW) to the salinity variability. A total of 248 seawater samples were collected f\or the analysis of total alkalinity (AT) and pH. The data collected were used together with temperature and salinity to obtain a full description of the carbonate system properties including total inorganic carbon (CT), CO2 partial pressure (pCO2), calcium carbonate saturation state of aragonite and calcite (Ω), and Revelle factor. Moreover, we estimated the anthropogenic carbon (Cant) throughout the TrOCA method to better understand the carbon cycle, also considering the effect of atmospheric CO2 uptake on ocean acidification. We used principal component analysis (PCA) to investigate the major controls on the carbonate system parameters with the aim of defining their sensitivity as chemical tracers. The changes in carbonate chemistry in surface waters were mainly due to the physical properties. AT and pH traced the entry of the ASW showing limited mixing between water masses on the shelf area. Shelf waters were enriched in Cant, which resulted lower than the estimated value for shelf waters produced in western Ross Sea.
The Ross Sea plays a fundamental role in the global carbon budget and in the air–sea carbon dioxide (CO2) flux, behaving as an atmospheric CO2 sink (Dejong and Dunbar, 2017). The Ross Sea is one of the most biologically productive regions in the Southern Ocean (Arrigo et al., 1999; Arrigo and van Dijken, 2004; Smith et al., 2010; Iudicone et al., 2011; Smith et al., 2014; Mangoni et al., 2017) and a key site of Antarctic Bottom Water (AABW) formation (Jacobs et al., 1970; Orsi et al., 1999; Bergamasco et al., 2002; Rivaro et al., 2010a).
The AABW is produced by the tidal mixing of the Dense Shelf Water (DSW) with the Circumpolar Deep Water (CDW) along the continental shelf margins in the western sector (Whitworth and Orsi, 2006; Castagno et al., 2017; Bowen et al., 2021) and it contributes significantly to the ventilation of the deep layer of the Southern Ocean (Orsi and Wiederwohl, 2009). Therefore, it plays an important role in sequestering CO2 from the atmosphere and transferring it into the deep ocean (Caldeira and Duffy, 2000; Sabine et al., 2004; Sandrini et al., 2007). The magnitude of the CO2 sink depends on the environmental conditions together with physical and biological processes. Therefore, it is crucial to define the parameters (i.e. environmental, physical, biological) that influence the variability of the properties of the carbonate system.
The properties of the carbonate system in natural waters can be defined by measuring the pH, the total alkalinity (AT), the total inorganic carbon (CT), and the CO2 partial pressure in wet (100% water-saturated) air at equilibrium with the sample (pCO2), that is proportional to the dissolved CO2.The addition of freshwater together with the increase of atmospheric CO2 could affect the carbonate system parameters, such as pH and carbonate saturation grade (Ω) which are key variables for monitoring the state of ocean acidification (OA). In fact, the increase in atmospheric CO2 concentration displaces the chemical equilibria occurring in seawater between the different species contributing to the CT (i.e. HCO3-, CO2, and CO32-) causing a decrease of the pH for the formation of H3O+ ions. Furthermore, CO2 addition lowers the Ω of calcium carbonate (Feely et al., 2004).
Polar seas are particularly vulnerable to OA, due to the cold, relatively fresh, and low AT surface waters that have a great potential for CO2 uptake and a low buffer capacity (Chierici and Fransson, 2009; Steinacher et al., 2009). Changes in pH may affect the biogeochemical cycles of many metals, including the bioavailability of iron that control the biological activities (Millero et al., 2005). Anthropogenic carbon (Cant) can be estimated using carbonate system properties. Touratier and Goyet defined the semi-conservative tracer TrOCA (Tracer combining Oxygen, inorganic Carbon and total Alkalinity) (Touratier and Goyet, 2004a; Touratier and Goyet, 2004b; Touratier et al., 2007).
In the recent decades, AABW has been subject to warming, freshening, and decreasing in volume and density (Johnson, 2008; Purkey and Johnson, 2012; Purkey and Johnson, 2013). The largest freshening has been observed in the Pacific and Australian Antarctic Basins where bottom water is originated from the Ross Sea DSW. The 50 years of AABW freshening has been linked to the salinity decrease of the HSSW formed in the Ross Sea due to the increased continental ice discharge and melting upstream in the Amundsen Sea (Jacobs et al., 2022). Recent observations show a rebound of both Ross Sea DSW (Castagno et al., 2019) and AABW salinity in the Southern Pacific (Silvano et al., 2020). This rebound has been related to a reduced sea ice import through the Ross Sea eastern gate driven by climate anomalies (Silvano et al., 2020). Furthermore, Guo et al. (2021) related the rapid enhancement of DSW salinity after 2014 to the reduced freshwater input into the Ross Sea due to weakening of the westward zonal flow from the upstream Amundsen Sea. Therefore, the Eastern Sector of the Ross Sea (ESRS) is an area of great importance for the whole Ross Sea shelf water production and variability.
In this paper we consider the ESRS as the area east of the Greenwich antemeridian (according also to the SOOS Science and Implementation Plan 2021-2025, https://www.soos.aq). The observations in this sector are very scarce, despite this being the area where the water masses coming from the West Antarctica sector pass through. According Orsi and Wiederwhol (2009) the ESRS is characterized by the presence of Low Salinity Shelf Waters (LSSW) over almost all the continental shelf area deep layer (below the neutral density – γn – surface of 28.27 kg m-3) and the absence of HSSW and AABW production. A fresher ISW than in the western sector is observed at the edge of the Ross Ice Shelf (RIS). The intermediate layer, defined as the layer between the isopycnal surface of γn 28 and 28.27 kg m-3, is divided into two sub-sectors: the first occupies the easternmost area of the ESRS where mainly Modified Shelf Waters (MSW) can be observed; the westernmost sub-sector, instead, is characterized by the intrusion of CDW. Then, a strong temperature front occurs in between the Hayes and Houtz Bank (Figure 1) and no intrusion of CDW onto the shelf can be observed in the easternmost sub-sector. The surface layer (the layer above the γn surface of 28 kg m-3) shows salinity value greater than 34.3 in the ESRS central sector, but close to the coast, near Cape Colbeck, a fresh water mass coming from West Antarctica can be observed. According to the surface circulation scheme (e.g. Sedwick et al., 2011), this fresh water mass moves westward along the RIS edge becoming more saline.
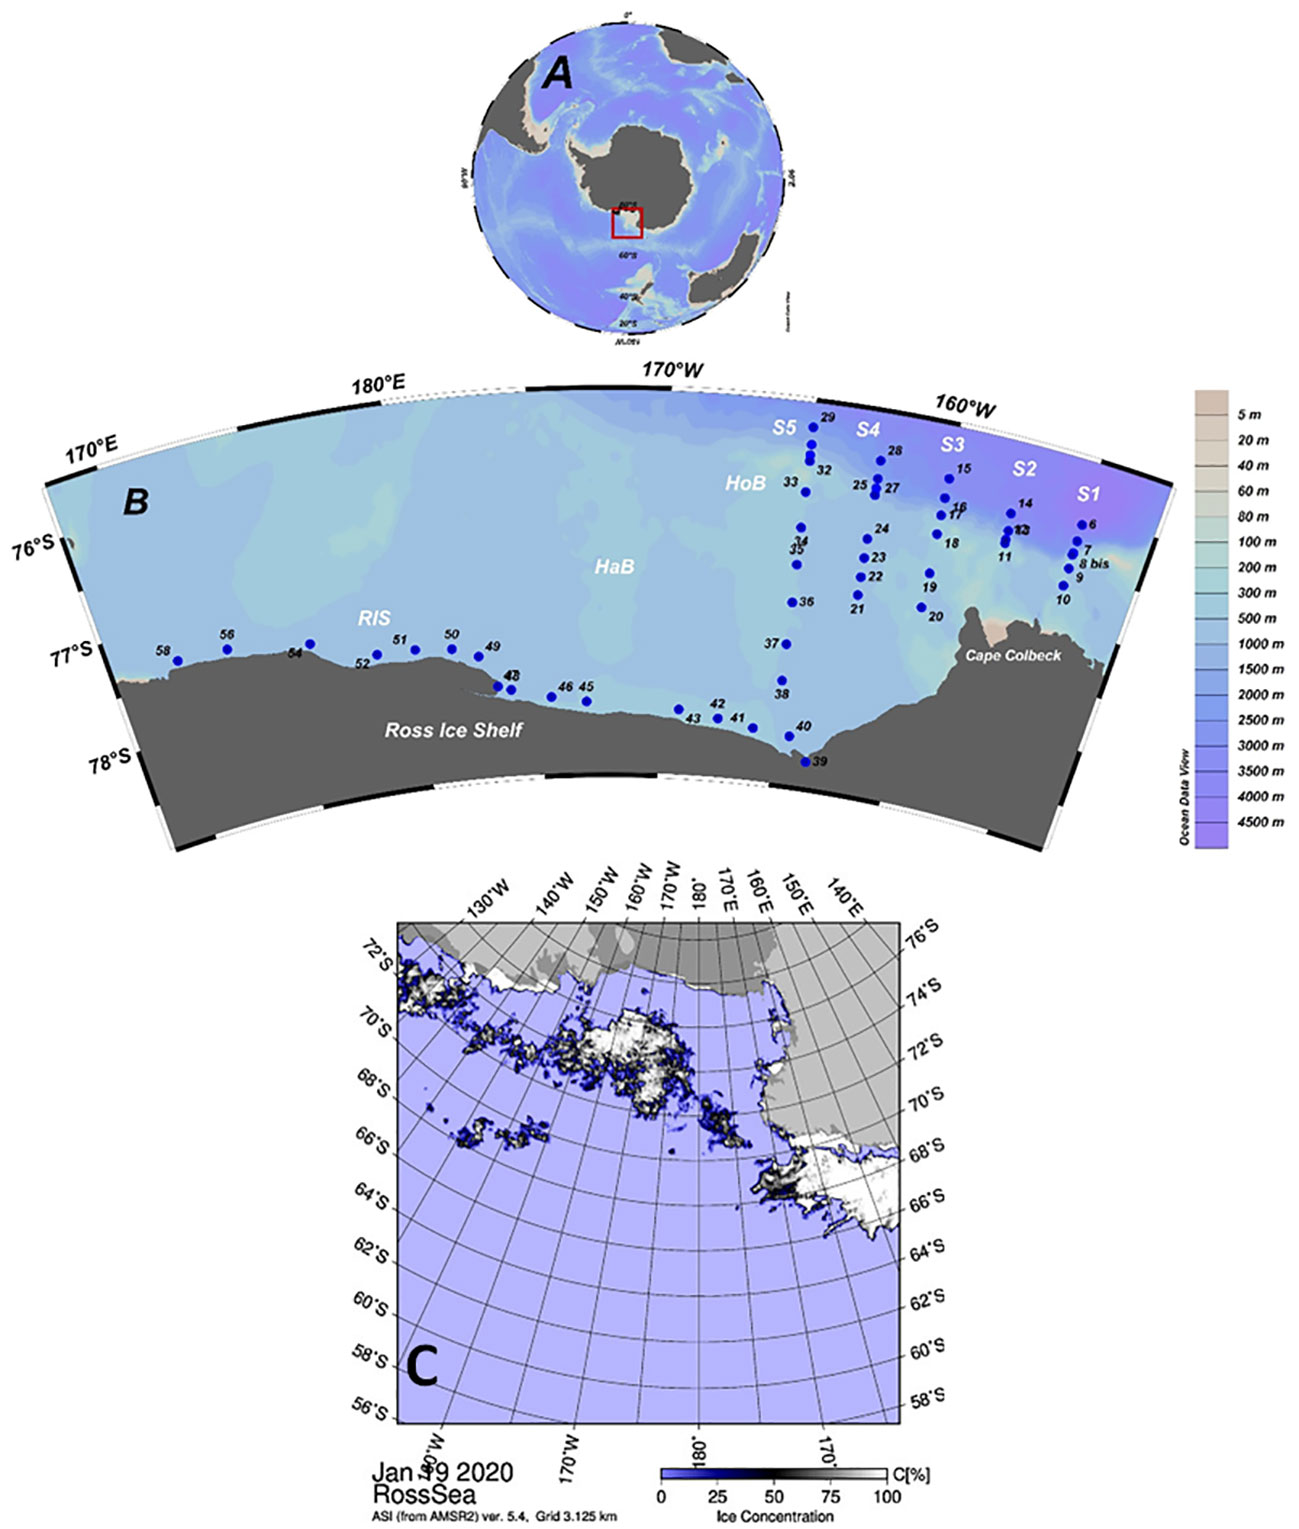
Figure 1 (A) Position of the Ross Sea in the Antarctic continent. (B) Location of ESTRO project sampling stations. S1: stations 6–10; S2 stations 11–14; S3: stations 15–20; S4: stations 21–28; S5: stations 29–38; RIS: stations 39–58. HaB: Hayes Bank; HoB: Houtz Bank. (C) Advanced Microwave Scanning Radiometer 2 (AMSR2) sea ice concentration map, by the University of Bremen provided for the start day of the ESTRO project (19 January 2020) (http://iup.physik.uni-bremen.de/iuppage/psa/2001/amsrop.html).
The primary objective of the ESTRO (Effect of the eaSTern inflow of water on the ROss Sea salinity field variability) project was to collect, for the first time, a comprehensive dataset (physical and chemical observations) to characterize the eastern Ross Sea sector water masses and dynamics focusing on the upstream water inflow coming from western Antarctica and entering the Ross Sea.
Here, we present a unique set water column data of pH and AT and derived carbonate system parameters (CT, pCO2 and Ω) from the nearly unexplored eastern sector of the Ross Sea and the along the Ross Ice Shelf (RIS) collected during the 2019–20 austral summer. We will discuss the distribution of carbonate system parameters by examining the drivers of their variability in surface waters, the possible use as chemical tracers in intermediate and deep waters. We will also do some considerations regarding the sensitivity of the area to ocean acidification and estimates of anthropogenic carbon.
Sea water samples were collected on board the R.V. Laura Bassi in the Ross Sea (Antarctica) during the 2020 austral summer, as part of ESTRO project of the Italian National Program of Research in Antarctica (PNRA) from 19 to 24 of January 2020.
A Sea Bird Electronics SBE9/11plus CTD profiler with two pairs of temperature-conductivity sensors was employed to acquire conductivity, temperature, and depth data. The CTD was coupled to an SBE 23 O2 sensor and to a Chelsea Aquatrack III fluorometer for measuring the oxygen concentration and the fluorescence, respectively.
An SBE 32 plastic coated carousel sampler was used to collect water samples from 24 12-L Niskin bottles. A total of 248 seawater samples for carbonate system analyses were collected at 52 stations at selected depths based on the CTD profiles.
The ESTRO cruise covered the shelf region and the eastern slope area of the Ross Sea. The stations made up five transects in the eastern sector (S1-S5) and one transect along the RIS (Figure 1). The samples were stored in 500 ml borosilicate glass bottles following standard operating procedures (Dickson et al., 2007). The samples were poisoned in the container with saturated HgCl2 to stop biological activity and were then stored in dark, cold (+4°C) conditions.
The CTD calibrations were performed before and after both cruises. Data were acquired at the maximum frequency (24 Hz) with a descent speed of 1 m s-1. The data were corrected and processed according to international procedures (SCOR Working Group, 1988). θ and S were computed using standard algorithms (Fofonoff Jr. and Millard, 1983). The data were processed, and quality was checked using the CTD Sea Bird Electronics data processing software. Finally, the profiles were vertically averaged over 1-m-depth bins.
AT analysis was carried out by potentiometric titration system with a Metrohm 806 Exchange Unit and a 702 SM titrino dosimat following the method described in Rivaro et al. (2010b); Rivaro et al. (2017). Certified Reference Material (batch 191 and 196, provided by A. G. Dickson, Scripps Institution of Oceanography) was analyzed once a week. The precision was ± 4.0 μmol kg−1 and the recovery was 99.8%.
Potentiometric pH measures were carried out by a Metrohm 827 pH meter employing a combination glass/reference electrode with an NTC temperature sensor. pH was expressed on the pH total scale (i.e. [H+] as moles per kilogram of seawater, pHT).
The Tris(hydroxymethyl)aminomethane (TRIS) buffer, provided by A. G. Dickson (Batch #T33) was used to standardize the pH electrode. Both the TRIS buffer and the seawater samples were brought to the same temperature (25°C ± 0.1°C) using a thermostatic water bath before the measurements were completed. The pHT values at 25°C were then recalculated at in situ temperature and pressure conditions (pH in situ). The precision of the pH measurement was ± 0.007 U and it was evaluated by repeated analysis of the AT certified material.
The CO2SYS program was used to recalculate at in situ conditions pH and AT together with CT, pCO2, and Ω calcite and aragonite (Ω Ca and Ar, respectively) from the pH and AT data measured at 25°C (Pierrot et al., 2006). The Revelle factor (RF) was computed for surface samples only. Equilibrium constants of CO2 (K1 and K2) of Millero, 2006 and the pHT scale were used for the calculations (Millero, 2007) together with CTD data (temperature, salinity and pressure).
The instantaneous air-sea CO2 flux (F, mmol m-2d-1) was calculated using the formula:
where k is the CO2 gas transfer velocity (cm h-1), s is the solubility of CO2 (mol kg-1 atm-1) and ΔpCO2 is the difference between the pCO2 of the seawater (pCO2SW) and the atmosphere (pCO2atm). We calculated k following the Wanninkhof formulation (2014):
2) k = 0.251u2(660/Sc)-0.5
where u is the wind speed at 10 m height and Sc is the temperature dependent Schmidt number. The shipboard wind speed data, measured at 10 m height, were used. NegativeΔpCO2 values indicate absorption of the gas by the sea surface, while positive values correspond to the release of the gas into the atmosphere (Wanninkhof, 2014).
The ΔpCO2 values were calculated as the difference between the pCO2SW computed by CO2SYS and the mean pCO2atm value of 409 μatm available from the South Pole Observatory (https://gml.noaa.gov/obop/spo/). The pCO2atm was corrected to 100% humidity at in situ sea surface temperature and salinity using the standard formula as given in Dickson (2007).
The Cant was estimated throughout the TrOCA method. This approach is based on the definition given by Touratier et al. (2007) of TroCA and TrOCA0, where TrOCA0 is defined as the pre-industrial TrOCA.
Since in Equation 3) only CT is significantly affected by the atmospheric increase of CO2, Cant concentration can be computed as follows:
where a represents the Redfield coefficient. Since TrOCA0 has conservative property, the four parameters (a, b, c, d) are determined by minimizing the fit standard error of Eq. 5). Hence the Cant is estimated using the following equation (Sandrini et al., 2007):
Principal component analysis (PCA) was applied to the dataset to explore the correlations between carbonate system data and the measured environmental parameters (temperature, salinity, fluorescence, and O2). First, data were normalized by log-transformation, then the data matrix was processed after autoscaling the data using the R based software CAT (Leardi et al., 2017).
Surface samples were considered separately from those collected at depths deeper than 100 m. Fluorescence data were not considered for deep samples, as the values were close to zero.
To identify the water masses present in the study area we have used hydrographic ranges defined by Orsi and Wiederwohl (2009) and Budillon et al. (2011) for the water originated in the Ross Sea and by Randall-Goodwin et al. (2015) for the upstream water that arrives with the westward coastal current at the eastern gate.
Based on the thermohaline properties and neutral density γn (Jackett and McDougall, 1997), we have identified the following water masses (Figure 2 and Table 1):
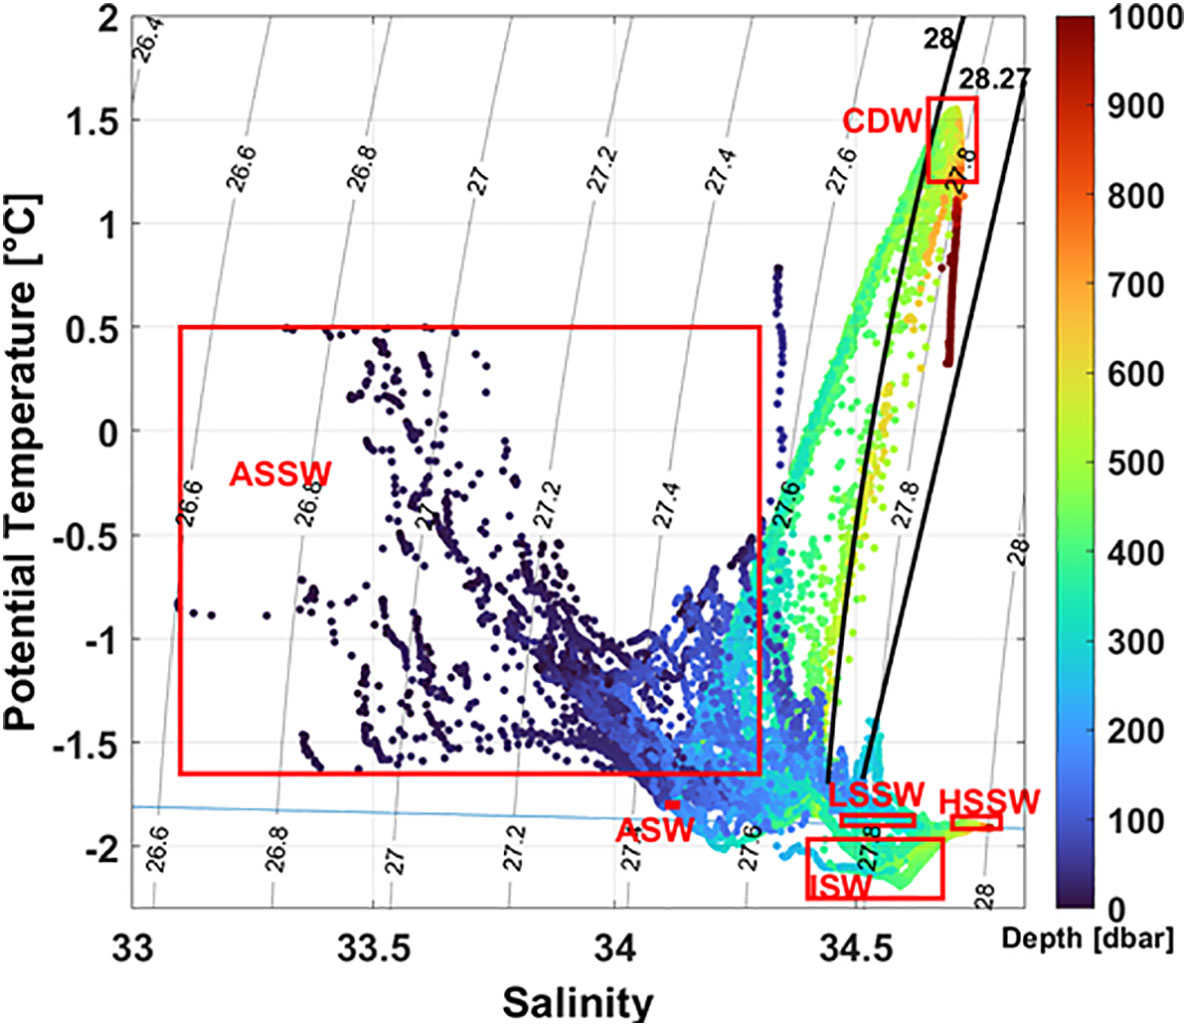
Figure 2 Potential temperature salinity (θ/S) plot. Solid lines show the 28.00 and 28.27 kg m-3 neutral density γn surfaces. The blue horizontal line shows the surface freezing point of seawater. Major water masses are labeled: Antarctic Surface Water (AASW), Circumpolar Deep Water (CDW), High Salinity Shelf Water (HSSW), Low Salinity Shelf Water (LSSW), Ice Shelf Water (ISW), and Amundsen Sea Water (ASW).
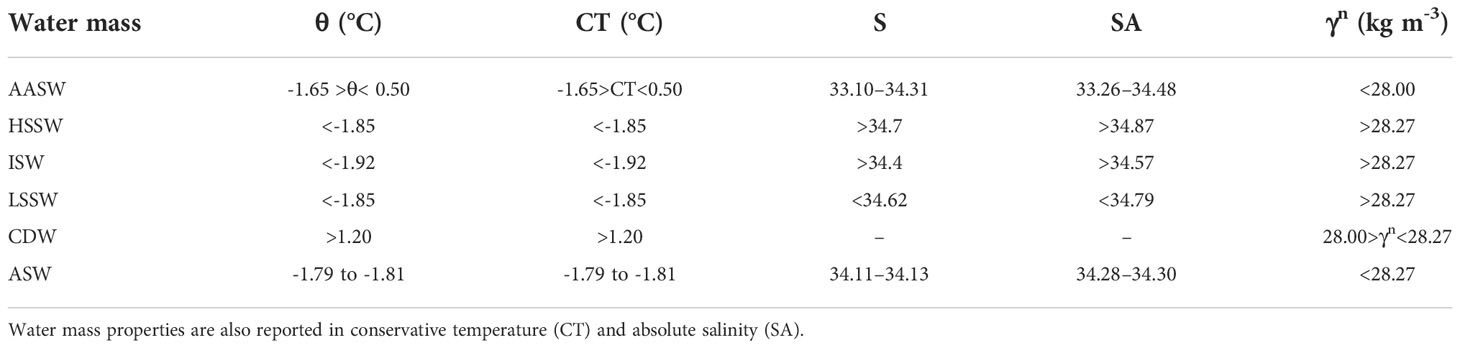
Table 1 Bounding potential temperature (θ), salinity and neutral density (γn) values that define the major water masses in the area investigated by the ESTRO cruise.
Antarctic Surface Water (AASW) characterized by a γn lower than 28.00 kg m-3 and by a wide range of temperatures and salinities;
The saltiest High Salinity Shelf Water (HSSW) defined by S > 34.7, θ< -1.85°C and γn > 28.27 kg m-3. It is produced in the Terra Nova Bay (TNB) polynya during wintertime by brine rejection during sea ice formation. In the study area HSSW is found only on the western sector of the RIS;
Ice Shelf Water (ISW) is formed by basal melting of the Ross Ice Shelf (RIS) by the dense shelf waters and is characterized by temperature below the surface freezing point (θ< -1.92° C). This is found mainly at intermediate depth along the RIS with two cores in the central and eastern Ross Sea. The colder and saltier core is found in the central Ross Sea at about 180° E;
Low Salinity Shelf Water (LSSW) is defined by S< 34.62, θ< -1.85° C and γn > 28.27. This water is formed by the interaction of surface water with the subsurface layer during freezing-melting cycles (Jacobs et al., 1985). In the study area LSSW is found at the bottom and at intermediate depths in the eastern continental shelf;
Circumpolar Deep Water (CDW) is a relatively warm, salty, low-oxygenated, and nutrient-rich water mass and is the primary source of heat and nutrients over the continental shelf. CDW is defined by γn > 28.00 kg m−3 and θ > 1.2° C. In the study area, CDW is mainly confined on the continental slope and does not intrude onto the shelf.
Amundsen Sea Water (ASW) is formed in the polynya area of the Amundsen Sea during winter and is characterized by θ ≈ -1.81°C and S = 34.13. We identified this water in the subsurface layer between 100 and 300 m in northeastern stations of the study area, both on the slope and over the continental shelf area. The ASW found in the study area has potential temperature and salinity slightly modified from the source region with values of θ between -1.79° and -1.81°C and S between 34.11 and 34.13.
The carbonate system parameters data were constrained by the physical data, allowing us to define mean values for each water mass. The mean values and relative standard deviations of AT, pH, CT, pCO2, ΩCa, and ΩAr are summarized in Table 2. Our results fall within the ranges of previously collected data in the Ross Sea (Sandrini et al., 2007; Mattsdotter Björk et al., 2014; Rivaro et al., 2014; Dejong et al., 2015; Rivaro et al., 2019).All parameters showed greater variability in the AASW than in deep waters, where they varied within a relatively narrow range. A general increase with depth was observed for AT, CT, and pCO2. In particular, the highest concentration of AT and CT (2365 μmol kg-1 and 2272 μmol kg-1, respectively) was measured in the HSSW in the western RIS section and the highest pCO2 (503 µatm) in the CDW. The pH decreased with depth with the absolute minimum (7.83) measured at stations 14 and 15 (Section S2) at a 2500-m depth, where CDW was identified.
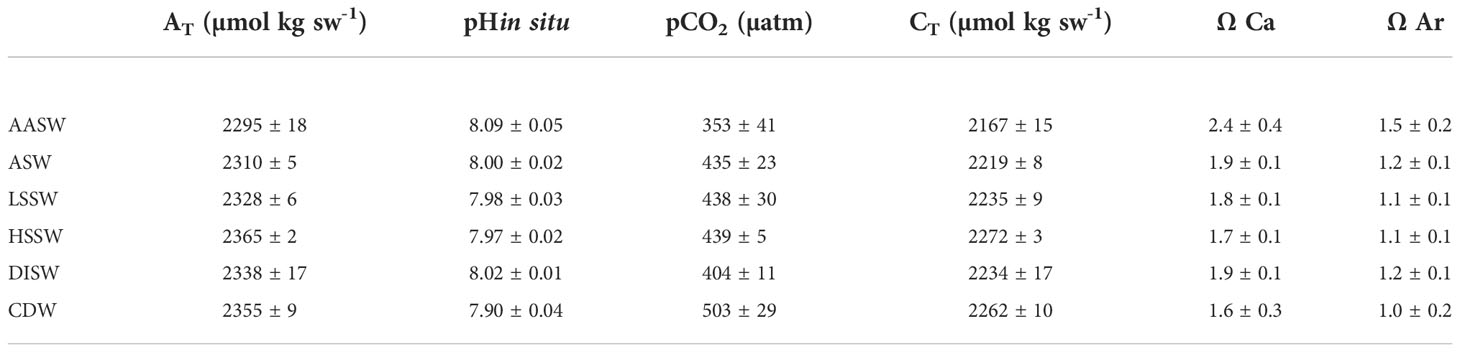
Table 2 Mean and standard deviation of values of carbonate system parameters in water masses. .
The computed surface water pCO2 showed undersaturation compared to atmospheric value at all stations except at stations 12 and 13 (409 and 452 µatm, respectively) collected in the eastern sector (section S2). High spatial variability was observed, with the lowest pCO2 at station 56 (259 µatm) matching the minimum of CT (2160 μmol kg-1) and the maximum of pH (8.21). Negative ΔpCO2 values found, in general, suggested absorption of the gas by the sea surface, particularly along RIS (Table 3).
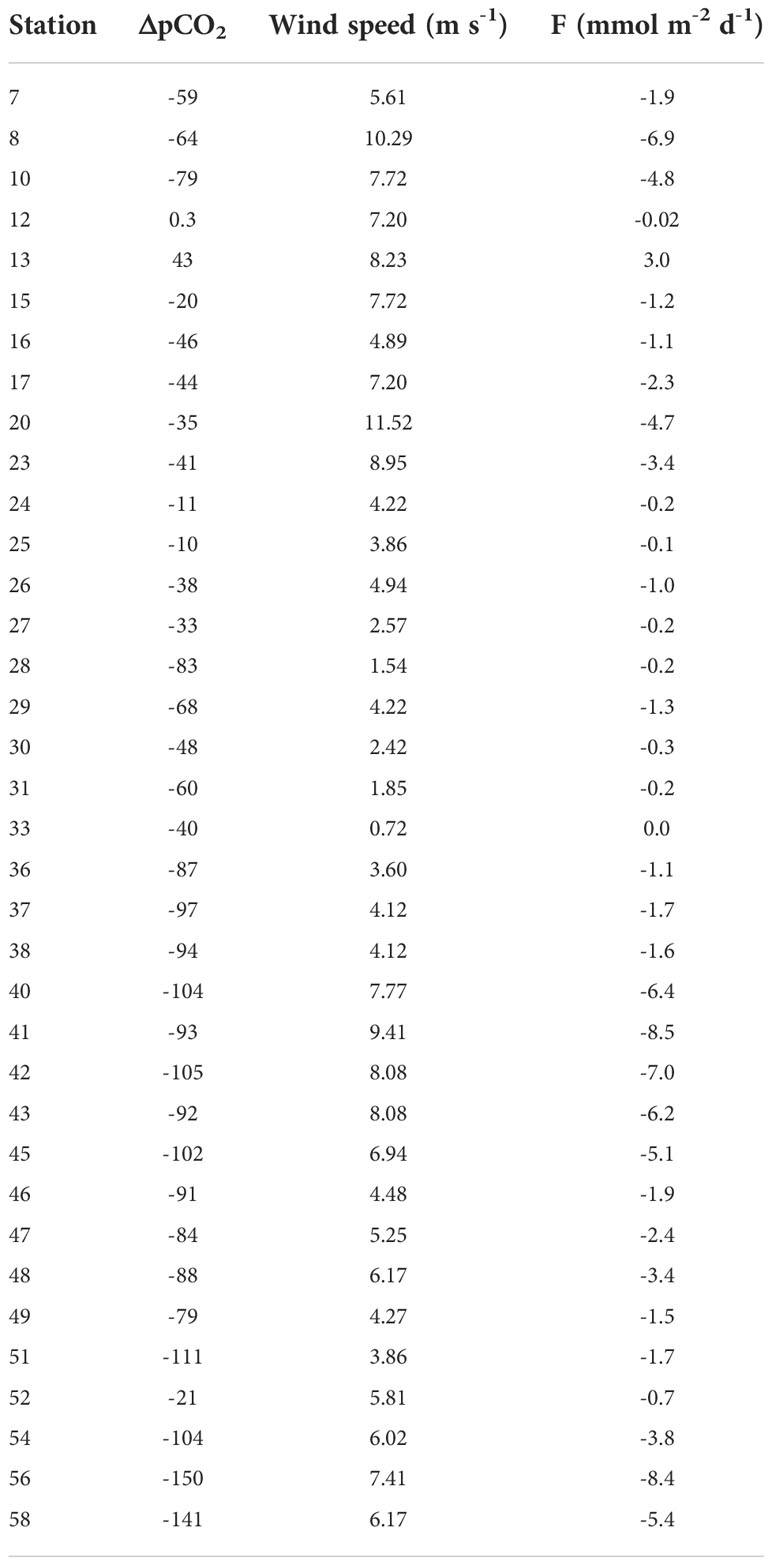
Table 3 Air–sea CO2 gradient (ΔpCO2), wind speed and estimated CO2 flux (F).
Carbonate dissolution is primarily controlled by the saturation state of seawater with respect to carbonate minerals (Ω). The solubility of calcite and aragonite increases with depth. All surface and sub-surface samples showed supersaturation conditions (Ω >) with respect to calcite and aragonite. Under-saturation conditions of aragonite (Ω<1) were only found at a few offshore stations at deep depths, with the absolute minimum being 0.7 at station 14, at 2500 m. The values found agree with what reported by Manno et al. (2007) in the western Ross Sea, where only the deepest layers (approximately below 1000 m) were undersaturated with respect to aragonite.
Due to the large seasonal variability in the surface waters, the TrOCA method is not applicable; therefore, we only computed Cant for depths below 100 m. An uncertainty of 8 μmol kg sw-1 associated with the mean Cant value was estimated. The calculated Cant concentration ranged from 21 μmol kg sw-1 in CDW to 65 μmol kg sw-1 in HSSW. The water masses observed over the shelf in the eastern sector (ASW and LSSW) were also enriched in Cant, albeit at slightly lower concentrations than the HSSW (54 μmol kg sw-1).
Principal component analysis applied to surface samples led to the identification of two principal components (PC) explaining about 82% of the total variance: PC1 explained 62.6% and PC2 explained a further 19.7%, which is valuable for the exploratory data analysis performed in this study and comparable to previous studies (Rivaro et al., 2019).
As regards the loading plot (Figure 3A), O2, pH, fluorescence, Ω Ca, and Ω Ar loaded at negative values of PC1 and positive values of PC2.They were negatively correlated with the AT and S that loaded at negative values of PC1 and PC2, and with pCO2 and RF that are loaded at positive values of PC1 and negative values of PC2. Finally, T and CT were negatively correlated, with the temperature loading at positive values of both PC1 and PC2 and the CT loading at negative values of both PC1 and PC2.
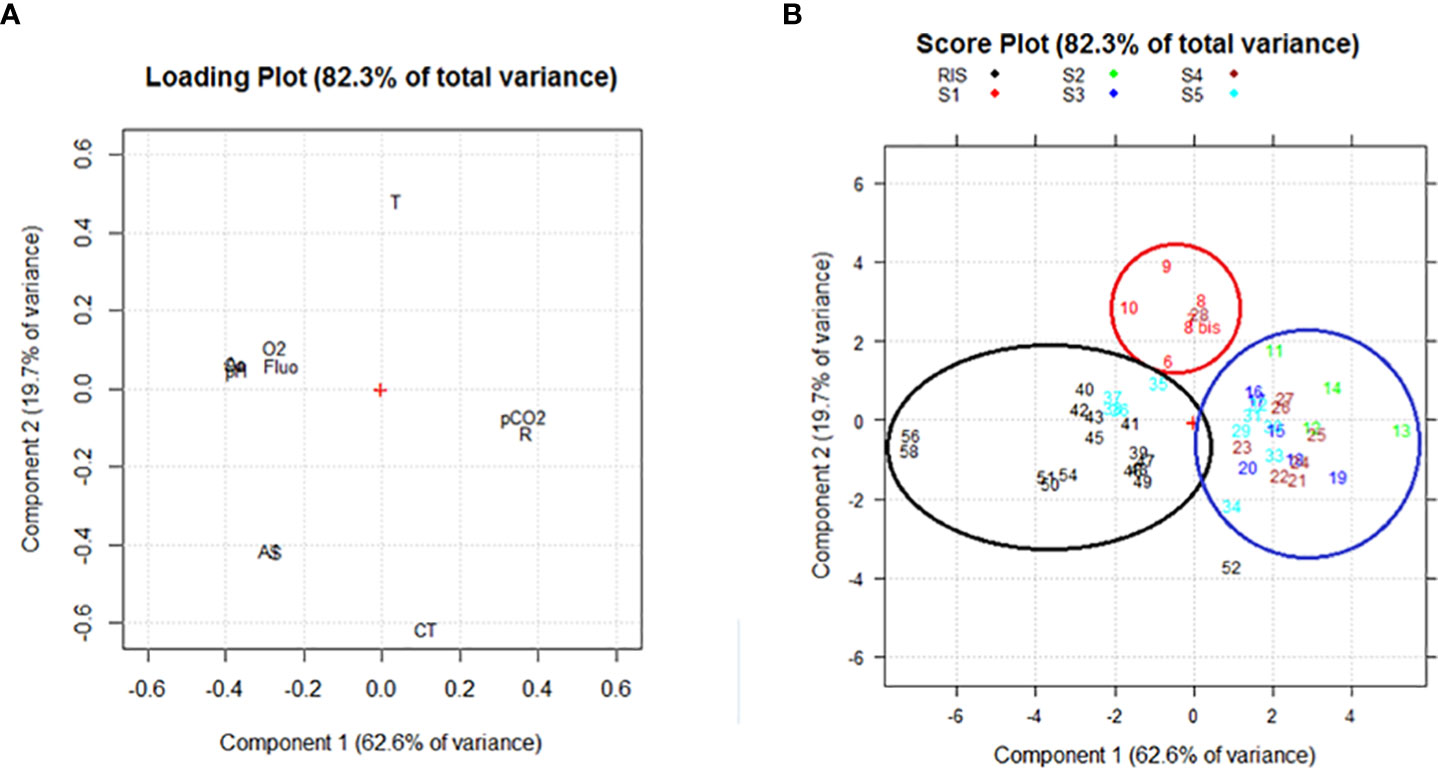
Figure 3 (A) Loading plot and (B) Score plot obtained from the PCA for the surface samples. The following abridgements were used for the variables in the loading plot: dissolved oxygen (O2), total inorganic carbon (CT), total alkalinity (AT), partial pressure of CO2 (pCO2), Revelle factor (R), saturation grade of calcite and aragonite (Ca and Ar), fluorescence (Fluo), temperature (T), and salinity (S).
The score plot (Figure 3B) highlights that the samples were ordered in three groups depending on the sampling area. In general, the samples were mainly distributed along PC1, moving from the samples collected in the western part of the RIS (station 56 and 58), characterized by high values of O2, pH, fluorescence and Ω, to the stations belonging to the eastern Ross Sea, characterized by higher values of pCO2 and of RF, in between the group composed by the stations collected at the easternmost section (S1), characterized by the highest temperature, lowest CT, and intermediate values of O2 and pH.
Two principal components were identified for the deeper samples which explained 69.6% and 16.8% of the total variance. pH, Ω Ar, and Ω Ca loaded at positive values of PC1 and negative values of PC2 and were negatively correlated with CT, T, S, and O2. CT and T loaded at negative values of PC1 and PC2, whereas O2 loaded at positive values of PC1 and PC2. CT, T, S, and AT loaded at negative values of PC1 and PC2 and were negative correlated with pCO2, which was placed in the opposite side of the PCA plot (Figure 4A). From the score plot, it was possible to identify different groups of samples, principally distributed along PC1, moving from samples characterized by high values of T and CT to samples with high values of pH, Ω, and O2 (Figure 4B).
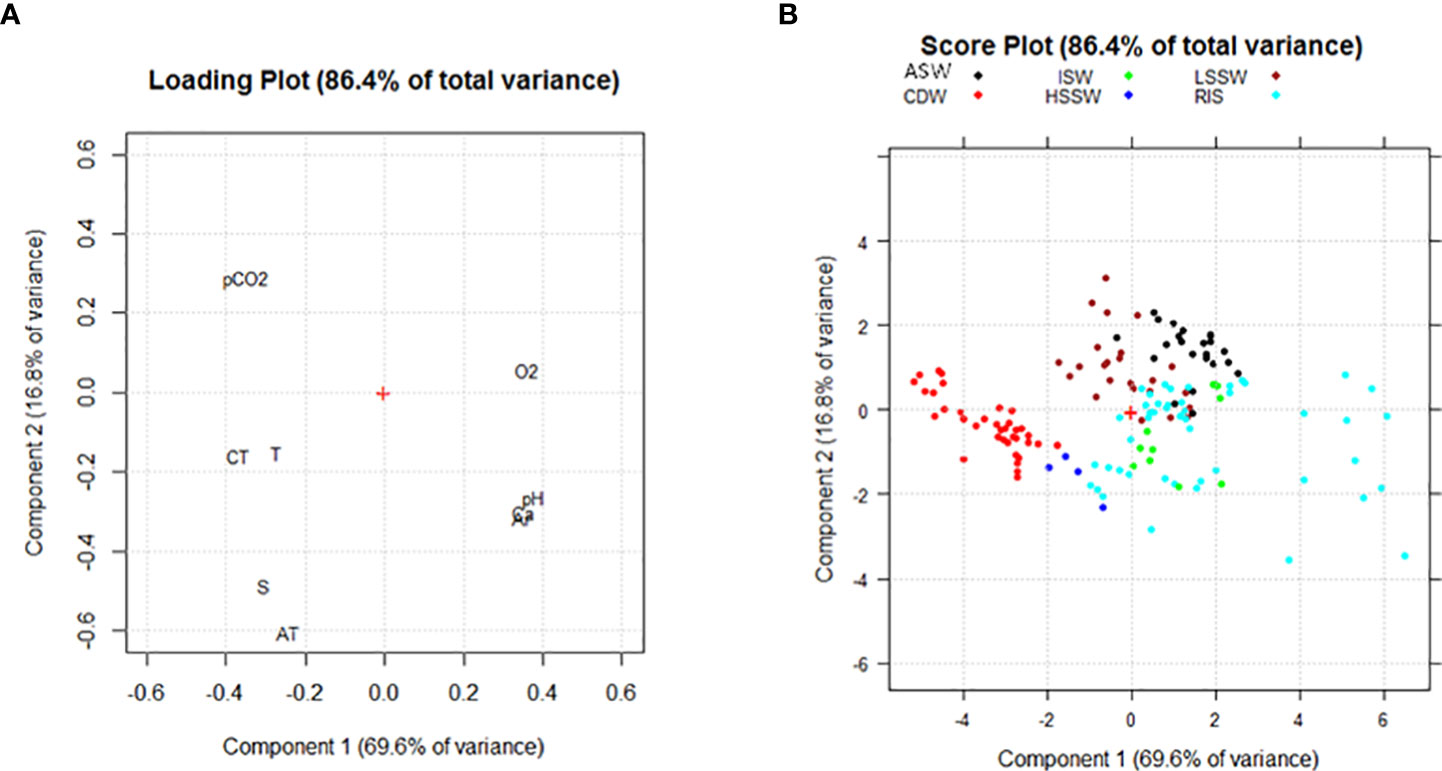
Figure 4 (A) Loading plot and (B) Score plot obtained from the PCA for samples collected at depths deeper than 100 m. The following abridgements were used for the variables in the loading plot: dissolved oxygen (O2), total inorganic carbon (CT), total alkalinity (AT), partial pressure of CO2 (pCO2), saturation grade of calcite and aragonite (Ca and Ar), temperature (T) and salinity (S). The following colors were used to identify water masses: black = Amundsen Sea Water (ASW); brown = Low Salinity Shelf Water (LSSW); red = Circumpolar Deep Water (CDW); green = Ice Shelf Water (ISW); blue = High Salinity Shelf Water (HSSW); cyan = Shelf Waters sampled along the RIS that belong to neither HSSW nor ISW (RIS).
The distribution of the carbonate system parameters in AASW is controlled by physical properties together with the circulation pattern and by biological activities.
Few AT measurements have been previously reported for the eastern Ross Sea and for the RIS area (Mattsdotter Björk et al., 2014; Dejong et al., 2015; Rivaro et al., 2019). Both the PCA results (Figure 3) and the longitudinal distribution outlined the link of AT variability with the salinity. Since AT strongly covaried with salinity (n = 52, r = 0.911, p = 0.01), the lowest AT values were in the eastern Ross Sea, where the salinity was lowest and temperature highest (Figures 5A–C). In fact, the Amundsen Sea has lower AT than the Ross Sea, which coincides with lower salinity. Mattsdotter Björk et al. (2014) reported for the Amundsen Sea surface waters a mean value and relative standard deviation of AT of 2995 ± 6 μmol kg-1 that are close to our data (2286 ± 11 μmol kg-1) measured in eastern Ross Sea (S1-S5). The slight increase in AT along the RIS (2313 ± 13 μmol kg-1) was statistically significant compared to the S1-S5 area (t-test, 95% confidence level). We can state that the AT distribution found in our survey traced near Cape Colbeck a freshwater mass coming from West Antarctica, which, moving westward along the RIS edge, became more saline with a higher AT. Therefore, our finding is consistent with the general Ross Sea surface circulation scheme (Sedwick et al., 2011).
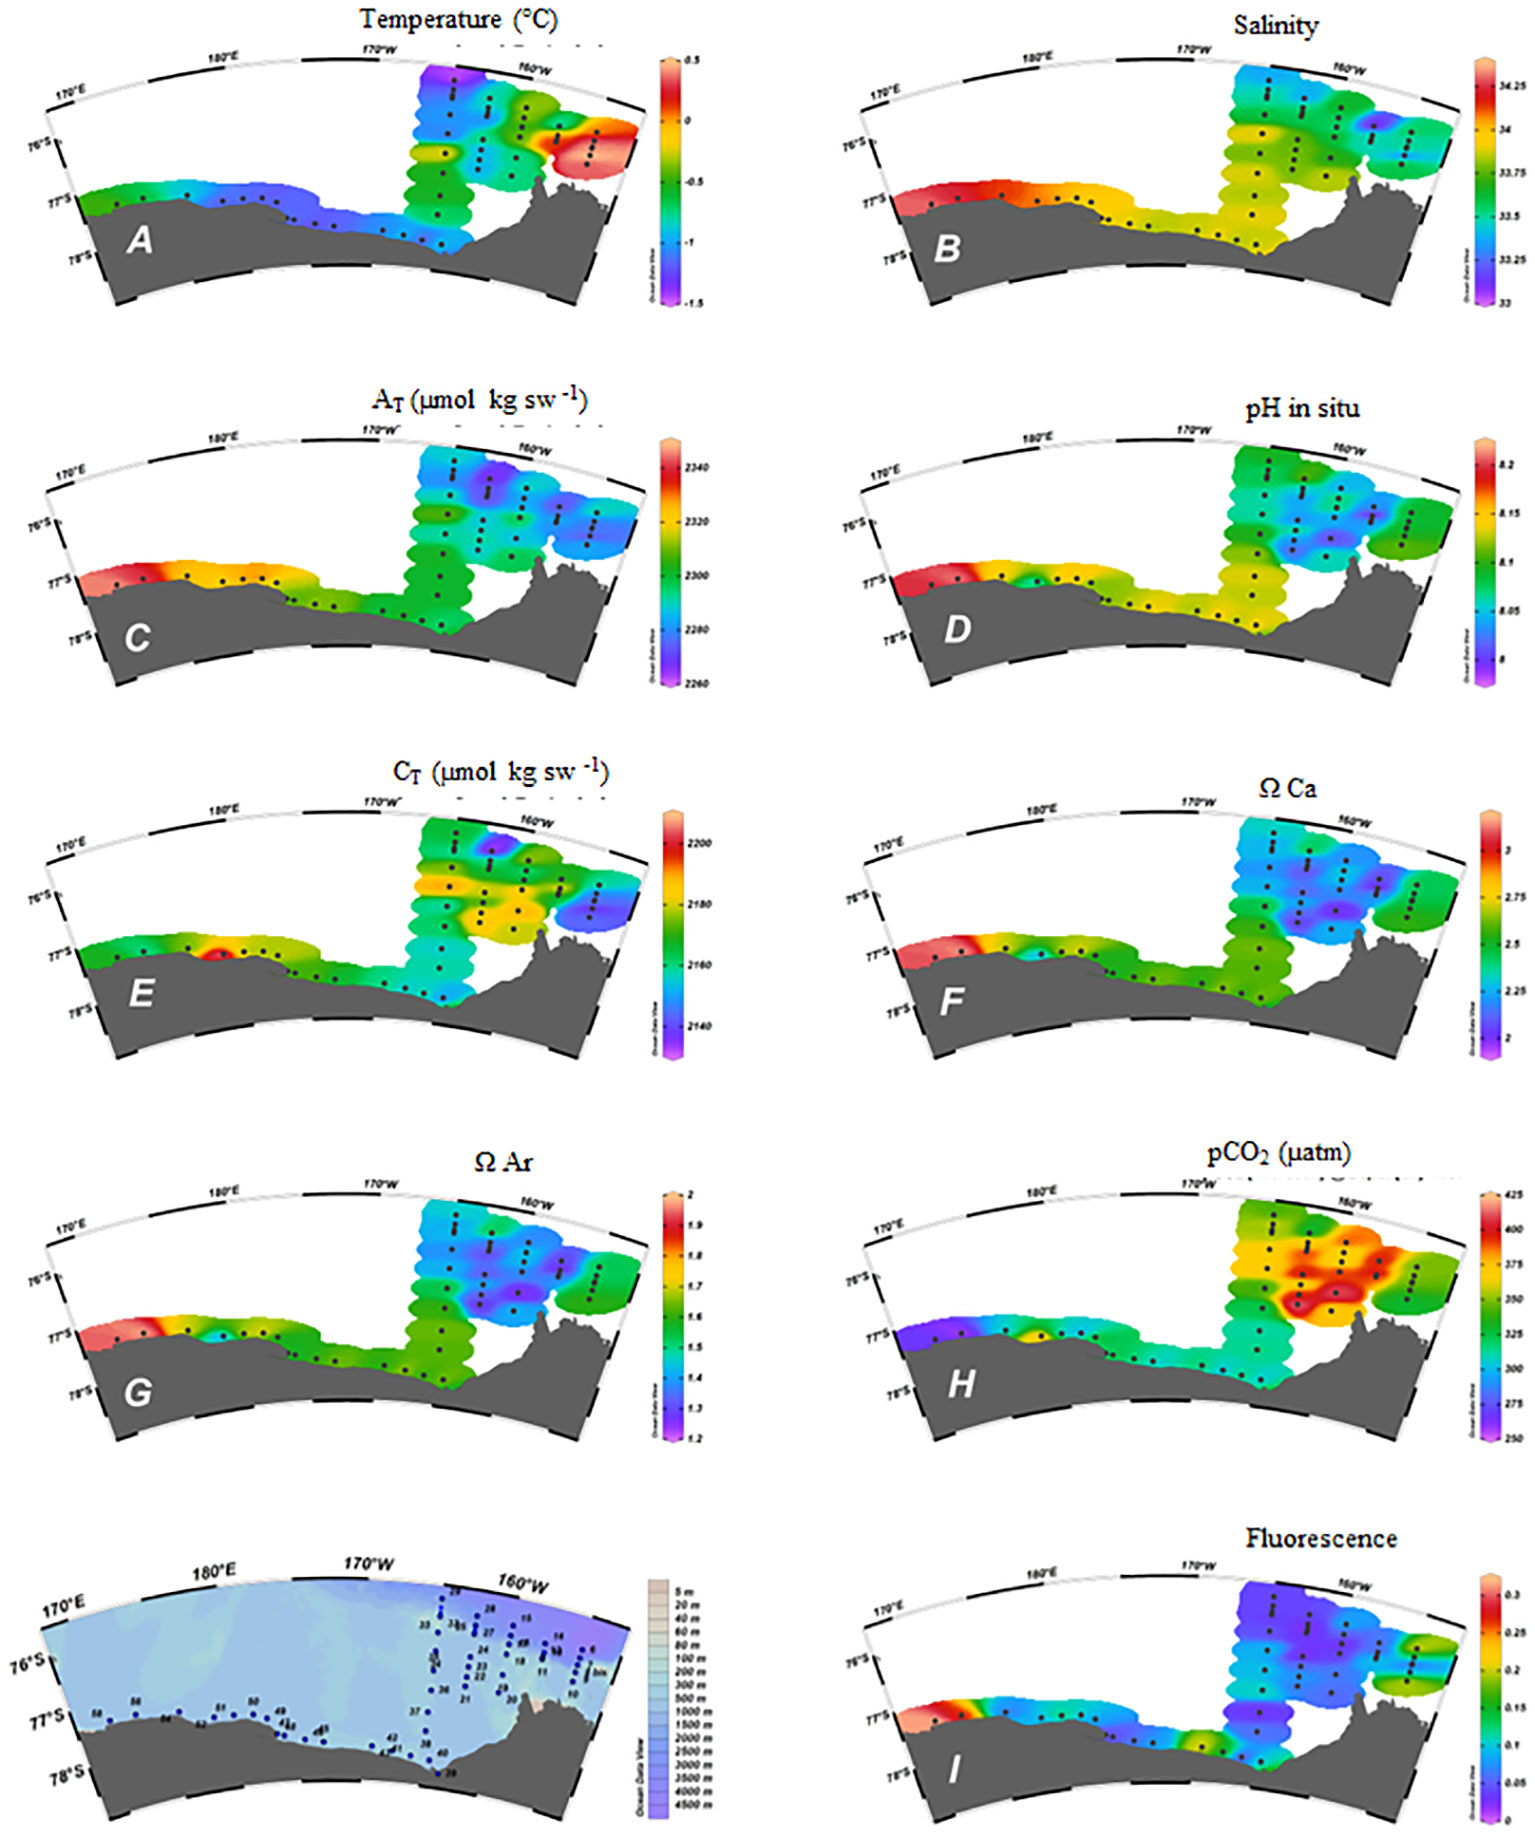
Figure 5 Spatial distribution in the surface samples of: (A) Temperature (°C); (B) Salinity; (C) AT (µmol kg sw-1); (D) pH in situ; (E) CT (µmol kg sw-1); (F) ΩCa; (G) ΩAr; (H) pCO2 (µatm); (I) Fluorescence.
The distribution of pH and CT also showed differences between the various sections examined (Figures 5D, E). Our CT data (2166 ± 16 μmol kg-1) at those stations sampled in S1-S5 sections agreed to the mean value and relative standard deviation reported by Mattsdotter Björk et al. (2014) for the Amundsen Sea (2179 ± 9 μmol kg-1). Differently to AT, the CT values found along the RIS (2170 ± 17 μmol kg-1) were not statistically different from those measured in the S1-S5 area. Moreover PCA results evidenced that the CT correlation with salinity, although positive, was less significant than that shown by the AT (n = 52, r = 0.350, p = 0.01), similar to the CT–AT correlation (n = 52, r = 0.375, p = 0.01), outlining the CT’s less conservative behavior in tracing the fresh water mass from west Antarctica.
Besides the circulation pattern, AT and CT variability in the AASW can also be controlled by freshwater addition from melting sea ice, which also acts to change salinity (Lee et al., 2006). Both field and laboratory studies have demonstrated that ikaite, a hydrous calcium carbonate mineral (CaCO3·6H2O), precipitates out within brines during sea ice formation (Marion et al., 2001; Papadimitriou et al., 2007). The net effect of ikaite precipitation in brine is to reduce the concentration of AT and CT, whilst increasing the pCO2. Any brine released during ice melt transfers these inorganic carbon characteristics to the underlying water. A relationship between normalized inorganic carbon and total normalized alkalinity (CTN and ATN, respectively) of 1:2 is indicative of ikaite precipitation during sea ice formation (Zeebe and Wolf-Gladrow, 2001; Jones et al., 2010).
Thus, surface AT and CT were normalized (ATN and CT N, respectively) to a constant salinity of 34.50 (roughly the average salinity of the Ross Sea upper water column) to remove the effects of dilution from the melting sea ice (Dunbar et al., 2003). ATN and CTN ranged from 2336 to 2370 μmol kg−1 and from 2177 to 2240 μmol kg−1, respectively (Figure 6). No 1:2 ratios were observed from the distribution of CTN and ATN except for a few stations sampled in S2, S3, and S4 (stations 12,13, 15, 18, 22, and 24) where pCO2 higher than 398 µatm and pH lower than 8.05 were measured.
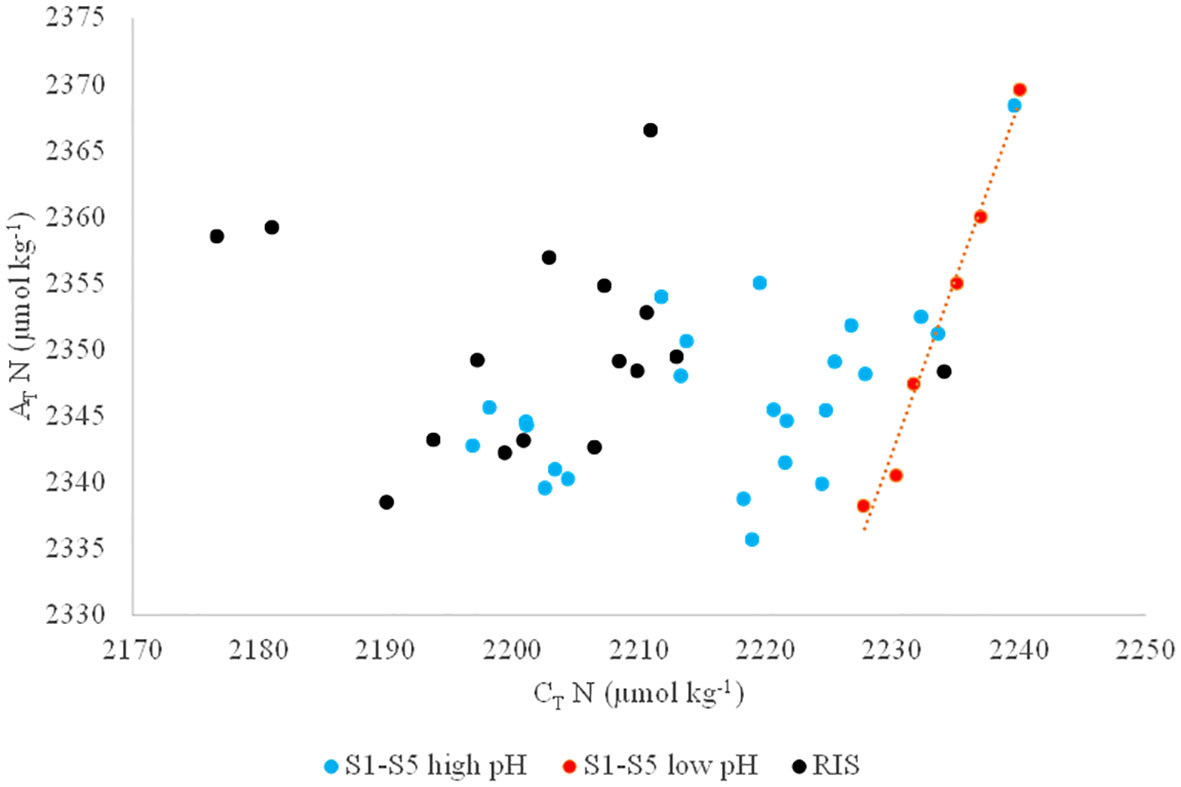
Figure 6 Normalized total alkalinity (AT N) as a function of normalized total inorganic carbon (CT N). Black dots (RIS) refer to samples taken along the RIS, blue dots (S1-S5 high pH) refer to samples taken in sections S1-S5 having a pH higher than 8.05 and pCO2 lower than 398 µatm and red dots (S1-S5 low pH) refer to samples taken in sections S1-S5 having a pH lower than 8.05 and pCO2 higher than 398 µatm.
The ESTRO cruise was characterized by ice-free conditions over most of the study area, except for the shelf area of section 2 which, for this reason, was not possible to complete. Therefore, when the sampling took place, the possible effect of melting sea ice on the distribution of CT and AT was no longer visible, apart at the abovementioned stations. Potentially, the contribution from melting sea ice in surface waters can be estimated by a combination of salinity and δ18O (Dini and Stenni, 2000). The measurement of δ18O was not included in ESTRO’s sampling plan, so no further conclusions can be drawn from this. Moreover, the high CT, CO2-rich, and low pH surface water explained the low ΩCa and ΩAr found at those stations (Figures 5F–H).
Ocean pH is affected by biological primary production and respiration, physical mixing, air-sea CO2 exchange, and sea water CO2 chemistry. The melting of sea ice, besides influencing the chemical properties, may promote the development of phytoplankton since it affects the depth of the Upper Mixed Layer (UML) and the stability of the water column (Mangoni et al., 2017).
The Ross Sea is a key region for global carbon uptake and is characterized by a strong seasonality with the annual CO2 uptake being mediated by biological carbon drawdown in summer that increases pH, Ω, and O2 concentration (Arrigo et al., 2008; Smith et al., 2014; Rivaro et al., 2019). During biological production, CT is consumed (increase in pH), which increases [CO32−] and the saturation state for aragonite and calcite (Chierici and Frasson, 2009).
No chlorophyll data were collected during the ESTRO cruise; however, information about primary production can be obtained by looking at the in situ fluorescence data (Figure 5I) or at satellite maps that provide an indication of the abundance of phytoplankton. Both the low fluorescence data acquired during the cruise and the MODIS map referred to the investigated period (available at http://giovanni.gsfc.nasa.gov) outlined the low biological activities occurring in the eastern sector.
We used the ATN–CTN relationship to further confirm the scarce role of biological activities in determining the distribution and variability of carbonate system species in the eastern Ross Sea surface waters. In fact, photosynthesis and respiration can significantly influence CT while AT is only slightly influenced by photosynthesis (Zeebe and Wolf-Gladrow, 2001). When considering the whole ASSW dataset, ATN variability was smaller (34 μmol kg−1) than CTN variability (63 μmol kg−1), but their low correlation (n = 39, r = 0.6, p = 0.01) confirmed the general low role of the biological processes. Consistent with this observation, the O2 saturation (i.e., the ratio of the measured concentration to the concentration at the equilibrium, which is a function of temperature and salinity) was ≈100% or lower, supporting the hypothesis that low photosynthetic activity was occurring during the ESTRO survey. Surface waters of the investigated area were supersaturated with respect to CaCO3, but the range of both ΩCa and ΩAr even if comparable to those of Mattsdotter Björk et al. (2014) for the Amundsen Sea was lower than that reported for the western Ross Sea in those areas characterized by high rates of primary production during the summer (Dejong et al., 2015; Rivaro et al., 2019). We found a little effect of phytoplankton activity on carbonate system chemistry at S1 and along the RIS at stations 56 and 58 only, as also highlighted by the PCA score plot (Cf. Figure 3B). Thus, our observations highlight differences between the eastern and western Ross Sea, where distribution of the carbonate system parameters was largely controlled by phytoplankton activity.
The combination of low-speed winds and low productivity resulted in low CO2 flux rates into surface waters. The eastern Ross Sea seems a low atmospheric CO2 sink area probably due to the sea ice that prevented air–sea CO2 exchange during the winter coupled with low wind speeds and high surface water pCO2. We found a lower averaged flux in the eastern sector than along RIS (-1.4 ± 2.7 mmol m-2 d-1 and -4.5 ± 2.6 C mmol m-2 d-1, respectively), that agrees with mean CO2 fluxes for January estimated by Dejong and Dunbar (2017).
The estimated fluxes in the eastern Ross Sea were particularly lower than those found in previous surveys at TNB polynya (-12.7-15.4 mmol C m-2 d-1, Rivaro et al., 2014; Rivaro et al., 2017). Although TNB is smaller than the Ross Sea polynya, it is characterized by high rates of primary production during the summer (Tremblay and Smith, 2007; Mangoni et al., 2017; Bolinesi et al., 2020) and a high air–sea CO2 disequilibrium is frequently observed in summer, with the sea surface under-saturated with respect to atmospheric CO2 corresponding to high measured chlorophyll-a concentration (Dejong and Dunbar, 2017; Rivaro et al., 2017; Rivaro et al., 2019). Moreover, the high katabatic winds speed blowing in TNB polynya, and the absence of sea ice facilitates gas exchange with the atmosphere.
The higher mean flux observed along the RIS section can be ascribed to both the higher air–sea CO2 disequilibrium and wind speed than the eastern sector. However, the effect of biological drawdown of CO2 seems to be low even in this area, except at stations 56 and 58, where the biological carbon uptake could have reduced seawater pCO2 and CT, favoring CO2 sinks and increased ΩAr and ΩCa values.
The PCA loading plot showed that the chemical properties in samples collected below 100 m were not uniformly distributed; thus, we focused on the relationships linking the distribution of the measured carbonate system properties (i.e. AT and pH) to those of S and θ. The AT significantly and positively correlated with both S (Spearman, n = 122, r = 0.892, p = 0) and θ (Spearman, n = 122, r = 0.590, p = 0). pH significantly and negatively correlated with both S (Spearman, n = 122, r = -0.650, p = 0) and θ (Spearman, n = 122, r = -0.653, p = 0).
Based on these observations, we can therefore assume that both AT and pH had conservative behavior and could be used as tracers to chemically identify water masses.
The eastern sector is the entrance gate of glacial melt water coming from the Amundsen and Bellingshausen Sea that alters the freshwater budget of the downstream Ross Sea (Rignot et al., 2013; Shepherd et al., 2018). The physical and chemical properties of the ASW (indicated as Winter Water in the Amundsen Sea) were defined as a result of the activities of the Amundsen Sea Polynya International Research Expedition (ASPIRE) project (Yager et al., 2012; Randall-Goodwin et al., 2015).
An average value of 2215 ± 5 μmol kg-1 for CT and of 2295 ± 5 μmol kg-1 for AT were defined (Yager et al., 2016). Our data seem to suggest a limited effect of mixing between water masses and circulation in general in changing these chemical properties on a relatively short spatial scale, as it can be seen by comparing the distribution of salinity and AT in sections 9–32 (Figure 7). In fact, the properties of the intruding ASW remain almost unchanged for tens of kilometers before the mixing of ASW with the shelf’s resident waters takes place. Even considering the average pH values, we can assume that the ASW input does not appreciably affect the distribution of the carbonate system in the entire eastern sector of the Ross Sea.
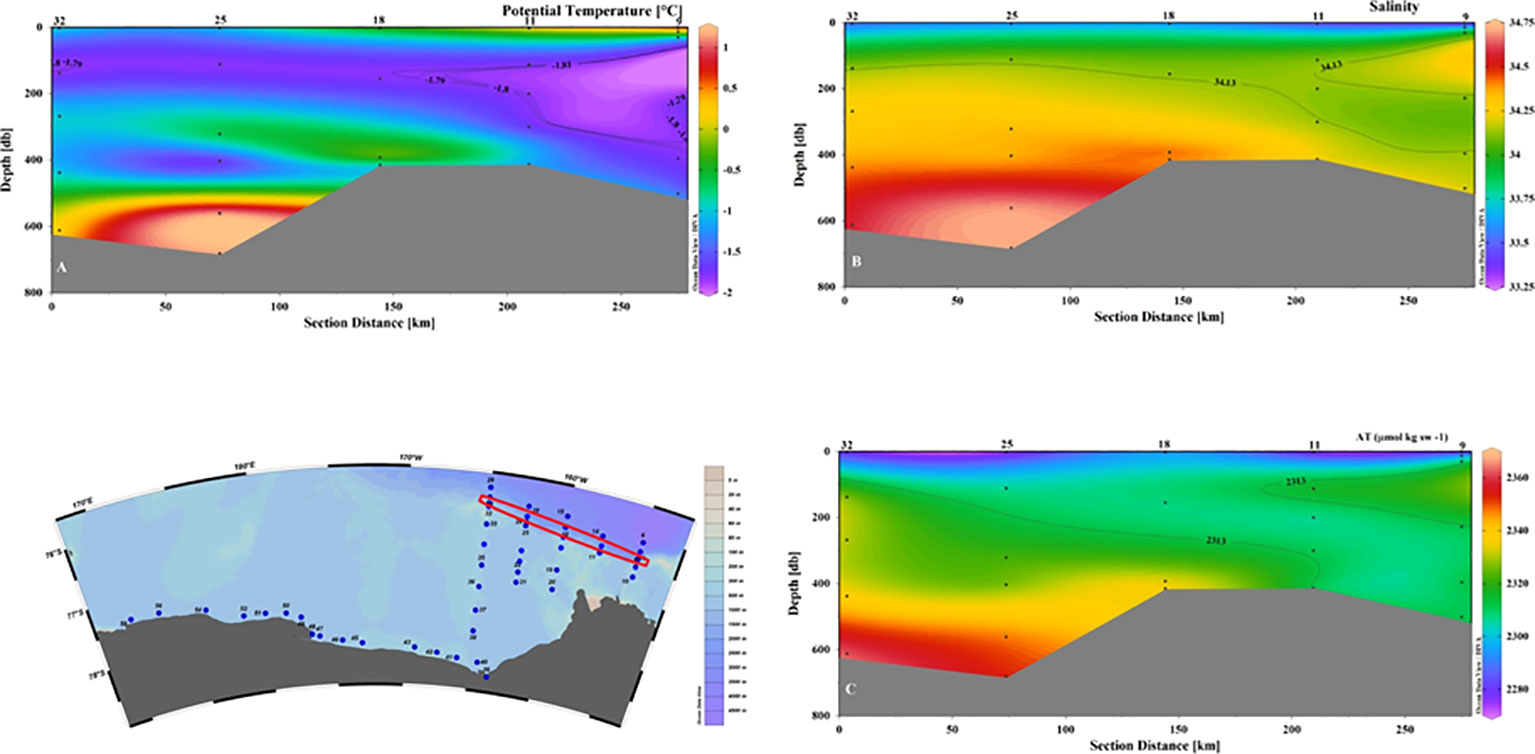
Figure 7 Vertical distribution of (A) Potential temperature (°C); (B) Salinity; (C) AT (µmol kg sw-1) for section 32-9. The values defined for ASW of θ, salinity and AT are shown by contour lines.
The contribution of the CDW could be important in determining a change in the carbonate equilibrium system of the Ross Sea since it is a more acidic water mass than the shelf waters. It has been predicted that the Southern Ocean could become under-saturated with aragonite by 2050, with a lysocline at 730 m (Orr et al., 2005; Mcneil et al., 2010). The transport of CDW on the continental shelf, although sporadic in time and space, could accelerate the ocean acidification of Ross Sea relative to these predictions.
The low pH measured in the CDW is dependent on the less recent ventilation time compared to recently formed shelf waters (Rivaro et al., 2015). Prolonged processes of remineralization of organic matter cause an increase in pCO2 and in CT as well, decreasing O2 concentration, pH, and Ω. CDW is the only water mass found in this study with ΩAr<1. The signal of CDW is very clear on the slope, traced by both θ and S values, as well as by chemical parameters (Figure 8). The core CDW data are comparable to those collected in the western Ross Sea (Rivaro et al., 2014), but they are higher than the observations by Yager et al. (2016) in the Amundsen Sea Polynya where the CDW did not exhibit the undiluted characteristics found during the ESTRO survey.
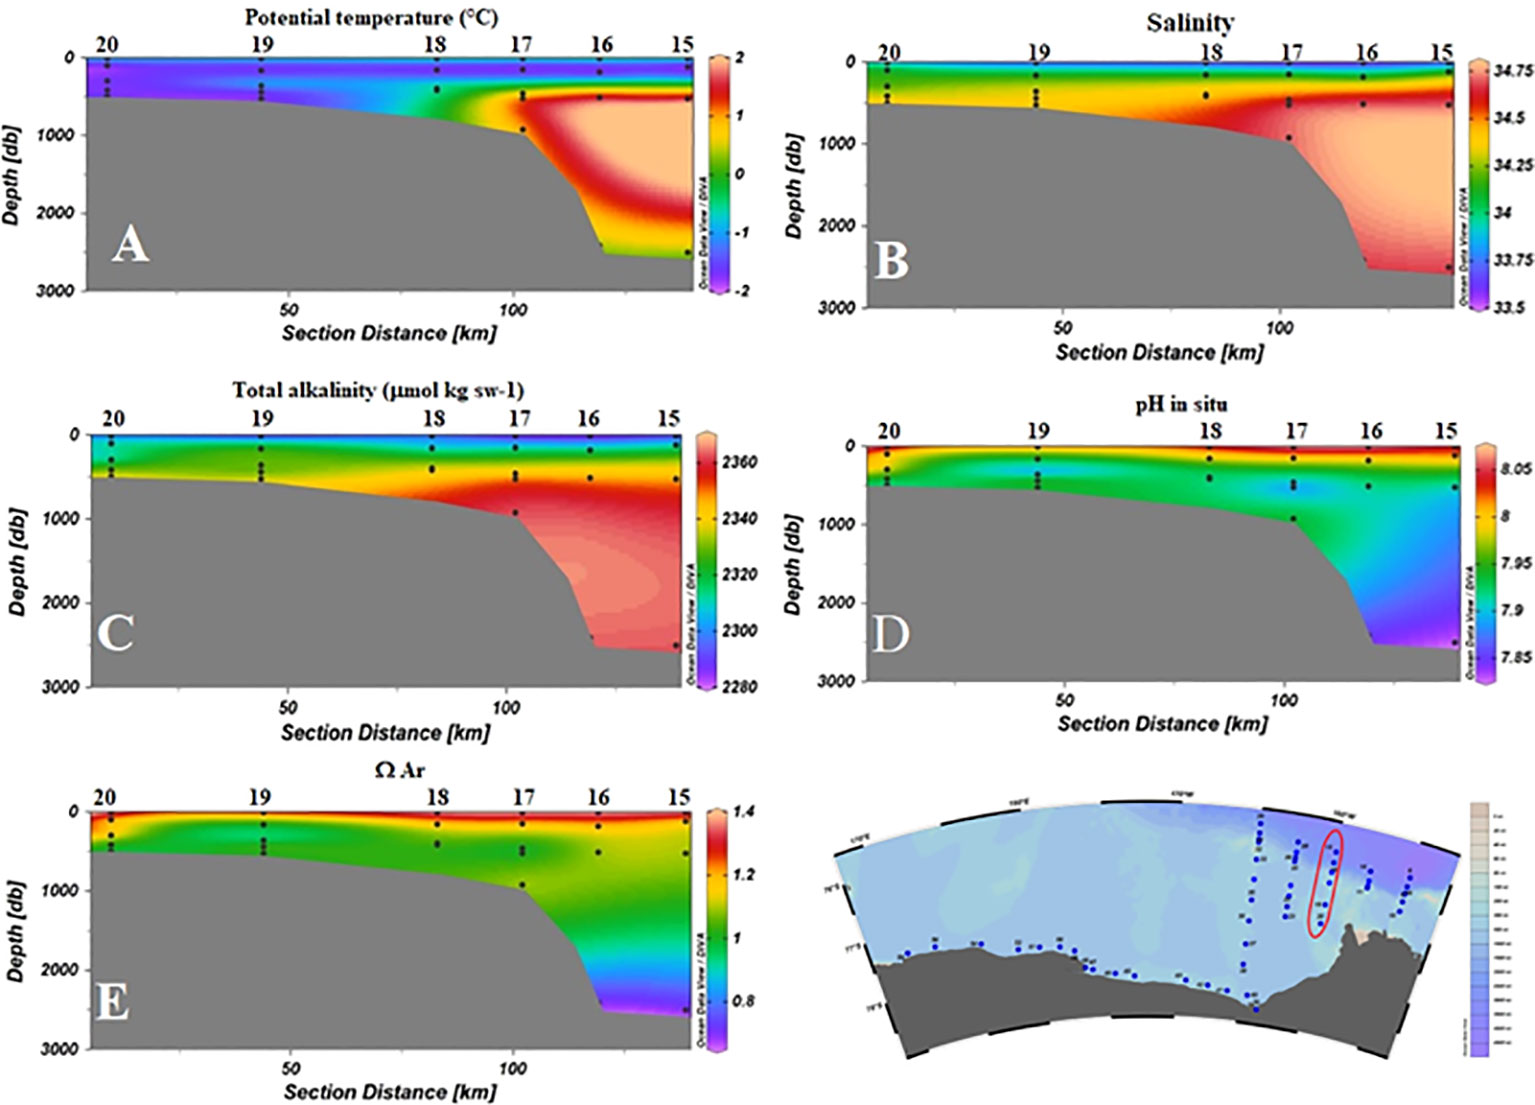
Figure 8 Distribution of physical and chemical parameters as a function of depth for S3 (stations 15–20). (A) Potential temperature (°C); (B) Salinity; (C) AT (µmol kg sw-1); (D) pH in situ; (E) ΩAr.
However, compared to what was observed in the western Ross Sea (Budillon et al., 2011; Castagno et al., 2017), the circumpolar waters remain confined on the slope, without intruding to the shelf and changing to Modified Circumpolar Deep Water (MCDW). Iron budgets constructed for the Ross Sea showed CDW accounts for most of the nutrients and of iron that supports primary production (McGillicuddy et al., 2015; Castagno et al., 2017). Other studies showed that MCDW, which is cooler and saltier than CDW, provides dissolved iron that is important for supporting phytoplankton blooms (Kustka et al., 2015) and biological CO2 drawdown in the western Ross Sea.
We can therefore assume that the non-intrusion of CDW in the shelf area reduces biological activities by not providing nutrients and micronutrients. This would also explain the low levels of chlorophyll a that we observed in the AASW. However, the non-intrusion of CDW into the shelf area would reduce the risk of accelerated acidification of intermediate waters in the eastern Ross Sea.
In contrast to the other water masses, an increasing longitudinal gradient of mean AT, pH, and ΩAr values was found for the LSSW. This could be due to local mixing phenomena, which, however, cannot be confirmed from the available data. LSSW is mainly produced in the eastern sector of the Ross Sea where the absence of polynyas does not allow for the high salinities observed in the western sector. Several mechanisms of LSSW formation have been proposed but, to date, due to the limited number of measurements available, there is no fully agreed theory (Orsi and Wiederwohl, 2009). However, it is believed, based on climatology, that the volume occupied by LSSW in the shelf area is smaller than that occupied by HSSW, and that 90% of this volume is confined to the sector investigated by the ESTRO project (Orsi and Wiederwohl, 2009).
The section sampled along RIS (Figure 9) can be considered the link between the eastern and western sectors of the southern Ross Sea. A sharp horizontal salinity gradient along RIS was inferred within the shelf waters near 175°E, which led to their classification into HSSW and LSSW.
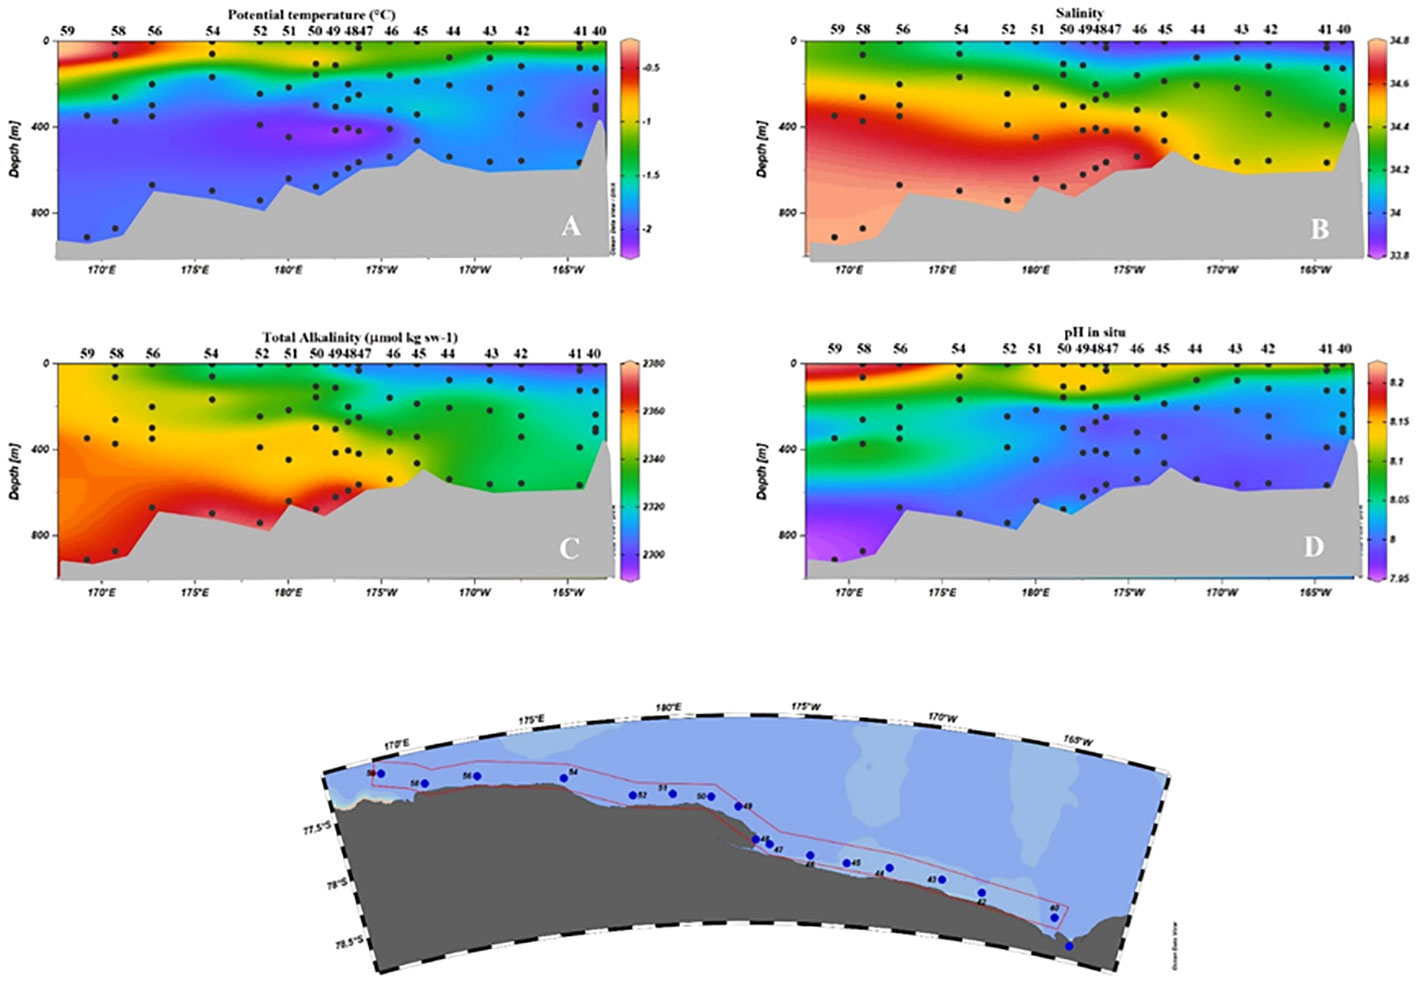
Figure 9 Vertical distribution of physical and chemical properties along the RIS. (A) Potential temperature (°C); (B) Salinity (C) AT (µmol kg sw-1); (D) pH in situ.
Also in this section, as might be expected from the positive correlation and the values attributed to the water masses, the AT proved to be a good conservative chemical tracer, appearing the same as the salinity of HSSW and LSSW. However, it proved less effective in tracing the presence of the ISW core. Smethie and Jacobs (2005) suggested that the source water that melts the ice and produces ISW is likely to be a mixture of HSSW and LSSW. The proportion of contributing water masses can vary, and there is therefore no fixed make-up that can be applied. Thus, depending on the percentage with which each end member participates in the formation of the ISW, there may be variations in the chemical signature of the ISW that the sensitivity of the AT is not able to highlight. This limitation is even greater in the case of pH, since any differences in the oxidative degradation processes of the organic substances and the ventilation times must also be considered in addition to the considerations made above.
Estimating the distribution of Cant is important to better understand the carbon cycle, also considering the effect of atmospheric CO2 uptake on OA. The chemical buffering of Cant is the quantitatively most important oceanic process acting as a carbon sink. RF is a measure of the ocean’s buffer capacity for the carbonate system in terms of pH changes also in seawater or freshwater. The higher the RF, the lower the ocean’s buffer capacity, and the faster the change of pCO2 in the ocean at a given CT change (Jiang et al., 2019).
At the surface we found RF values greater than 15 in surface waters, which suggests a low efficient Cant uptake ability. Alkalinity (i.e. the excess of bases), governs the efficiency at which this occurs and provides buffering capacity toward acidification. Thus, the low measured AT values justify the low buffer ability of the surface waters. Biological processes could contribute to the Cant sequestration in surface waters too. However, our data show that the biological role was moderate, underscoring the importance of chemical and physical drivers in carbon regulation in this region of the Ross Sea.
Different approaches have been proposed to evaluate the Cant in intermediate and deep waters (Sabine and Tanhua, 2010; Pardo et al., 2014). The choice of using the TrOCA method in our study is due to the following reasons: relative simplicity of application, good agreement of the results with those obtained with other more complex methods using, e.g., CFC measurements (Matear et al., 2003), and its application that has already been tested in the western Ross Sea (Sandrini et al., 2007).
ASW and LSSW were enriched in Cant suggesting a recent ventilation of these water masses. Given the calculated RF for AASW, the pCO2, and the mean CT (409 µatm, and 2167 μmol kg sw-1, respectively), a change in CT on the order of 46 μmol kg sw-1, between the preindustrial time and the time of sampling, was expected. Thus, our data (54 μmol kg sw-1) are slightly higher than expected, but the TrOCA method can lead to some overestimates of Cant in deep and bottom waters (Pardo et al., 2014).
Since our data are the first Cant estimates in this area of the Ross Sea, we cannot make any comparison on trends derived from data sets collected several years apart. There will be an opportunity to verify our results and to get an indication of the ventilation times of the water masses since the CFCs were sampled as part of the ESTRO project.
We have, however, compared our estimates in the HSSW and in the CDW with those collected in 2001 by the CLIMA project in the western Ross Sea (Sandrini et al., 2007). A change in CT in the order of 14 μmol kg sw-1, between 2001 and 2020, was calculated. This increase was observed in the CDW (from 6 to 21μmol kg sw-1), whereas the Cant in HSSW resulted higher than expected (65 instead of 44 μmol kg sw-1). Apart from differences associated with variations of the used stoichiometric ratios, the explanation for a high Cant value could be related to an HSSW salinity rebound. HSSW salinity decreased between 1995 and 2014 (consistent with freshening observed between 1958 and 2008) and it rebounded sharply after 2014 (Castagno et al., 2019). This shift to saltier HSSW may have caused increased ventilation and a higher Cant sequestration rate. Thus, our data hint that the production of HSSW could be a more efficient mechanism for the transfer of anthropogenic CO2 from the atmosphere to the deep ocean than in the past decades.
Our measurements represent the first detailed contribution on a large spatial scale of carbonate chemistry in the eastern sector of the Ross Sea.
AT resulted in the carbonate system parameter that mixes conservatively and was well-correlated with salinity in surface waters. AT distribution traced a freshwater mass coming from West Antarctica near Cape Colbeck, which moved westward along the RIS edge becoming more saline and with a higher AT.
In contrast to AT, the other parameters of the carbonate system revealed a more varying distribution associated with sea ice melting and primary production, organic matter respiration, and the formation or dissolution of calcium carbonate. Nevertheless, their distribution appeared more largely controlled by physical properties together with the circulation pattern than by biological activities, underlining the difference in factors affecting the surface variability in the eastern and western Ross Sea.
AT and pH resulted in conservative chemical properties below the surface waters, allowing the chemical tracing of the input of the Amundsen Sea Water and suggesting a limited effect of mixing between water masses. The study of the mixing evolution processes is mandatory to estimate also the volume reaching the Ross Sea shelf area. Moreover, AT and pH displayed an increasing longitudinal gradient in the LSSW, which needs further investigation to be fully understood.
Both physical and chemical data confirmed that CDW remains confined off the shelf, thus reducing the risk of accelerated acidification in the eastern Ross Sea, but at the same time not supplying the shelf water with nutrients and trace elements.
Shelf waters in the eastern Ross Sea were enriched in Cant, which resulted lower than the estimated value for HSSW produced in western Ross sea. The absence of polynya in the eastern Ross Sea may reduce the ability of this sector to transfer Cant from the surface to the deep waters compared to the western one. More extensive observations are needed to study the CO2 penetration and the air–sea CO2 exchange, considering that a change in hydrological conditions driven by climate variability could affect the Cant invasion throughout the water column.
The raw data supporting the conclusions of this article will be made available by the authors, without undue reservation.
EZ, PF, and PR designed the study. PR, DV, PC, and PF carried out fieldwork. DV, PR, PC, PF, EZ, and CI contributed to the laboratory measurements, data analysis, and interpreted the data. DV performed the statistical analysis. PR and DV wrote the manuscript with input and approval from all co-authors. All authors contributed to the article and approved the submitted version.
This study was funded by the Italian National Program for Antarctic Research, in the framework of the Project ESTRO (PNRA18_00258). Pasquale Castagno was supported by the Italian National Program for Antarctic Research (PNRA), grant number PNRA18_00256.
We express our gratitude to the Italian Antarctic National Program (PNRA) and the scientific personnel and crew of the research vessel Laura Bassi for logistical support. We thank Federica Maurantonio, Matilde Mataloni, and Erica Ceccardi for chemical analyses. The comments and the suggestions of the two reviewers are greatly appreciated, which improved this paper.
The authors declare that the research was conducted in the absence of any commercial or financial relationships that could be construed as a potential conflict of interest.
All claims expressed in this article are solely those of the authors and do not necessarily represent those of their affiliated organizations, or those of the publisher, the editors and the reviewers. Any product that may be evaluated in this article, or claim that may be made by its manufacturer, is not guaranteed or endorsed by the publisher.
Arrigo K. R., Robinson D. H., Worthen D. L., Dunbar R. B., DiTullio G. R., VanWoert M., et al. (1999). Phytoplankton community structure and the drawdown of nutrients and CO2 in the southern ocean. Science 283, 365–367. doi: 10.1126/science.283.5400.365
Arrigo K. R., van Dijken G. L. (2004). Annual changes in sea-ice, chlorophyll a, and primary production in the Ross Sea, Antarctica. Deep. Sea. Res. II. 51, 117–138. doi: 10.1016/j.dsr2.2003.04.003
Arrigo K. R., van Dijken G., Long M. (2008). Coastal southern ocean: a strong anthropogenic CO2 sink. Geophys. Res. Lett. 35, 1–6. doi: 10.1029/2008GL035624
SCOR Working Group, 51 (1988). The acquisition, calibration and analysis of CTD data. UNESCO Tech. Pap. Mar. Sci. 54, 102.
Bergamasco A., Defendi V., Zambianchi E., Spezie G. (2002). Evidence of dense water overflow on the Ross Sea shelf - break. Antarct. Sci. 14, 271–277. doi: 10.1017/S0954102002000068
Bolinesi F., Saggiomo M., Ardini F., Castagno P., Cordone A., Fusco G., et al. (2020). Spatial-related community structure and dynamics in phytoplankton of the Ross Sea, Antarctica. Front. Mar. Sci. 7, 1–20. doi: 10.3389/fmars.2020.574963
Bowen M. M., Fernandez D., Forcen-Vazquez A., Gordon A. L., Huber B., Castagno P., et al. (2021). The role of tides in bottom water export from the western Ross Sea. Sci. Rep. 11, 2246. doi: 10.1038/s41598-021-81793-5
Budillon G., Castagno P., Aliani S., Spezie G., Padman L. (2011). Thermohaline variability and Antarctic bottom water formation at the Ross Sea shelf break. Deep. Sea. Res. Part I. Oceanogr. Res. Pap. 58, 1002–1018. doi: 10.1016/j.dsr.2011.07.002
Caldeira K., Duffy P. B. (2000). The role of the southern ocean in uptake and storage of anthropogenic carbon dioxide. Science 287, 620–622. doi: 10.1126/science.287.5453.620
Castagno P., Falco P., Dinniman M. S., Spezie G., Budillon G. (2017). Temporal variability of the circumpolar deep water in flow onto the Ross Sea continental shelf. J. Mar. Syst. 166, 37–49. doi: 10.1016/j.jmarsys.2016.05.006
Castagno P., Rintoul S. R., Capozzi V., Ditullio G. R., Spezie G., Budillon G., et al. (2019). Rebound of shelf water salinity in the Ross Sea. Nat. Commun. 10, 1–6. doi: 10.1038/s41467-019-13083-8
Chierici M., Fransson A. (2009). Calcium carbonate saturation in the surface water of the Arctic ocean: Undersaturation in freshwater influenced shelves. Biogeosciences 6, 2421–2432. doi: 10.5194/bg-6-2421-2009
Dejong H. B., Dunbar R. B. (2017). Air-Sea CO2 exchange in the Ross Sea, Antarctica. J. Geophys. Res. Ocean. 122, 8167–8181. doi: 10.1002/2017JC012853
Dejong H. B., Dunbar R. B., Mucciarone D., Koweek D. A. (2015). Carbonate saturation state of surface waters in the Ross Sea and southern ocean: Controls and implications for the onset of aragonite undersaturation. Biogeosciences 12, 6881–6896. doi: 10.5194/bg-12-6881-2015
Dickson A. G., Sabine C. L., Christian J. R. (2007). Guide to best practices for ocean CO2 measurements (Sidney, BC, Canada: North Pacific Marine Science Organization).
Dini M., Stenni B. (2000). “Oxygen isotope characterization of Terra Nova bay seawater,” in Ross Sea Ecology. Eds. Faranda F. M., Guglielmo L., Ianora A. (Berlin/Heidelberg, Germany: Springer), 27–37.
Dunbar R. B., Arrigo K. R., Lutz M., Ditullio G. R., Leventer A. R., Lizotte M. P., et al. (2003). “Non-redfield production and export of marine organic matter: A recurrent part of the annual cycle in the Ross Sea, Antarctica,” in Biogeochemistry of the Ross sea. Antarctic research series, vol. 78 . Eds. Di Tullio G. R., Dunbar R. B. (Washington, DC, USA: American Geophysical Union), 179–196.
Feely R. A., Sabine C. L., Lee K., Berelson W., Kleypas J., Fabry V. J., et al. (2004). Impact of anthropogenic CO2 on the CaCO3 system in the oceans. Science 305, 362–367. doi: 10.1126/science.1097329
Fofonoff J., Millard R. (1983). Algorithms for computation of fundamental properties of seawater. UNESCO. Tech. Pap. Mar. Sci. 44, 53. doi: doi.org/10.25607/OBP-1450
Guo G., Gao L., Shi J. (2021). Modulation of dense shelf water salinity variability in the western Ross Sea associated with the amundsen Sea low. Environ. Res. Lett. 16, 014004. doi: 10.1088/1748-9326/abc995
Iudicone D., Rodgers K. B., Stendardo I., Aumont O., Madec G., Bopp L., et al. (2011). Water masses as a unifying framework for understanding the southern ocean carbon cycle. Biogeosciences 8, 1031–1052. doi: 10.5194/bg-8-1031-2011
Jackett D. R., McDougall T. J. (1997). A neutral density variable for the world’s oceans. J. Phys. Oceanogr. 27, 237–263. doi: 10.1175/1520-0485(1997)027<0237:ANDVFT>2.0.CO;2
Jacobs S. S., Amos A. F., Bruchhausen P. M. (1970). Ross Sea oceanography and antarctic bottom water formation. Deep. Sea. Res. Oceanogr. Abstr. 17, 935–962. doi: 10.1016/0011-7471(70)90046-X
Jacobs S. S., Fairbanks R. G., Horibe Y. (1985). “Origin and evolution of water masses near the Antarctic continental margin: Evidence from H218O/H216O ratios in sea water,” in Antarctic Research series, vol. 43 . Ed. Jacobs S. S. (Washington, DC: American Geophysical Union), 59–85.
Jacobs S. S., Giulivi C. F., Dutrieux P. (2022). Persistent Ross Sea freshening from imbalance West Antarctic ice shelf melting. J. Geophysical. Research.: Oceans. 127, e2021JC017808. doi: 10.1029/2021JC017808
Jiang L., Carter B. R., Feely R. A., Lauvset S. K., Olsen A. (2019). Surface ocean pH and buffer capacity: Past, present and future. Sci. Rep. 9, 1–11. doi: 10.1038/s41598-019-55039-4
Johnson G. C. (2008). Quantifying Antarctic bottom water and north Atlantic deep water volumes. J. Geophys. Res. 113, 1–13. doi: 10.1029/2007JC004477
Jones E., Bakker D. C. E., Venables H. J., Whitehouse M. J., Korb R. E., Watson A. J. (2010). Rapid changes in surface water carbonate chemistry during Antarctic sea ice melt. Tellus 62B, 621–635. doi: 10.1111/j.1600-0889.2010.00496.x
Kustka A. B., Kohut J. T., White A. E., Lam P. J., Milligan A. J., Dinniman M. S., et al. (2015). The roles of MCDW and deep water iron supply in sustaining a recurrent phytoplankton bloom on central pennell bank (Ross Sea). Deep-Sea. Res. I. 105, 171–185. doi: 10.1016/j.dsr.2015.08.012
Leardi R., Melzi C., Polotti G. (2017)Chemometric agile tool (CAT). Available at: http://gruppochemiometria.it/index.php/software.
Lee K., Tong L. T., Millero F. J., Sabine C. L., Dickson A. G., Goyet C., et al. (2006). Global relationships of total alkalinity with salinity and temperature in surface waters of the world’s oceans. Geophysical. Res. Lett. 33, L19605. doi: 10.1029/2006GL027207
Mangoni O., Saggiomo V., Bolinesi F., Margiotta F., Budillon G., Cotroneo Y., et al. (2017). Phytoplankton blooms during austral summer in the Ross Sea, Antarctica : Driving factors and trophic implications. PloS One 12 (4), 1–23. doi: 10.1371/journal.pone.0176033
Manno C., Sandrini S., Tositti L., Accornero A. (2007). First stages of degradation of Limacina helicina shells observed above the aragonite chemical lysocline in Terra Nova bay (Antarctica). J. Mar. Syst. 68, 91–102. doi: 10.1016/j.jmarsys.2006.11.002
Marion G. M. (2001). Carbonate mineral solubility at low temperatures in the Na-K-Mg-Ca-H-Cl-SO4-OH-HCO3-CO3-CO2-H2O system. Geochim. Cosmochim. Acta 65, 1883–1896. doi: 10.1016/S0016-7037(00)00588-3
Matear R. J., Wong C. S., Xie L. (2003). Can CFCs be used to determine anthropogenic CO2? Global Biogeochem. Cycles. 17 (1), 1013. doi: 10.1029/2001GB001415
Mattsdotter Björk M. M., Fransson A., Torstensson A., Chierici M. (2014). Ocean acidification state in western Antarctic surface waters: Controls and interannual variability. Biogeosciences 11, 57–73. doi: 10.5194/bg-11-57-2014
McGillicuddy D. J. Jr., Sedwick P. N., Dinniman M. S., Arrigo K. R., Bibby T. S., Greenan B. J. W., et al. (2015). Iron supply and demand in an Antarctic shelf ecosystem. Geophys. Res. Lett. 42 (19), 8088–8097. doi: 10.1002/2015GL065727
Mcneil B. I., Tagliabue A., Sweeney C. (2010). A multi-decadal delay in the onset of corrosive ‘acidified’ waters in the Ross Sea of Antarctica due to strong air sea CO2 disequilibrium. Geophys. Res. Lett. 37, 1–5. doi: 10.1029/2010GL044597
Millero F. (2007). The marine inorganic carbon cycle. Chem. Rev. 107, 308–341. doi: 10.1021/cr0503557
Millero F. J., Woosley R., Ditrolio B., Waters J. (2005). Effect of ocean acidification on the speciation of metals in seawater. Oceanography 22, 72–85. doi: 10.5670/oceanog.2009.98
Orr J. C., Fabry V. J., Aumont O., Bopp L., Doney S. C., Feely R. A., et al. (2005). Anthropogenic ocean acidification over the twenty-first century and its impact on calcifying organisms. Nature 437, 681–686. doi: 10.1038/nature04095
Orsi A. H., Johnson G. C., Bullister J. L. (1999). Circulation, mixing, and production of Antarctic bottom water. Prog. Oceanogr. 43, 55–109. doi: 10.1016/S0079-6611(99)00004-X
Orsi A., Wiederwohl C. L. (2009). A recount of Ross Sea waters. Deep. Res. Part II. 56, 778–795. doi: 10.1016/j.dsr2.2008.10.033
Papadimitriou S., Thomas D. N., Kennedy H., Haas C., Kuosa F., Krell A., et al. (2007). Biogeochemical composition of natural sea ice brines from the weddell Sea during early austral summer. Limnol. Oceanogr. 52, 1809–1823. doi: 10.4319/lo.2007.52.5.1809
Pardo P. C., Pérez F. F., Khatiwala S., Ríos A. F. (2014). Anthropogenic CO2 estimates in the southern ocean: Storage partitioning in the different water masses. Prog. Oceanogr. 120, 230–242. doi: 10/f5r3v3 doi: 10.1016/j.pocean.2013.09.005
Pierrot D., Lewis E., Wallace D. W. R. (2006). MS excel program developed for CO2 system calculations, ORNL/CDIAC-105 (Oak Ridge, TN, USA: US Department of Energy).
Purkey S. G., Johnson G. C. (2012). Global contraction of antarctic bottom water between the 1980s and 2000s. J. Clim. 25, 5830–5844. doi: 10.1175/JCLI-D-11-00612.1
Purkey S. G., Johnson G. C. (2013). Antarctic Bottom water warming and freshening: Contributions to sea level rise, ocean freshwater budgets, and global heat gain. J. Clim. 26, 6105–6122. doi: 10.1175/JCLI-D-12-00834.1
Randall-Goodwin E., Meredith M. P., Jenkins A., Yager P. L., Sherrell R. M., Abrahamsen E. P., et al. (2015). Freshwater distributions and water mass structure in the amundsen Sea polynya region, Antarctica. Elem. Sci. Anthr. 3, 1–22. doi: 10.12952/journal.elementa.000065
Rignot E., Jacobs S., Mouginot J., Scheuchl B. (2013). Ice-shelf melting around Antarctica. Science 341, 266–270. doi: 10.1126/science.1235798
Rivaro P., Ianni C., Langone L., Ori C., Aulicino G., Cotroneo Y., et al. (2017). Physical and biological forcing of mesoscale variability in the carbonate system of the Ross Sea (Antarctica) during summer 2014. J. Mar. Syst. 166, 144–158. doi: 10.1016/j.jmarsys.2015.11.002
Rivaro P., Ianni C., Magi E., Massolo S., Budillon G., Smethie W. M. Jr. (2015). Distribution and ventilation of water masses in the western Ross Sea inferred from CFC measurements. Deep-Sea. Res. I. 97, 19–28. doi: 10.1016/j.dsr.2014.11.009
Rivaro P., Ianni C., Raimondi L., Manno C., Sandrini S., Castagno P., et al. (2019). Analysis of physical and biogeochemical control mechanisms on summertime surface carbonate system variability in the Western Ross Sea (Antarctica) using in situ and satellite data. Remote Sens. 11, 1–17. doi: 10.3390/rs11030238
Rivaro P., Massolo S., Bergamasco A., Castagno P., Budillon G. (2010a). Deep-Sea research I chemical evidence of the changes of the Antarctic bottom water ventilation in the western Ross Sea between 1997 and 2003. Deep. Res. Part I. 57, 639–652.
Rivaro P., Messa R., Ianni C., Magi E., Budillon G. (2014). Distribution of total alkalinity and pH in the Ross Sea (Antarctica) waters during austral summer 2008. Polar. Res. 1, 1–15. doi: 10.3402/polar.v33.20403
Rivaro P., Messa R., Massolo S., Frache R. (2010b). Distributions of carbonate properties along the water column in the Mediterranean Sea: Spatial and temporal variations. Mar. Chem. 121, 236–245. doi: 10.1016/j.marchem.2010.05.003
Sabine C. L., Feely R. A., Gruber N., Key R. M., Lee K., Bullister J. L., et al. (2004). The oceanic sink for anthropogenic CO2. Science 305, 367–372. doi: 10.1126/science.1097403
Sabine C. L., Tanhua T. (2010). Estimation of anthropogenic CO2 inventories in the ocean. Annu. Rev. Mar. Sci. 2, 175–198. doi: 10.1146/annurev-marine-120308-080947
Sandrini S., Rivaro P., Massolo S., Touratier F., Tositti L., Goyet C. (2007). Anthropogenic carbon distribution in the Ross Sea, Antarctica. Antarct. Sci. 19, 395–407. doi: 10.1017/S0954102007000405
Sedwick P. N., Marsay C. M., Sohst M., Aguilar-Islas M., Lohan M. C., Long M. C., et al. (2011). Early season depletion of dissolved iron in the Ross Sea polynya: Implications for iron dynamics on the Antarctic continental shelf. J. Geophys. Res. 116, C12019. doi: 10.1029/2010JC006553
Shepherd A., Ivins E., Rignot E., Smith B., van den Broeke M., Velicogna I., et al. (2018). Mass balance of the Antarctic ice sheet from 1992 to 2017. Nature 558, 219–222. doi: 10.1038/s41586-018-0179-y
Silvano A., Foppert A., Rintoul S. R., Holland P. R., Tamura T., Kimura N., et al. (2020). Recent recovery of Antarctic bottom water formation in the Ross Sea driven by climate anomalies. Nat. Geosci. 13, 780–786. doi: 10.1038/s41561-020-00655-3
Smethie W. M., Jacobs S. S. (2005). Circulation and melting under the Ross ice shelf: Estimates from evolving CFC, salinity and temperature fields in the RossSea. Deep. Sea. Res. 52, 959–978. doi: 10.1016/j.dsr.2004.11.016
Smith W. O., Ainley D. G., Arrigo K. R., Dinniman M. S. (2014). The oceanography and ecology of the Ross Sea. Ann. Rev. Mar. Sci. 6, 469–487. doi: 10.1146/annurev-marine-010213-135114
Smith W. O., Dinniman M. S., Tozzi S., DiTullio G. R., Mangoni O., Modigh M., et al. (2010). Phytoplankton photosynthetic pigments in the Ross Sea: Patterns and relationships among functional groups. J. Mar. Syst. 82, 177–185. doi: 10.1016/j.jmarsys.2010.04.014
Steinacher M., Joos F., Frolicher T. L., Plattner G.-K., Doney S. C. (2009). Imminent ocean acidification in the Arctic projected with the NCAR global coupled carbon cycle-climate model. Biogeosciences 6, 515–533. doi: 10.5194/bg-6-515-2009
Touratier F., Azouzi L., Goyet C. (2007). CFC-11, Δ14C and 3H tracers as a means to assess anthropogenic CO2 concentrations in the ocean. Tellus 59B, 318–325. doi: 10.1111/j.1600-0889.2007.00247.x
Touratier F., Goyet C. (2004a). Definition, properties and Atlantic ocean distribution of the new tracer TrOCA. J. Mar. Syst. 46, 169–179. doi: 10.1016/j.jmarsys.2003.11.016
Touratier F., Goyet C. (2004b). Applying the new TrOCA approach to assess the distribution of anthropogenic CO2 in the Atlantic ocean. J. Mar. Syst. 46, 181–197. doi: 10.1016/j.jmarsys.2003.11.020
Tremblay J. E., Smith W. O. J. (2007). “Primary production and nutrient dynamics in polynyas,” in Polynyas: Windows to the world. elsevier oceanography series, vol. 74 . Eds. Smith Jr. W. O., Barber D. G. (Amsterdam, The Netherlands: Elsevier), 239–269.
Wanninkhof R. (2014). Relationship between wind speed and gas exchange over the ocean revisited. Limnol. Oceanogr. Methods 12, 351–362. doi: 10.4319/lom.2014.12.351
Whitworth T. III, Orsi A. H. (2006). Antarctic Bottom water production and export by tides in the Ross Sea Antarctic bottom water production and export by tides in the Ross Sea. Geophys. Res. Lett. 33, 1–4. doi: 10.1029/2006GL026357
Yager P. L., Sherrell R. M., Stammerjohn S. E., Alderkamp A., Schofield O., Abrahamsen E. P., et al. (2012). ASPIRE, the amundsen Sea polynya international research expedition. Oceanography 25, 41–53. doi: 10.5670/oceanog.2012.73
Yager P. L., Sherrell R. M., Stammerjohn S. E., Ducklow H. W., Schofield O., Ingall E. D., et al. (2016). A carbon budget for the amundsen Sea polynya, Antarctica: Estimating net community production and export in a highly productive polar ecosystem. Elementa.: Sci. Anthropocene. 4, 140. doi: 10.12952/journal.elementa.000140
Keywords: carbonate system, Ross Sea, Amundsen Sea Water, chemical tracers, anthropogenic carbon, carbonate saturation grade
Citation: Rivaro P, Vivado D, Castagno P, Falco P, Zambianchi E and Ianni C (2022) Carbonate system data tracing freshwater inflow into the Ross Sea through the eastern gate and along the Ross Ice Shelf (Antarctica). Front. Mar. Sci. 9:957060. doi: 10.3389/fmars.2022.957060
Received: 30 May 2022; Accepted: 14 November 2022;
Published: 08 December 2022.
Edited by:
Jadran Faganeli, National Institute of Biology, SloveniaReviewed by:
Daiki Nomura, Hokkaido University, JapanCopyright © 2022 Rivaro, Vivado, Castagno, Falco, Zambianchi and Ianni. This is an open-access article distributed under the terms of the Creative Commons Attribution License (CC BY). The use, distribution or reproduction in other forums is permitted, provided the original author(s) and the copyright owner(s) are credited and that the original publication in this journal is cited, in accordance with accepted academic practice. No use, distribution or reproduction is permitted which does not comply with these terms.
*Correspondence: Paola Rivaro, cGFvbGEucml2YXJvQHVuaWdlLml0
Disclaimer: All claims expressed in this article are solely those of the authors and do not necessarily represent those of their affiliated organizations, or those of the publisher, the editors and the reviewers. Any product that may be evaluated in this article or claim that may be made by its manufacturer is not guaranteed or endorsed by the publisher.
Research integrity at Frontiers
Learn more about the work of our research integrity team to safeguard the quality of each article we publish.