 Clare L. W. Steele
94% of researchers rate our articles as excellent or good
Learn more about the work of our research integrity team to safeguard the quality of each article we publish.
Find out more
ORIGINAL RESEARCH article
Front. Mar. Sci. , 28 July 2022
Sec. Marine Pollution
Volume 9 - 2022 | https://doi.org/10.3389/fmars.2022.905969
This article is part of the Research Topic Plastics in Aquatic Systems: from Transport and Fate to Impacts and Management Perspectives View all 12 articles
Accumulation of anthropogenic marine debris on shorelines is an issue of global concern, even impacting areas that are remote, uninhabited, or have protected area status. On islands in Southern California, USA, within the boundaries of a National Park and National Marine Sanctuary, we collected macro-debris on beaches and assessed micro-debris in beach sediment seasonally between 2016-2020. Macro-debris (>5mm) was collected from seven beaches on two California Channel Islands and two sites on the mainland. We assessed both the number of items collected and total mass of debris. Composition of macro-debris items was dominated by plastics, particularly fragmented hard and foamed plastics and food packaging. A substantial quantity of lost or discarded fishing gear was collected, with the most fishery-related debris found at sites with historically highest spiny lobster fishing effort. The initial density of debris items ranged from 0.01-0.13 items m-2 and the initial density of debris mass ranged from 0.01-0.02 kg m-2. Mean accumulation rates of debris were strongly site-dependent and ranged from 0.03-0.34 items m-2 yr-1 and 0.01-0.05 kg m-2 yr-1, and tended to be highest in the fall and winter months. Anthropogenic micro-debris (<5mm) was found in beach sediment at all sites. Micro-debris had no statistically significant relationship with accumulation rates of total macro-debris items, or plastic macro-debris items. There were, however, statistically significant relationships between accumulation rates of total macro-debris mass and plastic macro-debris mass. We compared the rate of accumulation of fishing debris items and mass during the lobster season (October-March) for the years 2017 to 2020. The accumulation of fishery-related debris differed significantly among sites, with apparent declines over time, likely reflecting declining effort in the fishery and trap-limit regulations implemented in the 2017-2018 season. Our assessment of marine debris accumulation on California Channel Island beaches has provided detailed information on the types of debris and patterns of accumulation. Unfortunately, remoteness from direct human impact and protected-area status does not protect these habitats against the onslaught of marine litter. Assessments of marine debris are critical to identify sources, to inform policy and to support efforts to reduce the impact of marine litter on vital coastal ecosystems.
Anthropogenic marine debris (AMD) in the ocean, and on shorelines, is a developing issue of global concern (Derraik, 2002; Barnes et al., 2009; Ribic et al., 2010; Galgani et al., 2015; Madricardo et al., 2020), even impacting areas that are remote, uninhabited, or have protected area status (Lavers and Bond, 2017; Whitmire et al., 2017; Uhrin et al., 2020). Marine debris consists of any persistent, manufactured or processed solid material discarded, disposed of, or abandoned in the marine and coastal environment (Marine Debris Research, Prevention, and Reduction Act, 2009; UNEP, 2009). Plastic litter is ubiquitous, entering the ocean as macro- (>5mm) and micro-debris (<5mm) (Serra-Gonçalves et al., 2019; Madricardo et al., 2020), and frequently comprises the majority of AMD found on shorelines (Galgani et al., 2015; Agamuthu et al., 2019). Plastics are of particular concern, due to their persistence in the environment and their potential to degrade into microplastic pollution (Andrady, 2011; Gall and Thompson, 2015; Andrady et al., 2022). As plastics degrade into smaller fragments, via photo-degradation and physical abrasion, they become increasingly bioavailable, via ingestion, to a wide range of marine organisms from megafauna to zooplankton (Barnes et al., 2009; Besseling et al., 2015; Botterell et al., 2019).
Commercial fishing activity contributes a significant quantity of gear-related debris, including plastics, such as positively buoyant lines and buoys (polyethylene (PE), polypropylene (PP), expanded polystyrene (PS), polyurethane (PU) and negatively buoyant nets (polyamide (PA), pots and traps (Andrady, 2022). Fishery gear losses can be significant, with estimated percentages of line loss of 29%, average proportion of net loss of 5.7%, and loss percentages for pots and traps of 19% (Richardson et al., 2019). AMD can impact the economic success of fisheries and tourism, and the biodiversity and ecological function of marine ecosystems, (Chen and Liu, 2013; Gall and Thompson, 2015; Lucrezi et al., 2016). There are economic impacts of gear loss as fishers bear the cost of replacing lost traps and harvestable organisms are lost to derelict fishing gear (Arthur et al., 2014). Abandoned, lost or otherwise discarded fishing gear (ALDFG) is a component of AMD that can particularly impact marine wildlife via ‘ghostfishing’, entanglement, or ingestion (Macfadyen et al., 2009; Ryan, 2018; Richardson et al., 2019). The accumulation of marine debris along shorelines can negatively impact marine wildlife and the biodiversity of coastal ecosystems (Uneputty and Evans, 1997; Gall and Thompson, 2015; Kühn et al., 2015), and can increase the threat of entanglement for coastal-nesting seabirds and other organisms (Votier et al., 2011; Lavers et al., 2013). This is especially important in the context of remote islands that support significant endemism and species richness (Kier et al., 2009), where large volumes of debris are known to accumulate, and where mitigation, prevention, and debris removal efforts are expensive and challenging (Edyvane et al., 2004; Eriksson et al., 2013; Lavers and Bond, 2017).
Patterns of transport and the fate of AMD can be difficult to determine because of complex topographical and oceanographic forces acting upon debris (Barnes et al., 2009; Eriksson et al., 2013), the physical characteristics of individual items, e.g., density, surface area, and size (Schwarz et al., 2019), and the degradation, bio-fouling, and changes in buoyancy of the items over time (Kaiser et al., 2017; Madricardo et al., 2020). Larger fishery-related debris, e.g. traps and pots, may be moved along the benthos, particularly during extreme weather events, and may be ensnared by rugose benthic structure (such as coral reefs in the Florida spiny lobster fishery) (Uhrin et al., 2014; Renchen et al., 2021). The highest densities, however, of accumulated AMD are frequently observed on shorelines closest to the main sources (Ribic et al., 2010; Ribic et al., 2012; Thiel et al., 2013). Benthic sediments and sedimentary shores are often considered to be sinks of AMD, as items may sink or become trapped in the sand after stranding (Kusui and Noda, 2003; Thompson et al., 2004; UNEP, 2005; Woodall et al., 2014).
In coastal Southern California (Figure 1), marine macro- and micro-debris is pervasive in coastal watersheds and epi-benthic environments throughout the Southern California Bight (SCB) (McLaughlin et al., 2022), as well as on the more remote shorelines of the California Channel Islands, (Cole, 1998, Whitmire et al., 2017, Miller et al., 2018). In this region there are various harbors, storm drains, watersheds, vessels, dense urban populations, commercial and recreational fisheries, and international shipping lanes which all can contribute to marine debris entering the SCB and potentially depositing on island shorelines (Moore et al., 2011; Ribic et al., 2012; McLaughlin et al., 2022). The Santa Barbara Channel, at the northern end of the SCB, is bounded to the north by the southern central California coast and to the south by four of the California Channel Islands (San Miguel, Santa Rosa, Santa Cruz and Anacapa) (Harms and Winant, 1998). Winds influencing the region are predominantly from the northwest for most of the year (Breaker et al., 2003). The SCB is oceanographically complex, with currents influenced by seasonally variable patterns in the equatorward California Current from the north Pacific, modest poleward flow on the continental shelf, and recirculation patterns including the counterclockwise Southern California eddy and a counterclockwise cyclonic circulation of variable intensity in the western half of the Santa Barbara Channel (Harms and Winant, 1998; Bray et al., 1999; Chen and Wang 2000).
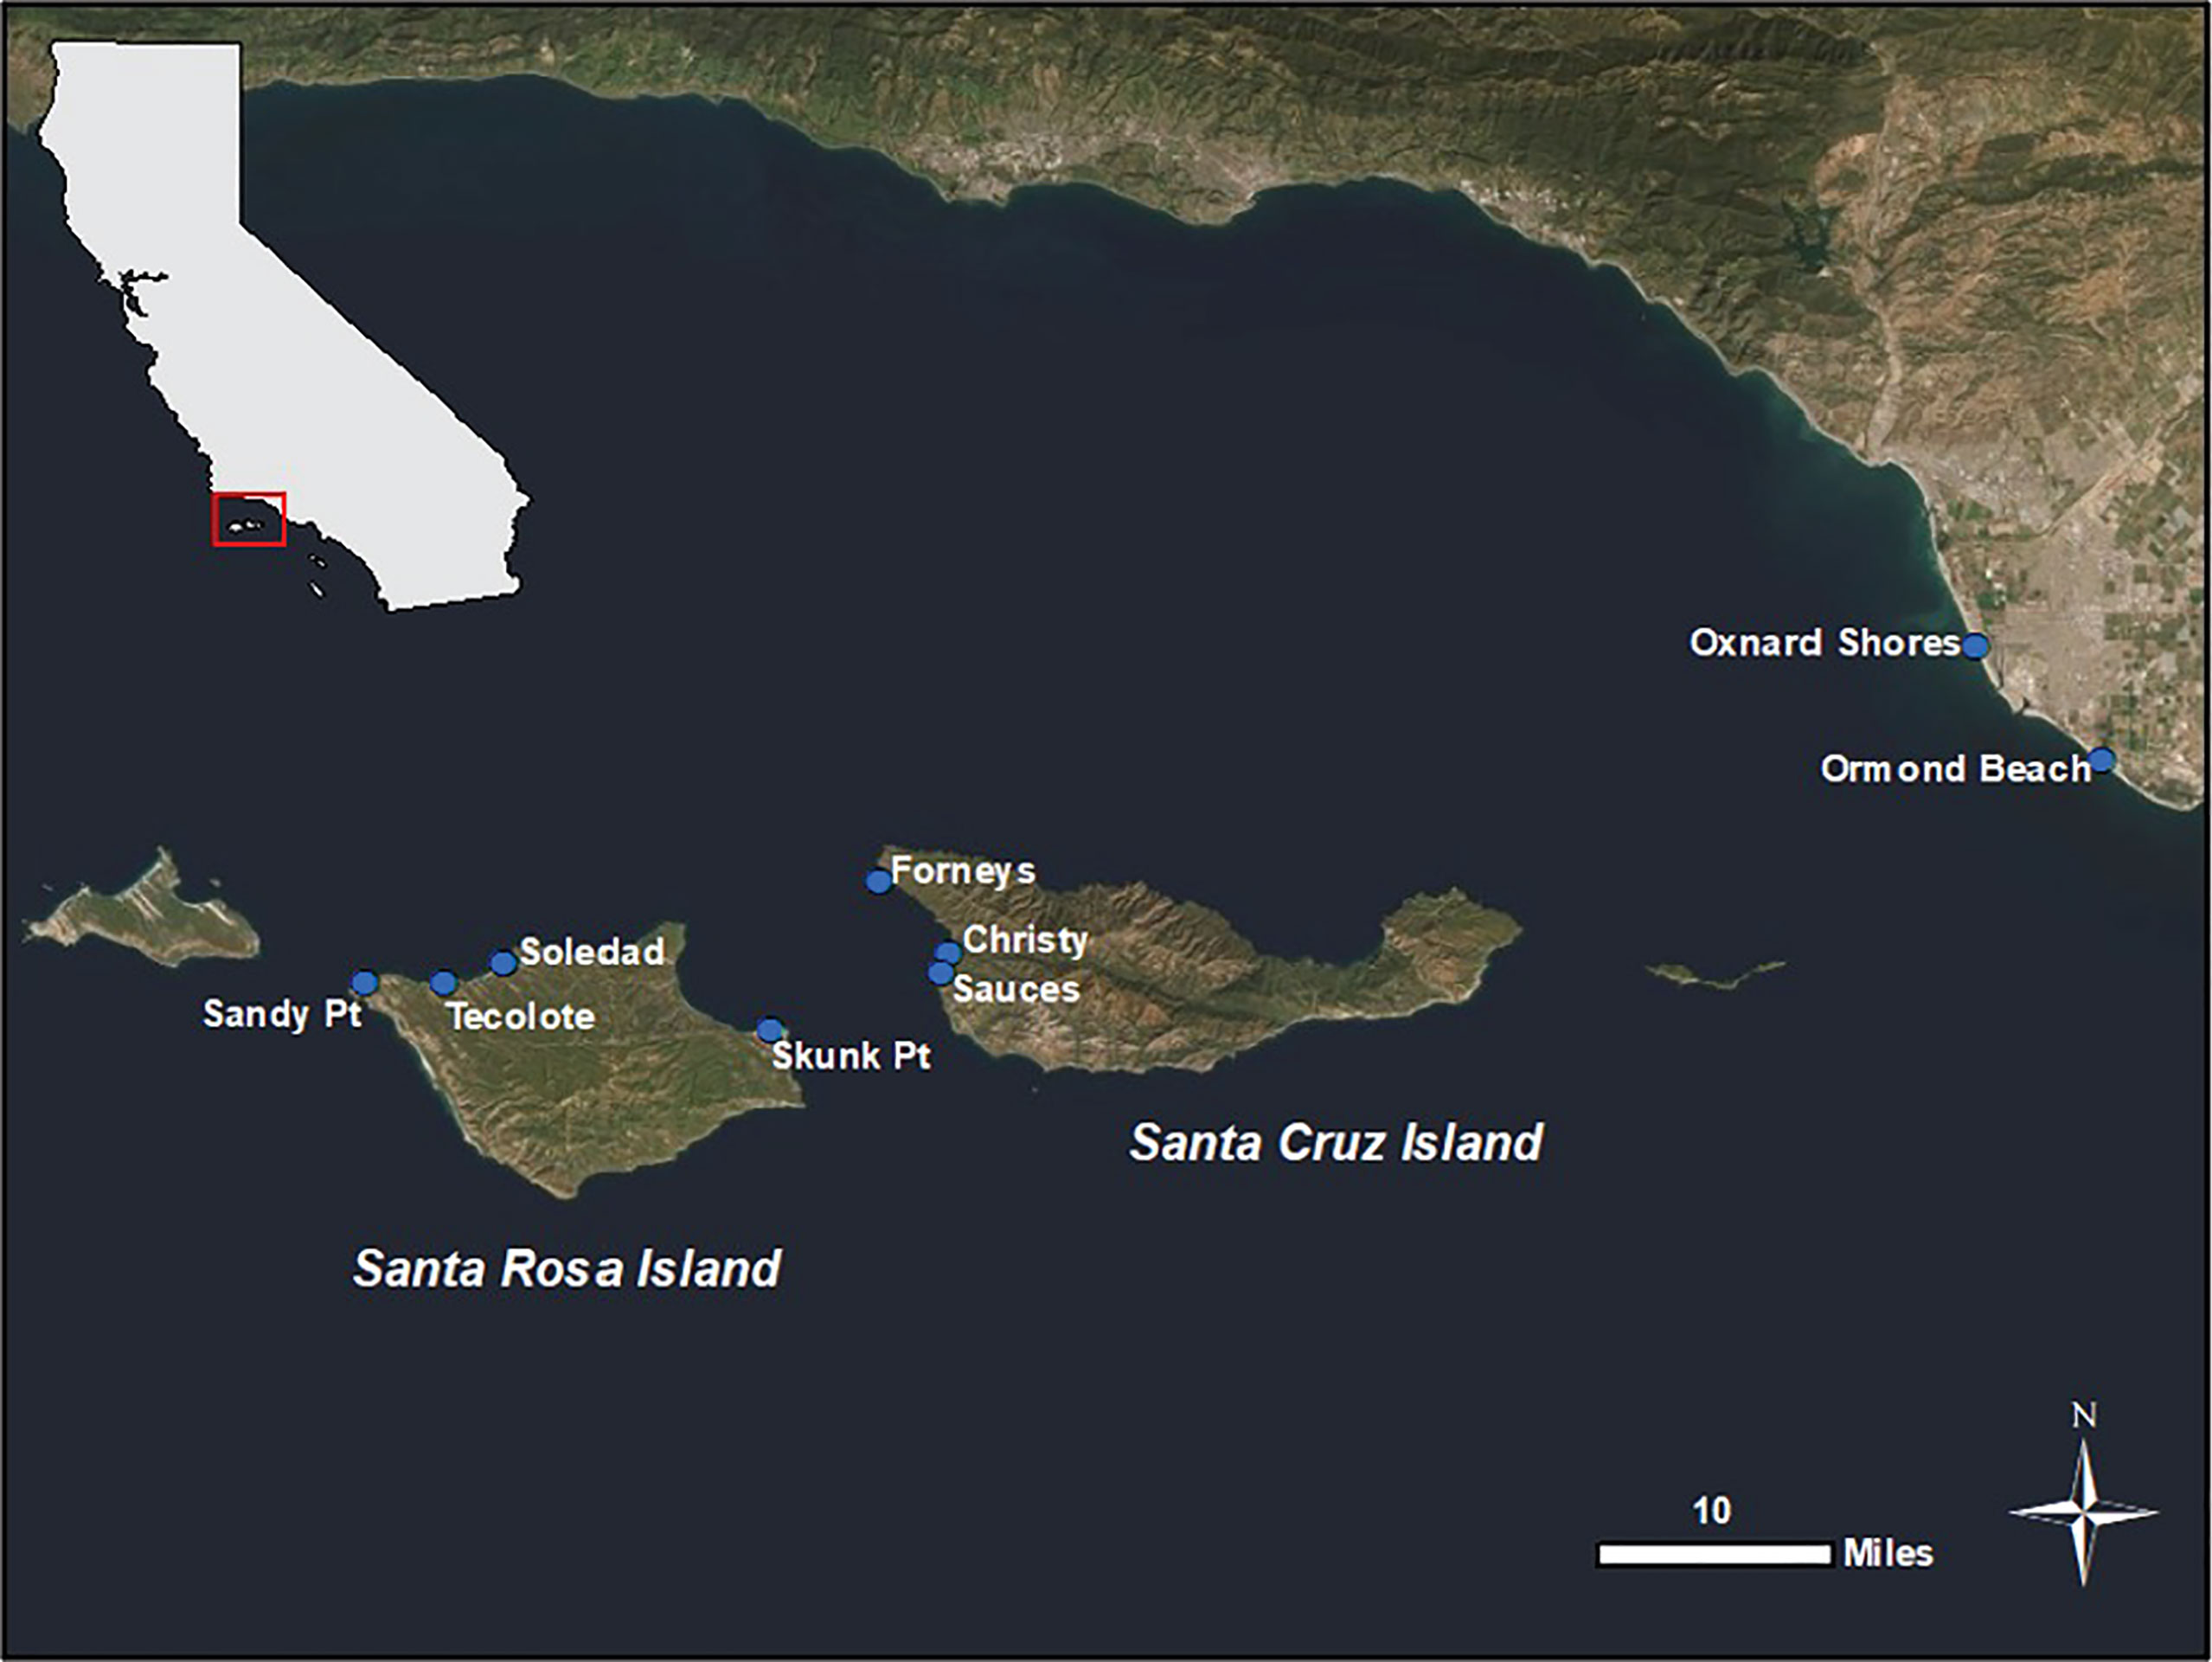
Figure 1 Location of marine debris monitoring and removal sites on two islands within the Channel Islands National Park and on the Ventura County Mainland, California, USA. Santa Rosa Island sites were Sandy Point (SAN), Tecolote Canyon (TEC), Soledad Canyon (SOL) and Skunk Point (SKP). Santa Cruz Island sites were Forney’s Point (FOR), Christy’s Beach (CHB) and Sauces (SAU). Two sites on the Ventura County mainland were Oxnard Shores (OXN) and Ormond Beach (ORM).
The highly populated mainland coast, with 17.8 million inhabitants in 5 coastal counties (U.S. Census Bureau, 2020), and the vast stretches of isolated beaches in the Channel Islands National Park (population <10, U.S. Census Bureau, 2020) have variable types and abundances of marine debris on shorelines (Miller et al., 2018). Despite the proximity of the northern Channel Islands to urban centers on the California mainland, there are no permanent island residents, and these seldom-visited beaches are not easily accessible by vehicle or boat. As such, they are important habitats for a variety of species including pinnipeds, birds, and the Channel Island-endemic island fox. Beaches on the Channel Islands are vulnerable to accumulation of marine litter from nearby mainland sources and debris from fishing activities nearby, particularly lobster-fishing industry activities concentrated in nearshore habitats (Guenther et al., 2015). A previous study of four beaches on Santa Rosa Island (Arlington Canyon, Cluster Point Sandy Point, Skunk Point), one of the five islands in the Channel Islands National Park, found that the relative proportion of ALDFG had significantly increased on all beaches between surveys conducted 1989–1993 and 2015–2016 (Miller et al., 2018).
The commercial fishery for the California spiny lobster is active in the waters of the Southern California Bight, from Point Conception, south to the U.S. border with Mexico. Commercial fishery activities are generally concentrated in the fishing blocks around the offshore islands and in the nearshore waters of the mainland (California Department of Fish and Wildlife, 2019). The number of active participants in this limited-entry fishery declined from a high of 352 active permits in 1994 and has remained relatively consistent, between 135 to 166 participants since 2000; however, the number of annual trap pulls increased in the late 1990s, increased again in 2011-2014, and has since declined (California Department of Fish and Wildlife, 2019) (Figure S1). Commercial landings increased slowly from a low of 69 metric tons during the 1974-1975 fishing season until the 2000-2001 fishing season, when 319 metric tons were landed. Landings have remained fairly stable since then, exceeding 300 metric tons each season. The fishing season operates from early October to mid-March each year, with 80% of the total landings generally occuring before the end of January (NOAA Fisheries, 2022). Commercial fishers use wire box traps deployed from boats, usually positioned at a depth of less than 31m, and pulled at least every 96 hours. A change in the spiny lobster fishery regulation was implemented in the 2017-2018 season restricting fishermen to 300 traps per permit, with the ability to hold a maximum of two permits (14 C.C.R. §122). As in other crustacean fisheries (Richardson et al., 2019), a proportion of traps are lost each season due to line/buoy loss and winter storm events. The reported number of traps lost for the 2019-2020 season was 2,431 and for the 2020-2021 season was 3,311 (Hofmeister, J. pers. comm).
Understanding patterns in AMD abundance and identifying areas where debris accumulation is highest can assist in identifying regional factors, locating hotspots and streamlining removal efforts (McLaughlin et al., 2022). This is critical to effectively removing AMD from the Channel Islands where resources are limited, logistics are challenging, and most beaches are hard to access. Our goal was to assess the amount and types of AMD present and obtain a clearer understanding of the extent of this issue on California Channel Island beaches through seasonal monitoring and removal efforts. Regular monitoring of marine debris can also glean information that can be used to inform management decisions and measure the success of implemented policies that directly or indirectly target debris reduction (McLaughlin et al., 2022). We assessed if recent trends in lobster fishing effort and fisheries regulation changes impacted the accumulation of fishery-related debris on beaches in the region.
The objectives of this study were to (1) describe the composition of anthropogenic macro-debris found on beaches in the study area, (2) assess the initial density of macro-debris on beaches prior to removal efforts (3) calculate seasonal accumulation rates of macro-debris (4) determine if the abundance of micro-debris in beach sediment was predicted by accumulation rates of macro-debris and (5) assess if recent trends in lobster fishing effort and fisheries regulation changes impacted the accumulation of fishery-related debris on beaches in the region. To address these objectives we focused on the following research questions: (i) Does the composition of macro-debris differ among sites? (ii) does the initial density of macro-debris differ among sites? (iii) do rates of accumulation differ among sites, seasons or years?, (iv) does the rate of accumulation of macro-debris predict the abundance of micro-debris in beach sediment, and (v) does the rate of accumulation of fishery-related debris change following the lobster fishery regulation change beginning in the 2017-2018 season?
On sparsely-inhabited islands in coastal California, within the boundaries of a National Park and National Marine Sanctuary, we quantitatively surveyed and collected marine macro-debris on beaches, and assessed micro-debris in beach sediment, seasonally, between 2016 - 2020. We began initial collections of marine debris in 2016, and there were no prior debris collections for at least a year, or perhaps much longer, on island beaches. We surveyed two mainland beaches in Ventura County to enable comparison of debris composition and accumulation. Debris was collected and cataloged using NOAA’s Marine Debris Program (NOAA MDP) accumulation protocol (Lippiatt et al., 2013). Many studies report only the numerical abundance of marine debris items in the environment (Galgani et al., 2015); however, mass is an equally important metric for monitoring marine debris (Ryan et al., 2020) as it is important to managing the logistics of debris removal efforts. We used both metrics, numerical abundance and mass, and measured the area surveyed to estimate initial density and rates of marine debris accumulation. We also assessed the abundance of micro-debris in beach sediments using density extraction and visual microscopy.
The California Channel Islands are an eight-island archipelago located within the Southern California Bight off the coast of Southern California (Figure 1). Santa Rosa Island (SRI) and Santa Cruz Island (SCI) are two of the five northern islands that comprise Channel Islands National Park (CINP) within the Channel Islands National Marine Sanctuary (CINMS). These islands are virtually uninhabited (limited numbers of hikers, campers, rangers, and researchers) in comparison to the neighboring highly populated mainland coast. The more remote island beaches are not accessed regularly by visitors.
Macro-debris surveys were conducted at nine sites in total: four on Santa Rosa Island, three on the west end of Santa Cruz Island, and two on the mainland in the city of Oxnard (Ventura County, California, USA) (Figure 1). Sites were chosen based on the following criteria: minimum beach length of 500 m, sandy beach habitat, and safe access (considering sensitive cultural and natural resources). Mainland sites in Oxnard (Ormond Beach and Oxnard Shores) were primarily chosen as outreach and volunteer engagement sites, and data from these sites provided information on the major differences between island and mainland debris.
We collected and cataloged marine macro-debris using a modified National Oceanic and Atmospheric Administration Marine Debris Program (NOAA MDP) accumulation protocol (Lippiatt et al., 2013). At each of nine sites, we established three 100m fixed transects to account for variability in debris deposition within sites (Lippiatt et al., 2013). The initial collections were performed between Fall 2016 – Spring 2017 (Table S1). At each site, three 100m long transects, parallel to the shoreline, were measured using a fiberglass measuring tape. Unlike the NOAA MDP protocol, the entirety of the 100 m transect was surveyed in our study. The width of each transect was determined by the water’s edge and the back of the beach, (defined as the location of the first barrier or primary substrate change (Lippiatt et al., 2013). The start and end points for each 100m transect were recorded, and the perimeter of the transect was mapped using GPS to calculate the area of each transect. All AMD greater than 5mm in diameter was collected and categorized according to the methods of Lippiatt et al. (2013) except that we created subcategories within the broad ‘plastics’ category to enable comparison with a historic data set from the CINP (Cole, 1998; Miller et al., 2018), and added a category for ALDFG (Table 1). Lippiatt et al. (2013) has one category of plastics, while the historic CINP database split plastic into three types: miscellaneous plastics, plastic packaging, and personal effects. Collected AMD items were transported to the laboratory, where they were cleaned of sand, dried, categorized and weighed. Debris that was buried, stranded, or too large to remove was recorded, tagged to indicate it had been recorded, and left in place. The initial collection at each site was used to calculate the ‘initial density’ of macro-debris as number of items (items m-2) and mass of debris (kg m-2). Removal of debris on the initial sampling occasion at each site allowed us to calculate accumulation rates in subsequent sampling occasions. The remote nature of the island beaches meant that there was no known prior removal of macro-debris for at least one year, and perhaps many years preceding our study. Debris was removed from transects but not from the entire beach due to its sheer volume and the challenging logistics required to remove marine debris from the remote island locations.
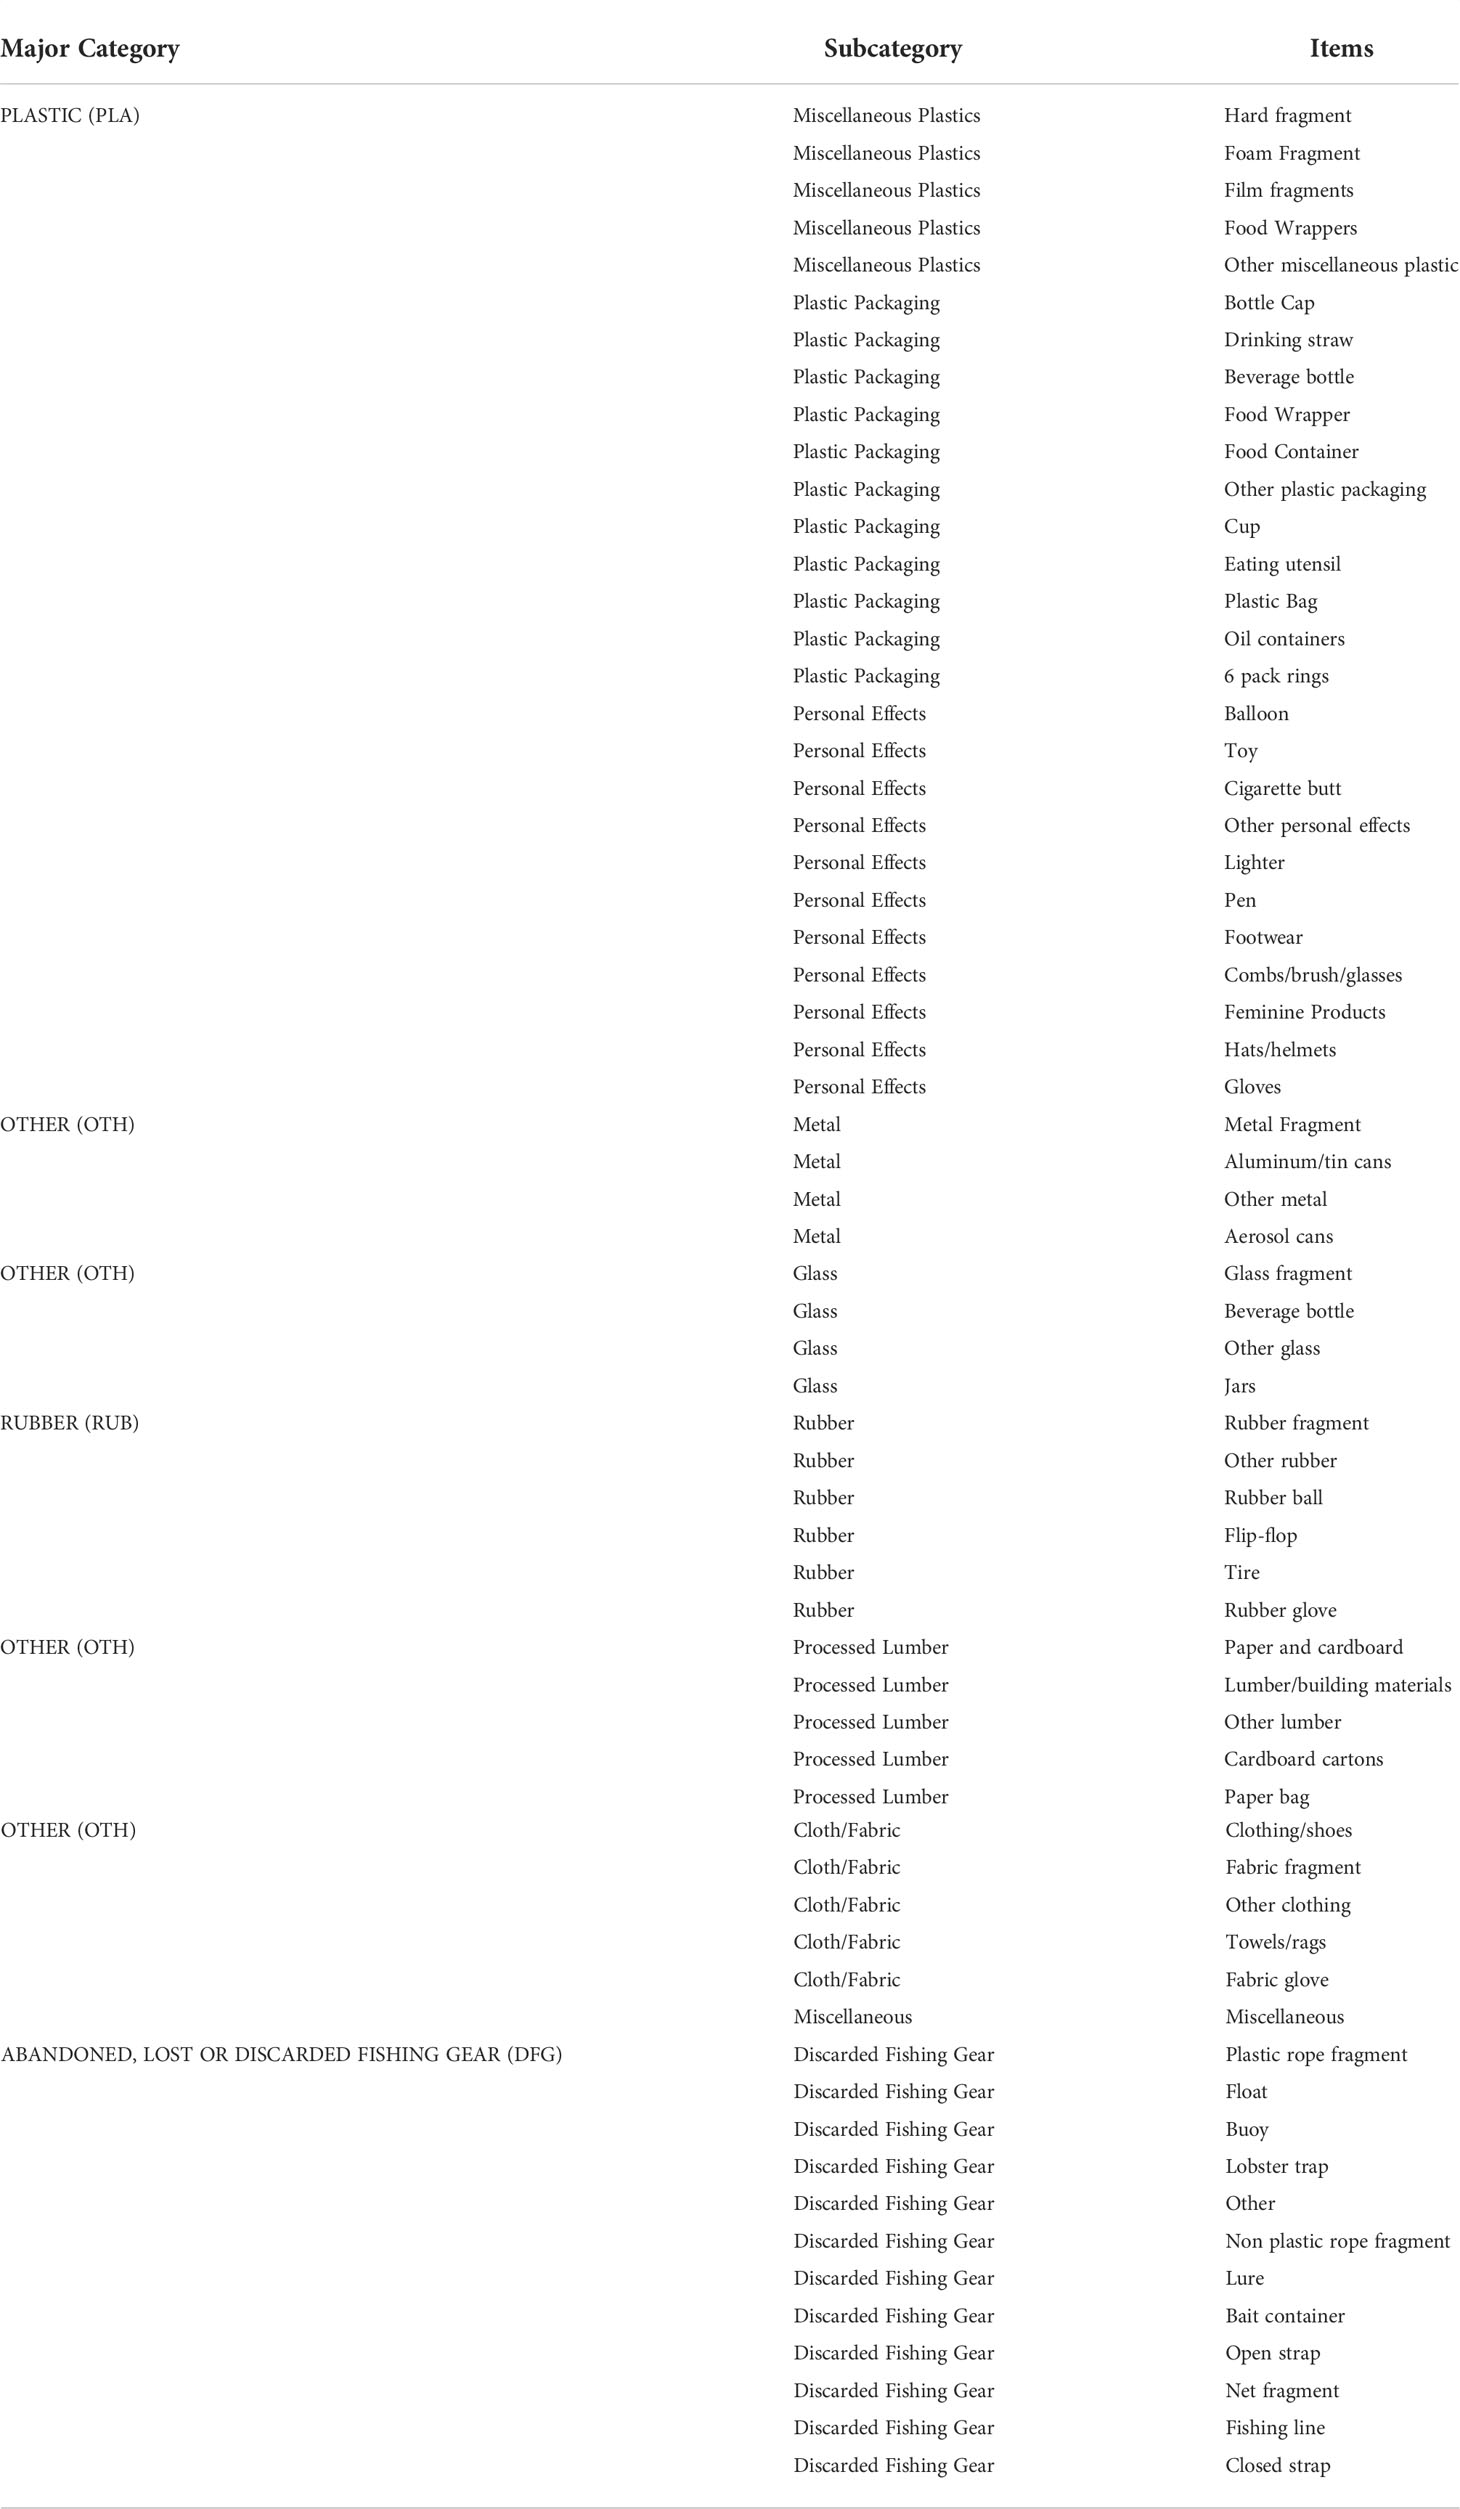
Table 1 Major categories and sub-categories used to categorize collected macro-debris adapted from Lippiatt et al. (2013), with the inclusion of subcategories Miscellaneous Plastics, Plastic Packaging and Personal Effects within the major category Plastic, and with the addition of a major category for Abandoned, Lost or Discarded Fishing Gear.
Using the same method as the initial collection, we recorded and collected debris from the three fixed 100m transects at each site to assess accumulation rates. Similarly, the start and end points for each 100m transect were recorded, and during each survey occasion the perimeter of the transect was mapped using GPS to calculate the area of each transect. Surveys were performed seasonally (during astronomical seasons commencing on the equinoxes and solstices) (Table S1). Since tides and seasons determine the overall width of the beach, the area of each transect was recorded each time a survey was conducted. A number of logistical difficulties hindered collection, particularly during Winter seasons, where heavy rain and erosion closed island roads and boat access to the islands was limited. Additional challenges including the closure of beaches due to pinniped presence and limited access to the CINP in Winter and Spring 2020, due to the COVID-19 global pandemic. Because of this inconsistency in sampling frequency, we calculated the number of days since previous survey for each site to enable us to standardize accumulation rates by area (m2) and time (year). Excluding the initial debris collections, we calculated the accumulation rate of macro-debris. Annual accumulation rate at each site were calculated as ((annual item accumulation rates = number of items per m2/days since last survey)* 365)), and [(annual mass accumulation rate = mass of items per m2/days since last survey) * 365)].
In order to examine if the rate of macro-debris accumulation predicted the number of micro-debris particles in beach sediment, we collected sand samples at the sites of macro-debris collections. Prior to the survey of macro-debris at each beach, two (~250 mL) sand samples were collected from the top 5 cm of sand – one from the swash zone and one from the high-tide line. A total of eighty pairs of these samples were collected between Fall 2016 and Summer 2019 (Table S1). Samples were collected in polyethylene zip top bags and transported to the laboratory where they were dried in a drying oven at 20°C. We used a density separation method (Thompson et al., 2004) to separate anthropogenic micro-debris from the beach sediment. To minimize contamination, cotton clothing and lab coats were worn during sample processing. Each piece of glassware was rinsed three times with filtered deionized water and covered before use. A hyper-saline (sodium chloride, NaCl) solution (1.2 g cm–3) was prepared and double-filtered (Whatman GF-A, nominal pore size 1.6 μm). Sand samples were measured to 100 mL from the collected sample using a pre-rinsed beaker, then placed into a pre-rinsed 1L glass jar with 400mL of hyper-saline solution. The contents of the jar were swirled vigorously for one minute, then allowed to settle for at least one minute or until the mineral matrix had settled. The supernatant was filtered onto glass fiber filters (Whatman GF-A), each filter was examined for anthropogenic microparticles using stereomicroscopy [Olympus Binocular Stereoscope (6.7x-45x) Zoom Body Trinocular Tube Model (SZ61TR)], and items were counted and categorized by color and type. Anthropogenic microparticles, “microlitter”, or micro-debris are usually defined as man-made particles less than 5 mm in size (Andrady, 2011), and fragments, fibers, and pellets are commonly found in beach sediments (Hidalgo-Ruz et al., 2012) and in other diverse ecosystems around the world (Rochman and Hoellein, 2020). Visual microscopy has been frequently used in studies to quantify and characterize larger microplastics (≥500 µm) (e.g., Lusher et al., 2017), and some studies have effectively confirmed these microparticles as plastic (Lusher et al., 2020). We defined anthropogenic micro-debris as particles that were smaller than 5 mm in their longest axis and having characteristics that indicated that they were manufactured rather than natural (Lusher et al., 2020). Density separation using saturated salt (sodium chloride, NaCl) solution (1.2 g cm–3) will suspend polypropylene, polyethene and ethyl vinyl acetate, polystyrene, acrylics, polyamides and polymethylmethacrylate (Lusher et al., 2020). We categorized and enumerated items based on their morphology (fibers, particles), color (homogenous, clear) and behavior (yielding, not easily broken with minimal force) (Hidalgo-Ruz et al., 2012; Lusher et al., 2020). We excluded items of abiogenic (e.g., quartz, mica) or biogenic sediment (e.g., shell, urchin spines) or those that might be mistaken for biological components (e.g., dark or light brown fibers or particles), or the filter (white fibers) (Hidalgo-Ruz et al., 2012). To minimize misidentification of natural articles as anthropogenic micro-debris, we counted only items that were visually characterized as synthetic or semi-synthetic (Kroon et al., 2018).
To assess if there were significant differences in the initial density of macro-debris items or mass among beaches we used nested ANOVA, with transect (random) nested within site (random) and Post-hoc Tukey’s HSD test. Marine debris items (items m-2) [ln(χ +0.0001)] and mass (kg m-2) [ln(χ+0.0001)] were log transformed to improve adherence to assumptions of normality and homoscedasticity. The same transformations were used in all other analyses. Adherence to the assumptions were evaluated by visual inspection of Q-Q plots and plots of residuals.
To test if site, year, or season influenced the rate of accumulation of macro-debris items or mass, we used a mixed-model ANOVA with year and season as fixed factors and site and transect nested within site as random factors.
On sampling occasions when both macro-debris was surveyed and sediment samples were collected (which averaged nine occasions per site) (Table S1) we calculated the mean accumulation rate (items and mass) of macro-debris across each site’s transects on each sampling occasion, then calculated the grand mean by site. We then calculated the mean number of micro-debris items per 100 mL sediment from two samples (swash zone and high-tide line) at each site, then calculated the grand mean by site across all sampling occasions. We used a linear regression to test if the number of micro-debris items per 100 mL of beach sediment was predicted by the density of macro-debris items (items m-2 year-1), or by macro-debris mass (kg m-2 year-1).
Because our assessment of anthropogenic microparticles in beach sediment was most likely to identify buoyant plastic particles rather than other types of anthropogenic micro-debris, we assessed if there was a relationship between micro-debris in sediment and plastic macro-debris items and mass. We calculated the mean accumulation rate (items and mass) of plastic macro-debris across each site’s transects on each sampling occasion, then calculated the grand mean by site. We calculated the mean number of micro-debris items per 100 mL sediment from two samples (swash zone and high-tide line) at each site, then calculated the grand mean by site across all sampling occasions. We used a linear regression to test if the number of micro-debris items per 100 mL of beach sediment was predicted by the density of plastic macro-debris items (items m-2 year-1), or by plastic macro-debris mass (kg m-2 year-1). Plastic macro-debris comprised items categorized as ‘Miscellaneous Plastics, Plastic Packaging and Personal Effects’ (Table 1).
We assessed if recent declining trends in the number of lobster traps pulled and the implementation of lobster fisheries regulation changes beginning in the 2017-2018 season affected the rate of accumulation of fishing debris items and mass. The initial survey at each site, representing an initial density of debris accumulated over an unknown time frame was excluded from the analysis. Data were not collected from Santa Cruz Island during the 2016-2017 lobster season, so we excluded that year from the analysis. We compared the rate of fishing debris item (mean number of items m-2 yr-1) and mass accumulation (mass m-2 yr-1) during the lobster season (October-March) for the season years 2017-2018 to 2020-2021. We used a mixed-model ANOVA with Lobster Season Year as a fixed factor and site and transect nested within site as random factors. Statistical analyses were performed using IBM SPSS Statistics Version 28.0.0.0.
We collected and cataloged 28,263 items of macro-debris over the course of this study (Table S2). There were substantial differences in the types and amounts of marine debris removed across all island and mainland sites. Plastics were the predominant type of macro-debris found across all surveyed beaches comprising about 87% of items collected. Hard and foam plastic fragments were the types of plastic most collected (Table S2). Single-use items such as beverage bottles, bottle caps and food wrappers were also very common. Of non-plastic items removed from beaches, metal fragments, rubber fragments, paper, cardboard and lumber were often found. Glass and cloth/fabric articles were generally found relatively infrequently. The mainland sites (Ormond Beach and Oxnard Shores) tended to have the highest densities of glass and metal fragments, paper/cardboard and processed lumber, as compared to the island sites. Cigarette butts, an item commonly found in beach cleanups, were an order of magnitude more common on the mainland than on the islands. Items categorized as ALDFG were much more common on Santa Rosa Island than at other sites. More than a third of ALDFG items were plastic rope fragments, about 30% were floats and buoys, and about 10% were lobster traps or lobster trap fragments (Table S2). Conversely, the greatest contribution of debris by mass was from the ALDFG category. Less commonly found ALDFG items were lures, bait containers, net fragments and monofilament. The items of AMD collected from beaches in the study averaged 0.039 ± 0.009 items per m2 (Mean ± S.E.) and ranged from 0.007 at Forney’s Point (FOR) to 0.092 items per m2 at Sauces (SAU).
The greatest contribution of debris by mass removed from transects was from the lost fishing gear category, plastics, rubber and other debris (metal, glass, lumber, cloth) also contributed to debris mass. The average mass of macro-debris was 0.003 ± 0.001 kg per m2 (Mean ± S.E.) and ranged from < 0.001 at Oxnard (OXN) to 0.013 kg per m2 at Tecolote (TEC).
The initial density of macro-debris items on beaches, i.e., the average number of items collected within a transect on the initial collection, ranged from 0.005 - 0.222 items m-2. The mean number of debris items collected during the initial surveys was highest at the Santa Rosa Island sites (SAN, TEC, SOL, SKP) and Ormond Beach (ORM). The mean total number of items per m2 collected as initial density differed significantly among sites (F8,18 = 4.28, p = 0.05). Post-hoc Tukey’s HSD test revealed that Forney’s Point (FOR) had significantly lower mean number of debris items per m2 than Tecolote (TEC), Skunk Point (SKP) and Ormond (ORM) beaches, which had significantly higher mean number of debris items per m2 (Figure 2A). The debris items collected during the initial collections were predominantly plastics (PLA) and rubber (RUB), however, a substantial amount of ALDFG (20% of total debris) was collected at the Santa Rosa Island (SRI) sites (Figure 2B).
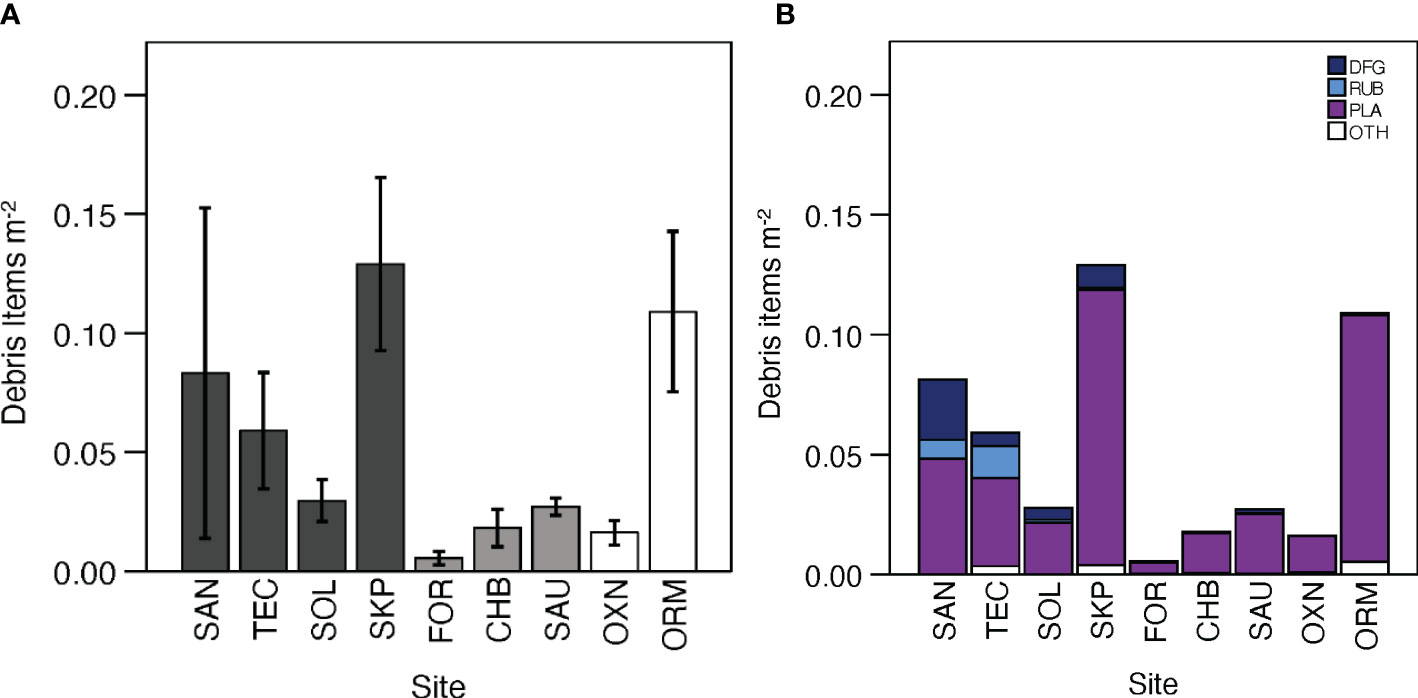
Figure 2 The initial density of marine debris (A), represented as the number of debris items per m2 (mean ± S.E.) collected on three transects per site during the initial collection at Santa Rosa Island (SAN, TEC, SOL, SKP - dark gray), Santa Cruz Island (FOR, CHB, SAU - light gray), and Ventura County mainland sites (OXN, ORM - white). Composition (B) of initial density of marine debris items represented as the mean number of debris items per m2 collected during the initial collection at each site. Items were classified as Discarded Fishing Gear (DFG), Rubber (RUB), Other (OTH), and Plastics (PLA).
The average initial macro-debris mass density ranged from 0.001 - 0.041 kg m-2 (Figure 3A). The mass of debris collected during the initial survey comprised predominantly ALDFG, particularly on the Santa Rosa Island beaches (SAN, TEC, SOL, SKP) and Forney’s Point (FOR) on Santa Cruz Island (Figure 3B). The mean mass of debris per m2 collected as initial density differed significantly among sites (F8,18 = 4.52, p = 0.04). Post-hoc Tukey’s HSD test revealed that the mass of debris per m2 at Oxnard (OXN) was significantly different than Sandy Point (SAN), Tecolote (TEC), and Skunk Point (SKP) beaches that had significantly higher mean mass of debris per m2.
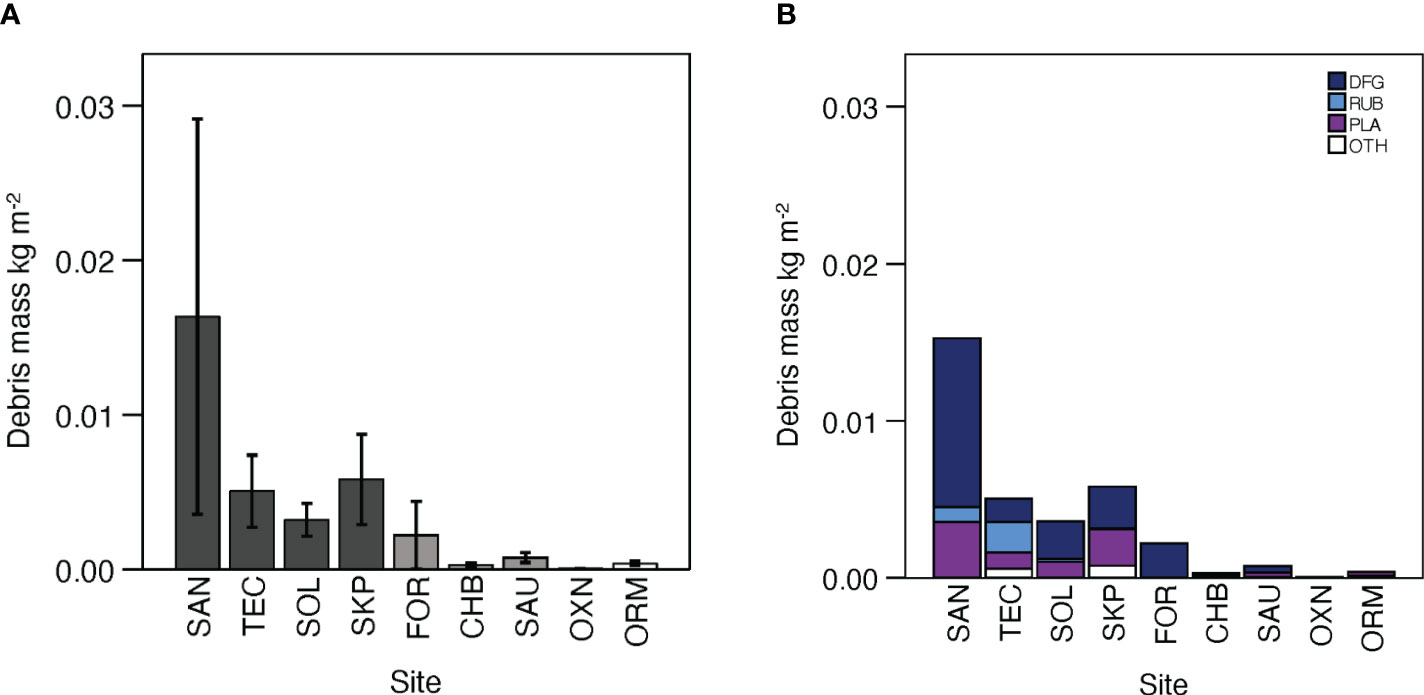
Figure 3 The initial density of marine debris (A), represented as the mass of debris in kg per m2 collected during the initial collection at Santa Rosa Island (SAN, TEC, SOL, SKP - dark gray), Santa Cruz Island (FOR, CHB, SAU - light gray), and Ventura County mainland sites (OXN, ORM – white). Composition (B) of initial density of marine debris mass represented as the mean mass of debris (kg m-2) collected during the initial collection at each site. Items were classified as Discarded Fishing Gear (DFG), Rubber (RUB), Other (OTH), and Plastics (PLA).
Mean accumulation rates of macro-debris at individual beaches were strongly site-dependent and ranged from 0.028-0.337 items m-2 yr-1 and 0.001-0.051 kg m-2 yr-1 (Figure 4). Patterns of accumulation rates among sites, seasons and years were complex. A statistically significant two-way interaction between year and site (F22,56.4 = 2.8, p = 0.001) and between season and site (F23, 64.8 = 4.0, p < 0.001) indicated that the effect of site on accumulation rate varied among years and among seasons (Table S3, Figures S2A– C). Rates of marine debris item accumulation varied among sites where some locations, such as TEC and SAU had consistently high rates of marine debris accumulation (items m-2 yr-1), and some were consistently low (FOR, OXN). Large quantities of debris items were collected during Fall and Winter collections at some sites including TEC, SOL, and SAU. There appeared to be a decline in debris item accumulation as years progressed from 2017-2020 (Figure S2C) with the lowest accumulation rates at all sites occurring in 2020 (0.028 items m-2 yr-1) (note that mainland collections were not conducted at OXN and ORM in 2020).
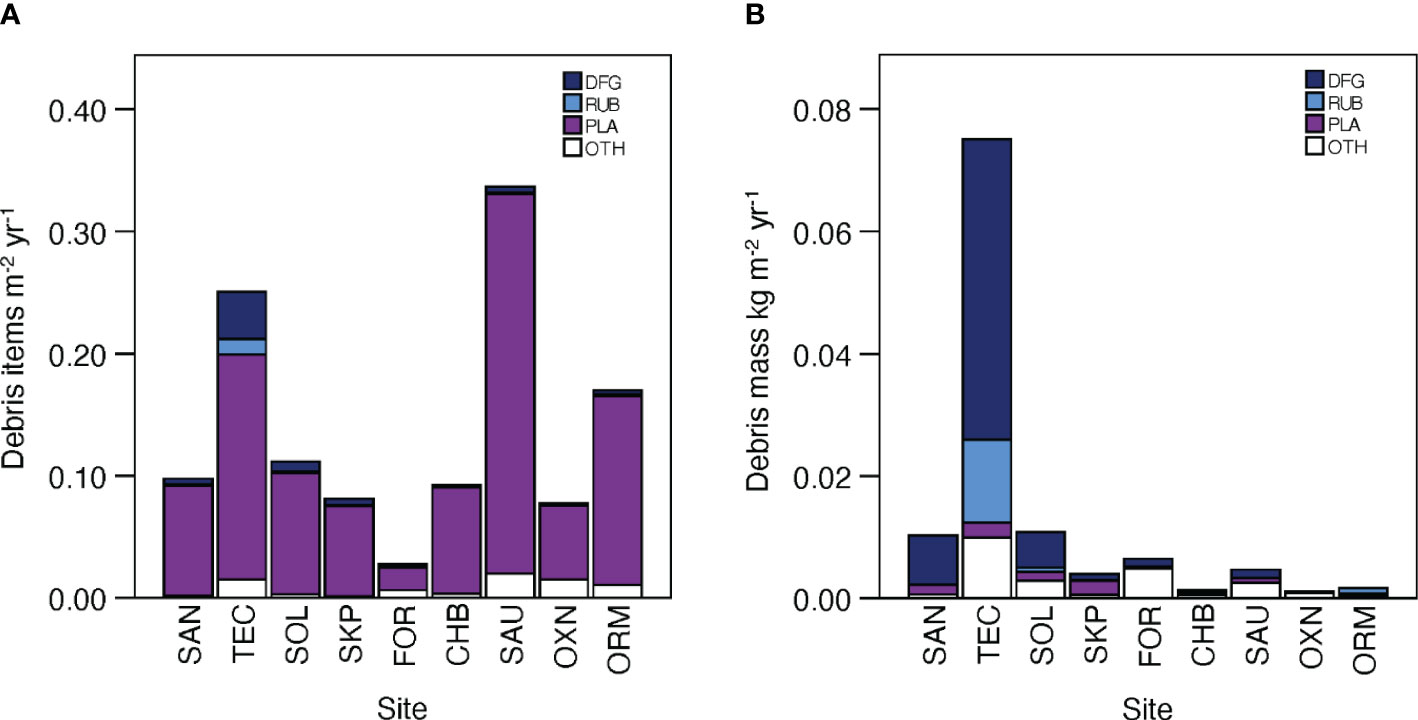
Figure 4 Mean number of debris items (A) and mass (B) collected by site and debris composition. Number of items and mass was standardized by area and by days since the previous survey. Plastics (PLA) was the largest category in terms of number of items removed, and fishing gear (DFG) was the largest category in terms of the mass of debris removed.
Accumulation rates of macro-debris mass among sites, seasons and years were also complex. A statistically significant two-way interaction between year and site (F22,56.0 = 2.2, p = 0.01) indicated that the effect of site on accumulation rate of debris mass varied among years (Table S4, Figures S3A–C). There was a strong effect of site on the rate of debris mass accumulation, with some sites, such as Tecolote (TEC) that had high rates of accumulation (0.051 kg m-2 yr-1) across seasons and years (Figure S3). Sauces (SAU), however, although it had a high rate of accumulation of items, these were consistently small, low weight items of debris (frequently Styrofoam fragments) and therefore, this site had consistently low rates of debris mass accumulation (0.013 kg m-2 yr-1).
We tested if beaches with high densities of marine macro-debris also had high densities of micro-debris in beach sediments. At the nine sample sites, we found a non-significant positive relationship between the mean density of micro-debris (items per 100 mL) in sediment and the mean macro-debris items (items m-2 yr-1) (R2 = 0.18, p = 0.26, n = 9). We found, however, a statistically significant positive relationship between the mean density of micro-debris in sediment and the mean of macro-debris mass (kg m-2 yr-1) (R2 = 0.69, p = 0.005, n = 9) (Figure S4).
We also assessed if micro-debris in sediment was related specifically to plastic macro-debris items or mass. Similar to the relationship between micro-debris in sediment and total macro-debris items, we found that there was a non-significant positive relationship between micro-debris items in sediment and plastic macro-debris items (Figure 5A) (R2 = 0.10, p = 0.40, n = 9) whereas there was a statistically significant positive relationship between the mean density of micro-debris in sediment and mean plastic macro-debris mass (Figure 5B) (R2 = 0.60, p = 0.01, n = 9). In all cases the positive relationship was strongly driven by the high density of macro- and micro-debris at the Tecolote Canyon beach site.
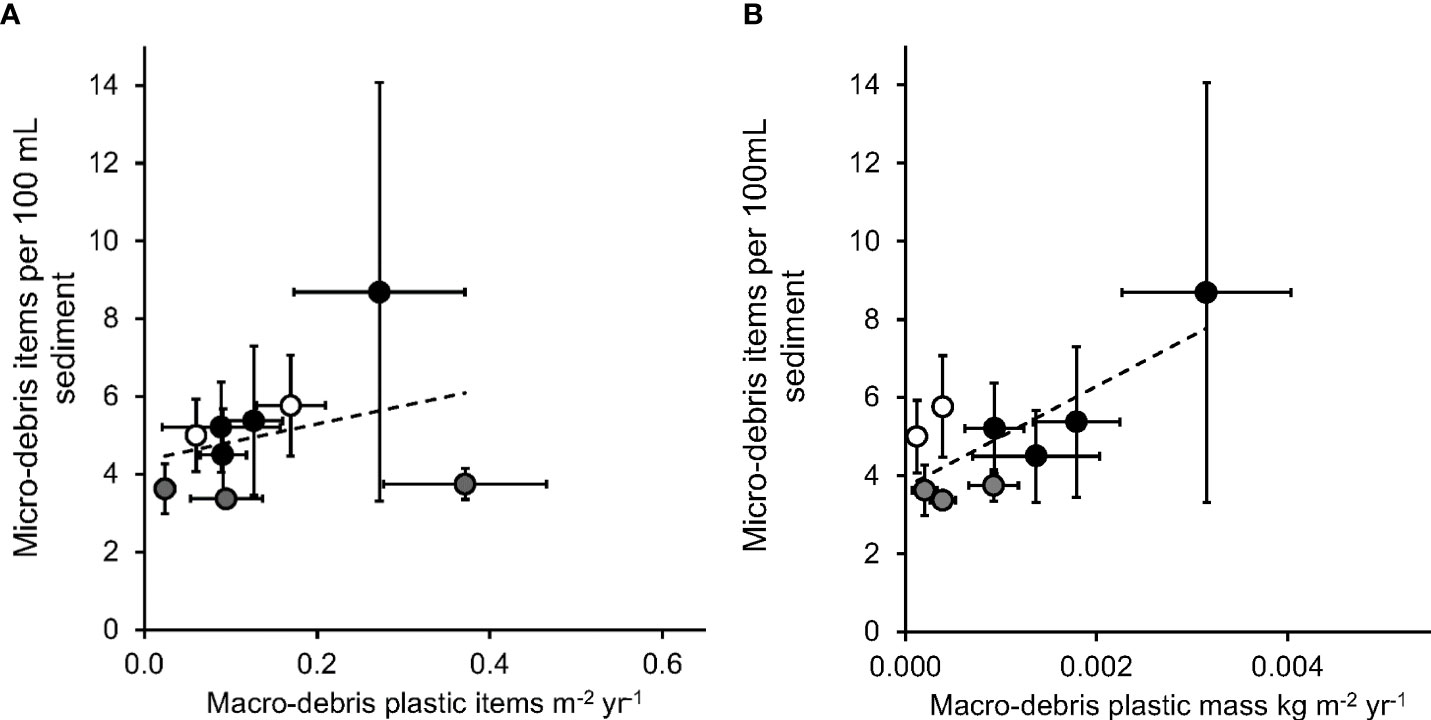
Figure 5 Mean plastic macro-debris item count (A) (items m-2 year-1) and mass (B) (kg m-2 year-1) (Mean ± SE) have non-significant positive relationships with the mean number of micro-debris items per 100mL of sediment (Mean ± SE) at sites on Santa Rosa Island (dark grey symbols), Santa Cruz Island (light grey symbols) and the California mainland (white symbols) (n = 9).
We compared the rate of fishing debris item accumulation (mean number of items m-2 yr-1) during the lobster season (October-March) for the years 2017 to 2020. We found that the accumulation of fishing debris items differed significantly among sites (F8,8.8 = 8.8, p = 0.002) and among years (F3,21.6 = 4.7, p = 0.01), with an apparent pattern of decline over time (Figure 6A). Likewise, we found that the accumulation of fishing debris mass differed significantly among sites (F8,5.5 = 13.6, p = 0.004) and among years (F3,22.2 = 8.3, p < 0.001), where the debris mass rate of accumulation in the 2019-2020 and 2020-2021 seasons appeared much lower than in preceding seasons (Figure 6B).
In this study we assessed the accumulation of macro- and micro-debris on remote beaches of the California Channel Islands and on the adjacent mainland. Upon initial survey and collection of debris on beaches, we found that the initial density of macro-debris was higher on the remote and infrequently visited Santa Rosa Island and Santa Cruz Island beaches, compared to mainland sites. The four sites at Santa Rosa Island, in particular, had large accumulations of debris measured as both items and mass. In the global context, the initial densities of AMD we encountered were relatively modest, and much lower than the global average of 1264.92 items m–2 for studies that report density of macro-debris per square meter (Serra-Gonçalves et al., 2019). The majority (62%) of studies from around the world generally reported low densities (0 - 5 items per m2) (Serra-Gonçalves et al., 2019), similar to the macro-debris densities found in our study (0.005 - 0.222 items m-2) and elsewhere in coastal California (0.03 -17.1 items m-2, Rosevelt et al., 2013). As has been found in other studies (Lavers and Bond, 2017; Ryan et al., 2020; United Nations Environment Programme, 2021), we found that plastics were a dominant component of the accumulated macro-debris items at all sites. Plastics were a relatively high proportion (87%) of beach debris in our study compared to a global average of 70.1% (Serra-Gonçalves et al., 2019).
To enable comparison with previous studies of daily accumulation rate (reviewed by Eriksson et al., 2013), we converted accumulation rates to items per kilometer of linear shoreline per day. The overall mean accumulation rate for all sites was 8.69 ± 1.56 items per linear km shoreline per day (items km-1 day-1) (Mean ± S.E.). The minimum mean accumulation rate of 1.19 items km-1 day-1 was found at Forney’s Cove (FOR) on Santa Cruz Island and the maximum mean accumulation rate was 16.60 items km-1 day-1 at Ormond Beach (ORM) on the mainland. The rates in this study were mostly higher than comparable studies of Alaskan Beaches (0.005 – 2.77 items km-1 day-1, Johnson, 1990), however, were much lower than rates from Halifax Harbor in Nova Scotia, Canada (175 – 650 items km-1 day-1 Walker et al., 2006) and Tresilian Bay in Wales, United Kingdom (28.6 – 212 items km-1 day-1 Williams and Tudor, 2001) (Eriksson et al., 2013). It is worth noting that the relatively low rates of debris accumulation we found may be underestimates. The difficulty in accessing some remote sites, where some beach surveys of marine debris have been conducted, can result in infrequent sampling, on the order of months or years. This can lead to substantial under-estimation of accumulation rates (Eriksson et al., 2013; Smith and Markic, 2013).
We found that the rates of accumulation of macro-debris were highly variable across years and seasons. There were some consistent, site-specific patterns of marine debris density. Mainland sites consistently had the lowest mass densities, some beaches that consistently had high item densities had low mass densities (e.g., Sauces, Santa Cruz Island), and the beach with consistently high density of marine debris by both number of items and by the weight of items removed was Tecolote Beach, Santa Rosa Island. The sites that had the highest accumulation rates of debris by mass were primarily those with large numbers of heavy lobster traps and trap fragments that accumulate there. There was a consistent pattern of higher rates of fishing debris accumulation on the beaches of northwestern Santa Rosa Island. This correlates with historically high lobster fishing pressure in these nearshore waters (Guenther et al., 2015; California Department of Fish and Wildlife, 2019).
The high spatial and temporal variation in debris abundance (Eriksson et al., 2013) makes it difficult to track the transport and fate of marine debris. A variety of local factors can determine the patterns of debris deposition on beaches (Debrot et al., 2013; Lavers and Bond, 2017; Schmuck et al., 2017; Waluda et al., 2020). Tidal height, wind speed and direction and storm events can strongly influence the accumulation rates of AMD on some beaches (Eriksson et al., 2013). Fishing gear, including traps and pots may be moved, subtidally, particularly during extreme weather events and may be ‘captured’ by rugose benthic structure such as coral reefs (as in the Florida spiny lobster fishery) (Uhrin et al., 2014; Renchen et al., 2021). On beaches surveyed in this study, the patterns of spatial and temporal variation of debris item and mass accumulation were complex. Patterns of total marine debris accumulation at each site differed among seasons, and among years. It appeared that in fall and winter the rates of debris accumulation were higher at many sites, perhaps as winter storm waves transported debris onto beaches; however, it was precisely these conditions (resulting in challenging sea crossings and washed-out island roads) that prevented access to surveys sites during most winter seasons making it difficult to fully document seasonal patterns of debris deposition. As in other studies, it is likely that winter storms and seasonal fishing patterns influence rates of accumulation during different parts of the year (Rosevelt et al., 2013; Waluda et al., 2020). There is likely also an influence of the prevailing wind direction and the anticlockwise eddy in the western part of the Santa Barbara Channel that are acting in concert with the high fishing effort on the northern coast of Santa Rosa Island to drive high rates of ALDFG accumulation in this area.
Micro-debris, and particularly microplastic, has garnered a great deal of recent attention, and we assessed if the density of micro-debris was predicted by the rates of accumulation of macro-debris. Micro-debris is time-consuming to assess compared to macro-debris, so it is useful to understand the relationship between macro- and micro-debris. Micro-debris was present in beach sediments at all sites and was predicted by the mass of macro- and plastic debris stranded on beaches. Channel Islands National Park had amongst the lowest micro-plastic densities (second lowest of nine U.S. West Coast National Parks) in a study of microplastics in National Park beaches (Whitmire et al., 2017). Micro-debris, including microplastics, are the numerically dominant type of marine debris (Hidalgo-Ruz et al., 2012), and likely have a greater impact on marine ecosystems than macro-debris (Barnes et al., 2009; Bergmann et al., 2015). Anthropogenic micro-debris is more difficult to detect than macro-debris and is virtually impossible to mitigate, therefore, a strong argument can be made to prioritize the removal of macro-debris from the marine environment. Additionally, macro-debris present in the environment is at risk of degrading into micro-debris (Barnes et al., 2009). Even if plastic pollution were halted immediately, we expect to see an increasing density of plastic fragments due to the ongoing physical weathering of plastic items already in the environment, particularly on beaches (Barnes et al., 2009). Despite the challenges associated with removal of bulky and heavy debris from remote locations, regular debris removal constitutes a worthwhile effort in mitigating impacts and improving the ecological value of coastal ecosystems.
This study coincided with the implementation of a trap limit and tag system in the 2017-2018 lobster season (14 C.C.R. §122) enabling us to observe trends in ocean-based fishery-related debris during this and three subsequent lobster fishing seasons (California Department of Fish and Wildlife, 2017). Trap loss is common in many of the world’s crustacean fisheries and lost or abandoned fishing gear can have ecological impacts on living resources and sensitive coastal habitats (Jeffrey et al., 2016). In the spiny lobster fishery of the Southern California Bight, the fishing season is open from early October to mid-March each year, although 80% of the total landings generally occurs before the end of January (NOAA Fisheries, 2022). In the first half of the season, fishing effort is highest and closest to shore, with most traps usually deployed in less than 31 m of water. The number of active lobster permits has been fairly stable for the last two decades, however the number of traps pulled increased to a peak of 1,179,914 in 2013 (California Department of Fish and Wildlife, 2019; Figure S1). Due to the implementation of the California Spiny Lobster Fishery Management Plan (California Department of Fish and Wildlife, 2016), beginning in the 2017-2018 season fishermen were restricted to 300 traps per permit, with the ability to hold a maximum of two permits. (§122, Title 14, CCR). The number of trap pulls declined annually from the peak in 2013 to 665,436 by the 2019 season (California Department of Fish and Wildlife, 2019). Although our data were limited in the 2016-2017 season, preceding the regulation change, we found that the rates of accumulation of fishing-related debris items and mass was significantly different among years (2017-2018 to 2020-2021 seasons) with an apparent declining trend over time (Figure 6; Tables S5, S6). The sites that had consistently high rates of accumulation, particularly of ALDFG could be identified as sites for future targeted collection efforts, perhaps at the conclusion of lobster fishing season or after strong wave events impacting the northeastern shores of the islands. Reductions in fishing effort can result in local reductions of fishery-related marine litter (Edyvane et al., 2004) and we hope that our continued monitoring of these sites will demonstrate a continued reflection of declining debris deposition.
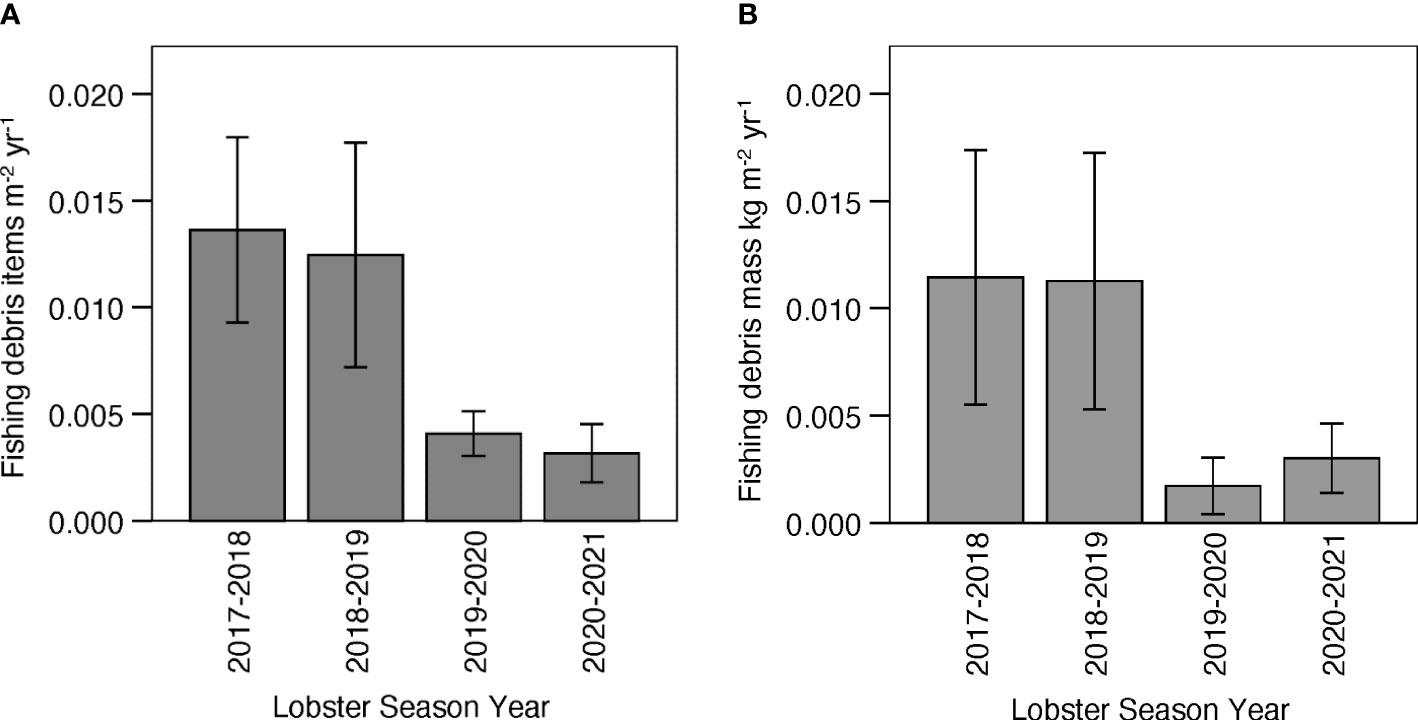
Figure 6 Rate of accumulation (mean ± S.E.) of lost and discarded fishing gear items (A) and mass (B) on beaches of Santa Cruz Island, Santa Rosa Island and the California mainland during the 2017-2018 through 2020-2021 lobster fishing seasons.
Regular monitoring and removal of debris can improve shoreline habitats, reduce risks to wildlife, and can provide useful information on litter composition trends and the impact of measures to reduce marine litter (such as plastic bag bans and fishery-related debris restrictions and incentives) (Lovett et al., 2007; Cho, 2009; Ribic et al., 2010; Blickley et al., 2016; McLaughlin et al., 2022). Information on the density of macro-debris items on shorelines can be helpful to describe spatial or temporal trends but may not be sufficient in a risk-assessment context. The mass and composition of AMD is particularly informative when considering the impacts to ecosystems. High densities of fragmented plastics, as we found at some sites in this study, might have relatively small impacts on recreational use of beaches, fisheries resources, and larger marine wildlife (e.g., pinnipeds), but pose a risk of ingestion by smaller animals. Larger, fishery-related debris might be relatively low in item density but poses a higher risk of entanglement and impacts to larger wildlife and is difficult to remove. Initially, such large debris may cause minimal impacts to small vertebrate and invertebrate inhabitants of beaches, but if not removed, larger debris items may ultimately fragment, increasing the numerical density of debris and becoming bioavailable to a wider range of organisms (Botterell et al., 2019). These are important considerations for management of coastal habitats and unfortunately, the accumulation of debris within National Parks and National Marine Sanctuaries threatens the protections that these protected areas are intended to provide (Renchen et al., 2021). Continued debris removal and monitoring is necessary to provide the reliable information on debris type and patterns of distribution that can support policies aimed at reducing marine litter (Rosevelt et al., 2013).
The raw data supporting the conclusions of this article will be made available by the authors, without undue reservation.
CS and MM contributed equally to this work. All authors contributed to the article and approved the submitted version.
The project was supported by the National Oceanic and Atmospheric Administration Marine Debris Program | Grant #NA16NOS9990035 and the California State University Channel Islands (CSUCI) Santa Rosa Island Research Station (SRIRS).
Logistical and in-kind support was provided by Channel Islands National Park, Channel Islands National Marine Sanctuary, Island Packers, The Nature Conservancy.
The authors gratefully acknowledge the contributions of C. Hanna, G. Dilly, S. Whitaker, R. Bradley, A. Coty, J. Forrest, M. Furmanski, R. Shea, and undergraduate student assistants R. Diego, D. Cook, J. Carlton, B. Demirci, A. Spyrka, and numerous volunteers.
Comments by R. Bradley, D. Reineman, M. Steele and three anonymous reviewers improved the manuscript.
We dedicate this manuscript to the late Dr. Cause Hanna, who initiated this project as lead PI, and whose vision and legacy lives on at CSUCI and the SRIRS.
The authors declare that the research was conducted in the absence of any commercial or financial relationships that could be construed as a potential conflict of interest.
All claims expressed in this article are solely those of the authors and do not necessarily represent those of their affiliated organizations, or those of the publisher, the editors and the reviewers. Any product that may be evaluated in this article, or claim that may be made by its manufacturer, is not guaranteed or endorsed by the publisher.
The Supplementary Material for this article can be found online at: https://www.frontiersin.org/articles/10.3389/fmars.2022.905969/full#supplementary-material.
Agamuthu P., Mehran S. B., Norkhairah A., Norkhairiyah A. (2019). Marine debris: A review of impacts and global initiatives. Waste Manage. Res. 37 (10), 987–1002. doi: 10.1177/0734242X19845041
Andrady A. L. (2011). Microplastics in the marine environment. Mar. Pollut. Bull. 62 (8), 1596–1605. doi: 10.1016/j.marpolbul.2011.05.030
Andrady A. L. (2022). “Plastics in the anthropocene,” in Plastics and the ocean: Origin, characterization, fate, and impacts. Ed. Andrady A. L. (John Wiley & Sons, Hoboken, NJ 07030, USA).
Andrady A. L., Law K. L., Donohue J., Koongolla B. (2022). Accelerated degradation of low-density polyethylene in air and in sea water. Sci. Total Environ. 811, 151368. doi: 10.1016/j.scitotenv.2021.151368
Arthur C., Sutton-Grier A. E., Murphy P., Bamford H. (2014). Out of sight but not out of mind: harmful effects of derelict traps in selected US coastal waters. Mar. Pollut. Bull. 86 (1-2), 19–28. doi: 10.1016/j.marpolbul.2014.06.050
Barnes D. K., Galgani F., Thompson R. C., Barlaz M. (2009). Accumulation and fragmentation of plastic debris in global environments. Philos. Trans. R. Soc. B: Biol. Sci. 364 (1526), 1985–1998. doi: 10.1098/rstb.2008.0205
Besseling E., Foekema E. M., Van Franeker J. A., Leopold M. F., Kühn S., Rebolledo E. B., et al. (2015). Microplastic in a macro filter feeder: humpback whale megaptera novaeangliae. Mar. Pollut. Bull. 95 (1), 248–252. doi: 10.1016/j.marpolbul.2015.04.007
Blickley L. C., Currie J. J., Kaufman G. D. (2016). Trends and drivers of debris accumulation on Maui shorelines: Implications for local mitigation strategies. Mar. Pollut. Bull. 105 (1), 292–298. doi: 10.1016/j.marpolbul.2016.02.007
Botterell Z. L., Beaumont N., Dorrington T., Steinke M., Thompson R. C., Lindeque P. K. (2019). Bioavailability and effects of microplastics on marine zooplankton: A review. Environ. Pollut. 245, 98–110. doi: 10.1016/j.envpol.2018.10.065
Breaker L. C., Gemmill W. H., DeWitt P. W., Crosby D. S. (2003). A curious relationship between the winds and currents at the western entrance of the Santa Barbara channel. J. Geophys. Res.: Ocean. 108 (C5). doi: 10.1029/2002JC001458
Bray N.A., Keyes A., Morawitz W.M.L. (1999). The California current system in the Southern California bight and the Santa Barbara Channel. Journal of Geophysical Research: Oceans 104 (C4), 7695–7714. doi: 10.1029/2002JC001458
California Department of Fish and Wildlife (2016). California Spiny lobster fishery management plan. (Sacramento, CA)
California Department of Fish and Wildlife (2017) Spiny lobster fishery management plan harvest control rule annual review for 2016-17. Available at: https://nrm.dfg.ca.gov/FileHandler.ashx?DocumentID=156078&inline (Accessed 07/06/2020).
California Department of Fish and Wildlife (2019). California Spiny lobster, panulirus interruptus, enhanced status report.
Chen C.S., Wang D.P. (2000). Data assimilation model study of wind effects in the Santa Barbara Channel. J Geophysical Res: Oceans 105 (C9), 22003–22013. doi: 10.1029/2002JC001458
Chen C. L., Liu T. K. (2013). Fill the gap: Developing management strategies to control garbage Pollution from fishing vessels. Mar. Policy 40, 34–40. doi: 10.1016/j.marpol.2013.01.002
Cho D. O. (2009). The incentive program for fishermen to collect marine debris in Korea. Mar. Pollut. Bull. 58 (3), 415–417. doi: 10.1016/j.marpolbul.2008.10.004
Cole C. A. (1998). Final report of the national park marine debris monitoring program 1993 Marine debris surveys: With a summary of data from 1988-1993. (National Park Service, Washington, D.C.)
Debrot A. O., van Rijn J., Bron P. S., de León R. (2013). A baseline assessment of beach debris and tar contamination in bonaire, southeastern Caribbean. Mar. Pollut. Bull. 71 (1-2), 325–329. doi: 10.1016/j.marpolbul.2013.01.027
Derraik J. G. (2002). The Pollution of the marine environment by plastic debris: a review. Mar. Pollut. Bull. 44 (9), 842–848. doi: 10.1016/S0025-326X(02)00220-5
Edyvane K. S., Dalgetty A., Hone P. W., Higham J. S., Wace N. M. (2004). Long-term marine litter monitoring in the remote great Australian bight, south Australia. Mar. Pollut. Bull. 48 (11-12), 1060–1075. doi: 10.1016/j.marpolbul.2003.12.012
Eriksson C., Burton H., Fitch S., Schulz M., van den Hoff J. (2013). Daily accumulation rates of marine debris on sub-Antarctic island beaches. Mar. Pollut. Bull. 66 (1-2), 199–208. doi: 10.1016/j.marpolbul.2012.08.026
Galgani F., Hanke G., Maes T. (2015). “Global distribution, composition and abundance of marine litter,” in Marine anthropogenic litter (Cham: Springer), 29–56.
Gall S. C., Thompson R. C. (2015). The impact of debris on marine life. Mar. Pollut. Bull. 92 (1-2), 170–179. doi: 10.1016/j.marpolbul.2014.12.041
Guenther C., López-Carr D., Lenihan H. S. (2015). Differences in lobster fishing effort before and after MPA establishment. Appl. Geogr. 59, 78–87. doi: 10.1016/j.apgeog.2014.12.016
Harms S., Winant C. D. (1998). Characteristic patterns of the circulation in the Santa Barbara channel. J. Geophys. Res.: Ocean. 103 (C2), 3041–3065. doi: 10.1029/97JC02393
Hidalgo-Ruz V., Gutow L., Thompson R. C., Thiel M. (2012). Microplastics in the marine environment: a review of the methods used for identification and quantification. Environ. Sci. Technol. 46 (6), 3060–3075. doi: 10.1021/es2031505
Jeffrey C. F., Havens K. J., Slacum H. W. Jr., Bilkovic D. M., Zaveta D., Scheld A. M., et al. (2016). Assessing ecological and economic effects of derelict fishing gear: A guiding framework. Office of Response and Restoration National Oceanic and Atmospheric Administration, Washington DC.
Johnson S. W. (1990). “Distribution, abundance, and source of entanglement debris and other plastics on alaskan beaches 1982-88,” in Shomura R.S., Godfrey M.L. (Eds.) Proceedings of the Second International Conference on Marine Debris. 2–7 April, 1989, Honolulu, Hawaii. US Department of Commerce, NOAA Tech. Memo. NMFS, NOAA-TM-NMFS-SWFC-154, pp. 331–348. National Oceanic and Atmospheric Administration, Washington DC.
Kaiser D., Kowalski N., Waniek J. J. (2017). Effects of biofouling on the sinking behavior of microplastics. Environ. Res. Lett. 12 (12), 124003. doi: 10.1088/1748-9326/aa8e8b
Kier G., Kreft H., Lee T. M., Jetz W., Ibisch P. L., Nowicki C., et al. (2009). A global assessment of endemism and species richness across island and mainland regions. Proc. Natl. Acad. Sci. 106 (23), 9322–9327. doi: 10.1073/pnas.0810306106
Kroon F.J., Motti C.E., Jensen L.H., Berry K.L.. (2018). Classification of marine microdebris: A review and case study on fish from the Great Barrier Reef, Australia. Scientific reports 8 (1), 1–15.
Kühn S., Bravo Rebolledo E. L., Franeker J. A. V. (2015). Deleterious effects of litter on marine life. Mar. Anthropog. Litter, 75–116. Springer International Publishing: Cham. doi: 10.1007/978-3-319-16510-3_4
Kusui T., Noda M. (2003). International survey on the distribution of stranded and buried litter on beaches along the Sea of Japan. Mar. Pollut. Bull. 47 (1-6), 175–179. doi: 10.1016/S0025-326X(02)00478-2
Lavers J. L., Bond A. L. (2017). Exceptional and rapid accumulation of anthropogenic debris on one of the world’s most remote and pristine islands. Proc. Natl. Acad. Sci. 114 (23), 6052–6055. doi: 10.1073/pnas.1619818114
Lavers J.L., Hodgson J.C., Clarke R.H. (2013). Prevalence and composition of marine debris in Brown Booby (Sula leucogaster) nests at Ashmore Reef. Marine Pollution Bulletin 77 (1-2), 320–324.
Lippiatt S., Opfer S., Arthur C. (2013). Marine debris monitoring and assessment (NOAA Technical Memorandum NOS-OR&R-46, Silver Spring, MD).
Lovett G. M., Burns D. A., Driscoll C. T., Jenkins J. C., Mitchell M. J., Rustad L., et al. (2007). Who needs environmental monitoring? Front. Ecol. Environ. 5 (5), 253–260. doi: 10.1890/1540-9295(2007)5[253:WNEM]2.0.CO;2
Lucrezi S., Saayman M., van der Merwe P. (2016). An assessment tool for sandy beaches: A case study for integrating beach description, human dimension, and economic factors to identify priority management issues. Ocean. Coast. Manage. 121, 1–22. doi: 10.1016/j.ocecoaman.2015.12.003
Lusher A. L., Bråte I. L. N., Munno K., Hurley R. R., Welden N. A. (2020). Is it or isn't it: the importance of visual classification in microplastic characterization. Appl. Spectrosc. 74 (9), 1139–1153. doi: 10.1177/0003702820930733
Lusher A. L., Welden N. A., Sobral P., Cole M. (2017). Sampling, isolating and identifying microplastics ingested by fish and invertebrates. Analytic. Methods 9 (9), 1346–1360. doi: 10.1039/C6AY02415G
Macfadyen G., Huntington T., Cappell R. (2009). “Abandoned, lost or otherwise discarded fishing gear,” in UNEP regional seas reports and studies No.185 (Rome: UNEP/FAO), 115p.
Madricardo F., Ghezzo M., Nesto N., Kiver M., Joseph W., Faussone G. C., et al. (2020). How to deal with seafloor marine litter: an overview of the state-of-the-art and future perspectives. Front. Mar. Sci., 830 7. doi: 10.3389/fmars.2020.505134
Marine Debris Research, Prevention, and Reduction Act (2009). Definition of marine debris for purposes of the marine debris research, prevention, and reduction act 2009, 74 Fed. Reg. 170 (September 3, 2009), 15 CFR§909 and 33 CFR§151. National Oceanic and Atmospheric Administration, Washington DC.
McLaughlin K., Mazor R. D., Schiff K. C., Hampton L. M. T. (2022). “Southern California bight 2018 regional monitoring program: Volume IX,” in Trash and marine debris. technical report 1263 (Costa Mesa, CA: Southern California Coastal Water Research Project).
Miller M., Steele C., Horn D., Hanna C. (2018). Marine debris trends: 30 years of change on Ventura county and channel island beaches Vol. 78 (Western North American Naturalist, Provo, UT), 328–340.
Moore C.J., Lattin G.L., Zellers A.F. (2011). Quantity and type of plastic debris flowing from two urban rivers to coastal waters and beaches of Southern California Revista de Gestão Costeira Integrada-Journal of Integrated Coastal Zone Management 11 (1), 65–73.
NOAA Fisheries (2022) California Spiny lobster fishery - MMPA list of fisheries. Available at: https://www.fisheries.noaa.gov/national/marine-mammal-protection/california-spiny-lobster-fishery-mmpa-list-fisheries (Accessed 3/16/2022).
Renchen G. F., Butler C. B., Matthews T. R. (2021). Marine debris knows no boundaries: Characteristics of debris accumulation in marine protected areas of the Florida keys. Mar. Pollut. Bull. 173, 112957. doi: 10.1016/j.marpolbul.2021.112957
Ribic C. A., Sheavly S. B., Rugg D. J., Erdmann E. S. (2010). Trends and drivers of marine debris on the Atlantic coast of the united states 1997–2007. Mar. Pollut. Bull. 60 (8), 1231–1242. doi: 10.1016/j.marpolbul.2010.03.021
Ribic C. A., Sheavly S. B., Rugg D. J., Erdmann E. S. (2012). Trends in marine debris along the US pacific coast and hawai’i 1998–2007. Mar. Pollut. Bull. 64 (5), 994–1004. doi: 10.1016/j.marpolbul.2012.02.008
Richardson K., Hardesty B. D., Wilcox C. (2019). Estimates of fishing gear loss rates at a global scale: A literature review and meta-analysis. Fish. Fish. 20 (6), 1218–1231. doi: 10.1111/faf.12407
Rochman C. M., Hoellein T. (2020). The global odyssey of plastic Pollution. Science 368 (6496), 1184–1185. doi: 10.1126/science.abc4428
Rosevelt C., Los Huertos M., Garza C., Nevins H. M. (2013). Marine debris in central California: Quantifying type and abundance of beach litter in Monterey bay, CA. Mar. Pollut. Bull. 71 (1-2), 299–306. doi: 10.1016/j.marpolbul.2013.01.015
Ryan P. G. (2018). Entanglement of birds in plastics and other synthetic materials. Mar. Pollut. Bull. 135, 159–164. doi: 10.1016/j.marpolbul.2018.06.057
Ryan P. G., Weideman E. A., Perold V., Moloney C. L. (2020). Toward balancing the budget: surface macro-plastics dominate the mass of particulate Pollution stranded on beaches. Front. Mar. Sci., 929. doi: 10.3389/fmars.2020.575395
Schmuck A. M., Lavers J. L., Stuckenbrock S., Sharp P. B., Bond A. L. (2017). Geophysical features influence the accumulation of beach debris on Caribbean islands. Mar. Pollut. Bull. 121 (1-2), 45–51. doi: 10.1016/j.marpolbul.2017.05.043
Schwarz A. E., Ligthart T. N., Boukris E., Van Harmelen T. (2019). Sources, transport, and accumulation of different types of plastic litter in aquatic environments: a review study. Mar. Poll. Bull. 143, 92–100. doi: 10.1016/j.marpolbul.2019.04.029
Serra-Gonçalves C., Lavers J. L., Bond A. L. (2019). Global review of beach debris monitoring and future recommendations. Environ. Sci. Technol. 53, 12158–12167. doi: 10.1021/acs.est.9b01424
Smith S. D., Markic A. (2013). Estimates of marine debris accumulation on beaches are strongly affected by the temporal scale of sampling. PloS One 8 (12), e83694. doi: 10.1371/journal.pone.0083694
Thiel M., Hinojosa I. A., Miranda L., Pantoja J. F., Rivadeneira M. M., Vásquez N. (2013). Anthropogenic marine debris in the coastal environment: a multi-year comparison between coastal waters and local shores. Mar. Poll. Bull. 71 (1-2), 307–316. doi: 10.1016/j.marpolbul.2013.01.005
Thompson R. C., Olsen Y., Mitchell R. P., Davis A., Rowland S. J., John A. W., et al. (2004). Lost at sea: where is all the plastic? Science 304 (5672), 838–838. doi: 10.1126/science.1094559
Uhrin A. V., Lippiatt S., Herring C. E., Dettloff K., Bimrose K., Butler-Minor C. (2020). Temporal trends and potential drivers of stranded marine debris on beaches within two US national marine sanctuaries using citizen science data. Front. Environ. Sci. 8, 232. doi: 10.3389/fenvs.2020.604927
Uhrin A. V., Matthews T. R., Lewis C. (2014). Lobster trap debris in the Florida keys national marine sanctuary: distribution, abundance, density, and patterns of accumulation. Mar. Coast. Fish. 6 (1), 20–32. doi: 10.1080/19425120.2013.852638
UNEP (2005). Marine litter: An analytical overview. intergovernmental oceanographic commission of the united nations educational, scientific and cultural organisation Vol. 58 (Nairobi: UNEP).
Uneputty P., Evans S. M. (1997). The impact of plastic debris on the biota of tidal flats in ambon bay (eastern Indonesia). Mar. Environ. Res. 44 (3), 233–242. doi: 10.1016/S0141-1136(97)00002-0
Maes T., McGlade J., Fahim I.S., Green D.S., Landrigan P., Andrady A.L., et al (2021). From Pollution to solution: A global assessment of marine litter and plastic Pollution. United Nations Environment Programme (Nairobi).
U.S. Census Bureau (2020) Census of population and housing. Available at: www.census.gov/quickfacts/.
Votier S. C., Archibald K., Morgan G., Morgan L. (2011). The use of plastic debris as nesting material by a colonial seabird and associated entanglement mortality. Mar. Pollut. Bull. 62 (1), 168–172. doi: 10.1016/j.marpolbul.2010.11.009
Walker T. R., Grant J., Archambault M. C. (2006). Accumulation of marine debris on an intertidal beach in an urban park (Halifax harbour, Nova Scotia). Water Qual. Res. J. 41 (3), 256–262. doi: 10.2166/wqrj.2006.029
Waluda C. M., Staniland I. J., Dunn M. J., Thorpe S. E., Grilly E., Whitelaw M., et al. (2020). Thirty years of marine debris in the southern ocean: annual surveys of two island shores in the Scotia Sea. Environ. Int. 136, 105460. doi: 10.1016/j.envint.2020.105460
Whitmire S. L., Van Bloem S. J. (2017). Microplastics. quantification of microplastics on national park beaches. contract GSI-CU-1505 (Marine Debris Program, Office of Response and Restoration, National Oceanic and Atmospheric Administration, Silver Spring, MD).
Williams A. T., Tudor D. T. (2001). Litter burial and exhumation: spatial and temporal distribution on a cobble pocket beach. Mar. Pollut. Bull. 42 (11), 1031–1039. doi: 10.1016/S0025-326X(01)00058-3
Keywords: anthropogenic marine debris, marine litter, macro-debris, micro-debris, spiny lobster fishery, fishery-related debris, ALDFG
Citation: Steele CLW and Miller MR (2022) Temporal trends in anthropogenic marine macro-debris and micro-debris accumulation on the California Channel Islands. Front. Mar. Sci. 9:905969. doi: 10.3389/fmars.2022.905969
Received: 28 March 2022; Accepted: 30 June 2022;
Published: 28 July 2022.
Edited by:
Tanveer Adyel, Deakin University, AustraliaReviewed by:
Catharina Diogo Pieper, University of the Azores, PortugalCopyright © 2022 Steele and Miller. This is an open-access article distributed under the terms of the Creative Commons Attribution License (CC BY). The use, distribution or reproduction in other forums is permitted, provided the original author(s) and the copyright owner(s) are credited and that the original publication in this journal is cited, in accordance with accepted academic practice. No use, distribution or reproduction is permitted which does not comply with these terms.
*Correspondence: Clare L. W. Steele, clare.steele@csuci.edu
Disclaimer: All claims expressed in this article are solely those of the authors and do not necessarily represent those of their affiliated organizations, or those of the publisher, the editors and the reviewers. Any product that may be evaluated in this article or claim that may be made by its manufacturer is not guaranteed or endorsed by the publisher.
Research integrity at Frontiers
Learn more about the work of our research integrity team to safeguard the quality of each article we publish.