 Liuyang Sheng1,2
 Zhibing Jiang1,2,3,4,5*
 Zhenhao Sun2
 Yuanli Zhu2,4Hongchang Zhai2,3,4Ling Ding6,7
 Mengmeng Tong1
 Jianfang Chen1,2
 Quanzhen Chen2Jiangning Zeng1,2,4,5,7*
- 1Ocean College, Zhejiang University, Zhoushan, China
- 2Key Laboratory of Marine Ecosystem Dynamics, Second Institute of Oceanography, Ministry of Natural Resources, Hangzhou, China
- 3Key Laboratory of Marine Space Resource Management Technology, Ministry of Natural Resources, Hangzhou, China
- 4Marine Ecosystem Observation and Research Station on the Changjiang Estuary, Ministry of Natural Resources, Hangzhou, China
- 5Key Laboratory of Nearshore Engineering Environment and Ecological Security of Zhejiang Province, Hangzhou, China
- 6Key Laboratory of Satellite Ocean Environment Dynamics, Second Institute of Oceanography, Ministry of Natural Resources, Hangzhou, China
- 7School of Oceanography, Shanghai Jiao Tong University, Shanghai, China
Noctiluca scintillans feeds on a large number of phytoplankton, including diatoms and dinoflagellates, and frequently forms a red tide in the East China Sea (ECS) and southern Yellow Sea (SYS). However, the spatiotemporal distribution pattern, controlling factors, and long-term change of N. scintillans in the ECS and SYS remain unclear. In the present study, we collected N. scintillans samples from the ECS and SYS throughout the four seasons of 2011. We sampled phytoplankton and environmental parameters simultaneously. The depth-integrated abundance (DIA) of N. scintillans was the highest and lowest in summer and winter, respectively. N. scintillans is distributed abundantly in eutrophic coastal waters and the Changjiang Estuary, which are characterized by high concentrations of phytoplankton and chlorophyll-a. A Spearman correlation test demonstrated that its DIA in the upper 30-m water column was generally more significantly associated with phytoplankton abundance and chlorophyll-a concentration than with temperature and salinity. The results of the generalized additive models revealed that chlorophyll-a concentration explained more of the variation in N. scintillans abundance than temperature and salinity throughout the year, particularly in warm seasons. These findings indicate that the seasonal and spatial changes of N. scintillans are largely regulated by phytoplankton biomass. Compared with the historical data from 1959 and 2002, the abundance of N. scintillans in the Changjiang Estuary increased considerably in 2011 with increasing phytoplankton abundance resulting from accelerated eutrophication and warming. These results clarify the controlling factors, red-tide formation mechanism, and changing trends associated with the N. scintillans in the ECS and SYS.
Introduction
Noctiluca scintillans is widely distributed in temperate, subtropical, and tropical coastal waters (Elbrächter and Qi, 1998; Harrison et al., 2011). It tends to be more abundant, even forming a red tide, in eutrophic inshore waters, estuaries, and upwellings because it requires a large supply of food based on phytoplankton (e.g., diatoms and dinoflagellates) to maintain its high growth rate (Harrison et al., 2011). The red tide formed by N. scintillans adheres to the gills of aquatic animals, causing them to suffocate from a lack of oxygen, and the ingestion of fish eggs causes a decline in fish stocks (Enomoto, 1956). N. scintillans contains a large amount of ammonium in its cells, which may affect the quality of seawater and the ecological environment (Ara et al., 2013; Zhou et al., 2020). N. scintillans influences the plankton food web and biogeochemical processes by feeding on microalgae, copepod eggs, fish eggs, and protozoa (Hattori, 1962; Zhang et al., 2016).
N. scintillans can be divided into two types according to the presence of the symbiotic algae Protoeuglena noctiluca: green N. scintillans with symbiotic algae and red N. scintillans without symbiotic algae (Harrison et al., 2011). N. scintillans reproduces asexually through the binary fission of vegetative cells and also sexually through the formation of gametocytes to produce gametes (Song et al., 2016; Sathish et al., 2020). Studies have demonstrated that the temporal and spatial distribution of N. scintillans is affected by various physical, chemical, and biological factors in different waters. Tada et al. (2004) revealed that the water stability from late spring to early summer promoted an increase in N. scintillans abundance. The proliferation of N. scintillans is generally regarded as an indirect result of eutrophication because the increase in nutrient input promotes a higher phytoplankton biomass, thereby providing more food for N. scintillans (Dela-Cruz et al., 2003; Smitha et al., 2022).
The East China Sea (ECS) and southern Yellow Sea (SYS) are located off the west coast of the Pacific Ocean; they span latitudes from subtropical to temperate waters, and despite considerable seasonal changes, they are mainly controlled by the warm, salty, oligotrophic Kuroshio system (including the Taiwan Warm Current and Yellow Sea [YS] Warm Current) and the low-salinity, eutrophic coastal current system (Changjiang Diluted Water, ECS Coastal Current, and YS Coastal Current; Figure 1). In summer, the Kuroshio mainstream flows toward the northeast along the ECS shelf break (200–1,000 m isobaths), and the Taiwan Warm Current enhances and flows northeastward along the 50-m isobath under the prevailing southwest monsoon. Notably, the low-salinity (≤31) Changjiang Diluted Water flows northeastward, and dominates the Changjiang Estuary, southern SYS, and northern ECS. Deeper water is controlled by YS Cold Water (≤10°C) in the SYS. In winter, the Taiwan Warm Current weakens and the high-temperature YS Warm Current intrudes into the SYS. The temperature, salinity, and nutrient concentrations vary greatly on spatial and seasonal scales because of the water mass movement of the Kuroshio and coastal current in addition to solar irradiance. Studies on N. scintillans in the ECS and SYS have been limited to coastal waters, including the Changjiang Estuary (Xu, 2009), Jiaozhou Bay (Tian et al., 2017; Wang et al., 2018), and Yantai coast (Zhang et al., 2020c). No multidisciplinary investigations on the seasonal and spatial distribution and population dynamics of N. scintillans across the entire ECS and SYS have been conducted. The controlling factors and regulation mechanism of N. scintillans in the ECS and SYS remain unclear; therefore, a large-scale baseline survey is warranted.
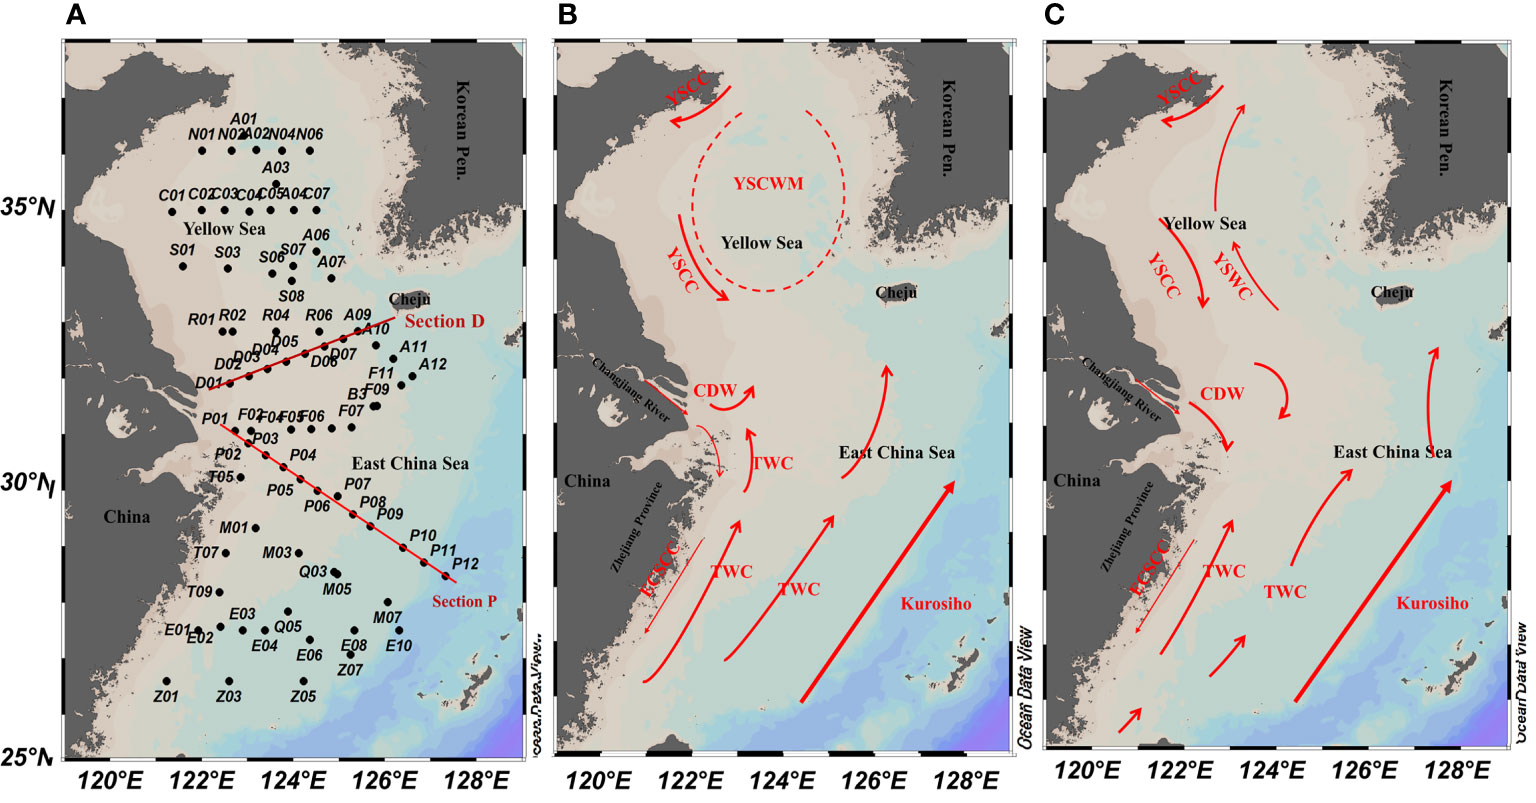
Figure 1 Schematic of the circulation and (A) sampling stations in the East China Sea and southern Yellow Sea in (B) warm (summer and autumn) and (C) cold (winter and spring) seasons (Su and Yuan, 2005; Zhang et al., 2008; Chen, 2009).
N. scintillans is a eurythermal and euryhaline species; thus, it tolerates different temperatures and salinity in different regions. Xu (2009) revealed that the most suitable temperature range for N. scintillans in the Changjiang Estuary ranges from 15°C to 20°C. However, N. scintillans red tides were also observed in the Changjiang Estuary during summer when the water temperature was between 28°C and 30°C (Qi et al., 2019). This finding demonstrates that temperature is not the most crucial factor for inducing N. scintillans blooms in the Changjiang Estuary. Tseng et al. (2011) noted that N. scintillans was abundant in the eutrophic low-salinity waters of the southern and western parts of the ECS, especially in the Changjiang Estuary, and Zhang et al. (2020c) revealed that the rapid growth of N. scintillans in Yantai, China, was caused by an increase in phytoplankton abundance. Remote sensing data reveal that N. scintillans blooms frequently coincide with the fronts of the Changjiang Diluted Water, which are characterized by low salinity and abundant food (phytoplankton; Sriwoon et al., 2010; Qi et al., 2019). Furthermore, N. scintillans blooms were observed in the offshore waters of the ECS to at least 126°E, which have relatively high salinity (Qi et al., 2019). The eutrophic Changjiang Diluted Water and coastal current promote phytoplankton growth (Zhu et al., 2009; Jiang et al., 2015; Jiang et al., 2019; Liblik et al., 2020). The N. scintillans in the ECS and SYS is the red type (Harrison et al., 2011) that consumes large amounts of phytoplankton cells through heterotrophic feeding. Therefore, we assume that the spatial and temporal distribution of N. scintillans in the ECS and SYS is influenced more by phytoplankton biomass rather than by temperature and salinity.
In the present study, we conducted four cruises in the ECS and SYS for all four seasons of 2011. We collected N. scintillans using net-collection and water-collection methods. Our objectives were to (1) compare the temporal and spatial distribution of N. scintillans using different collection methods; (2) explore the adaptability of N. scintillans to temperature, salinity, phytoplankton abundance, and other factors; and (3) ascertain the long-term changes in N. scintillans in the Changjiang Estuary compared with historical data since 1959. The present study improves our understanding of the distribution pattern, controlling factors, red-tide formation mechanism, and changing trend of N. scintillans in the ECS and SYS.
Materials and Methods
Study Area
Four multidisciplinary cruises were conducted in the ECS and SYS for the four seasons (i.e., spring [April–March 2011], summer [July 2011], autumn [October–November 2011], and winter [December 2011–January 2012]). A total of 67, 62, 68, and 67 stations were investigated in spring, summer, autumn, and winter, respectively. Figure 1 presents the study area and all sampling stations. Section D is the dividing line between the ECS and SYS.
Sample Collection
At each station, temperature, salinity, density (σt), and water depth were measured in situ by using a conductivity–temperature–depth (CTD) recorder (SBE 917 Plus, Seabird, Sea Bird Corporation, USA). The water column stratification index (SI) was defined as Δσt = bottom density – surface density.
Water samples at different depths (2 or 3, 10, 30, 50, 75, 100, 150, and 200 m, as well as the bottom and deep chlorophyll-a [Chl-a] maximum) were collected in 12-L Niskin bottles. The collected seawater was used to determine nutrients and Chl-a concentrations and conduct the microscopic counting of N. scintillans abundance.
For the net-collected samples, phytoplankton and N. scintillans samples were collected vertically from the bottom (3–5 m above the seabed) to the surface using a plankton net with a 76-µm mesh (inner diameter of the net mouth: 37 cm; length: 280 cm) at each station. The amount of filtered water was recorded using a digital flow meter (Model 438115, Hydro Bios). All net-collected and water-collected samples were preserved using 4% formalin, and 2–3 mL of the net-collected samples were extracted for counting using a Leica DMI 3000B microscope. After 24–48 h of sedimentation, the water-collected samples (~1,000 mL) of N. scintillans were concentrated to 10–100 mL and then sieved using an 8-μm nylon sieve. The N. scintillans was counted in the sieve using a Leica DMI 3000B microscope.
After a specific amount of seawater was filtered through a 0.45-μm polycarbonate membrane, a continuous flow analyzer (Skalar San++, Netherlands) was employed to determine the concentrations of dissolved inorganic nitrogen (DIN: ++) and phosphorus (DIP) in a laboratory. The sample of Chl-a was obtained by filtering 100–250 mL of seawater (200-μm sieve silk) through a 0.7-μm Whatman GF/F filter membrane. After being extracted using 10 mL of 90% acetone at −20°C for 24 h, the concentration of Chl-a was measured using a Turner Design Fluorometer. The temperature, salinity, nutrient, and phytoplankton datasets used in this analysis have already been published (Quan, et al., 2013; Jiang et al., 2018; Jiang et al., 2020).
Data Analysis
The depth-integrated abundance (DIA) of N. scintillans in the whole water column at each station was calculated.
On the basis of the abundance of N. scintillans at each water layer, the water-collected DIA Ct of the N. scintillans at each station was calculated using the equation as follows:
where Ci is the N. scintillans abundance of the ith layer (cells/L), Ci+1 is the N. scintillans abundance of the i + 1st layer (cells/L), Di is the sampling depth of the ith layer (m), Di+1 is the sampling depth of the i + 1st layer (m), and n is the number of sampling layers.
According to the net-collected abundance of N. scintillans at each station, the DIA Cd of N. scintillans at each station was calculated as follows:
Where C is the abundance of net-collected N. scintillans and Zmax is the water depth (m) at each station.
On the basis of the environmental variables (temperature, salinity, and nutrients) at each station, the depth-average value (Nt) of each variable in the upper 30-m water column at each station was calculated as follows:
Where Ni is the variables of the ith layer, Ni+1 is the variable of the i + 1st layer, and n is the number of sampling layers.
The high density of N. scintillans was generally observed in the upper 30-m water column. Therefore, a Spearman correlation analysis and generalized additive models (GAMs) were applied to determine the relationship between the DIA of N. scintillans and the depth-average values of the environmental variables (except SI) in the upper 30-m water column. A Spearman correlation analysis and GAMs were applied using SPSS 20.0 and R, respectively. The establishment of GAMs was completed using the mgcViz package (version 4.0.2). The expression of the GAMs was expressed was as follows:
In the aforementioned equation, the abundance at several stations was 0; thus, Y is the log (Cd+1)-transformed value of N. scintillans abundance; α is the intercept of the fit function; f1, f2, f3, f4, and f5 are the smooth functions of the five variables of X; X1 and X2 are the depth-average temperature and salinity, respectively, in the upper 30-m water column, respectively; X3 is the SI; X4 is the depth-integrated Chl-a in the upper 30-m water column; and X5 is the log-transformed Cd of phytoplankton. The N. scintillans in the ECS and SYS is a heterotrophic dinoflagellate and cannot directly utilize nutrients (Harrison et al., 2011). Thus, DIN and DIP were not included in the formula. Model building followed a stepwise forward approach with the largest cumulative deviation explained value. The model with the lowest value of Akaike information criterion (AIC) was selected as the optimal model.
The relationship between Cd and Ct was determined using linear regression. A Kruskal–Wallis one-way analysis of variance by ranks was performed to detect significant differences in the Cd and Ct of N. scintillans and environmental variables among different seasons. These statistical tests were applied using SPSS 20.0. We used the net-collection method to describe the spatial distribution pattern in the abundance of N. scintillans. Because Cd ranged from 0 to 108 cells/m2 across the entire ECS and SYS, a log (Cd+1) transformation was performed to present the spatial distribution pattern of N. scintillans. The distribution of environmental factors and N. scintillans abundance was drawn using Ocean Data View (ODV) 4.5.
Results
Environment Conditions
Our results revealed significant (p < 0.01) seasonal differences in temperature and salinity both on the surface and in the upper 30-m water column (Table 1). The SI and depth-average nutrients (DIN and DIP) results also varied significantly among the seasons (p < 0.01). The depth-average and surface temperature were higher in summer (21.5°C and 25.0°C) and autumn (21.7°C and 21.7°C) than in winter (15.3°C and 15.3°C) and spring (9.9°C and 10.0°C). Because of the presence of the low-salinity Changjiang Diluted Water extension off the Changjiang Estuary, the depth-average salinity of the upper 30-m water column and surface salinity were lower in summer (31.8 and 30.6) and autumn (32.8 and 32.8) than in spring (33.1 and 33.0) and winter (33.3 and 33.3). Furthermore, because of the enhancement of the Changjiang Diluted Water and YS Cold Water Mass, the SI was higher in summer (4.69) and autumn (1.42) than in spring (0.22) and winter (0.27). The depth-average concentrations of the DIN and DIP were markedly lower in summer and autumn than in winter and spring because the water bodies mixed to a greater degree in winter and spring than in summer and autumn.
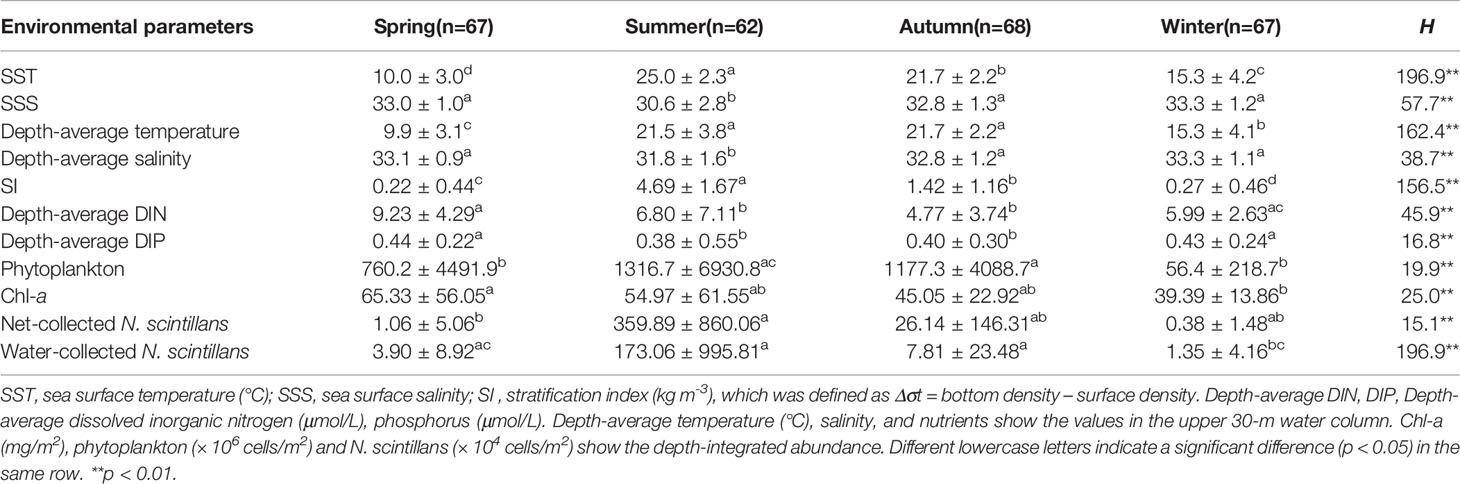
Table 1 Comparison of depth-integrated abundance of N. scintillans and environmental variables (mean ± standard deviation) in the East China Sea and southern Yellow Sea in different seasons by using Kruskal–Wallis (H) test.
In winter and spring, temperature and salinity were high in the southern and eastern parts of the ECS and in the southeastern part of the SYS because of the intrusion of the Kuroshio, Taiwan Warm Current, and YS Warm Current (Figure 2). In summer and autumn, the temperature and salinity were higher in the southern part of the ECS than in the northern part of the ECS and in the SYS influenced by the Changjiang Diluted Water and YS Coastal Current. The southern part of the SYS and the northern ECS were controlled by the Changjiang Diluted Water, which had a strong halocline, and the deeper SYS was dominated by the YS Cold Water Mass, which had a strong thermocline; consequently, a high SI was detected off the Changjiang Estuary and in the central SYS.
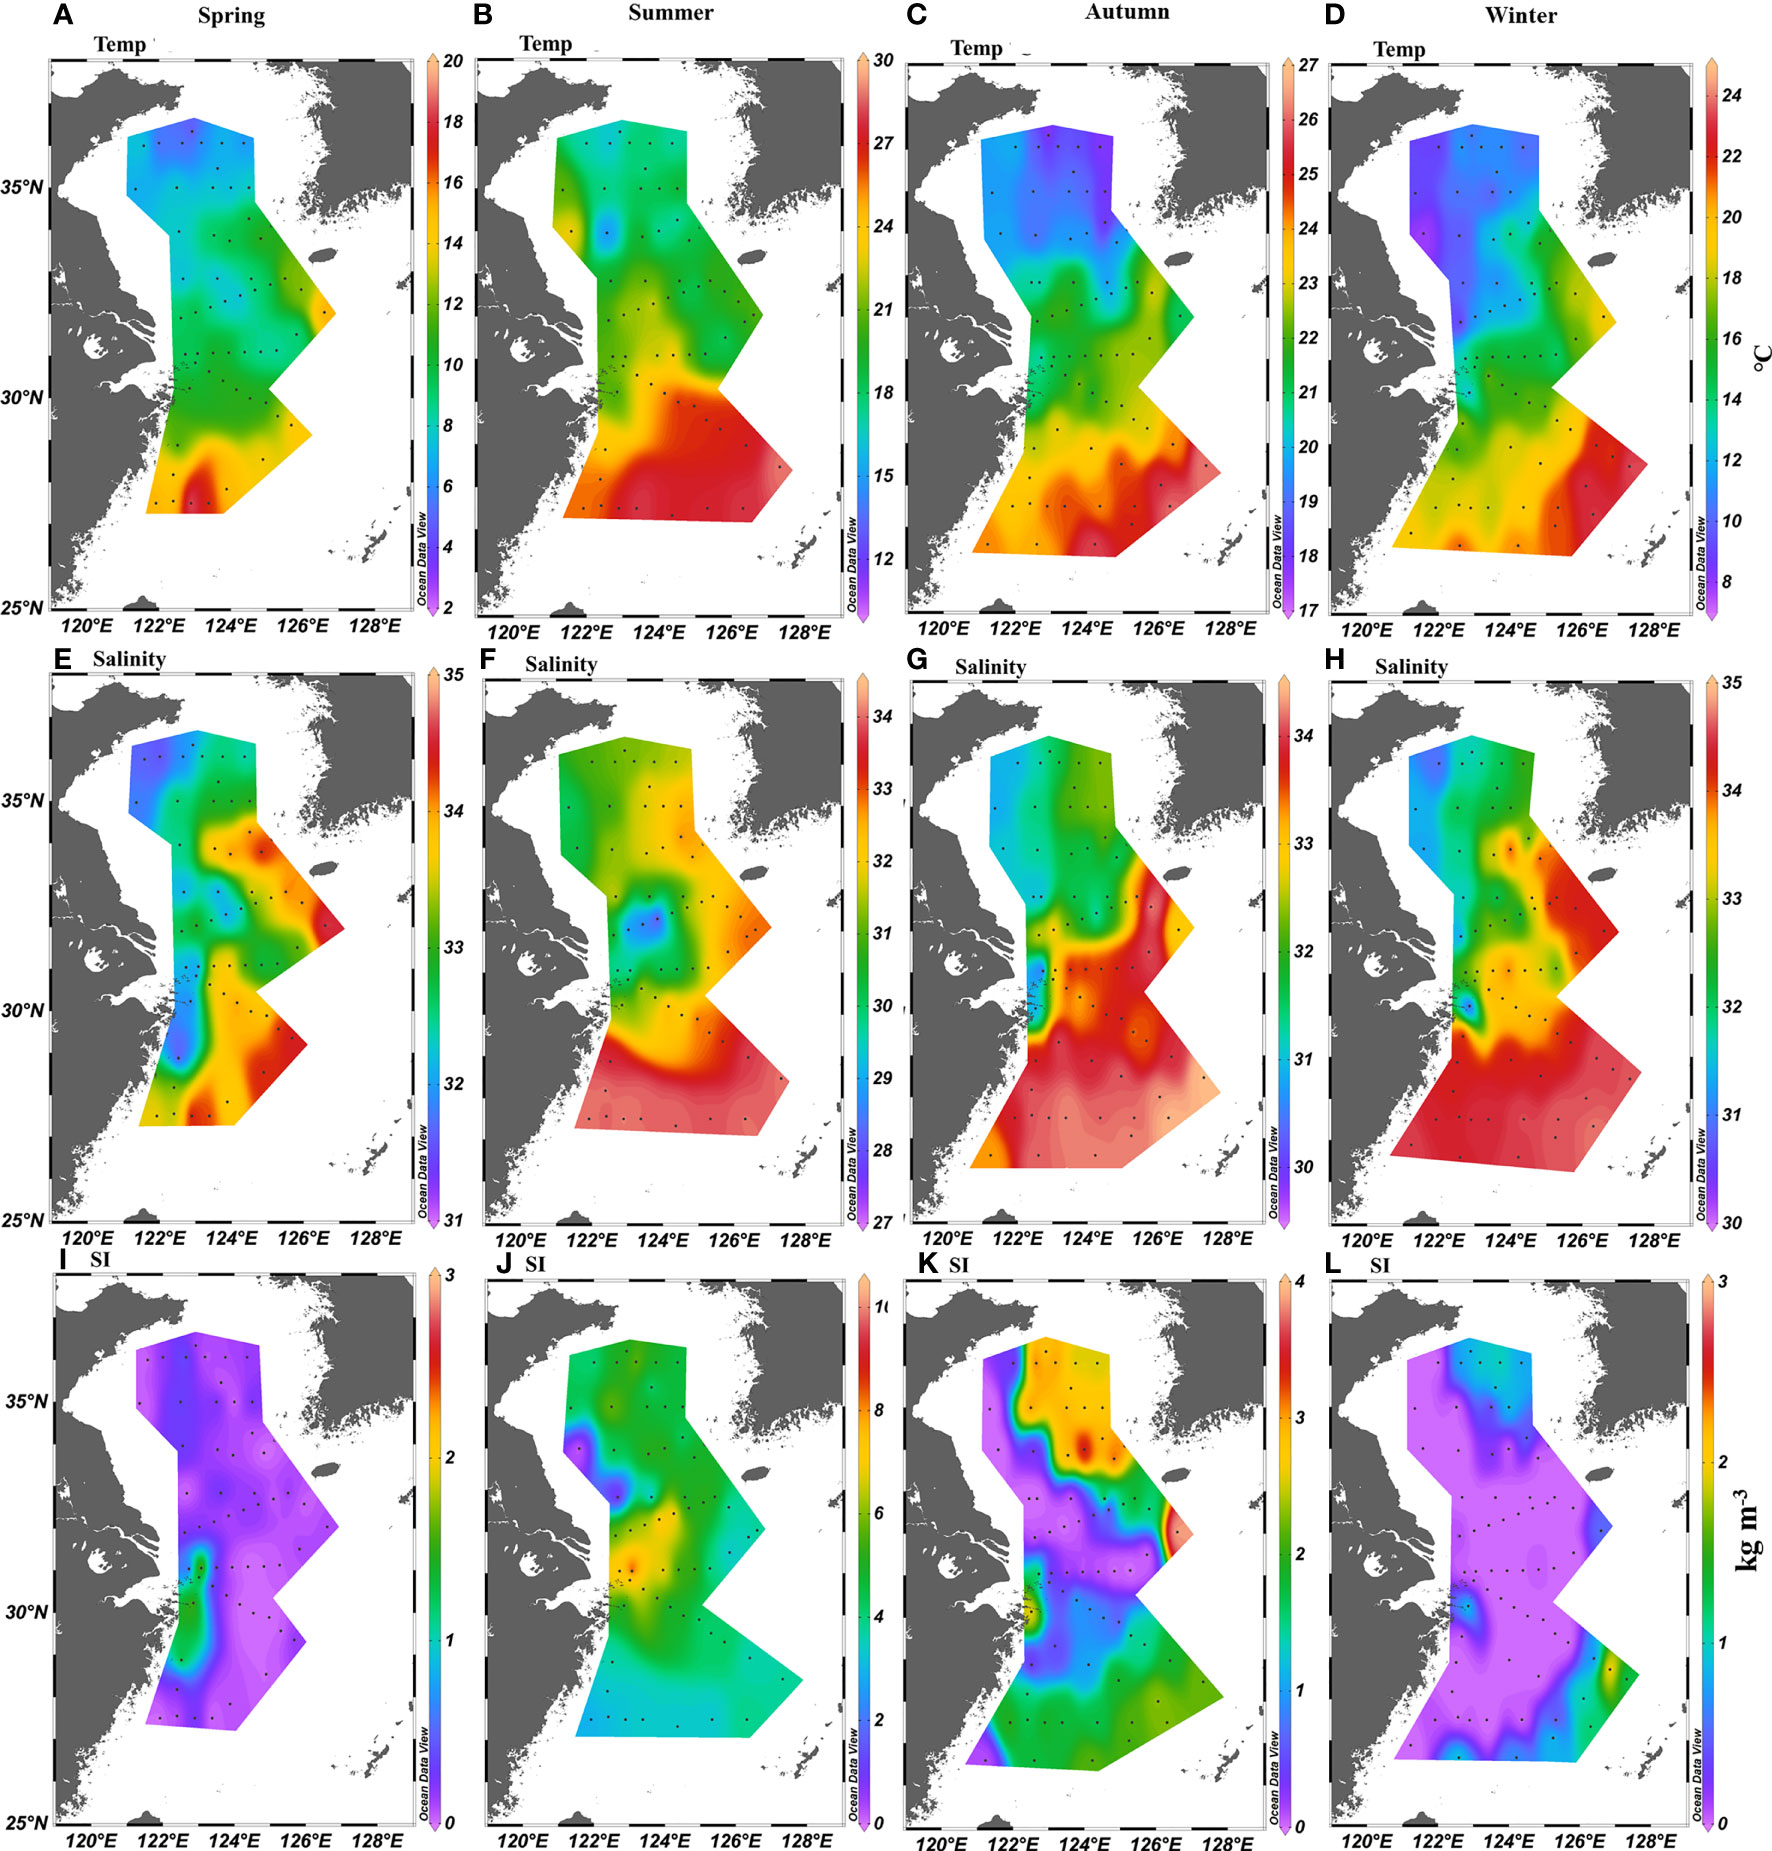
Figure 2 Distribution of depth-average (A–D) temperature (°C) and (E–H) salinity in the upper 30-m water column, and (I–L) stratification index (kg m-3) in the East China Sea and southern Yellow Sea.
Phytoplankton Biomass
The phytoplankton biomass in the ECS and SYS varied significantly (p < 0.01) among the seasons. The Cd values of Chl-a concentration and phytoplankton abundance were the highest in summer and lowest in winter. In spring, phytoplankton biomass was high in the coastal waters (Figure 3). In summer and autumn, the phytoplankton biomass was high in the Zhejiang coastal waters and Changjiang Estuary controlled by the ECS Coastal Current, upwelling, and Changjiang Diluted Water. In winter, the phytoplankton biomass was high in the southeast part of the ECS controlled by the Kuroshio where nutrients and light were not restricted.
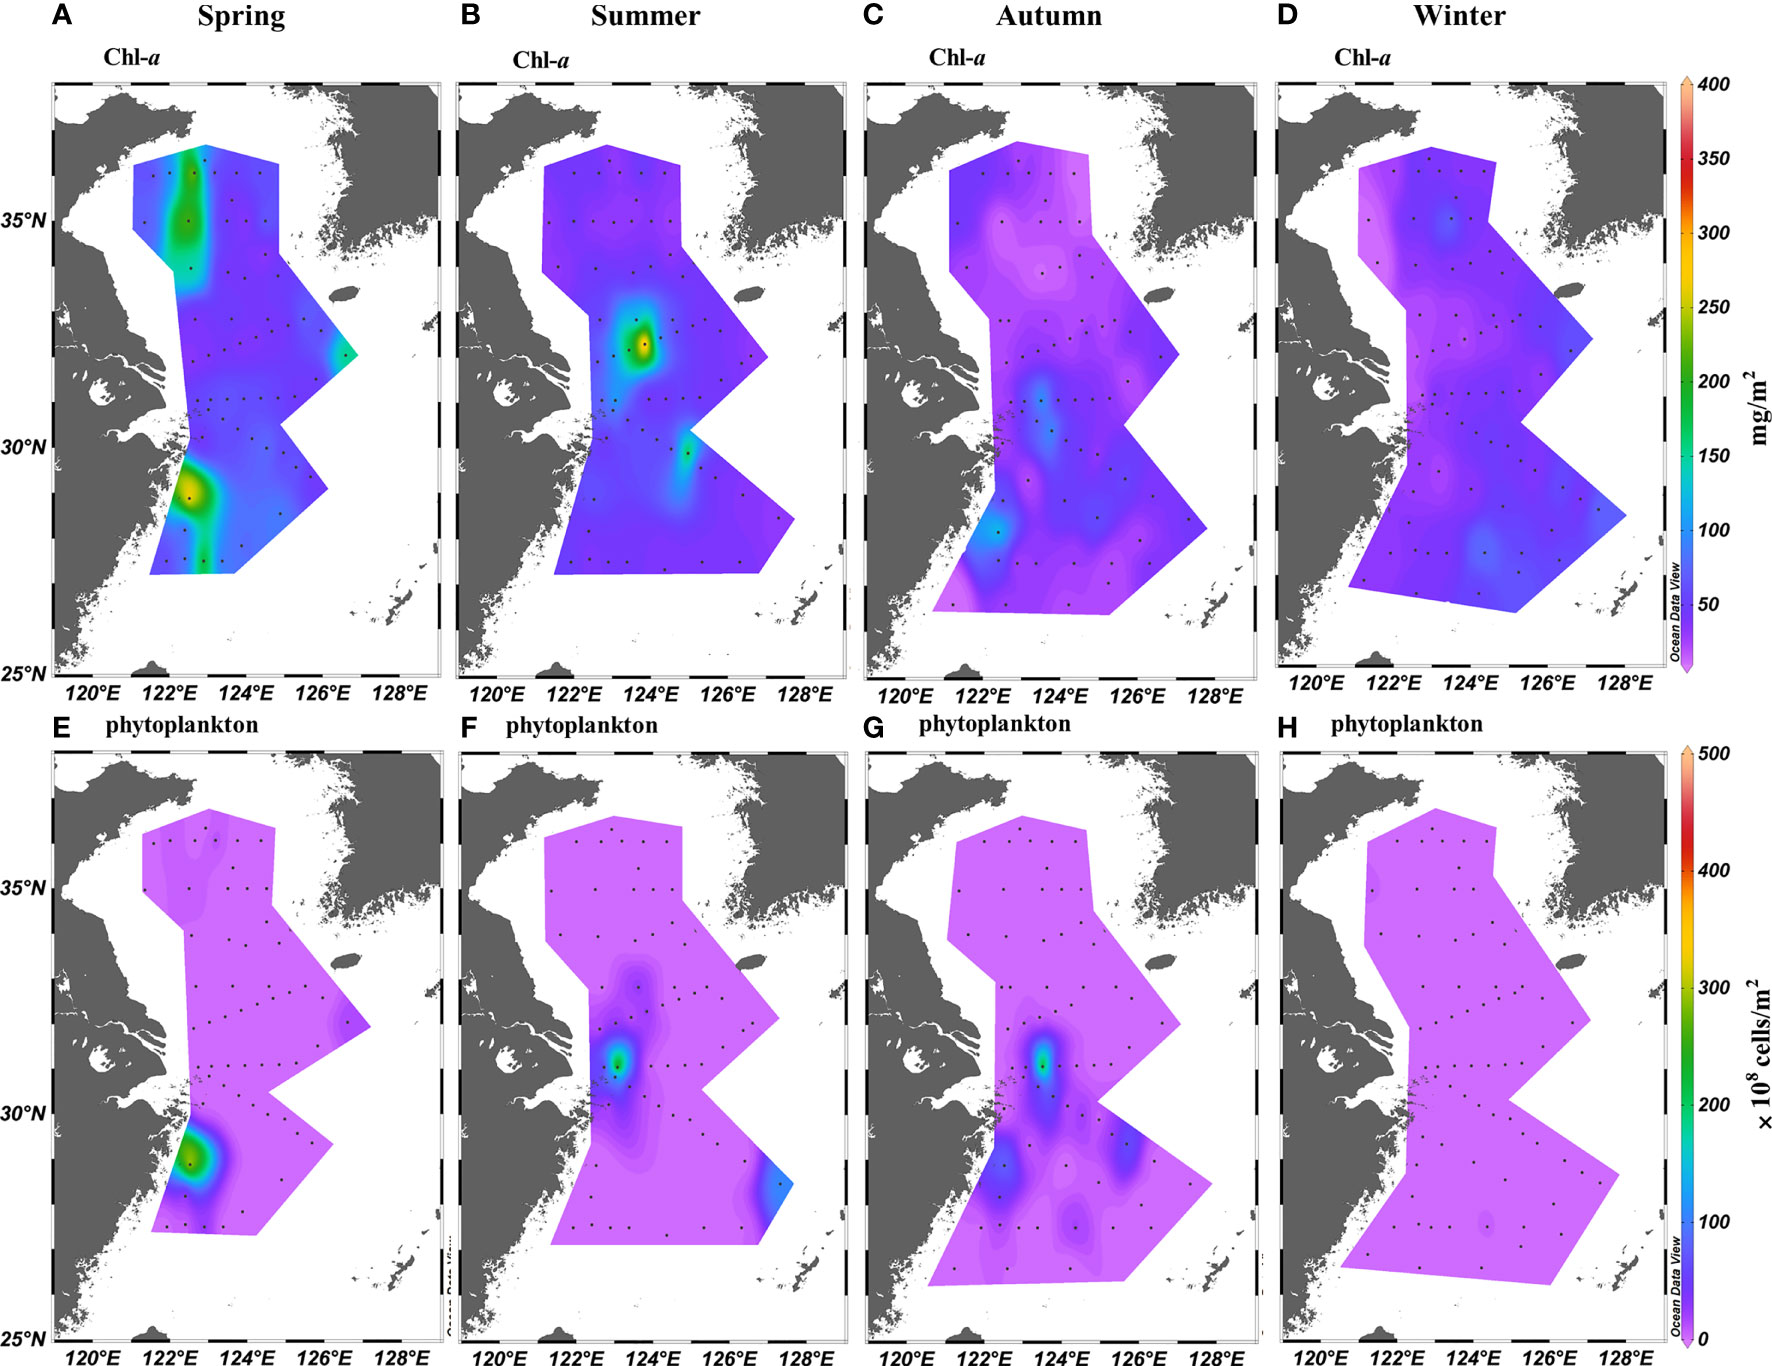
Figure 3 Distribution of (A–D) chlorophyll-a concentration (mg/m2) and (E–H) phytoplankton abundance (× 108 cells/m2) in the East China Sea and southern Yellow Sea.
N. Scintillans Abundance
The average Cd of the N. scintillans was the highest in summer, followed by autumn, spring, and winter in both the ECS and SYS (Table 2). Cd was higher in the SYS than in the ECS for all seasons except summer. High N. scintillans Cd (Figure 4) and Ct (Figure S1) were observed in coastal waters and the Changjiang Estuary during all seasons, which were controlled by the coastal current and Changjiang Diluted Water. Low N. scintillans Cd and Ct were observed in the offshore waters controlled by the Kuroshio and YS Cold Water Mass. Our data also revealed a significant correlation (p < 0.05) between the Cd and Ct of the N. scintillans in the ECS and SYS, and the corresponding slope (Figure S2) was higher in autumn (0.78) and winter (0.75) than in spring (0.62) and summer (0.64).
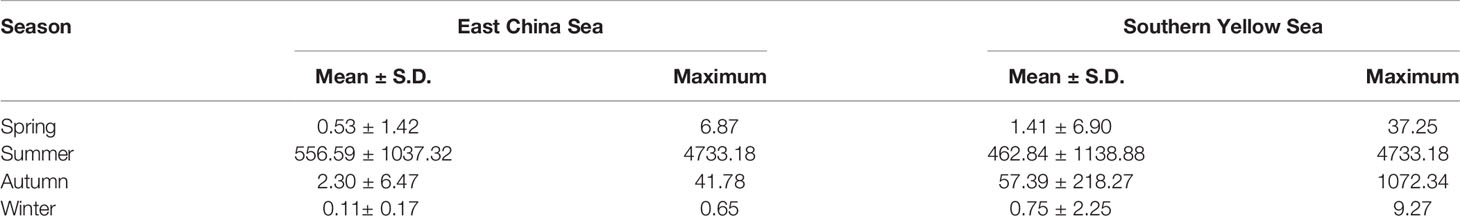
Table 2 The depth-integrated abundance (× 104 cells/m2) of N. scintillans using net-collection method in the East China Sea and southern Yellow Sea.
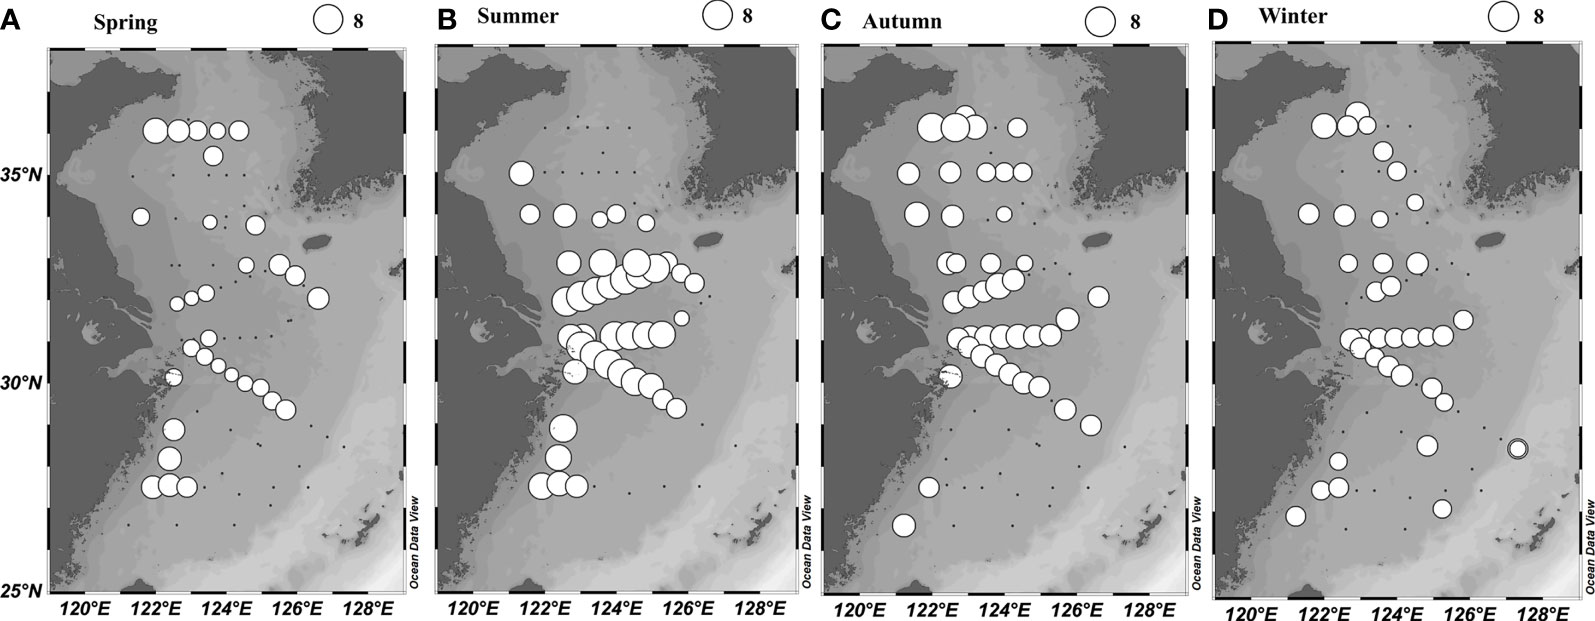
Figure 4 Horizontal distribution of log-transformed (Cd +1) of N. scintillans (cells/m2) in the East China Sea and southern Yellow Sea using net-collection method.
We observed an obvious difference between the density of N. scintillans at different depths along section P in all seasons (Figure 5). However, a high density of N. scintillans was generally observed in the upper 30-m water column. Notably, the highest abundance (5,314 cells/L) was observed in summer at a depth of 10 m at station T07 (upwelling water), which was characterized by abundant phytoplankton, high nutrient concentrations and salinity, and low temperatures (Figure S3). The highest Ct of N. scintillans in summer was also detected at this station (Figure S1).
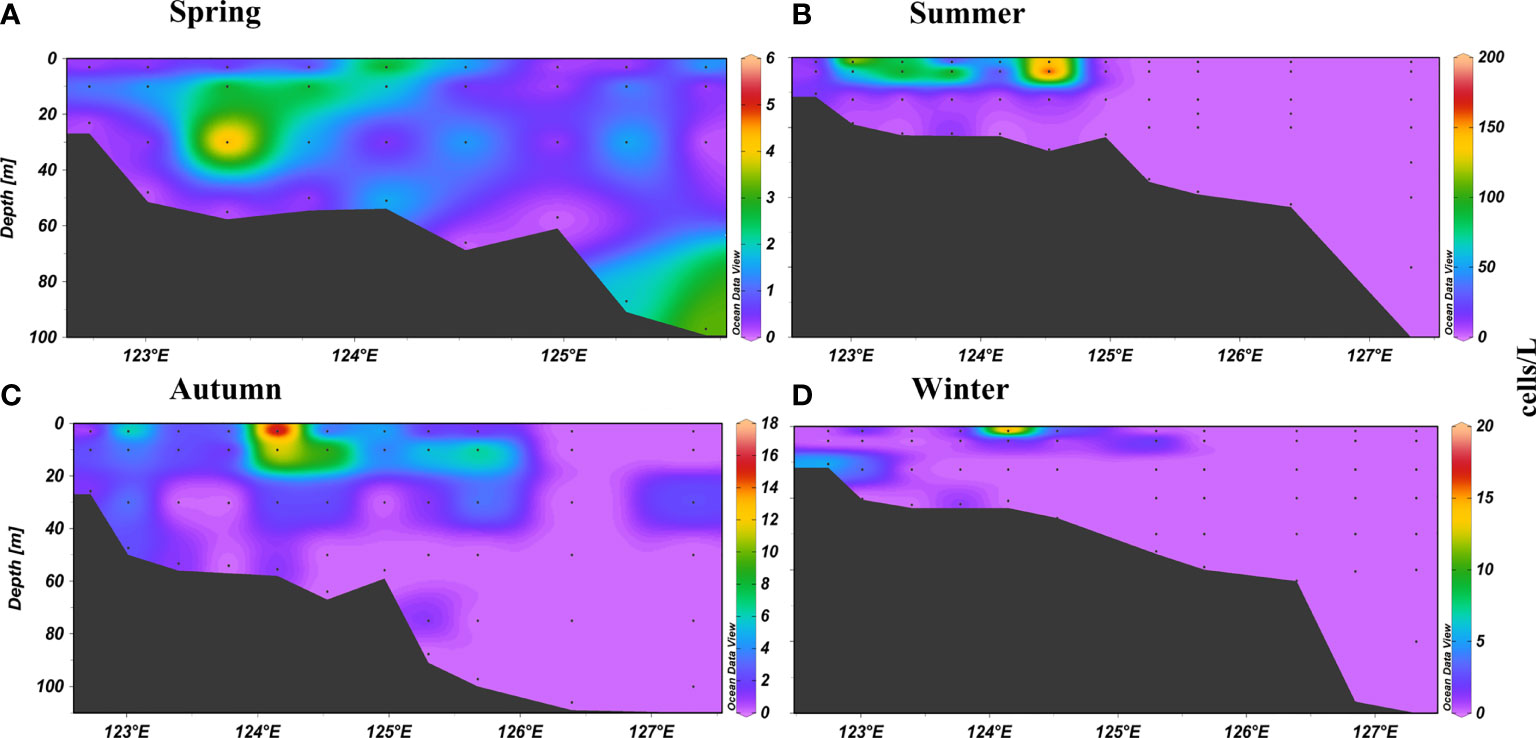
Figure 5 Vertical distribution of N. scintillans abundance (cells/L) along section P. (A) spring; (B) summer; (C) autumn; (D) winter.
Relationship Between N. Scintillans and Environmental Factors
The Spearman correlation demonstrated that the annual DIA of the N. scintillans in the upper 30-m water column was significantly (p < 0.05) and positively correlated with phytoplankton abundance, Chl-a concentration, temperature, and SI but significantly (p < 0.01) and negatively correlated with salinity (Table 3). Particularly in warm seasons (summer and autumn), the DIA of the N. scintillans was more significantly associated with phytoplankton abundance and Chl-a concentration than with temperature, salinity, and SI. Figure 6 reveals that N. scintillans was abundant in the coastal waters controlled by the low-salinity Changjiang Diluted Water and coastal current, particularly in the fronts. A low density of N. scintillans was observed in the Kuroshio, YS Cold Water Mass, and YS Warm Current.
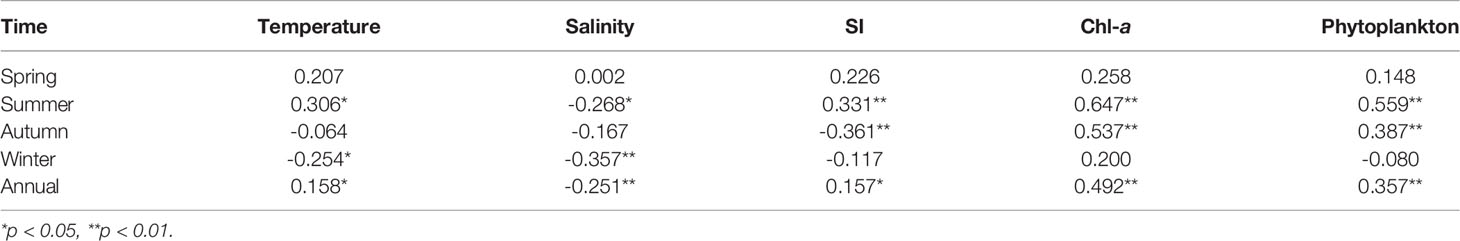
Table 3 Correlation coefficients (Spearman’s r) between the depth-integrated abundance of N.scintillans and environmental factors in the East China Sea and southern Yellow Sea.
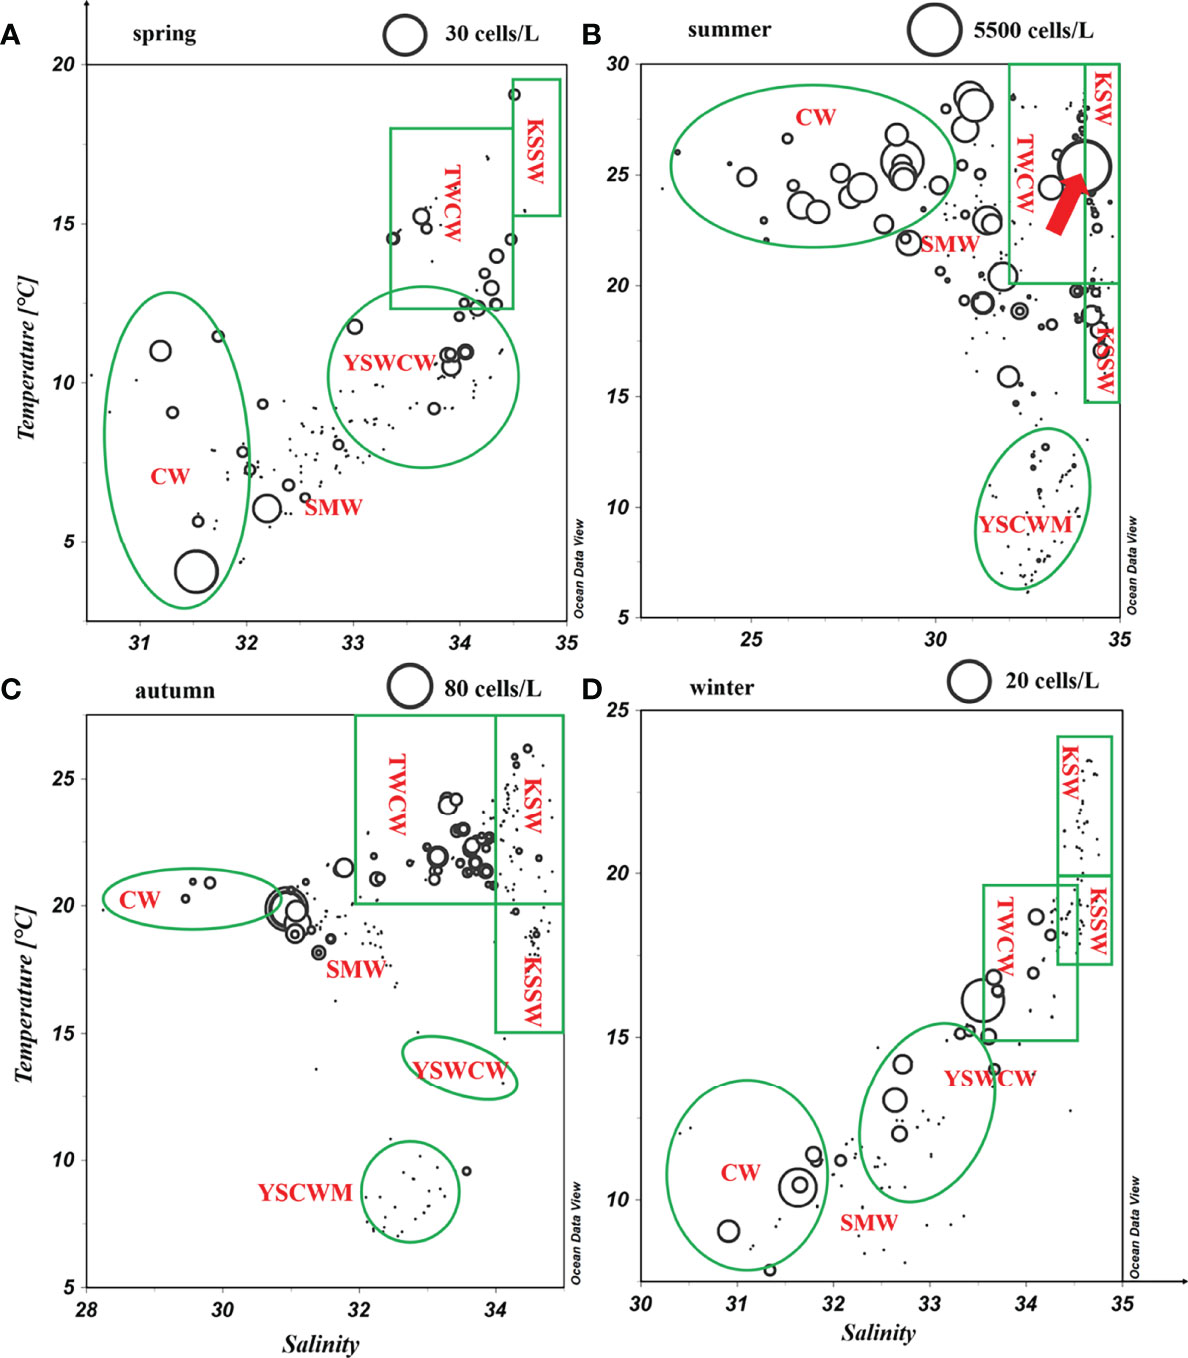
Figure 6 Diagram of N. scintillans abundance (cells/L) versus temperature–salinity (water masses) in the East China Sea and southern Yellow Sea. The arrow indicates a bloom of N. scintillans with abundance of 5314 cells/L at station T07. CW: including Changjiang Diluted Water, the ECS Coastal Water, and the SYS Coastal Water; YSWCW, Yellow Sea Warm Current Water; TWCW, Taiwan Warm Current Water; YSCWM, the deeper Yellow Sea Cold Water Mass; KSW, Kuroshio surface water; KSSW, Kuroshio subsurface water; SMW, shelf mixed water. (A) spring; (B) summer; (C) autumn; (D) winter.
All the established models are shown in Table S1, and the summary of the final optimal models is shown in Table 4. In summer, winter, and year-round models, the AIC value decreased with the increase of environmental factors. Therefore, the best model for summer had 5 factors, and the best model for the winter and full year had 4 factors (SI was not included in winter and full year because cumulative explained deviation was decreased after its adding). There were the two-factor (Temperature + SI) and one-factor (Chl-a) models in spring and autumn, respectively, with the smallest AIC values and the best fit. The results of the GAMs demonstrated that relative to temperature and salinity, Chl-a concentration explained more of the variation in the abundance of N. scintillans throughout the year. Table 4 and Figure 7 reveal that Chl-a concentration, salinity, temperature, and phytoplankton abundance explained 33.76% of the variation in N. scintillans abundance with the smallest AIC value. Among these environmental parameters, Chl-a concentration explained 25.07% (p < 0.01) of the aforementioned variation. The optimal GAM for the full year was expressed using the equation as follows:
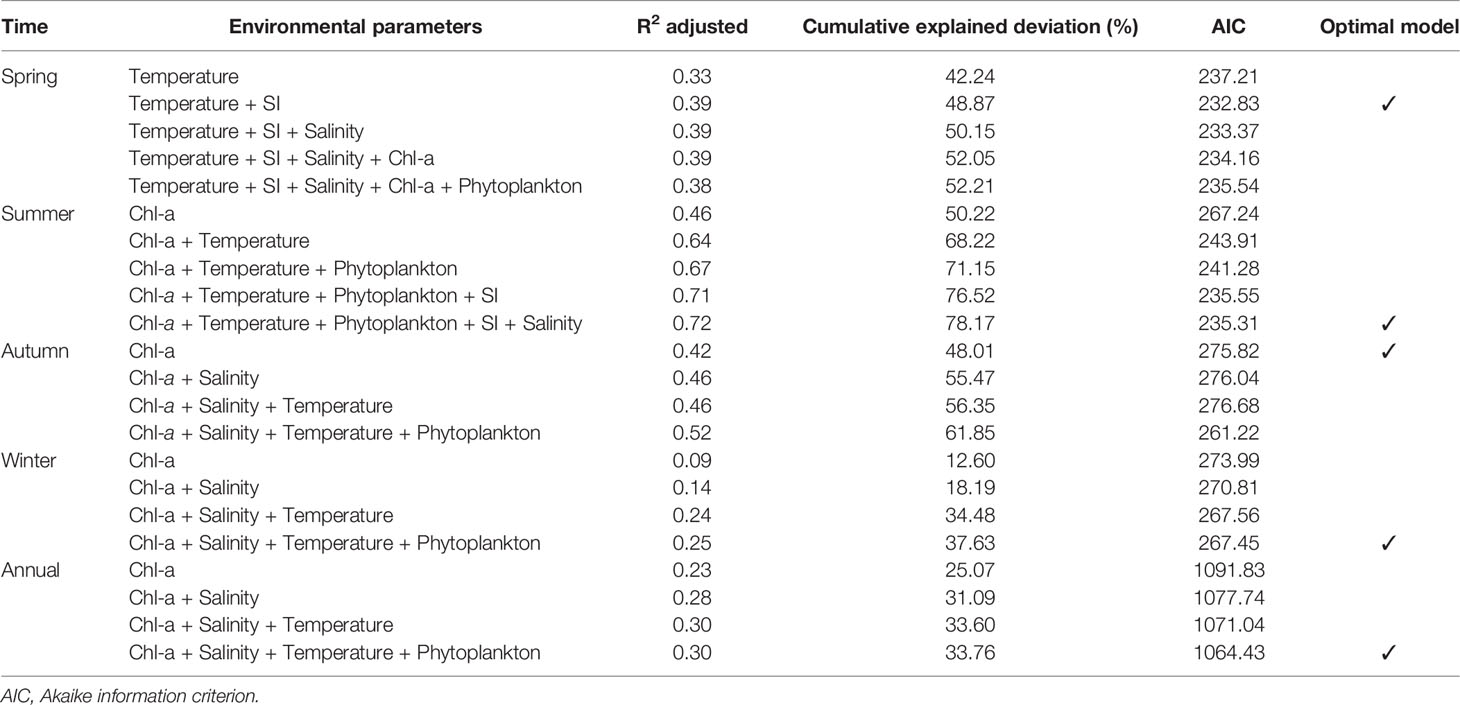
Table 4 Results of GAMs between N. scintillans abundance and environmental parameters.
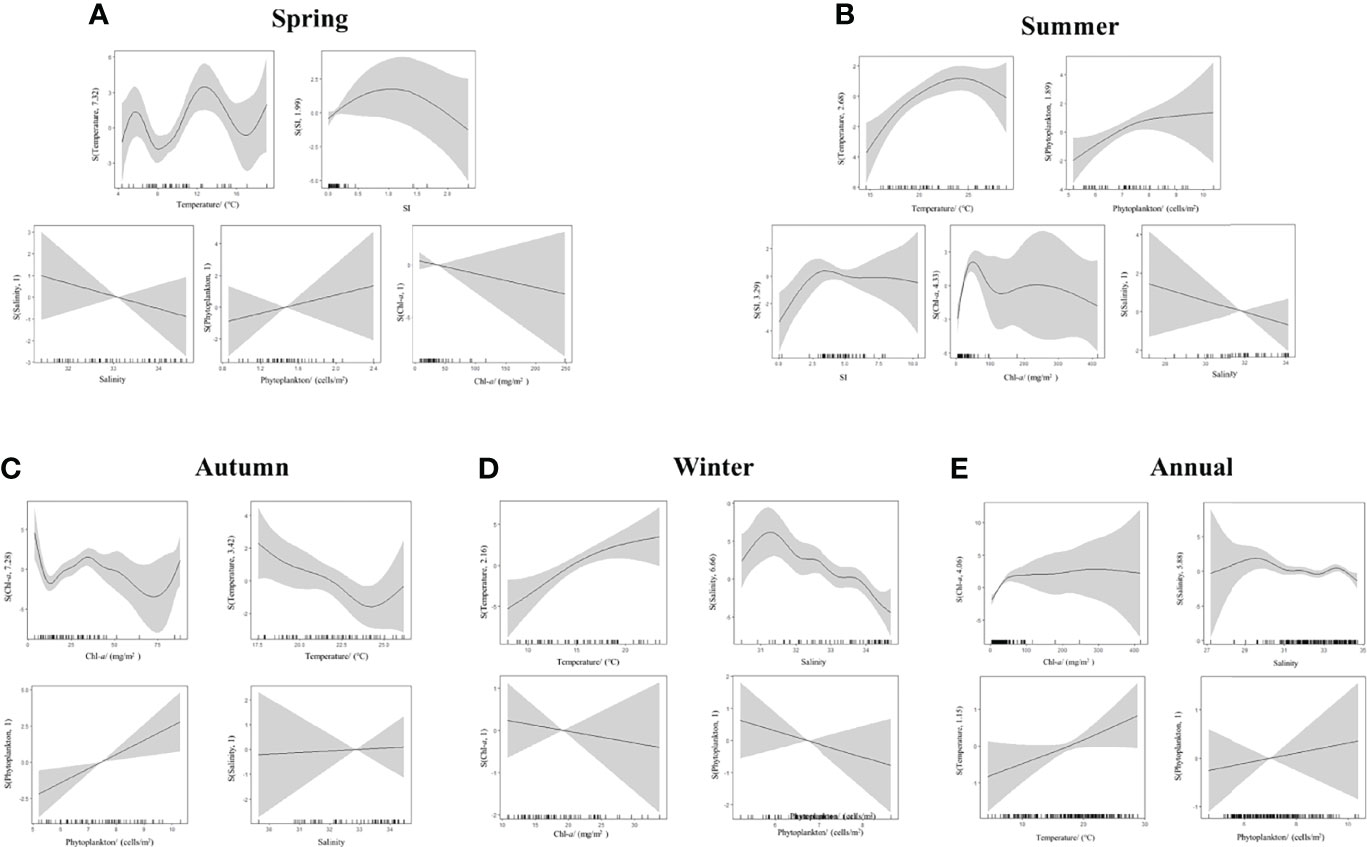
Figure 7 Results of GAMs for the relationship between N. scintillans abundance and environmental parameters.
In spring, temperature (42.24%) explained more of the variation in the abundance of N. scintillans relative to the other variables (9.97%). A multi-peak nonlinear relationship existed between temperature and N. scintillans abundance (Figure 7). The abundance of N. scintillans peaked at between approximately 6°C and 13°C. However, for the other seasons, Chl-a concentration explained more variation in the abundance of N. scintillans relative to the other variables (Table 4).
Discussion
Comparison of N. Scintillans Sampled Using Net-Collection and Water-Collection Methods
N. scintillans samples are usually collected using plankton nets (i.e., net-collection method) and bottles equipped with a CTD recorder (i.e., water-collection method) (Murray and Suthers, 1999; Zhang et al., 2016). The net-collection method collects N. scintillans from the entire water column through vertical towing from the bottom to the surface. Because the single cell of N. scintillans is large (diameter of 200–600 μm), the species of N. scintillans is not easy to be lost in net-collected samples. The water-collection method collects N. scintillans from discrete depths. We observed an obvious difference between the density of N. scintillans at different depths along section P in all seasons (Figure 5). The density of N. scintillans varied greatly in the water column (particularly in summer and autumn; Figure 5), the Ct was higher than Cd in winter and spring and vice versa in summer and autumn (Table 1). And the high density of N. scintillans was generally observed in the upper 30-m water column. Notably, the highest abundance (5,314 cells/L) was observed in summer at a depth of 10 m at station T07 (Figure S3). Once a water layer with very high or very low abundance is not collected, the depth-integrated abundance will be greatly affected. Therefore the net-collected method can more accurately reflect its abundance in the entire water column compared with the water-collected method. Jiang et al. (2020) found that the species number of phytoplankton in water samples was slightly less than that in net samples. However, this method can obtain its vertical distribution information. Studies have used both methods (Murray and Suthers, 1999; Jiang et al., 2018; Jiang et al., 2020); thus, we collected N. scintillans samples using these two methods.
Adaptability of N. Scintillans to Environmental Factors
Phytoplankton biomass seemed to be the most crucial factor in the regulation of the seasonal and spatial distribution of N. scintillans in the ECS and SYS. Chl-a had the highest correlation coefficient among all the environmental factors in all seasons except winter (Table 3). Moreover, the correlations between Chl-a concentration and N. scintillans abundance were much weaker in cold seasons (winter and spring) than in warm seasons. The phytoplankton abundance and Chl-a concentration were too low and evenly distributed across the entire ECS and SYS in winter (Figure 3), probably resulting in a low correlation coefficient between N. scintillans abundance and Chl-a concentration. GAMs confirmed that Chl-a concentration explained more variation in the abundance of N. scintillans than that of temperature and salinity throughout the year and in all seasons except spring (Table 4). The abundance of N. scintillans was relatively lower in spring than in warm seasons, which required less phytoplankton biomass and was largely influenced by temperature. In spring, diatom blooms (high Chl-a concentration and phytoplankton abundance) occurred in the western SYS (Jiang et al., 2019) and central Zhejiang coastal waters (Figure 3), being inconsistent with the high-abundance regions (southern waters of Shandong Peninsula and southern Zhejiang coastal waters) of N. scintillans (Figure 4). Under an increasingly eutrophic Changjiang Diluted Water, the density of phytoplankton increased and the Cd of N. scintillans was revealed to be significantly higher in summer and autumn than in winter and spring (Table 1). From spring to summer, the average Cd of phytoplankton increased from 760.21 × 10⁶ to 1,316.66 × 106 cells/m2, whereas the average Cdof N. scintillans increased from 1.06 × 10⁴ to 354.17 × 10⁴ cells/m2. This seasonal variation is consistent with other observations. For example, Sun et al. (2011) noted that the bimodal distribution of N. scintillans abundance throughout the year was consistent with the bimodal distribution of phytoplankton in Jiaozhou Bay. In addition, a correlation analysis demonstrated a significant relationship between Chl-a concentration and N. scintillans abundance in the northern Indian Ocean (Koochaknejad and Hamzei, 2022).
N. scintillans was distributed abundantly in coastal waters and the Changjiang Estuary, controlled by the eutrophic low-salinity Changjiang Diluted Water and coastal current (Figures 4 and 6), which were characterized by high levels of phytoplankton and Chl-a (Figure 3) and associated nutrients (data not shown). Figure 5 illustrates the higher abundance of N. scintillans in the upper 30-m water column, characterized by abundant phytoplankton. Table 3 verifies that the Ctof N. scintillans in the upper 30-m water column was significantly and positively correlated with phytoplankton abundance and Chl-a concentration in all seasons except winter, demonstrating that the density of N. scintillans in the ECS and SYS was highly associated with phytoplankton biomass. Hallegraeff et al. (2019) observed a higher abundance (even bloom) of N. scintillans in the coastal waters of Australia (because of abundant food sources) than in offshore waters. A long-term study in the German Gulf revealed that the spatial distribution of N. scintillans had the highest abundance near the coast, with a decreasing trend from the coast to the North Sea with decreasing food sources (Uhlig and Sahling, 1990).
N. scintillans in the ECS and SYS is a heterotrophic dinoflagellate (Harrison et al., 2011). Thus, food abundance (particularly phytoplankton) strongly influences its abundance. Zhang et al. (2020a) demonstrated that the community structure and nutrient conditions of food might influence the metabolism and bloom of the species of N. scintillans, and an experimental study verified that well-fed N. scintillans undergo rapid cell division, whereas starved cells stop dividing (Elbrächter and Qi, 1998). The proportion of individuals in binary fission of N. scintillans was significantly and positively correlated with Chl-a concentration, indicating that multiplication requires sufficient food (Tian et al., 2017). Therefore, food supply is a key factor shaping proliferation. N. scintillans can feed on microalgae, copepod eggs, fish eggs, and protozoa in a natural environment (Zhang et al., 2016). However, phytoplankton is considered to be its main food (Harrison et al., 2011), and its bloom is attributed to the increase in phytoplankton abundance. As shown in Figures 3 and 4, the high-abundance regions of N. scintillans were generally consistent with high-value waters of phytoplankton abundance and Chl-a concentration.
Temperature is generally considered to limit the distribution and bloom of N. scintillans. Red N. scintillans is distributed from temperate to tropical waters with temperature between 10°C and 30°C (Zhu et al., 2009; Kirchner et al., 2012). The optimal temperature for its growth ranges from 10°C; to 25°C; (Turkoglu, 2013; Gomes et al., 2014). Our results indicated that the Cd(359.89 × 10⁴ cells/m2) of N. scintillans in the ECS and SYS was substantially higher in summer (25.0°C; in average) than in other seasons (Table 1). However, N. scintillans bloomed with the highest density of up to 7.86 × 10⁷ cells/m2 in the Changjiang Estuary and Zhejiang coastal waters (Figures 2 and 4) with a temperature (> 25°C) above the optimum growth temperature, indicating that high temperature was not the limiting factors for the growth of N. scintillans. Field investigation and remote sensing data have revealed frequent blooms of N. scintillans in the Changjiang Estuary and adjacent waters in summer (Xu, 2009; Qi et al., 2019), and a Spearman correlation demonstrated that its density was positively correlated with temperature in spring and summer (Table 3). Notably, extremely high Cd of phytoplankton (11.36 × 10⁶ cells/m2) and Chl-a concentration (68.47 mg/m2) was observed in the Changjiang Estuary. We inferred that the promoting effect of phytoplankton on N. scintillans exceeded the limiting effect of high temperature. Although N. scintillans was negatively correlated with temperature in autumn and winter (Table 3), the explanation of Chl-a to variation in abundance of N. scintillans exceeded that of temperature (Table 4). Table 2 shows a higher abundance in the low-temperature SYS than in the high-temperature ECS in all seasons except summer (the hottest season). These results also supported our inference. Moreover, the annual abundance of N. scintillans was significantly and positively correlated with temperature. The low temperature (~4°C) in cold seasons did not limit distribution of N. scintillans in the ECS and SYS (Figure 7). Particularly in spring, temperature explained more variation in the abundance of N. scintillans than that of Chl-a concentration (Table 4). Our findings indicated a wide range of suitable temperatures (~4°C–30°C) and the high thermal adaptation of the species of N. scintillans. Therefore, temperature did not limit the distribution and bloom of N. scintillans in the ECS and SYS.
Notably, an extremely high N. scintillans abundance (particularly blooming at station T07) was observed in the Zhejiang coastal upwelling in summer caused by the strong intrusion of the deeper Taiwan Warm Current (Figures S1 and S3). Similarly, upwelling along the coast of China promoted the growth of phytoplankton, triggering a N. scintillans bloom (Zhang et al., 2020b). Dela-Cruz et al. (2008) also observed that N. scintillans was abundant in the mature upwelled waters in Australia. Figure S1 depicts a higher abundance of N. scintillans in the upper 20-m water column, characterized by relatively high Chl-a concentration. Moreover, our results revealed that the temperature (> 25°C;) was substantially higher in the upper 20 m than at other discrete depths beyond the optimal temperature for its growth. These findings therefore confirm that the abundance of N. scintillans in the ECS and SYS in warm seasons is largely regulated by phytoplankton biomass rather than temperature.
In addition, our results demonstrated that salinity did not limit the distribution of N. scintillans across the entire ECS and SYS. It was abundant in all seasons in the Changjiang Estuary and southern waters of the Shandong Peninsula, controlled by the low-salinity eutrophic Changjiang Diluted Water and coastal current (Figures 2 and 4). Because coastal low salinity is generally associated with high nutrient concentrations and the consequent abundant phytoplankton, the Cd of N. scintillans was negatively correlated with salinity in all seasons except spring. Figures 4 and 6 verify that the species of N. scintillans was occasionally abundant in the high-salinity offshore waters controlled by the Taiwan Warm Current and Kuroshio. This observation is consistent with the remote sensing data revealing that N. scintillans blooms in the offshore saline waters of the ECS to at least 126°E (Qi et al., 2019). Several studies have also noted no marked relationship between N. scintillans abundance and salinity (Tada et al., 2004; Nasution et al., 2021). Our findings indicated that the abundance of N. scintillans in the ECS and SYS was largely shaped by phytoplankton rather than salinity.
Long-Term Changes in N. Scintillans Abundance
We collected historical data of N. scintillans abundance in the Changjiang Estuary using the net-collection method (Table 5). The abundance of N. scintillans in 2011 was considerably higher than that in earlier studies in all seasons except spring in 1959 and 2002. However, the annual average abundance increased sharply from 1.42 cells/m3 in 1959 to 1,466.60 cells/m3 in 2002, and then to 38,365.41 cells/m3 in 2011. Similarly, Wang et al. (2012) noted that N. scintillans abundance in the northern South China Sea in 2006–2008 was 27 times higher than that recorded in 1959. In the Adriatic Sea, N. scintillans bloomed as a result of eutrophication in the 1970s, but it did not bloom in the 1990s because of reduced eutrophication (Fonda-Umani et al., 2004). This increasing abundance of N. scintillans feeds on a larger number of phytoplankton and small protozoa (Hattori, 1962; Zhang et al., 2016), which may profoundly influence the planktonic food web and biogeochemical processes (e.g., primary production and carbon transfer) in the Changjiang Estuary, ECS, and SYS.

Table 5 Comparison of the net-collected abundance of N. scintillans (cells/m3) in different years in the Changjiang Estuary (28°00’–32°00’N, 122°00’–123°30’E).
We inferred that the increasing trend in N. scintillans abundance in the Changjiang Estuary was largely attributed to the increase in phytoplankton abundance. Severe eutrophication fuels the growth of phytoplankton and frequent algal blooms in the Changjiang Estuary (Jiang et al., 2014; Wei et al., 2021). The extensive use of chemical fertilizers and discharge of industrial wastewater and domestic sewage increases N and P loads from the Changjiang (Cui et al., 2020). During the past 50 years, phytoplankton abundance and Chl-a concentration in the Changjiang Estuary have increased significantly with increasing eutrophication (Jiang et al., 2014; Chen et al., 2020). For example, the summer net-collected phytoplankton abundance in the Changjiang Estuary (28.0−32.0°N, 122.0−123.5°E) increased from 12.0 cells/mL in 1959 to 39.4 cells/mL in 2002 and then to 65.7 cells/mL in 2011. Furthermore, light penetration has enhanced and consequently promoted primary production in the Changjiang Estuary since the interception of a large amount of sediment by the Three Gorges Dam in 2003. Yang et al. (2007) calculated that the construction of the Three Gorges Dam decreased the sediment input into the estuary by 31% between 2003 and 2005. Therefore, the severe light limitation in the Changjiang Estuary was reduced, which fueled the growth and bloom of phytoplankton as a result of deteriorated eutrophication (Chen, 2003; Chen et al., 2020).
Warming is probably another reason for the increase in the abundance of N. scintillans. Because of accelerated warming and the strengthening of the Taiwan Warm Current transport (Tang et al., 2009), the summer sea temperature of the Changjiang Estuary increased significantly (by 1.31°C; with a rate of 0.49°C;/decade) from 1982 to 2009 (Jiang et al., 2014). The increase in temperature also resulted in an enhanced stratification, which facilitated the growth of dinoflagellates with a motional ability (Guo et al., 2014; Xiang et al., 2019). Our results verify that the annual abundance of N. scintillans was significantly and positively correlated with the SI in the ECS and SYS (Table 3). Tada et al. (2004) revealed that from late spring to early summer, the stability of water bodies leads to an increase in N. scintillans populations on the surface. N. scintillans can obtain more food sources through vertical migration (Xiang et al., 2019).
Conclusions
We first compared the abundance of N. scintillans using water-collection and net-collection methods during large-scale surveys in China’s marginal seas. Our results suggest that the DIA of the species of N. scintillans varied between net-collected and water-collected samples, but a significant correlation between the Cd and Ct of N. scintillans was revealed in the ECS and SYS. The present study provides high spatial resolution data sets of N. scintillans in the ECS and SYS and verifies our hypothesis that its seasonal and spatial distribution would be largely regulated by phytoplankton biomass rather than temperature and salinity throughout the year. Particularly in warm seasons when the abundance of N. scintillans increased, its abundance was highly associated with Chl-a concentration and phytoplankton abundance. However, temperature explained more variation in the abundance of N. scintillans than other Chl-a concentration in winter. N. scintillans was abundant in the Changjiang Estuary and southern waters of the Shandong Peninsula, controlled by the eutrophic Changjiang Diluted Water and coastal current with high phytoplankton abundance and Chl-a concentration. In addition, N. scintillans is prone to bloom in Zhejiang coastal upwelling waters, characterized by abundant nutrients and phytoplankton. Since 1959, the abundance of N. scintillans in the Changjiang Estuary has increased sharply with the increasing phytoplankton density resulting from accelerated eutrophication and warming. These findings identified the distribution pattern, controlling factors, red-tide formation mechanism, and long-term change of N. scintillans in the ECS and SYS, which improves our understanding of its regional population succession and ecological function.
Data Availability Statement
The original contributions presented in the study are included in the article/Supplementary Material. Further inquiries can be directed to the corresponding authors.
Author Contributions
LS: Writing-original draft preparation and data curation. ZJ: Conceptualization, reviewing and editing. ZS: Visualization. HZ: Investigation. LD: Data processing. MT: Data curation. JC: Data curation and funding acquisition. QC: Funding acquisition. JZ: Funding acquisition, reviewing and editing. All authors contributed to the article and approved the submitted version.
Conflict of Interest
The authors declare that the research was conducted in the absence of any commercial or financial relationships that could be construed as a potential conflict of interest.
Publisher’s Note
All claims expressed in this article are solely those of the authors and do not necessarily represent those of their affiliated organizations, or those of the publisher, the editors and the reviewers. Any product that may be evaluated in this article, or claim that may be made by its manufacturer, is not guaranteed or endorsed by the publisher.
Acknowledgments
We are grateful to Professor Wensheng Jiang for providing the physical data. We also thank Wallace for editing. This work was funded by the National Key Research and Development Program of China (2021YFC3101702), Key R&D Program of Zhejiang (2022C03044), NSFC‐Zhejiang Joint Fund for the Integration of Industrialization and Informatization (U1709201), National Basic Research Program of China (2010CB428903), National Programme on Global Change and Air-Sea Interaction (Phase II)—Hypoxia and Acidification Monitoring and Warning Project in the Changjiang Estuary, and Longterm Observation and Research Plan in the Changjiang Estuary and Adjacent East China Sea Project (LORCE) (SZ2001).
Supplementary Material
The Supplementary Material for this article can be found online at: https://www.frontiersin.org/articles/10.3389/fmars.2022.899334/full#supplementary-material
References
Ara K., Nakamura S., Takahashi R., Shiomoto A., Hiromi J. (2013). Seasonal Variability of the Red Tide-Forming Heterotrophic Dinoflagellate Noctiluca Scintillans in the Neritic Area of Sagami Bay, Japan: Its Role in the Nutrient-Environment and Aquatic Ecosystem. Plankton. Benthos. Res. 8 (1), 9–30. doi: 10.3800/pbr.8.9
Chen C. (2003). Physical-Biological Sources for Dense Algal Blooms Near the Changjiang River. Geophys. Res. Lett. 30 (10), 1515–1518. doi: 10.1029/2002GL016391
Chen C. T. A. (2009). Chemical and Physical Fronts in the Bohai, Yellow and East China Seas. J. Mar. Syst. 78 (3), 394–410. doi: 10.1016/j.jmarsys.2008.11.016
Chen J. F., Li D. W., Jin H. Y., Jiang Z. B., Wang B., Wu B., et al. (2020). “Changing Nutrients, Oxygen and Phytoplankton in the East China Sea,” in Changing Asia-Pacific Marginal Seas (Singapore: Springer), 155–178.
Cui M., Guo Q., Wei R., Chen T. (2020). Temporal-Spatial Dynamics of Anthropogenic Nitrogen Inputs and Hotspots in a Large River Basin. Chemosphere 269, 1–36. doi: 10.1016/j.chemosphere.2020.129411
Dela-Cruz J., Middleton J. H., Suthers I. M. (2003). Population Growth and Transport of the Red Tide Dinoflagellate, Noctiluca Scintillans, in the Coastal Waters Off Sydney, Australia, Using Cell Diameter as a Tracer. Limnol. Oceanogr. 48, 656–674. doi: 10.2307/3096569
Dela-Cruz J., Middleton J. H., Suthers I. M. (2008). The Influence of Upwelling, Coastal Currents and Water Temperature on the Distribution of the Red Tide Dinoflagellate, Noctiluca Scintillans, Along the East Coast of Australia. Hydrobiologia 598, 59–75. doi: 10.1007/s10750-007-9140-z
Elbrächter M., Qi Z. (1998). Aspects of Noctiluca (Dinophyceae) Population Dynamics (Berlin: Springer-Verlag).
Enomoto Y. (1956). On the Occurrence and the Food of Noctiluca Scintillans (Macartney) in the Waters Adjacent to the West Coast of Kyushu, With Special Reference to the Possibility of the Damage Caused to the Fish Eggs by That Plankton. NipSuisan Gakk. 22, 82–88. doi: 10.2331/suisan.22.82
Fonda-Umani S., Beran A., Parlato S., Virgilio D., Zollet T., De Olazabal A., et al. (2004). Noctiluca Scintillans Macartney in the Northern Adriatic Sea: Long-Term Dynamics, Relationships With Temperature and Eutrophication, and Role in the Food Web. J. Plankton. Res. 26 (5), 545–561. doi: 10.1023/B:INET.0000038409.50723.3b
Gomes H. D. R., Goes J. I., Matondkar S. G. P., Buskey E. J., Basu S., Parab S., et al. (2014). Massive Outbreaks of Noctiluca Scintillans Blooms in the Arabian Sea Due to Spread of Hypoxia. Nat. Commun. 5, 4862–4868. doi: 10.1038/ncomms5862
Guo S. J., Feng Y. Y., Wang L., Dai M. H., Liu Z. L., Bai Y., et al. (2014). Seasonal Variation in the Phytoplankton Community of a Continental-Shelf Sea:the East China Sea. Mar. Ecol-Prog. Ser. 516, 103–126. doi: 10.3354/meps10952
Hallegraeff G. M., Albinsson M. E., Dowdney J., Holmes A. K., Mansour M. P., Seger A. (2019). Prey Preference, Environmental Tolerances and Ichthyotoxicity by the Red-Tide Dinoflagellate Noctiluca Scintillans Cultured From Tasmanian Waters. J. Plankton. Res. 41 (4), 407–418. doi: 10.1093/plankt/fbz037
Harrison P. J., Furuya K., Glibert P. M., Xu J., Liu H. B., Yin K., et al. (2011). Geographical Distribution of Red and Green Noctiluca Scintillans. Chin. J. Oceanol. Limn. 29, 807–831. doi: 10.1007/s00343-011-0510-z
Hattori S. (1962). Predatory Activity of Noctiluca on Anchovy Eggs. Bull. Tokai. Reg. Fish. Res. Lab. 9, 211–220. doi: 10.1016/0011-7471(63)90076-7
Jiang Z. B., Chen J. F., Gao Y. X., Zhai H. C., Jin H. Y., Zhou F., et al. (2019). Regulation of Spatial Changes in Phytoplankton Community by Water Column Stability and Nutrients in the Southern Yellow Sea. J. Geophys. Res-Biogeo. 124 (8), 2610–2627. doi: 10.1029/2018JG004785
Jiang Z. B., Chen J. F., Zhou F., Shou L., Chen Q. Z., Tao B. Y., et al. (2015). Controlling Factors of Summer Phytoplankton Community in the Changjiang (Yangtze River) Estuary and Adjacent East China Sea Shelf. Cont. Shelf. Res. 101 (15), 71–84. doi: 10.1016/j.csr.2015.04.009
Jiang Z. B., Liu J. J., Chen J. F., Chen Q. Z., Yan X. J., Xuan J. L., et al. (2014). Responses of Summer Phytoplankton Community to Drastic Environmental Changes in the Changjiang (Yangtze River) Estuary During the Past 50 Years. Water Res. 54 (1), 1–11. doi: 10.1016/j.watres.2014.01.032
Jiang Z. B., Liu J. J., Zhu X. Y., Chen Y., Chen Q. Z., Chen J. F. (2020). Quantitative Comparison of Phytoplankton Community Sampled Using Net and Water Collection Methods in the Southern Yellow Sea. Reg. Stud. Mar. Sci. 35, 1–10. doi: 10.1016/j.rsma.2020.101250
Jiang Z. B., Li H. L., Zhai H. C., Zhou F., Chen Q. Z., Chen J. F., et al. (2018). Seasonal and Spatial Changes in Trichodesmium Associated With Physicochemical Properties in East China Sea and Southern Yellow Sea. J. Geophys. Res-Biogeo. 123, 509–530. doi: 10.1002/2017JG004275
Kirchner M., Sahling G., Uhlig G., Gunkel W., Klings K. W. (2012). Does the Red Tide-Forming Dinoflagellate Noctiluca Scintillans Feed on Bacteria? Sarsia 81 (1), 45–55. doi: 10.1080/00364827.1996.10413610
Koochaknejad E., Hamzei S. (2022). Distribution of Winter Blooms of Noctiluca Scintillans in the Strait of Hormuz (Case Study Based on the Results of Offshore Patrol of the Oceanographic Research Institute in Winter 2017). J. Oceanogr. 12 (48), 67–78. doi: 10.52547/joc.12.48.57
Liblik T., Wu Y., Fan D. D., Shang D. H. (2020). Wind-Driven Stratification Patterns and Dissolved Oxygen Depletion Off the Changjiang (Yangtze) Estuary. Biogeosciences 17 (10), 2875–2895. doi: 10.5194/bg-17-2875-2020
Murray S., Suthers I. M. (1999). Population Ecology of Noctiluca Scintillans Macartney, a Red-Tide-Forming Dinoflagellate. Brit. J. Pharmacol. 117 (3), 1277–1285. doi: 10.1071/MF98052
Nasution A. K., Takarina N. D., Thoha H. (2021). The Presence and Abundance of Harmful Dinoflagellate Algae Related to Water Quality in Jakarta Bay, Indonesia. Biodiver. J. Biol. Diversity 22 (5), 2909–2917. doi: 10.13057/biodiv/d220556
Qi L., Tsai S. F., Chen Y. L., Le C. F., Hu C. M. (2019). In Search of Red Noctiluca Scintillans Blooms in the East China Sea. Geophys. Res. Lett. 46 (11), 5997–6004. doi: 10.1029/2019GL082667
Quan Q., Mao X. Y., Yang X. D., Hu Y. Y., Zhang H. Y., Jiang W. S. (2013). Seasonal Variations of Several Main Water Masses in the Southern Yellow Sea and East China Sea in 2011. J. Ocean. U. China 12 (4), 524–536. doi: 10.1007/s11802-013-2198-5
Sathish T., Thomas L. C., Padmakumar K. B. (2020). Vegetative and Sexual Reproduction of Bloom-Forming Dinoflagellate Noctiluca Scintillans (Ehrenberg) McCartney From Tropical Cochin Estuary (Southwest Coast of India): In-Situ and Laboratory Studies. Thalassas 37 (1), 1–7. doi: 10.1007/s41208-020-00247-3
Smitha B. R., Sanjeevan V. N., Padmakumar K. B., Hussain M. S., Salini T. C., Lix J. K. (2022). Role of Mesoscale Eddies in the Sustenance of High Biological Productivity in North Eastern Arabian Sea During the Winter-Spring Transition Period. Sci. Total. Environ. 809 (25), 2022. doi: 10.1016/j.scitotenv.2021.151173
Song S. Q., Li C. W., Sun J. (2016). Progress on Studies of Sexual Reproduction in Noctiluca Scintillans. Acta Ecologica. Sin. 36 (9), 2451–2459. doi: 10.5846/stxb201312212994
Sriwoon R., Pholpunthin P., Lirdwitayaprasit T., Kishino M., Furuya K. (2010). Population Dynamics of Green Noctiluca Scintillans (Dinophyceae) Associated With the Monsoon Cycle in the Upper Gulf of Thailand. J. Phycol. 44 (3), 605–615. doi: 10.1111/j.1529-8817.2008.00516.x
Sun X. X., Sun S., Wu Y. L., Zhang Y. S., Zhen S. (2011). Long-Term Changes of Phytoplankton Community Structure in the Jiaozhou Bay. Oceanol. Et. Limnol. Sin. 42 (5), 639–646. doi: 10.11693/hyhz201105003003
Tada K., Pithakpol S., Montani S. (2004). Seasonal Variation in the Abundance of Noctiluca Scintillans in the Seto Inland Sea, Japan. Plankton. Biol. Ecol. 51 (1), 7–14. doi: 10.1093/plankt/22.6.1203
Tang X. H., Wang F., Chen Y. L., Li M. K. (2009). Warming Trend in Northern East China Sea in Recent Four Decades. Chin. J. Oceanol. Limn. 27 (2), 185–191. doi: 10.1007/s00343-008-0238-6
Tian D. W., Song S. Q., Chen T. T., Li Z., Liu Y., Liang J. H., et al. (2017). Noctiluca Scintillans Blooming in the Jiaozhou Bay: Population Dynamics and Ecological Mechanism. Oceanol. Et. Limnol. Sin. 48 (2), 9. doi: 10.11693/hyhz20161000218
Tseng L. C., Kumar R., Chen Q. C., Hwang J. S. (2011). Summer Distribution of Noctiluca Scintillans and Mesozooplankton in the Western and Southern East China Sea Prior to the Three Gorges Dam Operation. Hydrobiologia 666 (1), 239–256. doi: 10.1007/s10750-010-0587-y
Turkoglu M. (2013). Red Tides of the Dinoflagellate Noctiluca Scintillans Associated With Eutrophication in the Sea of Marmara (the Dardanelles, Turkey). Oceanologia 55 (3), 709–732. doi: 10.5697/oc.55-3.709
Uhlig G., Sahling G. (1990). Long-Term Studies on Noctiluca Scintillans German Bight Population Dynamics and Red Tide Phenomena 1968-1988. Netherlands J. Sea. Res. 25, 101–112. doi: 10.1016/0077-7579(90)90012-6
Wang W. C., Sun S., Sun X. X., Zhang F., Zhang G. T., Zhu M. L. (2018). Seasonal Phenology of the Heterotrophic Dinoflagellate Noctiluca Scintillans (Macartney) in Jiaozhou Bay and Adjacent Coastal Yellow Sea, China. J. Oceanol. Limnol. 36 (4), 1280–1293. doi: 10.1007/s00343-018-6350-3
Wang Y., Ye Y. Y., Lin M., Chen X. Q. (2012). Spatial-Temporal Distribution of a Noctiluca Scintillans Population and its Adaption to Environmental Conditions in Northern South China Sea. Biodiv. Sci. 20 (6), 685–692. doi: 10.3724/SP.J.1003.2012.08065
Wei Q. S., Wang B. D., Zhang X. L., Ran X. B., Fu M. Z., Sun X., et al. (2021). Contribution of the Offshore Detached Changjiang (Yangtze River) Diluted Water to the Formation of Hypoxia in Summer. Sci. Total. Environ. 764 (10), 142838. doi: 10.1016/j.scitotenv.2020.142838
Xiang C., Tan Y., Zhang H., Liu J., Ke A., Li G. (2019). The Key to Dinoflagellate (Noctiluca Scintillans) Blooming and Outcompeting Diatoms in Winter Off Pakistan, Northern Arabian Sea. Sci. Total. Environ. 694 (1), 133396.1–133396.9. doi: 10.1016/j.scitotenv.2019.07.202
Xu Z. L. (2009). The Inter-Annual Variations in Noctiluca Scintillans Abundance and Eutrophication in Changjiang Estuary. Oceanol. Et. Limnol. Sin. 40, 793–798. doi: 10.11693/hyhz200906019019
Yang S. L., Zhang J., Xu X. J. (2007). Influence of the Three Gorges Dam on Downstream Delivery of Sediment and its Environmental Implications, Yangtze River. Geophys. Res. Lett. 34 (10), 1–5.. doi: 10.1029/2007GL029472
Zhang W. J., Dong Z. J., Zhang C., Sun X. Y., Hou C. E., Liu Y. L., et al. (2020c). Effects of Physical-Biochemical Coupling Processes on the Noctiluca Scintillans and Mesodinium Red Tides in October 2019 in the Yantai Nearshore, China. Mar. pollut. Bull. 160 (1), 1–13. doi: 10.1016/j.marpolbul.2020.111609
Zhang S., Li C., Cheung S., Sun M., Liu H. (2020a). Snapshot of Peptidomics of the Red Tide Forming Species Noctiluca Scintillans. Front. Mar. Sci. 7. doi: 10.3389/fmars.2020.569807
Zhang S., Liu H., Guo C., Harrison P. J. (2016). Differential Feeding and Growth of Noctiluca Scintillans on Monospecific and Mixed Diets. Mar. Ecol. Prog. Ser. 549, 27–40. doi: 10.3354/meps11702
Zhang S., Wang Q., Lü Y., Cui H., Yuan Y. (2008). Observation of the Seasonal Evolution of the Yellow Sea Cold Water Mass in 1996–1998. Cont. Shelf. Res. 28 (3), 442–457. doi: 10.1016/j.csr.2007.10.002
Zhang S., Xia X., Ke Y., Song S., Liu H. (2020b). Population Dynamics and Interactions of Noctiluca Scintillans and Mesodinium Rubrum During Their Successive Blooms in a Subtropical Coastal Water. Sci. Total. Environ. 755 (1), 142349–142362. doi: 10.1016/j.scitotenv.2020.142349
Zhou J., Lao Y. M., Song J. T., Jin H. J., Zhu J. M., Cai Z. H. (2020). Temporal Heterogeneity of Microbial Communities and Metabolic Activities During a Natural Algal Bloom. Water Res. 183, 116020–116033. doi: 10.1016/j.watres.2020.116020
Keywords: noctiluca scintillans, East China Sea, Southern Yellow Sea, controlling factors, phytoplankton
Citation: Sheng L, Jiang Z, Sun Z, Zhu Y, Zhai H, Ding L, Tong M, Chen J, Chen Q and Zeng J (2022) Noctiluca Scintillans Distribution Largely Regulated by Phytoplankton Biomass in the East China Sea and Southern Yellow Sea. Front. Mar. Sci. 9:899334. doi: 10.3389/fmars.2022.899334
Received: 18 March 2022; Accepted: 24 May 2022;
Published: 23 June 2022.
Edited by:
Albert Calbet, Institute of Marine Sciences, Spanish National Research Council (CSIC), SpainReviewed by:
Hongbin Liu, Hong Kong University of Science and Technology, Hong Kong SAR, ChinaShuwen Zhang, South China Normal University, China
Copyright © 2022 Sheng, Jiang, Sun, Zhu, Zhai, Ding, Tong, Chen, Chen and Zeng. This is an open-access article distributed under the terms of the Creative Commons Attribution License (CC BY). The use, distribution or reproduction in other forums is permitted, provided the original author(s) and the copyright owner(s) are credited and that the original publication in this journal is cited, in accordance with accepted academic practice. No use, distribution or reproduction is permitted which does not comply with these terms.
*Correspondence: Zhibing Jiang, anpiQHNpby5vcmcuY24=; Jiangning Zeng, amlhbmduaW5nekAxMjYuY29t