
95% of researchers rate our articles as excellent or good
Learn more about the work of our research integrity team to safeguard the quality of each article we publish.
Find out more
ORIGINAL RESEARCH article
Front. Mar. Sci. , 29 June 2022
Sec. Marine Biology
Volume 9 - 2022 | https://doi.org/10.3389/fmars.2022.879911
This article is part of the Research Topic Ocean-Biota System: Integrated Approach to Climate Change Impacts on Plankton Communities in Coastal and Pelagic Environments View all 8 articles
 Hyoung Min Joo1Kang Eun Kim2,3Joon Sang Park2Hyun-Jung Kim2Eun Jin Yang4Taek-Kyun Lee3,5Kyoung-Ho Cho4Jinyoung Jung4Youngju Lee4Sung-Ho Kang6Seung Won Jung2,3*
Limited information is available regarding the phytoplankton communities in the Arctic Ocean, especially in the Chukchi Sea. We conducted research cruises in the Arctic Ocean in the late summers of 2015, 2016, 2018, and 2019, and used 18S ribosomal DNA metabarcoding to examine the dynamic changes in core phytoplankton. Environmental factors were divided into three Groups: “surface layers in low latitude”, “subsurface chlorophyll maximum layers in low latitude”, and “high latitude.” The phytoplankton community was divided into two Groups. One Group, “the phytoplankton community in lower latitudes affected by the Pacific Influx “, comprised Dinophyta (56.33%), Bacillariophyta (22.28%), and Chlorophyta (20.77%), while the other Group, “the phytoplankton community in higher latitudes affected by the Arctic Sea “, comprised Dinophyta (57.51%), Bacillariophyta (10.71%), and Chlorophyta (27.57%). The common phytoplankton taxa in Group of lower latitudes included 33 operational taxonomic units (OTUs) (99.04%), while the other Group included nine OTUs (98.80%). In these groups, OTUs #005 (Heterocapsa rotundata), #001 (Micromonas pusilla), and #003 (Chaetoceros gelidus) were core OTUs (>5%). These core OTUs were significantly different between the two Groups; OTU #001 and #003 were distributed at high relative abundance and rapidly increased at higher latitudes. OTU #005 showed a relatively high abundance at lower latitudes. Analysis of the indicator species revealed that 34 OTUs in lower latitudes and only one OTU (#003) in higher latitudes were observed to have a strong value of >0.8. Our results indicate that core phytoplankton taxa and community structures by latitudinal differences are highly dependent on different water masses and show their dynamic ecological responses to extreme environmental conditions.
The Chukchi Sea, which is connected to the Arctic Ocean and extends northwards, involves complex currents that facilitate the northward transport of the Pacific waters through the Bering Strait and exerts a significant impact on regional circulation, freshwater supplements, and nutritional distribution (Weingartner et al., 1998). Furthermore, the central northern Chukchi Sea water mass significantly affects the transport (Weingartner et al., 2005). Owing to the latitudinal differences between the Pacific Ocean and the Arctic Ocean, the warm and salty waters of the Bering Sea flow into the Chukchi Sea, resulting in the melting of sea ice in summer (Shimada et al., 2006). Three Pacific inflows enter the Chukchi Sea in succession, and these water masses affect the Arctic Ocean. The first is water from the Gulf of Anadir (AW), with low temperature and high salinity, while the second and third are, respectively, waters from the Bering Strait (BSW), having high temperature and salinity and low silica characteristics, and from the Alaska Coast (ACW), which is introduced after melting ice and has low salinity and low nitrogen concentration (Grebmeier et al., 1988; Aagaard et al., 2006). Overall, the location of the Pacific summer waters and the contents of the Chukchi Sea exert a significant impact on physical conditions, nutrients, and phytoplankton communities therein (Mordy et al., 2020; Wang et al., 2020).
Various Arctic research programmes have been conducted over the past decade to understand how climate change affects the Arctic marine ecosystems in the Chukchi Sea (Babin, 2020). In particular, field research programmes in the Arctic Ocean have greatly contributed to increasing our understanding of the spatiotemporal and ecological roles of phytoplankton communities in this region (Sukhanova et al., 2009; Joo et al., 2012). Seasonal changes in the environment with respect to solar radiation, sea ice, water temperature, vertical stratification, and influx of warm Pacific Ocean through the Bering Strait control the primary production by phytoplankton in the Arctic Ocean (Arrigo et al., 2012; Hill et al., 2018; Zhang et al., 2021). Picophytoplanktons are a major component in the Arctic Sea. There is a high occurrence of Micromonas in Beaufort Gyre (Coupel et al., 2012; Coupel et al., 2015), while cryptophytes are dominant in the Chukchi Sea (Fujiwara et al., 2014). The specific composition of the phytoplankton community is influenced by the water mass in the Arctic Ocean (Hamilton et al., 2008; Lee et al., 2019). Therefore, understanding the magnitude and spatial distribution of the phytoplankton community is essential to better study the changing environments in the Arctic Ocean (Stoecker and Lavrentyev, 2018).
Studies on the Arctic Basin are essential to determine the extent of plankton productivity involving phytoplankton biomass and biodiversity, and the factors affecting the shelves and slopes of the Arctic Ocean (Codispoti et al., 2005; Joo et al., 2012; Lee et al., 2012). On the shelves and slopes of the Chukchi Sea, pelagic phytoplankton account for most of the primary production, whereas ice algae are only important during the short period of spring transition (Hill and Cota, 2005; Zhang et al., 2021). Until recently, it was believed that the increase in the primary production of phytoplankton in the ice-covered Arctic Ocean only began after the sea ice had receded and the water mass was stratified to provide sufficient light for photosynthesis (Ardyna et al., 2020; Oziel et al., 2020). However, the massive growth of phytoplankton under the Chukchi Sea ice in 2011 indicates that significant amounts of phytoplankton can grow even in ice-covered seas (Arrigo et al., 2012). The discovery of very high biomass and growth rates over a spatial range of more than 100 km suggests that phytoplankton blooms under sea ice are an important factor in the Arctic marine ecosystem, which has thus far been overlooked (Arrigo et al., 2014). In the Chukchi Sea, the pelagic ecosystem is greatly affected by the seasonal melting of sea ice (Comeau et al., 2011). For example, as the Arctic sea ice decreases the phytoplankton biomass increases, potentially increasing the primary productivity of the Arctic Ocean by up to 20% (Arrigo and Van Dijken, 2011). In some parts of the Arctic, earlier phytoplankton blooms can be induced by early sea ice retreat, occurring widely throughout the Arctic (Stroeve et al., 2014). However, a detailed understanding of the dynamics of Arctic phytoplankton indicators remains elusive.
Metabarcoding has previously identified spatial and temporal trends in phytoplankton communities (Jung et al., 2018; Kang et al., 2021) and can be a valuable tool for analysing plankton biodiversity, even though the differences in rDNA copy numbers are associated with genome size and biovolume in unicellular eukaryotes (Prokopowich et al., 2003). Therefore, a semi-quantitative approach was suggested because of the differences in rDNA (Amend et al., 2010). This metabarcoding approach may be advantageous for analysing pico-sized phytoplankton, even though it has several technical limitations. For example, Kang et al. (2021) reported that Bathycoccus prasinos was only identified in the metabarcoding analysis even though this taxon is a known important component of picoplankton in temperate waters. Therefore, we suggest that metabarcoding is a rapid and high-resolution analysis tool, particularly for the detection of pico-sized phytoplankton communities. We aimed to evaluate the changes in the phytoplankton community in response to the changes in the water mass (in the Bering, Chukchi, and Arctic Seas) between 64 °N and 80 °N and the variations in the surface and subsurface chlorophyll maximum (SCM) layers. The relationships between the phytoplankton community and the environment factors (focused on water temperature), particularly the changes in phytoplankton indicators, were assessed in the Arctic Ocean during the summers of 2015-2019. We used 18S rDNA metabarcoding and evaluated the environmental factors at the surface and SCM depths to elucidate the effects on the phytoplankton communities.
To understand the changes in phytoplankton communities with increases in latitude, we collected sub-samples to analyse phytoplankton communities and relevant environmental factors in the water column between the Bering Strait, the Chukchi Sea, and the Arctic Sea (70 sampling sites from 62°N to 80°N). In the present study, the Korean icebreaker research vessel R/V Araon conduct surveys in 2015 (Cruise name: ARA06B), 2016 (ARA07B), 2018 (ARA09B), and 2019 (ARA10B) as part of a polar research programme (the Korea-Arctic Ocean Observing System [K-AOOS] programme) at the Korea Polar Research Institute of South Korea (Figure 1, Table S1). The sub-samples in the water column were collected at the surface (1 m below the surface) and SCM layer depths. Water samples were collected using a rosette sampler with 20-L Niskin-type bottles (OceanTest Equipment, Inc., Ft. Lauderdale, FL, USA), equipped with a Sea-Bird 911 plus CTD (Sea-Bird Electronics, Inc., Bellevue, WA, USA). Here, the SCM layer was determined by realistic measurements using an in situ Seapoint fluorometer (Sea Bird Electronics, Inc.). The SCM layer was ascertained using a realistic measurement with an in situ Seapoint fluorometer (Sea Bird Electronics, Inc.). The subsurface chlorophyll maxima were estimated according to Martin et al. (2010), and the layer was commonly located between 0.2% and 5% of the surface irradiance. The temperature, salinity, and dissolved oxygen content were evaluated using an SBE 911 plus system (Sea Bird Electronics, Inc.). A 100-mL aliquot of each sub-sample was filtered through a 47-mm glass fibre filter (Whatman, Clifton, NJ, USA), and the filtered seawater was stored in an acid-cleaned polyethylene bottle in a deep freezer at −80 °C. Subsequently, concentrations of dissolved inorganic nutrients, such as dissolved inorganic nitrogen (DIN), including nitrite + nitrate + ammonia, dissolved inorganic phosphorus (DIP), and dissolved silica (DSi), were determined in each sample using a four-channel continuous automatic analyser (QuAAtro, SEAL Analytical, Germany).
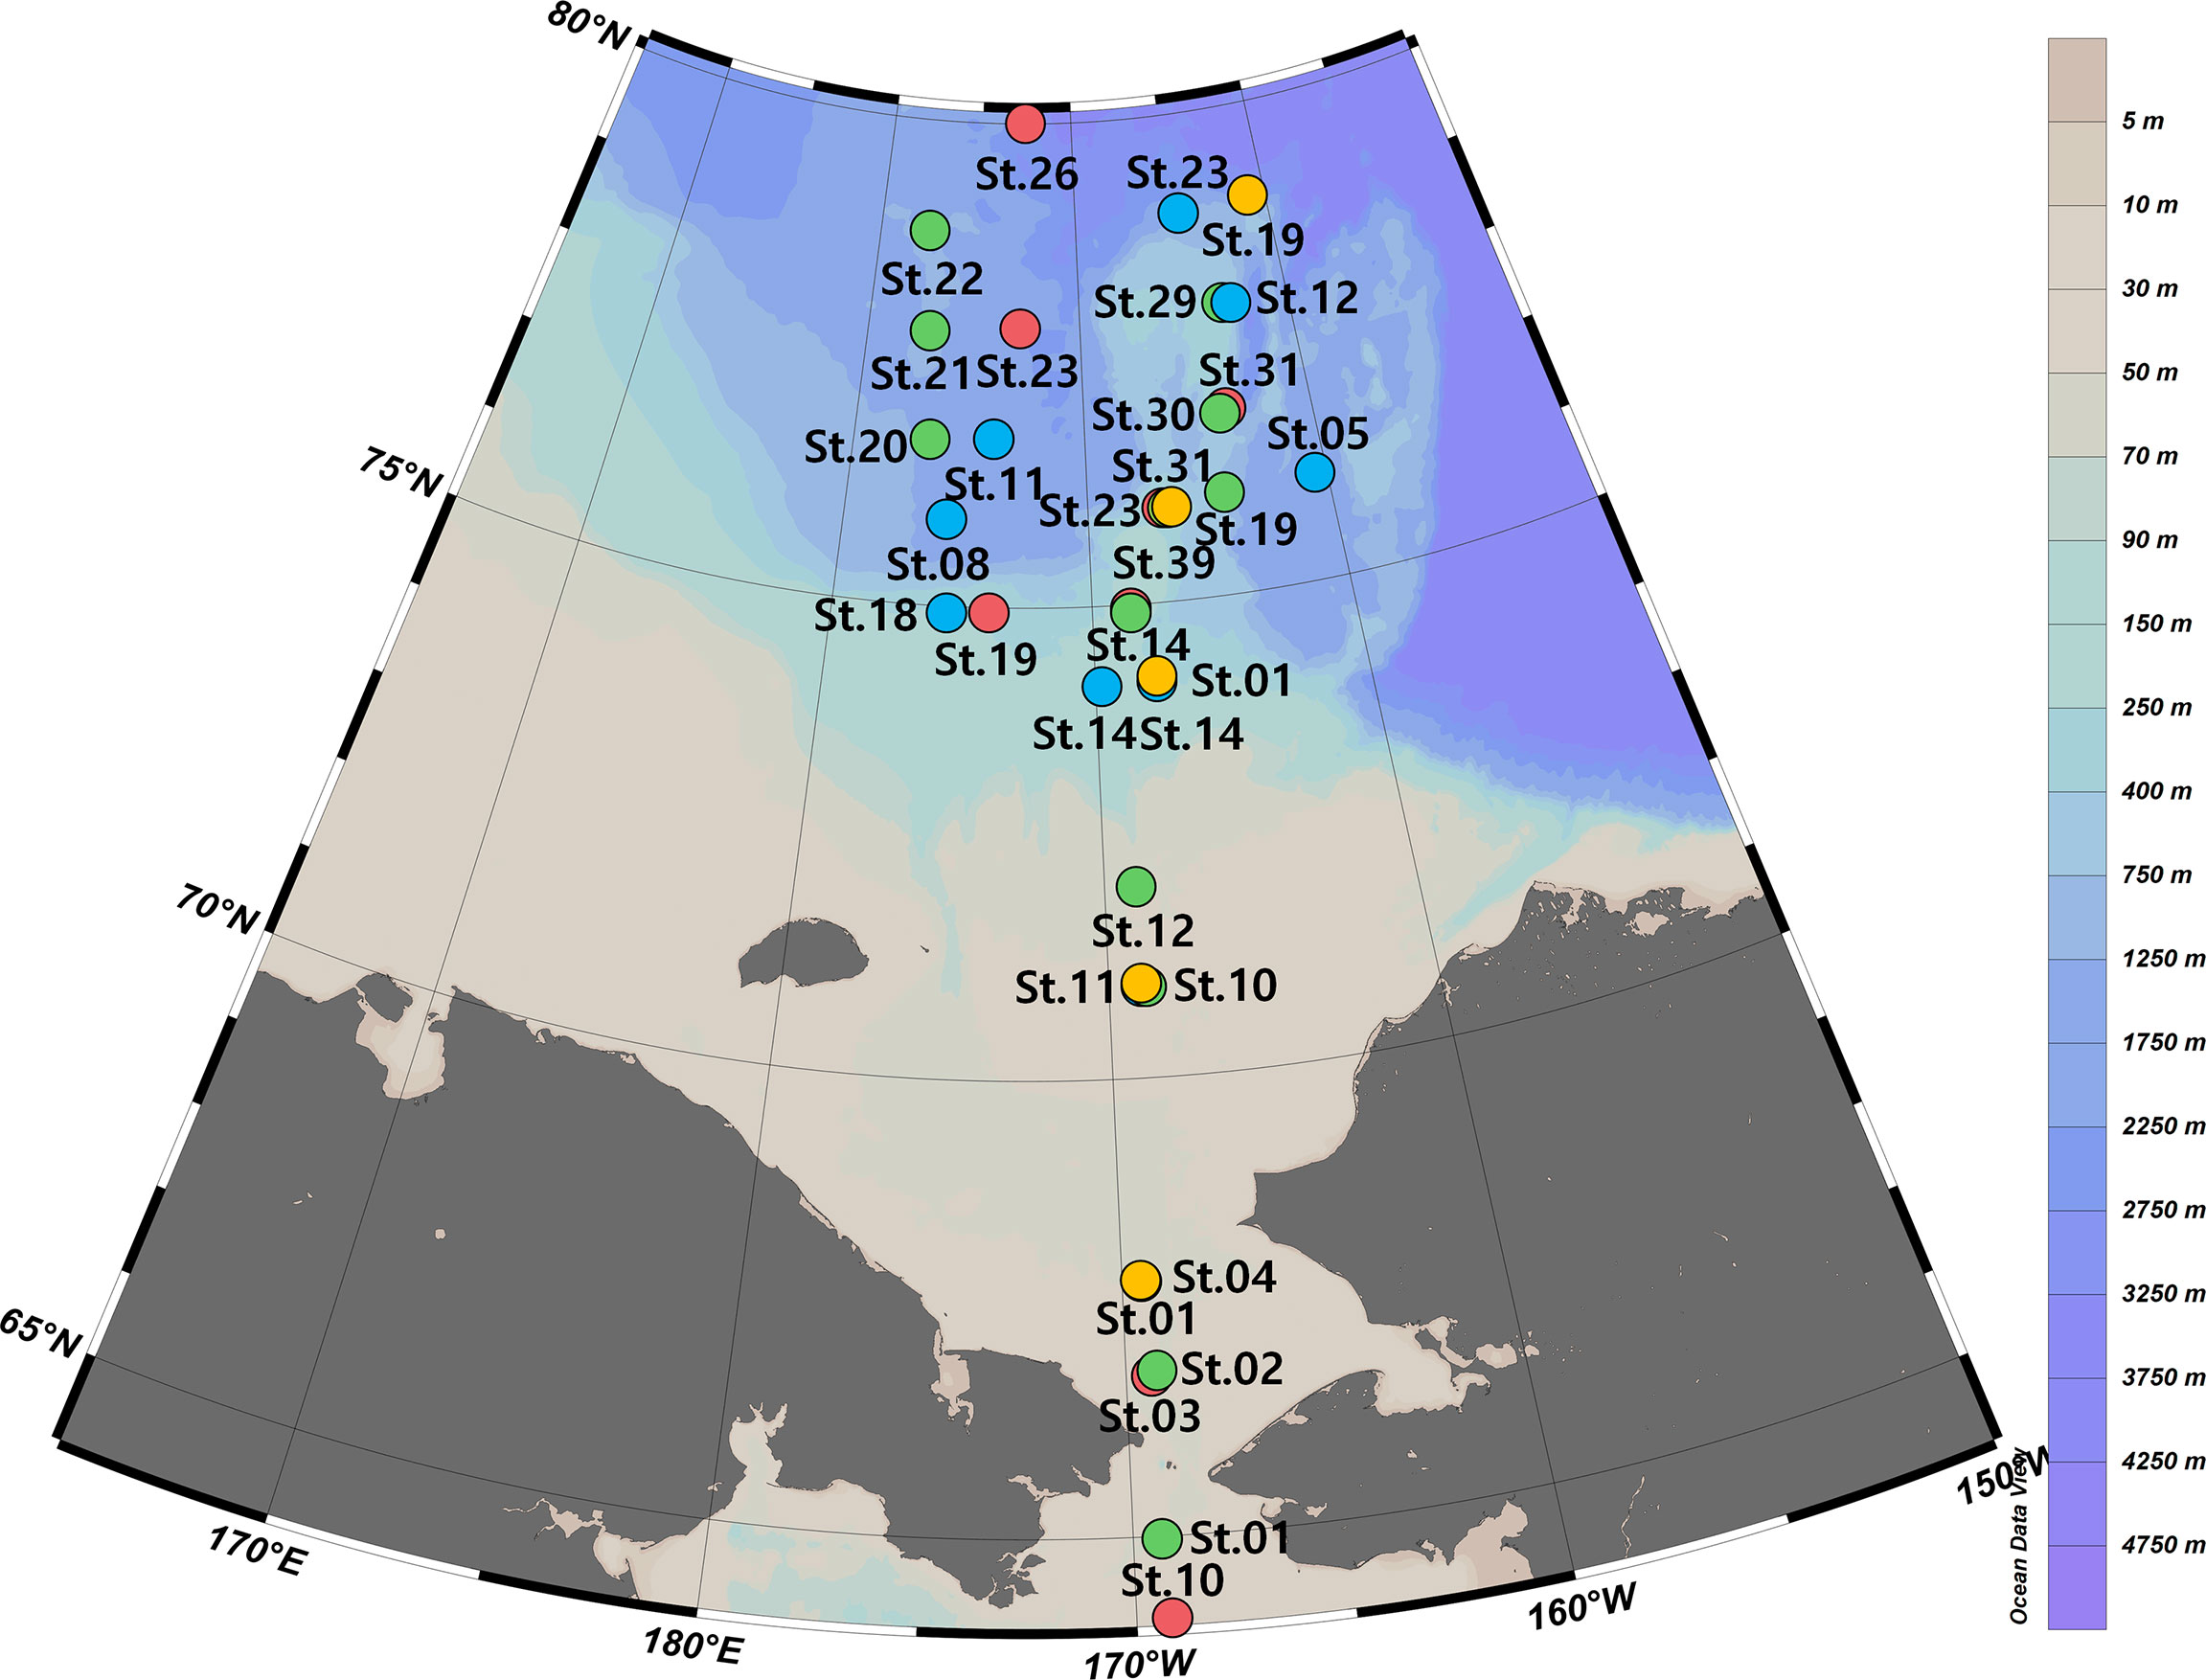
Figure 1 Sampling locations in the Arctic Ocean in the late summers during 2015-2019. A total of 70 sites were investigated during the ARA06B, 07B, 09B, and 10B cruises of the South Korean ice breaker research vessel Araon. SCM, subsurface chlorophyll maximum layer.
To analyse the eukaryotic phytoplankton community, 2 L of the surface and SCM layer samples were passed through a 0.2-μm pore-sized filter (GTTP04700; Millipore, Bedford, MA, USA) under < 100 Hg low vacuum pressure to isolate eukaryotes. The filters were stored at −80 °C until DNA extraction. Genomic DNA was extracted from eukaryotic plankton communities, and metabarcoding analyses using 18S rDNA was performed as previously described (Kang et al., 2021). The filter was cut into eight several pieces for genomic DNA (gDNA) extraction. gDNA was extracted using the DNeasy PowerSoil kit (Qiagen, Hilden, Germany); the DNA samples were diluted to a final concentration of 20 ng μL−1. The quantity and quality of total gDNA was determined using a Nano-drop (Nano-MD-NS; SCINCO Ltd., South Korea). The V4-V5 region of the 18S rDNA gene was targeted using Illumina-tagged forward (TAReuk454FWD1) and reverse (TAReukREV3) primers (Table S2). Although the replication experiment was not performed, the samples for gDNA extraction were obtained from the larger volume of 2 L. To obtain more accurate results, polymerase chain reaction (PCR) was performed in three separate tubes, and the contents were mixed in a tube. Therefore, we believe that the change patterns in the phytoplankton community are representative despite the lack of replications in the field investigation (Jung et al., 2018; Kim et al., 2021). The products from the first PCR reactions were purified individually using a QIAquick PCR Purification Kit (Qiagen, Hilden, Germany). The second PCR involved 10 cycles using tags from the Nextera XT 96 Index Kit v2 (Illumina). The DNA concentration was measured using the 2100 Bioanalyzer (Agilent Technologies, Palo Alto, CA, USA). Equal amounts of the PCR products from each sample were pooled; the combined sample was analysed using the Mi-Seq platform (Illumina). The raw sequencing data (Fastaq files) were obtained from the Mi-Seq platform.
The raw sequencing data (Fastq files) were analysed using the bioinformatic processes described in Jung et al. (2021). After completing each sequencing, the data were pre-processed using Mi-Seq Control Software v2.4.1. The raw sequences were first analysed using FastQC (Andrews, 2010) to check basic parameters, such as GC %. The quality score distribution per base was determined and the poor-quality sequences were flagged. Ambiguous and chimeric reads were removed; the noise sequences, with operational taxonomic units (OTUs) of 1, 2, and 3 reads, were removed at a cut-off of 97% (denoising). The processed paired-end reads were merged using the fast length adjustment of short reads software tool (Magoč and Salzberg, 2011). Following each sequencing, a quality check was performed to remove short sequence reads (< 150 bp), low-quality sequences (score < 33 in 18S rDNA analysis), singletons, and non-target sequences. Using the Basic Local Alignment Search Tool (Altschul et al., 1990), the sequence reads were compared to those from the National Center for Biotechnology Information database. Sequence reads with an E-value < 10-3 were considered for further analysis. A pairwise global alignment was performed for the selected candidates to identify the most similar sequences. The taxonomy of the sequence with the highest similarity was assigned to the sequence read (species and genus levels with > 97% and > 94% similarity, respectively). To analyse OTUs, the CD-HIT-OTU software (Li and Chang, 2017) was used, for clustering and obtaining the metagenomic functional information. To calculate alpha-diversity, such as Shannon-Weaver diversity, Chao richness, and Simpson evenness, we used the closed-reference reported by Mothur (Schloss et al., 2009) and QIIME (Caporaso et al., 2010), based on the OTU table.
Pearson’s correlation analysis was performed to examine the relationships between the measured parameters using SPSS Statistics software v12 (IBM SPSS, Armonk, NY, USA). Cluster analysis was performed via group average clustering using the Bray-Curtis similarity method investigating the relative abundances of phytoplankton groups. The most abundant (or common) phytoplankton operational taxonomic units (OTUs) indicated a relative abundance >0.1% in at least one sample. Using the ranked similarity matrix, an ordination plot was produced by non-metric multidimensional scaling (nMDS) using PRIMER 6 (v6.1.13). To test the null hypothesis (no significant difference between the Groups discriminated according to the agglomerative clustering analysis), similarities were analysed with ANOSIM (Clarke et al., 2001). Alpha diversity (including Chao1, Shannon, and Simpson diversity metrics) was analysed using the vegan of R Studio (Oksanen et al., 2022). The indicator species analysis or the indicator value index (IndVal), developed by Dufrêne and Legendre (1997), uses the relative abundance and relative frequency of occurrence of species in defined Groups obtained through hierarchical clustering, to narrow a large number of species down to a few species of interest that are the most characteristic of the defined Groups. De Caceres and Jansen (2016) developed the “indicspecies” methods in R Studio (v. 1.2.5042), based on the WPGMA clustering method. The IndVal values range from 0 (not an indicator species) to 1 (maximum indicator ability). Redundancy analysis (RDA) was used to investigate the relationships between the indicator phytoplankton OTUs, obtained using the IndVal methods, and the environment. A Pearson correlation matrix was generated to identify the correlated variables within this data set. Environmental variables below the detection limits at most sites were removed before running the RDA; only those contributing significantly to the analysis (as assessed using the forward selection) were included in the final RDA. The ratio of the eigenvalues of the constrained first axis to the second unconstrained axis was examined, because this ratio indicates the importance of a variable in controlling the common OTU distributions (Ter Braak, 1986). The RDA was calculated using the CANOCO program version 4.55 (Ter Braak and Smilauer, 2002), and all axes were tested for significance using the 999 unrestricted Monte Carlo permutations. Heatmaps based on the most abundant phytoplankton OTUs were plotted using ggplot2 (Wickham et al., 2016) in R Studio.
During this study, the water temperature and salinity gradually decreased with increasing latitude. For lower latitude sites between 64°N and 70°N, the mean water temperature was 6.84°C at the surface and 2.71°C in the SCM layer (Figure 2). However, the water temperature, which displayed little difference between the surface and SCM layers at most sampling sites at latitudes higher than 72°N, was measured at a mean of below 0°C. Salinity showed a clear difference higher than 72°N between the surface at a mean of 28.15 and the SCM layer at a mean of 31.30 (Figure 2). Thus, the water masses at lower latitude sites (the Bering Strait and bordering area of the Bering Strait and the Southern Chukchi Sea) showed relatively higher water temperature and salinity, with little difference between the two layers. For higher latitude sites (most of the Chukchi Sea and Arctic Sea), the water temperature was below 0°C in all layers and salinity was clearly distinguished with an mean of 29.28. In particular, these sites are located near the ice edges. The DIN concentrations in all surface layers were detected at mean of 0.05 μM, but their concentrations in the SCM layer were found to have a mean of 4.10 μM (Figure 2). The DIP concentrations were significantly correlated with changes in the DSi concentrations (r>0.8 and p<0.001), particularly in the SCM layer (Figure 2).
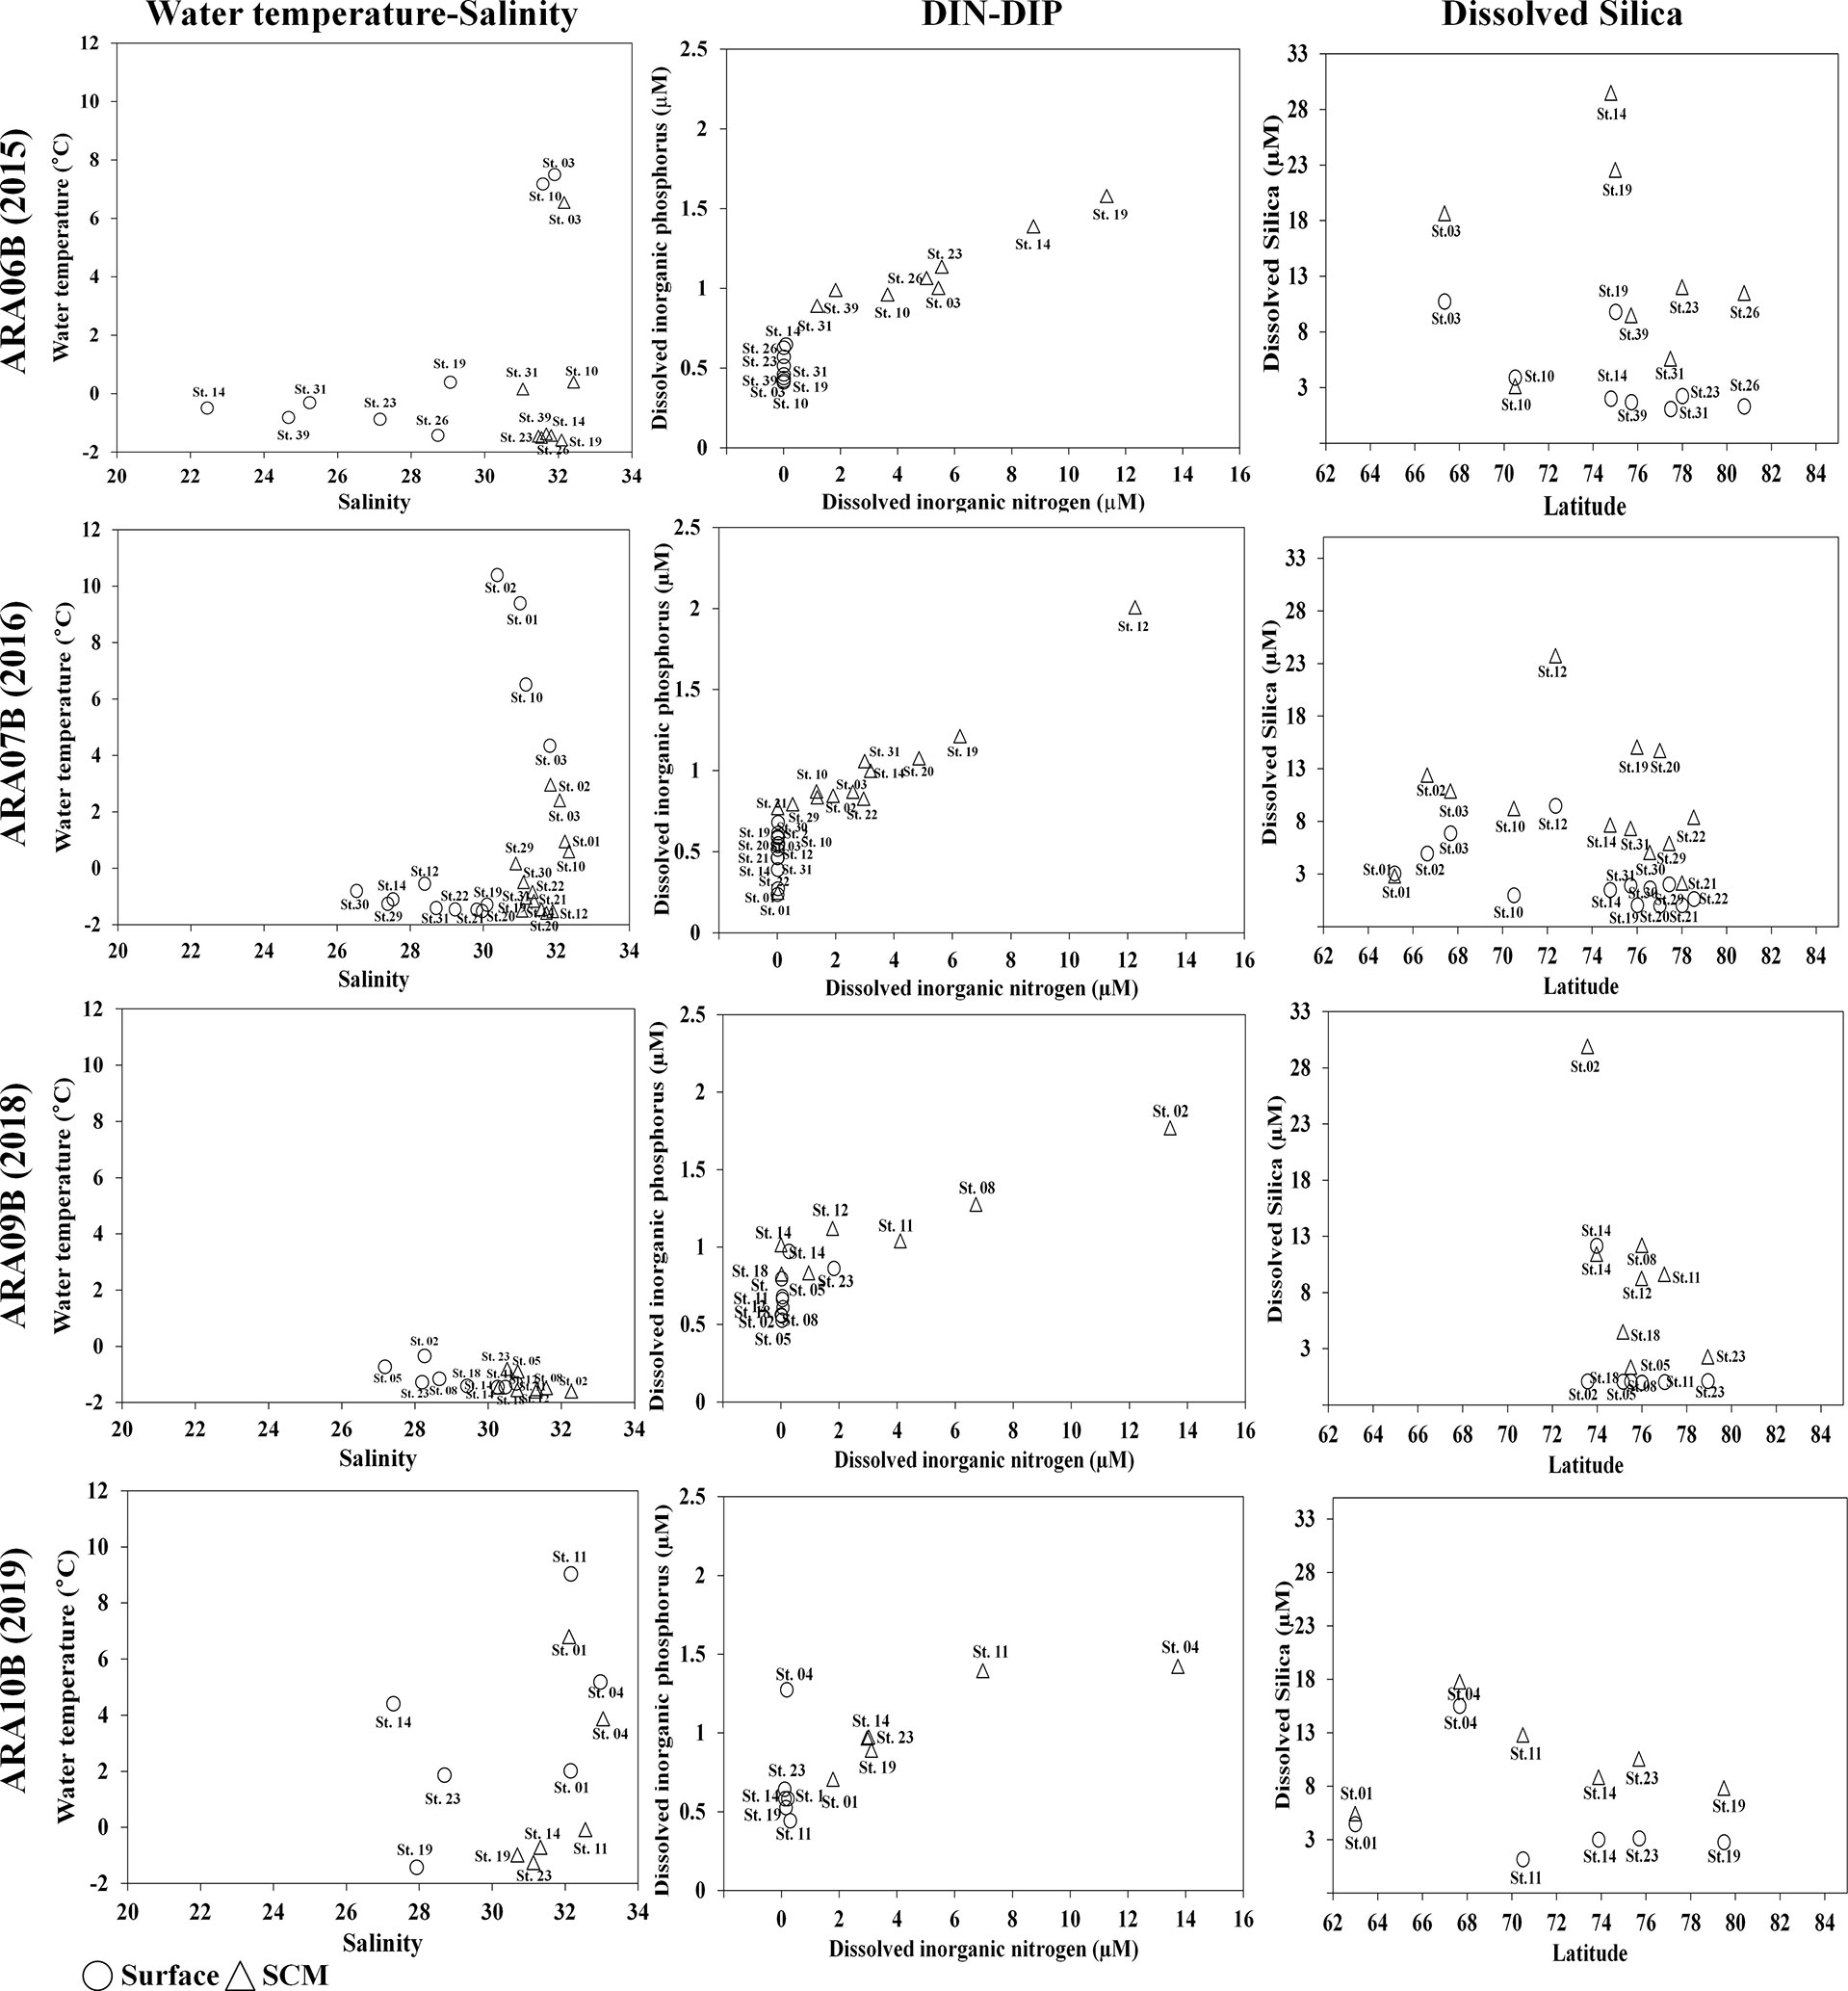
Figure 2 Changes in the environmental factors in the Arctic Ocean in the late summers during 2015-2019. The temperature-salinity plots obtained from each cruise. Plots of inorganic nutrient values [dissolved inorganic nitrogen(DIN)-dissolved inorganic phosphorus (DIP), and dissolved silica (DSi)] obtained from each cruise. SCM, subsurface chlorophyll maximum layer.
The environmental factors were stringently classified into three Groups at a similarity of 90%, based on the results of the nMDS analysis (Figure S1). One Group was mainly associated with “effects of surface layers in lower latitude.” In this Group, most sampling sites were below 72°N, water temperature was 1.77°C, salinity was 29.28, and DIN concentration was 0.059 μM. Another Group was associated with “effects of SCM layers at lower latitudes,” with water temperature and salinity measurements of -0.08°C and 31.61, respectively. The other Group was associated with “effects of higher latitude.” In this Group, the mean water temperature was -1.19°C, and the salinity was 29.28 at the latitude range of 73−78°N. In particular, DIN and DSi were detected at very low concentrations of 0.029 and 0.063 μM, respectively.
The reads counts and summary statistics across the eukaryotic phytoplankton communities in the present study are summarised in Table S3. Briefly, the sequences and read counts were generated at means of 45,706,854 and 51,972, respectively. The relative abundance of the phytoplankton community (including Dinophyta, Bacillariophyta, and Chlorophyta) was 61.83% in the total 18S rDNA metabarcoding results. The phytoplankton community was classified into two major Groups with 69% similarity, using nMDS analysis (Figure 3A). Based on the nMDS results for the phytoplankton community dataset, One Group included “the phytoplankton community at latitudes affected by the Pacific Influx,’’ comprising Dinophyta (56.33%), Bacillariophyta (22.28%), and Chlorophyta (20.77%). The other Group included “the phytoplankton community in the higher latitudes affected by Arctic Sea,” comprising Dinophyta (57.51%), Bacillariophyta (10.71%), and Chlorophyta (27.57%). Thus, the phytoplankton taxa were significantly different between the two Groups (Table 1). The SCM layer at the sampling site of ten in ARA06B (06B-10SCM) showed unique distribution characteristics with increasing diatoms such as Genus Chaetoceros, Fragilariopsis, and Thalassiosira. The resulting Venn diagrams showed overlaps in the common phytoplankton OTUs (a relative abundance >0.1% in at least one sample) in the two Groups and the 06B-10SCM sampling site (Figure 3B). The number of common OTUs to all groups was 31, accounting for 53.4% of the total number; 98.2% (n=57) of the OTUs overlapped between the two Groups. There were 1.7% (1 OTU) and 0% OTUs, respectively, at the lower and higher latitudes in both Groups. The mean Shannon diversity was 3.17. In particular, the diversity index increased with increasing latitude (Figure 3B) and significantly differed between the two Groups (Table 1). Moreover, compared with the water depths between the surface and SCM layers, the mean diversity index in the surface and SCM layers were found to be 3.14 and 3.16, respectively.
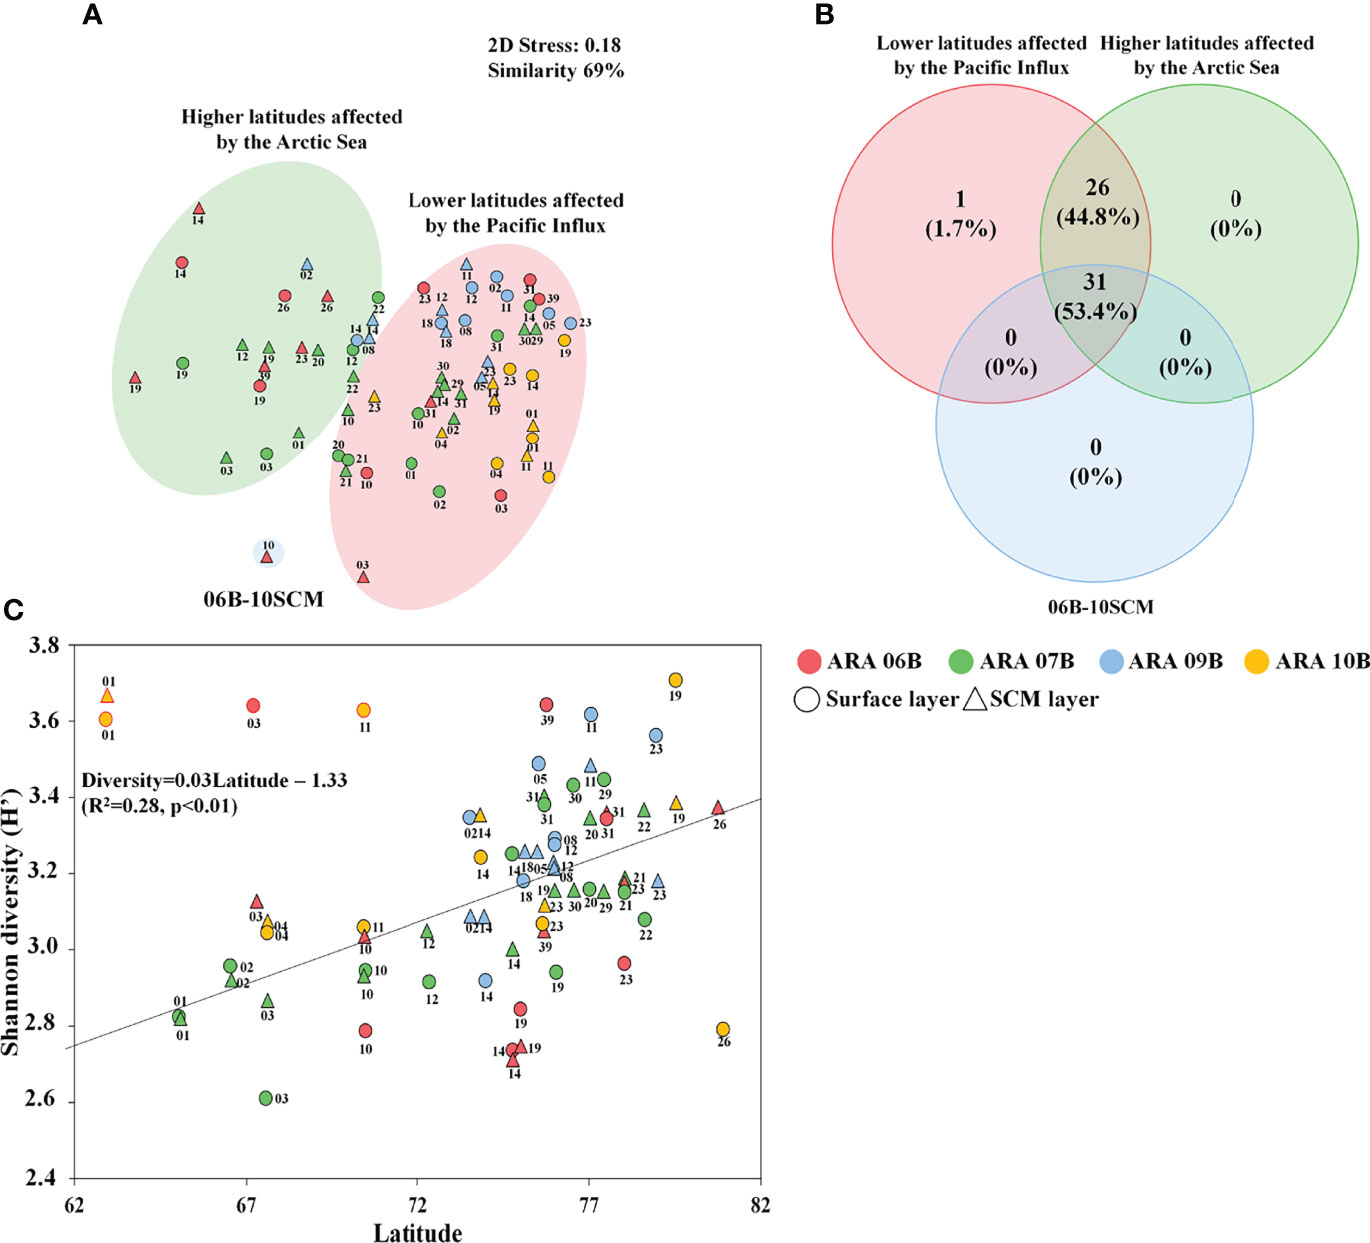
Figure 3 Distribution of operational taxonomic units (OTUs) among phytoplankton communities in the Arctic Ocean. Nonmetric multidimensional scaling (nMDS) plots by the Bray–Curtis dissimilarity method using phytoplankton datasets (A). All data were normalized by the fourth roots. (B) Venn diagram showing the shared and unique common phytoplankton OTUs (a relative abundance >0.1% in at least one sample) among Groups based on nMDS results. Changes and correlations in Shannon diversity by latitudinal difference (C).
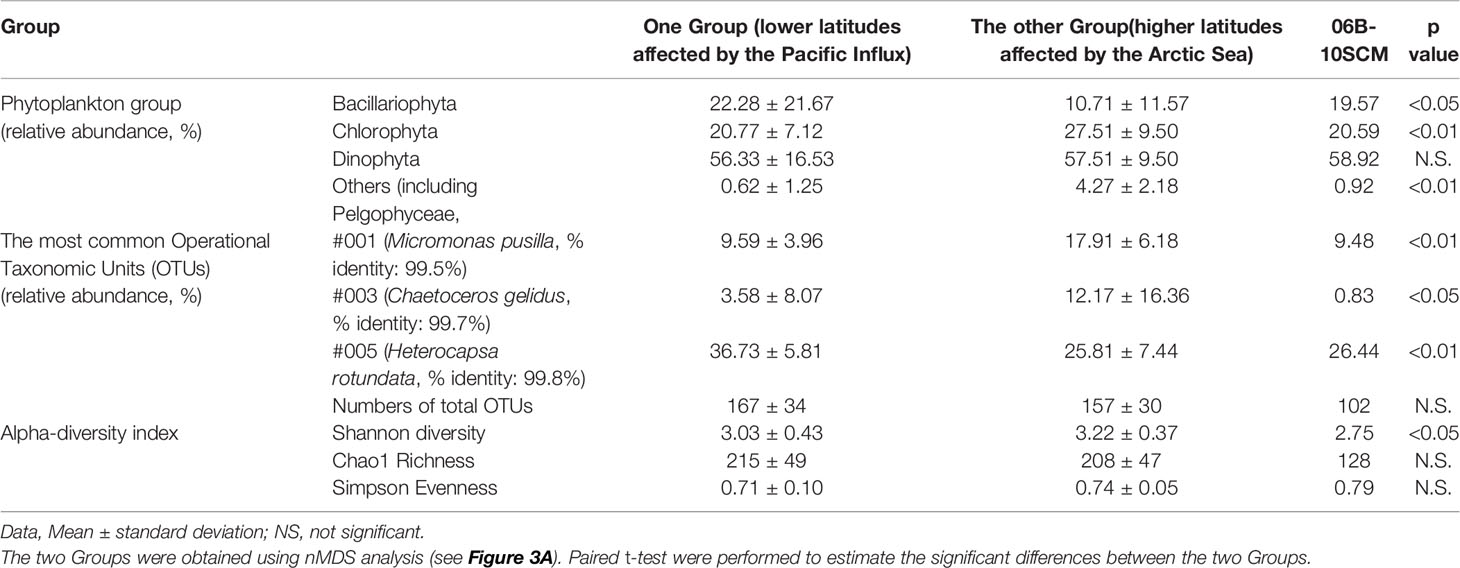
Table 1 Summary of phytoplankton community and alpha-diversity in the Arctic Ocean in the late summer seasons during 2015–2019.
The common phytoplankton taxa in each Group included 58 OTUs, and the accumulated relative abundance of these common OTUs had a mean of 99.35% (Figure 4A, Table S4). The common phytoplankton taxa in the Group at lower latitudes included 33 OTUs, with a mean value of 99.04% of the total relative abundance of phytoplankton. OTU #005 (Heterocapsa rotundata, Dinophyta), #001 (Micromonas pusilla, Chlorophyta), and #003 (Chaetoceros gelidus, Bacillariophyta) were identified as the core phytoplankton taxa (>5%), with a mean relative abundance of 36.73%, 9.59%, and 3.58%, respectively (Figure 4B). In the Group at higher latitudes, the common phytoplankton taxa included nine OTUs with a mean relative abundance of 98.80%. Similar to the presence of the common species at lower latitudes, OTUs #005, #003, and #001 had a relative abundance of 25.81%, 12.17%, and 17.91%, respectively. These OTUs (#005, #003, and #001) were significantly different between the two Groups (Table 1). OTUs #001 and #003 were rapidly increased in higher latitudes. In particular, OTU #001 was distributed at relative abundance of 19.06%. OTU #005 showed a relatively high abundance in lower latitudes. The common phytoplankton OTUs for IndVal analysis were classified into two Groups based on the results of cluster analysis, and 40 indicator species were selected (Figure 5). Thirty-four OTUs at lower latitudes and one OTU (#003) at higher latitudes had a strong value of >0.8. In particular, #001 and #025 (Bathycoccus prasinos, Chlorophyta) at the lower latitudes and #003 at the higher latitudes were selected as indicator species.
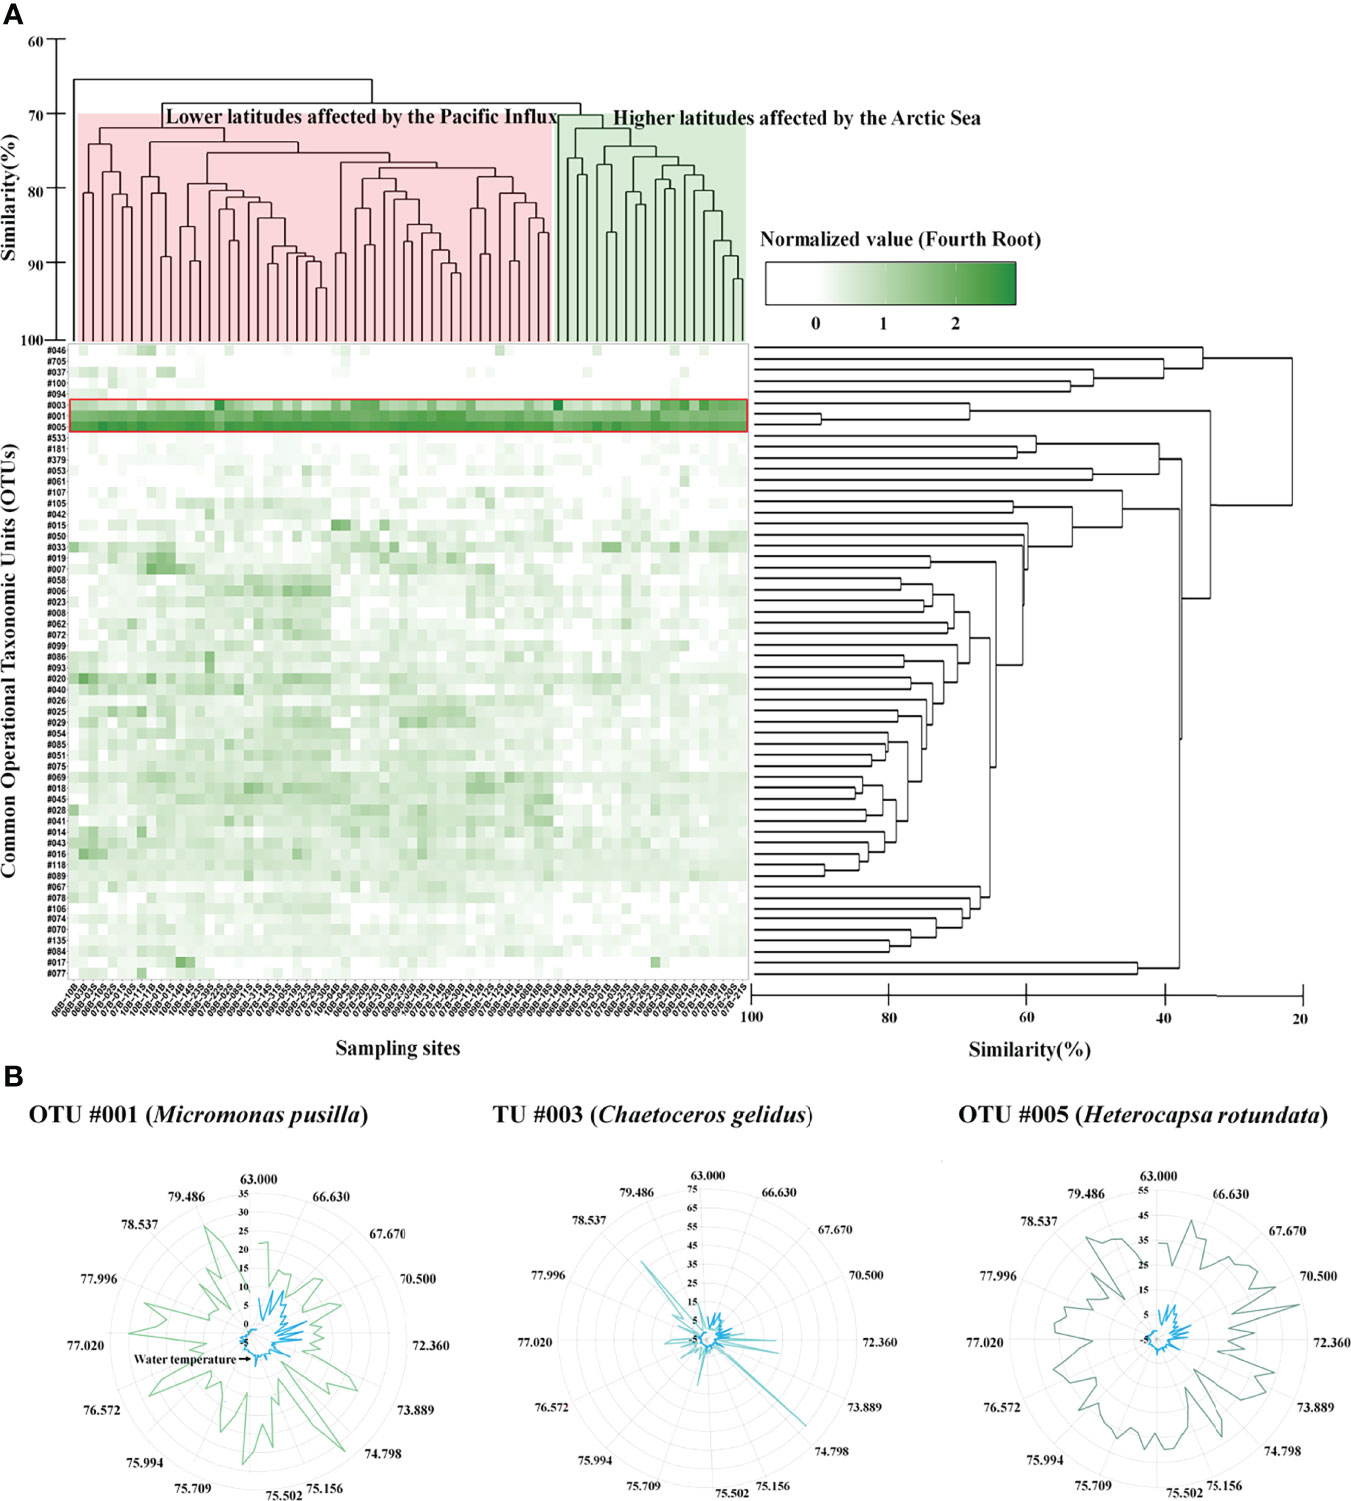
Figure 4 Changes in the common (A) and core (B) phytoplankton operational taxonomic units (OTUs) in the Arctic Ocean. Common phytoplankton OTUs selected the mean relative abundances of 0.1%. The heatmap displays the fourth root normalized data, ranging from 0 to 3. The common phytoplankton OTUs and sampling sites are Hierarchical agglomerative clustering using the group average with the Bray–Curtis similarity method. Core phytoplankton OTUs displaying mean relative abundances of >5%. The selected core phytoplankton OTUs were #005 (Heterocapsa rotundata, Dinophyta), #001 (Micromonas pusilla, Chlorophyta), and #003 (Chaetoceros gelidus, Bacillariophyta).
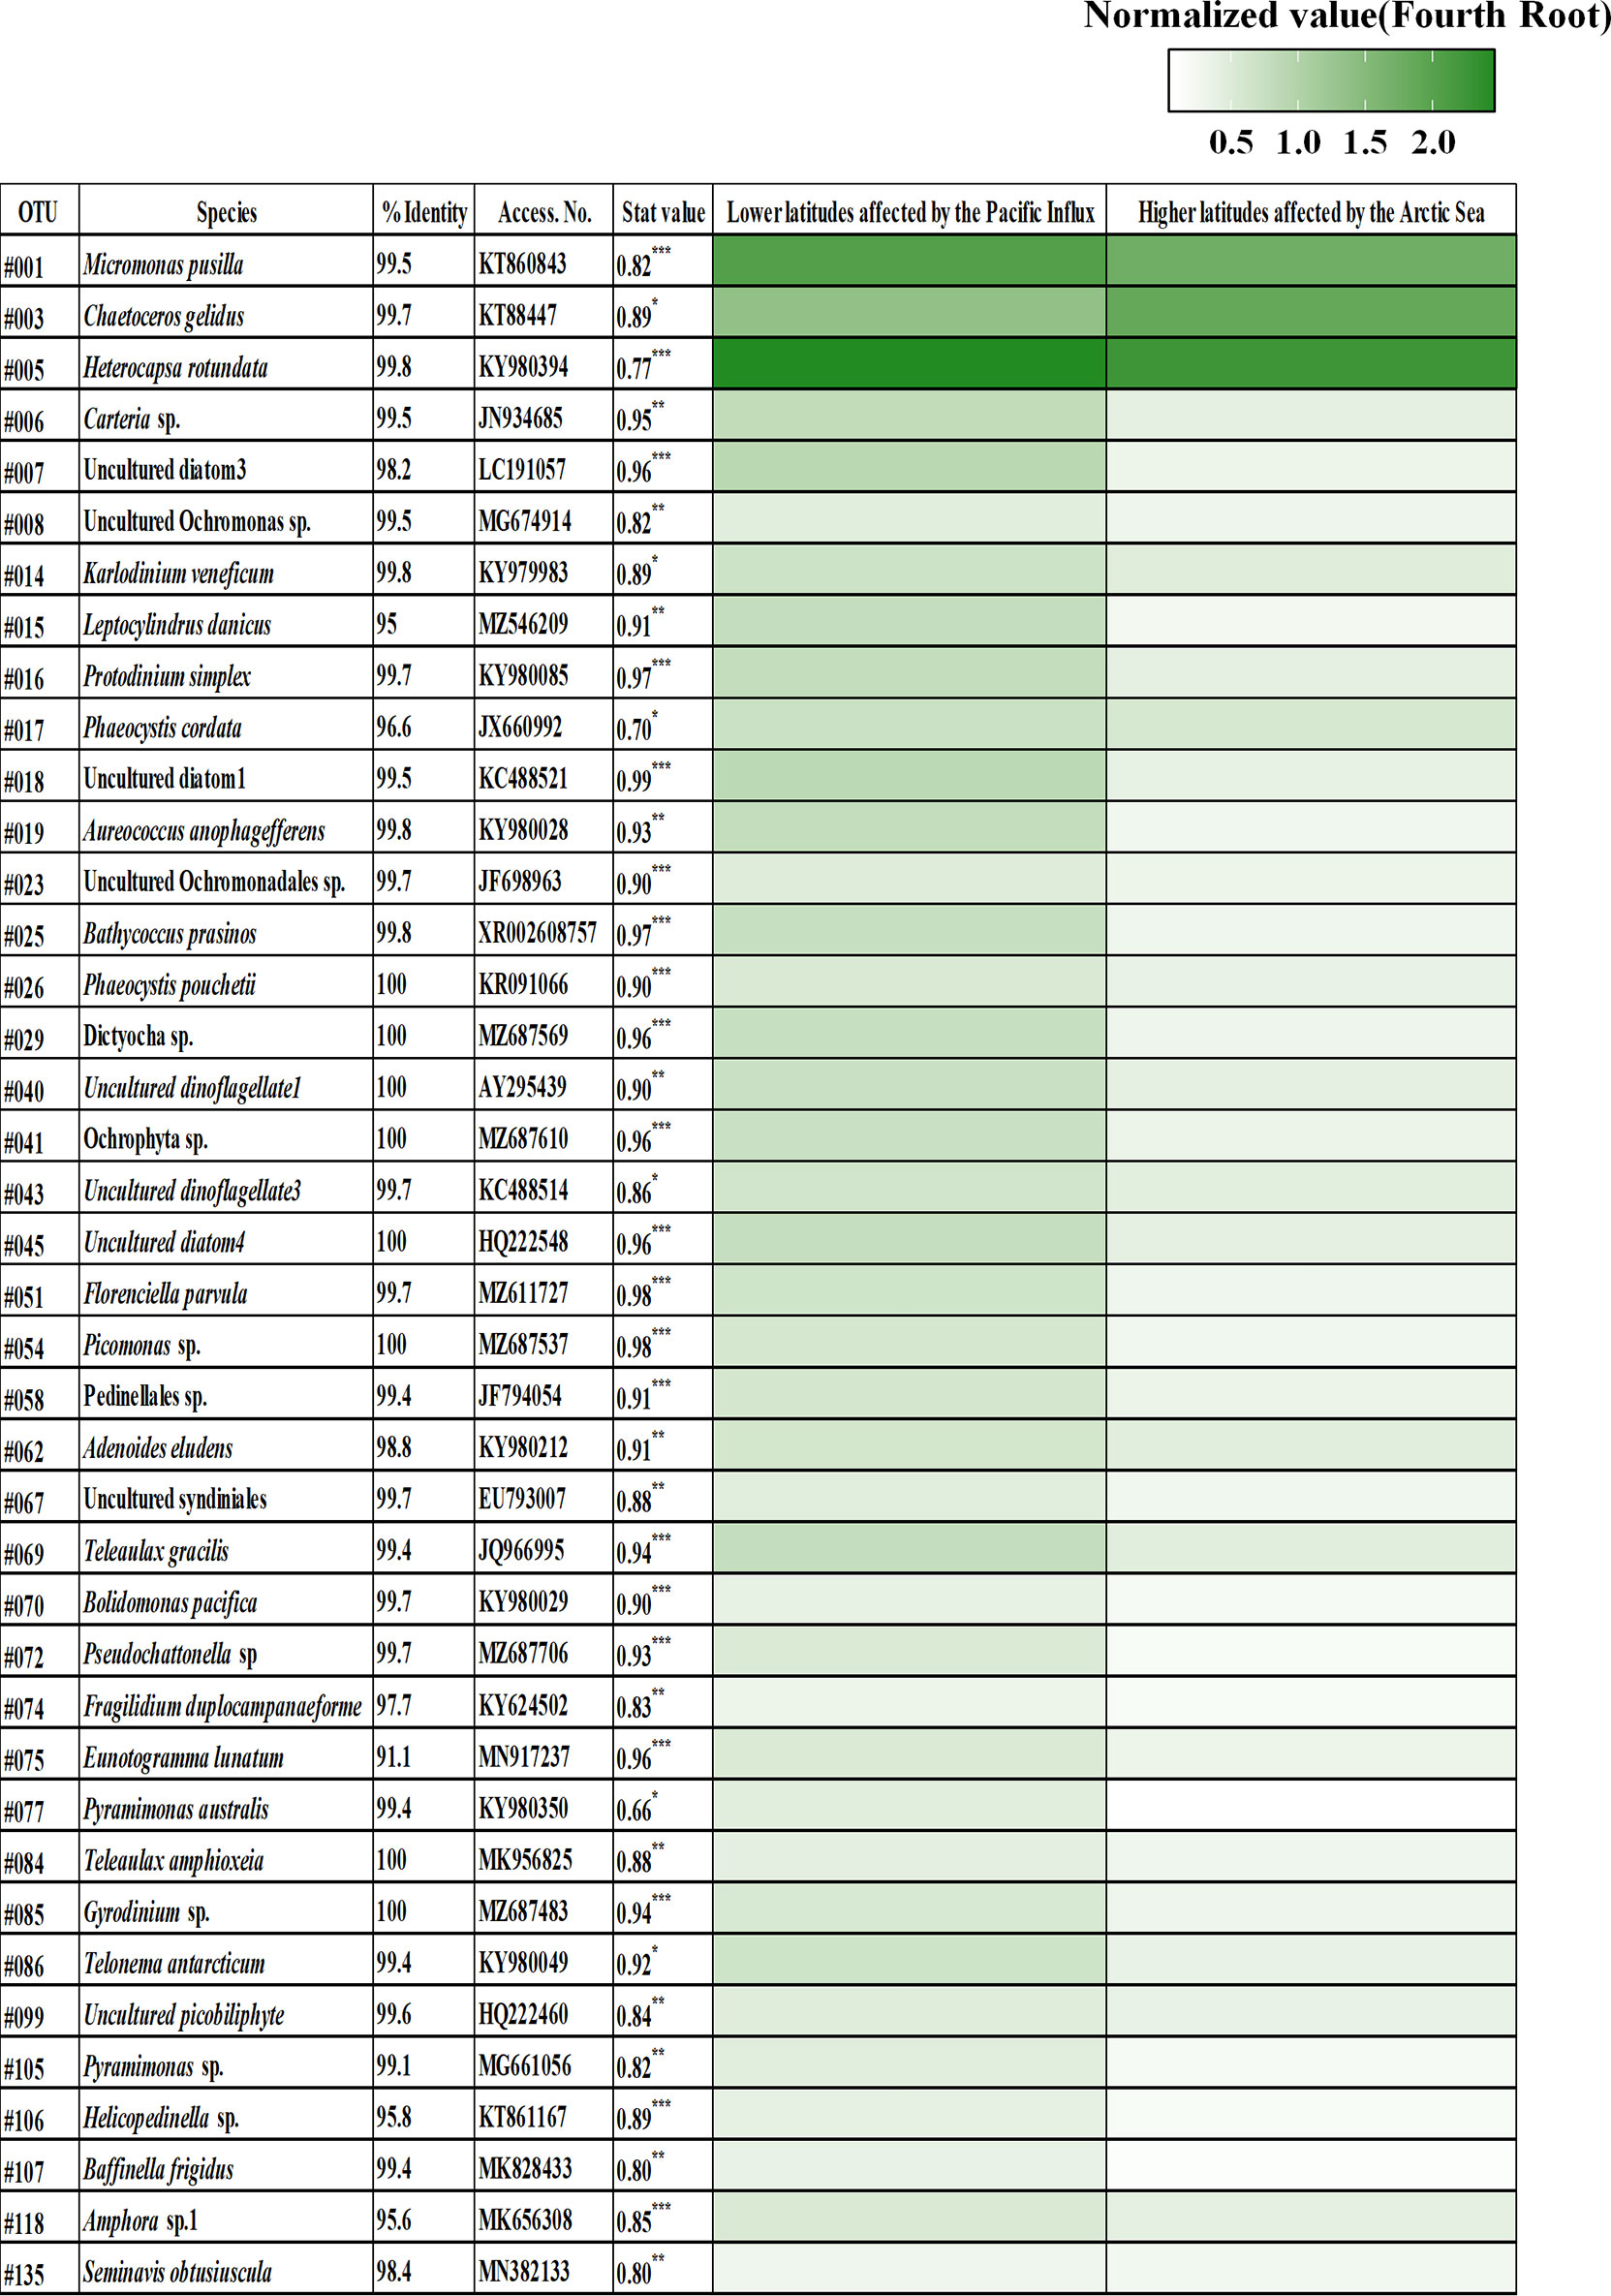
Figure 5 Heatmap showing the phytoplankton indicator species in the Arctic Ocean. The identified phytoplankton at the species level, including the related significant indicator value and p value (*<0.05, **<0.01, and ***<0.001). The heatmap displays the fourth root normalized data at the range of 0 to 3. Two Groups were obtained from the nMDS analysis presented in Figure 3.
Pearson’s correlation analysis between the abundance of water temperature and relative abundances of common planktonic OTUs provided some insight into the relationship between the stimulation and inhibition water temperature effects of the Arctic Ocean (Figure 6). At lower latitudes, water temperature and some phytoplanktonic OTUs [#005, #014 (Karlodinium veneficum, Dinophyta), #025, #043 (uncultured dinoflagellate), and Dinophyta group] showed significant positive correlations (see the caption of Figure 6), while changes in water temperature were negatively correlated with OTU #018 (Uncultured diatom), #028 (Fragilariopsis kerguelensis, Bacillariophyta), #051 (Florenciella parvula, Dictyochophyceae), and #058 (Pedinellales, Dictyochophyceae). Water temperature at higher latitudes was positively correlated with #005, #020 (Chaetoceros sp., Bacillariophyta), #033 (Thalassiosira sp., Bacillariophyta), and Dinophyta. In particular, #014 and #025 in the Group at lower latitudes and #020 and #033 in the Group at higher latitudes increased with increasing water temperature at ranges between -2°C and 5 °C (Figure 6). In the RDA biplot in Figure 7, the lengths of the arrows indicate the relative importance of the variables in explaining the dataset of the environmental factors and indicator phytoplankton OTUs, whereas their angles relative to the axes and to each other indicate the strength of their correlation. RDA revealed seven environmental factors and 40 indicator phytoplankton OTUs in 70 sampling sites, accounting for 17.2% and 15.4% of the variance explained along the first and second axes, respectively. OTUs #001, #025, and #026 (Phaeocystis pouchetii, Haptophyta), involving all surface layers at lower latitudes, were associated with water temperature and salinity, while OTU #003, involving most SCM layers at higher latitudes, was strongly associated with DIP, DIN, and NO3 values.
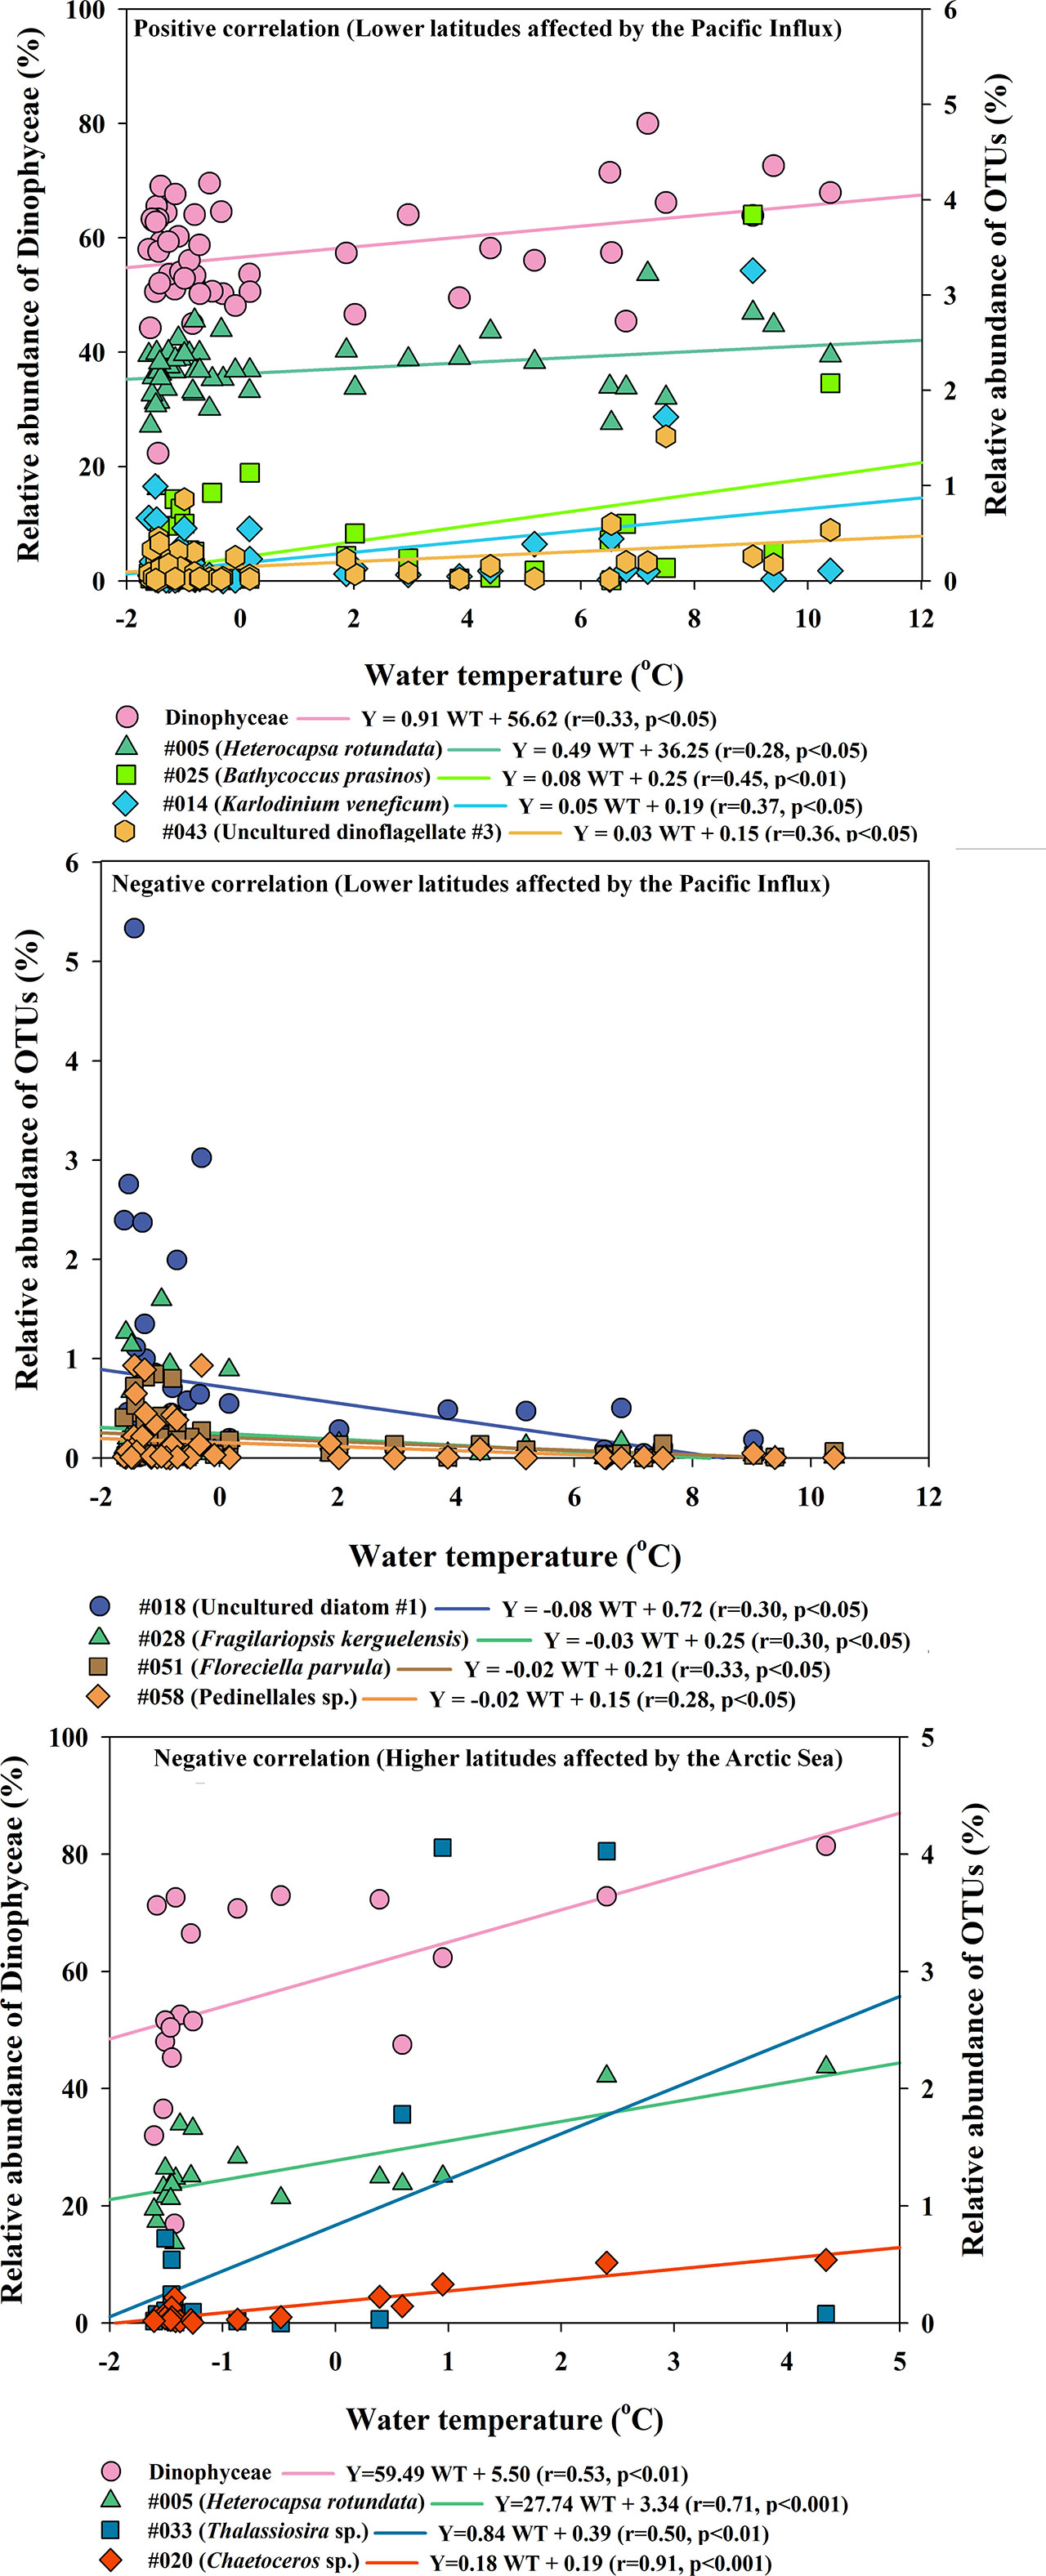
Figure 6 Significant Pearson correlations between common phytoplankton operational taxonomic units and water temperature in the Arctic Ocean. In the Group at lower latitudes, positive and negative correlations were observed, whereas in the Group at higher latitudes, only positive correlations were observed. Two Groups were defined according to the nMDS results of analysis of the phytoplankton dataset (see Figure 3).
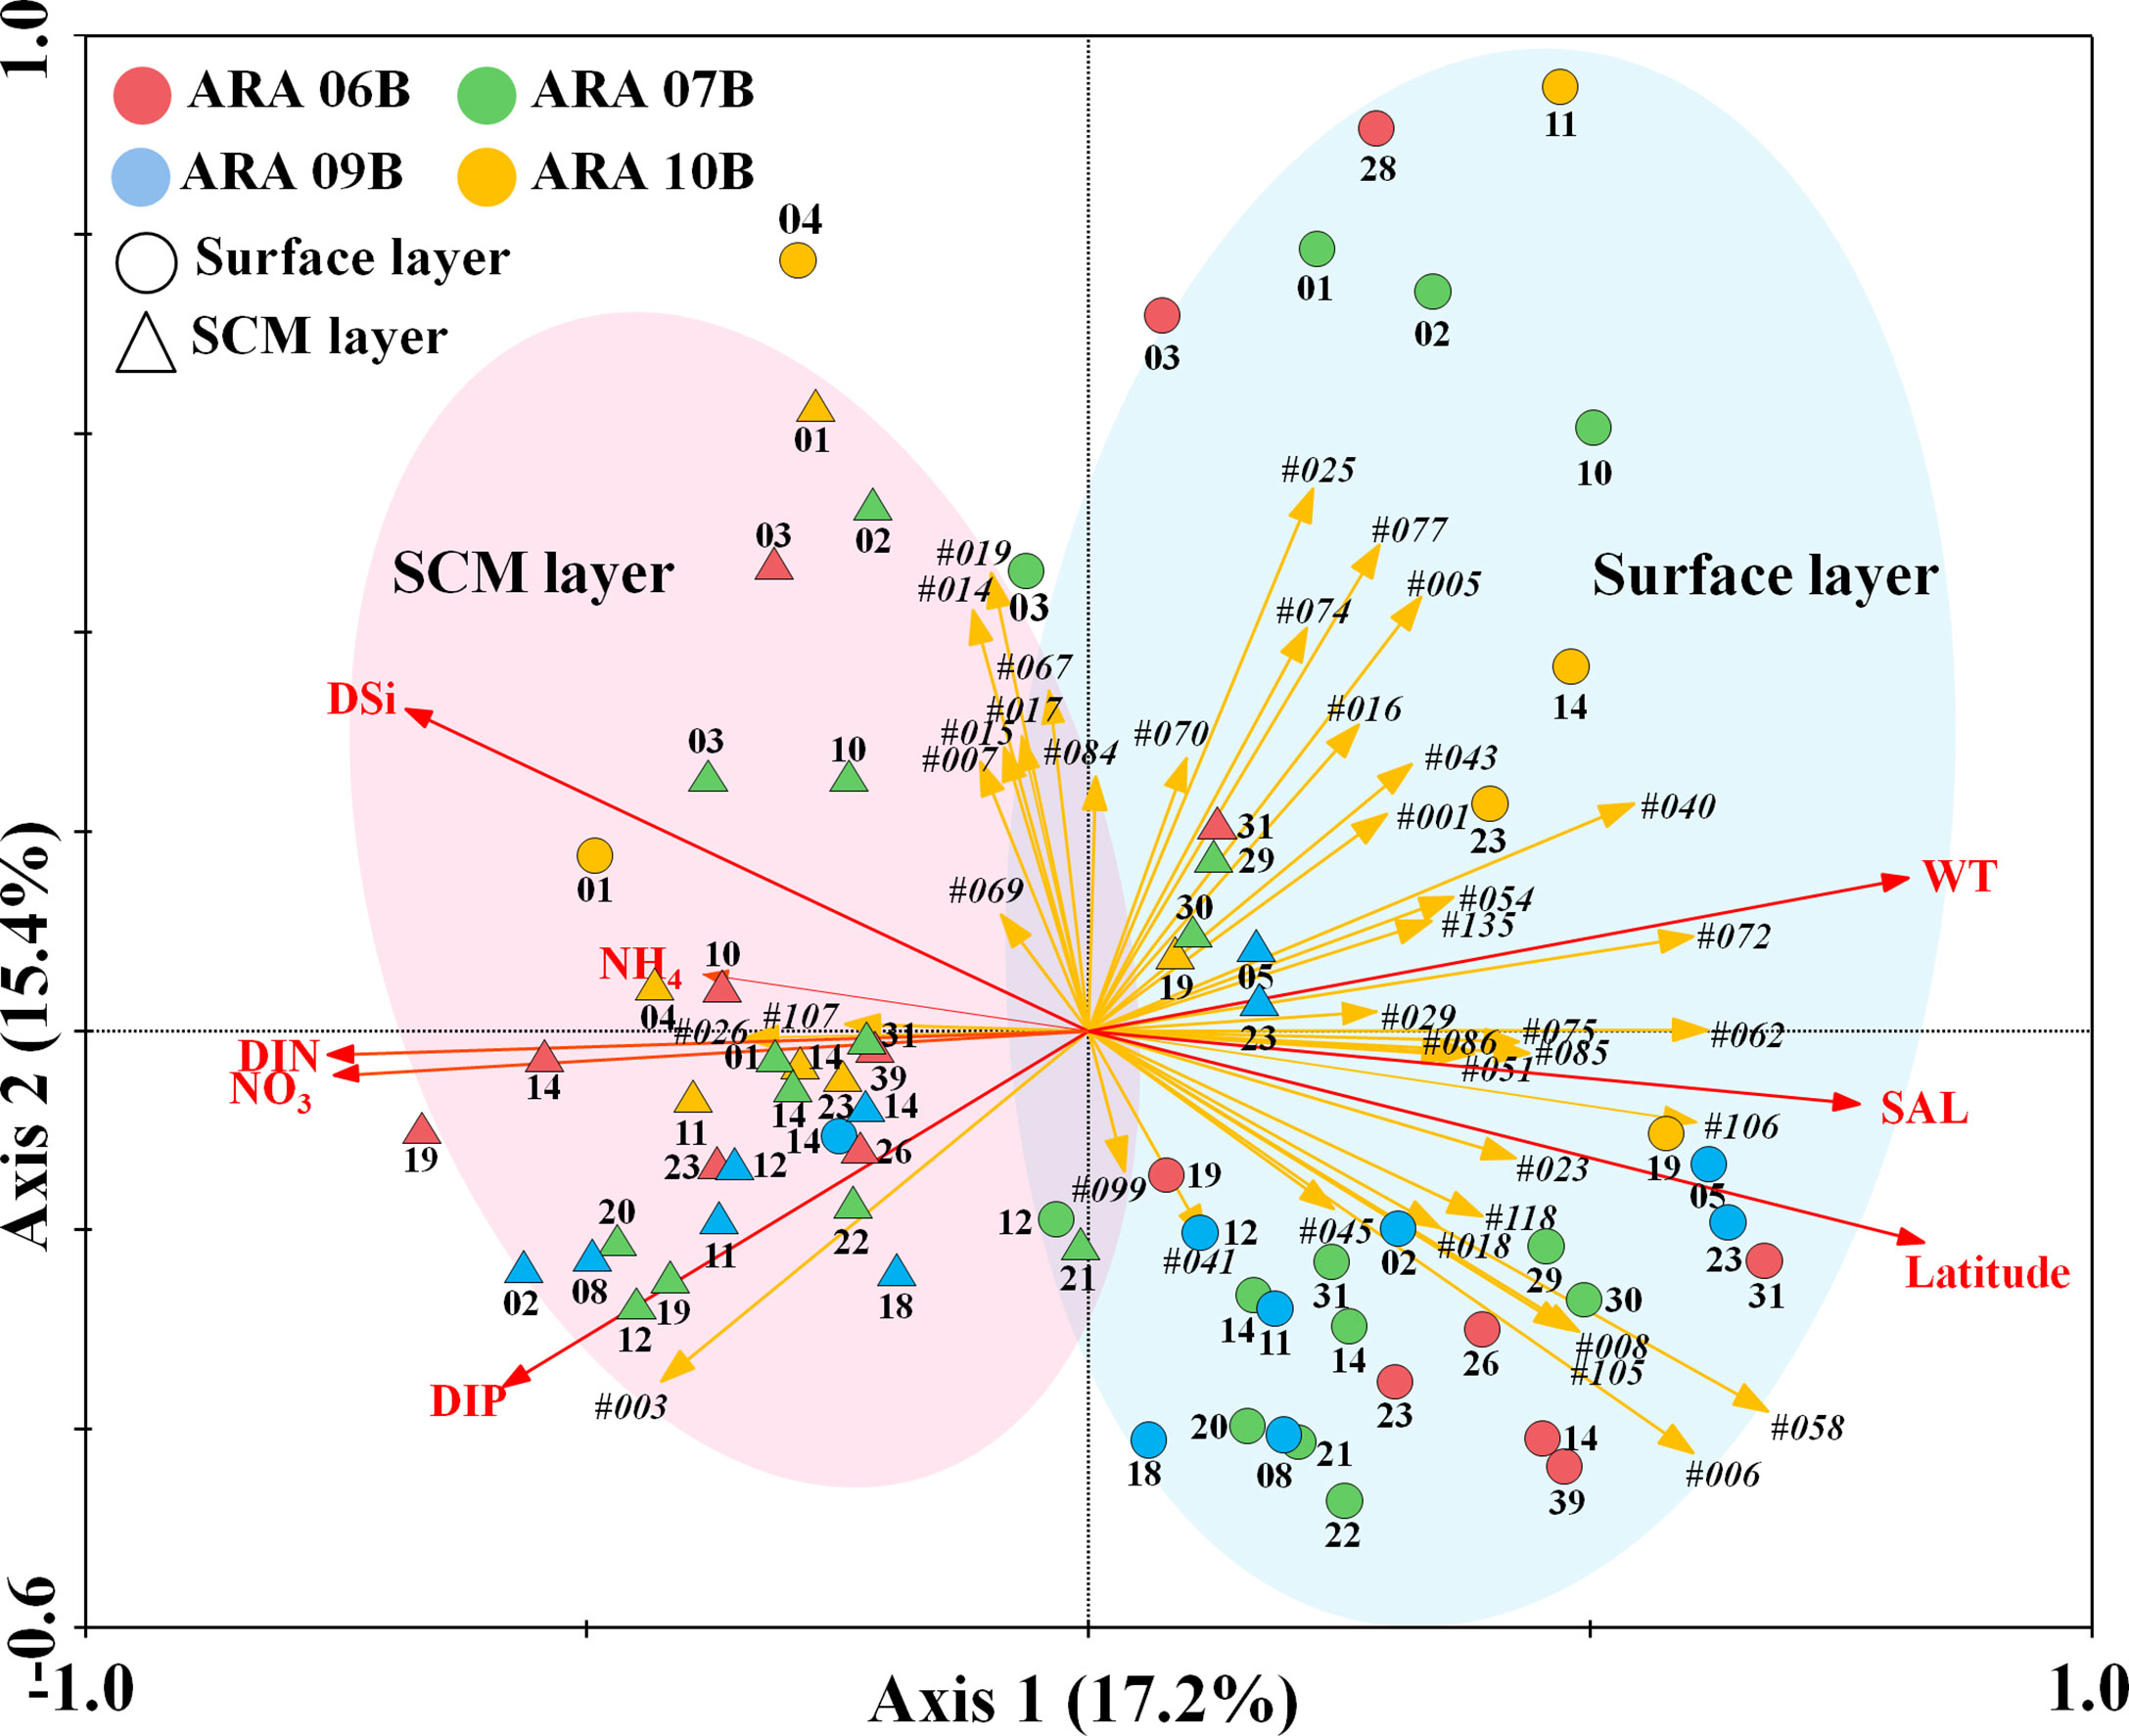
Figure 7 Redundancy analysis (RDA) ordinations of 40 indicated phytoplankton operational taxonomic units (OTUs) analysed using indicator value index (IndVal) and seven environmental factors from 70 sampling sites in the Arctic Ocean. The correlations between the environmental factors (red lines) and indicator species in indicated phytoplankton OTUs (orange arrow lines) and the first two RDA axes are represented by the lengths and angles of the arrows, respectively. The OTU number indicates the indicator phytoplankton species displayed in Figure 5.
Our study of the dynamics of phytoplankton communities focused on core taxa using 18S rDNA metabarcoding. Clustered phytoplankton communities were found to display different characteristics based on latitude changes in the Arctic Ocean (64–80°N). These communities were consistent with the communities found in the warm waters that flow northward through the Bering Strait into the Chukchi Sea and in the waters influenced by summer ice melting in the Arctic area (Shiomoto et al., 2002; Carmack and Wassmann, 2006). The differences in water masses in the Group pertaining to the effects of surface layers in lower latitudes and in the Group pertaining to the effects of SCM layers at lower latitudes (the Bering Strait and bordering area of the Bering Strait and the Southern Chukchi Sea) were divided by water temperature, salinity, and inorganic nutrients in the surface and SCM layers. In the higher latitude sites (most of the Chukchi Sea and Arctic Sea), the water temperature was below 0°C in all the layers; they were clearly distinguished only by salinity. The DIN concentrations in the surface layer were negligible; they were up to 4 μM in the SCM layer; higher concentrations were detected in ARA09B and 10B at some sampling sites (higher latitudes over 74 °N). The DIN concentrations are consistent with the areas of ice melting edges (data not shown). Zhuang et al. (2021) reported that the nitrogen concentration was higher in the higher latitudes (70-75 °N). The limitation of N concentrations could influence the changes in the phytoplankton compositions, ranging from the nano- and micro-sized phytoplankton taxa to pico-sized taxa. The nMDS analysis (Figure 3) indicated that the composition of the phytoplankton community did not change with the years, but it changed with the latitude. This study area is located in a transition zone influenced by the Pacific Water, East Siberian Shelf Water, and Atlantic Water (Nishino et al., 2008). The environmental characteristics are governed by the distribution of these water masses (Jiang et al., 2013). The water masses passing northward through the Bering Strait originate along with the BSW with high salinity in the northern branch of the Bering Slope Current (Aagaard, 1987; Coachman, 1992). In the Chukchi Sea near the Arctic Sea, the transport of BSW dominates the heat flux into the Chukchi Sea during the summer (Steele et al., 2004). This helps drive the seasonal melting of sea ice (Spall, 2007). This water mass has a strong influence on the water temperature, nutrients, and phytoplankton activity in this important gateway to the Arctic Sea (Springer and McRoy, 1993). Furthermore, the ice retreat in the Chukchi Shelf occurred earlier than that in the northern deep-sea areas in late summer (Wang et al., 2020). In the Arctic Sea, the low salinity on the surface could be attributed to the dilution due to the melting of the ice and the discharge of freshwater into the high salinity in the SCM layer. Melting ice reduces the salinity at the surface, causing strong halocline formation and vertical differences in the water column (Wang et al., 2020), resulting in relatively lower chlorophyll a and phytoplankton abundance in the Chukchi shelf (Joo et al., 2012). in vivo fluorescence and chlorophyll a concentrations were higher in the SCM layer than that in the surface layer. In particular, inorganic N concentrations were mostly limited to the surface layers; the surface layer lacking N concentrations showed a lower diversity index, while the relative abundances of Chlorophyta increased above 74°N. The Arctic Sea is one of the most N-limiting areas among the open seas (Brown et al., 2015).
A predominant phytoplankton taxon, OTU #005 (H. rotundata, Dinophyta), was present in almost all sampling sites. There are no earlier reports to indicate why this OTU was so abundant; the dominance of H. rotundata was first recorded in this study. This dinoflagellate species is not endemic to the Arctic and is found throughout the Arctic-boreal biogeographical zone (Okolodkov and Dodge, 1996). The presence of H. rotundata could be related to strong summer transportation through the Strait and southern Chukchi Sea and relatively abundant nutrient concentrations; this dinoflagellate could quickly grow and move into the Chukchi Sea (Lee et al., 2012). Stoecker and Lavrentyev (2018) reported that H. rotundata occurs frequently in temperate low salinity waters and that it could be an important mixotrophic alga in low salinity, turbid waters, such as the coastal Beaufort Sea and Kara Sea. In addition, Millette et al. (2017) reported that H. rotundata is stimulated to feed through light limitation in winter. Therefore, H. rotundata may be transferred to the Arctic Ocean along with the ACW. The phytoplanktons predominant in the Arctic Ocean include Dinophyta, Bacillariophyta, Chrysophyceae, and Dictyochophyceae (Lovejoy et al., 2006; Lovejoy and Potvin, 2011). In addition, the observations of this study are consistent with those of Lassen et al. (2010); groups of larger phytoplankton species, such as diatoms and dinoflagellates, dominate the warmer oceans than the smaller Prasinophycean. Booth et al. (2002) reported that the Chukchi Sea in the summer is often dominated by diatoms. Wang et al. (2020) reported that the water mass of high-nutrient concentrations in the Bering Strait is supplied by the Pacific Ocean. However, inorganic nutrient concentrations, especially N concentrations, were minimal in the Arctic Ocean (Zhang et al., 2021). Therefore, H. rotundata accounted for more than 64% of the Bering Strait could be influenced by the warmer waters from the Pacific currents within the Arctic Circle (Okolodkov and Dodge, 1996).
Other core pico- and/or nano-sized phytoplankton taxa, OTU #001 (M. pusilla, Chlorophyta) and #003 (C. gelidus, Bacillariophyta) were significantly more at the higher latitudes (>74°N) (Table 1). In particular, C. gelidus and M. pusilla were dominant in the Chukchi Sea and Arctic Sea below 0°C. The pan-Arctic C. gelidus is widely distributed in the Arctic, and remains abundant in the summer and early autumn seasons (Tremblay et al., 2006). In particular, this psychrophilic diatom thrives despite the depletion of inorganic nitrogen concentrations at near-freezing temperatures (Schiffrine et al., 2020). Micromonas spp. are abundant in the Arctic Sea (Wang et al., 2020). The picophytoplankton is a significant contributor to overall productivity in the world’s oceans (Worden et al., 2015); it is more efficient in acquiring nutrients (Ardyna et al., 2011). Small-sized phytoplankton can take up nutrients more efficiently because of their high surface-to-volume ratio (Brussaard et al., 2013). Moreover, Marquardt et al. (2016) described Micromonas as an evolutionarily shade-adapted species, inhabiting regions in the Arctic winter darkness. In particular, Micromonas growing at low temperatures in the Arctic and enhancing CO2 solubility are regarded as potential “winners of climate change” (Brussaard et al., 2013; Hoppe et al., 2018). Therefore, during the summer in the Arctic Ocean, the variability in phytoplankton biomass is driven by changes in small-sized phytoplankton. The biomass may further be suppressed by low levels of nutrients in the surface water due to the well-stratified water conditions of the Pacific (Wang et al., 2020).
Different common phytoplanktons were observed at different latitudes; larger-sized diatoms and dinoflagellates appeared mainly in the Bering Strait (lower latitudes) and pico-sized chlorophytes appeared mainly in the northern Chukchi Sea (higher latitudes). The selections of OTU #003 in the Group at lower latitudes, and #001 and #025 (B. prasinos, Chlorophyta) in the Group at higher latitudes were consistent with the ecological appearance of these taxa. The phytoplankton community in the Sub-Arctic Kongsfjorden ecosystem (Svalbard, Norway) showed a predominance of nano- and picophytoplankton such as cryptophytes, chlorophytes, prymnesiophytes, and raphidophytes (Kulk et al., 2018; Payne and Roesler, 2019). The distribution of the phytoplankton community in this study is similar to that in the above reports and others (Coupel et al., 2012). In this study, the occurrence of 11 phytoplankton OTUs and one Dinophyta group were significantly correlated with the changes in water temperature (Figure 6); five OTUs had a positive correlation and four OTUs had a negative correlation in the Group at lower latitudes, and only four OTUs had a positive correlation in the Group at higher latitudes. This change in Dinophyta and OTU #005 (H. rotundata) revealed that their relative abundance increased with increasing water temperature. In the Group at lower latitudes, the four OTUs (#018, #028, #051, and #058) with negative correlations were potential psychrophilic phytoplankton. Further studies to investigate their ecological and physiological effects are warranted. RDA revealed that specific phytoplankton taxa were associated with environmental factors, such as salinity, water temperature, and inorganic nitrogen. In particular, common OTUs (e.g. OTU #001, #003, and #005) revealed ecological connections among the partners of various trophic positions; OTU #003 was related to the DIP factor in most SCM layers, while #001 and #005 were associated with water temperatures in most surface layers.
Studies on the dynamics of core phytoplankton in the Arctic Ocean can be used to understand the implications of Arctic warming. The environmental factors were strongly divided into three Groups: “effects of surface layers at lower latitude,” “effects of SCM layers at lower latitude,” and “effects of higher latitude”. The water masses that flow through the Bering Strait and Chukchi Sea, as well as the low temperature and salinity in the Arctic Sea, could be affected by the ice-melting process, because the phytoplankton community structures are highly dependent on the water mass types. OTU #005 (H. rotundata) is the predominant taxon in the Arctic Oceans, but nano- and pico-sized core phytoplankton such as OTU #003 (C. gelidus) and OTU #001 (M. pusilla) may benefit from extreme climate conditions and are regarded as a potential ‘‘winners of climate change”. In addition, some phytoplankton (OTU #018, #028, #051, and #058) showed potential psychrophilic activity. Although the Arctic Ocean is a very important area of research to interpret climate-related changes, such studies are limited by the difficulties in accessing the investigation area. In addition, limited information is available on the short-term environmental impacts on the phytoplankton communities in the Arctic region. Therefore, to investigate the effect of climate change on phytoplankton communities of the pico-sized taxa through long-term investigations, Arctic based field studies require continuous efforts. This study elucidated the responses of the phytoplankton community to latitudinal differences in late summer seasons and phytoplankton interactions through extreme environmental dynamics.
The datasets presented in this study can be found in online repositories. The names of the repository/repositories and accession number(s) can be found below: https://www.ncbi.nlm.nih.gov/genbank/, PRJNA667130.
HMJ and KEK share first authorship. HMJ and SWJ designed the research plan; HMJ, KEK, H-JK, K-HC, JJ, and YL performed the experiments and analysed data; HMJ, JSP, EJY, T-KL, S-HK, and SWJ discussed the results; HMJ, KEK, and SWJ wrote the paper. All authors contributed to the article and approved the submitted version.
This research was supported by the National Research Foundation (NRF-2020R1A2C2005970) funded by the Ministry of Science and ICT(MSIT) of Republic of Korea and supported by the research projects (project titled “Diagnosis, treatment and control technology based on big data of infectious virus in marine environment, Ref. No. 21210466” and “Korea-Arctic Ocean Warming and Response of Ecosystem, K-AWARE, KOPRI, 1525011760”) funded by the Ministry of Oceans and Fisheries (MOF) of Republic of Korea.
The authors declare that the research was conducted in the absence of any commercial or financial relationships that could be construed as a potential conflict of interest.
All claims expressed in this article are solely those of the authors and do not necessarily represent those of their affiliated organizations, or those of the publisher, the editors and the reviewers. Any product that may be evaluated in this article, or claim that may be made by its manufacturer, is not guaranteed or endorsed by the publisher.
The stored genomic DNA samples and fixed phytoplankton samples were obtained from the Library of Marine Samples of Korea Institute of Ocean Science & Technology (KIOST), South Korea.
The Supplementary Material for this article can be found online at: https://www.frontiersin.org/articles/10.3389/fmars.2022.879911/full#supplementary-material
Aagaard K. (1987). “Physical Oceanography of the Chukchi Sea: An Overview,” in Chuckchi Sea Information Update (USA: D.A. Hale. U.S. Department of Commerce, National Oceanic and Atmospheric Administration, National Ocean Service), 3–10.
Aagaard K., Weingartner T. J., Danielson S. L., Woodgate R. A., Johnson G. C., Whitledge T. E. (2006). Some Controls on Flow and Salinity in Bering Strait. Geophysic. Res. Lett. 33, L19602. doi: 10.1029/2006GL026612
Altschul S. F., Gish W., Miller W., Myers E. W., Lipman D. J. (1990). Basic Local Alignment Search Tool. J. Mol. Biol. 215, 403–410. doi: 10.1016/S0022-2836(05)80360-2
Amend A. S., Seifert K. A., Bruns T. D. (2010). Quantifying Microbial Communities With 454 Pyrosequencing: Does Read Abundance Count? Mol. Ecol. 19, 5555–5565. doi: 10.1111/j.1365-294X.2010.04898.x
Andrews S. (2010). "FastQC: A Quality Control Tool for High Throughput Sequence Data" (Babraham Institute, Cambridge, United Kingdom: Babraham Bioinformatics).
Ardyna M., Gosselin M., Michel C., Poulin M., Tremblay J.-Ë. (2011). Environmental Forcing of Phytoplankton Community Structure and Function in the Canadian High Arctic: Contrasting Oligotrophic and Eutrophic Regions. Mar. Ecol. Prog. Ser. 442, 37–57. doi: 10.3354/meps09378
Ardyna M., Mundy C. J., Mills M. M., Oziel L., Grondin P.-L., Lacour L., et al. (2020). Environmental Drivers of Under-Ice Phytoplankton Bloom Dynamics in the Arctic Ocean. Elemmenta Sci. Anthropocene 8, 30. doi: 10.1525/elementa.430
Arrigo K. R., Perovich D. K., Pickart R. S., Brown Z. W., Van Dijken G. L., Lowry K. E., et al. (2012). Massive Phytoplankton Blooms Under Arctic Sea Ice. Science 336, 1408–1408. doi: 10.1126/science.1215065
Arrigo K. R., Perovich D. K., Pickart R. S., Brown Z. W., Van Dijken G. L., Lowry K. E., et al. (2014). Phytoplankton Blooms Beneath the Sea Ice in the Chukchi Sea. Deep Sea Res. Part II: Topical Stud. Oceanog. 105, 1–16. doi: 10.1126/science.1215065
Arrigo K. R., Van Dijken G. L. (2011). Secular Trends in Arctic Ocean Net Primary Production. J. Geophysic. Res.: Oceans 116, C09011. doi: 10.1029/2011JC007151
Babin M. (2020). Climate Change Tweaks Arctic Marine Ecosystems. Science 369, 137–138. doi: 10.1126/science.abd1231
Booth B. C., Larouche P., Bélanger S., Klein B., Amiel D., Mei Z. P. (2002). Dynamics of Chaetoceros Socialis Blooms in the North Water. Deep Sea Res. Part II: Topical Stud. Oceanog. 49, 5003–5025. doi: 10.1016/S0967-0645(02)00175-3
Brown Z. W., Casciotti K. L., Pickart R. S., Swift J. H., Arrigo K. R. (2015). Aspects of the Marine Nitrogen Cycle of the Chukchi Sea Shelf and Canada Basin. Deep Sea Res. Part II: Topical Stud. Oceanog. 118, 73–87. doi: 10.1016/j.dsr2.2015.02.009
Brussaard C. P. D., Noordeloos A. A. M., Witte H., Collenteur M. C. J., Schulz K. G., Ludwig A., et al. (2013). Arctic Microbial Community Dynamics Influenced by Elevated CO2 Levels. Biogeosciences 10, 719–731. doi: 10.5194/bg-10-719-2013
Caporaso J. G., Kuczynski J., Stombaugh J., Bittinger K., Bushman F. D., Costello E. K., et al. (2010). QIIME Allows Analysis of High-Throughput Community Sequencing Data. Nat. Methods 7, 335–336. doi: 10.1038/nmeth.f.303
Carmack E., Wassmann P. (2006). Food Webs and Physical–Biological Coupling on Pan-Arctic Shelves: Unifying Concepts and Comprehensive Perspectives. Prog. Oceanog. 71, 446–477. doi: 10.1016/j.pocean.2006.10.004
Clarke K. R., Gorley R., Somerfield P. J., Warwick R. (2001). Change in Marine Communities: An Approach to Statistical Analysis and Interpretation (Plymouth, U.K: Primer-E Ltd).
Coachman L. (1992). Results of the Third Joint US-USSR Bering & Chukchi Seas Expedition (BERPAC), Summer 1988 (Washington, DC: U.S. Fish and Wildlife Service).
Codispoti L. A., Flagg C., Kelly V., Swift J. H. (2005). Hydrographic Conditions During the 2002 SBI Process Experiments. Deep Sea Res. Part II: Topical Stud. Oceanog. 52, 3199–3226. doi: 10.1016/j.dsr2.2005.10.007
Comeau A. M., Li W. K., Tremblay J.É, Carmack E. C., Lovejoy C. (2011). Arctic Ocean Microbial Community Structure Before and After the 2007 Record Sea Ice Minimum. PloS One 6, e27492. doi: 10.1371/journal.pone.0027492
Coupel P., Jin H. Y., Joo M., Horner R., Bouvet H. A., Sicre M. A., et al. (2012). Phytoplankton Distribution in Unusually Low Sea Ice Cover Over the Pacific Arctic. Biogeosciences 9, 4835–4850. doi: 10.5194/bg-9-4835-2012
Coupel P., Matsuoka A., Ruiz-Pino D., Gosselin M., Marie D., Tremblay J.-É, et al. (2015). Pigment Signatures of Phytoplankton Communities in the Beaufort Sea. Biogeosciences 12, 991–1006. doi: 10.5194/bg-12-991-2015
De Caceres M., Jansen F. (2016). Package ‘indicspecies’. Relationship between species and groups of sites. R package version (1.7.6). Available at: http://th.archive.ubuntu.com/cran/web/packages/indicspecies/.
Dufrêne M., Legendre P. (1997). Species Assemblages and Indicator Species:the Need for a Flexible Asymmetrical Approach Species. Ecol. Monogr. 67, 345–366. doi: 10.1890/0012-9615(1997)067[0345:SAAIST]2.0.CO;2
Fujiwara A., Hirawake T., Suzuki K., Imai I., Saitoh S. I. (2014). Timing of Sea Ice Retreat can Alter Phytoplankton Community Structure in the Western Arctic Ocean. Biogeosciences 11, 1705–1716. doi: 10.5194/bg-11-1705-2014
Grebmeier J. M., Mcroy C. P., Feder H. M. (1988). Pelagic-Benthic Coupling on the Shelf of the Northern Bering and Chukchi Seas. 1. Food Supply Source and Benthic Biomass. Mar. Ecol. Prog. Ser. 48, 57–67. doi: 10.3354/meps048057
Hamilton A. K., Lovejoy C., Galand P. E., Ingram R. G. (2008). Water Masses and Biogeography of Picoeukaryote Assemblages in a Cold Hydrographically Complex System. Limnol. Oceanog. 53, 922–935. doi: 10.4319/lo.2008.53.3.0922
Hill V., Ardyna M., Lee S. H., Varela D. E. (2018). Decadal Trends in Phytoplankton Production in the Pacific Arctic Region From 1950 to 2012. Deep Sea Res. Part II: Topical Stud. Oceanog. 152, 82–94. doi: 10.1016/j.dsr2.2016.12.015
Hill V., Cota G. (2005). Spatial Patterns of Primary Production on the Shelf, Slope and Basin of the Western Arctic in 2002. Deep Sea Res. Part II: Topical Stud. Oceanog. 52, 3344–3354. doi: 10.1016/j.dsr2.2005.10.001
Hoppe C. J. M., Flintrop C. M., Rost B. (2018). The Arctic Picoeukaryote Micromonas Pusilla Benefits Synergistically From Warming and Ocean Acidification. Biogeosciences 15, 4353–4365. doi: 10.5194/bg-15-4353-2018
Jiang Y., Yang E. J., Min J.-O., Kang S.-H., Lee S. (2013). Using Pelagic Ciliated Microzooplankton Communities as an Indicator for Monitoring Environmental Condition Under Impact of Summer Sea-Ice Reduction in Western Arctic Ocean. Ecol. Indic. 34, 380–390. doi: 10.1016/j.ecolind.2013.05.026
Joo H. M., Lee S. H., Jung S. W., Dahms H.-U., Lee J. H. (2012). Latitudinal Variation of Phytoplankton Communities in the Western Arctic Ocean. Deep Sea Res. Part II: Topical Stud. Oceanog. 81, 3–17. doi: 10.1016/j.dsr2.2011.06.004
Jung S. W., Kang D., Kim H. J., Shin H. H., Park J. S., Park S. Y., et al. (2018). Mapping Distribution of Cysts of Recent Dinoflagellate and Cochlodinium Polykrikoides Using Next-Generation Sequencing and Morphological Approaches in South Sea, Korea. Sci. Rep. 8, 7011. doi: 10.1038/s41598-018-25345-4
Jung S.W., Kang J., Park J.S., Joo H.M., Suh S.-S., Kang D., et al. (2021). Dynamic Bacterial Community Response to Akashiwo Sanguinea (Dinophyceae) Bloom in Indoor Marine Microcosms. Sci. Rep. 11, 6983. doi: 10.1038/s41598-021-86590-8
Kang J., Park J. S., Jung S. W., Kim H. J., Joo H. M., Kang D., et al. (2021). Zooming on Dynamics of Marine Microbial Communities in the Phycosphere of Akashiwo Sanguinea (Dinophyta) Blooms. Mol. Ecol. 30, 207–221. doi: 10.1111/mec.15714
Kim H. J., Park J. S., Lee T. K., Kang D., Kang J. H., Shin K., et al. (2021). Dynamics of Marine Bacterial Biofouling Communities After Initial Alteromonas Genovensis Biofilm Attachment to Anti-Fouling Paint Substrates. Mar. pollut. Bull. 172, 112895. doi: 10.1016/j.marpolbul.2021.112895
Kulk G., Van De Poll W. H., Buma A. G. J. (2018). Photophysiology of Nitrate Limited Phytoplankton Communities in Kongsfjorden, Spitsbergen. Limnol. Oceanog. 63, 2606–2617. doi: 10.1002/lno.10963
Lassen M. K., Nielsen K. D., Richardson K., Garde K., Schlüter L. (2010). The Effects of Temperature Increases on a Temperate Phytoplankton Community — A Mesocosm Climate Change Scenario. J. Exp. Mar. Biol. Ecol. 383, 79–88. doi: 10.1016/j.jembe.2009.10.014
Lee S. H., Joo H. M., Liu Z., Chen J., He J. (2012). Phytoplankton Productivity in Newly Opened Waters of Thwestern Arctic Ocean. Deep Sea Res. Part II: Topical Stud. Oceanog. 81, 18–27. doi: 10.1016/j.dsr2.2011.06.005
Lee Y., Min J. O., Yang E. J., Cho K. H., Jung J., Park J., et al. (2019). Influence of Sea Ice Concentration on Phytoplankton Community Structure in the Chukchi and East Siberian Seas, Pacific Arctic Ocean. Deep Sea Res. Part I: Oceanog. Res. Papers 147, 54–64. doi: 10.1016/j.dsr.2019.04.001
Li W., Chang Y. (2017). CD-HIT-OTU-MiSeq, an Improved Approach for Clustering and Analyzing Paired End MiSeq 16s rRNA Sequences. bioRxiv 153783. doi: 10.1101/153783
Lovejoy C., Massana R., Pedrós-Alió C. (2006). Diversity and Distribution of Marine Microbial Eukaryotes in the Arctic Ocean and Adjacent Seas. Appl. Environ. Microbiol. 72, 3085–3095. doi: 10.1128/AEM.72.5.3085-3095.2006
Lovejoy C., Potvin M. (2011). Microbial Eukaryotic Distribution in a Dynamic Beaufort Sea and the Arctic Ocean. J. Plankton Res. 33, 431–444. doi: 10.1093/plankt/fbq124
Magoč T., Salzberg S. L. (2011). FLASH: Fast Length Adjustment of Short Reads to Improve Genome Assemblies. Bioinformatics 27, 2957–2963. doi: 10.1093/bioinformatics/btr507
Marquardt M., Vader A., Stübner E. I., Reigstad M., Gabrielsen T. M., Stams A. J. M. (2016). Strong Seasonality of Marine Microbial Eukaryotes in a High-Arctic Fjord (Isfjorden, in West Spitsbergen, Norway). Appl. Environ. Microbiol. 82, 1868–1880. doi: 10.1128/AEM.03208-15
Martin J., Tremblay J.-Ë., Gagnon J., Tremblay G., Lapoussière A., Jose C., et al. (2010). Prevalence, Structure and Properties of Subsurface Chlorophyll Maxima in Canadian Arctic Waters. Mar. Ecol. Prog. Ser. 412, 69–84. doi: 10.3354/meps08666
Millette N. C., Pierson J. J., Aceves A., Stoecker D. K. (2017). Mixotrophy in Heterocapsa Rotundata: A Mechanism for Dominating the Winter Phytoplankton. Limnol. Oceanog. 62, 836–845. doi: 10.1002/lno.10470
Mordy C. W., Bell S., Cokelet E. D., Ladd C., Lebon G., Proctor P., et al. (2020). Seasonal and Interannual Variability of Nitrate in the Eastern Chukchi Sea: Transport and Winter Replenishment. Deep Sea Res. Part II: Topical Stud. Oceanog. 177, 104807. doi: 10.1016/j.dsr2.2020.104807
Nishino S., Shimada K., Itoh M., Yamamoto-Kawai M., Chiba S. (2008). East–west Differences in Water Mass, Nutrient, and Chlorophyll a Distributions in the Sea Ice Reduction Region of the Western Arctic Ocean. J. Geophysic. Res.: Oceans 113, C00A01. doi: 10.1029/2007JC004666
Okolodkov Y. B., Dodge J. D. (1996). Biodiversity and Biogeography of Planktonic Dinoflagellates in the Arctic Ocean. J. Exp. Mar. Biol. Ecol. 202, 19–27. doi: 10.1016/0022-0981(96)00028-7
Oksanen J., Simpson G. L., Blanchet F. G., Kindt R., Legendre P., Minchin ,. P. R., et al. (2022). “Package ‘Vegan’,” in Community Ecology Package. Available at: https://github.com/vegandevs/vegan.
Oziel L., Baudena A., Ardyna M., Massicotte P., Randelhoff A., Sallée J.-B., et al. (2020). Faster Atlantic Currents Drive Poleward Expansion of Temperate Phytoplankton in the Arctic Ocean. Nat. Commun. 11, 1705. doi: 10.1038/s41467-020-15485-5
Payne C. M., Roesler C. S. (2019). Characterising the Influence of Atlantic Water Intrusion on Water Mass Formation and Phytoplankton Distribution in Kongsfjorden, Svalbard. Continental Shelf Res. 191, 104005. doi: 10.1016/j.csr.2019.104005
Prokopowich C. D., Gregory T. R., Crease T. J. (2003). The Correlation Between rDNA Copy Number and Genome Size in Eukaryotes. Genome 46, 48–50. doi: 10.1139/g02-103
Schiffrine N., Tremblay J.-Ë., Babin M. (2020). Growth and Elemental Stoichiometry of the Ecologically-Relevant Arctic Diatom Chaetoceros Gelidus: A Mix of Polar and Temperate. Front. Mar. Sci. 6. doi: 10.3389/fmars.2019.00790
Schloss P. D., Westcott S. L., Ryabin T., Hall J. R., Hartmann M., Hollister E. B., et al. (2009). Introducing Mothur: Open-Source, Platform-Independent, Community-Supported Software for Describing and Comparing Microbial Communities. Appl. Environ. Microbiol. 75, 7537–7541. doi: 10.1128/AEM.01541-09
Shimada K., Kamoshida T., Itoh M., Nishino S., Carmack E., Mclaughlin F., et al. (2006). Pacific Ocean Inflow: Influence on Catastrophic Reduction of Sea Ice Cover in the Arctic Ocean. Geophysic. Res. Lett. 33, L08605. doi: 10.1029/2005GL025624
Shiomoto A., Saitoh S.-I., Imai K., Toratani M., Ishida Y., Sasaoka K. (2002). Interannual Variation in Phytoplankton Biomass in the Bering Sea Basin in the 1990s. Prog. Oceanog. 55, 147–163. doi: 10.1016/S0079-6611(02)00075-7
Spall M. A. (2007). Circulation and Water Mass Transformation in a Model of the Chukchi Sea. J. Geophysic. Res: Oceans 112, C05025. doi: 10.1029/2005jc003364
Springer A. M., McRoy C. P. (1993). The Paradox of Pelagic Food Webs in the Northern Bering Sea—III. Patterns of Primary Production. Continental Shelf Res. 13, 575–599. doi: 10.1016/0278-4343(93)90095-F
Steele M., Morison J., Ermold W., Rigor I., Ortmeyer M., Shimada K. (2004). Circulation of Summer Pacific Halocline Water in the Arctic Ocean. J. Geophysic. Res: Oceans 109, C02027. doi: 10.1029/2003
Stoecker D. K., Lavrentyev P. J. (2018). Mixotrophic Plankton in the Polar Seas: A Pan-Arctic Review. Front. Mar. Sci. 5. doi: 10.3389/fmars.2018.00292
Stroeve J. C., Markus T., Boisvert L., Miller J., Barrett A. (2014). Changes in Arctic Melt Season and Implications for Sea Ice Loss. Geophysic. Res. Lett. 41, 1216–1225. doi: 10.1002/2013GL058951
Sukhanova I. N., Flint M. V., Pautova L. A., Stockwell D. A., Grebmeier J. M., Sergeeva V. M. (2009). Phytoplankton of the Western Arctic in the Spring and Summer of 2002: Structure and Seasonal Changes. Deep Sea Res. Part II: Topical Stud. Oceanog. 56, 1223–1236. doi: 10.1016/j.dsr2.2008.12.030
Ter Braak C. J. (1986). Canonical Correspondence Analysis: A New Eigenvector Technique for Multivariate Direct Gradient Analysis. Ecology 67, 1167–1179. doi: 10.2307/1938672
Ter Braak C. J., Smilauer P. (2002) "CANOCO Reference Manual and CanoDraw for Windows User's Guide: Software for Canonical Community Ordination (Version 4.5)". Available at: www.canoco.com.
Tremblay J.-Ë., Michel C., Hobson K. A., Gosselin M., Price N. M. (2006). Bloom Dynamics in Early Opening Waters of the Arctic Ocean. Limnol. Oceanog. 51, 900–912. doi: 10.4319/lo.2006.51.2.0900
Wang Y., Kang J., Xiang P., Wang W., Lin M. (2020). Short Timeframe Changes of Environmental Impacts on Summer Phytoplankton in the Chukchi Sea and Surrounding Areas in a Regional Scaling. Ecol. Indic. 117, 106693. doi: 10.1016/j.ecolind.2020.106693
Weingartner T., Cavalieri D., Aagaard K., Sasaki Y. (1998). Circulation, Dense Water Formation, and Outflow on the Northeast Chukchi Shelf. J. Geophysic. Research: Oceans 103, 7647–7661. doi: 10.1029/98JC00374
Weingartner T. J., Cavalieri D. J., Woodgate R., Danielson S., Sasaki Y., Cavalieri D. (2005). Circulation on the North Central Chukchi Sea Shelf. Deep Sea Res. Part II: Topical Stud. Oceanog. 52, 3150–3174. doi: 10.1016/j.dsr2.2005.10.015
Wickham H., Chang W., Henry L., Pedersen T. L., Takahashi K., Wilke C., et al. (2016). Ggplot2: Create Elegant Data Visualisations Using the Grammar of Graphics. R Package version 2. Available at: http://cran.r-project.org/web/packages/roxygen2/index.html.
Worden A.Z., Follows M.J., Giovannoni S.J., Wilken S., Zimmerman A.E., Keeling P.J., et al (2015). Rethinking the Marine Carbon Cycle: Factoring in the Multifarious Lifestyles of Microbes. Science 347, 1257594. doi: 10.1126/science.1257594.
Zhang F., He J., Jin H., Hao Q., Gao Z., Sun H. (2021). Comparison of Picoeukaryote Community Structures and Their Environmental Relationships Between Summer and Autumn in the Southern Chukchi Sea. Extremophiles: Life under Extreme Conditions 25, 235–248. doi: 10.1007/s00792-021-01222-3
Keywords: Arctic Ocean, core phytoplankton, latitudinal differences, 18S metabarcoding, nano- and pico-phytoplankton
Citation: Joo HM, Kim KE, Park JS, Kim H-J, Yang EJ, Lee T-K, Cho K-H, Jung J, Lee Y, Kang S-H and Jung SW (2022) Ecological Responses of Core Phytoplankton by Latitudinal Differences in the Arctic Ocean in Late Summer Revealed by 18S rDNA Metabarcoding. Front. Mar. Sci. 9:879911. doi: 10.3389/fmars.2022.879911
Received: 20 February 2022; Accepted: 30 May 2022;
Published: 29 June 2022.
Edited by:
Alessandro Bergamasco, National Research Council (CNR), ItalyReviewed by:
Haiyan Jin, Ministry of Natural Resources, ChinaCopyright © 2022 Joo, Kim, Park, Kim, Yang, Lee, Cho, Jung, Lee, Kang and Jung. This is an open-access article distributed under the terms of the Creative Commons Attribution License (CC BY). The use, distribution or reproduction in other forums is permitted, provided the original author(s) and the copyright owner(s) are credited and that the original publication in this journal is cited, in accordance with accepted academic practice. No use, distribution or reproduction is permitted which does not comply with these terms.
*Correspondence: Seung Won Jung, diatoms@kiost.ac.kr
Disclaimer: All claims expressed in this article are solely those of the authors and do not necessarily represent those of their affiliated organizations, or those of the publisher, the editors and the reviewers. Any product that may be evaluated in this article or claim that may be made by its manufacturer is not guaranteed or endorsed by the publisher.
Research integrity at Frontiers
Learn more about the work of our research integrity team to safeguard the quality of each article we publish.