
94% of researchers rate our articles as excellent or good
Learn more about the work of our research integrity team to safeguard the quality of each article we publish.
Find out more
ORIGINAL RESEARCH article
Front. Mar. Sci. , 27 September 2022
Sec. Marine Biology
Volume 9 - 2022 | https://doi.org/10.3389/fmars.2022.997591
This article is part of the Research Topic Ocean-Biota System: Integrated Approach to Climate Change Impacts on Plankton Communities in Coastal and Pelagic Environments View all 8 articles
 Yanping Zhong1,2
 Edward A. Laws3
 Jiafu Zhuang1
 Jingxiao Wang2Peixuan Wang2
 Caiyun Zhang2
 Xin Liu2,4*
 Bangqin Huang2,4
The El Niño Southern Oscillation (ENSO) is one of the most important drivers of interannual variations of marine ecosystems, especially monsoonal ecosystems. The channel effect in a strait amplifies the impact of monsoons and may be an ideal area to study ecosystem responses to ENSO events. Previous studies have shown that physical processes in the Taiwan Strait (TWS) vary during the different ENSO phases, but the biological responses are still unclear. In this study, we found clear differences in the physical, chemical, and biological characteristics of the TWS between different ENSO phases based on data from satellites and field cruises during the 2015–2016 El Niño and 2017–2018 La Niña events. Although the monsoonal patterns were similar during early spring cruises during two ENSO events, the influence of the China Coastal Current (CCC), which is characterized by low sea surface temperature, low salinity, and high nutrient concentrations, was 1.5 times greater during the 2015–2016 El Niño than the 2017–2018 La Niña. The average chlorophyll a concentration was therefore higher in 2016 than that in 2018. The phytoplankton consisted mainly of diatoms, dinoflagellates, and cryptophytes during the 2015–2016 El Niño, but concentrations of those phytoplankton groups decreased, and concentrations of prasinophytes, Synechococcus, and Prochlorococcus increased during the 2017–2018 La Niña. Their influence of the CCC and warm currents were associated with the variations in phytoplankton community structure in the TWS. The results of this study enhance understanding of the responses of marine ecosystems to climate variabilities, and of the changes that climate change may bring to strait ecosystems.
Marine phytoplankton as primary producers drive the material cycles and energy flows of marine ecosystems (Field et al., 1998), and their biomass and community composition respond rapidly to environmental changes induced by anthropogenic activities and climate variabilities (Barton et al., 2010; Boyce et al., 2010). The El Niño Southern Oscillation (ENSO) is one of the most important drivers of the interannual variations of marine ecosystems and is characterized by anomalies of sea surface temperature (SST) in the equatorial Pacific Ocean (Jin et al., 2006). It is divided into a warm (El Niño) and cold (La Niña) phase (Ren and Jin, 2013; Wang et al., 2016). ENSO events can directly alter SST in the ocean and are closely linked to global atmospheric circulation, which in turn influences the intensity of wind fields, mesoscale physical processes, and even local flow fields (Wang et al., 2016). These changes can further influence the availability of light and nutrients in the water column and can thus affect phytoplankton biomass and community structure (Racault et al., 2017; Conde and Prado, 2018). Clarifying the responses of phytoplankton biomass and community structure to different ENSO phases can therefore facilitate anticipation of the cascading effects of climate change on marine ecosystems.
Many studies have shown that the effects of El Niño and La Niña on marine ecosystems are complicated (Rousseaux and Gregg, 2012; Liu et al., 2013). For instance, in the northern South China Sea (SCS), variations of phytoplankton biomass and compositions are regulated by ENSO events (Liu et al., 2007). The relatively low chlorophyll a (Chl a) concentrations and higher proportion of Prochlorococcus are typical of El Niño events because SSTs are warmer, whereas higher Chl a and a greater proportion of picoeukaryote have been found in winter during La Niña events (Liu et al., 2013). Phytoplankton variabilities driven by ENSO events include direct effects (e.g., stratification in the water column influenced by the changes of SST and wind intensity) and indirect effects (e.g., the availability of light and nutrients). Furthermore, ENSO events can alter the strength and direction of wind fields, which affects the intensity of physical processes such as upwelling (Du and Peterson, 2018; Cordero−Quirós et al., 2022) and the intrusion of Kuroshio water (Nan et al., 2015) and coastal water into marginal sea (McClatchie et al., 2016), and they can alter the structure of the phytoplankton community. Previous studies in coastal areas have focused mainly on the effects of ENSO events on the phytoplankton community in upwelling systems (Du and Peterson, 2018). For example, the phytoplankton community shifts from diatoms to dinoflagellates in the California upwelling system from La Niña to El Niño conditions (Du and Peterson, 2018; Cordero−Quirós et al., 2022). Some studies have also revealed that coastal currents are influenced by ENSO events (Jacox et al., 2016), but a systematic response of coastal phytoplankton communities to different ENSO phases has not been elucidated.
The channel effect in a strait amplifies the impact of monsoonal cycles, and straits may therefore be well suited for studies of ecosystem response to ENSO events. The Taiwan Strait (TWS), which is located in the subtropical region of the western Pacific Ocean, is an important channel between the East China Sea (ECS) and SCS (Figure 1). Circulation in the TWS is clearly forced by the East Asian monsoon. Our previous studies have shown that spatiotemporal variations of the phytoplankton communities in the TWS are associated with the different water masses, the influence of which changes as a function of circulations induced by monsoonal winds (Zhong et al., 2020). During the northeast monsoon (October to April), the TWS is influenced by the China Coastal Current (CCC), SCS warm water, and intrusions of Kuroshio water (Hu et al., 2010). The CCC is characterized by relatively low temperature, low salinity, and high nutrient concentrations (Hong et al., 2011). The high nutrient fluxes carried by the CCC are important to the TWS and even the northern SCS (Han et al., 2013). The phytoplankton community is dominated by diatoms and cryptophytes in the cold, low-salinity coastal water, whereas in water affected by the Kuroshio intrusion, the contributions of diatoms to total Chl a (TChl a) decrease and phytoplankton groups such as Prochlorococcus and Synechococcus increase (Zhong et al., 2020). The force of the northeast monsoon causes obvious seasonal variations of the circulations. For instance, under the influence of the northeast monsoon, the CCC flows southward along the coast of Zhejiang and Fujian in October, becomes strongest during January and February of the following year, weakens in May, and disappears in June (Hong et al., 2011). The variations of circulation further influence the distributions of phytoplankton biomass and community structure in the TWS. Furthermore, ENSO events affect wind patterns in the TWS. Some studies have found that the northeast wind is weak during the El Niño events and strong during the La Niña events (NanJung and ChungRu, 2004). The alterations of wind patterns during the different phases of the ENSO influence the intensity of the CCC and change biogeochemical processes in the TWS (Shang et al., 2005). Studies that have focused on the ecological effects of the 1997–1998 El Niño on the TWS have shown that the area with high Chl a concentrations was reduced by half during the winter of 1997–1998 because of the weakening of the northeast wind, the recession of the CCC, and the enhanced intrusions of warm water (Shang et al., 2005). However, those studies have focused mainly on the physical effects of ENSO events on the TWS during the winter monsoon (Shang et al., 2005) or summer monsoon (Hong et al., 2009; Zhang, 2021). The effects of different ENSO events on biological communities have not been clarified.
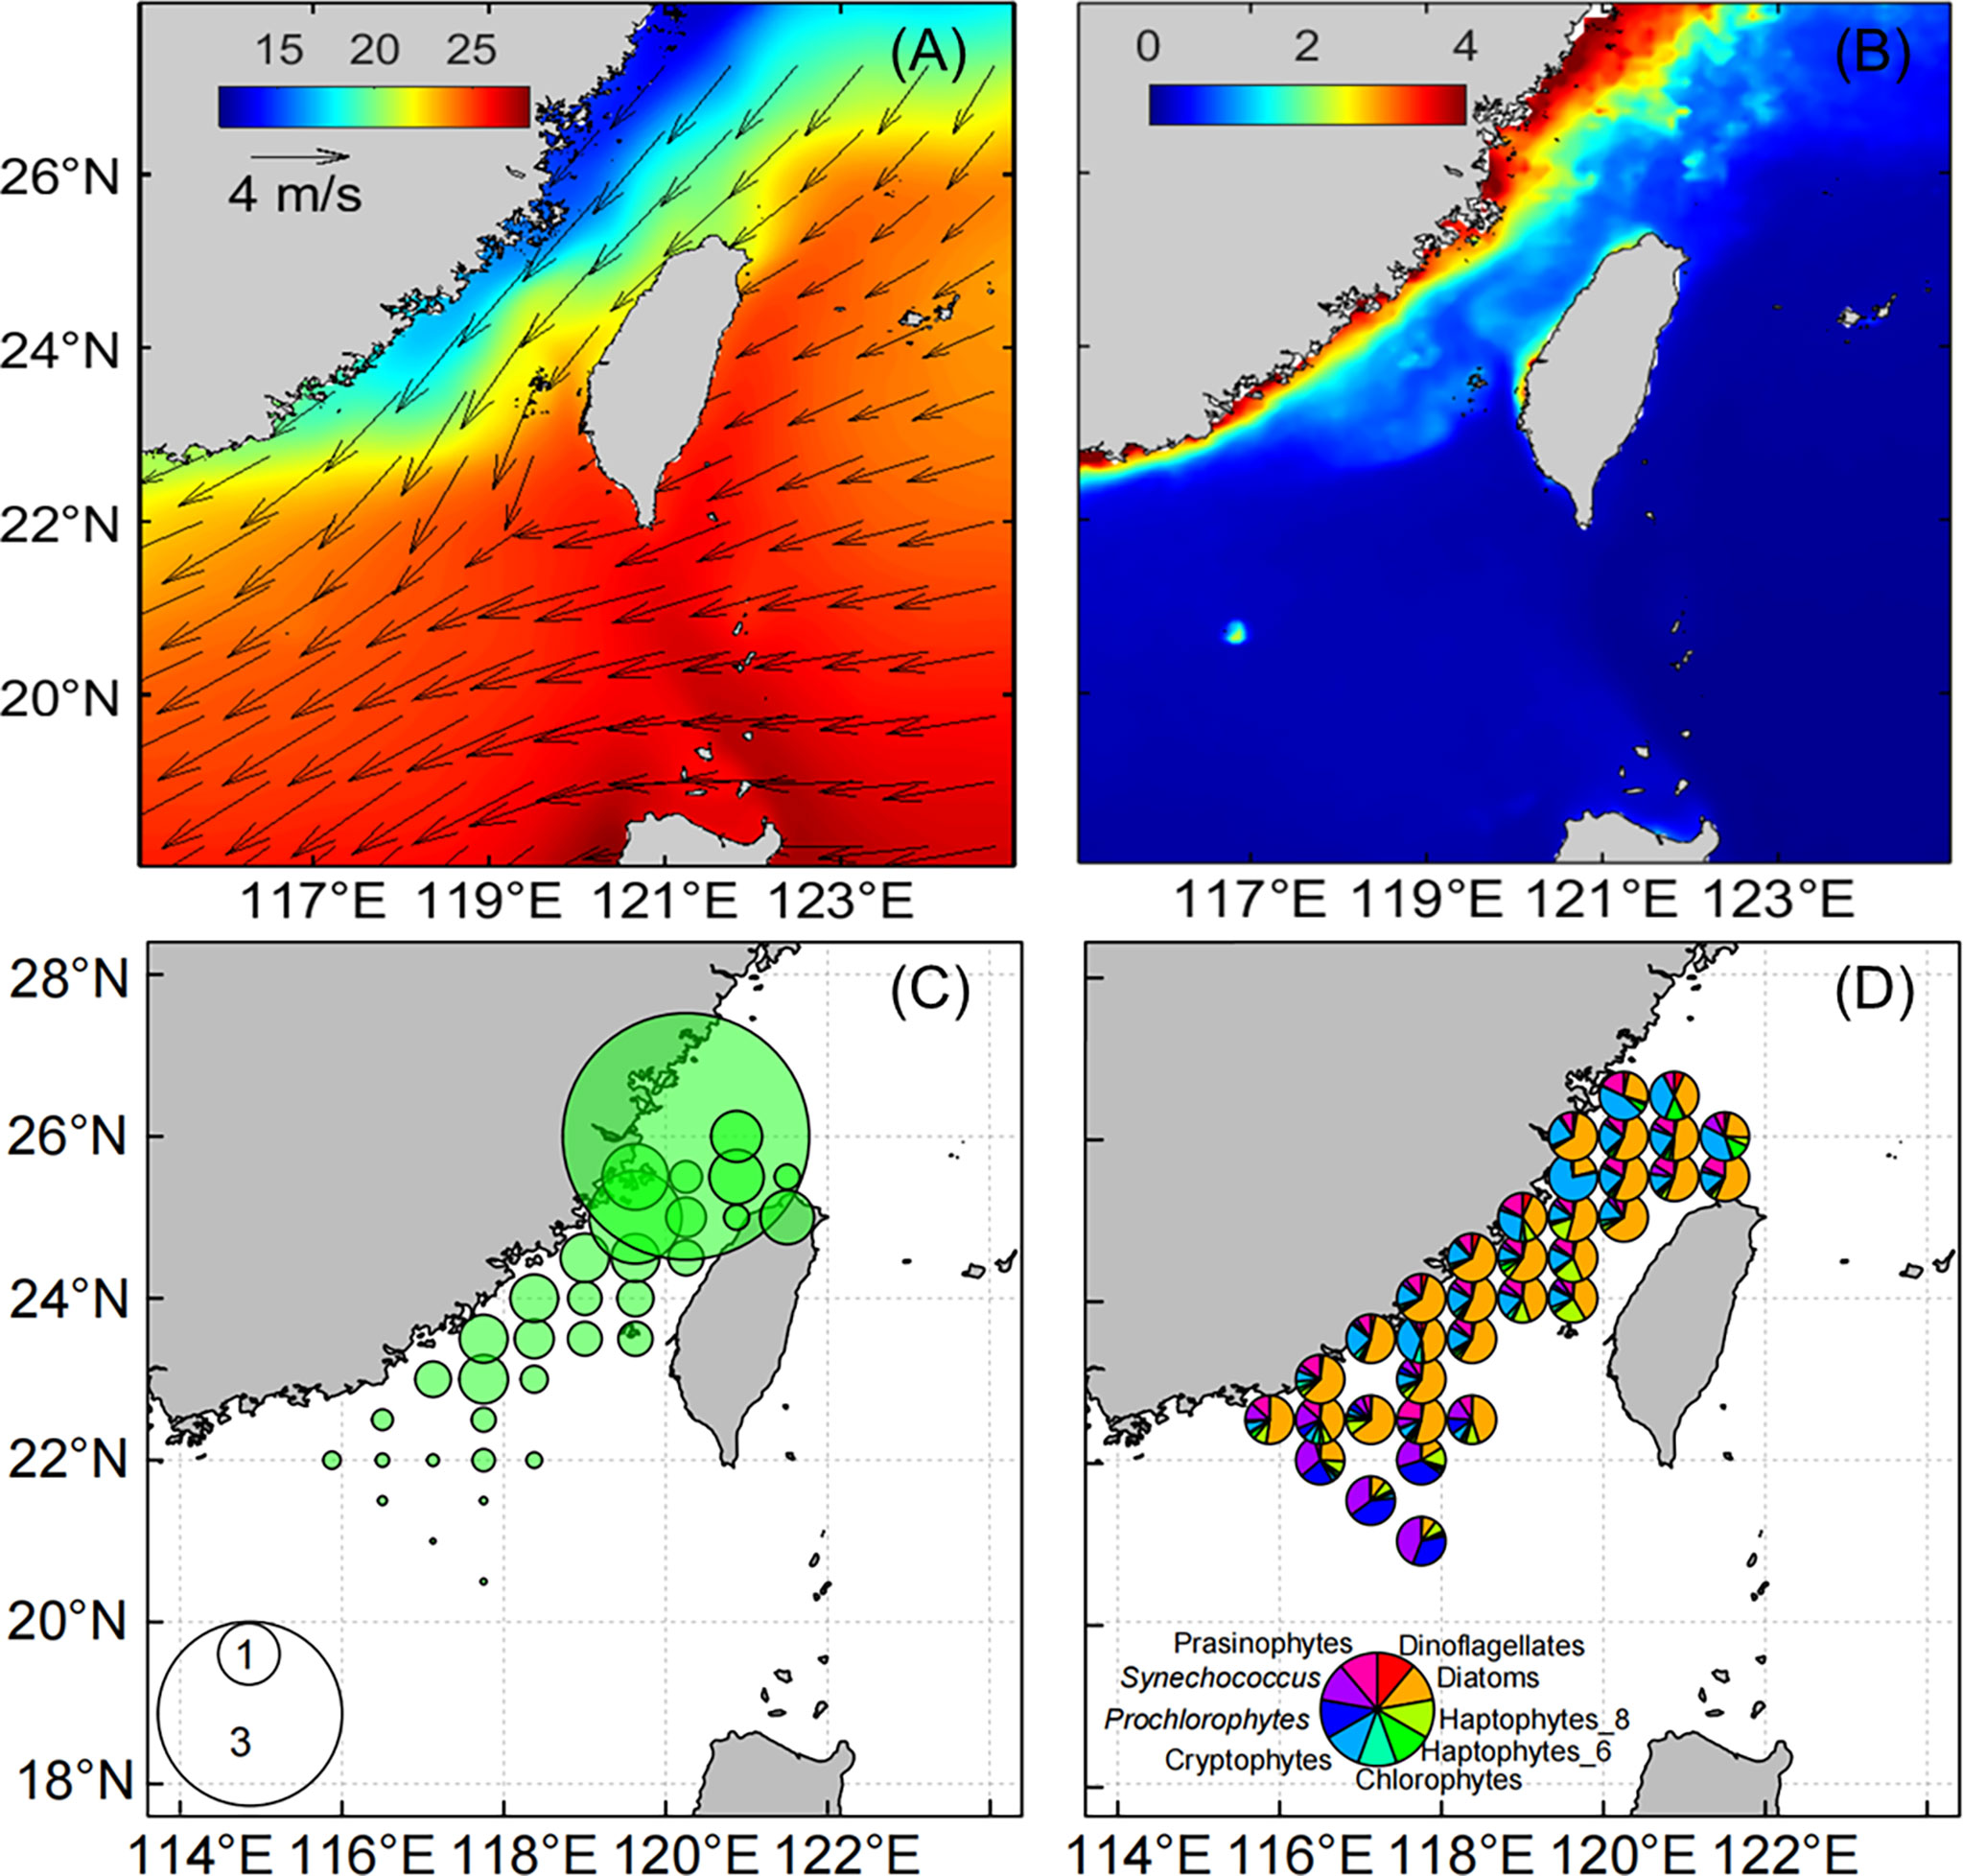
Figure 1 The climatological mean sea surface temperature (shading, in °C, A), wind velocity at 10 m above the sea surface (vectors, in m/s, A), chlorophyll a concentrations (μg L−1, B) based on the satellite data between February and April during 1998–2018, total chlorophyll a concentrations (μg L−1, C) and phytoplankton community structure (D) based on the HPLC analysis between February and April during 2012–2018. All data are averaged over 0.5°×0.5° grid boxes.
There are several methods (e.g., microscopy, flow cytometric analysis, the combination of high-performance liquid chromatography (HPLC) and CHEMTAX approach, and genomic sequencing) for determination of phytoplankton community composition (Utermöhl, 1958; Mackey et al., 1996; Sieracki et al., 1998; Saldarriaga et al., 2001), and each method has its strengths and weakness. The microscopic method may be more suitable in coastal seas. When the biomass is relatively high, the larger diatoms and dinoflagellates become the dominant species, and their cells are larger and easier to identify and count. However, in the open ocean, the dominant group of phytoplankton is the picophytoplankton (< 2 μm), and it is difficult to identify them by conventional microscopy. Flow cytometry is required for analysis of the picophytoplankton (Sieracki et al., 1998). In the TWS, the current system is complex. It includes the CCC with a large amount of coastal water, the oligotrophic Kuroshio intrusion, and the SCS Warm Current (Hong et al., 2011). The variations of water masses greatly affect the applicability of research methods. Moreover, phytoplankton photosynthetic pigments were determined by the HPLC, and then calculate the concentrations of nine phytoplankton groups based on the CHEMTAX software (Mackey et al., 1996). This method basically covers all particle sizes of phytoplankton, especially for discriminating groups of nanophytoplankton that cannot be easily identified by microscopy or flow cytometric analyses (Liu et al., 2016). Although the information on phytoplankton derived by the HPLC-CHEMTAX method is limited to the taxonomic level, it has been widely used in oceanographic research (Mackey et al., 1996; Zhong et al., 2020; Xiao et al., 2020; Liu et al., 2016).
We therefore used satellite data between 1998 and 2018 and extant knowledge of the spatiotemporal variations of climatological phytoplankton community obtained by the HPLC-CHEMTAX approach combining with other methods such as microscopic and flow cytometric analyses based on a decadal-scale field database (Zhong et al., 2020; 25 cruises from 2004 to 2018; 787 stations) to calculate climatological averages of SST, Chl a, and phytoplankton community composition in the surface waters of the TWS during the early spring (between February and April) (Figure 1). The surface phytoplankton data from six cruises during periods from February to April between 2012 and 2018 were used to calculate the climatological average phytoplankton community structure in the early spring. To better understand the biological responses to different ENSO events, we selected data from two cruises during extreme ENSO events—the 2015–2016 El Niño and 2017–2018 La Niña—for comparative study (Figure 2). We further aimed to clarify the responses of the phytoplankton community to different ENSO events. We expected that the results of this analysis would enhance understanding of the response of marine ecosystems to climate change.
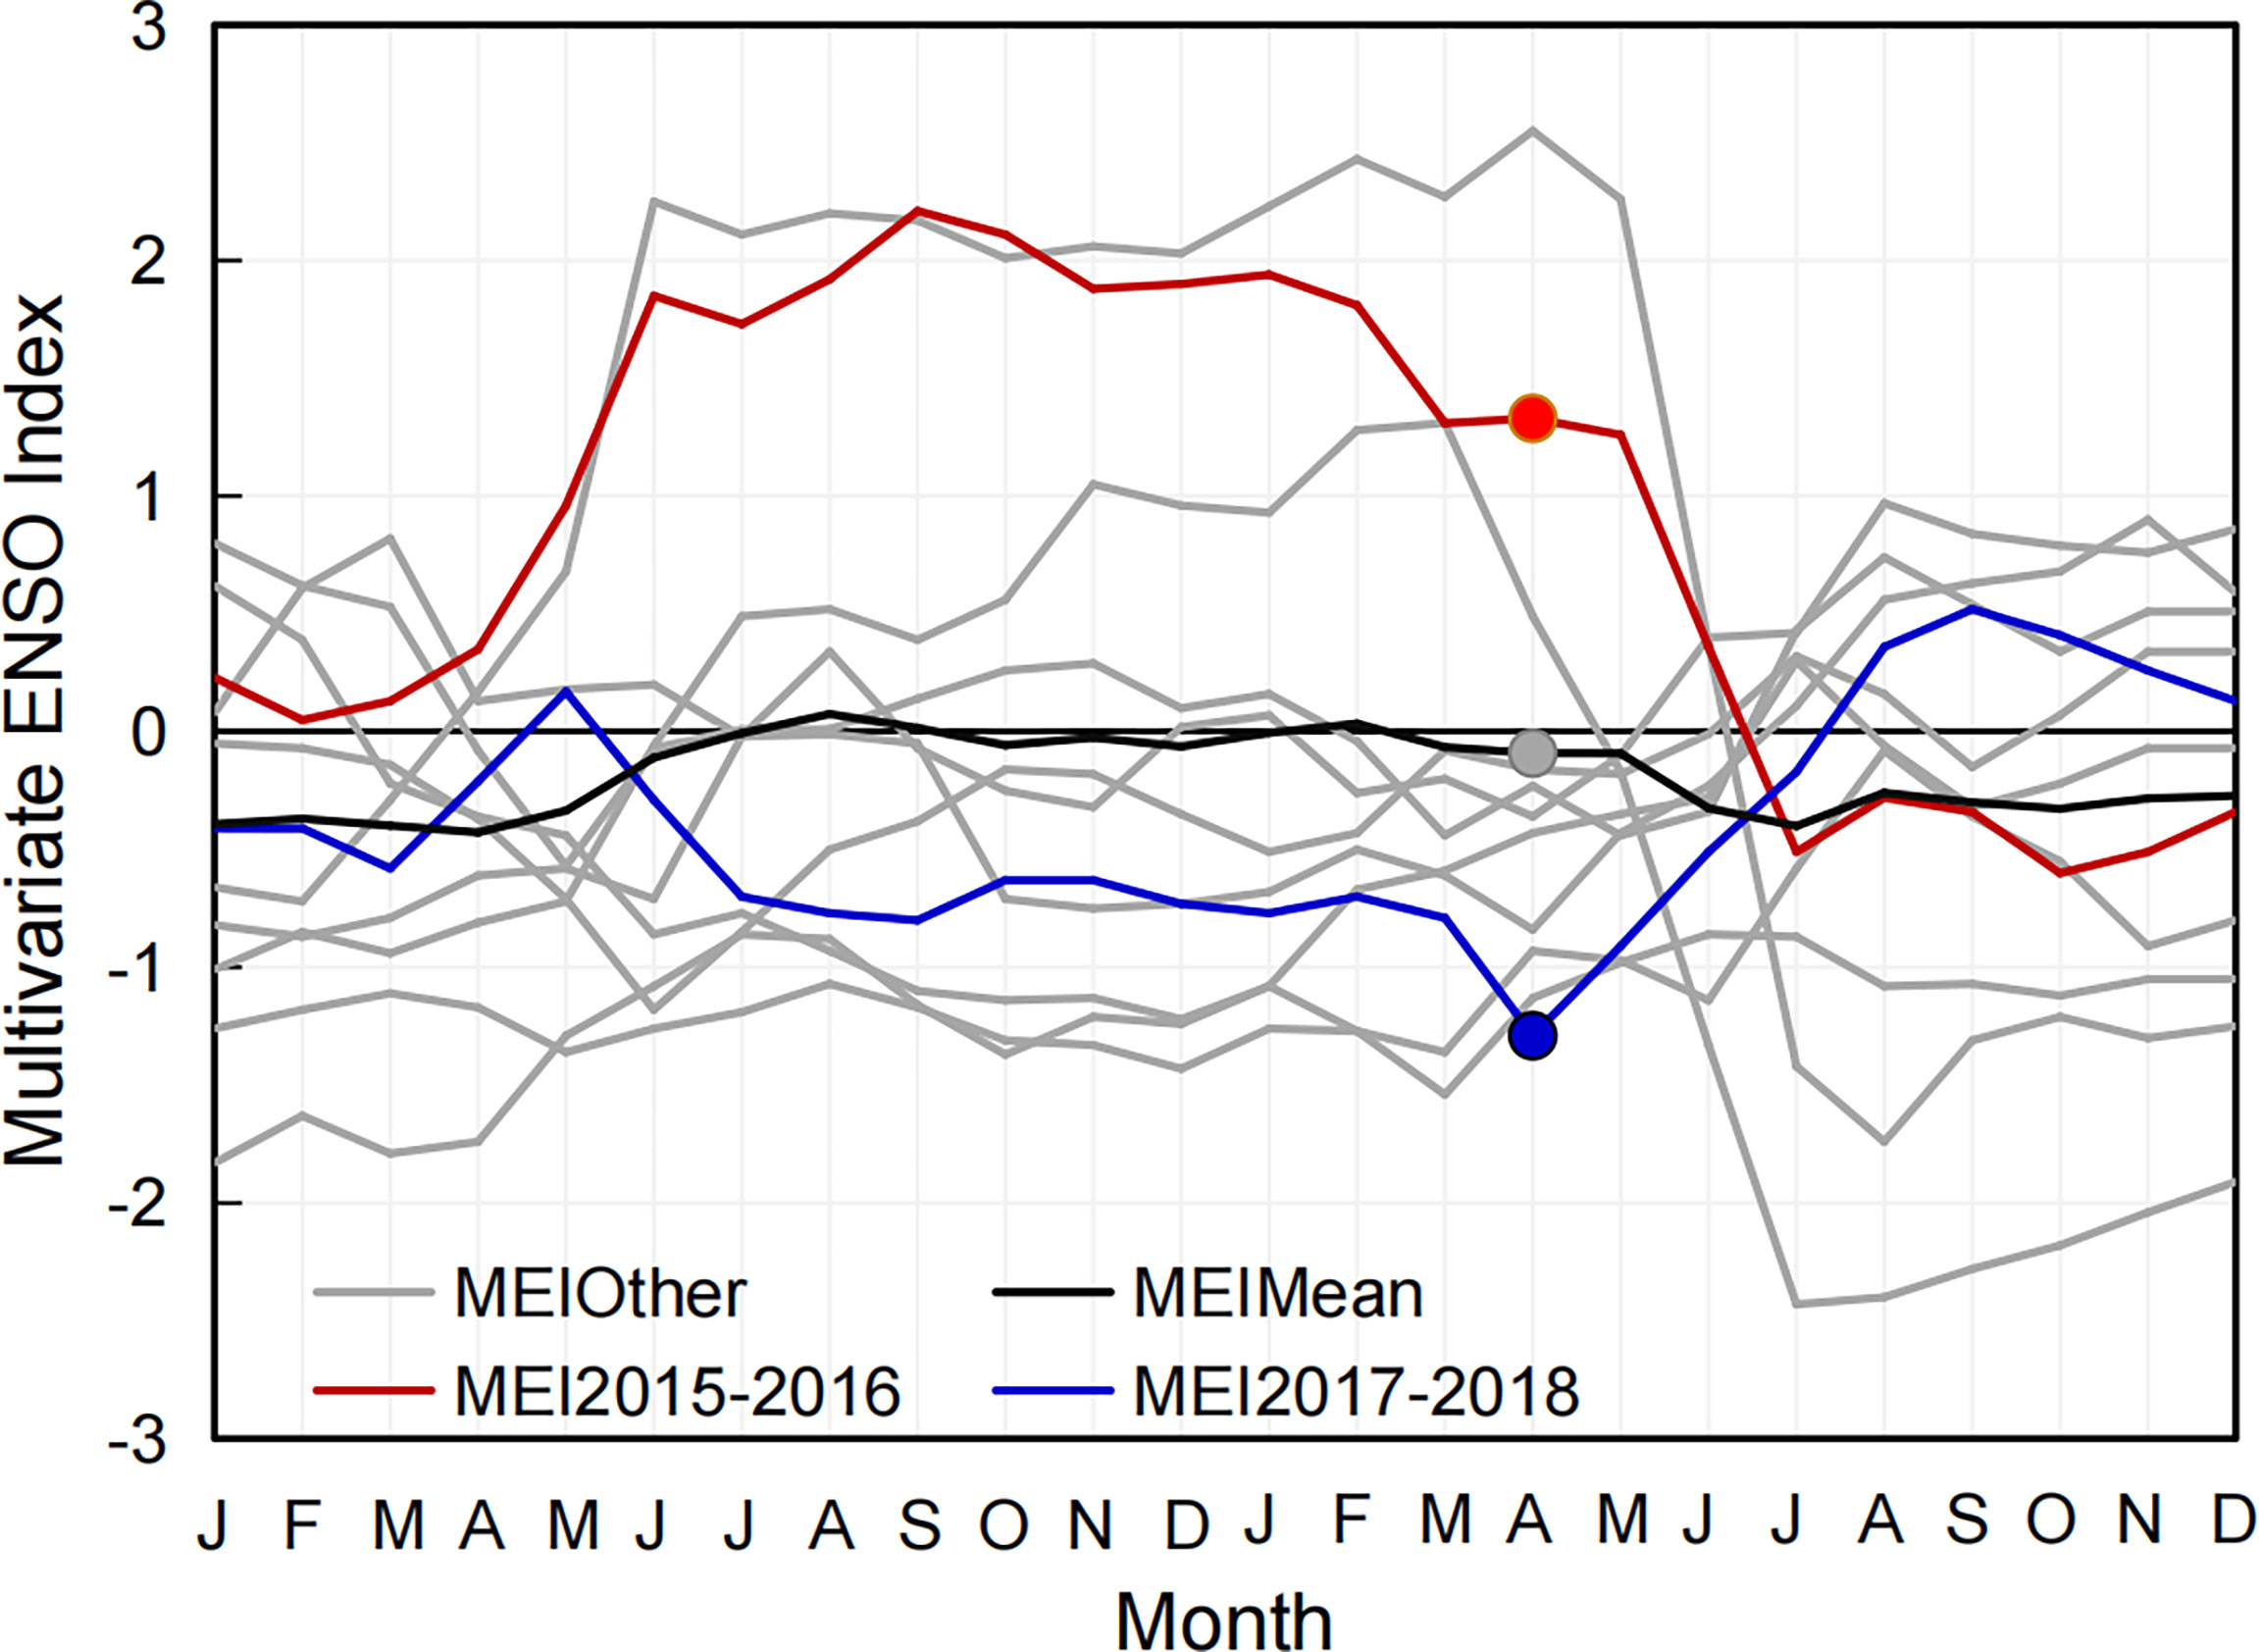
Figure 2 Two-year progression of the bi-monthly multivariate El Niño/Southern Oscillation (ENSO) index since 1998.
Water samples were collected in the TWS during 29 March–3 April 2016 (Figure 3C, during El Niño conditions), and 24 March–13 April 2018 (Figure 3D, during La Niña conditions) from the R/V Yanping 2. These cruises were carried out to explore the responses of biogeochemical processes in the TWS during the early spring to the El Niño and La Niña conditions.
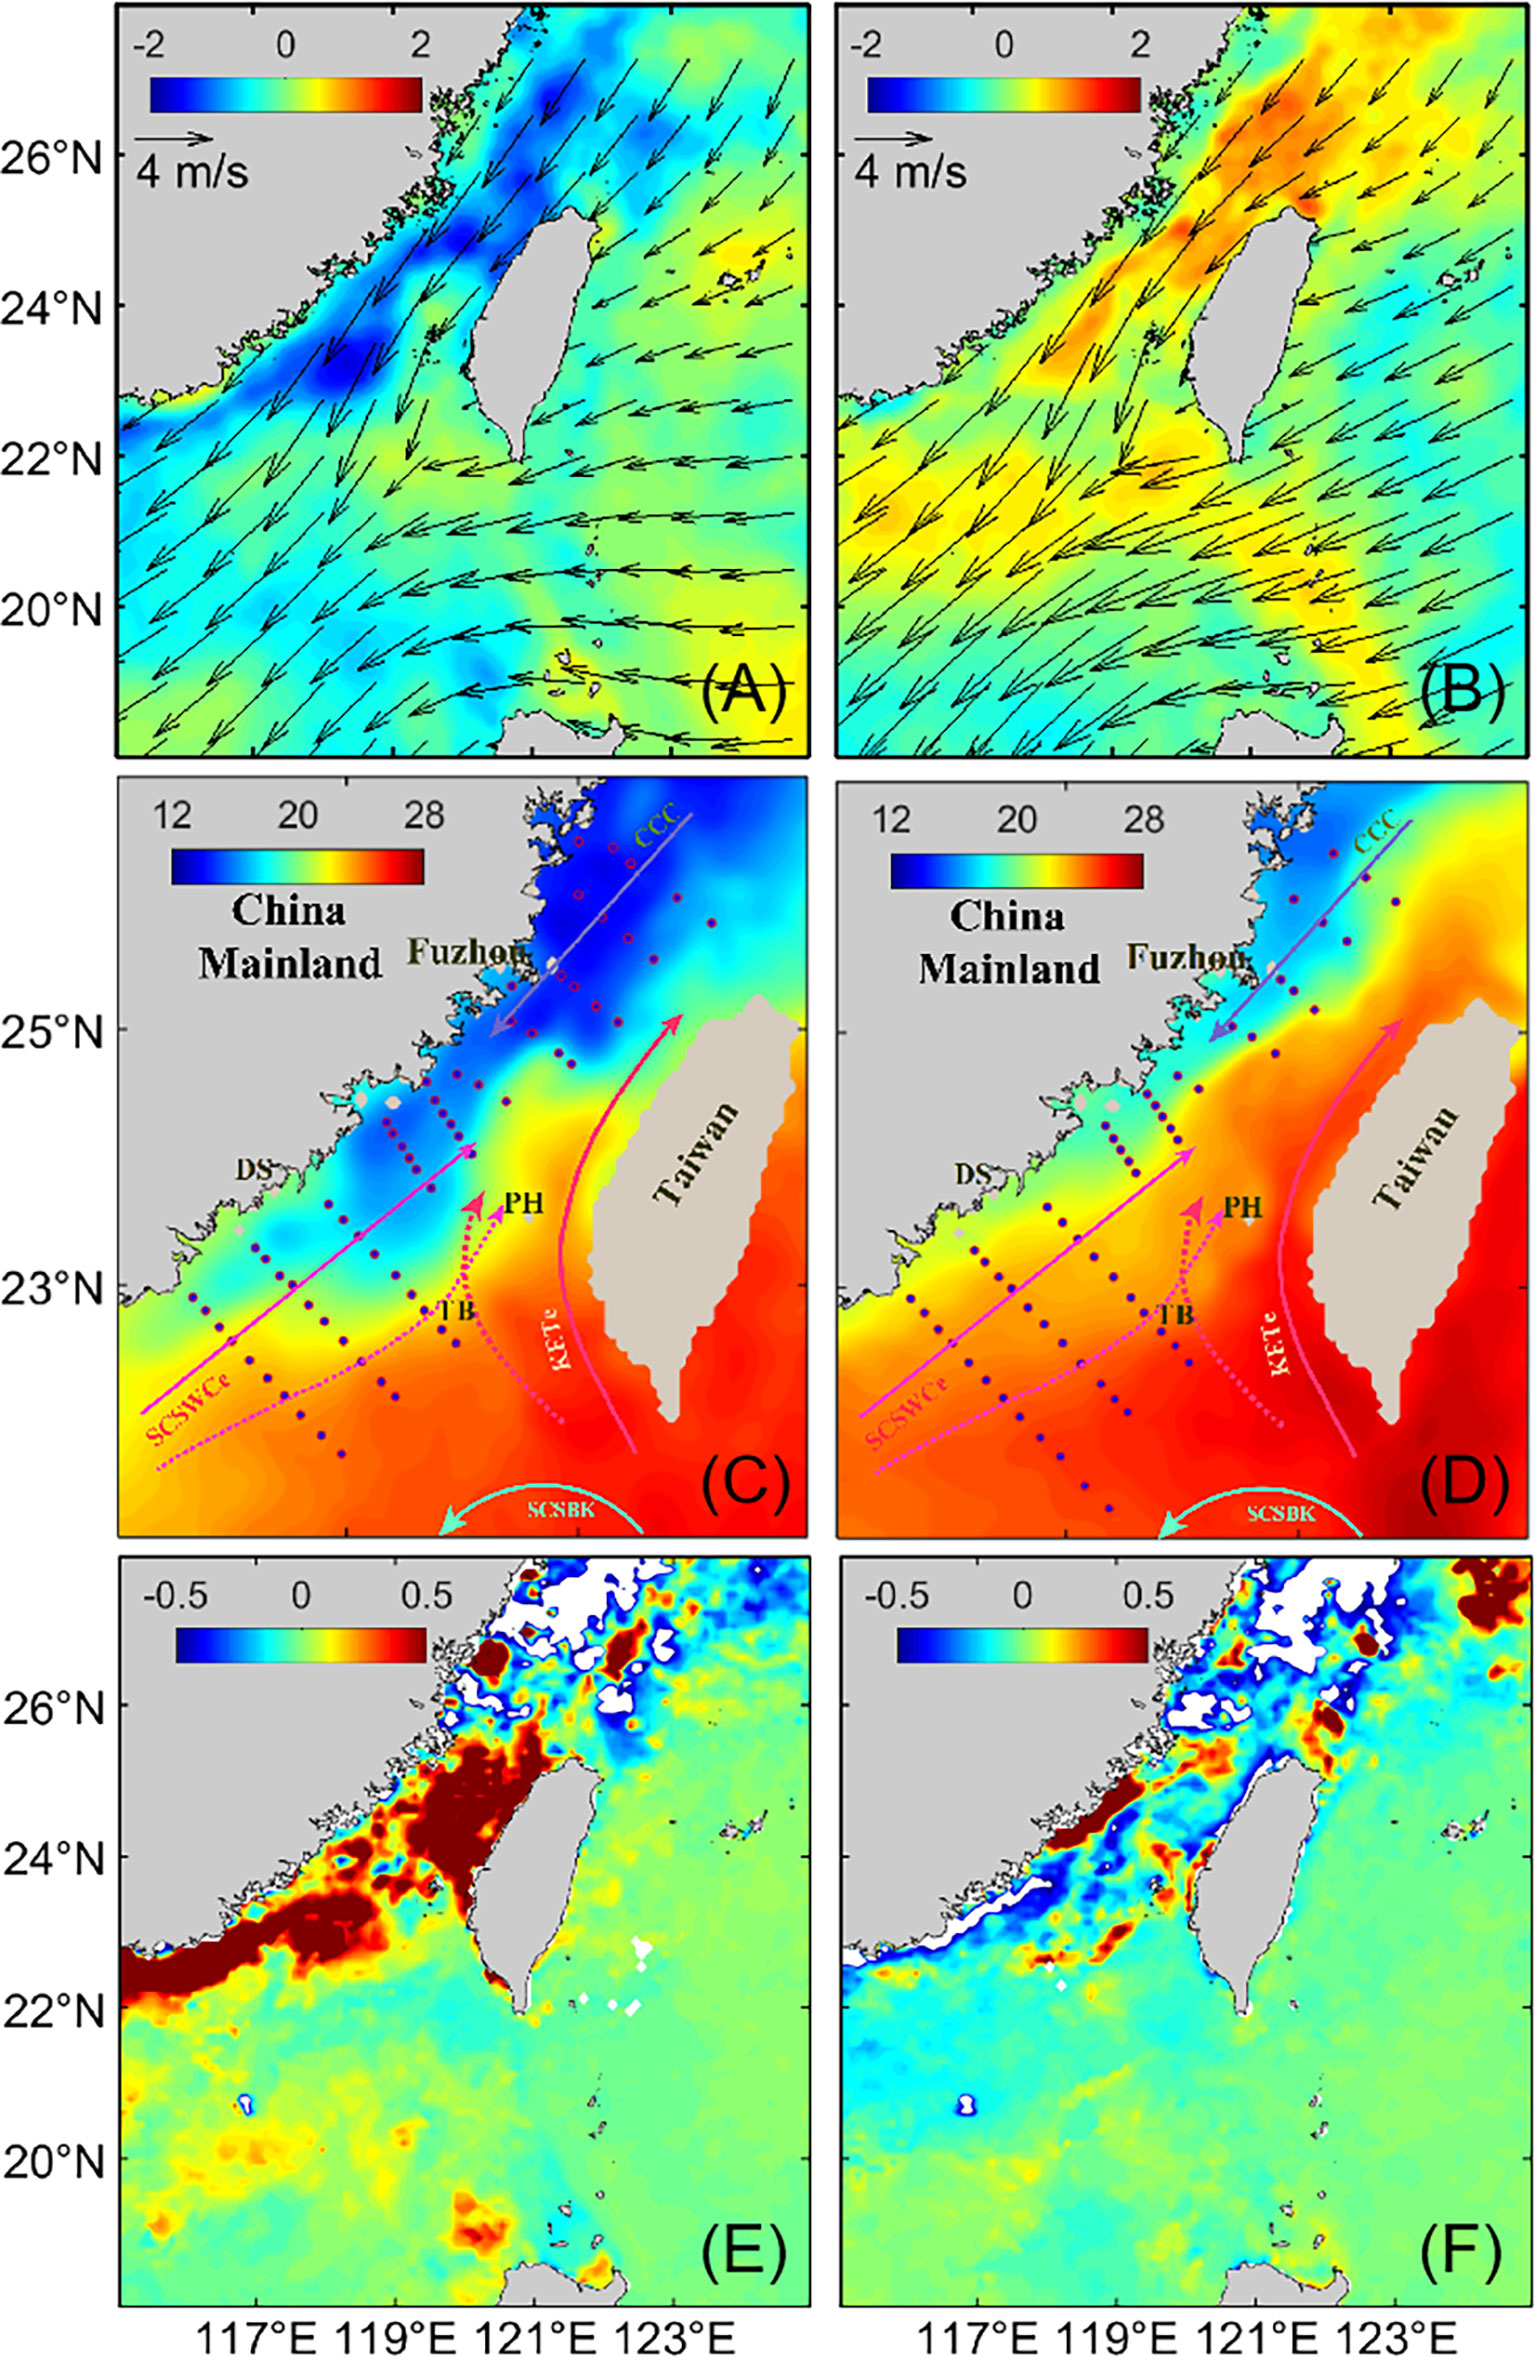
Figure 3 Sea surface temperature anomalies (shading, in °C, A, B), wind velocity at 10 m above the sea surface (vectors, in m/s, A, B) between February and April in 2016 and 2018, sea surface temperature (°C, C, D) during the observations in 2016 (C), and 2018 (D), and chlorophyll a anomalies between February and April in 2016 (E) and 2018 (F) in the Taiwan Strait. Notes: DS: Dongshan; TB: Taiwan Bank; PH: Penghu island; CCC: The China Coastal Current; SCSWCe: The South China Sea Warm Current; SCSBK: The South China Sea Branch of Kuroshio; KETe: The Kuroshio’s Eastern Taiwan Strait’s extension.
Temperature and salinity were measured in situ with a conductivity-temperature-depth (CTD) system (Seabird SEB 19). All nutrient and biological samples were collected in at least three layers within the euphotic zone. Nutrient samples during the cruises of 2016 and 2018 were measured with a QUAATRO nutrient analyzer. The detection limits of the sum of nitrate and nitrite (NOX) were 0.03 μmol L−1.
Seawater samples of 200–500 mL were filtered through 25-mm GF/F filters (Whatman) for Chl a analysis, and seawater samples of 1–4 L were also filtered through 25-mm GF/F filters (Whatman) for analysis of photosynthetic pigments samples (<50 mm Hg). The filters were stored in liquid nitrogen and then kept at –80 °C after being returned to the laboratory. Chl a concentrations were determined by florescence analysis. Phytoplankton photosynthetic pigment samples were extracted in 1 mL of N,N-dimethylformamide, and then 0.5 mL of the extract was mixed with 0.5 mL of ammonium acetate in a 1.5-mL brown chromatographic bottle. Phytoplankton photosynthetic pigments were determined by HPLC (3.5 μmEclipse XDB C8 column) based on the quantification of standards manufactured by Danish Hydraulic Institute (DHI) Water and Environment, Hørsholm, Denmark. We used CHEMTAX V1.95 with 13 diagnostic pigments to determine the concentration of nine phytoplankton groups, including dinoflagellates (Dino), diatoms (Diat), haptophytes (Type 8; Hapt.T8), haptophytes (Type 6; Hapt.T6), chlorophytes (Chlo), cryptophytes (Cryp), Prochlorococcus (Proc), Synechococcus (Syne), and prasinophytes (Pras) (Mackey et al., 1996). The initial input matrix of ratios of diagnostic pigments to total Chl a (TChl a, TChl a = Chl a + divinyl Chl a) was taken from the input matrix reported in Wang et al. (2015) and Xiao et al. (2018). To obtain reasonable estimates of phytoplankton groups, we used seven vertical distribution patterns of the ratios of pigments to TChl a. We then carried out successive runs of CHEMTAX in accord with the procedures published by Wang et al. (2015) and Zhong et al. (2020). Our previous studies have shown that the estimates of pigment-based phytoplankton groups obtained in this way are credible and are supported by the positive correlations between the concentrations of phytoplankton groups based on HPLC analysis and the abundances estimated from microscopic and flow cytometric analyses in the TWS (Zhong et al., 2020), SCS (Xiao et al., 2018) and ECS (Liu et al., 2016). Data from analyses of surface water, including temperature, salinity, nutrient concentrations, and phytoplankton community composition from 2004 to 2018, have been described by Zhong et al. (2020) as part of an analysis of the climatological distribution patterns of the phytoplankton community in the TWS during different monsoons. In this study, the surface phytoplankton data from six cruises during time intervals between February and April from 2012 to 2018 (the NORC2012-02, NORC2013-04, NORC2014-04, NORC2015-04, NORC2016-03, and NORC2018-03 cruises in Zhong et al. (2020)) were used to calculate the climatological average of the phytoplankton community structure in the early spring. In addition, vertical profiles of temperature, salinity, nutrient concentrations and phytoplankton community composition during the 2016 and 2018 cruises are included among the new results reported in this study.
Daily sea surface temperature (SST) with a resolution of 0.05° (available at https://resources.marine.copernicus.eu/product-download/SST_GLO_SST_L4_REP_OBSERVATIONS_010_011) were derived from the Copernicus Marine Environment Monitoring Service (Good et al., 2020). Monthly level-3 Chl a concentrations were derived from the Sea-viewing Wide Field-of-view Sensor (SeaWiFS) database between January 1998 and June 2002 as well as the Moderate Resolution Imaging Spectroradiometer (MODIS) database from July 2002 to December 2018 (available at https://oceancolor.gsfc.nasa.gov/). The spatial resolution of those data was 9 km. The eastward and northward components of the monthly mean wind were obtained from the European Centre for Medium-Range Weather Forecasts (available at https://apps.ecmwf.int/datasets/data/interim-full-daily/levtype=sfc/). The bi-monthly multivariate El Niño/Southern Oscillation (ENSO) indices were acquired from the NOAA physical sciences laboratory (available at https://psl.noaa.gov/enso/mei/).
Based on the SST images, temperature fronts were detected using gradient analyses via Matlab software (Belkin and O’Reilly, 2009). The averages between February and April in each year were then calculated throughout the TWS. Anomalies of SST (SSTA) and Chlorophyll a (ChlaA) from February to April in 2016 and 2018 were equated to the deviations from the climatological means between 1998 and 2018. Several studies have defined areas with SST<17 °C to have been influenced by the CCC (Zhang et al., 2020). We defined the proportion of pixels with low temperature (SST<17 °C) among all the pixels in the SST images to be a metric of the intensity of the CCC in this study.
Figure 1 shows the climatological average SST, Chl a, and phytoplankton community composition between February and April based on the satellite data from 1998 to 2018 and field database from 2012 to 2018. During northeast monsoons, the western TWS was influenced by the CCC characterized by low temperature (SST<17 °C) and high Chl a concentrations (> 1 μg L−1), whereas the eastern TWS was characterized by warm water and low Chl a concentrations (Figures 1A, B). In the northern TWS, TChl a concentrations based on the HPLC analysis were high (Figure 1C). The phytoplankton community was dominated by diatoms and cryptophytes along the west coast of the TWS, and the contribution of haptophytes increased in the central TWS. In the southern TWS, the proportion of cryptophytes decreased, and the proportions of Prochlorococcus and Synechococcus increased (Figure 1D).
Since 1998, typical El Niño events have occurred during 1997–1998, 2009–2010, and 2015–2016; La Niña events occurred during 1999–2000, 2007–2008, 2011–2012, and 2017–2018 (Figure 2). To better explore the biogeochemical process to different ENSO events, two extreme ENSO events including the 2015–2016 El Niño and 2017–2018 La Niña were selected for comparative study.
The difference between the ecological effects of the El Niño and La Niña events was further apparent from the temporal patterns of SST and Chl a during the 2015–2016 El Niño and 2017–2018 La Niña (Figure 3). We defined the average SST, Chl a, and wind vectors from February to April of every year as the values for early spring. Although the wind patterns were similar, the distributions of SST and Chl a differed. In the early spring of 2016, the anomalies of SST were largely negative (SSTA < –1 °C) near the coast of the western TWS (Figure 3A), and Chl a anomalies were significantly positive in most of the TWS (Figure 3E). The opposite pattern of largely positive anomalies of SST (SSTA > 0.5 °C) and negative anomalies of Chl a were apparent in the TWS during the early spring of 2018 (Figures 3B, F). The areas covered by cold and hyposaline water were larger in 2016 than in 2018. During the observations in 2016, the CCC flowed southward as far as Xiamen (Figure 3C), and strong SST fronts were formed and ran across the central TWS (Figure S1). During the 2018 observations, the CCC was closed to the coast of the western TWS (Figure 3D), and there was no significant SST front in the southern TWS (Figure S1).
The distributions of SST based on the 2016 and 2018 field observations were similar to the patterns derived from satellite data (Figure 4). During the observations in 2016, cold, low-salinity water (SST < 17 °C and salinity < 31) appeared in the western TWS and extended to 23°N, and there was warm, saline water (SST > 20 °C and salinity > 34) in the central and southern TWS. The ranges of SST and salinity were 12.80–25.18 °C and 26.21–34.88, respectively. However, during the cruises in 2018, the CCC was present only near the coast of the western TWS, and much of the TWS was occupied by warm, saline water (Figures 4B, D). The ranges of SST and salinity were 13.77–27.24 °C and 30.70–34.46, respectively.
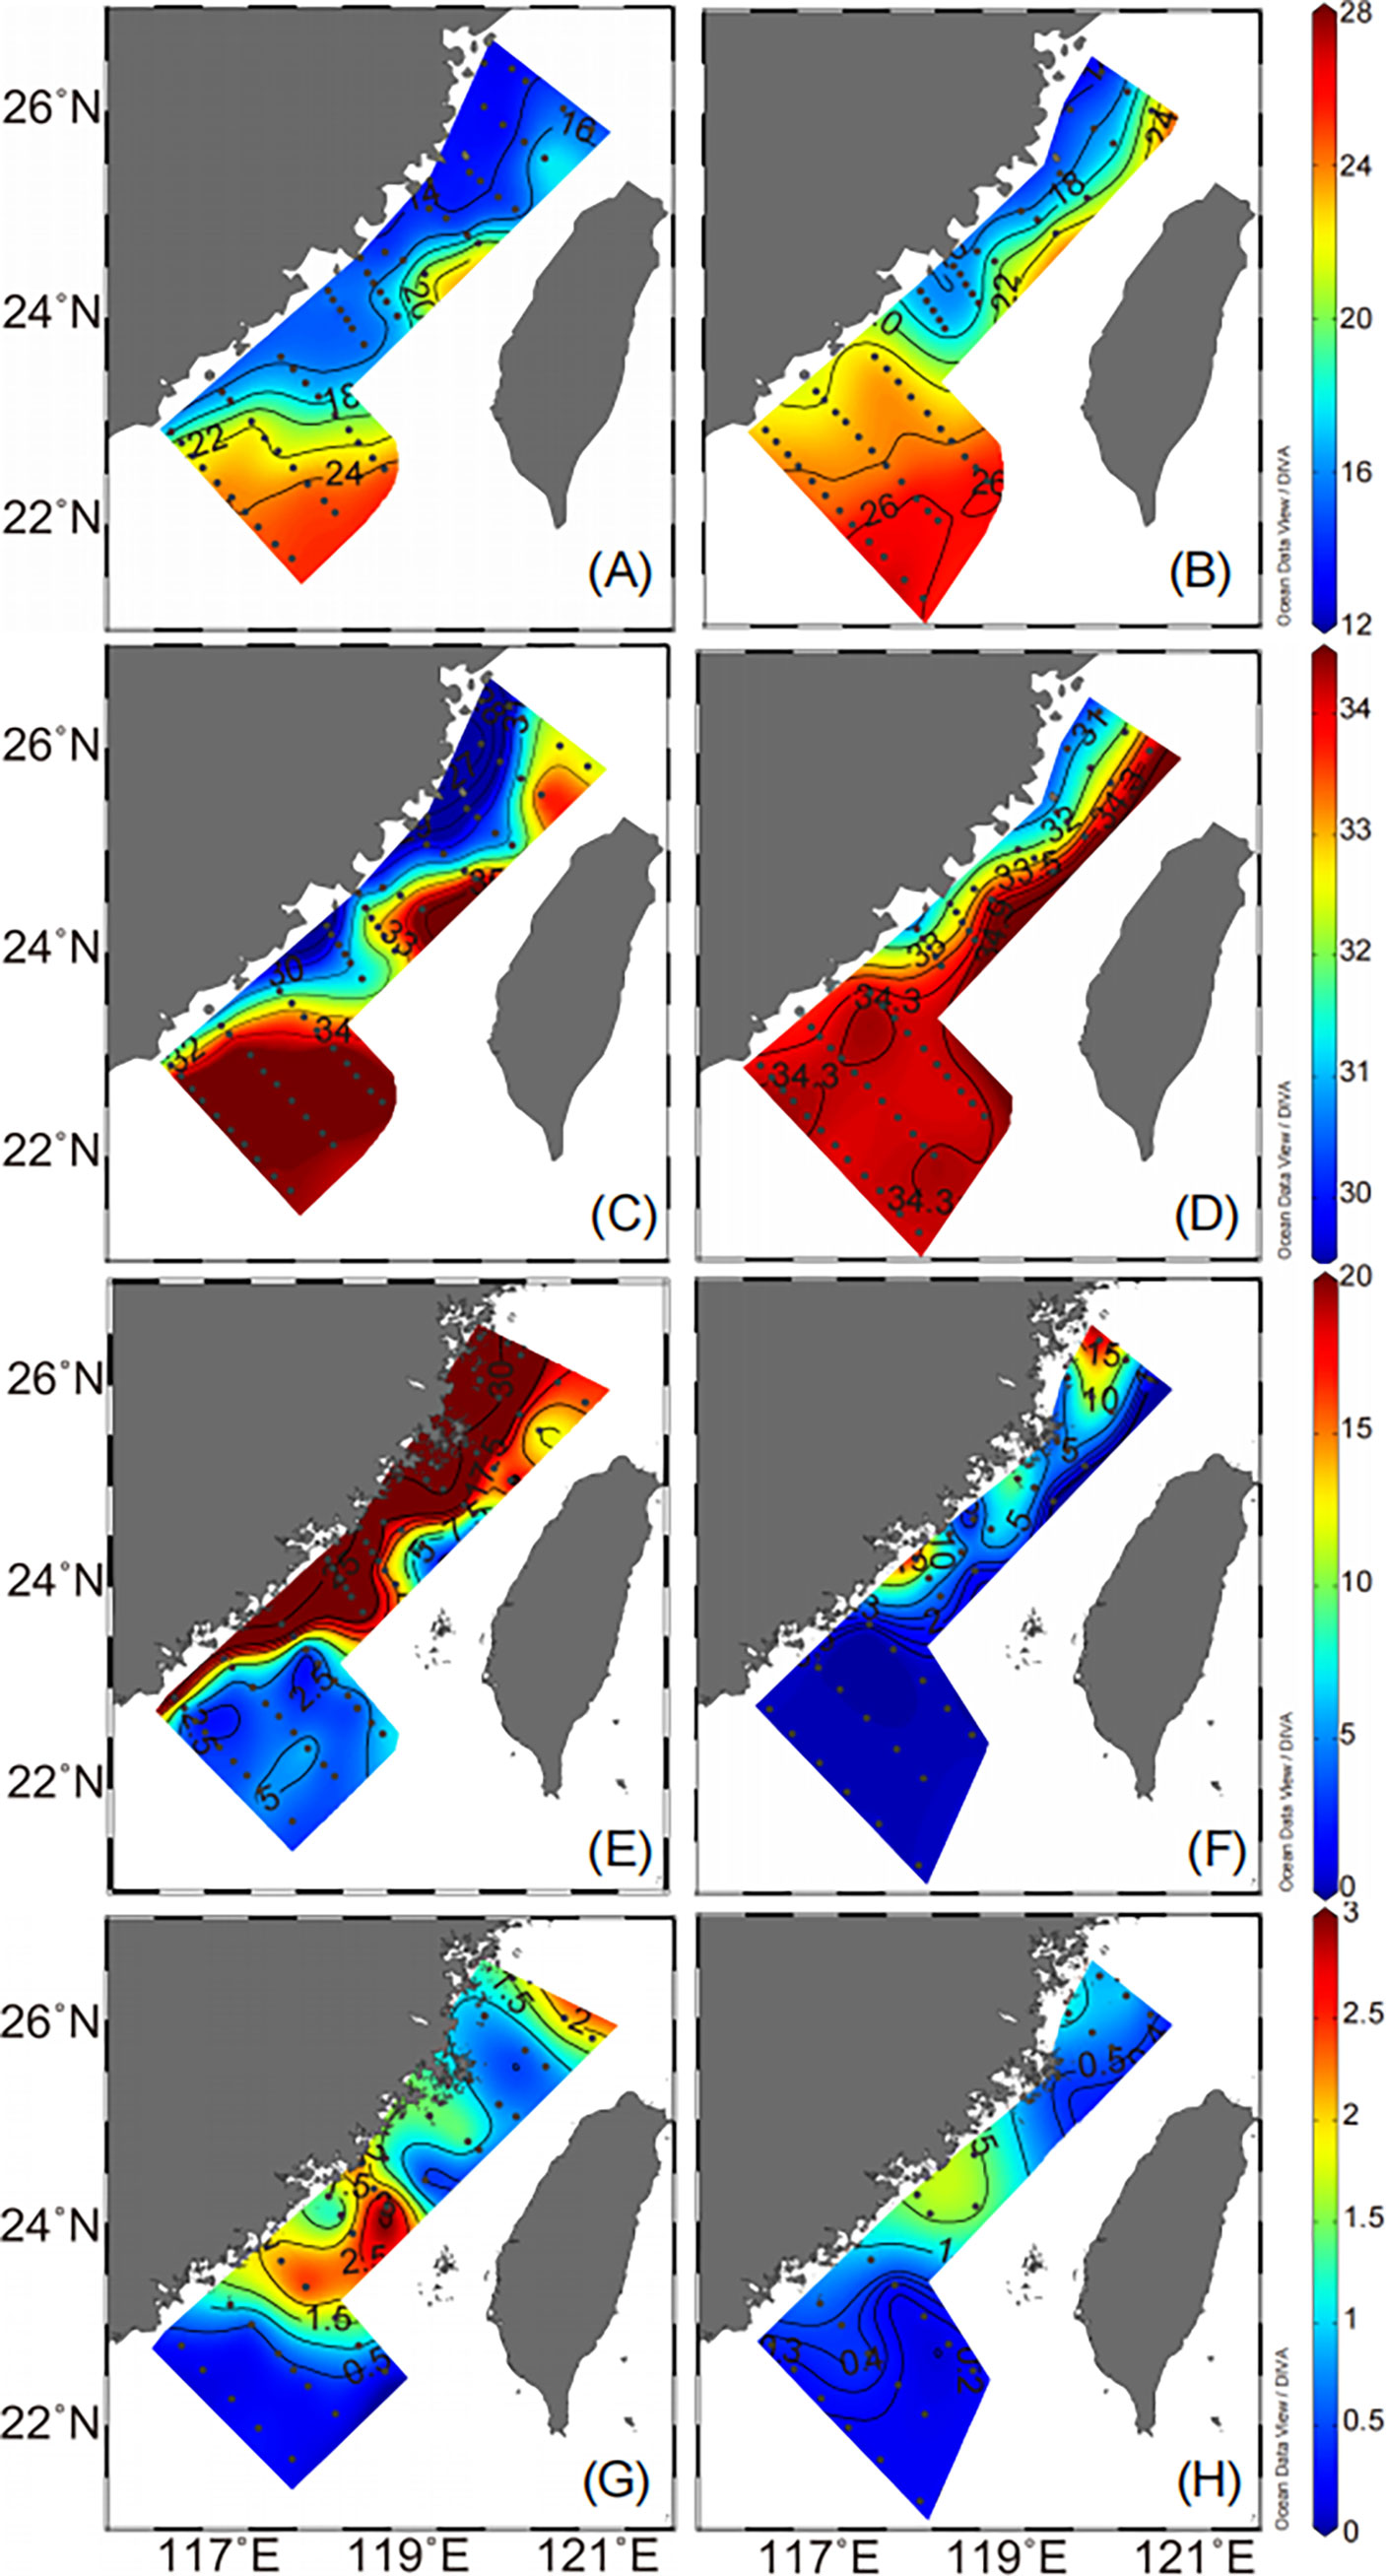
Figure 4 Surface temperature (°C, A, B), salinity (C, D), NOx (μmol L−1, E, F) and chlorophyll a (μg L−1, G, H) in the Taiwan Strait during the observations in 2016 (A, C, E, G), and 2018 (B, D, F, H).
Differences of water properties in the TWS during observations in 2016 and 2018 were obvious in the potential temperature-salinity (T-S) diagrams (Figure 5). During the 2016 cruise, the TWS was influenced mainly by China coastal water and Kuroshio water (Figure 5A). During the 2018 cruise, the water in the TWS was a combination of three water masses: China coastal water, SCS water, and Kuroshio water (Figure 5B).
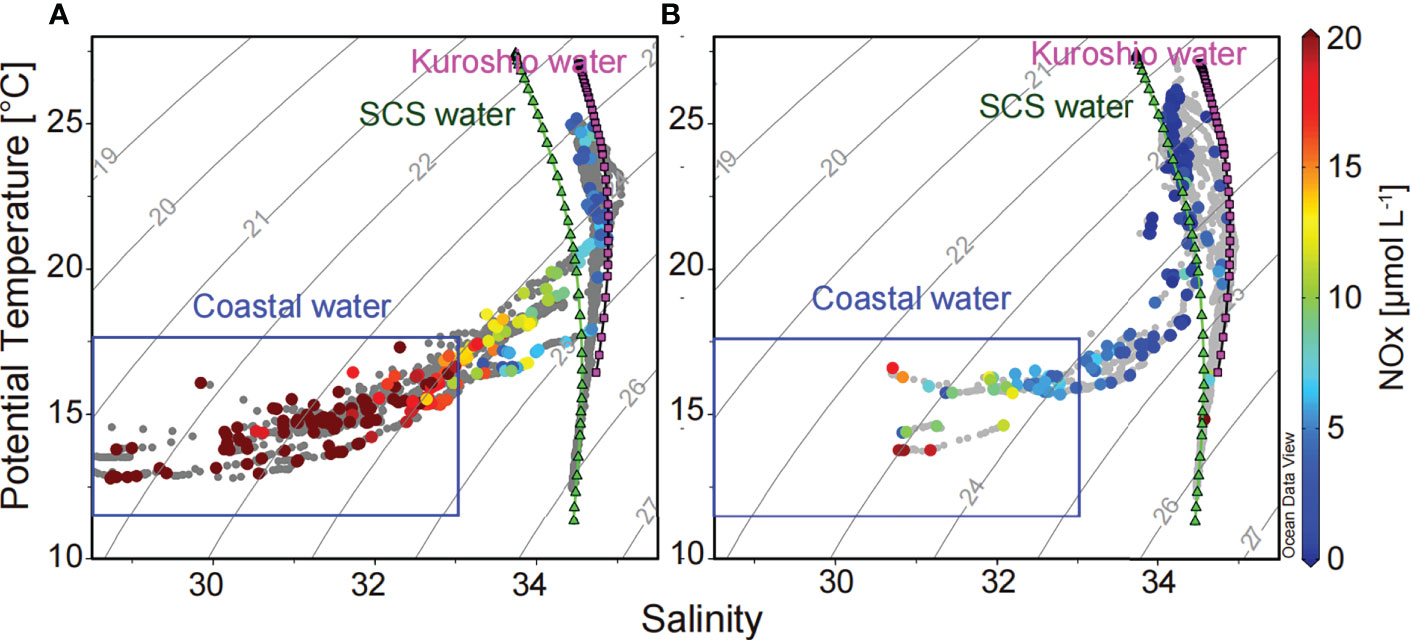
Figure 5 Potential temperature-salinity diagrams during the observations in 2016 (A) and 2018 (B). Grey points represent all data of temperature and salinity in the water column, and color points represent the NOX concentrations in the sampling layer.
The strength of the CCC clearly influenced nutrient concentrations in the TWS (Figure 5). The distribution patterns of nutrient concentrations in the surface water during the two years were similar to the influence of coastal water (Figures 4E, F and 5). The NOX concentrations were significantly higher during the 2016 observations than during the 2018 observations, especially in the China coastal waters. The NOX concentrations in the surface water varied from 2.54 to 49.82 μmol L−1 during the observations in 2016, and from the limit of detection to 19.49 μmol L−1 in 2018.
Figures 4 and 6 show the spatial variations of Chl a concentrations and phytoplankton community composition in the surface water during the observations in 2016 and 2018. The average Chl a concentrations in the surface water were relatively high during the 2016 cruise (1.18 ± 0.90 μg L−1) and low during the 2018 cruise (0.61 ± 0.51 μg L−1). The Chl a concentrations ranged from 0.11 to 3.59 μg L−1 in 2016 and from 0.10 to 1.59 μg L−1 in 2018 (Figure 4).
The distributions of the phytoplankton communities differed between the 2016 and 2018 cruises (Figures 6 and S2). During the 2016 cruise, the phytoplankton community was dominated by diatoms and cryptophytes, which made large contributions to the TChl a in the surface water and throughout (depth-integrated) the water column at latitudes above 24°N. In the southern TWS, the contributions of Synechococcus and Prochlorococcus increased to as much as 35% in the surface water. The phytoplankton community during the 2018 cruise was dominated by diatoms, prasinophytes, and cryptophytes. Together these groups accounted for 87% and 91% of the TChl a in the surface water and throughout (depth-integrated) the water column, respectively. TChl a concentrations in the southern TWS were lower in 2018 than in 2016, but the phytoplankton community was still dominated by diatoms, Synechococcus, and Prochlorococcus. To better understand the differences of concentrations of phytoplankton groups in the surface water and water column between 2016 and 2018, we subtracted the concentrations of dinoflagellates, diatoms, cryptophytes, haptophytes (Type 8), chlorophytes, prasinophytes, Synechococcus, and Prochlorococcus in 2016 from their concentrations in 2018 (Figures 7 and S3). Dinoflagellates, diatoms, cryptophytes, and chlorophytes were significantly more abundant during the observations in 2016 than in 2018, whereas the concentrations of Synechococcus and Prochlorococcus were lower in 2016 than in 2018. The concentrations of prasinophytes were lower along the coast of the western TWS and higher in the central TWS in 2016 than in 2018. We defined differences between concentrations of phytoplankton groups in the surface water during the 2016 and 2018 cruises and the climatological average phytoplankton community based on the six cruises in the early spring between 2012 and 2018 as the anomalies of the phytoplankton groups (Figure S4). The anomalies of dinoflagellates, diatoms, cryptophytes, and chlorophytes were positive in most of the TWS during the 2016 cruise, and the anomalies of Synechococcus, and Prochlorococcus were positive during the 2018 cruise (Figure S4).
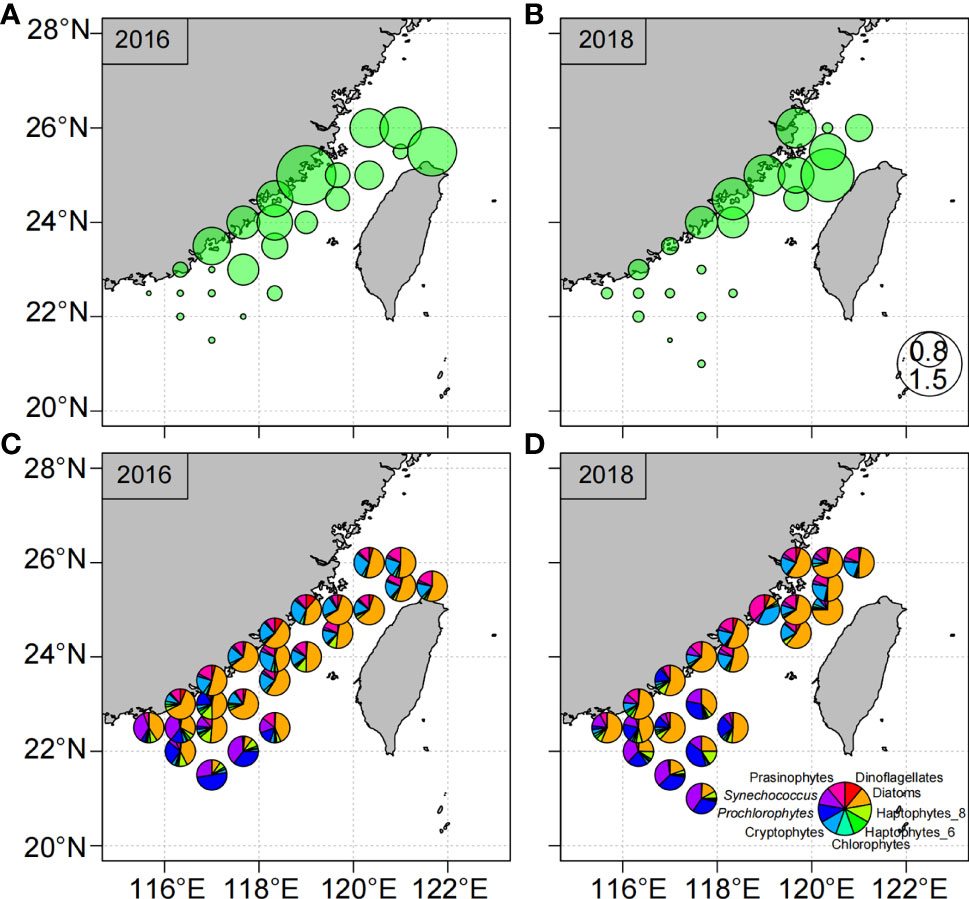
Figure 6 Surface total chlorophyll a concentrations (upper, μg L−1) and phytoplankton community structure (below) based on the HPLC analysis during the observations in 2016 (A, C) and 2018 (B, D). All data are averaged over 0.5°×0.5° grid boxes.
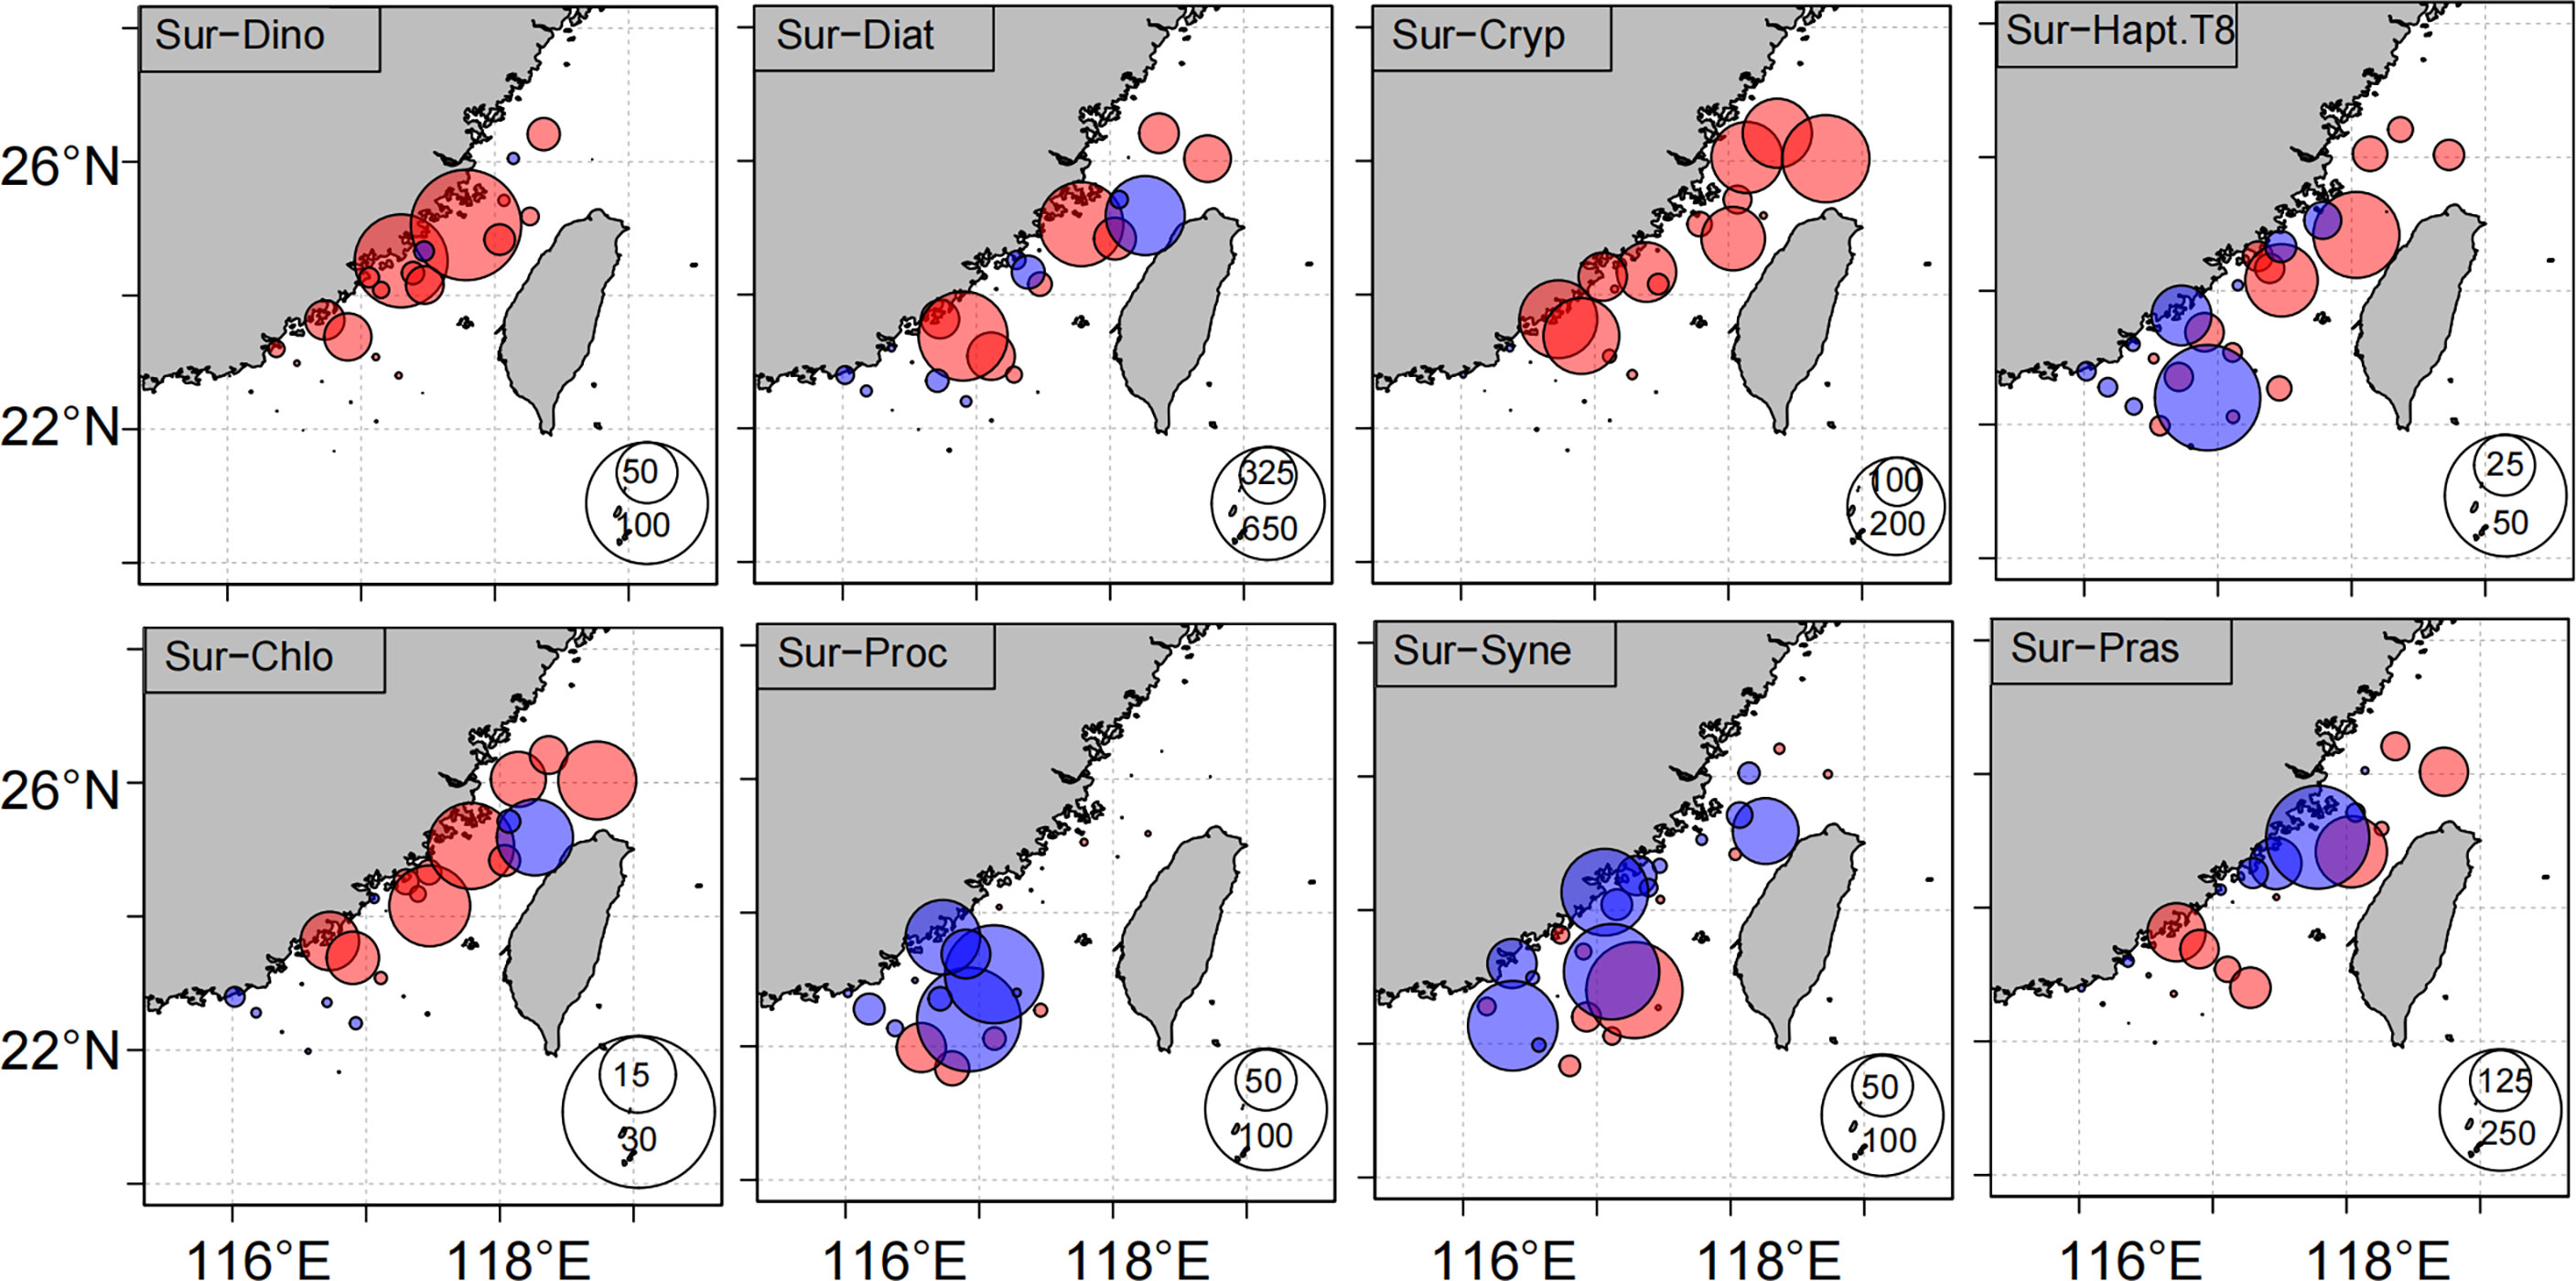
Figure 7 The differences in concentrations of dinoflagellates (Dino, ng L−1), diatoms (Diat, ng L−1), cryptophytes (Cryp, ng L−1), haptophytes (Type 8; Hapt.T8, ng L−1), chlorophytes (Chlo, ng L−1), Prochlorococcus (Proc, ng L−1), Synechococcus (Syne, ng L−1) and prasinophytes (Pras, ng L−1) in the surface water between 2016 and 2018. Notes: red and blue circles represent the positive and negative values, respectively.
To explore the causes of different phytoplankton communities between two ENSO phases, concentrations of phytoplankton groups were shown in the T-S diagrams (Figure S5). Similar distributions of phytoplankton groups were observed in the 2016 and 2018 cruises. High concentrations of dinoflagellates, diatoms, cryptophytes, chlorophytes, and prasinophytes were mainly found in cold (Potential temperature < 20 °C), low-salinity water, whereas concentrations of Synechococcus and Prochlorococcus increased in warm water (Potential temperature > 20 °C). The TWS was affected by the obvious difference between coastal water and warm water, which leads to significant differences of phytoplankton community concentration during the cruise in 2016 and 2018. During the 2016 cruise, the average concentrations of dinoflagellate, diatoms, cryptophytes, chlorophytes, prasinophytes, Synechococcus, and Prochlorococcus in the water column were 14, 279, 81, 5, 72, 13, and 9 ng L−1, whereas during the 2018 cruise, they were 7, 239, 48, 4, 66, 32, 30 ng L−1, respectively.
The physical, chemical, and biological differences in the TWS during the different ENSO phases could be attributed to changes of ocean currents, including the CCC, the SCS warm current, and the Kuroshio invasion. The environmental changes induced by physical processes during the different phases of the ENSO could account for the variations of phytoplankton community structure. Our previous study based on a decadal-scale field database has shown that the distributions of phytoplankton during the different monsoons in the TWS are associated with a variety of physical processes that influence different water masses, and phytoplankton realized traits help to explain the distribution patterns (Zhong et al., 2020). This study revealed that the concept of phytoplankton realized niches could also help to explain the responses of the phytoplankton community to the variations of physical processes during different ENSO events.
Some studies have shown that the intrusions of the Kuroshio water into the TWS are regulated by ENSO events (Huang et al., 2015). The intrusions have greater impact during El Niño events and less impact during La Niña event (Kuo and Tseng, 2020). For instance, the results of Ding et al. (2022) have shown that the intrusion of Kuroshio water was strong during the winter of the 2015–2016 El Niño. In this study, the analysis of water masses revealed the influence of Kuroshio water characterized by high temperature and high salinity during the 2015–2016 El Niño and 2017–2018 La Niña (Figure 5). There were no obvious differences between the impacts of the two Kuroshio invasions because of the limited size of the sampling area. However, influences of the CCC and warm water associated with the Kuroshio intrusion and SCS warm current on the TWS differed during the two ENSO events (Figures 3–5). The distinct differences in Chl a concentrations and phytoplankton communities (Figures 6, 7) between the early spring of 2016, when there was a large influence of the CCC, and 2018, when the TWS was covered by warm water, were thus explained by differences in the preferences of phytoplankton groups in terms of temperature, salinity, and nutrient concentrations. Phytoplankton groups including diatoms, dinoflagellates, and cryptophytes have low-temperature, low-salinity, and relatively high-nutrient niches, and they are dominant in the coastal water (Zhong et al., 2019; Zhong et al., 2020; Figure S5). Prochlorococcus and Synechococcus prefer an environment characterized by high temperature, high salinity, and relatively low nutrient concentrations, and they are dominant in the warm water influenced by SCS warm water or Kuroshio water (Zhong et al., 2020; Figure S5). Prasinophytes are characterized by relatively low-temperature, low-salinity, and high-nutrient niches, but they are more sensitive to irradiance and temperature than diatoms (Xiao et al., 2018). Chlorophytes prefer freshwater environments (Ma et al., 2020), and haptophyte (Type 8) flourish in water influenced by the Kuroshio intrusion during the northeast monsoon (Zhong et al., 2020). The realized niches of these phytoplankton groups therefore help to explain the high Chl a concentrations associated with diatoms, dinoflagellates, cryptophytes, and chlorophytes during the 2016 cruise as well as the relatively high Prochlorococcus and Synechococcus concentrations in the TWS during the 2018 cruise (Figures 6, 7 and S3, S4).
Furthermore, previous studies have shown that the influences of the CCC and warm water on the TWS are regulated by the intensities of the northeast winds (Hong et al., 2011), which are influenced by the formation of the Philippine Sea anticyclone (PSAC) (Tim et al., 2017). The formation of the PSAC is an important facet of ENSO that influences the East Asian climate. The PSAC is often found in the northwest Pacific Ocean during an El Niño year, and the southerly winds near the west side of the PSAC weaken the northerly winds. Conditions are reversed during La Niña events (Yuan et al., 2012). This pattern is consistent with the results of the physics, chemistry, and biology of the TWS during the 1997–1998 El Niño event. During that time, the TWS was characterized by a weak northeast wind, large SST anomalies, and low concentrations of nutrients and Chl a (Shang et al., 2005). Some researchers have found that although the strengths of the 2015–2016 and 1997–1998 El Niño events were similar, there were some fundamental differences between the underlying dynamics of the 1997–1998 El Niño, which evolved in the eastern Pacific, and the 2015–2016 El Niño, which evolved in the eastern and central Pacific (Paek et al., 2017). Xiao et al. (2020) have shown that the effects of the 1997–1998 and 2015–2016 El Niño events on the SCS were dissimilar. This dissimilarity was associated with the different locations, intensities, and lifetimes of the PSACs during the central and eastern Pacific El Niño events (Yuan et al., 2012; Feng et al., 2018). These differences influenced the strength of the East Asian winter monsoon: the northeast wind was weak during the 1997–1998 El Niño and strong during the 2015–2016 El Niño. This difference was associated with the influences of the different currents and led to the different distributions of phytoplankton community structure.
However, many studies have shown that northeast winds have intensified since 1998 (Zhang et al., 2020), and the relationship between the East Asian winter monsoon and ENSO has weakened as the climate has changed (Wang and He, 2012). Previous studies have shown that the influence of the CCC in winter tends to be stronger during La Niña and weaker during El Niño events (Zhang et al., 2020). The similar patterns of the northeast wind observed during the early springs of 2016 and 2018 differed from the results of Zhang et al. (2020) (Figure 3) and further verified the results of Wang and He (2012). This weakening relationship may account for the similarity of the northeast wind patterns observed during the early springs of 2016 and 2018, but why the influence of the CCC in the two years differed is still unclear (Figure 3). The obviously high SST anomalies in the northern TWS during the early spring of 2018 (Figure 3) indicated that a large amount of warm water had invaded into the northern TWS from the northern Taiwan Province. The Kuroshio intrusion into the shelf of ECS from the northeast of Taiwan was confirmed by the study of Yang et al. (2018). That invasion restricted the transport of the CCC and resulted in warm water covering the TWS (Figure 3). Compared to the conditions during 2016, variations of concentrations of phytoplankton groups, which was reflected from the decreasing of diatoms, dinoflagellate, chlorophytes, cryptophytes and the increasing of Prochlorococcus and Synechococcus, also verified the relatively larger influences of warm water during the early spring of 2018 (Figure 7).
Many studies have shown that changes in physical processes caused by the stress of climate change may induce the environmental changes that in turn cause changes of phytoplankton composition (Oziel et al., 2020; Catlett et al., 2021). In this study, the different patterns of the phytoplankton community during two ENSO phases were also associated with physical processes such as the intrusion of low-salinity water and warm water. However, the conditions of the 1997–1998 El Niño differed from the ecological responses to the ENSO events during the 2015–2016 El Niño. The differences indicated that the regional impacts of ENSO events can be more complex. The original relationship between the physical processes in the TWS and ENSO may change, and that change may then influence the biological community in the TWS. The conclusions to be reached from this study were also constrained by the insufficient number of field observations in this complex strait ecosystem during the early spring. The limited number of field data from this natural marine ecosystem makes it challenging to analyze these changes on a long timescale and correctly attribute them to key processes. Although we able to sort out a large number of field data and used remote sensing satellite data to complement the field data, there is still an urgent need for long-term, continuous, high-resolution field data. Based on this large number of field observations, a big data analysis combined with remote sensing information and numerical models may provide important new clues and evidence.
The physical, chemical, and biological processes in the TWS associated with variations of the CCC, the SCS warm water, and the Kuroshio intrusion are influenced by ENSO events. Different responses of the TWS to the two ENSO phases were observed in the early spring during the 2015–2016 El Niño and 2017–2018 La Niña events. Much of the TWS was covered by warm water during the 2017–2018 La Niña, and the influence of the CCC on the TWS was much greater during the 2015–2016 El Niño. These differences resulted in distinctly different phytoplankton community compositions during the two different ENSO phases. During the 2015–2016 El Niño, the concentrations of phytoplankton were high because of the presence of numerous diatoms, dinoflagellates, cryptophytes, and chlorophytes, whereas TChl a concentrations were low during the 2017–2018 La Niña because of the decrease of diatoms and cryptophytes, and an increase of picophytoplankton including Synechococcus, Prochlorococcus, and prasinophytes. The difference of the ecological responses of the TWS to ENSO events in our study versus the 1997–1998 El Niño indicates that the regional impacts of ENSO events will be more complicated as the climate changes.
The original contributions presented in the study are included in the article/Supplementary Material. Further inquiries can be directed to the corresponding author.
YZ: Conceptualization, Formal analysis, Writing- Original draft preparation, Methodology, Software; EL: Writing- Reviewing and Editing, Supervision; JZ: Methodology, Software; JW: Methodology, Software; PW: Methodology, Software; CZ: Methodology, Software, Writing- Reviewing and Editing; XL: Conceptualization, Formal analysis, Writing- Reviewing and Editing; BH: Data curation, Supervision. All authors contributed to the article and approved the submitted version.
This work was supported by grants from the China NSF (grant numbers U1805241, 42122044, 42141002), the Programme of Introducing Talents of Discipline to Universities (“111” Project, grant number BP0719030), and Fujian Provincial Department of Educational Project (grant number JAT210297). Project supported by Southern Marine Science and Engineering Guangdong Laboratory (Zhuhai) (No. SML2021SP308) were acknowledged.
Date and samples were collected onboard of R/V Yanping implementing the open research cruises NORC2016-04 and NORC2018-04 supported by NSFC ship time Sharing Project (project numbers: 41549904 and 41749904). We thank Jixin Chen, Lizhen Lin and Lei Wang for their assistance in phytoplankton sample collections and analyses, and Siguang Liu for hydrographic data.
The authors declare that the research was conducted in the absence of any commercial or financial relationships that could be construed as a potential conflict of interest.
All claims expressed in this article are solely those of the authors and do not necessarily represent those of their affiliated organizations, or those of the publisher, the editors and the reviewers. Any product that may be evaluated in this article, or claim that may be made by its manufacturer, is not guaranteed or endorsed by the publisher.
The Supplementary Material for this article can be found online at: https://www.frontiersin.org/articles/10.3389/fmars.2022.997591/full#supplementary-material
Boyce D. G., Lewis M. R., Worm B. (2010). Global phytoplankton decline over the past century. Nature 466 (7306), 591–596. doi: 10.1038/nature09268
Barton A. D., Dutkiewicz S., Flierl G., Bragg J., Follows M. J. (2010). Patterns of diversity in marine phytoplankton. Science 327 (19), 1509–1511. doi: 10.1126/science.1184961
Belkin I. M., O’Reilly J. E. (2009). An algorithm for oceanic front detection in chlorophyll and SST satellite imagery. J. Marine Syst. 78 (3), 319–326. doi: 10.1016/j.jmarsys.2008.11.018
Catlett D., Siegel D. A., Simons R. D., Guillocheau N., Henderikx-Freitas F., Thomas C. S. (2021). Diagnosing seasonal to multi-decadal phytoplankton group dynamics in a highly productive coastal ecosystem. Prog. Oceanogr. 197, 102637. doi: 10.1016/j.pocean.2021.102637
Conde A., Prado M. (2018). Changes in phytoplankton vertical distribution during an El niño event. Ecol. Indic. 90, 201–205. doi: 10.1016/j.ecolind.2018.03.015
Cordero−Quirós N., Miller A. J., Pan Y., Balitaan L., Curchitser E., Dussin R. (2022). Physical−ecological response of the California current system to ENSO events in ROMS−NEMURO. Ocean Dynam. 72, 21–36. doi: 10.1007/s10236-021-01490-9
Ding X., Liu J., Zhang H., Ke Z., Li J., Liu W., et al. (2022). Phytoplankton community patterns in the northeastern south China Sea: Implications of intensified kuroshio intrusion during the 2015/16 El niño. J. Geophys. Res.: Oceans. 127, e2021JC017998. doi: 10.1029/2021JC017998
Du X., Peterson W. T. (2018). Phytoplankton community structure in 2011–2013 compared to the extratropical warming event of 2014–2015. Geophys. Res. Lett. 45 (3), 1534–1540. doi: 10.1002/2017gl076199
Feng J., Chen W., Wang X. (2018). Asymmetric responses of the Philippine Sea anomalous anticyclone/cyclone to two types of El niño–southern oscillation during the boreal winter. Atoms. Sci. Lett. 19, e866. doi: 10.1002/asl.866
Field C. B., Behrenfeld M. J., Randerson J. T., Falkowski P. (1998). Primary production of the biosphere: Integrating terrestrial and oceanic components. Science 281 (5374), 237–240. doi: 10.1126/science.281.5374.237
Good S., Fiedler E., Mao C., Martin M. J., Maycock A., Reid R., et al. (2020). The current configuration of the OSTIA system for operational production of foundation sea surface temperature and ice concentration analyses. Remote Sens. 12, 720. doi: 10.3390/rs12040720
Han A. Q., Dai M. H., Gan J. P., Kao S. J., Zhao X. Z., Jan S., et al. (2013). Inter-shelf nutrient transport from the East China Sea as a major nutrient source supporting winter primary production on the northeast south China Sea shelf. Biogeosciences 10 (12), 8159–8170. doi: 10.5194/bg-10-8159-2013
Hong H., Chai F., Zhang C., Huang B., Jiang Y., Hu J. (2011). An overview of physical and biogeochemical processes and ecosystem dynamics in the Taiwan strait. Cont. Shelf Res. 31 (6), 3–12. doi: 10.1016/j.csr.2011.02.002
Hong H., Zhang C., Shang S., Huang B., Li Y., Li X., et al. (2009). Interannual variability of summer coastal upwelling in the Taiwan strait. Cont. Shelf Res. 29 (2), 479–484. doi: 10.1016/j.csr.2008.11.007
Huang T.-H., Chen C.-T. A., Zhang W.-Z., Zhuang X.-F. (2015). Varying intensity of kuroshio intrusion into southeast Taiwan strait during ENSO events. Cont. Shelf Res. 103, 79–87. doi: 10.1016/j.csr.2015.04.021
Hu J., Kawamura H., Li C., Hong H., Jiang Y. (2010). Review on current and seawater volume transport through the Taiwan strait. J. Oceanogr. 66 (5), 591–610. doi: 10.1007/s10872-010-0049-1
Jacox M. G., Hazen E. L., Zaba K. D., Rudnick D. L., Edwards C. A., Moore A. M., et al. (2016). Impacts of the 2015–2016 El niño on the California current system: Early assessment and comparison to past events. Geophys. Res. Lett. 43, 7072–7080. doi: 10.1002/2016GL069716
Jin F.-F., Kim S. T., Bejarano L. (2006). A coupled-stability index for ENSO. Geophys. Res. Lett. 33 (23), L23708. doi: 10.1029/2006gl027221
Kuo Y.-C., Tseng Y.-H. (2020). Impact of ENSO on the south China Sea during ENSO decaying winter–spring modeled by a regional coupled model (a new mesoscale perspective). Ocean Model. 152, 101655. doi: 10.1016/j.ocemod.2020.101655
Liu H., Chang J., Tseng C. M., Wen L. S., Liu K. K. (2007). Seasonal variability of picoplankton in the northern south China Sea at the SEATS station. Deep Sea Res. Part II. 54 (14-15), 1602–1616. doi: 10.1016/j.dsr2.2007.05.004
Liu X., Xiao W., Landry M. R., Chiang K., Wang L., Huang B., et al (2016). Responses of phytoplankton communities to environmental variability in the East China Sea. Ecosystems 19 (5), 832–849. doi: 10.1007
Liu K. K., Wang L. W., Dai M., Tseng C. M., Yang Y., Sui C. H., et al. (2013). Inter-annual variation of chlorophyll in the northern south China Sea observed at the SEATS station and its asymmetric responses to climate oscillation. Biogeosciences 10 (11), 7449–7462. doi: 10.5194/bg-10-7449-2013
Ma L., Xiao W., Laws E.A., Bai X., Chiang K.P., Liu X, et al (2020). Responses of phytoplankton communities to the effect of internal wave‐powered upwelling. Limnol. Oceanogr. 9999, 1–16. doi: 10.1002/lno.11666
Mackey M., Mackey D., Higgins H., Wright S. (1996). CHEMTAX -a program for estimating class abundances from chemical markers: application to HPLC measurements of phytoplankton. Mar. Ecol. Prog. Ser. 144 (1), 265–283. doi: 10.3354/meps144265
McClatchie S., Goericke R., Leising A., Auth T., Bjorkstedt E., Robertson R., et al. (2016). State of the California current 2015-16: Comparisons with the 1997-98 El niño. CalCOFI Rep. 57, 1–57.
NanJung K., ChungRu H. (2004). ENSO effect on the sea surface wind and sea surface temperature in the Taiwan strait. Geophys. Res. Lett. 31 (13), 1–4. doi: 10.1029/2004gl020303
Nan F., Xue H., Yu F. (2015). Kuroshio intrusion into the south China Sea: A review. Prog. Oceanogr. 137, 314–333. doi: 10.1016/j.pocean.2014.05.012
Oziel L., Baudena A., Ardyna M., Massicotte P., Randelhoff A., Sallée J.-B., et al. (2020). Faster Atlantic currents drive poleward expansion of temperate phytoplankton in the Arctic ocean. Nat. Commun. 11, 1705. doi: 10.1038/s41467-020-15485-5
Paek H., Yu J.-Y., Qian C. (2017). Why were the 2015/2016 and 1997/1998 extreme El niños different? Geophys. Res. Lett. 44, 1848–1856. doi: 10.1002/2016GL071515
Racault M.-F., Sathyendranath S., Brewin R. J. W., Raitsos D. E., Jackson T., Platt T. (2017). Impact of El niño variability on oceanic phytoplankton. Front. Mar. Sci. 4. doi: 10.3389/fmars.2017.00133
Ren H.-L., Jin F.-F. (2013). Recharge oscillator mechanisms in two types of ENSO. J. Climate 26 (17), 6506–6523. doi: 10.1175/jcli-d-12-00601.1
Rousseaux C. S., Gregg W. W. (2012). Climate variability and phytoplankton composition in the pacific ocean. J. Geophys. Res.: Oceans 117, C10006. doi: 10.1029/2012jc008083
Saldarriaga J. F., Taylor F. J., Keeling P. J., Cavaliersmith T. (2001). Dinoflagellate nuclear SSU rRNA phylogeny suggests multiple plastid losses and replacements. J. Mol. Evol. 53, 204–213. doi: 10.1007/s002390010210
Shang S., Zhang C., Hong H., Liu Q., Wong G., Hu C., et al. (2005). Hydrographic and biological changes in the Taiwan strait during the 1997–1998 El niño winter. Geophys. Res. Lett. 32, L11601. doi: 10.1029/2005gl022578
Sieracki C. K., Sieracki M. E., Yentsch C. S. (1998). An imaging-in-flow system for automated analysis of marine microplankton. Mar. Ecol. Prog. Ser. 168, 285–296. doi: 10.3354/meps168285
Tim L., Bin W., Bo W., Zhou T., Chang C.-P., Zhang R. (2017). Theories on formation of an anomalous anticyclone in western north pacific during El niño: A review. J. Meteorol. Res. 31, 987–1006. doi: 10.1007/s13351-017-7147-6
Utermöhl H. (1958). Zur vervollkommnung der quantitativen phytoplankton-methodik. Mitteilung Internationale Vereinigung Fuer Theoretische unde Amgewandte Limnologie 9, 1–38.
Wang C., Deser C., Yu J.-Y., DiNezio P., Clement A. (2016). “El Niño and southern oscillation (ENSO): A review,” In Coral Reefs of the Eastern Pacific, Ed Glymn P., Manzello D., Enochs I. (Berlin, Germany: Springer Science Publisher), 85–106. doi: 10.1007/978-94-017-7499-4_4
Wang H., He S. (2012). Weakening relationship between East Asian winter monsoon and ENSO after mid-1970s. Chin. Sci. Bull 57, 3535–3540. doi: 10.1007/s11434-012-5285-x
Wang L., Huang B., Liu X., Xiao W. (2015). The modification and optimizing of the CHEMTAX running in the south China Sea. Acta Oceanol. Sin. 34 (2), 124–131. doi: 10.1007/s13131-015-0621-z
Xiao W., Wang L., Laws E., Xie Y., Chen J., Liu X., et al. (2018). Realized niches explain spatial gradients in seasonal abundance of phytoplankton groups in the south China Sea. Progr. Oceanogr. 162, 223–239. doi: 10.1016/j.pocean.2018.03.008
Xiao F., Wu Z., Lyu Y., Zhang Y. (2020). Abnormal strong upwelling off the coast of southeast Vietnam in the late summer of 2016: A comparison with the case in 1998. Atmosphere 11, 940. doi: 10.3390/atmos11090940
Yang D., Yin B., Chai F., Feng X., Xue H., Gao G., et al (2018). The onshore intrusion of Kuroshio subsurface water from February to July and a mechanism for the intrusion variation. Progr. Oceanogr. 167, 97–115. doi: 10.1016/j.pocean.2018.08.004
Yuan Y., Yang S., Zhang Z. (2012). Different evolutions of the Philippine Sea anticyclone between the eastern and central pacific El niño: Possible effects of Indian ocean SST. J. Climate 25, 7867–7883. doi: 10.1175/JCLI-D-12-00004.1
Zhang C. (2021). Responses of summer upwelling to recent climate changes in the Taiwan strait. Remote Sensi. 13, 1386. doi: 10.3390/rs13071386
Zhang C., Huang Y., Ding W. (2020). Enhancement of Zhe−Min coastal water in the Taiwan strait in winter. J. Oceanogr. 76, 197–209. doi: 10.1007/s10872-020-00539-5
Zhong Y., Hu J., Laws E. A., Liu X., Chen J., Huang B. (2019). Plankton community responses to pulsed upwelling events in the southern Taiwan strait. ICES J. Mar. Sci. 76 (7), 2374–2388. doi: 10.1093/icesjms/fsz142
Keywords: phytoplankton community, coastal current, ENSO events, biogeochemical processes, Taiwan Strait
Citation: Zhong Y, Laws EA, Zhuang J, Wang J, Wang P, Zhang C, Liu X and Huang B (2022) Responses of phytoplankton communities driven by differences of source water intrusions in the El Niño and La Niña events in the Taiwan Strait during the early spring. Front. Mar. Sci. 9:997591. doi: 10.3389/fmars.2022.997591
Received: 19 July 2022; Accepted: 13 September 2022;
Published: 27 September 2022.
Edited by:
Yunyan Deng, Institute of Oceanology (CAS), ChinaReviewed by:
Dylan Catlett, Woods Hole Oceanographic Institution, United StatesCopyright © 2022 Zhong, Laws, Zhuang, Wang, Wang, Zhang, Liu and Huang. This is an open-access article distributed under the terms of the Creative Commons Attribution License (CC BY). The use, distribution or reproduction in other forums is permitted, provided the original author(s) and the copyright owner(s) are credited and that the original publication in this journal is cited, in accordance with accepted academic practice. No use, distribution or reproduction is permitted which does not comply with these terms.
*Correspondence: Xin Liu, bGl1eGluMTk4M0B4bXUuZWR1LmNu
Disclaimer: All claims expressed in this article are solely those of the authors and do not necessarily represent those of their affiliated organizations, or those of the publisher, the editors and the reviewers. Any product that may be evaluated in this article or claim that may be made by its manufacturer is not guaranteed or endorsed by the publisher.
Research integrity at Frontiers
Learn more about the work of our research integrity team to safeguard the quality of each article we publish.