
95% of researchers rate our articles as excellent or good
Learn more about the work of our research integrity team to safeguard the quality of each article we publish.
Find out more
ORIGINAL RESEARCH article
Front. Mar. Sci. , 17 February 2022
Sec. Coastal Ocean Processes
Volume 9 - 2022 | https://doi.org/10.3389/fmars.2022.844113
This article is part of the Research Topic Advances in Sea State Modeling and Climate Change Impacts View all 19 articles
 Delei Li1,2,3*
 Jianlong Feng4
 Yuchao Zhu1,2,3
 Joanna Staneva5
 Jifeng Qi1,2,3
 Arno Behrens5
 Donghyun Lee6
 Seung-Ki Min7,8
 Baoshu Yin1,2,3,9,10*
Few studies have focused on the projected future changes in wave climate in the Chinese marginal seas. For the first time, we investigate the projected changes of the mean and extreme wave climate over the Bohai Sea, Yellow Sea, and East China Sea (BYE) during two future periods (2021–2050 and 2071–2100) under the RCP2.6 and RCP8.5 scenarios from the WAM wave model simulations with a resolution of 0.1°. This is currently the highest-resolution wave projection dataset available for the study domain. The wind forcings for WAM are from high-resolution (0.22°) regional climate model (RCM) CCLM-MPIESM simulations. The multivariate bias-adjustment method based on the N-dimensional probability density function transform is used to correct the raw simulated significant wave height (SWH), mean wave period (MWP), and mean wave direction (MWD). The annual and seasonal mean SWH are generally projected to decrease (-0.15 to -0.01 m) for 2021–2050 and 2071–2100 under the RCP2.6 and RCP8.5 scenarios, with statistical significance at a 0.1 level for most BYE in spring and for most of the Bohai Sea and Yellow Sea in annual and winter/autumn mean. There is a significant decrease in the spring MWP for two future periods under both the RCP2.6 and RCP8.5 scenarios. In contrast, the annual and summer/winter 99th percentile SWH are generally projected to increase for large parts of the study domain. Results imply that the projected changes in the mean and 99th percentile extreme waves are very likely related to projected changes in local mean and extreme surface wind speeds, respectively.
Ocean waves, especially extreme waves, contain tremendous energy and can greatly impact coastal and offshore industries and marine ecosystems (Hoeke et al., 2013; Toimil et al., 2020). They are also one of the dominant contributors to coastal erosion and flooding (Casas-Prat and Wang, 2020; Melet et al., 2020) along with sea-level rise, storm surge, and precipitation (Camus et al., 2017). Extreme waves have also been a significant threat to human life. For example, they are the deadliest marine hazard in China and have caused ∼74% of the total casualties from major marine hazards (including extreme waves, storm surges, tsunamis, and sea ice) during 2000–2015 (Tao et al., 2018).
Under global warming, there have been emerging changes in large-scale atmospheric circulations or climate modes. The western North Pacific subtropical high will likely weaken and retreat eastward in the mid-troposphere at the end of the twenty-first century (He et al., 2015). There was a robust migration of tropical cyclones coastward and poleward in 1982–2018 (Wang and Toumi, 2021). Mei and Xie (2016) revealed that typhoons that impact East and Southeast Asia have intensified by 12–15% during 1977–2014 and indicated that the proportion of category 4 and 5 typhoons has doubled or tripled. All these changes have potential implications for ocean waves or extreme wave events.
Previous studies have investigated the historical changes in the mean or extreme wave conditions globally or regionally (Reguero et al., 2019; Shi et al., 2019; Young and Ribal, 2019). Based on satellite observations, Young and Ribal (2019) revealed small increases in the significant wave height (SWH) and larger increases in the 90th percentiles extreme wave conditions during 1985–2018, especially in the Southern Ocean. Shi et al. (2019) found that the 99th percentile extreme waves increases in most of the Chinese seas by 0.5–3 cm/year in 1979–2017.
However, knowledge of future projected changes in ocean wave climate is limited relative to knowledge of sea surface temperatures or sea levels. This is because most global climate models (GCMs) from the Climate Model Intercomparison Project (CMIP) do not have ocean wave components, with some exceptions, such as FIO-ESM v2.0 (Song et al., 2020). Useful projections of mean and extreme wave climate need to be conducted through dynamical or statistical downscaling (Wang and Swail, 2001, 2006; Mori et al., 2010). Since the launch of the Coordinated Ocean Wave Climate Project (henceforth COWCLIP, Hemer et al., 2012), projected change studies of the ocean wave climate have advanced both regionally and globally (Hemer et al., 2013a; Casas-Prat et al., 2018; Lobeto et al., 2021; O’Grady et al., 2021). From the first community-derived multi-model ensemble of wave-climate projections, Hemer et al. (2013a) revealed the projected changes of SWH, mean wave period (MWP), and mean wave direction (MWD) and found a projected increase in annual mean SWH over 7.1% of the global ocean, predominantly in the Southern Ocean. Based on statistical projections of wave height from sea-level pressure of 20 CMIP5 GCMs, Wang et al. (2014) found increases of SWH in the tropics and high latitudes in the Southern Hemisphere. The occurrence frequency of the present-day 10-year return extreme wave heights are likely to double or triple in several coastal areas worldwide at end of the twenty-first century under the RCP 8.5 scenario. Morim et al. (2018) conducted a system review on global and regional wind-wave climate projection and established consistent patterns of projected changes in wind-wave climate globally under the global warming. Morim et al. (2019) concluded that approximately 50% of the world’s coastline is at risk due to wave climate change, and current wave projection uncertainties are dominated by model-driven uncertainty, encouraging the application of multi-modeling methods on wave climate projections. By using ensembles of global wave model runs driven by 8 CMIP5 GCMs, Meucci et al. (2020) revealed that the intensity of a 100-year return level of the SWH increases by 5–15% in the Southern Ocean by the end of the twenty-first century relative to the 1979–2005 period.
GCMs generally have a coarse resolution, which is not feasible in capturing local or regional wind systems. Li et al. (2016) found that the high-resolution regional climate model (RCM) hindcast can add value in capturing strong wind speeds in the coastal areas of the Bohai Sea and Yellow Sea. Timmermans et al. (2017) revealed that wave modeling driven by high-resolution winds features improvement in capturing extreme waves relative to coarse-resolution winds. In contrast, Chowdhury and Behera (2019) revealed that the wave modeling driven by high-resolution RCMs does not add value to those driven by coarse-resolution GCMs in the Indian Ocean, indicating that the added value of RCMs strongly depends on the regions considered (e.g., Di Luca et al., 2012). The high-resolution wind-driven wave projections have been performed over areas such as the European coast (Laugel et al., 2014; Bricheno and Wolf, 2018; Bonaduce et al., 2019), the southeastern coast of Australia (Hemer et al., 2013b), and the Gulf of St. Lawrence (Wang et al., 2018), however, it is not yet available for the Chinese marginal seas by now.
Wave modeling inevitably demonstrates bias relative to observations, which is a combination of inherited systematic bias from wind forcings and bias generated from wave modeling processes due to inadequate model physics, numerical solution schemes, or unrealistic topography. Different bias-adjustment methods (BAMs), such as the delta method and empirical or parametric quantile mapping method, have been applied in several wave climate studies (Charles et al., 2012; Parker and Hill, 2017; Lemos et al., 2020a,b; Meucci et al., 2020). However, the performances among BAMs show some differences. Lemos et al. (2020a) demonstrated that a quantile-based bias adjustment is better than the delta method in correcting biases in extremes. Parker and Hill (2017) revealed that bivariate BAMs can greatly improve intervariable correlations by comparing them with univariate BAMs. However, wave variables (wave height, wave direction, wave period, etc.) are highly correlated with each other. Multivariate bias adjustment is required to apply on the raw wave outputs, to correct biases in both individual wave variables and multivariate dependence structures.
For the first time, high-resolution regional wave climate projections in the Bohai Sea, Yellow Sea, and East China Sea (hereafter BYE) driven by high-resolution RCM winds are performed. The present study aims to investigate the future projected changes in the annual and seasonal mean and extreme waves in this area during the middle of the twenty-first century (2021–2050) and the end of the twenty-first century (2071–2100) under the RCP2.6 and RCP8.5 scenarios. A multivariate bias-adjustment method (MBAn, Cannon, 2018) is applied to correct multivariate biases.
This paper is organized as follows. Section “Methodology and Datasets” describes the model and datasets. The results are given in section “Results”, including the wave hindcast evaluation and projected change analyses in the mean and extreme wave conditions. The manuscript ends with conclusions and a discussion (section “Conclusion and Discussion”).
In this study, the third-generation WAM cycle 4.7 was used to investigate the impact of climate change on the wave conditions in the BYE area. It maintains the basic physics and numeric of the WAM model used in Li et al. (2021) and is run in a shallow-water mode, with depth refraction considered. The wave model is configured to use 24 directions and 25 frequencies ranging from 0.04118 to 0.41145 Hz. It is implemented on two nested domains: the northwestern Pacific Ocean (NWP) with a spatial resolution of 0.5° and the BYE area with a spatial resolution of 0.1° (Figure 1). Full-wave spectra produced by the larger domain simulations are provided to the smaller domain at the open boundaries with an hourly frequency. The topographic data are obtained from the General Bathymetric Chart of the Oceans 1-min grid.1
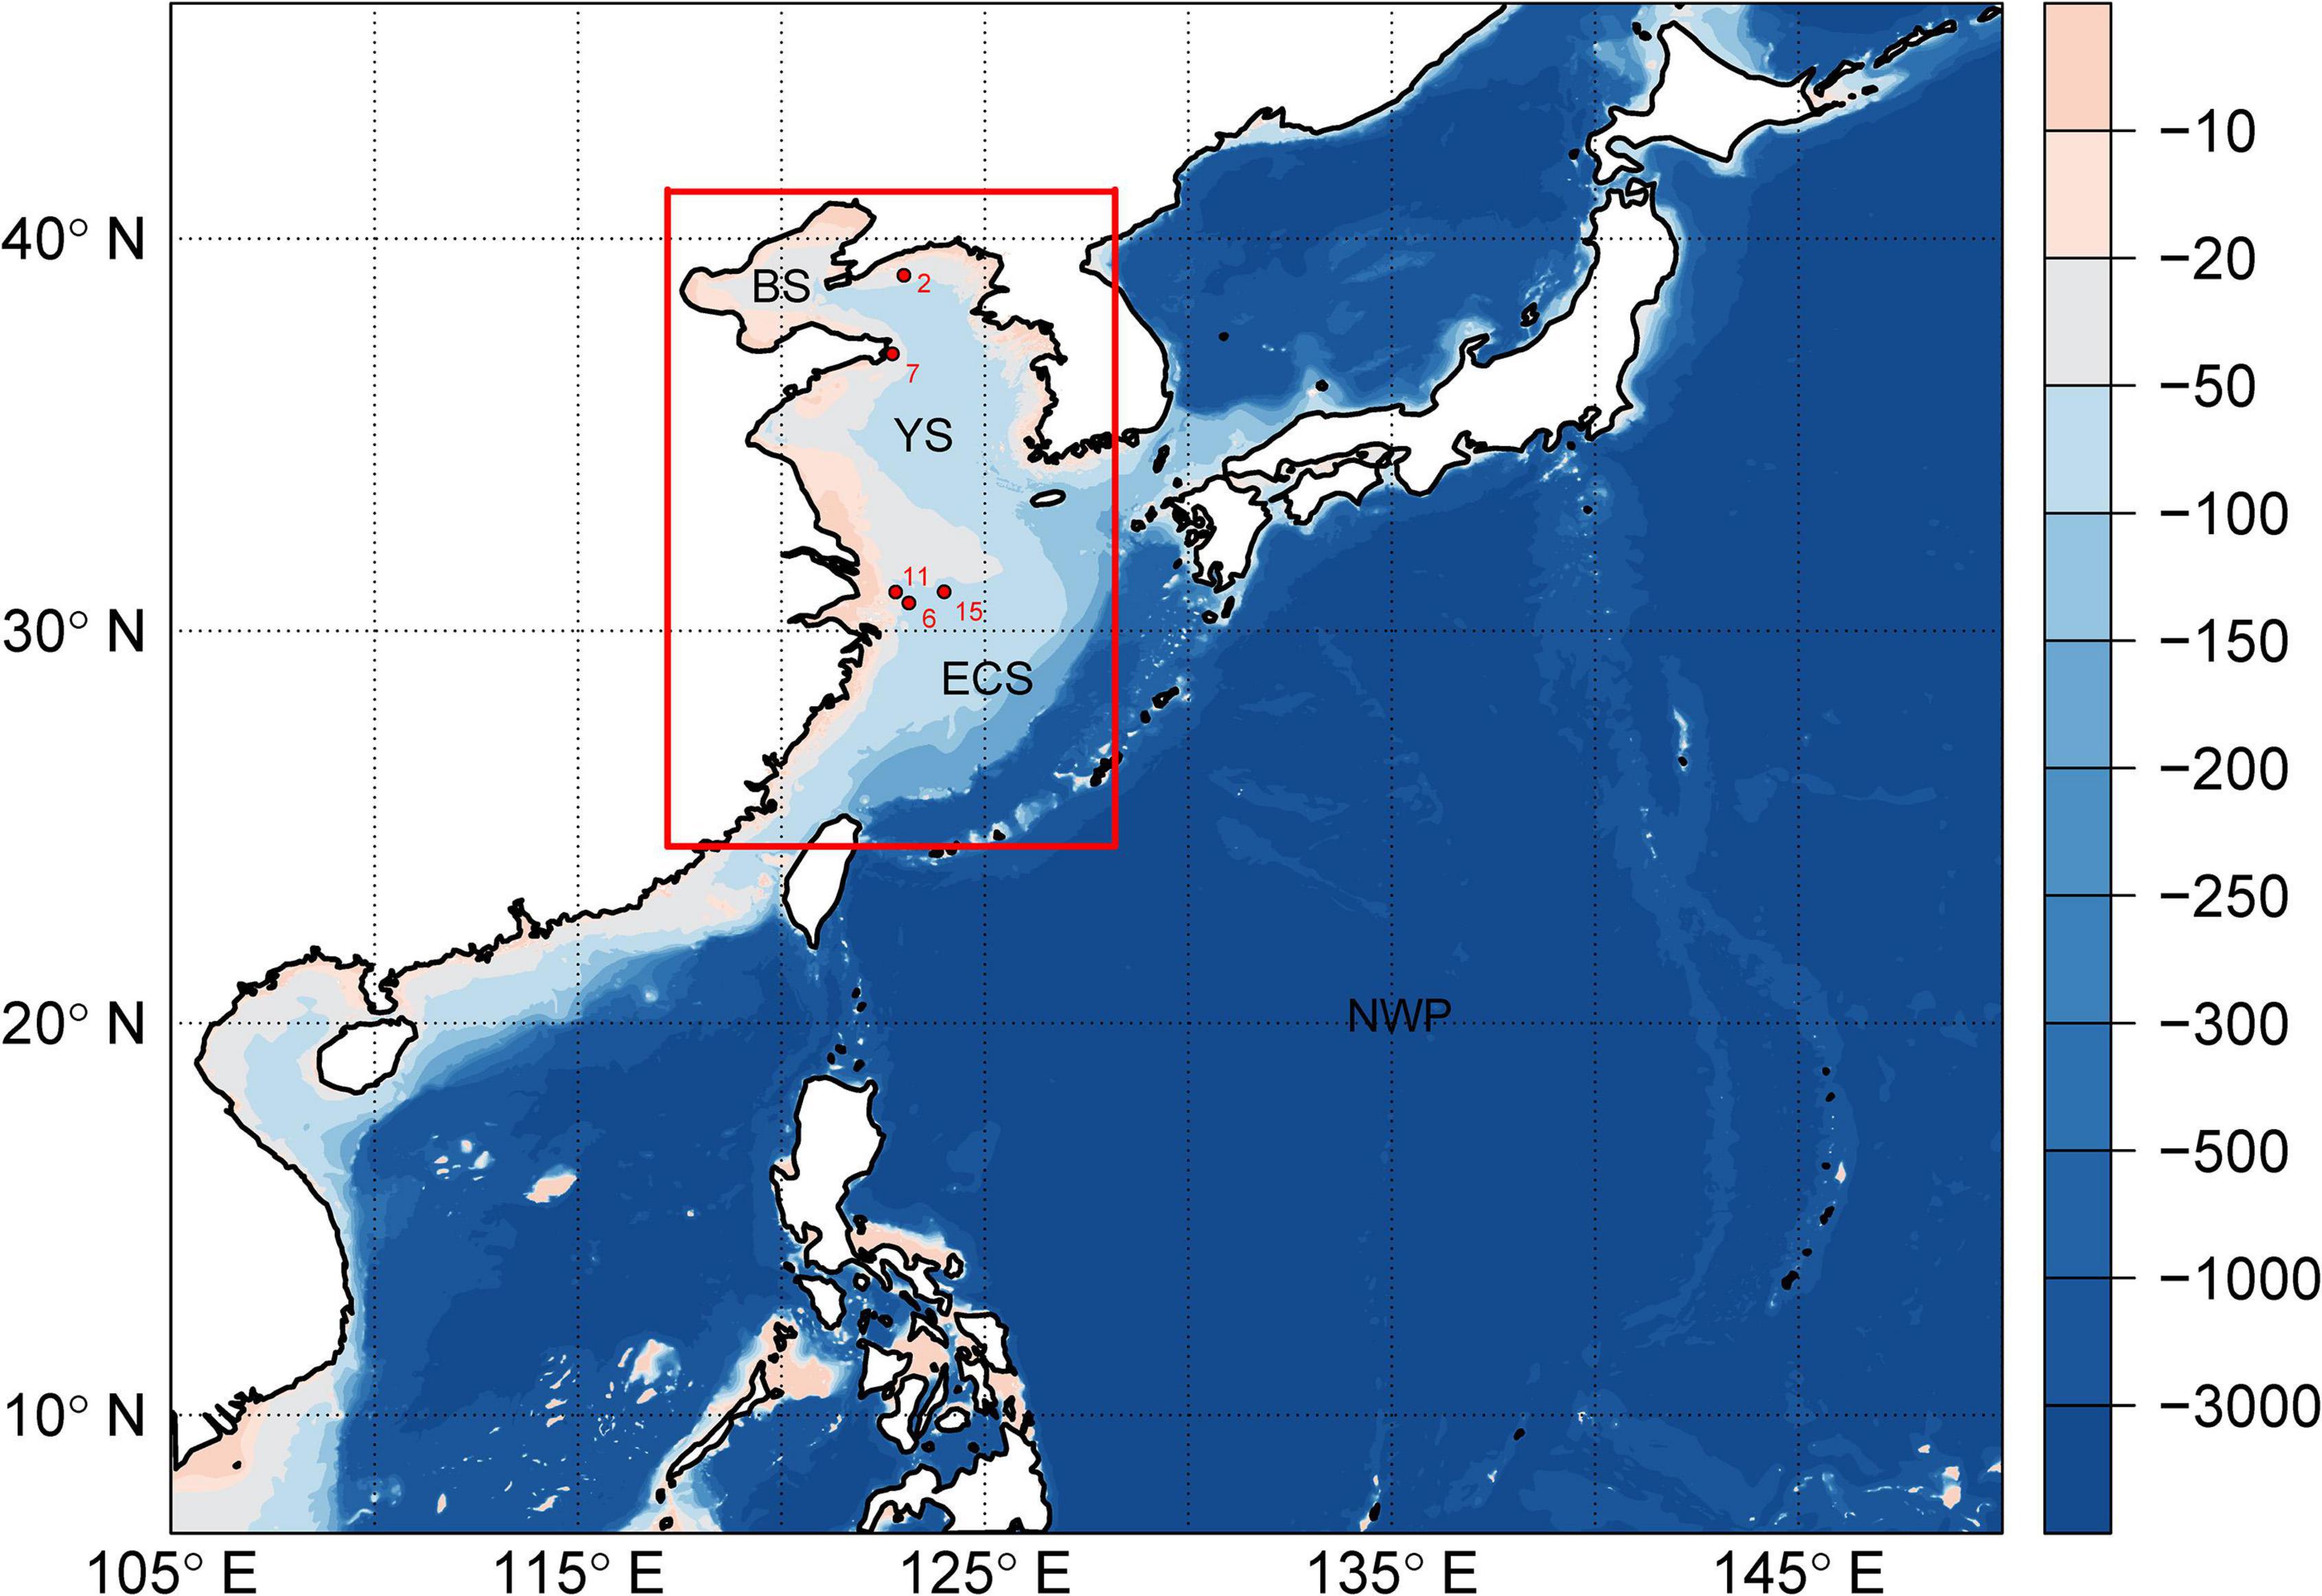
Figure 1. Topography (in meters) of the modeling areas: the outermost square indicates the domain for the WAM simulations over the northwestern Pacific region (resolution: 0.5°), and the red square indicates the region for the fine-resolution (0.1°) WAM simulations. Red points and numbers indicate the locations and station numbers of buoy observations, respectively. The abbreviations BS, YS, ECS, and NWP represent the Bohai Sea, the Yellow Sea, the East China Sea, and the northwest Pacific Ocean, respectively.
We conducted wave hindcast simulations over the NWP and BYE forced by ERA5 wind speed (0.25°, Hersbach et al., 2020) during 1979–2019 to validate the model’s ability to capture the wave climate features in the BYE (thereafter ERA5 driven wave hindcast). ERA5 winds have proved to be robust in forcing wave conditions in the study domain (Li et al., 2020). To study the impact of climate change on wave climate, nested WAM simulations are forced by 3-hourly wind outputs (0.22°) from the CCLM-MPIESM RCM simulations (Kim et al., 2020) for the historical climate period (1979–2005) and two future periods (2021–2050 and 2071–2100) under the RCP2.6 and RCP8.5 emission scenarios. The above wind forcings are spatially interpolated to 0.5° and 0.1° resolutions for the NWP and BYE simulations, respectively, and kept constant in time throughout 3-h during wave integration. CCLM-MPIESM regional climate simulations were performed by Pohang University of Science and Technology from the CORDEX-East Asia II framework (Kim et al., 2020) by using the RCM CCLM downscaled from the global climate model MPIESM-LR (Giorgetta et al., 2013). To reduce potential biases on larger-scale circulation patterns, spectral nudging was employed to zonal and meridional winds above the 850 hPa level based on the sensitivity experiment results (Lee et al., 2016). CCLM experimental details are summarized on the CORDEX-East Asia website.2
A multivariate bias-adjustment method based on the N-dimensional probability density function transform (MBAn, Cannon, 2018) has been applied to multiple wave variables, including the SWH, MWP, and MWD. As wave direction is a cyclic variable, it was partitioned into two orthogonal components (sinMWD and cosMWD) before the application of bias-adjustment. MBAn can correct the biases of the marginal distribution of individual wave variables and multivariate dependence structure. Three steps are involved in the usage of MBAn for bias adjustment of historical and future projected wave variables: (1) applying a uniformly distributed random orthogonal rotation to the simulated and observed data; (2) correcting the marginal distributions of each variable of the rotated simulated data by using the quantile delta mapping method; and (3) applying inverse rotation to the correct data. These steps are repeated until the modeled multivariate distribution has converged to the observed distribution. More details can be found in Cannon (2018).
To validate the skills of the wave model in capturing historical wave climate features in the BYE, in-situ observations from five buoy stations (Figure 1) were obtained from the Marine Science Data Center of the Chinese Academy of Sciences for the period approximately from 2010 to 2019. The observed wave variables include SWH, wave direction, and MWP. Furthermore, a daily merged multi-mission along-track L3 satellite product from the Sea State Climate Change Initiative (CCI) dataset v1 (Dodet et al., 2020) is also used as a reference for comparison from 1991 to 2018. The Sea State CCI L3 product retains only valid and good-quality measurements from 10 altimeters (ERS-1, ERS-2, TOPEX, Envisat, GFO, CryoSat-2, Jason-1, Jason-2, Jason-3, and SARAL). The satellite measurements nearest to the WAM model grid points and within 1 h from the simulated full hour were assigned as observations for the specific model grid. All simultaneous pairs between satellite observations and model grid points were used to evaluate the models’ skills in capturing wave conditions.
The statistical metrics used for the comparison between simulated data and observations are the bias, scatter index (SI), correlation coefficient (CORR), and root mean square error (RMSE).
We used the robust coefficient of variation (RCoV) to quantify the inter-annual and intra-annual variability in the SWH. RCoV is defined as the median absolute deviation (MAD) divided by the median (Gunturu and Schlosser, 2012):
where SWHi is the bias-adjusted time-series of the SWH.
To compute the intra-annual variability of SWH, we performed the following processes: (1) calculate the monthly mean SWH at each grid point, (2) calculate the median of monthly SWH and MAD data series for each year, (3) divide the annual MAD with the corresponding annual median SWH to obtain annual RCoV, and (4) calculate the median of the annual RCoV, producing an estimation of the intra-annual variability of SWH. For the calculation of inter-annual variability of SWH, the annual mean SWH was calculated first and the RCoV was calculated based on the annual mean time series.
We compared the SWH of the ERA5-driven wave hindcast with the Sea State CCI dataset between 1991 and 2018 (Figure 2). The results show that the wave hindcast is in good agreement with the observed SWH, with a bias of -0.104 m, correlation coefficient of 0.858, root mean square error of 0.5 m and scatter index of 0.338. Furthermore, we also assessed the wave hindcast annually from 1991 to 2018, with the Sea State CCI dataset as a reference (Supplementary Table 1). The statistical metrics are similar among different years in terms of bias, RMSE, and CORR except in 1991, when there are only 204 pairs. It is found that the simulated data tend to overestimate satellite observations for SWH larger than 6 m, which may be due to the underestimation of extreme wave heights by altimeter data in the coastal area (Dodet et al., 2020) or the limited skills of ERA5-driven wave hindcast in capturing very extreme wave heights.
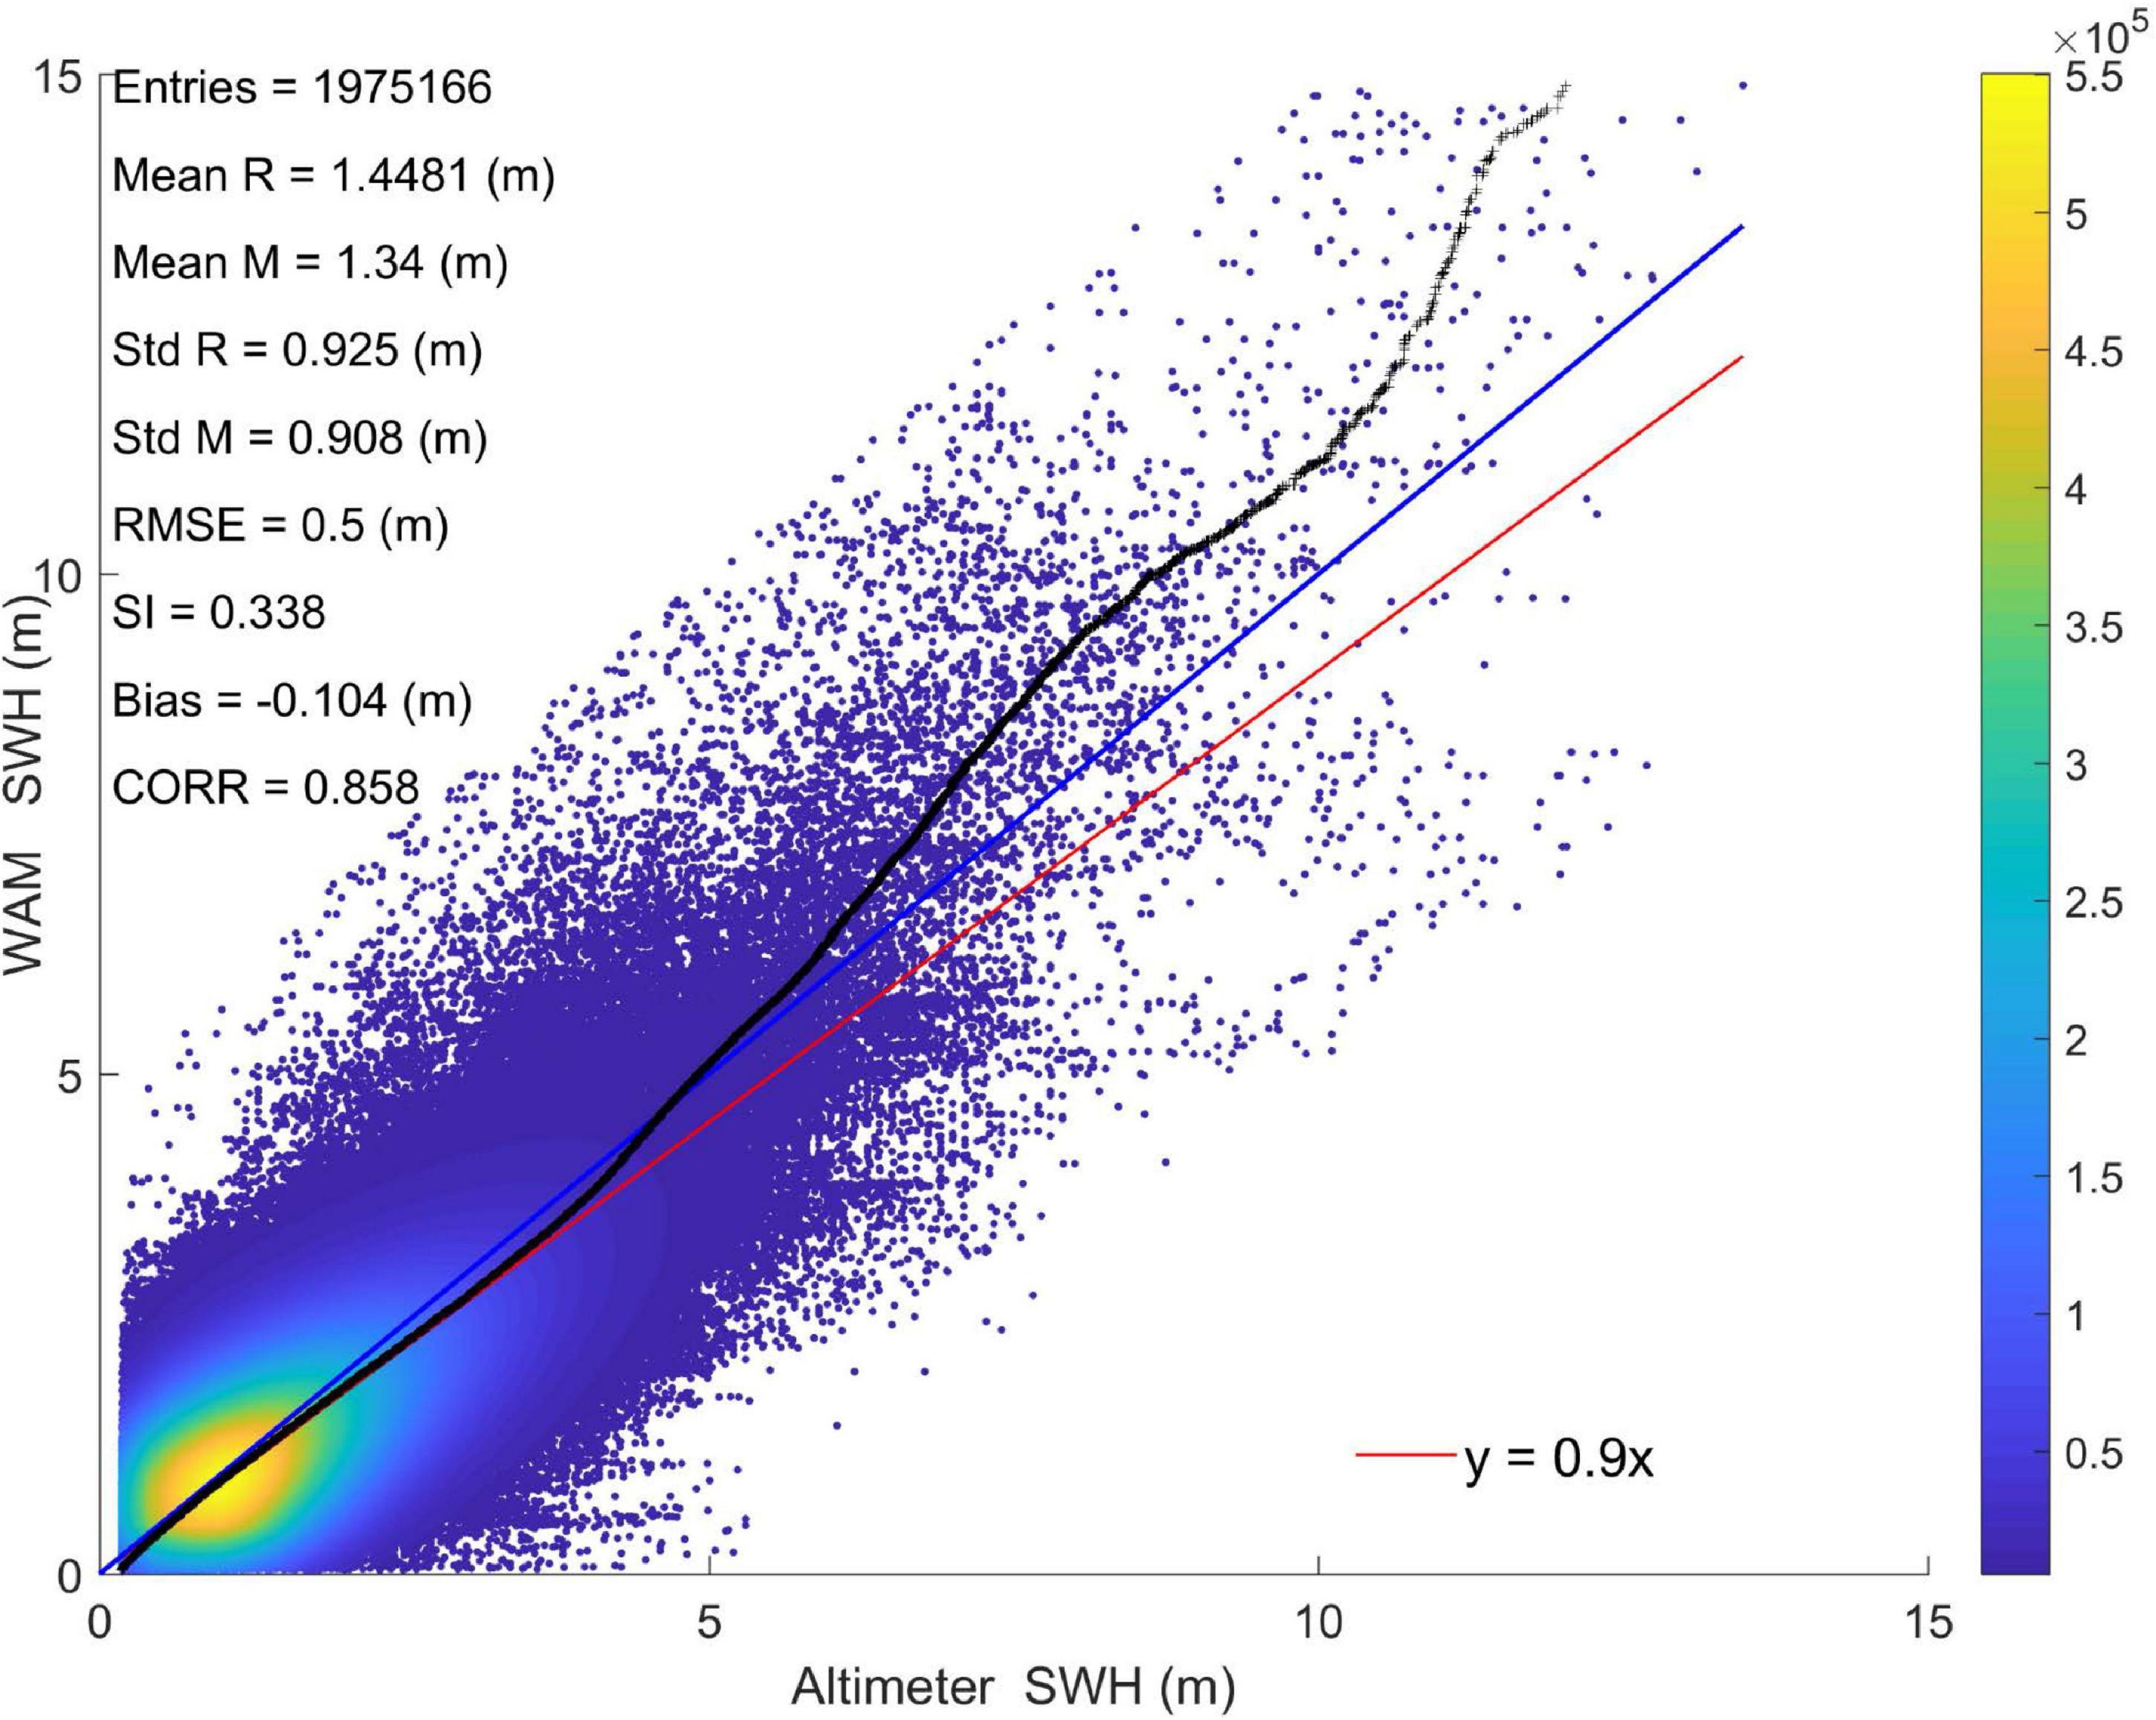
Figure 2. Comparison between the ERA5-driven wave hindcast (y-axis) and satellite data (x-axis) during 1991–2018 in the BYE area: scatter plots (dots), qq plots (black dashed dots), linear regression line (red line), equal value line (blue line) and several statistical measures [valid numbers of entries, mean values of satellite (Mean R) and model (Mean M), standard deviation of satellite (Std R) and model (Std M), root-mean-square error (RMSE), Scatter Index (SI), Mean Bias, and correlation coefficient (CORR)]. The color of scatter plots indicates the count of points within a determined square area centered at each data point.
In addition, we compared the wave hindcast with 5 buoy observations in terms of SWH, MWP, and MWD. The comparisons between observed and simulated SWH in Table 1 show that the biases are mostly within 0.12 m, the CORR values are higher than 0.8, the RMSE is mostly less than 0.4 m, and the normalized standard deviation is larger than 0.86, indicating that the performance of the WAM hindcast is consistent when using different observation datasets as references. Furthermore, the extreme SWH values (i.e., 90th and 99th percentile SWH, hereafter the SWH_90p and SWH_99p, respectively) are also well captured by the WAM hindcast.
Table 2 shows that the WAM hindcast generally overestimates the MWP by values less than 0.46 s and overestimates the temporal variability with nsd larger than 1. However, the CORR values are smaller than those for the SWH in Table 1. Regarding the MWD, the biases are within ± 30°, except for station S07, where the bias of the simulated MWD is 58.51°. The large bias of MWD at station S07 is possible because the wind forcing or the wave modeling is still too coarse to resolve the coastal wind inhomogeneity or complex bathymetric refraction. Nevertheless, the wave hindcast forced by ERA5 is generally realistic in capturing wave statistics, with both satellite and buoy observations as references.
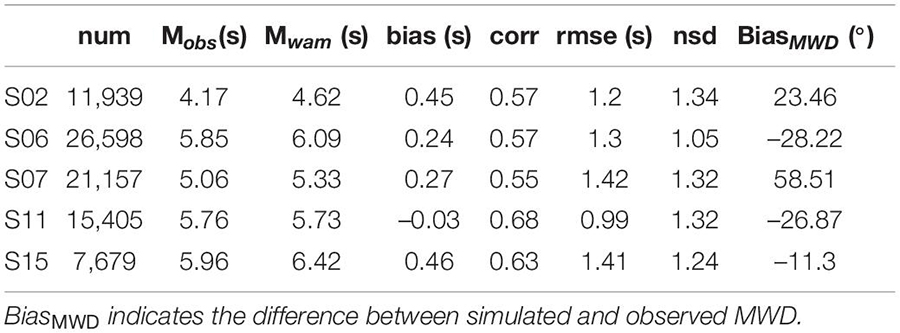
Table 2. The same as Table 1 but for the MWP.
To assess the skills of MBAn in correcting the biases of multiple variables from raw WAM historical simulation, we compared the climatological biases between the raw WAM simulation and bias-adjusted WAM simulation output for the SWH, SWH_99p, MWP, and MWD (Figure 3). The WAM hindcast driven by the ERA5 wind reanalysis dataset is used as a reference. Figure 3 shows that the raw WAM simulation generally overestimates the SWH, SWH_99p, and MWP. There are both positive and negative biases for the raw simulated MWD. As expected, the multivariate bias-adjustment method can greatly reduce the climatological biases of raw simulation, showing negligible biases relative to the WAM hindcast.
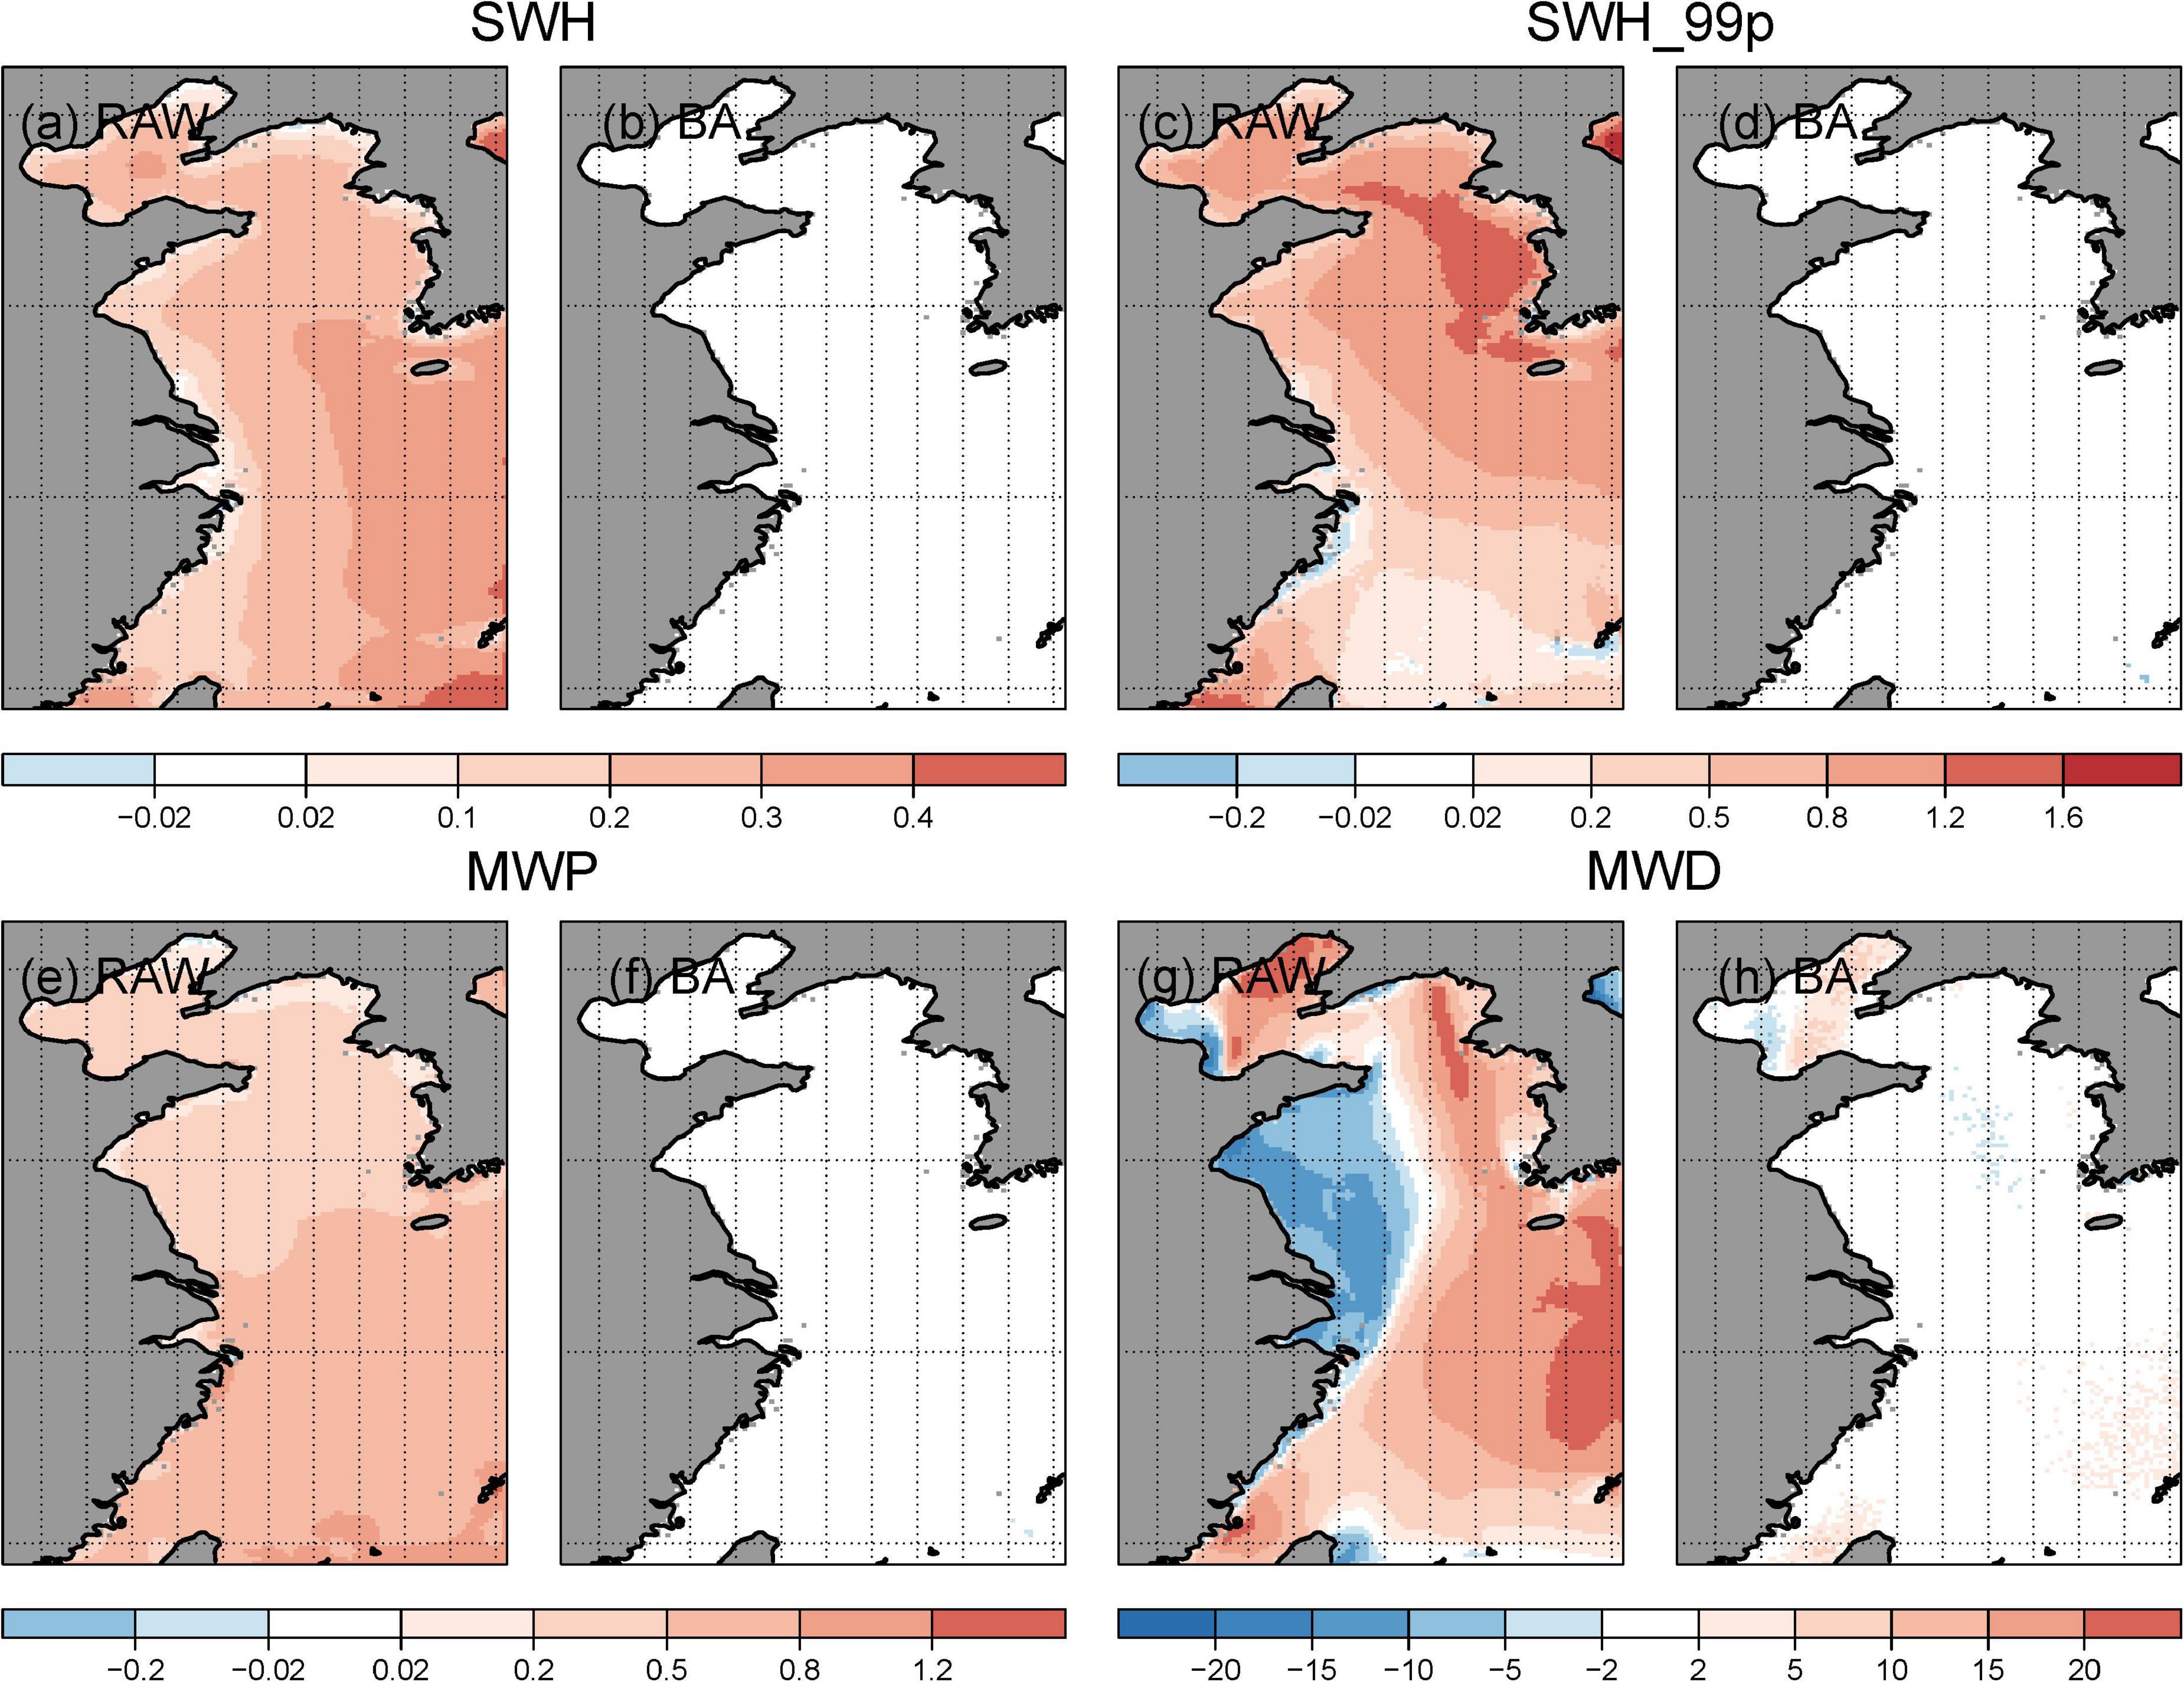
Figure 3. The differences between the raw WAM historical simulation and ERA5-driven wave hindcast for the climatological means of the (a) significant wave height (SWH, m) and the (c) annual 99th percentile of the SWH (SWH_99p, m), (e) mean wave period (MWP, s), and (g) mean wave direction (MWD, °); (b,d,f,h) the same as (a,c,e,g) but for bias-adjusted results.
The projected changes in the mean and extreme wave climate have been assessed based on bias-adjusted wave datasets under present-day climate (1979–2005) and future projections (2021–2050 and 2071–2100). In addition, a Mann-Whitney U-test (Kruskal and Wallis, 1952), a non-parametric test, was used to determine whether the differences in the mean wave conditions between future projections and present-day climate are statistically significant.
The results show an increase in the climatological annual and seasonal mean SWH from the northwest to southeast in the study domain (Figure 4). Large mean SWHs over 1.6 m are pronounced in the southeastern BYE in autumn and winter. The annual and seasonal mean SWH are generally projected to decrease (-0.15 to -0.01 m) during 2021–2050 and 2071–2100 under the RCP2.6 and RCP8.5 scenarios, with statistical significance at a 0.1 level for most BYE in spring and for most of the Bohai Sea and Yellow Sea in annual and winter/autumn mean. The exceptions are autumn season during 2021–2050 under both scenarios (Figures 4e2,e4), featuring significant increasing changes (0.05–0.15 m) in the East China Sea.
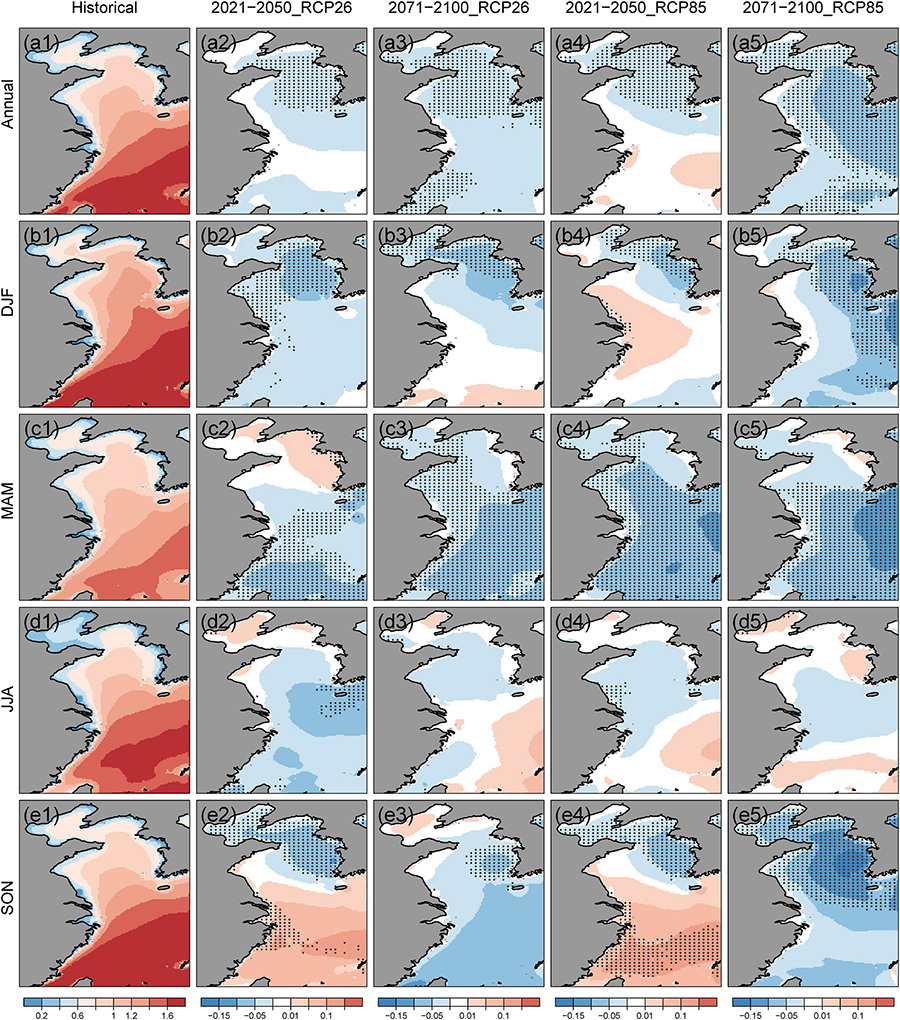
Figure 4. Annual and seasonal historical (1979–2005) climatological mean SWH (m) and the projected changes for RCP2.6 and RCP8.5 in different periods: 2021–2050 and 2071–2100. Stippling indicates areas where the projected changes are significant at a 0.1 level.
We also observe that the decreases in annual or seasonal mean (except for summer) SWH are more pronounced at the end of the twenty-first century under the RCP8.5 scenario compared with the other counterparts. Furthermore, the spatial patterns of projected changes in the annual mean and seasonal mean SWH resemble those of projected changes in the surface wind speed (Supplementary Figure 1), which indicates that the SWH changes in the BYE are highly related to the changes in the local surface wind speeds. The spatially mixed pattern of projected changes in SWH, especially in the Bohai Sea and Yellow Sea in spring (Figures 4c2,c5) and in summer (Figures 4d2–d5), is also possibly related to the rotation of wind directions (Supplementary Figure 1), the impact of which is rather strong in the marginal seas (Hemer et al., 2010; Kudryavtseva and Soomere, 2017).
Figure 5 shows that the climatological annual and seasonal MWPs also increase from the northwest to the southeast. MWP larger than 6 s is mainly in the southeastern BYE, featuring larger areas in summer and autumn. There are distinct features of projected changes in seasonal MWP. The results indicate a significant decrease in the MWP in spring over almost the entire study domain for both periods and both scenarios, especially for the East China Sea at the end of the twenty-first century under RCP8.5 (Figure 5c5). Projected increases are pronounced in large parts of the Yellow Sea and East China Sea in summer at the end of the twenty-first century under RCP2.6 and the middle and end of the twenty-first century under RCP8.5 (Figures 5d3–d5); however, the changes are not significant at 0.1 level.
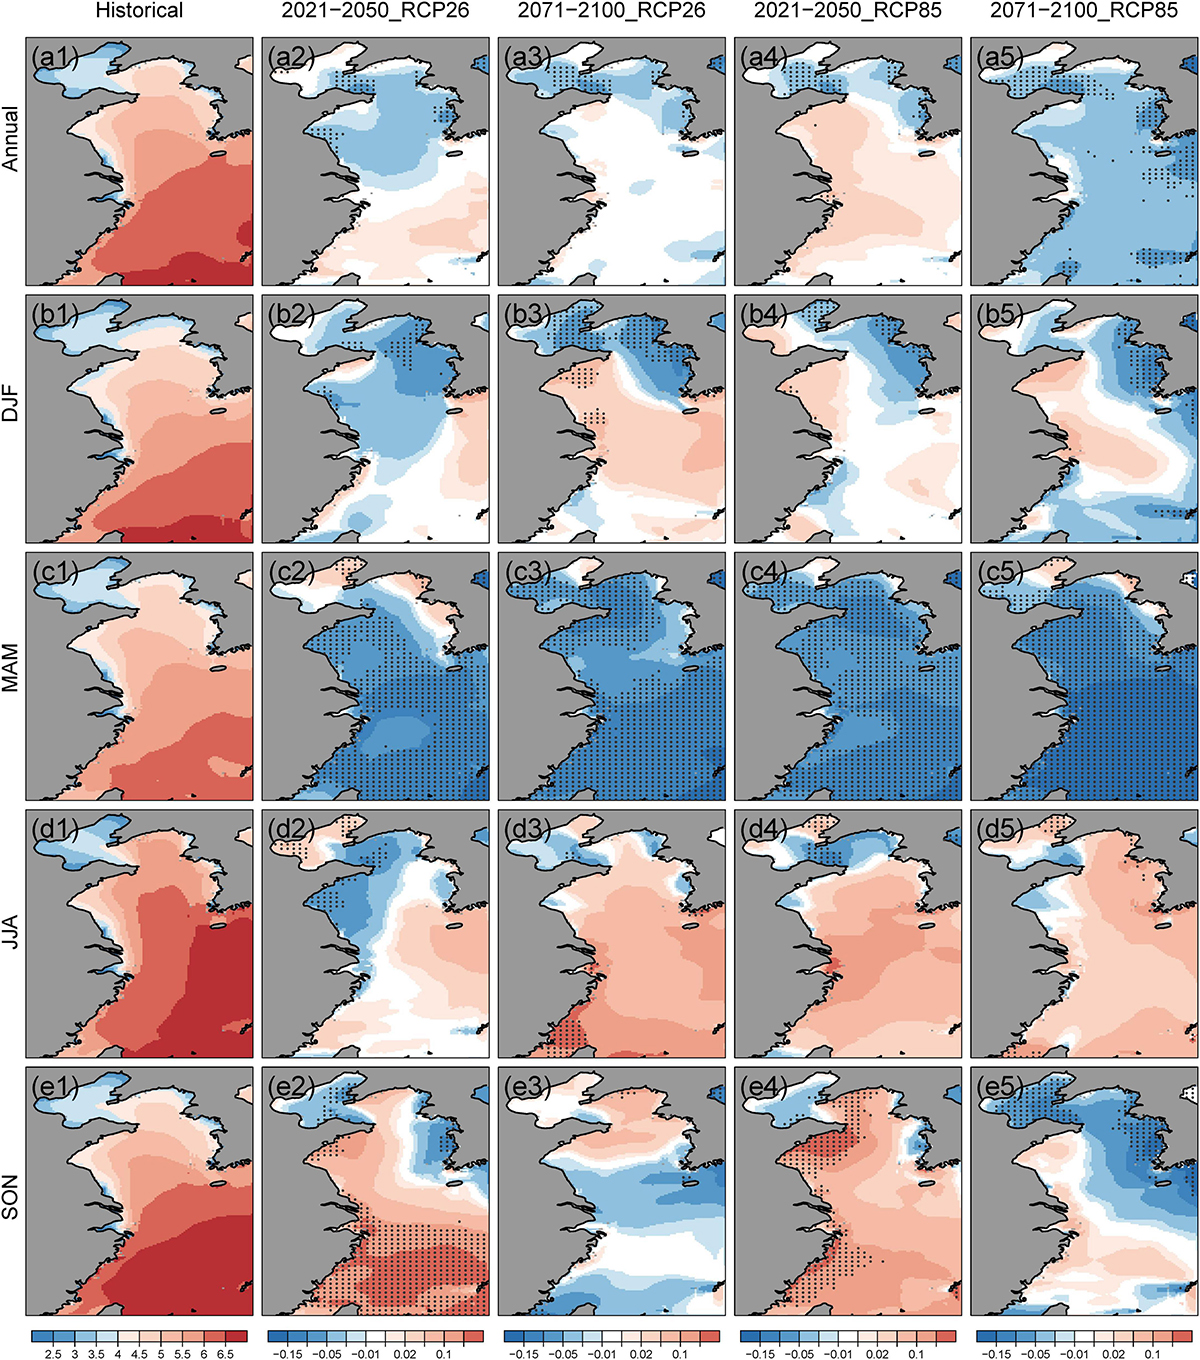
Figure 5. The same as in Figure 4 but for the annual or seasonal MWP (s). Stippling indicates areas where the projected changes are significant at a 0.1 level.
Figure 6 shows that there is generally low inter-annual variability, with RCoV in the range of 0.03–0.05, while there is stronger intra-annual variability, with RCoV mostly from 0.1 to 0.25. It is noticed that we find that the strong intra-annual variability and low inter-annual variability is a common feature for the global ocean especially in the North Pacific Ocean, North Atlantic Ocean, and some marginal seas, with the exception of the polar ocean areas (Supplementary Figure 2), where the inter-annual variability is much larger than intra-annual variability.
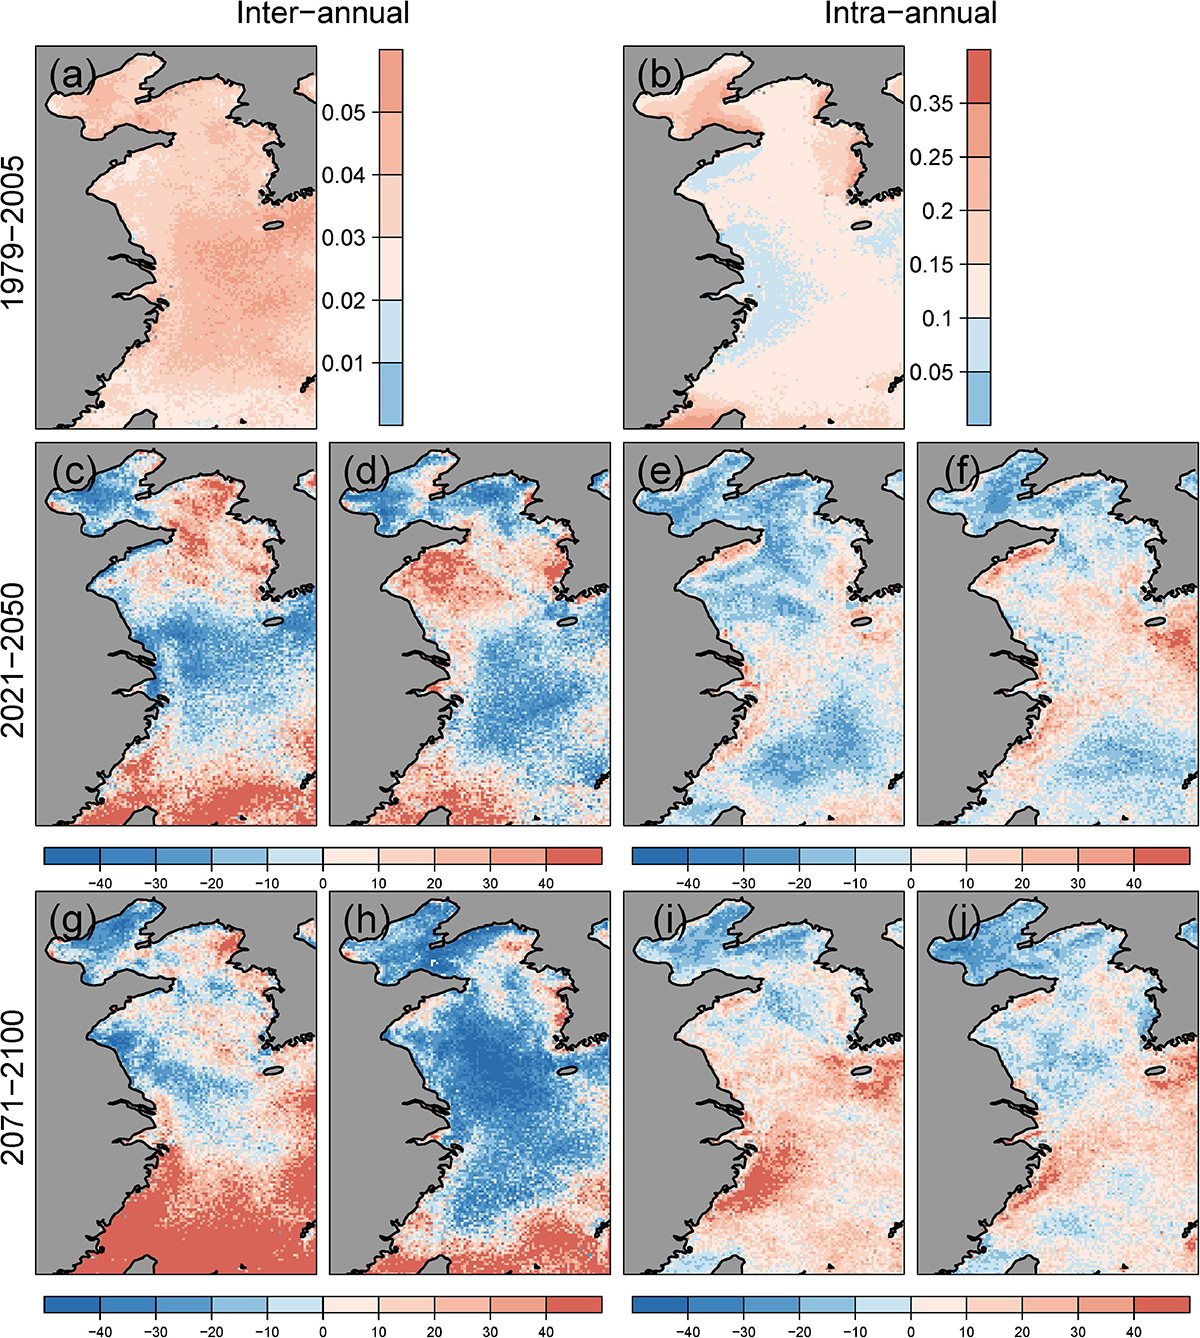
Figure 6. Robust coefficient of variation (RCoV) to quantify (a) inter-annual variability and (b) intra-annual variability of the SWH for 1979–2005. Projected changes (%) in inter-annual (left two panels) and intra-annual (right two panels) variability between the bias-adjusted future projections (middle: 2021–2050; lower: 2071–2100) and bias-adjusted historical runs. (c,e,g,i) Are for RCP2.6, and (d,f,h,j) are for RCP8.5.
The projected changes in both inter- and intra-annual variability are more pronounced at the end of the twenty-first century than those in the middle of the twenty-first century. In particular, there was a more than 40% increase in inter-annual variability in the southern East China Sea at the end of the twenty-first century under the RCP2.6 scenario (Figure 6g) and a more than 30% decrease in inter-annual variability in the southern Yellow Sea and northern ECS at the end of the twenty-first century under RCP8.5 scenario (Figure 6h). Furthermore, a large increase (more than 30%) in intra-annual variability along the southeastern coasts of China and around Jeju Island at the end of the twenty-first century for both scenarios is observed (Figures 6i,j).
The spatial patterns of projected changes in the inter-annual variability of SWH resemble those of projected changes in the surface wind speed to some extent, with spatial correlations in the range of 0.36–0.67 (Supplementary Figure 3), indicating that the inter-annual variability of SWH is partially determined by the changes in the local surface wind speeds. However, it is not the case for projected changes of intra-annual variability, which features a very low spatial relationship between SWH and surface wind speed (Supplementary Figure 3). Therefore, some other factors such as the migration of cyclone paths or the swell variability generated by a remote wind possibly govern the projected changes in inter-annual and intra-annual variability, which deserves further in-depth study.
The annual or seasonal SWH_99p shows an increase from the northwest to southeast in the study domain (Figure 7). SWH_99p over 5 m is mainly observed in the East China Sea for summer and autumn (Figures 7d1,e1), which are supposed to be caused by tropical cyclones. The annual and seasonal SWH_99p features stronger projected changes than those in the climatological mean SWH. The annual SWH_99p are projected to increase in the East China Sea in the middle of the twenty-first century under the RCP8.5 scenario (Figure 7a4), which are mainly caused by the projected increase in summer and autumn, with a more than 0.5 m intensification in the East China Sea (Figures 7d4,e4). For the summer season in 2071–2100 under both scenarios, SWH_99p shows a projected increase larger than 0.2 m, however, they mostly fail to pass the significance test at 0.1 level. The projected decreases larger than 0.2 m are mainly in the Yellow Sea in autumn for both periods and both scenarios (Figures 7e2–e5). The BYE shows a significant projected decrease in the SWH_99p in spring at the end of the twenty-first century under the RCP8.5 scenario (Figure 7c5) in the range of -0.5 to -0.05 m. For winter, we find a projected increase in the SWH_99p of 0.2–0.5 m in the East China Sea for the middle of the twenty-first century under the RCP2.6 scenario (Figures 7b2–b5). Generally, the projected changes in the SWH_99p feature strong seasonal variability.
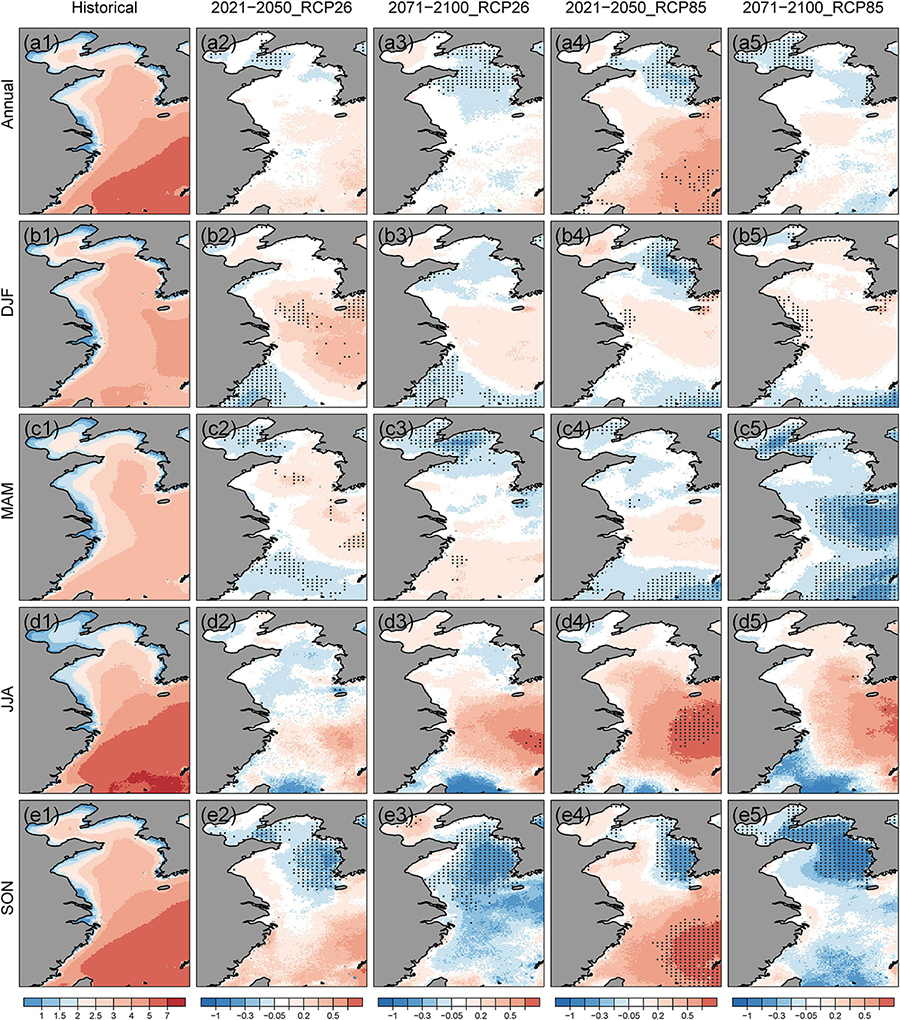
Figure 7. The same as in Figure 4 but for the annual or seasonal SWH_99p (m). Stippling indicates areas where the projected changes are significant at a 0.1 level.
The predominance of wave types can be determined by the wave age parameter. The sea state is dominated by wind sea if the wave age A=Cp/U10=gTp/2πU10 < 1.2 and dominated by swell if A > 1.2 (e.g., Smith et al., 1992), where Cp is the wave peak phase speed, U10 is the 10-m wind speed, and Tp is the wave peak period. Supplementary Figure 4 shows the historical simulated and future projected occurrence frequency of swells. The annual and seasonal distribution patterns of occurrence frequencies of swell-dominant waves are similar between the historical simulation and future projections, featuring swell prevalence increases from the Bohai Sea to the East China Sea. Annually, the percentage increases from 30% in the Bohai Sea to more than 80% in the southeastern East China Sea. Swell-dominant waves occur the most frequently in summer and the least frequently in winter, with frequencies larger than 70% for nearly all the Yellow Sea and East China Sea for the former and less than 50% for the Bohai Sea and Yellow Sea for the latter. Except for summer, the Bohai Sea features wind-sea dominant wave fields for the other three seasons.
Figure 8 shows that the 99th percentile (99p) wind-sea-dominated sea-state are larger than 3 m for most of the study domain and can be more than 5 m in the southeastern part of the East China Sea in the present-day climate (Figures 8d1,e1), which is supposed to be caused by the impacts of tropical cyclones. Projected increases in winter and summer for 99p wind-sea-dominated sea-state are found for large parts of the study domain for both future periods under the RCP2.6 and RCP8.5 scenarios. In particular, 99p wind-sea-dominated sea-state is projected to increase significantly by more than 0.5 m in summer (Figures 8d3–d5) and to decrease by more than 0.5 m in autumn in the Yellow Sea or parts of the East China Sea (Figures 8e2–e5).
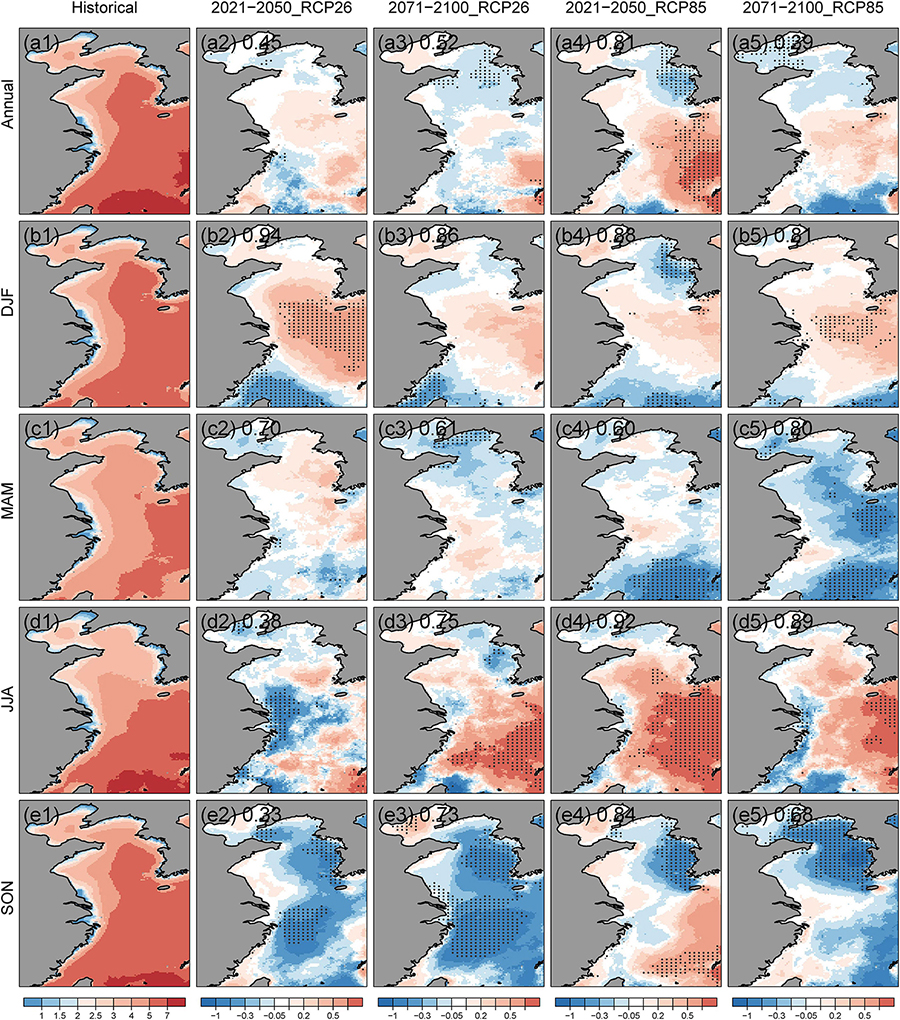
Figure 8. The same as in Figure 4 but for the annual or seasonal 99th percentile wind-sea dominant wave fields (m). The numbers labeled represent spatial corrections between the 99th percentile wind-sea-dominated sea-state and those of the 99th percentile total waves in Figure 7. Stippling indicates areas where the projected changes are significant at a 0.1 level.
In contrast, we can see that the annual or seasonal 99p swell-dominated sea-state are much smaller than those of extreme wind-sea-dominated sea-state, with the former being larger than 1.5 m for most of the study domain (Figure 9). The projected changes in the 99p swell-dominated sea-state are also not as pronounced as those in the 99p wind-sea-dominated sea-state (Figure 8). Furthermore, we find projected increases of more than 0.3 m for 99p swell-dominated sea-state in the southern Yellow Sea or the East China Sea in summer and autumn during 2021–2050 under the RCP8.5 scenario, contributing to the total increases (Figure 7). On the other hand, slight decreases in 99p swell-dominated sea-state by 0.05–0.2 m are distributed mainly in the BYE domain for spring except for the one during 2021–2050 under the RCP2.6 scenario (Figure 9c2).
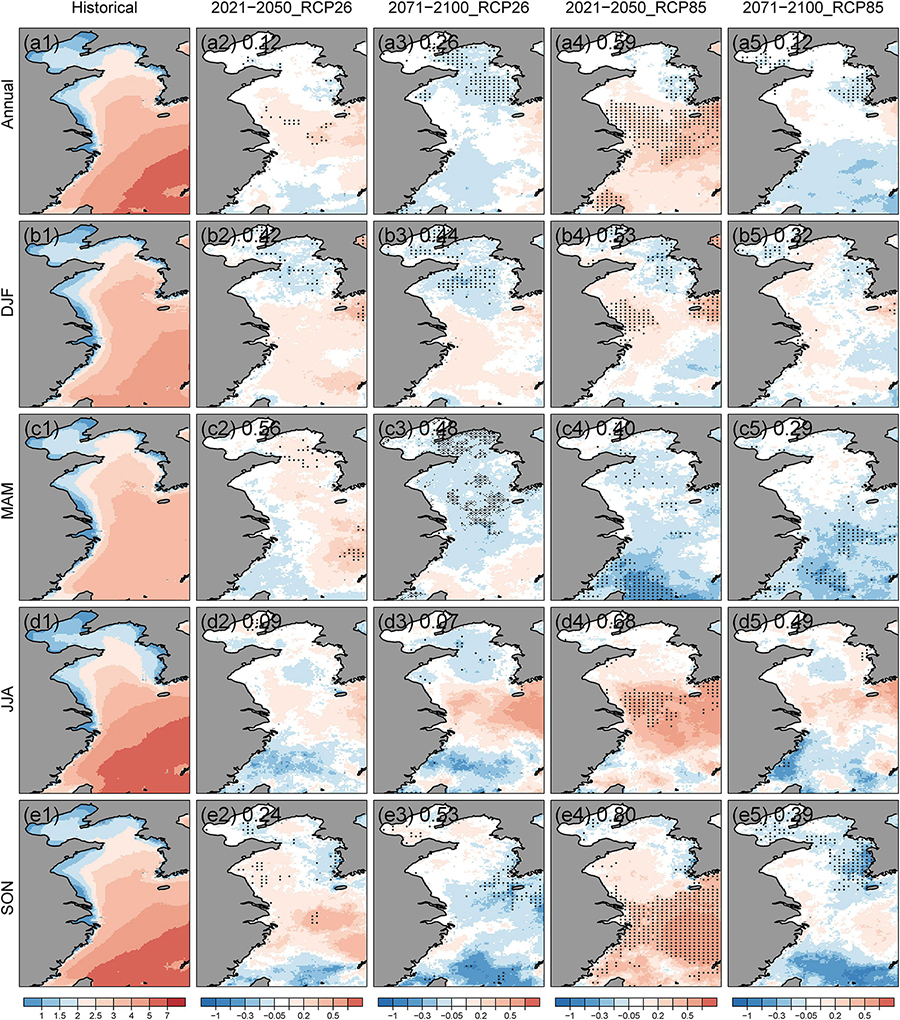
Figure 9. The same as in Figure 4 but for the annual or seasonal 99th percentile swell dominant wave fields (m). The numbers labeled represent spatial corrections between the 99th percentile wind-sea-dominated sea-state and those of the 99th percentile total waves in Figure 7. Stippling indicates areas where the projected changes are significant at a 0.1 level.
Notably, we find that the projected changes in the near future (2021–2050) are generally more pronounced than changes in the far future (2071–2100) under RCP8.5 scenario for annual, summer and autumn SWH_99p (Figure 7), for annual and summer 99p wind-sea-dominated sea-state (Figure 8), and for annual, summer and autumn 99p swell-dominated sea-state (Figure 9). The results are possibly due to the impact of natural variability instead of anthropogenic climate change.
In addition, we calculated the spatial corrections between the 99th percentile wind-sea (swell)-dominated sea-state and those of the 99th percentile total waves, to reveal their spatial consistency. The spatial corrections added in Figures 8, 9 show that there are generally higher correlations between projected changes of 99p total sea-state (Figure 7) and projected changes of 99p wind-sea-dominated sea-state (Figure 8). This implies that the local wind-generated sea state mainly causes the projected changes in 99p extreme waves. This conclusion is further confirmed by the fact that the projected change patterns of the SWH_99p in Figure 7 greatly resemble those of the 99th percentile surface wind speeds in the BYE (Supplementary Figure 5).
For the first time, we investigate the future changes in the mean and extreme wave climate in the Bohai Sea, Yellow Sea, and East China Sea. Previous studies have revealed that high-resolution dynamical downscaling can add value to coarse-resolution reanalysis or GCMs in capturing the intensity of strong winds in coastal areas, as well as tropical cyclones (Li et al., 2016; Li, 2017); therefore, we used regional downscaled winds (resolution 0.22°) to force high-resolution WAM wave model simulations in the study domain for the present-day climate (1979–2005) and future climate (2021–2050, 2071–2100) under the RCP2.6 and RCP8.5 scenarios. The WAM simulations feature a resolution of 0.1°, which is the highest-resolution wave climate projection dataset available for the study domain. We applied a multivariate bias-adjustment method based on the N-dimensional probability density function transform (MBAn) to correct biases in the raw simulated SWH, MWP, and MWD. The projected changes in the mean and extreme wave climate in the middle (2021–2050) and end of the (2071–2100) twenty-first century were evaluated, with the present-day wave climate during 1979–2005 serving as a reference. The main conclusions are summarized as follows:
(1) The WAM hindcast with 0.1-degree resolution driven by ERA5 winds shows robust skills in capturing wave statistics compared with the buoy and satellite observations. The MBAn method proves to be skillful in reducing substantial biases of the historical WAM simulation in the climatological mean SWH, MWP, MWD, and 99p extreme wave heights.
(2) The annual and seasonal mean SWH are generally projected to decrease (-0.15 to -0.01 m) for the 2021–2050 and 2071–2100 periods under the RCP2.6 and RCP8.5 scenarios, with statistical significance at a 0.1 level for most BYE in spring and for most of the Bohai Sea and Yellow Sea in annual and winter/autumn mean. A significant decrease in MWP in spring for both periods under both scenarios is found. The projected changes in inter-annual and intra-annual variabilities are more pronounced at the end of the twenty-first century than those in the mid- twenty-first century.
(3) The annual, and winter/summer 99th percentile SWHs are projected to increase for large parts of the study domain, and the autumn 99th percentile SWH are projected to decrease for the Yellow Sea, with the former mostly failing to pass the significance test. Results imply that the projected changes in the mean and 99th percentile extreme waves are very likely related to the projected changes in local mean and extreme surface wind speeds.
The significant contribution of this study is that we, for the first time, revealed the projected changes of mean and extreme waves, with a focus on the Chinese marginal seas. This is also the first study to apply the multivariate bias-adjustment method on the simulated wave variables. The high-resolution wave projection data produced in this study can provide support for a comprehensive assessment of marine energy resource under climate change (e.g., Lira-Loarca et al., 2021). They can also be used for estimating wave induced loads for appropriate design, construction, and operations of offshore and coastal structures (e.g., Kumar et al., 2018). Furthermore, extreme waves can cause extensive modification of the shoreline environment and landforms, and threaten human life (Hansom et al., 2015). Hence, integrating multivariate extreme wave conditions into comprehensive assessments of coastal hazards and vulnerability is paramount to effective coastal climate adaptation planning (Morim et al., 2020).
Based on reconstructed SWH over the Chinese marginal seas by using a multivariate regression model and the twentieth-century reanalysis ensemble of the mean sea level pressure, Wu et al. (2014) revealed that the annual and seasonal SWH trends during 1911–2010 are dominantly negative over the Chinese marginal seas, and the summer maximum SWHs seem to have increased in the East China Sea. Our study implies that these trends are likely to continue in the future.
Being consistent with Fan et al. (2014), both the historical and future projected wave fields are dominated by the swell wave. However, the high spatial correlation of projected changes in mean or extremes between wind and wave fields in our study indicated that the projected changes in the mean and extreme waves are mainly related to the projected changes in local surface wind speeds in the Bohai Sea, Yellow Sea and East China Sea, annually and seasonally. The conclusion is partially consistent with Fan et al. (2014), who showed a more pronounced increase in the wind-sea energy than swell energy in July to December at the end of the twenty-first century in our study domain. While for the other global oceans, whether the changes in total waves being determined by swell or by wind-sea are regionally dependent (Fan et al., 2014).
The projected changes of mean, especially the extremes wave heights, for large parts of our study domain, do not pass the significance test at 0.1 level, implying that these changes may be related to sampling uncertainty. Nevertheless, we find strong consensus between our study and many other global-scale studies regarding the projected decrease and its intensity for the annual mean and winter mean SWH in the study domain. The projected decrease of annual mean or winter significant mean wave heights are generally less than -0.1 m or -10% in the middle and end of the twenty-first century under different scenarios including A1B (Mori et al., 2010; Semedo et al., 2013; Shimura et al., 2016), A2 (Hemer et al., 2013c), RCP4.5 and RCP8.5 (Wang et al., 2014; Shimura et al., 2016; Lemos et al., 2019; Morim et al., 2019), based on either single-GCM forcing (e.g., Mori et al., 2010) or ensemble-GCM forcing wave simulations (e.g., Shimura et al., 2016), The consensus proves the robustness of projected decrease of annual mean or winter significant mean.
However, the projected changes in summer mean SWH as well as extreme wave heights, lack consensus among studies in this area. Semedo et al. (2013) showed decreasing changes in summer mean SWH under A1B emission scenario, while Wang et al. (2014) revealed increases for projected summer mean SWH and summer maximum wave heights at the end of the twenty-first century under RCP8.5 scenario, and Morim et al. (2019) showed an increase in summer mean SWH and a decrease in annual 99th percentile wave heights under RCP4.5 and RCP8.5 scenario. Similarly, their projected changes in summer mean or extreme wave heights in the study domain generally do not pass the significance test. The dissimilarity of projected changes in summer mean SWH and extreme wave heights is supposed to stem from different sources including internal variability, GCMs or RCMs wind forcing, wind-wave modeling method, and scenario uncertainty (Deser et al., 2012; Morim et al., 2019).
The note is that this study only adopts a single wind forcing for each future period and scenario and does not consider the complete uncertainty sources. This is because of the limited availability of high-resolution wind forcings during the conduction of the wave simulations. With the release of more high-resolution RCM datasets through the Coordinated Regional Climate Downscaling Experiment (Sørland et al., 2021), ensemble of high-resolution wave projections are in demand for the Chinese marginal seas. Furthermore, it is also interesting to investigate the capacity of these high-resolution RCMs in simulating tropical cyclones and in driving cyclone-related extreme waves. The projected changes of cyclones and cyclone-related extreme waves and their uncertainties, are worthy of further efforts.
The data that support the findings of this study are available from the corresponding author upon reasonable request.
DL and BY contributed to the conception and designed of the study. DL, JS, AB, DHL, and S-KM contributed to the methodology and modeling. DL performed the dataset analyses, and visualization, with contributions from JF, YZ, and JQ. DL prepared the manuscript draft. All authors contributed to manuscript revision, read, and approved the submitted version.
The study was supported through the National Natural Science Foundation of China (42176203), the National Key Research and Development Program of China (2017YFA0604100), the Strategic Priority Research Program of the Chinese Academy of Sciences (XDB42000000), the NSFC-Shandong Joint Fund (U1806227), and the National Natural Science Foundation of China (42076022 and 41706019). Seung-Ki Min was supported by the Korea Meteorological Administration Research and Developement Program under Grant KMI2020-01413.
The authors declare that the research was conducted in the absence of any commercial or financial relationships that could be construed as a potential conflict of interest.
All claims expressed in this article are solely those of the authors and do not necessarily represent those of their affiliated organizations, or those of the publisher, the editors and the reviewers. Any product that may be evaluated in this article, or claim that may be made by its manufacturer, is not guaranteed or endorsed by the publisher.
We acknowledge the Oceanographic Data Center of the Institute of Oceanology Chinese Academy of Sciences and the German Climate Computing Center (DKRZ) for providing the computer hardware for the simulations and subsequent analyses. We thank the buoy observations provided by the Yellow Sea ocean/East China Sea observation and a research station of OMORN. The wind forcings for wave simulations have been generated using the COSMO model in CLimate Mode (CCLM). CCLM is the community model of the German regional climate research jointly further developed by the CLM-Community. We acknowledge the members of the community for their common efforts to envelop the model and to find right setups. The reanalysis dataset ERA5 is available at https://cds.climate.copernicus.eu/#!/search?text=ERA5&type=dataset. The Sea State CCI data is accessed at https://data.ceda.ac.uk/neodc/esacci/sea_state/data/v1.1_release/l3/v1.1/.
The Supplementary Material for this article can be found online at: https://www.frontiersin.org/articles/10.3389/fmars.2022.844113/full#supplementary-material
Bonaduce, A., Staneva, J., Behrens, A., Bidlot, J. R., and Wilcke, R. A. I. (2019). Wave climate change in the North Sea and Baltic Sea. J. Mar. Sci. Eng. 7:166. doi: 10.3390/jmse7060166
Bricheno, L. M., and Wolf, J. (2018). Future wave conditions of Europe, in response to high-end climate change scenarios. J. Geophys. Res.Oceans 123, 8762–8791. doi: 10.1029/2018jc013866
Camus, P., Losada, I. J., Izaguirre, C., Espejo, A., Menendez, M., and Perez, J. (2017). Statistical wave climate projections for coastal impact assessments. Earths Future 5, 918–933.
Cannon, A. J. (2018). Multivariate quantile mapping bias correction: an N-dimensional probability density function transform for climate model simulations of multiple variables. Clim. Dyn. 50, 31–49. doi: 10.1007/s00382-017-3580-6
Casas-Prat, M., Wang, X. L., and Swart, N. (2018). CMIP5-based global wave climate projections including the entire Arctic Ocean. Ocean Model. 123, 66–85.
Casas-Prat, M., and Wang, X. L. L. (2020). Projections of extreme Ocean waves in the Arctic and potential implications for coastal inundation and erosion. J. Geophys. Res.Oceans 125:e2019JC015745.
Charles, E., Idier, D., Delecluse, P., Déqué, M., and Le Cozannet, G. (2012). Climate change impact on waves in the Bay of Biscay. France. Ocean Dyn. 62, 831–848.
Chowdhury, P., and Behera, M. R. (2019). Evaluation of CMIP5 and CORDEX derived wave climate in Indian Ocean. Clim. Dyn. 52, 4463–4482. doi: 10.1007/s00382-018-4391-0
Deser, C., Phillips, A., Bourdette, V., and Teng, H. (2012). Uncertainty in climate change projections: the role of internal variability. Clim. Dyn. 38, 527–546. doi: 10.1007/s00382-010-0977-x
Di Luca, A., de Elía, R., and Laprise, R. (2012). Potential for added value in precipitation simulated by high-resolution nested regional climate models and observations. Clim. Dyn. 38, 1229–1247. doi: 10.1007/s00382-011-1068-3
Dodet, G., Piolle, J. F., Quilfen, Y., Abdalla, S., Accensi, M., Ardhuin, F., et al. (2020). The Sea State CCI dataset v1: towards a sea state climate data record based on satellite observations. Earth Syst. Sci. Data 12, 1929–1951.
Fan, Y., Lin, S., Griffies, S. M., and Hemer, M. A. (2014). Simulated global swell and Wind-Sea climate and their responses to Anthropogenic climate change at the end of the twenty-first century. J. Clim. 27, 3516–3536. doi: 10.1175/jcli-d-13-00198.1
Giorgetta, M. A., Jungclaus, J., Reick, C. H., Legutke, S., Bader, J., Böttinger, M., et al. (2013). Climate and carbon cycle changes from 1850 to 2100 in MPI-ESM simulations for the coupled model intercomparison project phase 5. J. Adv. Model. Earth Syst. 5, 572–597.
Gunturu, U. B., and Schlosser, C. A. (2012). Characterization of wind power resource in the United States. Atmos. Chem. Phys. 12, 9687–9702. doi: 10.5194/acp-12-9687-2012
Hansom, J. D., Switzer, A. D., and Pile, J. (2015). “Chap. 11–Extreme waves: causes, characteristics, and impact on coastal environments and society,” in Coastal and Marine Hazards, Risks, and Disasters, eds J. F. Shroder, J. T. Ellis, and D. J. Sherman (Boston, MA: Elsevier), 307–334.
He, C., Zhou, T., Lin, A., Wu, B., Gu, D., Li, C., et al. (2015). Enhanced or weakened Western North Pacific Subtropical High under Global Warming? Sci. Rep. 5:16771. doi: 10.1038/srep16771
Hemer, M. A., Church, J. A., and Hunter, J. R. (2010). Variability and trends in the directional wave climate of the Southern Hemisphere. Int. J. Climatol. 30, 475–491. doi: 10.1002/joc.1900
Hemer, M. A., Fan, Y., Mori, N., Semedo, A., and Wang, X. L. (2013a). Projected changes in wave climate from a multi-model ensemble. Nat. Clim. Chang. 3, 471–476. doi: 10.1038/nclimate1791
Hemer, M. A., McInnes, K. L., and Ranasinghe, R. (2013b). Projections of climate change-driven variations in the offshore wave climate off south eastern Australia. Int. J. Climatol. 33, 1615–1632. doi: 10.1002/joc.3537
Hemer, M. A., Katzfey, J., and Trenham, C. E. (2013c). Global dynamical projections of surface ocean wave climate for a future high greenhouse gas emission scenario. Ocean Model. 70, 221–245. doi: 10.1016/j.ocemod.2012.09.008
Hemer, M. A., Wang, X. L., Weisse, R., and Swail, V. R. (2012). Advancing wind-waves climate science: the COWCLIP project. Bull. Am. Meteorol. Soc. 93, 791–796. doi: 10.1175/bams-d-11-00184.1
Hersbach, H., Bell, B., Berrisford, P., Hirahara, S., Horányi, A., Muñoz-Sabater, J., et al. (2020). The ERA5 global reanalysis. Q. J. R. Meteorol. Soc. 146, 1999–2049.
Hoeke, R. K., McInnes, K. L., Kruger, J. C., McNaught, R. J., Hunter, J. R., and Smithers, S. G. (2013). Widespread inundation of Pacific islands triggered by distant-source wind-waves. Glob. Planet. Change 108, 128–138. doi: 10.1016/j.gloplacha.2013.06.006
Kim, J.-U., Kim, T.-J., Kim, D.-H., Kim, J.-W., Cha, D.-H., Min, S.-K., et al. (2020). Evaluation of performance and uncertainty for multi-RCM over CORDEX-East Asia phase 2 region. Atmosphere 30, 361–376.
Kruskal, W. H., and Wallis, W. A. (1952). Use of ranks in one-criterion variance analysis. J. Am. Stat. Assoc. 47, 583–621. doi: 10.1080/01621459.1952.10483441
Kudryavtseva, N., and Soomere, T. (2017). Satellite altimetry reveals spatial patterns of variations in the Baltic Sea wave climate. Earth Syst. Dyn. 8, 697–706. doi: 10.5194/esd-8-697-2017
Kumar, N. K., Savitha, R., and Al Mamun, A. (2018). Ocean wave characteristics prediction and its load estimation on marine structures: a transfer learning approach. Mar. Struct. 61, 202–219. doi: 10.1016/j.marstruc.2018.05.007
Laugel, A., Menendez, M., Benoit, M., Mattarolo, G., and Mendez, F. (2014). Wave climate projections along the French coastline: dynamical versus statistical downscaling methods. Ocean Model. 84, 35–50. doi: 10.1016/j.ocemod.2014.09.002
Lee, D., Park, C., Kim, Y.-H., and Min, S.-K. (2016). Evaluation of the COSMO-CLM for East Asia climate simulations: sensitivity to spectral nudging. J. Clim. Res. 11, 69–85. doi: 10.14383/cri.2016.11.1.69
Lemos, G., Menendez, M., Semedo, A., Camus, P., Hemer, M., Dobrynin, M., et al. (2020a). On the need of bias correction methods for wave climate projections. Glob. Planet. Change 186:103109. doi: 10.1016/j.gloplacha.2019.103109
Lemos, G., Semedo, A., Dobrynin, M., Menendez, M., and Miranda, P. M. A. (2020b). Bias-corrected CMIP5-derived single-forcing future wind-wave climate projections toward the end of the Twenty-First Century. J. Appl. Meteorol. Climatol. 59, 1393–1414. doi: 10.1175/jamc-d-19-0297.1
Lemos, G., Semedo, A., Dobrynin, M., Behrens, A., Staneva, J., Bidlot, J. R., et al. (2019). Mid-twenty-first century global wave climate projections: results from a dynamic CMIP5 based ensemble. Glob. Planet. Change 172, 69–87. doi: 10.1016/j.gloplacha.2018.09.011
Li, D. (2017). Added value of high-resolution regional climate model: selected cases over the Bohai Sea and the Yellow Sea areas. Int. J. Climatol. 37, 169–179.
Li, D., Staneva, J., Bidlot, J.-R., Grayek, S., Zhu, Y., and Yin, B. (2021). Improving regional model skills during Typhoon events: a case study for super Typhoon lingling over the Northwest Pacific Ocean. Front. Mar. Sci. 8:613913. doi: 10.3389/fmars.2021.613913
Li, D., Staneva, J., Grayek, S., Behrens, A., Feng, J., and Yin, B. (2020). Skill Assessment of an Atmosphere–Wave Regional Coupled Model over the East China Sea with a focus on Typhoons. Atmosphere 11:252. doi: 10.3390/atmos11030252
Li, D., von Storch, H., and Geyer, B. (2016). High-resolution wind hindcast over the Bohai Sea and the Yellow Sea in East Asia: evaluation and wind climatology analysis. J. Geophy Res. Atmos. 121, 111–129. doi: 10.1002/2015jd024177
Lira-Loarca, A., Ferrari, F., Mazzino, A., and Besio, G. (2021). Future wind and wave energy resources and exploitability in the Mediterranean Sea by. Appl. Energy 302:117492. doi: 10.1016/j.apenergy.2021.117492
Lobeto, H., Menendez, M., and Losada, I. J. (2021). Future behavior of wind wave extremes due to climate change. Sci. Rep. 11:7869. doi: 10.1038/s41598-021-86524-4
Mei, W., and Xie, S.-P. (2016). Intensification of landfalling typhoons over the northwest Pacific since the late. Nat. Geosci. 9, 753–757.
Melet, A., Almar, R., Hemer, M., Le Cozannet, G., Meyssignac, B., and Ruggiero, P. (2020). Contribution of wave setup to projected Coastal Sea level changes. J. Geophys. Res.Oceans 125:e2020JC016078. doi: 10.1371/journal.pone.0133409
Meucci, A., Young, I. R., Hemer, M., Kirezci, E., and Ranasinghe, R. (2020). Projected 21st century changes in extreme wind-wave events. Sci. Adv. 6:eaaz7295. doi: 10.1126/sciadv.aaz7295
Mori, N., Yasuda, T., Mase, H., Tom, T., and Oku, Y. (2010). Projection of extreme wave climate change under Global Warming. Hyd. Res. Lett. 4, 15–19. doi: 10.3178/hrl.4.15
Morim, J., Hemer, M., Cartwright, N., Strauss, D., and Andutta, F. (2018). On the concordance of 21st century wind-wave climate projections. Glob. Planet. Change 167, 160–171.
Morim, J., Hemer, M., Wang, X. L. L., Cartwright, N., Trenham, C., Semedos, A., et al. (2019). Robustness and uncertainties in global multivariate wind-wave climate projections. Nat. Clim. Change 9, 711–718. doi: 10.1038/s41558-019-0542-5
Morim, J., Trenham, C., Hemer, M., Wang, X. L. L., Mori, N., Casas-Prat, M., et al. (2020). A global ensemble of ocean wave climate projections from CMIP5-driven models. Sci. Data 7:105. doi: 10.1038/s41597-020-0446-2
O’Grady, J. G., Hemer, M. A., McInnes, K. L., Trenham, C. E., and Stephenson, A. G. (2021). Projected incremental changes to extreme wind-driven wave heights for the twenty-first century. Sci. Rep. 11:8826. doi: 10.1038/s41598-021-87358-w
Parker, K., and Hill, D. F. (2017). Evaluation of bias correction methods for wave modeling output. Ocean Model. 110, 52–65.
Reguero, B. G., Losada, I. J., and Mendez, F. J. (2019). A recent increase in global wave power as a consequence of oceanic warming. Nat. Commun. 10:205. doi: 10.1038/s41467-018-08066-0
Semedo, A., Weisse, R., Behrens, A., Sterl, A., Bengtsson, L., and Gunther, H. (2013). Projection of Global Wave Climate Change toward the End of the Twenty-First Century. J. Clim. 26, 8269–8288.
Shi, J., Zheng, J., Zhang, C., Joly, A., Zhang, W., Xu, P., et al. (2019). A 39-year high resolution wave hindcast for the Chinese coast: model validation and wave climate analysis. Ocean Eng. 183, 224–235.
Shimura, T., Mori, N., and Hemer, M. A. (2016). Variability and future decreases in winter wave heights in the Western North Pacific. Geophys. Res. Lett. 43, 2716–2722.
Smith, S. D., Anderson, R. J., Oost, W. A., Kraan, C., Maat, N., DeCosmo, J., et al. (1992). Sea surface wind stress and drag coefficients: the HEXOS results. Boundary Layer Meteorol. 60, 109–142.
Song, Z., Bao, Y., Zhang, D., Shu, Q., Song, Y., and Qiao, F. (2020). Centuries of monthly and 3-hourly global ocean wave data for past, present, and future climate research. Sci. Data 7:226. doi: 10.1038/s41597-020-0566-8
Sørland, S. L., Brogli, R., Pothapakula, P. K., Russo, E., Van de Walle, J., Ahrens, B., et al. (2021). COSMO-CLM Regional climate simulations in the CORDEX framework: a review. Geosci. Model. Dev. Discuss. 14, 5125–5154.
Tao, A., Shen, Z., Li, S., Xu, X., and Zhang, Y. (2018). Research progrecs for disastrous waves in China. Sci. Technol. Rev. 36, 26–34.
Timmermans, B., Stone, D., Wehner, M., and Krishnan, H. (2017). Impact of tropical cyclones on modeled extreme wind-wave climate. Geophys. Res. Lett. 44, 1393–1401. doi: 10.1002/2016gl071681
Toimil, A., Losada, I. J., Nicholls, R. J., Dalrymple, R. A., and Stive, M. J. F. (2020). Addressing the challenges of climate change risks and adaptation in coastal areas: a review. Coast. Eng. 156:103611. doi: 10.1016/j.coastaleng.2019.103611
Wang, L., Perrie, W., Long, Z. X., Blokhina, M., Zhang, G. S., Toulany, B., et al. (2018). The impact of climate change on the wave climate in the Gulf of St. Lawrence. Ocean Model. 128, 87–101. doi: 10.1016/j.ocemod.2018.06.003
Wang, S., and Toumi, R. (2021). Recent migration of tropical cyclones toward coasts. Science 371, 514–517. doi: 10.1126/science.abb9038
Wang, X. L., Feng, Y., and Swail, V. R. (2014). Changes in global ocean wave heights as projected using multimodel CMIP5 simulations. Geophys. Res. Lett. 41, 1026–1034. doi: 10.1002/2013gl058650
Wang, X. L. L., and Swail, V. R. (2001). Changes of extreme wave heights in Northern Hemisphere oceans and related atmospheric circulation regimes. J. Clim. 14, 2204–2221. doi: 10.1175/1520-0442(2001)014<2204:coewhi>2.0.co;2
Wang, X. L. L., and Swail, V. R. (2006). Climate change signal and uncertainty in projections of ocean wave heights. Clim. Dyn. 26, 109–126.
Wu, L. L., Wang, X. L. L., and Feng, Y. (2014). Historical wave height trends in the South and East China Seas. J. Geophys. Res.Oceans 119, 4399–4409. doi: 10.1002/2014jc010087
Keywords: wave climate, extreme wave, multivariate bias adjustment, climate projection, Chinese marginal seas
Citation: Li D, Feng J, Zhu Y, Staneva J, Qi J, Behrens A, Lee D, Min S-K and Yin B (2022) Dynamical Projections of the Mean and Extreme Wave Climate in the Bohai Sea, Yellow Sea and East China Sea. Front. Mar. Sci. 9:844113. doi: 10.3389/fmars.2022.844113
Received: 27 December 2021; Accepted: 24 January 2022;
Published: 17 February 2022.
Edited by:
Adem Akpinar, Uludağ University, TurkeyReviewed by:
Piyali Chowdhury, Centre for Environment, Fisheries and Aquaculture Science (CEFAS), United KingdomCopyright © 2022 Li, Feng, Zhu, Staneva, Qi, Behrens, Lee, Min and Yin. This is an open-access article distributed under the terms of the Creative Commons Attribution License (CC BY). The use, distribution or reproduction in other forums is permitted, provided the original author(s) and the copyright owner(s) are credited and that the original publication in this journal is cited, in accordance with accepted academic practice. No use, distribution or reproduction is permitted which does not comply with these terms.
*Correspondence: Delei Li, ZGVsZWlsaUBxZGlvLmFjLmNu; Baoshu Yin, YnN5aW5AcWRpby5hYy5jbg==
Disclaimer: All claims expressed in this article are solely those of the authors and do not necessarily represent those of their affiliated organizations, or those of the publisher, the editors and the reviewers. Any product that may be evaluated in this article or claim that may be made by its manufacturer is not guaranteed or endorsed by the publisher.
Research integrity at Frontiers

Learn more about the work of our research integrity team to safeguard the quality of each article we publish.