 Xin Li1
94% of researchers rate our articles as excellent or good
Learn more about the work of our research integrity team to safeguard the quality of each article we publish.
Find out more
ORIGINAL RESEARCH article
Front. Mar. Sci., 08 November 2022
Sec. Marine Ecosystem Ecology
Volume 9 - 2022 | https://doi.org/10.3389/fmars.2022.1032105
This article is part of the Research TopicDegradation, Ecological Restoration and Adaptive Management of Estuarine Wetlands under Intensifying Global ChangesView all 20 articles
Coastlines and estuaries as one of the most dynamic systems in the marine environment are influenced by not only natural factors but also various anthropogenic activities, but there have been limited comprehensive studies on the relationship between coastline variation and anthropogenic activities at the watershed and local scales. The Pearl River Estuary (PRE) in China has experienced remarkable coastline variation along with rapid economic development and urbanization. In this study, the coastline of the PRE was extracted using Landsat images during 1987-2017, and the impacts of multiple factors on coastline variation were explored with correlation analysis and regression analysis. Results suggested coastlines of the PRE demonstrated a clear expanding trend over recent decades, and the coastline length had increased by 74.81 km and the land area had increased by 679.25 km2 by 2017, and results also showed rapid coastline variation during 1987-2004 and relatively slow variation during 2004-2017. Artificial coastlines accounted for 80.90% of the total coastline length in 2017, while natural coastlines accounted for only 19.10%. In addition, reduction in the sand content caused by construction of reservoirs and river dredging in upstream areas played a dominant role in affecting natural coastline variation in the PRE, especially on the west coast. Moreover, the artificial coastline in the study area expanded quickly due to the influence of various human activities, among which the urbanization and land reclamation for aquaculture played a dominant role in affecting the artificial coastline variation on the east and west coasts, respectively. Results of this study have important value for understanding the individual and joint effects of various human activities on coastline variation and can provide important reference information for the sustainable management of the PRE as well as other estuaries.
As one of the most biologically productive regions in the world, estuaries generally serve as important bases for socioeconomic growth and development (Verdiell-Cubedo et al., 2012; Sundblad et al., 2014; Sui et al., 2020). Coastlines, which serve as a demarcation line between the land and sea, play a fundamental role in affecting the evolution of the environmental conditions in estuaries (Pajak and Leatherman, 2002). On the one hand, estuaries are located in a mixed zone between the river and sea, which experience frequent material exchange and close interaction between runoff and tidal currents and provide favorable habitat conditions (food, temperature, salinity, hydrodynamics) for aquatic organisms (Machado et al., 2016). On the other hand, a number of estuaries around the world have experienced various degrees of coastal erosion and expansion since the 20th century under the influence of anthropogenic factors (e.g., dam construction, sand mining, dredging) and natural factors (e.g., sea level rise, storm surges) (Syvitski and Saito, 2007; Blum and Roberts, 2009). For example, anthropogenic activities, e.g., reservoir and dam construction, sand mining and dredging in river watersheds, have greatly altered the water and sedimentary conditions of rivers (e.g., runoff and sand content) and caused the retreat of coastlines in a number of estuaries (Yang et al., 2004; Fan et al., 2006; Ghoneim et al., 2015). Additionally, the anthropogenic activities in coastal areas, e.g., land reclamation, harbor and channel construction and development of aquaculture, not only consume a large amount of mudflat resources but also greatly change the coastal topography and alter the habitats of benthic animals, fish and birds, which may result in destruction of the coastal ecosystems (Luan et al., 2016). It is therefore of great practical importance to quantitatively analyze the long-term coastline variation to alleviating the conflict between economic development and environmental protection (Zhang et al., 2014; Anh et al., 2021).
In recent decades, remote sensing (RS) and geographic information system (GIS) technologies have provided an important basis for monitoring coastline variation and exploring its driving mechanism (Li et al., 2014; Dua et al., 2021; Skilodimou et al., 2021). For example, numerous scholars have extracted coastline data based on RS and GIS approaches and conducted relevant studies on coastline variation in terms of coastline length, change rates, coastline fractal dimensions, conversions of coastline types and land-sea patterns. Meanwhile the impacts of upstream runoff and sediment changes on the coastline variation have drawn considerable attention in recent decades. Some previous studies have shown the dramatic decrease in the sand content of rivers due to dam construction (Ghionis et al., 2013), sand mining (Siegle et al., 2019), dredging and other anthropogenic activities (Wang et al., 2021) in a number of estuaries, e.g., the Yellow River Estuary (Fan et al., 2006), Yangtze River Estuary (Yang et al., 2004) and Nile River Estuary (Ghoneim et al., 2015), which have led to increased erosion along these coastlines. Additionally, some scholars have revealed coastline variation as a result of anthropogenic activities such as coastal engineering, polder farming, port construction, and land reclamation in coastal areas (Bolam et al., 2006; Luan et al., 2016; Zhu et al., 2016; Anh et al., 2021). For example, Luan et al. (2016) suggested that engineering projects in the coastal areas of estuaries have led to a shift from erosion to siltation along the coastlines of the Yangtze River Estuary, while Thoai et al. (2019) showed that changes in land use have resulted in coastline changes and increased the coastline vulnerability.
Anthropogenic activities have become more complex and diverse along with rapid socioeconomic development in recent decades, and anthropogenic interventions in the basin and estuary have not only reduced the sediment input to the estuary but also changed the location, structure and morphology of the coastline, especially in some estuarine areas of high-intensity land development (Li and Damen, 2010). For example, it has been a strategic choice for many areas to exploit coastal resources after the depletion of land resources in recent decades (Zhang et al., 2022), and anthropogenic activities have played an increasingly important role in controlling the shrinkage and expansion of estuaries, e.g., the Pearl River Estuary (PRE) (Syvitski and Saito, 2007; Bi et al., 2014; Tan et al., 2016; Wu et al., 2018). The PRE is a typical estuary that has been subjected to intense anthropogenic activities, but there have been limited systematic and comprehensive studies on the relationship between coastline variation and anthropogenic activities at the watershed and local scales in this region (Zheng et al., 2020). Meanwhile several studies indicated that the construction of reservoirs and dams is the main cause of coastline and topographic erosion in the basin of the PRE (Ranasinghe et al., 2019; Wei et al., 2021). While some other studies have shown that anthropogenic activities such as land reclamation and coastal engineering have become important factors in the expansion of coastlines and offset the trend of coastline erosion driven by a reduction in river sediment loads in the PRE (Li and Damen, 2010; Zhang et al., 2015; Wu et al., 2018; Hu and Wang, 2020). This suggested there are multiple anthropogenic activities in the watershed and coastal areas that jointly affected the erosion and expansion of the PRE coastline. This study has aimed to reveal the effects of various anthropogenic activities on coastline variation in the PRE. This study used long-term socioeconomic data to reflect the intensity of multiple anthropogenic activities and used statistical methods to identify the dominant anthropogenic activities that significantly influence the coastline variation. The results of this study can provide an important reference for coastline management practices that actively regulate the intensity of anthropogenic activities.
The PRE is located in the southern and central parts of Guangdong Province, China (112°18′08″E~115°01′19″E, 21°42′31″N~22°42′23″N), where the convoluted and complex coastlines have changed significantly during past decades (Figure 1). There are widespread mountains, hills and plains in the estuary region, and bedrock and sandy coastlines are more widespread in the central and eastern parts of the PRE, which offer the natural advantage of excellent harbors. By contrast, the western part of the study area has a large number of silty coastlines with widely distributed mudflats, providing ample land resources for agricultural polders and aquaculture (Ai et al., 2019). The PRE as a pioneering region of the reform and opening up of China has experienced rapid economic development and witnessed the rapidest urbanization in the world over past decades (Ye et al., 2011). For example, the urban agglomeration in the PRE including two first-tier cities of China has been one of the most densely populated and urbanized regions in the world. However, rapid economic development and urbanization have also led to significant expansion of urban land and large-scale land reclamation, resulting in a dramatic increase in artificial coastlines and substantial loss of natural coastal wetlands (Weng, 2002). The imbalance in the coastline composition has considerable negative effects on the ecological safety of the PRE, which has been reflected by the substantial decrease in mangrove forests, shrinkage of natural coastlines and significant changes in the location of the coastlines.
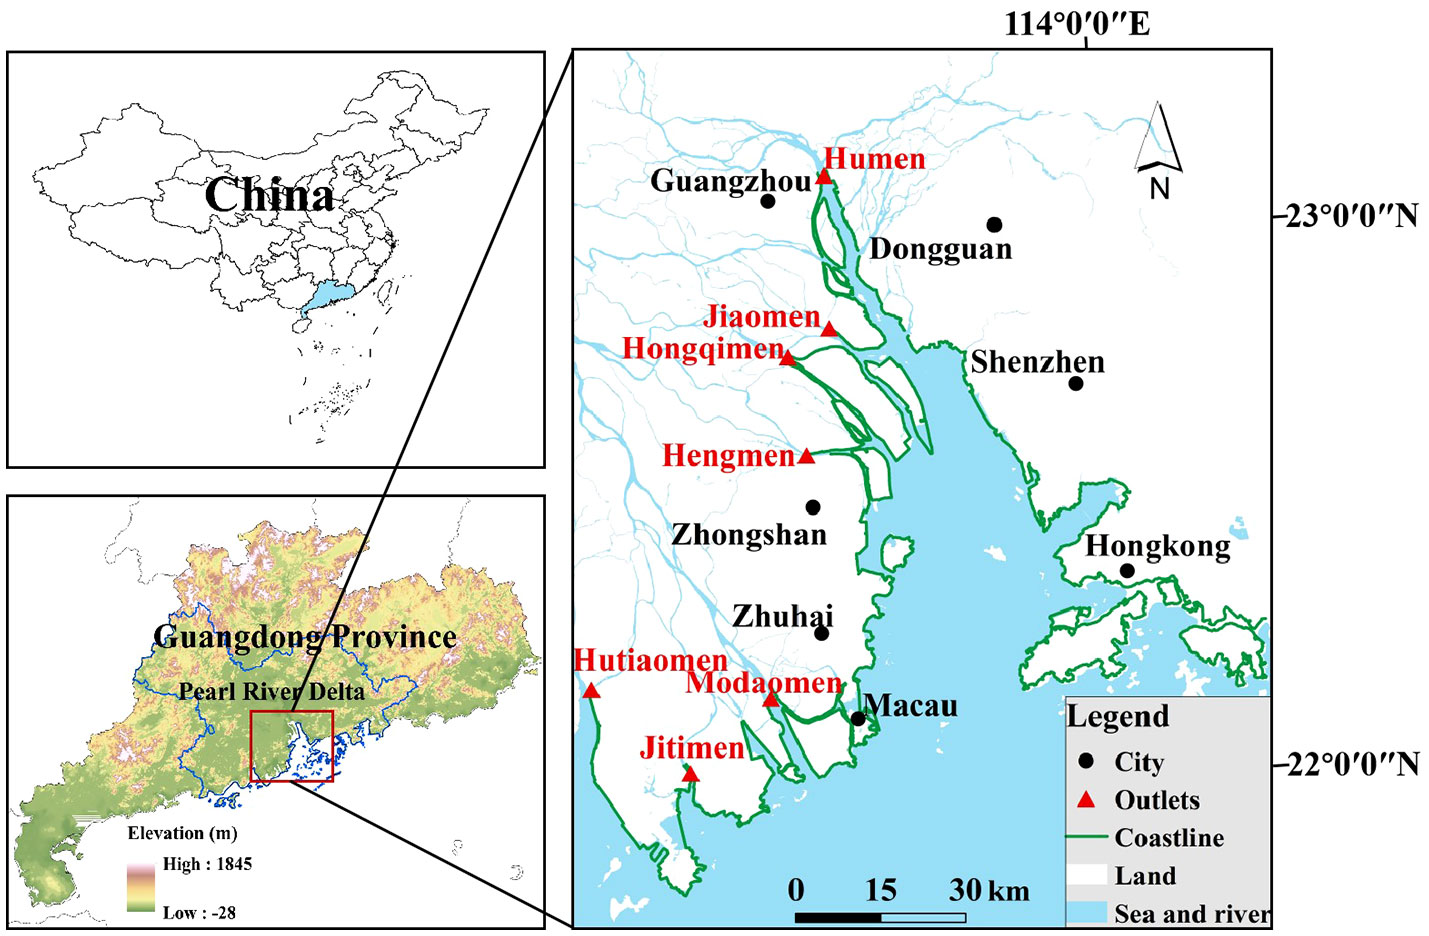
Figure 1 Location of the Pearl River Estuary.
The remote sensing images for reverting the coastline in this study are shown in Figure 2, and the detailed information for these selected remote sensing images is summarized in Table 1. All of these images were obtained from the Geospatial Data Cloud website (www.gscloud.cn/). In order to reduce the possible influence of tides on coastline extraction, all remote sensing images used in this study were on similar time periods, generally during the neap and normal tide periods in November-December. Besides, images containing fewer than 5% cloud coverage were further selected in order to eliminate the data errors caused by clouds. In addition, the water and sand of the PRE mainly come from three major tributaries, i.e., Beijiang, Xijiang, and Dongjiang, and the last hydrological stations before these tributaries reach to outlets are Sanshui station, Makou station, and Boluo station, respectively. This study acquired the runoff and sand content time series data of these stations between 1987 and 2017 from the Guangdong Provincial Hydrological Bureau and “China Sediment and River Bulletin”. These data were used to approximately reflect the incoming water and sand conditions of the PRE. Moreover, this study collected a series of socioeconomic data from the Guangdong Provincial Statistical Yearbook (http://stats.gd.gov.cn/gdtjnj/index.html), the Macau Statistics and Census Service (http://stats.gd.gov.cn/gdtjnj/index.html ), the Hong Kong Government Statistical Processing (https://www.censtatd.gov.hk/sc ) and some relevant literature, e.g., the gross fishery product (GFP), port throughput (PT), GDP and population density (PD) in different parts of the PRE.
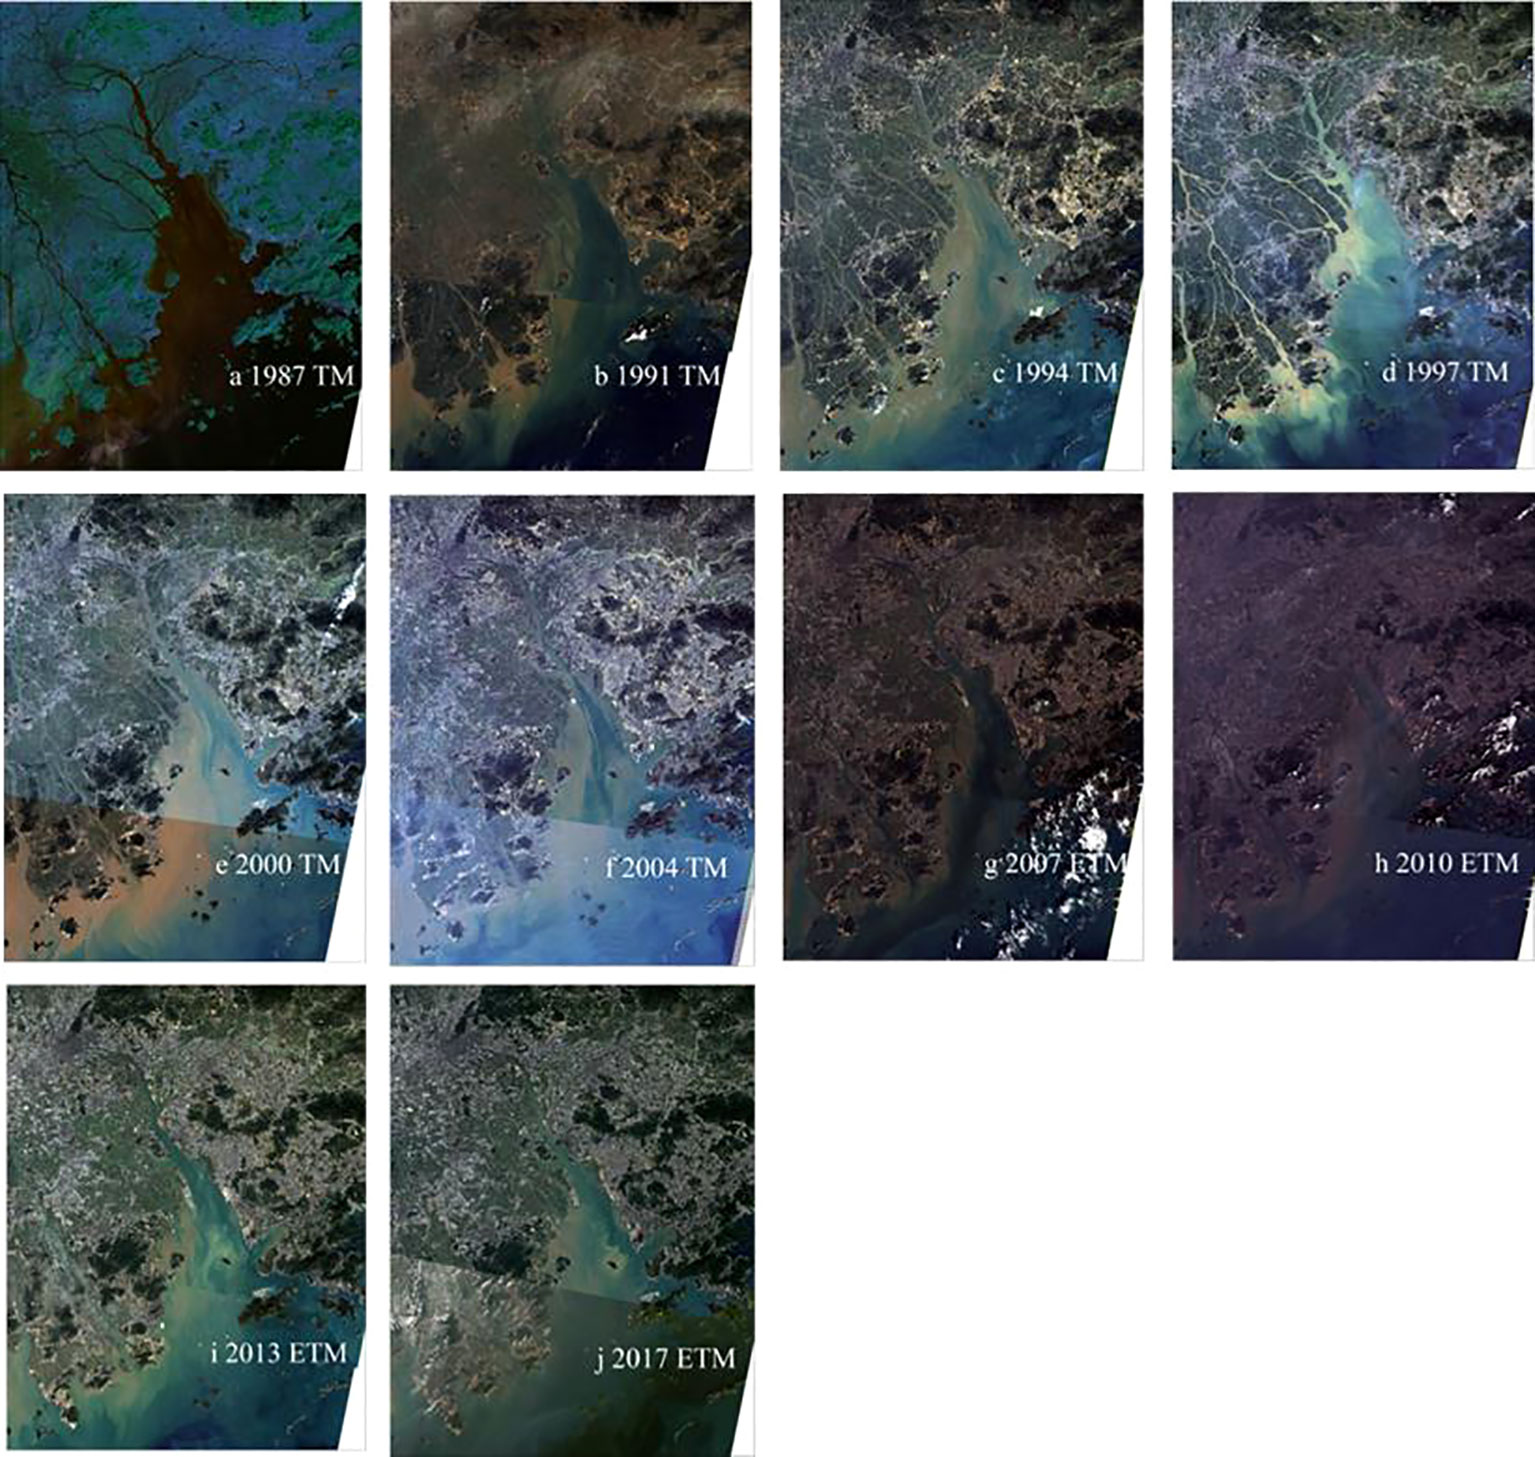
Figure 2 Remote sensing images of the study area from 1987 to 2017.
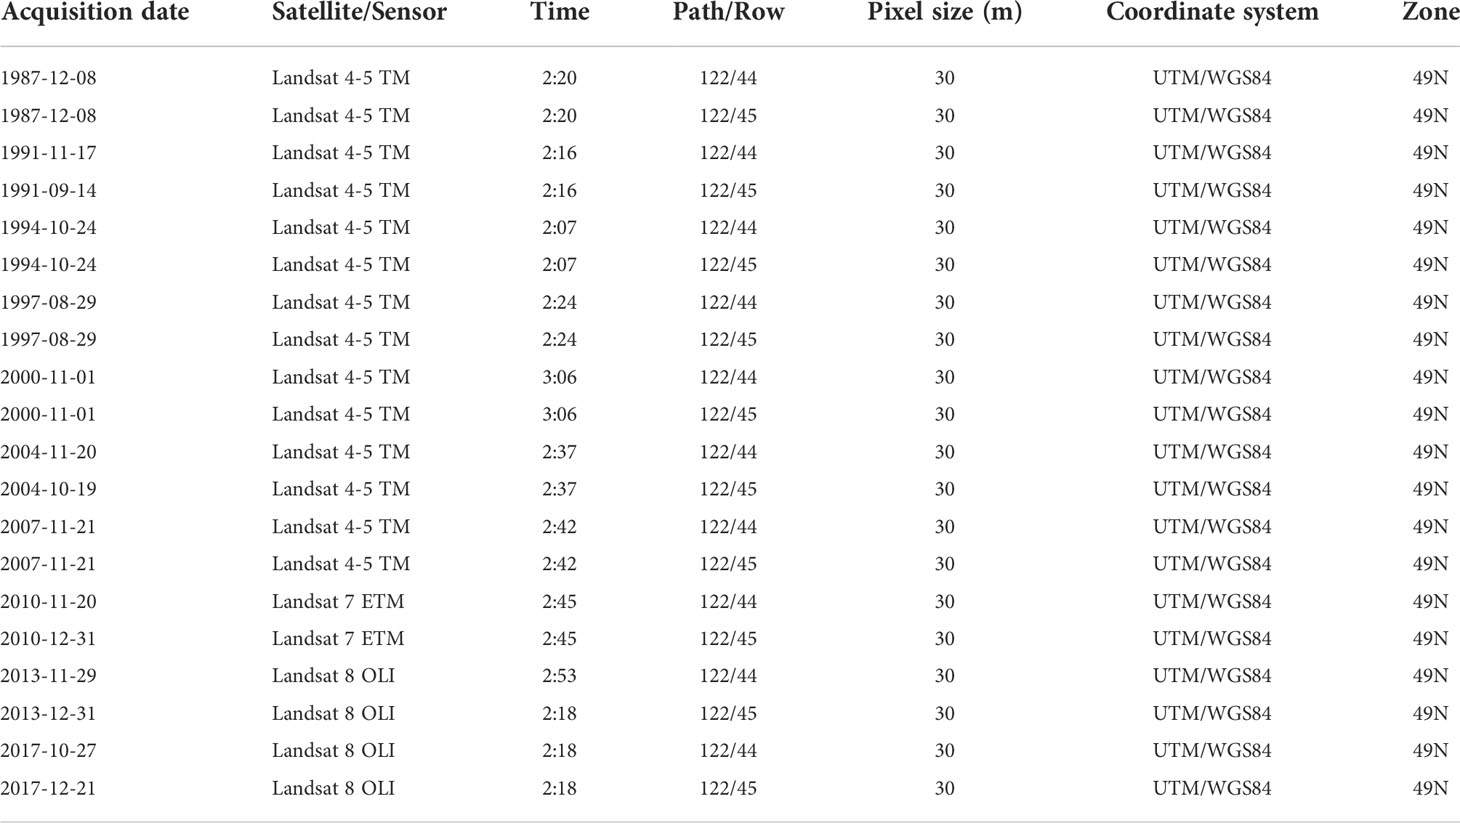
Table 1 Information on the selected remote sensing images from 1987 to 2017.
All the remote sensing images were preprocessed at the spatial resolution of 30 m with the ENVI 5.2 software. This study carried out radiometric calibration, atmospheric correction and geometric correction in order to eliminate errors due to sensor performance variations and atmospheric and light effects. Besides, this study merged two Landsat scenes to cover the whole study area due to the wide extent of the PRE. In addition, all images were processed with the same projected coordinate system (UTM projection, WGS84 reference system), and false colour composites of bands 3, 4, and 5 for Landsat TM/ETM images and bands 4, 5 and 6 for Landsat OLI images were used to assist with the extraction of coastlines.
The modified normalized difference water index (MNDWI) has the highest integrated accuracy and is the best index for automatic coastline mapping (Kelly and Gontz, 2018), and therefore this study firstly used the MNDWI to distinguish water bodies and land based on the preprocessed remote sensing images as follows (Xu, 2006).
where Green and MIR represent the pixel values of the green band and the mid-infrared band, respectively. Zero was identified as the best threshold for water-land separation by using receiver operating characteristic (ROC) curves (Fisher et al., 2016), and some previous studies successfully used a threshold of zero to map the extent of land and water bodies (Xu, 2006; Kelly and Gontz, 2018), and this study has therefore used a threshold of zero for image binarization to highlight water bodies. Besides, the automatically extracted coastlines were manually corrected based on Google Earth images. In addition, this study established coastline interpretation markers for classifying the coastlines based on the features shown on the false colour composite images, including hue, texture, location, and shape, with reference to the relevant literature (Zhu et al., 2013; Wang et al., 2014; Hu et al., 2021). Finally, the coastlines of the PRE were classified into six types, i.e., bedrock coastlines, sandy coastlines, silty coastlines, biological coastlines, aquaculture coastlines and other artificial coastlines.
The following principles and interpretation criteria were used to classify different types of coastlines in this study (Table 2). (1) Bedrock coastlines are located on rocky coasts with obvious mountain textures and have low spectral reflectance and a clear and irregular coastline position. They can be demarcated as the junction line between the cape, sea cliff and seawater. (2) Sandy coastlines are located on sandy coasts, having a higher spectral reflectance on the landward side than on the seaward side and showing a high degree of bright white reflectance. These coastlines are relatively straight, parallel to the coast, and are indicated by a bright white stripe with a clear, uniform texture. (3) Silty coastlines are located on the mudflat coast, which generally have an irregular shape and are often grey−black, with a grey or blue−black irregular flaky edge. (4) Biological coastlines consist of mangroves that grow at the high tide position along the tidal flats. These coastlines have low reflectivity, and the interpretation marks are bright red patches or flakes. (5) Aquaculture coastlines mainly consist of artificially built dams used for aquaculture, with regularly shaped aquaculture ponds inside. These are presented as a band of white colour in the images, and the location is determined at the external boundary of the agricultural ponds. (6) The other artificial coastlines, including the harbor, engineering, construction and other categories of coastlines, present as irregular or with a striped bright white colour, and have obvious demarcation lines with seawater. The outer edge of these features is usually taken as the coastline location.
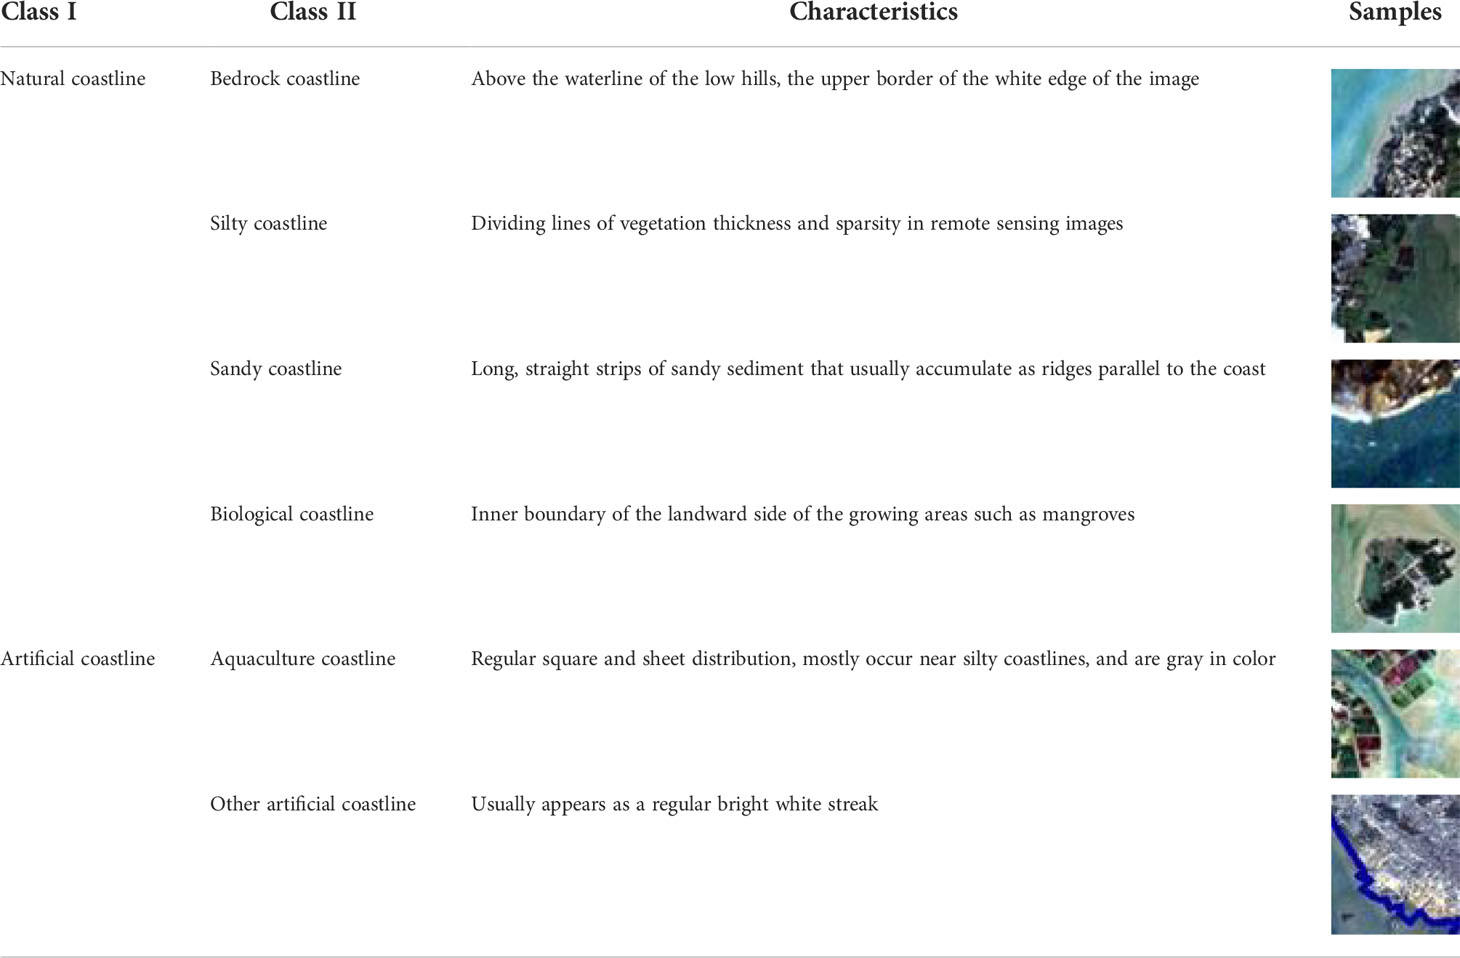
Table 2 Interpretation signs of coastlines in the study area.
The accuracy of the coastline extraction results was verified with the following steps. First, the extracted coastlines at three equal time intervals (1997, 2007 and 2017) during 1987-2017 were selected to verify the accuracy. Then, we collected historical Google Earth images corresponding to Landsat images in 1997, 2007 and 2017. The location of the coastline was identified and 80 ground control points (GCPs) evenly distributed along the entire coastlines were extracted in the historical Google Earth images for each year. In this way, a total of 240 GCPs were used for the accuracy assessment. Finally, the shortest distance from each GCP to the corresponding coastlines extracted based on Landsat images was calculated using the ArcGIS software, and basic statistic indices such as the mean error, standard deviation and root mean square error were further calculated, which are shown in Table 3. All these statistic indices were within the maximum allowable error extent for the images with the spatial resolution of 30m (Hou et al., 2016). As our extraction method and remote sensing image data source are consistent during 1987-2017, it is reasonable to believe that the coastline extraction results during 1987-2017 are all accurate.
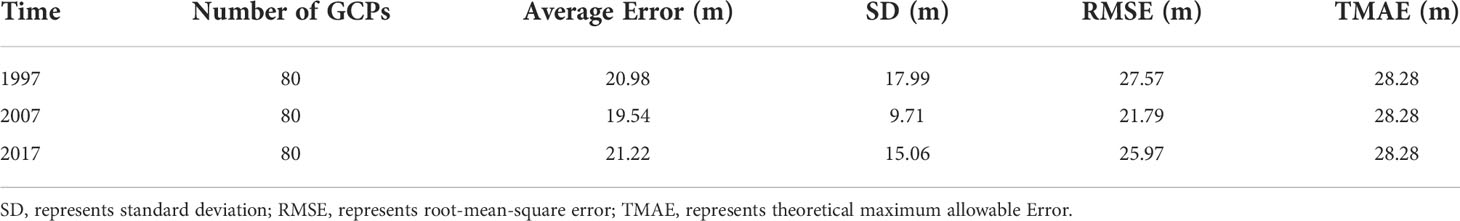
Table 3 Accuracy analysis results of the coastline extraction from remote sensing images in three periods.
This study explored the coastline variations of the PRE during the study period with a focus on the intensity of coastline variations, fractal dimensions of coastlines, and land area changes. Specifically, this study represented the intensity of coastline variations with the average annual change percentage of the coastline length as follows (Xu et al., 2014).
where Lcij is the intensity of coastline variations, and Li and Lj represent the coastline length of the ith year and the jth year, respectively.
The curvature of coastlines were described with the fractal dimension index, which is generally obtained with the grid method as follows (Gagnepain and Roques-Carmes, 1986; Nayak et al., 2019).
where N is the number of square grids covering the coastline, with a side length of r; C is a constant to be further determined; and D is the fractal dimension of the coastline to be estimated. The larger the value of D becomes, the more complex the coastline will be.
The land area change near coastlines were explored by estimating the land area of the coastal zone between coastlines in different periods. Specifically, the coastlines during different periods were overlaid to form some enclosed polygons, the area of which was further estimated to reveal the land area change during the focal period (Yang et al., 2019).
This study explored the effects of the factors that drive coastline change using two approaches, i.e., correlation analysis and multiple regression analysis. The first approach of this study was to explore the correlation between coastline data and anthropogenic activity indicators from 1987 to 2017 with Pearson correlation analysis. A pairwise correlation analysis of the variation in different types of coastlines and anthropogenic activity factors was firstly conducted, and factors with low correlation values were eliminated in the subsequent modelling process, which was helpful in improving the accuracy of the regression model. It is notable that the land area change can only reflect the variation near the coastlines within a certain time period, which is not comprehensive enough to represent the coastline variation of the whole study area during the study period. This study therefore chose the coastline length as the representative indicator of coastline variation and explored the relationship between coastline length and various driving factors. The second approach was to conduct stepwise multiple regression analysis between the coastline length of various types (the dependent variable) and the anthropogenic activity indicators (the independent variables) (Denis, 2009). Specifically, this study selected the incoming water and sand, port construction, agricultural reclamation, urbanization, and economic development level as anthropogenic activity indicators, which were represented with the runoff volume (RV), sand content (SC), port throughput (PT), gross fishery product (GFP), population density (PD), and GDP, respectively. More specifically, new independent variables were introduced one by one in the stepwise regression analysis, and the F test and t test were conducted to test the significance of the influence of these independent variables. The original independent variables were removed when they were no longer significant due to the introduction of newer independent variables. This process continued until no new independent variables were introduced. Additionally, if the variance inflation factor of an independent variable is >10, that independent variable will be excluded from the output model due to its collinearity to ensure that only significant factors are included in the regression equation.
The spatiotemporal variation of coastline locations in the study area is shown in Figure 3, which suggests that the coastlines of the PRE changed remarkably during 1987-2017. Specifically, the coastlines changed most significantly in some locations within Jiaomen outlet, Hongqimen outlet, Hengmen outlet, Modaomen outlet, Jitimen outlet and from from Jiaoyi Bay to Shenzhen Bay (Figure 3). Besides, the coastlines in the study area were approximately classified into natural coastlines and artificial coastlines, and Figure 4 shows the length change intensity of different types of coastlines in the PRE during 1987-2017. On the whole, during the study period, the lengths of the overall and artificial coastlines in the study area increased by 74.81 km and 387.52 km, respectively, and the natural coastline decreased by 312.70 km; the changing rates of which were 2.49 km/a, 12.92 km/a, and -10.42 km/a, respectively. In addition, the coastline changes can be divided into two phases, i.e., the rapid growth phase (1987-2004) and the slow growth phase (2004-2017). During the period of 1987-2004, the lengths of the overall coastline, artificial coastline and natural coastline in the study area varied greatly, with the former two increasing by 83.19 km and 338.99 km, respectively, and the latter shrinking by 255.80 km; the intensity of change for these three was 0.45%/a, 3.63%/a and -2.82%/a, respectively. During the period of 2004-2017, the length of the overall coastline and the artificial coastline showed a recurrent fluctuating trend with a slight increase, while the length of the natural coastline continued to decrease by 56.90 km, and the intensity of change for these three was -0.06%/a, 0.42%/a, and -1.58%/a, respectively, slowing down in comparison to the previous period.
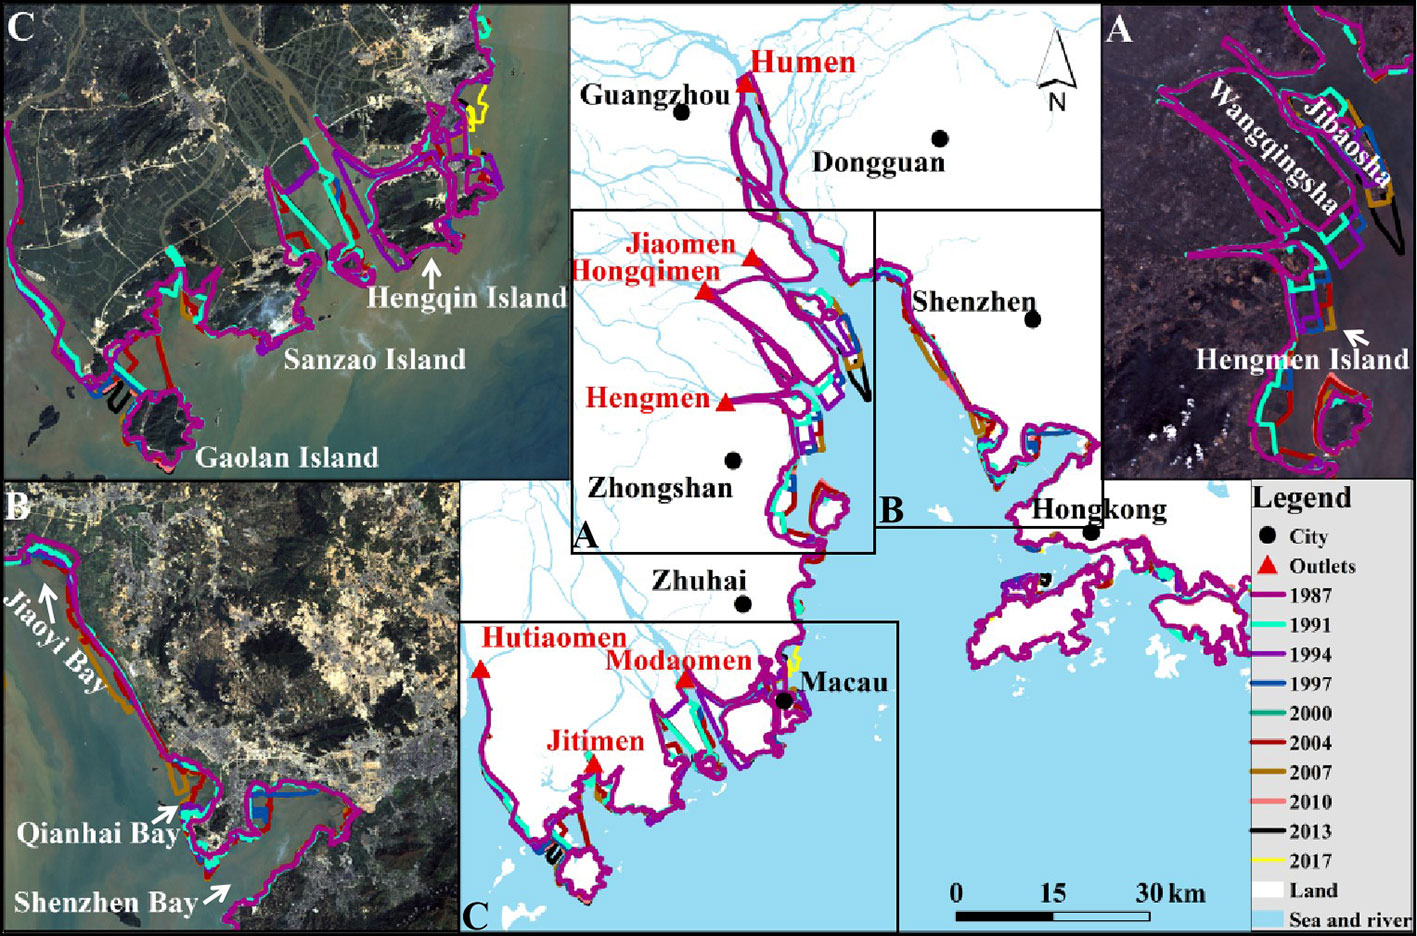
Figure 3 The spatiotemporal variation of coastline locations from 1987 to 2017: (A) from the Jiaomen Outlet to the Hengmen Outlet in the western part of the study area, (B) from the Jiaoyi Bay to the Shenzhen Bay in the eastern part of the study area, and (C) from the Modaomen Outlet to the Jitimen Outlet in the western part of the study area.
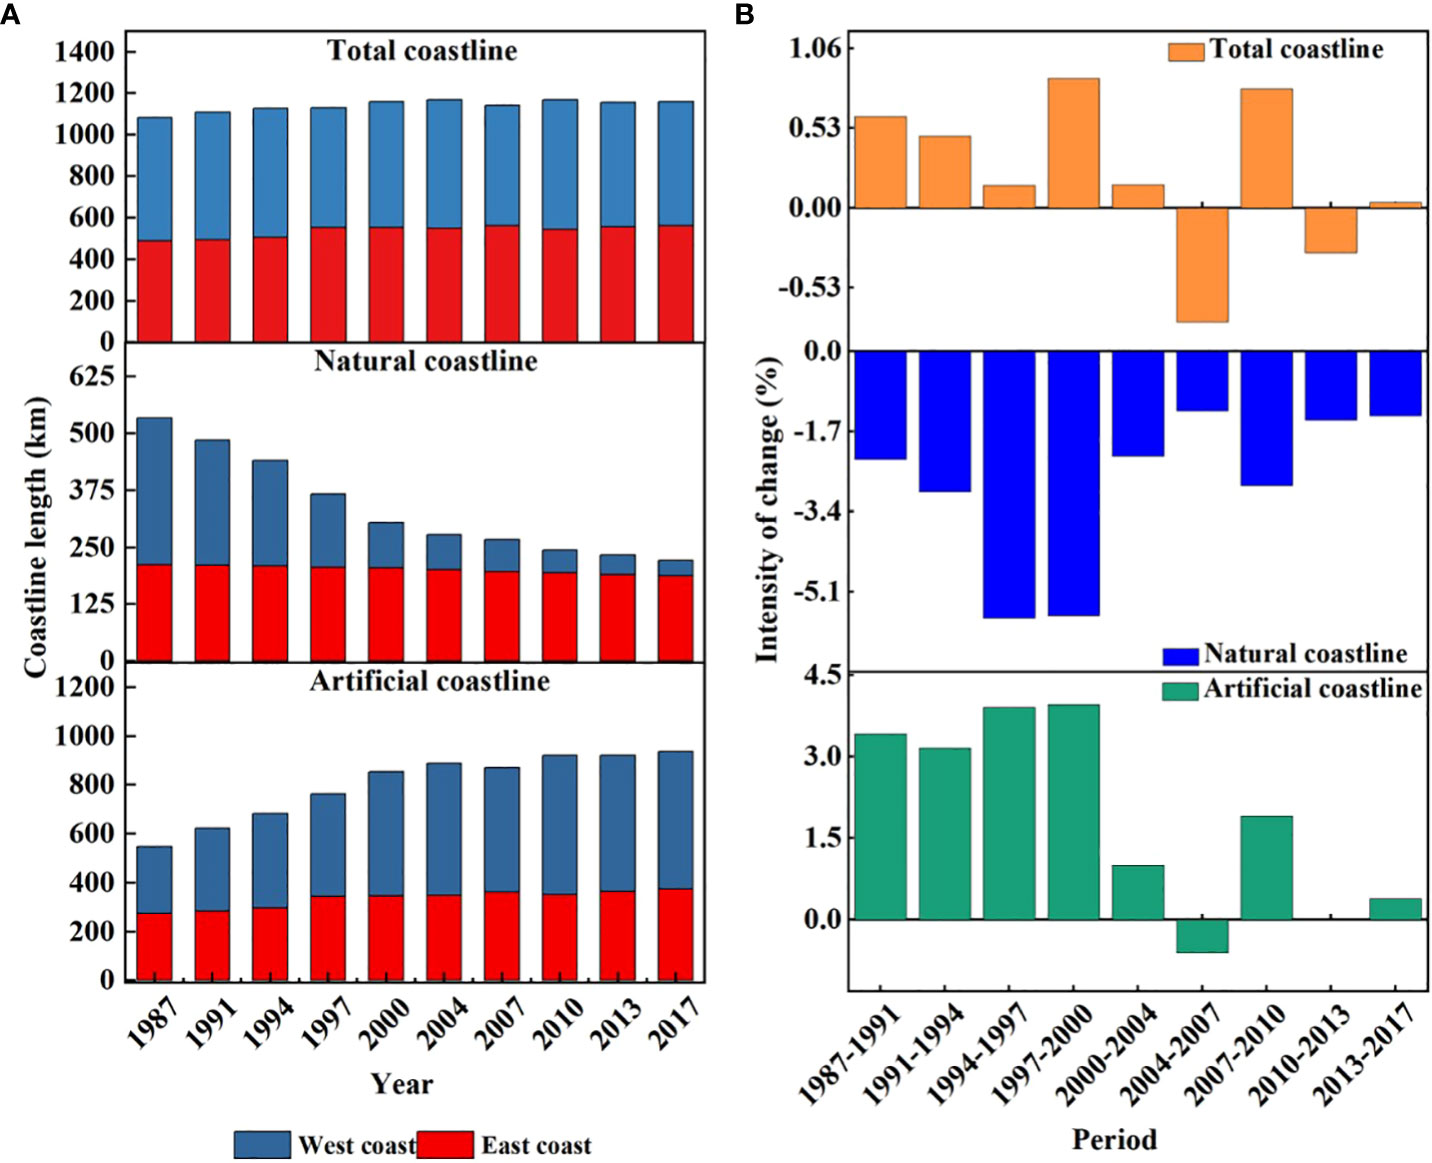
Figure 4 Variation in the coastline length (A) and length variation intensity (B) of natural, artificial and total coastlines in the Pearl River Estuary from 1987 to 2017.
The changes in natural and artificial coastlines varied considerably in different geographic regions due to the heterogeneity of natural conditions and socioeconomic levels within the PRE. Specifically, from 1987 to 2017, the overall length of the natural coastline of the PRE decreased from 533.68 km to 220.977 km, and the natural coastline of the east and west coasts decreased by 24.3 km and 288.403 km, respectively. In other words, the average decrease rates of natural coastlines of the whole PRE, east coast and west coast were 10.42 km/a, 0.81 km/a and 9.61 km/a, respectively. In contrast, the artificial coastline variation can be divided into 2 phases, i.e., the rapid growth phase (1987-2004) and the slow fluctuation phase (2004-2017). In the first stage, the artificial coastlines on the east and west coasts increased by 74.89 km and 264.11 km, respectively, with large-scale land extension to the sea, and the human activities in the PRE mainly included agricultural reclamation, while there was limited engineering construction of towns and roads along the coastlines. In the second stage, the artificial coastlines on the east and west coasts increased by only 24.35 km and 24.17 km, respectively, and the urban and industrial construction in the PRE played a dominant role in affecting the coastline. In fact, the artificial coastline has remained in a stable phase since 2010, which may be due to legislative restrictions.
There was a remarkable difference in the composition of the PRE coastlines among different years, which showed a significant change after 2004 (Figure 5). There was little difference in the proportion of artificial and natural coastlines in 1987, which was 50.70% and 49.30%, respectively, indicating that most of the natural coastlines remained undeveloped during this period. In contrast, the natural coastlines decreased sharply at a rate of 3.55 km/a during 1987-2004, and the artificial coastline increased significantly at a rate of 8.06 km/a. The natural coastlines continued to decrease at a rate of 1.93 km/a after 2004, while the artificial coastlines increased at a rate of 2.85 km/a, the change rates of which both decreased gradually. However, considerable natural coastlines and agricultural polder coastlines were utilized for the construction of ports, towns and roads during this period, which decreased at rates of 8.99 km/a and 3.36 km/a, respectively. Moreover, the engineering coastlines increased rapidly at a rate of 8.08 km/a, which gradually became the dominant part of the artificial coastlines. In fact, the expansion of the artificial coastlines in the study area was mainly at the expense of the silty and sandy coastlines during the whole study period, especially in the coastal zone of the Baoan District of Shenzhen City, where a considerable proportion of silty coastlines was consumed due to the construction of ports and towns.
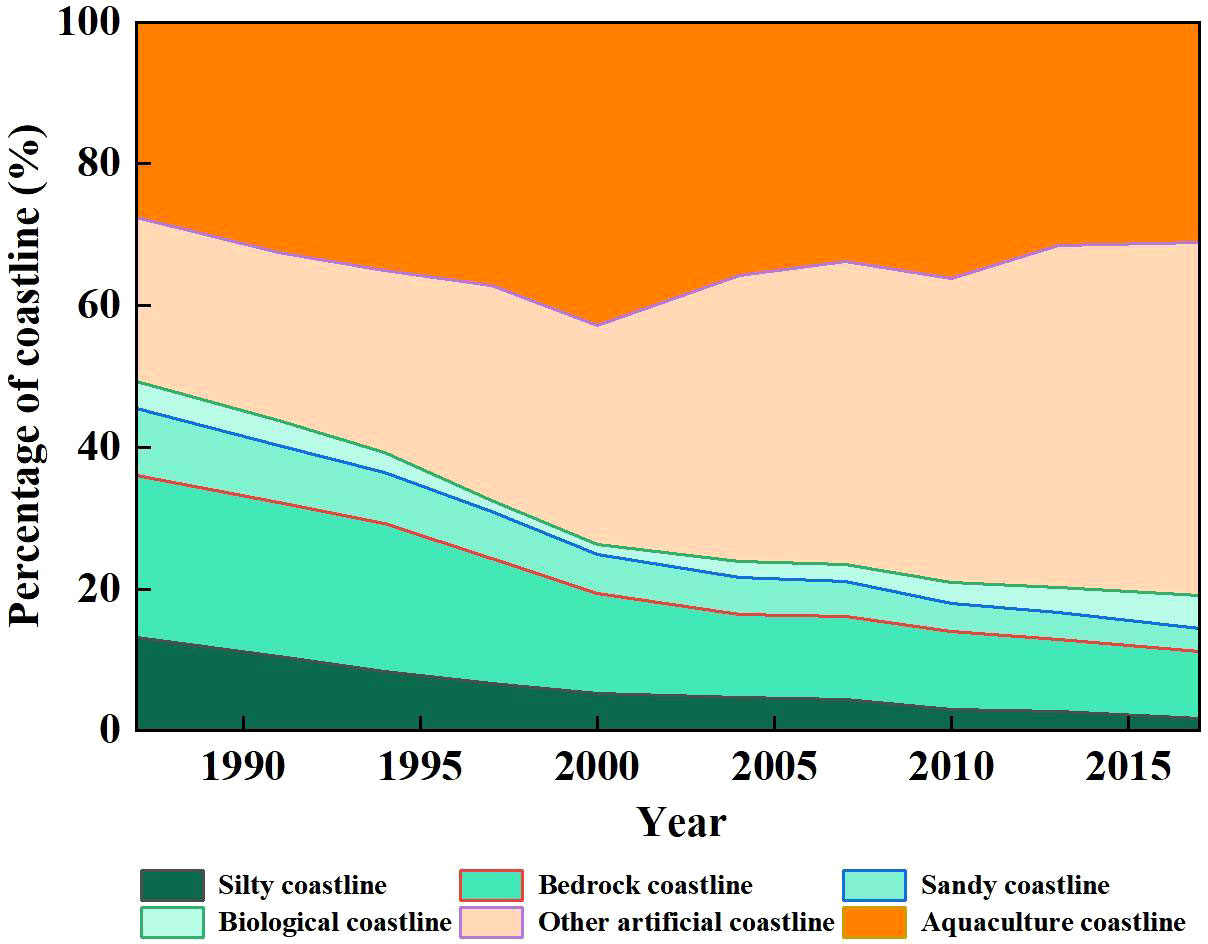
Figure 5 Variation in the different compositions of the coastline in the Pearl River Estuary during 1987-2017.
The overall fractal dimension of the coastlines of the study area increased steadily during the study period, indicating that the geometry of coastlines became increasingly complex (Figure 6). First, the changes in the fractal dimension of the coastlines of the study area can be divided into two phases as follows. The first phase (1987-2007) was characterized by the rapid increase in the fractal dimension of the coastlines due to the gradual fragmentation of the coastline morphology along with the intensified exploitation and utilization of coastal areas by human beings. Specifically, the fractal dimension of coastlines was 1.0007 in 1987, which increased by 0.0034 in 2007, with an average annual change of 0.0002/a. The second phase (2008-2017) was characterized by a slow increase in the coastline fractal dimension, with a total change by only 0.0012 and an average annual change by 0.0001/a, which was primarily due to the limited land reclamation during this period. In addition, the fractal dimension of coastlines of the study area showed a continuous upwards trend over time. However, there were still large differences within the study area (Figure 6), and the ranking of geometric complexity of coastlines within the study area is described as follows: Hong Kong > Zhuhai > Guangzhou > Zhongshan > Shenzhen > Dongguan > Macau. Specifically, the fractal dimension of coastlines in Hong Kong was usually larger, generally fluctuating from 1.002 to 1.006, while that in Zhuhai, Guangzhou and Zhongshan generally fluctuated approximately 1.004. In contrast, the fractal dimension of coastlines in Dongguan and Shenzhen changed only slightly in the early period and continued to rise after 1994 and 2000, which eventually remained at approximately 1.003. Additionally, the fractal dimension of coastlines in Macau was the smallest but showed a slow increasing trend.
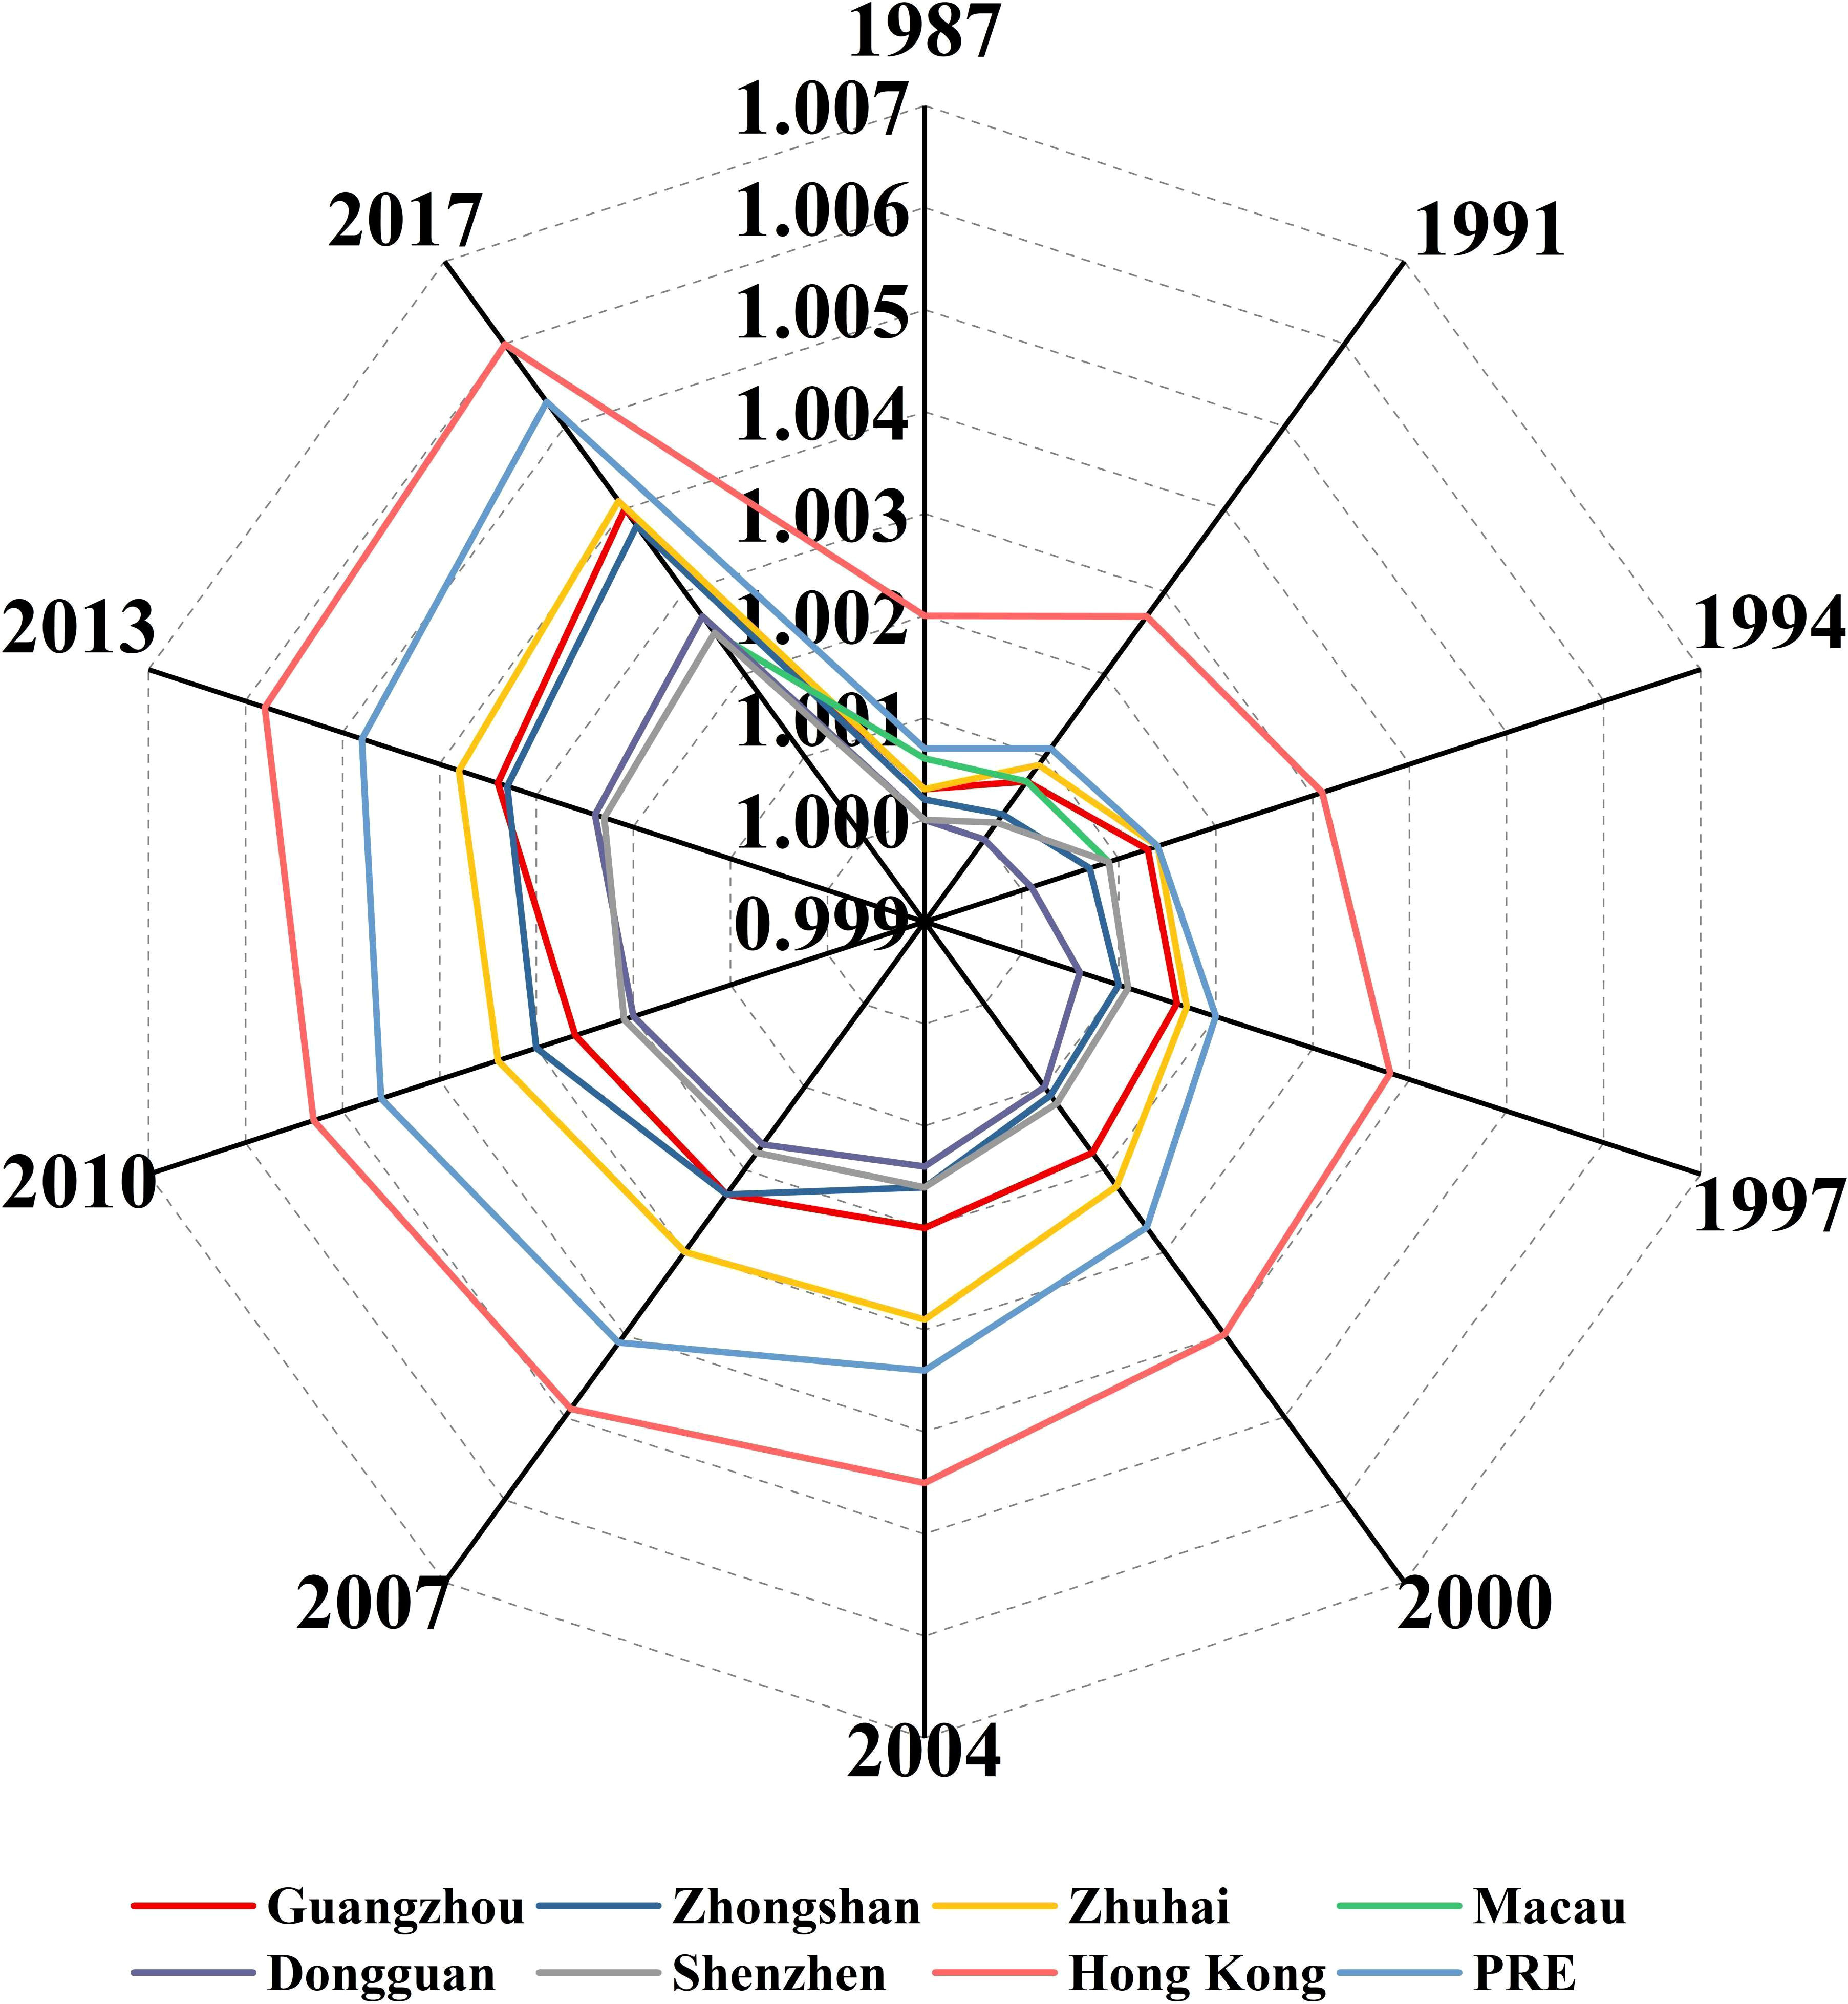
Figure 6 Fractal dimension variations of the coastline in different cities of the Pearl River Estuary during 1987-2017.
The land area of the PRE showed an overall increasing trend during the study period (Figure 7), with a total increase by 679.253 km2 and an average annual growth rate of 22.642 km2/a. Specifically, the land area increased by 109.31 km2, 139.18 km2, 70.77 km2, 51.64 km2 and 96.89 km2 in each consecutive stage during the study years between 1987 and 2004, respectively, which was mainly due to the large amount of polder farming and the expansion of unused areas in the estuary. The increase in the land area slowed after 2004, increasing by 60.22 km2, 56.87 km2 and 68.90 km2 in each consecutive stage during the study years between 2004 and 2013, respectively, and the new land area was mainly used for the construction of towns, ports and roads. The land area increased by only 25.47 km2 after 2013, and the newly reclaimed land area was still used for the expansion of port terminals and industrial land. In addition, the reclamation approach during land area change had significant impacts on the length and morphology of the coastlines. For example, the results of the correlation analysis suggested that the land area change showed a significant positive correlation with the overall coastline length, artificial coastline length and fractal dimension of coastlines, while it showed a significant negative correlation with the natural coastline length.
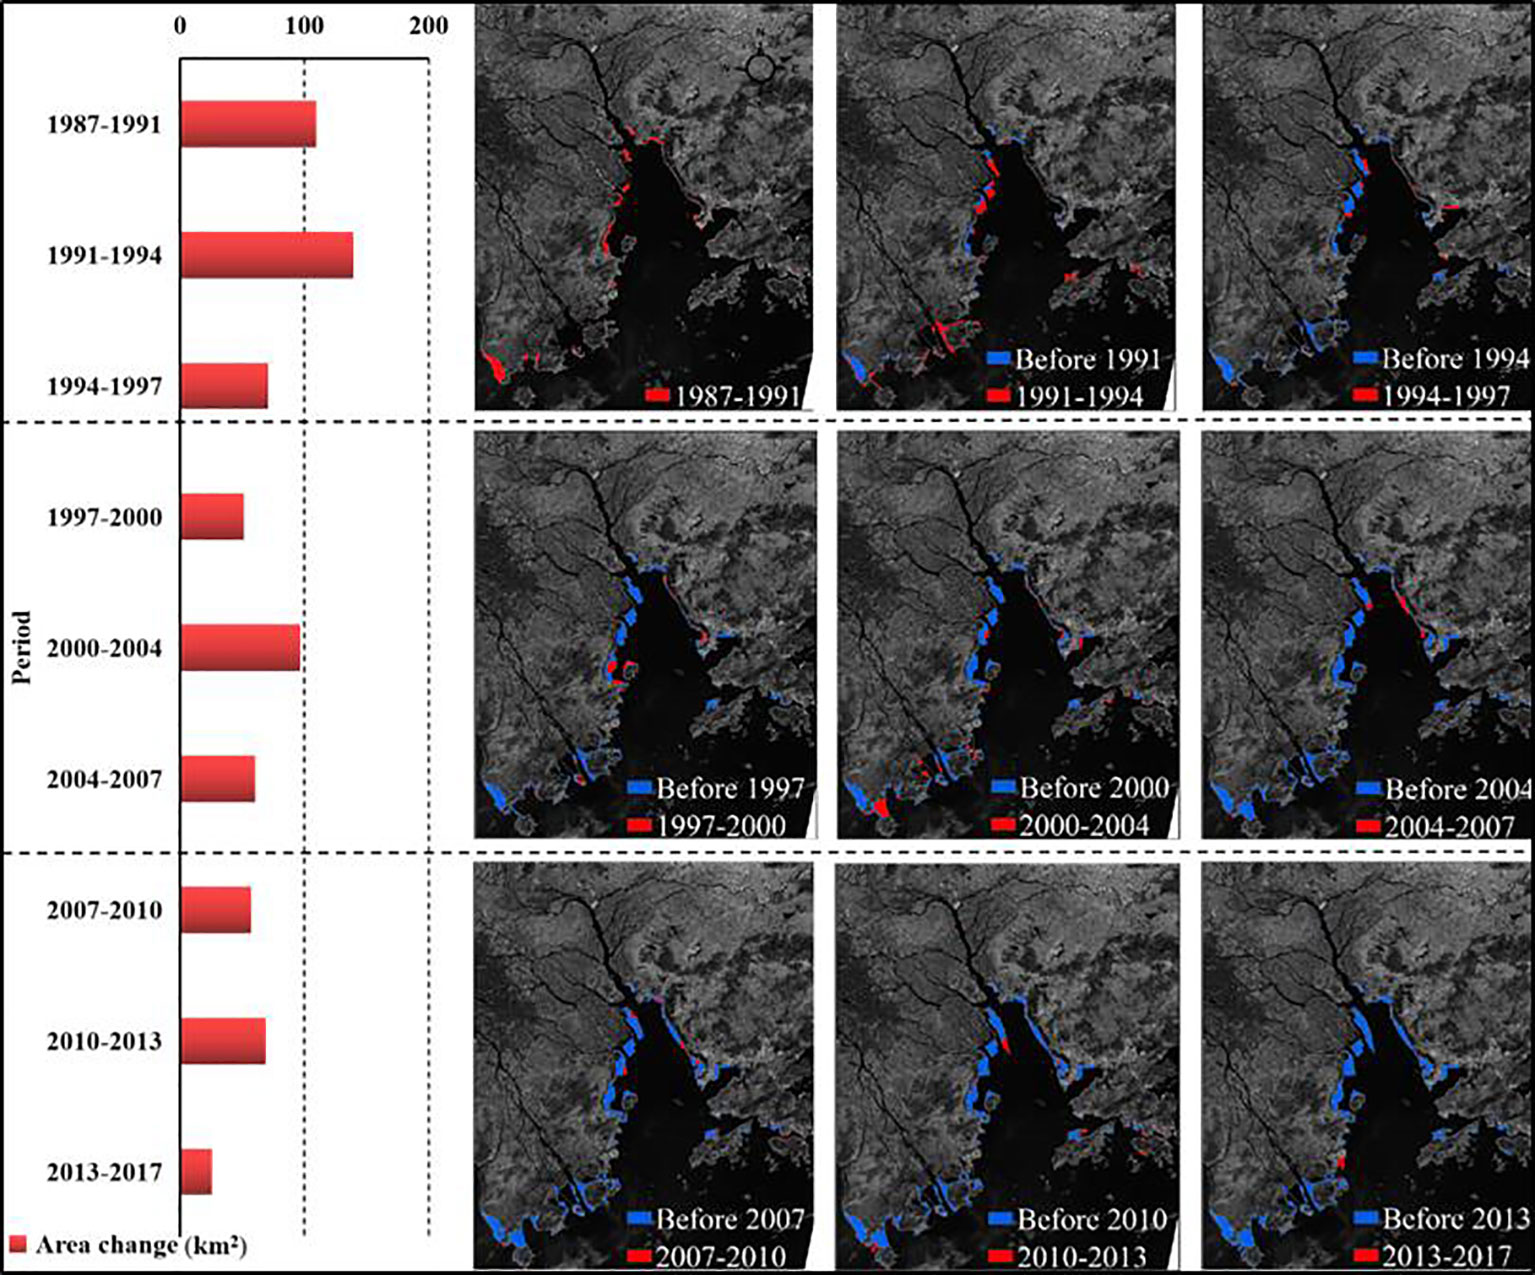
Figure 7 The spatiotemporal variations of the land area in the Pearl River Estuary during the period from 1987 to 2017.
Figure 8 shows the changing trends of the impact factors in the whole PRE and the east and west coasts during 1987-2017. The interannual variation in runoff during this period fluctuates greatly, the sand content shows an obvious decreasing trend, and the sand content in 2017 is 82.76% less than that in 1987. Furthermore, the port throughput, gross fishery product, population density, and GDP of the whole PRE all showed a significant increasing trend after 1995, among which the port throughput increased at a rate of 53,185,700 tons/a and the GDP increased by 20 times in the past 30 years.
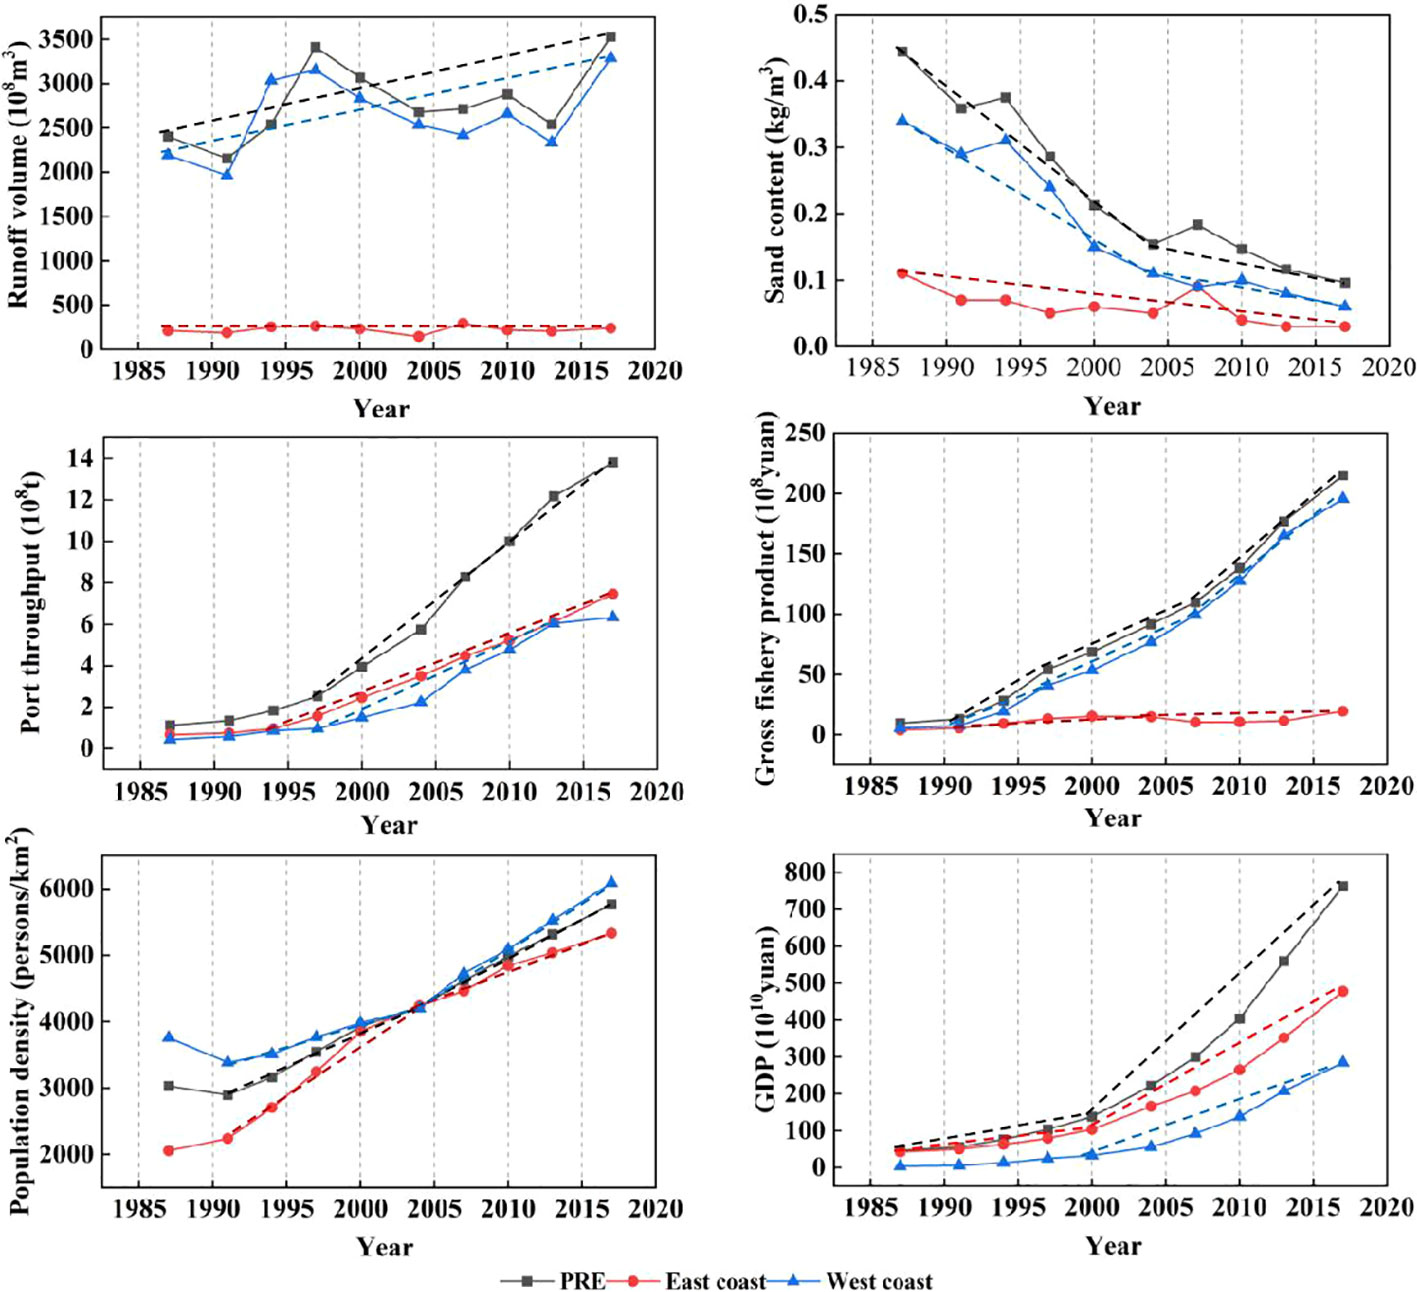
Figure 8 Trends of influencing factors impact on coastline variation in the Pearl River Estuary during 1987-2017. The black, blue, and red dashed lines indicate the fitted trends of the influencing factors for the whole PRE, east coast in the PRE, and west coast in the PRE, respectively.
There were significant differences in the changing trends of these impact factors in different parts of the study area. Specifically, the changing trend of the runoff and sand content of the west coast was consistent with that of the whole PRE, which were both significantly higher than that of the east coast. In addition, there was a remarkable difference in the changing trends of the gross fishery product and GDP between these two coasts. Specifically, the gross fishery product was higher on the west coast, which showed a significant increasing trend, while it remained stable overall in recent decades and even showed a slight decreasing trend after 2005 along the east coast. Additionally, the GDP of both the east and west coasts showed an increasing trend, but it was higher on the east coast than on the west coast, the difference between which even tended to become increasingly significant. In addition, there was only a slight difference in the port throughput between the east and west coasts, which showed a similar changing trend. Moreover, the population density of the west coast was significantly higher than that of the east coast before 1995, and thereafter, the population density of the east coast was close to that of the west coast and showed basically the same changing trend.
The correlations between the coastline variation in different types and driving factors in different parts of the study area are shown in Figure 9. The results showed that the natural coastline length of the whole PRE and the west coast were each highly positively correlated with the sand content, with correlation coefficients reaching 0.99 and 0.98 (p<0.05), respectively. Moreover, the natural coastline length of the east coast was moderately positively correlated with the sand content (0.71, p<0.05). This result suggested that the sediment content has a significant correlation with the natural coastline length in different parts of the PRE and should be the dominant factor affecting the natural coastline variation. In contrast, there was a nonsignificant correlation between the coastline length and runoff in the whole PRE as well as along the east and west coasts. In addition, socioeconomic factors, including port throughput, gross fishery product, population density and GDP, were all significantly positively correlated with the artificial coastline length in the whole PRE as well as along the east and west coasts, while they were all significantly negatively correlated with the natural coastline length. Notably, while the correlation analysis revealed the degree of correlation between coastline variation and the different factors driving that variation, it remains necessary to explore the dominant factors driving coastline variation quantitatively in different types.
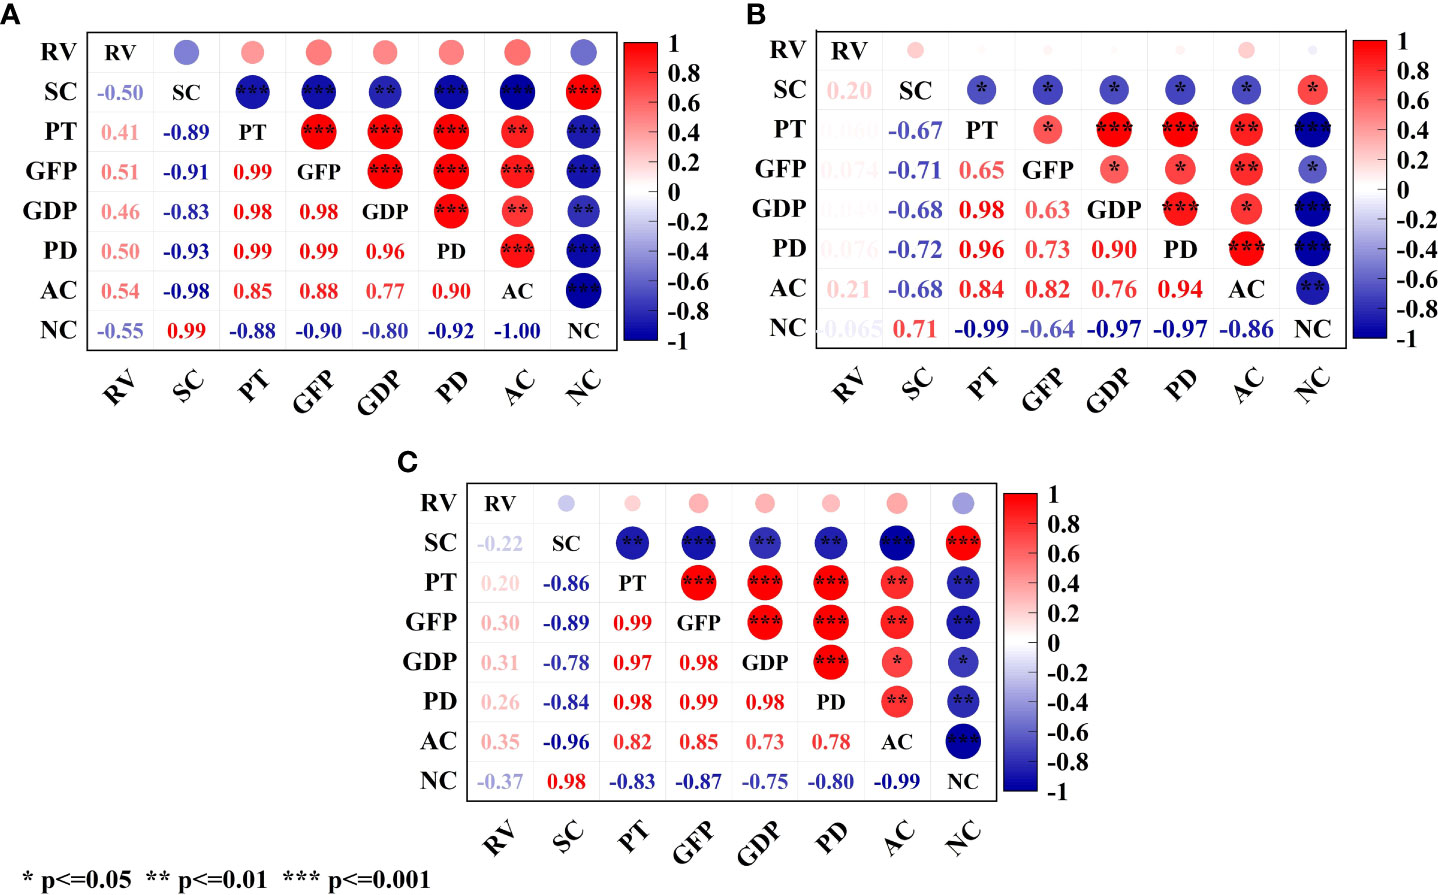
Figure 9 Correlation of coastline variations with various factors in: (A) the whole Pearl River Estuary (PRE), (B) east coast in the PRE, and (C) west coast in the PRE.
Figure 10 shows the relationship between the sand content and natural coastline variation as revealed by the stepwise multiple regression analysis. The results showed that the coefficients of all three regression models were significant at the 0.05 level, and the standardized residual plots also showed a high degree of fit for the regression function, indicating that these regression models are reliable. The regression analysis results showed that the sand content was the main factor influencing natural coastline variation in different parts of the study area, and the relationship between the sand content and the natural coastline length in the PRE and on both coasts could be quantitatively described as follows.
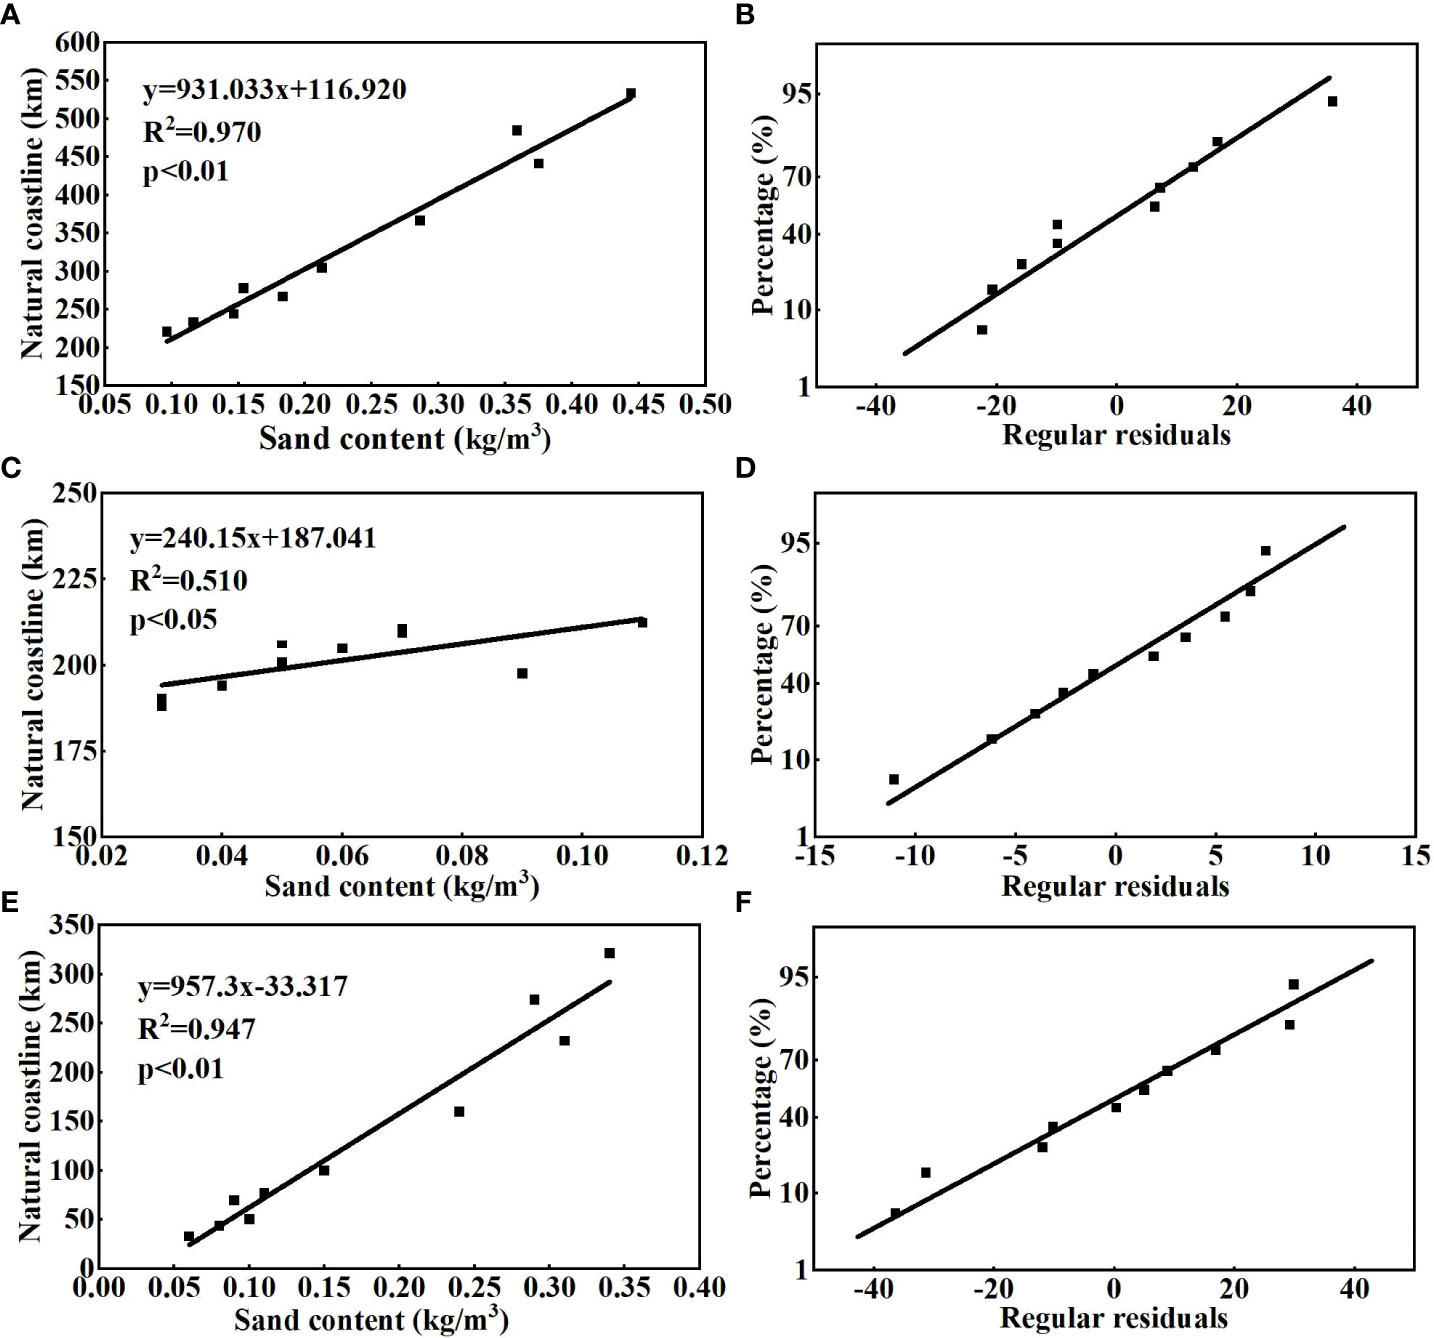
Figure 10 The relationship between natural coastline variations and dominant driving factors based on multivariate stepwise linear regression analysis: (A) the whole Pearl River Estuary (PRE), (C) East coast in the PRE, (E) West coast in the PRE; and the residual plots for regression analysis: (B) the whole Pearl River Estuary (PRE), (D) East coast in the PRE, (F) West coast in the PRE (R2 represents determination coefficient and p represents significance level).
y=931.033x+116.900 (R2 = 0.970, p<0.01) (Pearl River Estuary)
y=240.150x+187.041 (R2 = 0.510, p<0.05) (East coast)
y=957.3x-33.317 (R2 = 0.947, p<0.01) (West coast)
In fact, the overall natural coastline length and sand content of the PRE have decreased remarkably from 1987 to 2017. The variations in natural coastline length and sand content in the PRE and the west coast showed similar synchronous trends, while there was relatively weak correlation between the coastline length and sand content on the east coast. The changing trends and proportion of the sand content in different part of the PRE (Figure 8) suggested that the amount of sediment entering the estuary on the west coast accounted for approximately 76.52% of the total, which, together with the influence of topography, made the sediment material more likely to accumulate on the west coast. In contrast, the amount of sediment entering the estuary on the east coast was generally lower than that on the west coast, where the coastlines are mostly bedrock and siltation is more difficult under the influence of hilly topography, and the limited silty coastlines have been completely occupied by land reclamation after 2004. As a result, the natural coastlines of the east coast have shrunk less significantly than that of the west coast and are overall less affected by the diminishing sand content under the joint influence of environmental attributes and anthropogenic activities.
It is notable that the dominant role of sand content in affecting the natural coastline variation was more obvious during 1987-2000 and thereafter gradually weakened after 2000, while the construction of large reservoirs and dams had significant effects on the sand content. Specifically, the sand content peaked in 1994, which may be related to the increased karstic desertification in the upstream area of the Pearl River basin (Zhang et al., 2012), and the soil erosion made the sand content increase by 0.02 kg/m3 compared to that during 1987-1991. As a result, the rate of the natural coastline shrinkage in the PRE and the east and west coasts during 1991-1994 lessened by 0.1%/a, 0.08%/a, and 0.3%/a, respectively, in comparison to that during 1987-1991. In particular, at least 8,636 reservoirs had been built in the Pearl River basin by the end of the 1990s, which effectively trapped most of the sediment, and the sand content from the upstream of the Pearl River reached only 0.21 kg/m3, which is only approximately 47.86% of that in the late 1980s. As a result, the sediment supply reduction further exacerbated the contraction of the natural coastline. During 1994-2000, the sand content of the PRE and west coast decreased by 0.022 kg/m3 and 0.02 kg/m3 per year, respectively, where the reduction rates of the natural coastline were 16.35 km/a and 15.51 km/a, respectively. The sand content of the Pearl River has decreased at a rate of 0.004 kg/m3 per year under the influence of various reservoirs and dams since 2000, which has declined to 0.18kg/m3 by 2006 and reached only 86.20% of the average value during 1994-2000. Meanwhile natural coastline length of the PRE and the west coast decreased at a rate of approximately 4.38 km/a and 3.38 km/a, respectively. What’s worse, the sand content of the Pearl River has further decreased at a rate of 0.0086kg/m3 per year since the Longtan Reservoir was built, which is twice that during 2000-2006. In particular, the sand content of the Pearl River has reached only 0.10 kg/m3 by 2017, which is only 52.59% of the average value during 2000-2006, and the natural coastline length of the PRE and west coast continuously decreased at a rate of 4.63 km/a and 3.68 km/a, respectively.
These results suggested that the decrease in the sand content disrupted the sedimentary balance of the PRE, and some of the original natural coastlines were eroded due to insufficient sediment supply. Some related studies have also shown that the erosion area of the PRE since the late 1990s is significantly larger than that before the 1980s, and the erosion rate has tripled in comparison to that of the 1980s, primarily resulting from the decrease in the sand content (Wei et al., 2021). This situation has also been be observed in the estuaries of many rivers, e.g., Nile, Mississippi, Mekong, and Ebro (Mikhailova, 2003; El Banna and Frihy, 2009; Blum and Roberts, 2009; Li et al., 2017). Some previous studies have shown that the erosion started when the sand content of the Yangtze River delta decreased by 50% (Yang et al., 2005), while the coastline of the Yellow River estuary have been eroded when the sediment into the estuary decreased by 73.28% (Cui and Li, 2011). In fact, it is notable that the sand content of the Pearl River has decreased by approximately 78.3% so far, and some recent studies have shown that some part of the PRE has been eroded at a decreasing rate (Yang et al., 2019). It is therefore reasonable to assume that the decrease in the sediment load caused by anthropogenic activities played an important role in affecting the natural coastline variation in the PRE.
Different socioeconomic factors played a dominant role in influencing the artificial coastline variation both in the east and west coasts (Figure 11). Specifically, the artificial coastline variation of the PRE and the east coast were mainly influenced by the population density, which is closely related to the level of urbanization. While the coastline variation of the west coast was mainly influenced by agricultural reclamation during the study period. This study also considered the effects of other impact factors on the artificial coastline variation. However, the results of the regression analysis showed no further significant contribution from these other factors. The relationship between the artificial coastline length and the dominant driving factors in different parts of the study area can be described as follows.
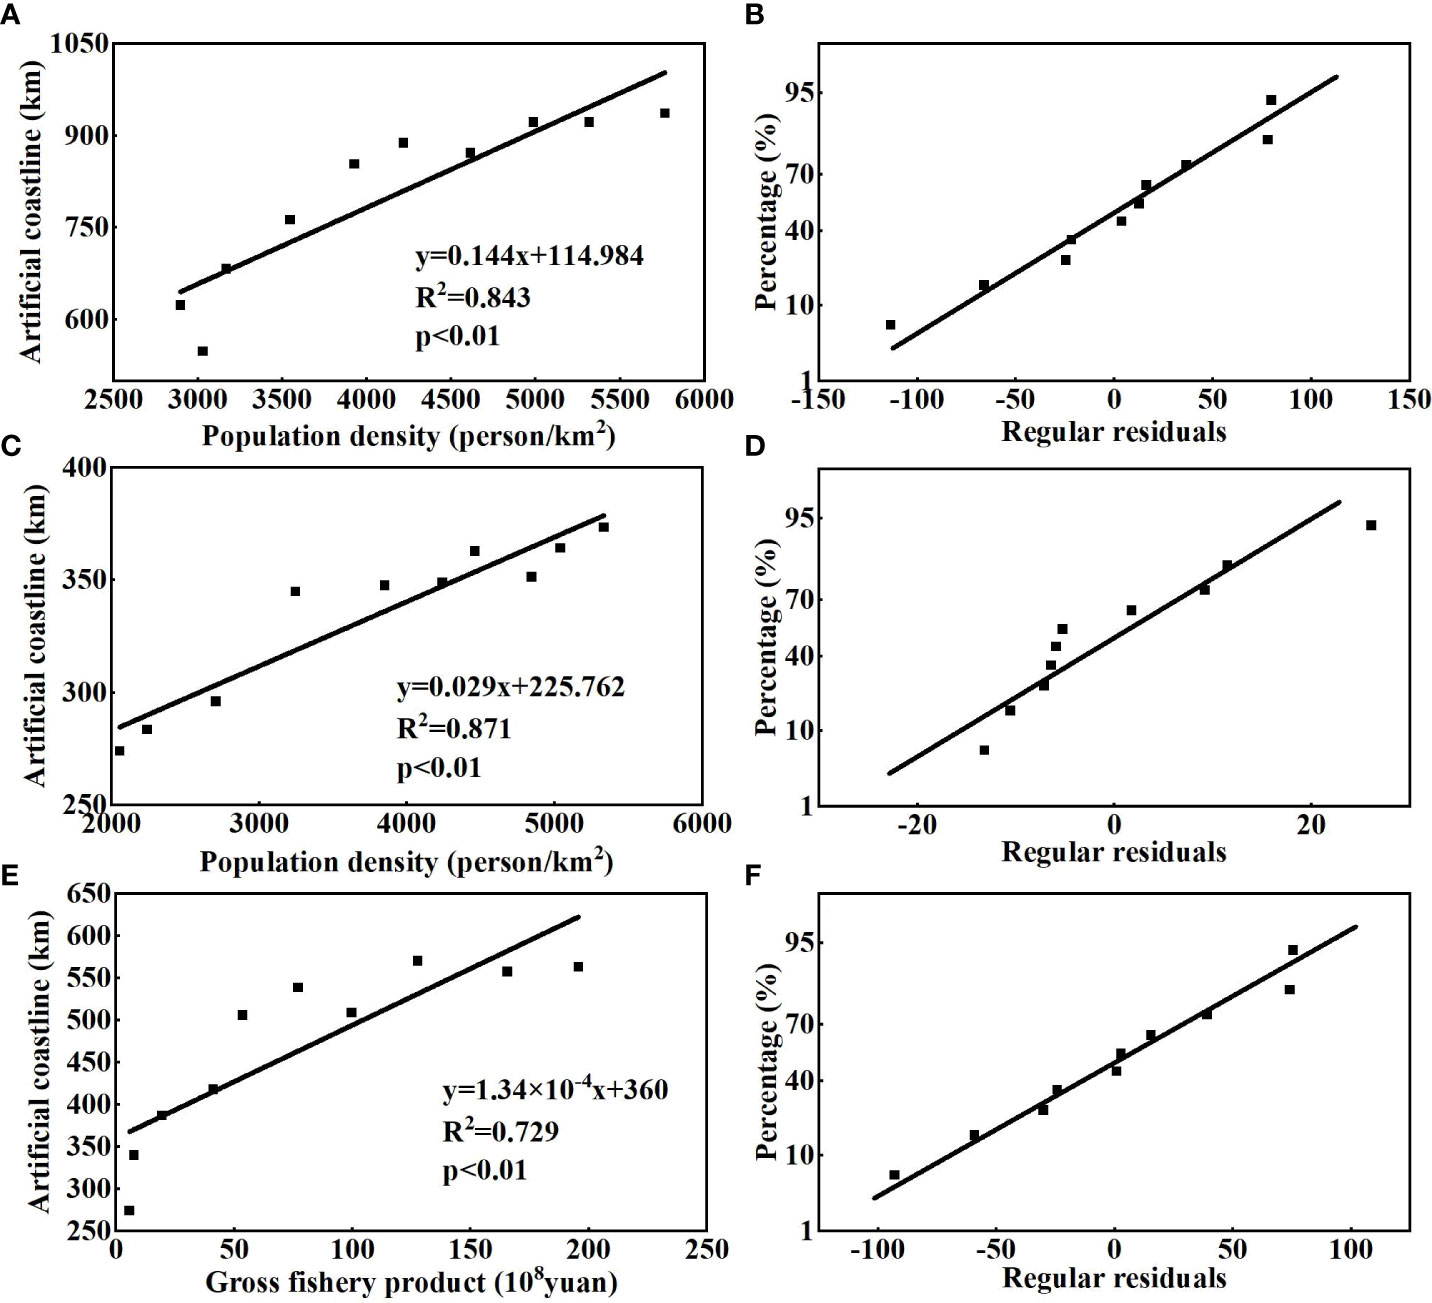
Figure 11 The relationship between artificial coastline variations and dominant driving factors based on multivariate stepwise linear regression analysis: (A) the whole Pearl River Estuary (PRE), (C) East coast in the PRE, (E) West coast in the PRE; and the residual plots for regression analysis: (B) the whole Pearl River Estuary (PRE), (D) East coast in the PRE, (F) West coast in the PRE (R2 represents determination coefficient and p represents significance level).
y=0.144x+114.984 (R2 = 0.843, p<0.01) (Pearl River Estuary)
y=0.029x+225.262 (R2 = 0.871, p<0.01) (East coast)
y=1.34×10⁻⁴x+360 (R2 = 0.729, p<0.01) (West coast)
The coefficients of the variables of these models proved to be valid at a significance level of less than 0.01, indicating that these models are reliable. The residuals of the regression analysis also showed that there was a good fit between the regression functions of the dominant anthropogenic driving factors and the coastline length in each part of the study area, which also indicates the effectiveness of these regression models.
Figure 11 shows that the artificial coastlines increased with the enhancement of the dominant anthropogenic activities during the whole study period. However, the growth rate of the artificial coastlines showed significant variation in different stages. The growth rate of the artificial coastlines for the overall study area and the east and west coasts generally slowed after 2004, 1997, and 2004, respectively. It is inferred that the dominant anthropogenic activities have stage-specific impacts on the artificial coastline. In particular, a large number of coastal mudflat resources were converted into land for aquaculture in the late 1990s when the gross value of fisheries began to increase significantly, and thereafter land reclamation shifted towards urban and transportation construction and industrial development after 2000. Specifically, only very limited mudflat resources at the outlets on the west coast and sides of the Dongbao River Estuary on the east coast were reclaimed for aquaculture and agriculture before 1997, where the gross fishery product increased at a rate of 355.92 million yuan/year and 9.24 million yuan/year, respectively (Figure 8). Additionally, the artificial coastlines of the PRE and the east and west coasts increased dramatically during the whole study period at a rate of 21.42 km/a, 7.08 km/a and 14.34 km/a, respectively. However, the land for aquaculture on the east coast decreased sharply after 2004, and the gross fishery product also decreased from 1.323 billion yuan to 1.025 billion yuan during 1997-2007. Meanwhile a large amount of agricultural land on the west coast was gradually converted into land for aquaculture in pursuit of greater economic benefits after 2007, where the gross value of fisheries continued to rise sharply at a rate of $585,416,000/year (Figure 8). Thereafter, the rate of the artificial coastline variation on the west coast declined to 1.79 km/a due to the diffusion of land for aquaculture.
Land reclamation was generally carried out in the western part of Dongguan city and Shenzhen city along with the accelerated urbanization on the east coast, leading to a dramatic increase of the artificial coastline on the east coast from 274.18 km to 349.06 km during 1987-2004, a larger portion of which was still used as land for aquaculture. The increase in the artificial coastline tended to level off, with the increasing rate declining to 1.87 km/a after 2004, and a large amount of reclaimed land on the east coast was used for urban and industrial development and transportation construction. In particular, there were generally bedrock coastlines on the east coast, the bedrock coastline also gives the east coast the advantage of having natural harbors. This provides natural conditions for the construction of ports, and the port throughput increased significantly at a rate of 180,525,700 tons/a after 1994 (Figure 8). The coastline on the east coast has been dominated by urban construction, with some supplementary port construction, while the land previously used for aquaculture has been occupied by urban construction by approximately 2008. There has been a relatively higher degree of land development and utilization on the east coast, where the ecological risk has been significantly greater than that of the west coast (Chen and Zhou, 2011). Nevertheless, there has been a high degree of redundant construction and a lack of rational utilization of coastlines on the west coast (Hu and Wang, 2022). It is therefore very necessary to set up some coastline protection and reclamation management categories for the already utilized coastline and reclaimed areas. These management strategies should restrict reclamation activities in the PRE as well as the east and west coasts to clarify the control requirements for various types of coastline and reclamation activities to ensure the rational use of the limited coastlines and reduce the waste of coastal resources in the future.
Coastline variation in most estuaries worldwide is influenced by a variety of anthropogenic activities. For example, although the Danube estuary is not directly affected by anthropogenic activities to some extent, a series of dam and weir projects on the river and its tributaries resulted in a 50% reduction in the river sediment load, leading to a retreat of the coastline (Stănică et al., 2011). By contrast, the sediment input to the Yangtze River estuary was significantly reduced due to the operation of the Three Gorges Reservoir, but the Yangtze River coastline advanced seaward instead under the construction of coastal projects (Chu et al., 2013). The Yellow River estuary is greatly affected by land reclamation, and the tidal flats along the southern and northern coastlines in 2019 declined to 43% and 27% of their original area in 1984, respectively, resulting in a continuous reduction in tidal width (Li et al., 2021). This indicates that anthropogenic activities in both watersheds and coastal areas can significantly affect the estuarine coastline variation. In this study, multiple anthropogenic activities in the watershed and coastal areas were considered together, and the main driving factors of coastline variation were identified, and there are different dominant driving factors that significantly affect different types of coastlines in the watershed or coastal areas. These results of this study have important implications for the management of estuarine coastlines subject to high-intensity anthropogenic activities.
This study accurately revealed the coastline variation and its dominant driving factors in the PRE, but it is still necessary to carry out more in depth studies in the future. First, this study extracted coastlines based on multitemporal Landsat remote sensing images on adjacent dates, generally during the neap and normal tide periods of November-December, to reduce the influence of tides and consequently improve the remote sensing retrieval accuracy. However, the influence of tides on coastline variation was not fully considered in this study, primarily due to the limit imposed by the 30m resolution of the Landsat images, which is not precise enough (Liu et al., 2017). It is necessary to further explore the influence of tides on coastline extraction based on remote sensing images with higher resolution. Besides, this study primarily focused on the individual and joint effects of various anthropogenic activities on coastline variation since the coastlines in the PRE varied rapidly under the influence of intensive anthropogenic activities, but other factors can also play an important role in affecting the coastline variation. For example, natural events such as storms, hurricanes, ocean currents and sea level rise can also result in significant and rapid coastline variation (Liu et al., 2013; Gonéri et al., 2014; Saïdi and Zargouni, 2019). Nevertheless, the PRE is a typical area greatly affected by intensive anthropogenic activities, which have played a dominant role in affecting the variation in different types of coastlines, and the coastline variation resulting from natural events is very likely to be obscured by these anthropogenic activities (Zhang et al., 2014). It is therefore necessary to further explore the impacts of these natural events on the coastline variation according to specific situations of the study area in future studies. In addition, coastline variation can also alter the runoff, wave and tidal movement patterns on coastal habitats. It is therefore also necessary to carry out further analysis of the effects of coastline variation on the coastal hydrodynamics, water quality, and hydro-ecological processes in future studies to better support the sustainable development of the PRE as well as other coastal areas.
This study extracted the coastlines of the PRE based on a total of 20 Landsat ETM, TM and OLI images during 1987-2017 and systematically analyzed the relationship between coastline variation and multiple anthropogenic activities. The main conclusions are as follows: (1) The coastline length of the PRE increased by 74.813 km and the land area increased by 679.253 km2 from 1987 to 2017 under the joint influence of multiple anthropogenic activities, while the growth rate of both became slower after 2004. By 2017, the proportion of artificial coastlines has been as high as 80.90%, while the proportion of natural coastlines has been only 19.10%. (2) In recent decades, the decrease in sand content caused by anthropogenic activities has been the dominant cause of the contraction of natural coastlines in different regions of the PRE, and this phenomenon was more obvious before 2000. Urbanization and polder farming are the main reasons for the expansion of artificial coastlines on the east and west coasts. These results of this study provide an important foundation for understanding the coastline variation under the influence of multiple anthropogenic activities in the PRE and can provide scientific guidance for coordinating anthropogenic activities in upstream and downstream areas of the Pearl River to achieve a balance between the erosion and expansion states of the coastline. This work can also provide a reference for exploring the coastline variation and the associated processes in estuarine areas subjected to highly intense anthropogenic and development activities in other estuaries.
The original contributions presented in the study are included in the article/supplementary material. Further inquiries can be directed to the corresponding author.
XL: Methodology, Formal analysis, Data curation, Writing-original draft preparation. HaY: Formal analysis, Writing-review and editing; YY: Conceptualization, Writing-review and editing, Supervision, Project administration; ZX: Software, Validation, Visualization; HuY: Methodology, Investigation. All authors contributed to the article and approved the submitted version.
This research was funded by the National Natural Science Foundation of China (No. 51979042; 51909036; 51909052) and the Special Fund of the State Key Joint Laboratory of Environment Simulation and Pollution Control (No. 21K02ESPCW).
The authors declare that the research was conducted in the absence of any commercial or financial relationships that could be construed as a potential conflict of interest.
All claims expressed in this article are solely those of the authors and do not necessarily represent those of their affiliated organizations, or those of the publisher, the editors and the reviewers. Any product that may be evaluated in this article, or claim that may be made by its manufacturer, is not guaranteed or endorsed by the publisher.
Ai B., Zhang R., Zhang H., Ma C. L., Gu F. G. (2019). Dynamic process and artificial mechanism of coastline change in the pearl river estuary. Reg. Stud. Mar. Sci. 30, 100715. doi: 10.1016/j.rsma.2019.100715
Anh V. T., Trung P. B., Nguyen K. A., Liou Y. A., Phan M. T. (2021). Human impacts on estuarine erosion-deposition in southern central Vietnam: Observation and hydrodynamic simulation. Sustainability. 13 (15), 8303. doi: 10.3390/su13158303
Bi N. S., Wang H. J., Yang Z. S. (2014). Recent changes in the erosion-accretion patterns of the active huanghe (Yellow river) delta lobe caused by human activities. Cont. Shelf. Res. 90, 70–78. doi: 10.1016/j.csr.2014.02.014
Blum M. D., Roberts H. H. (2009). Drowning of the Mississippi delta due to insufficient sediment supply and global sea-level rise. Nat. Geosci. 2 (7), 488–491. doi: 10.1038/ngeo553
Bolam S. G., Rees H. L., Somerfield P., Smith R., Clarke K. R., Warwick R. M., et al. (2006). Ecological consequences of dredged material disposal in the marine environment: A holistic assessment of activities around the England and Wales coastline. Mar. pollut. Bull. 52 (4), 415–426. doi: 10.1016/j.marpolbul.2005.09.028
Chen X. L., Zhou F. (2011). “Gravity center change in the coastal area of the pearl river estuary based on GIS and RS,” in ICCIC 2011: Innovative computing and information, vol. Volume 232 . Ed. Dai M. (Berlin, Heidelberg: Springer), 281–286. doi: 10.1007/978-3-642-23998-4_40
Chu Z. X., Yang X. H., Feng X. L., Fan D. J., Li Y. K., Xing Shen X., et al. (2013). Temporal and spatial changes in coastline movement of the Yangtze delta during 1974–2010. J. Asian. Earth. Sci. 66, 166–174. doi: 10.1016/j.jseaes.2013.01.002
Cui B. L., Li X. Y. (2011). Coastline change of the yellow river estuary and its response to the sediment and runoff, (1976–2005). Geomorphology. 127 (1–2), 32–40. doi: 10.1016/j.geomorph.2010.12.001
Denis D. J. (2009). SPSS Data analysis for univariate, bivariate, and multivariate statistics (111 River Street, Hoboken, USA: John Wiley & Sons, Inc.).
Dua P., Li J., Wang M. G., Wu J. Y. (2021). Spatial-temporal analysis of the coastline changes in fujian province, China from 1995 to 2015. J. Environ. Sci. Manage. 24 (2), 1–9. doi: 10.47125/jesam/2021_2/01
El Banna M. M., Frihy O. E. (2009). Human-induced changes in the geomorphology of the northeastern coast of the Nile delta, Egypt. Geomorphology. 107 (1-2), 72–78. doi: 10.1016/j.geomorph.2007.06.025
Fan H., Huang H. J., Zeng T. (2006). Impacts of anthropogenic activity on the recent evolution of the huanghe (Yellow) river delta. J. Coastal. Res. 224, 919–929. doi: 10.2112/04-0150.1
Fisher A., Flood N., Danaher T. (2016). Comparing landsat water index methods for automated water classification in Eastern Australia. Remote. Sens. Environ. 175, 167–182. doi: 10.1016/j.rse.2015.12.055
Gagnepain J. J., Roques-Carmes C. (1986). Fractal approach to two-dimensional and three-dimensional surface roughness. Wear. 109 (1-4), 119–126. doi: 10.1016/0043-1648(86)90257-7
Ghionis G., Poulos S. E., Karditsa A. (2013). Deltaic coastline retreat due to dam construction: The case of the river alfios mouth area (Kyparissiakos gulf, Ionian Sea). J. Coastal. Res. 65 (sp2), 2119–2124. doi: 10.2112/SI65-358.1
Ghoneim E., Mashaly J., Gamble D., Halls J., AbuBakr M. (2015). Nile Delta exhibited a spatial reversal in the rates of shoreline retreat on the Rosetta promontory comparing pre- and post-beach protection. Geomorphology. 228, 1–14. doi: 10.1016/j.geomorph.2014.08.021
Gonéri L. C., Manuel G., Marissa Y., Déborah I., Benoit M. (2014). Approaches to evaluate the recent impacts of sea-level rise on coastline change. Earth-Sci. Rev. 138, 47–60. doi: 10.1016/j.earscirev.2014.08.005
Hou X. Y., Wu T., Hou W., Chen Q., Wang Y. D., Yu L. J. (2016). Characteristics of coastline changes in mainland China since the early 1940s. Sci. China. Earth. Sci. 59 (9), 1791–1802. doi: 10.1007/s11430-016-5317-5
Hu X. Y., Wang Y. P. (2020). Coastline fractal dimension of mainland, island, and estuaries using multi-temporal landsat remote sensing data from1978 to 2018: A case study of the pearl river estuary area. Remote. Sens. 12 (15), 2482. doi: 10.3390/rs12152482
Hu X. Y., Wang Y. P. (2022). Monitoring coastline variations in the pearl river estuary from 1978 to 2018 by integrating canny edge detection and otsu methods using long time series landsat dataset. Catena. 209 (P2), 105840. doi: 10.1016/j.catena.2021.105840
Hu R. R., Yao L. J., Yu J., Chen P. M., Wang D. L. (2021). Remote sensing of the coastline variation of the guangdong–Hongkong–Macao greater bay area in the past four decades. J. Mar. Sci. Eng. 9 (12), 1318. doi: 10.3390/jmse9121318
Kelly J. T., Gontz A. M. (2018). Using GPS-surveyed intertidal zones to determine the validity of shorelines automatically mapped by landsat water indices. Int. J. Appl. Earth. Obs. 65, 92–104. doi: 10.1016/j.jag.2017.10.007
Li X. J., Damen M. C. J. (2010). Coastline change detection with satellite remote sensing for environmental management of the pearl river estuary, China. J. Mar. Syst. 82, S54–S61. doi: 10.1016/j.jmarsys.2010.02.005
Li X., Liu J. P., Saito Y., Nguyen V. L. (2017). Recent evolution of the Mekong delta and the impacts of dams. Earth-Sci. Rev. 175, 1–17. doi: 10.1016/j.earscirev.2017.10.008
Li J. L., Pu R. L., Yuan Q. X., Liu Y. C., Feng B. X., Guo Q. D., et al. (2014). Spatiotemporal change patterns of coastlines in xiangshan harbor (Zhejiang, China) during the past 40 years. J. Coastal. Res. 34 (6), 1418–1428. doi: 10.2112/JCOASTRES-D-17-00150.1
Liu Y. X., Huang H. J., Qiu Z. F., Fan J. Y. (2013). Detecting coastline change from satellite images based on beach slope estimation in a tidal flat. Int. J. Appl. Earth. Obs. 23, 165–176. doi: 10.1016/j.jag.2012.12.005
Liu Y. L., Wang X., Ling F., Xu S., Wang C. C. (2017). Analysis of coastline extraction from landsat-8 OLI imagery. Water. 9 (11), 816. doi: 10.3390/w9110816
Li C. M., Zhu L. N., Dai Z. X., Wu Z. (2021). Study on spatiotemporal evolution of the yellow river delta coastline from 1976 to 2020. Remote. Sens. 13 (23), 4789. doi: 10.3390/rs13234789
Luan H. L., Ding P. X., Wang Z. B., Ge J. Z., Yang S. L. (2016). Decadal morphological evolution of the Yangtze estuary in response to river input changes and estuarine engineering projects. Geomorphology. 265, 12–23. doi: 10.1016/j.geomorph.2016.04.022
Machado A. A. D., Spencer K., Kloas W., Toffolon M., Zarfl C. (2016). Metal fate and effects in estuaries: A review and conceptual model for better understanding of toxicity. Sci. Total. Environ. 541, 268–281. doi: 10.1016/j.scitotenv.2015.09.045
Mikhailova M. V. (2003). Transformation of the ebro river delta under the impact of intense human-induced reduction of sediment runoff. Water. Resour. 30 (4), 370–378. doi: 10.1023/A:1024963911893
Nayak S. R., Mishra J., Palai G. (2019). Analysing roughness of surface through fractal dimension: A review. Image. Vision. Comput. 89, 21–34. doi: 10.1016/j.imavis.2019.06.015
Pajak M. J., Leatherman S. (2002). The high water line as shoreline indicator. J. Coastal. Res. 18 (2), 329–337. doi: 10.2307/4299078
Ranasinghe R., Wu C. S., Conallin J., Duong T. M., Anthony E. J. (2019). Disentangling the relative impacts of climate change and human activities on fluvial sediment supply to the coast by the world’s large rivers: Pearl river basin, China. Sci. Rep. 9, 9236. doi: 10.1038/s41598-019-45442-2
Saïdi H., Zargouni F. (2019). Sea-Level rise impact on the evolution of a microtidal Mediterranean coastline without human-made structures–a case of the port aux princes-sidi daoued coastline, gulf of Tunis, NE-Tunisia. Acta Oceanol. Sin. 38 (3), 72–77. doi: 10.1007/s13131-018-1331-0
Siegle E., Couceir M. A. A., Sousa S. H. D. E., Figueira R. C. L., Schettini C. A. F. (2019). Shoreline retraction and the opening of a new inlet: Implications on estuarine processes. Estuar. Coast. 42 (8), 2004–2019. doi: 10.1007/s12237-019-00635-w
Skilodimou H. D., Antonious V., Bathrellos G. D., Tsami E. (2021). Mapping of coastline changes in Athens Riviera over the past 76 year's measurements. Water. 13 (15), 2135. doi: 10.3390/w13152135
Stănică A., Dan S., Jiménez J. A., Ungureanu G. V. (2011). Dealing with erosion along the Danube delta coast. the CONSCIENCE experience towards a sustainable coastline management. Ocean. Coast. Manage. 54 (12), 898–906. doi: 10.1016/j.ocecoaman.2011.06.006
Sui L. C., Wang J., Yang X. M., Wang Z. H. (2020). Spatial-temporal characteristics of coastline change in Indonesia from 1990 to 2018. Sustainability. 12 (8), 3242. doi: 10.3390/su12083242
Sundblad G., Bekkby T., Isaeus M., Nikolopoulos A., Norderhaug K. M., Rinde E. (2014). Comparing the ecological relevance of four wave exposure models. Estuar. Coast. Shelf. S. 140, 7–13. doi: 10.1016/j.ecss.2014.01.008
Syvitski J. P. M., Saito Y. (2007). Morphdynamics of deltas under the influence of humans. Global. Planet. Change. 57, 261–282. doi: 10.1016/j.gloplacha.2006.12.001
Tan C., Huang B. S., Liu F., Yang Q. S., Jiang C. J., Zhang S. H. (2016). Transformation of the three largest Chinese river deltas in response to the reduction of sediment dis-charges. J. Coastal. Res. 32 (6), 1402–1416. doi: 10.2112/JCOASTRES-D-15-00007.1
Thoai D. T., Dang A. N., Oanh N. T. K. (2019). Analysis of coastline change in relation to meteorological conditions and human activities in Ca mau cape, Viet nam. Ocean. Coast. Manage. 171, 56–65. doi: 10.1016/j.ocecoaman.2019.01.007
Verdiell-Cubedo D., Torralva. M., Andreu-Soler A., Oliva-Paterna F. J. (2012). Effects of shoreline urban modification on habitat structure and fish community in littoral areas of a Mediterranean coastal lagoon (Mar menor, Spain). Wetlands. 32 (4), 631–641. doi: 10.1007/s13157-012-0296-6
Wang Y. H., Cai S. L., Yang Y. D., Zhong Z. Y., Liu F. (2021). Morphological consequences of upstream water and sediment changes and estuarine engineering activities in pearl river estuary channels over the last 50 years. Sci. Total. Environ. 765 (1), 144–172. doi: 10.1016/j.scitotenv.2020.144172
Wang C. Y., Zhang J., Song P. J. (2014). An intelligent coastline interpretation of several types of seacoasts from TM/ETM+ images based on rules. Acta Oceanol. Sin. 33 (7), 89–96. doi: 10.1007/s13131-014-0482-x
Wei X., Cai S. Q., Zhan W. K., Li Y. N. (2021). Changes in the distribution of surface sediment in pearl river estuary 1975–2017, largely due to human activity. Cont. Shelf. Res. 228, 104538. doi: 10.1016/j.csr.2021.104538
Weng Q. H. (2002). Land use change analysis in the zhujiang delta of China using satellite remote sensing, GIS and stochastic modelling. J. Environ. Manage. 64 (3), 273–284. doi: 10.1006/jema.2001.0509
Wu Z. Y., Milliman J. D., Zhao D. N., Cao Z. Y., Zhou J. Q., Zhou C. Y. (2018). Geomorphologic changes in the lower pearl river delta 1850–2015, largely due to human activity. Geomorphology. 314, 42–54. doi: 10.1016/j.geomorph.2018.05.001
Xu H. Q. (2006). Modification of normalised difference water index (NDWI) to enhance open water features in remotely sensed imagery. Int. J. Remote. Sens. 27 (14), 3025–3033. doi: 10.1080/01431160600589179
Xu J. Y., Zhang Z. X., Zhao X. L. (2014). Spatial and temporal variations of coastlines in northern china (2000–2012). J. Geogr. Sci. 24 (1), 18–32. doi: 10.1007/s11442-014-1070-x
Yang L. Z., Liu F., Gong W. P., Cai H. Y., Yu F. H., Pan H. Z. (2019). Morphological response of lingding bay in the pearl river estuary to human intervention in recent decades. Ocean. Coast. Manage. 176, 1–10. doi: 10.1016/j.ocecoaman.2019.04.011
Yang S. L., Shi Z., Zhao H. Y., Li P., Dai S. B., Gao A. (2004). Research note: Effects of human activities on the Yangtze river suspended sediment flux into the estuary in the last century. Hydrol. Earth. Syst. Sc. 8 (6), 1210–1216. doi: 10.5194/hess-8-1210-2004
Yang S. L., Zhang J., Zhu J., Smith J. P., Dai S. B., Gao A., et al. (2005). Impact of dams on y angtze river sediment supply to the sea and delta intertidal wetland response. J. Geophys. Res. 110, F03006. doi: 10.1029/2004JF000271
Ye Y. Y., Zhang H. G., Liu K., Wu Q. T. (2011). Research on the influence of site factors on the expansion of construction land in the pearl river delta, China: By using GIS and remote sensing. Int. J. Appl. Earth. Obs. 21, 366–373. doi: 10.1016/j.jag.2011.10.012
Zhang X. H., Lin J. R., Huang H. M., Deng J. J., Chen A. P. (2022). Analysis on the dynamics of coastline and reclamation in pearl river estuary in China for nearly last half century. Water. 14 (8), 1228. doi: 10.3390/w14081228
Zhang X. P., Pan D. L., Chen J. Y., Zhao J. H., Zhu Q. K., Huang H. Q. (2014). Evaluation of coastline change under human intervention using multi-temporal high-resolution images: A case study of the zhoushan islands, China. Remote. Sens. 6 (10), 9930–9950. doi: 10.3390/rs6109930
Zhang W., Wei X. Y., Zheng J. H., Zhu Y. L., Zhang Y. J. (2012). Estimating suspended sediment loads in the pearl river delta region using sediment rating curves. Cont. Shelf. Res. 38, 35–46. doi: 10.1016/j.csr.2012.02.017
Zhang W., Xu Y., Hoitink A. J. F., Sassi M. G., Zheng J. H., Chen X. W., et al. (2015). Morphological change in the pearl river delta, China. Mar. Geol. 363, 202–219. doi: 10.1016/j.margeo.2015.02.012
Zheng Z. H., Wu Z. F., Chen Y. B., Yang Z. W., Marinello F. (2020). Exploration of eco-environment and urbanization changes in coastal zones: A case study in China over the past 20 years. Ecol. Indic. 119, 106847. doi: 10.1016/j.ecolind.2020.106847
Zhu M. S., Sun T., Shao D. D. (2016). Impact of land reclamation on the evolution of coastline change and nearshore vegetation distribution in Yangtze river estuary. Wetlands. 36, S11–S17. doi: 10.1007/s13157-014-0610-6
Keywords: coastline variation, multiple human activities, driving factors, remote sensing, Pearl River Estuary
Citation: Li X, Yan H, Yang Y, Xu Z and Yang H (2022) Spatiotemporal coastline variations in the Pearl River Estuary and the relationship with multiple human disturbances. Front. Mar. Sci. 9:1032105. doi: 10.3389/fmars.2022.1032105
Received: 30 August 2022; Accepted: 21 October 2022;
Published: 08 November 2022.
Edited by:
Tian Xie, Beijing Normal University, ChinaReviewed by:
Zutao Yang, Stanford University, United StatesCopyright © 2022 Li, Yan, Yang, Xu and Yang. This is an open-access article distributed under the terms of the Creative Commons Attribution License (CC BY). The use, distribution or reproduction in other forums is permitted, provided the original author(s) and the copyright owner(s) are credited and that the original publication in this journal is cited, in accordance with accepted academic practice. No use, distribution or reproduction is permitted which does not comply with these terms.
*Correspondence: Ying Yang, yangying@dgut.edu.cn
Disclaimer: All claims expressed in this article are solely those of the authors and do not necessarily represent those of their affiliated organizations, or those of the publisher, the editors and the reviewers. Any product that may be evaluated in this article or claim that may be made by its manufacturer is not guaranteed or endorsed by the publisher.
Research integrity at Frontiers
Learn more about the work of our research integrity team to safeguard the quality of each article we publish.