 Yan Jiang
- 1State Key Laboratory of Marine Environmental Science, College of Ocean and Earth Sciences, Xiamen University, Xiamen, China
- 2Fishery Resources Monitoring Center of Fujian Province, Fuzhou, China
- 3Shenzhen Marine Environment Monitoring Center, State Oceanic Administration of China, Shenzhen, China
Sansha Bay (26.40−27.00°N, 119.50−120.20°E) is a typical semi-enclosed bay, located in northern Fujian Province, China, and adjacent to the East China Sea. The ichthyoplankton species composition and assemblage structure were investigated based on monthly sampling at 25 stations in April−September 2019, covering the important spring and summer spawning seasons in the region. Sampling was conducted in the first 3−5 days of the full moon or new moon phases using a standard plankton net through horizontal and vertical tows during daytime. In total, 25,819 ichthyoplankton samples were collected, of which 25,449 samples (i.e., 24,757 eggs and 692 larvae) were from horizontal tows. For horizontal tow samples, the ichthyoplankton were classified into 58 taxa in 15 orders and 23 families with a combination of external morphology and DNA barcoding analyses, from pelagic to demersal and benthic species. The dominant order was the Gobiiformes, including 23 species (39.7% of all species). The dominant taxa, in terms of relative abundance and frequency of occurrence, consisted of commercially important fishes, such as Setipinna tenuifilis (Valenciennes, 1848) (Engraulidae), Epinephelus akaara (Temminck and Schlegel, 1842) (Serraenidae), Collichthys lucidus (Richardson, 1844), Nibea albiflora (Richardson, 1846) (Sciaenidae), Acanthopagrus schlegelii (Bleeker, 1854), and Pagrus major (Temminck and Schlegel, 1843) (Sparidae), accounting for 78.9% of the horizontal tow samples. Low-valued and small-sized fishes, such as Stolephorus commersonnii Lacepède, 1803 (Engraulidae), Solea ovata Richardson, 1846 (Soleidae), Nuchequula nuchalis (Temminck and Schlegel, 1845), and Photopectoralis bindus (Valenciennes, 1835) (Leiognathidae), were also dominant species, accounting for 11.4% of the horizontal tow samples. The ichthyoplankton assemblage was categorized into five different temporal assemblages based on the cluster and nonmetric multidimensional scaling analysis, namely, April, May, June, July, and August−September (ANOSIM, Global R = 0.656, p < 0.01) with the highest density and richness of ichthyoplankton occurred in May. The spatial distribution pattern showed that the high density (ind./m3) of ichthyoplankton occurred mainly in S12–S25 in Guanjingyang and along the Dongchong Peninsula coastline into Dongwuyang, while low density occurred mainly in S01–S11 in the northwest waters of Sandu Island (ANOVA, F = 8.270, p < 0.05). Temperature, salinity, and chlorophyll a were key factors structuring the ichthyoplankton assemblages in Sansha Bay. In addition, this study revealed the changes of the ichthyoplankton composition, density, and spatial distribution in Sansha Bay over the past three decades.
Introduction
Fishes have various life stages, and different developmental stage requires different foods, habitats, and environmental factors (Rijnsdorp et al., 2009; Hamre et al., 2013; Petitgas et al., 2013; Madeira et al., 2020). For example, ripe fishes are sensitive to the hydrological conditions of the spawning grounds, such as current, tide, water temperature, salinity and dissolved oxygen, and prey availability and preference (MacKenzie et al., 1996; Costa et al., 2002). Ichthyoplankton include fish eggs and larvae, belonging to the early life stages. Due to their absence of or weakness on independent swimming capabilities, ichthyoplankton have a drifting nature with currents and tides (Lechner et al., 2016; Downie et al., 2020). Understanding the distribution patterns of different life stages and exploring the abiotic and biotic factors influencing the distribution patterns are crucial for assessing fish recruitment and stock restoration (Costa et al., 2002; Santos et al., 2017). Achieving the sustainability of fishery resources depends highly on the abundance and survival of fish eggs and larvae (Oeberst et al., 2009; Llopiz et al., 2014).
The identification of unambiguous species from fish eggs and larvae is challenging. It is mainly because of the high diversity of species of fishes and the limitation of morphological observation on different stages of eggs and larvae before metamorphosis (Li et al., 2014; Zhang et al., 2015; Hsieh et al., 2016). For example, eggs and larvae of Sciaenidae are difficult to identify to species level through morphological features (Zhang et al., 1985; Zhan et al., 2016), besides the challenges for identification of adult sciaenids (Chu et al., 1963). DNA barcode, which delimits species using a molecular marker (e.g., mitochondrial cytochrome c oxidase subunit I gene, COI), has been widely applied to facilitate the identification in all stages from egg to adult of fishes (Ward et al., 2005; Ko et al., 2013; Becker et al., 2015; Harada et al., 2015; Hou et al., 2021a). In recent studies, Kerr et al. (2020) successfully identified 564 fish eggs to 89 taxa collected from northwestern Cuba and across the Florida Straits using DNA barcode. Hou et al. (2021a) successfully identified 931 fish eggs and 229 larvae to 75 taxa collected from the Pearl River Estuary of China using a DNA barcode. However, identifying ichthyoplankton correctly through DNA barcoding relies highly on a powerful and accurate database. It is necessary, but still challenging, to build up a DNA barcoding library in a specific area.
The transitional region between the East China Sea and the South China Sea through the Taiwan Strait, Fujian Province, has a highly sinuated coastline forming many bays with some typically semi-closed by peninsulas (Yu et al., 1988). In terms of volumes of the marine capture fisheries, Fujian Province ranks third in China, contributing to approximately 15.6% of the national total marine capture volumes or 16.8% of the national total marine fish capture volumes in the past decade, 2010−2019 (MOA, 2010–2018; MARA, 2019). Sansha Bay (26.40−27.00°N, 119.50−120.20°E) is located in Fujian Province (Figure 1A) and connects with the East China Sea through the narrow Dongchong Channel of about 3 km in width (Figure 1B). This typical semi-enclosed bay is well-known because it was one of the 12 traditional spawning grounds along Chinese coastal waters for the large yellow croaker Larimichthys crocea (Richardson, 1846) (Sciaenidae) before the 1990s, a commercially important species that formed large spawning aggregations (Chu, 1985; Liu and Sadovy de Mitcheson, 2008). With the mariculture and industrial development since the 1990s, marine pollution has been exacerbated in Sansha Bay (Wang et al., 2019). The current status of Sansha Bay as L. crocea spawning ground function is unclear.
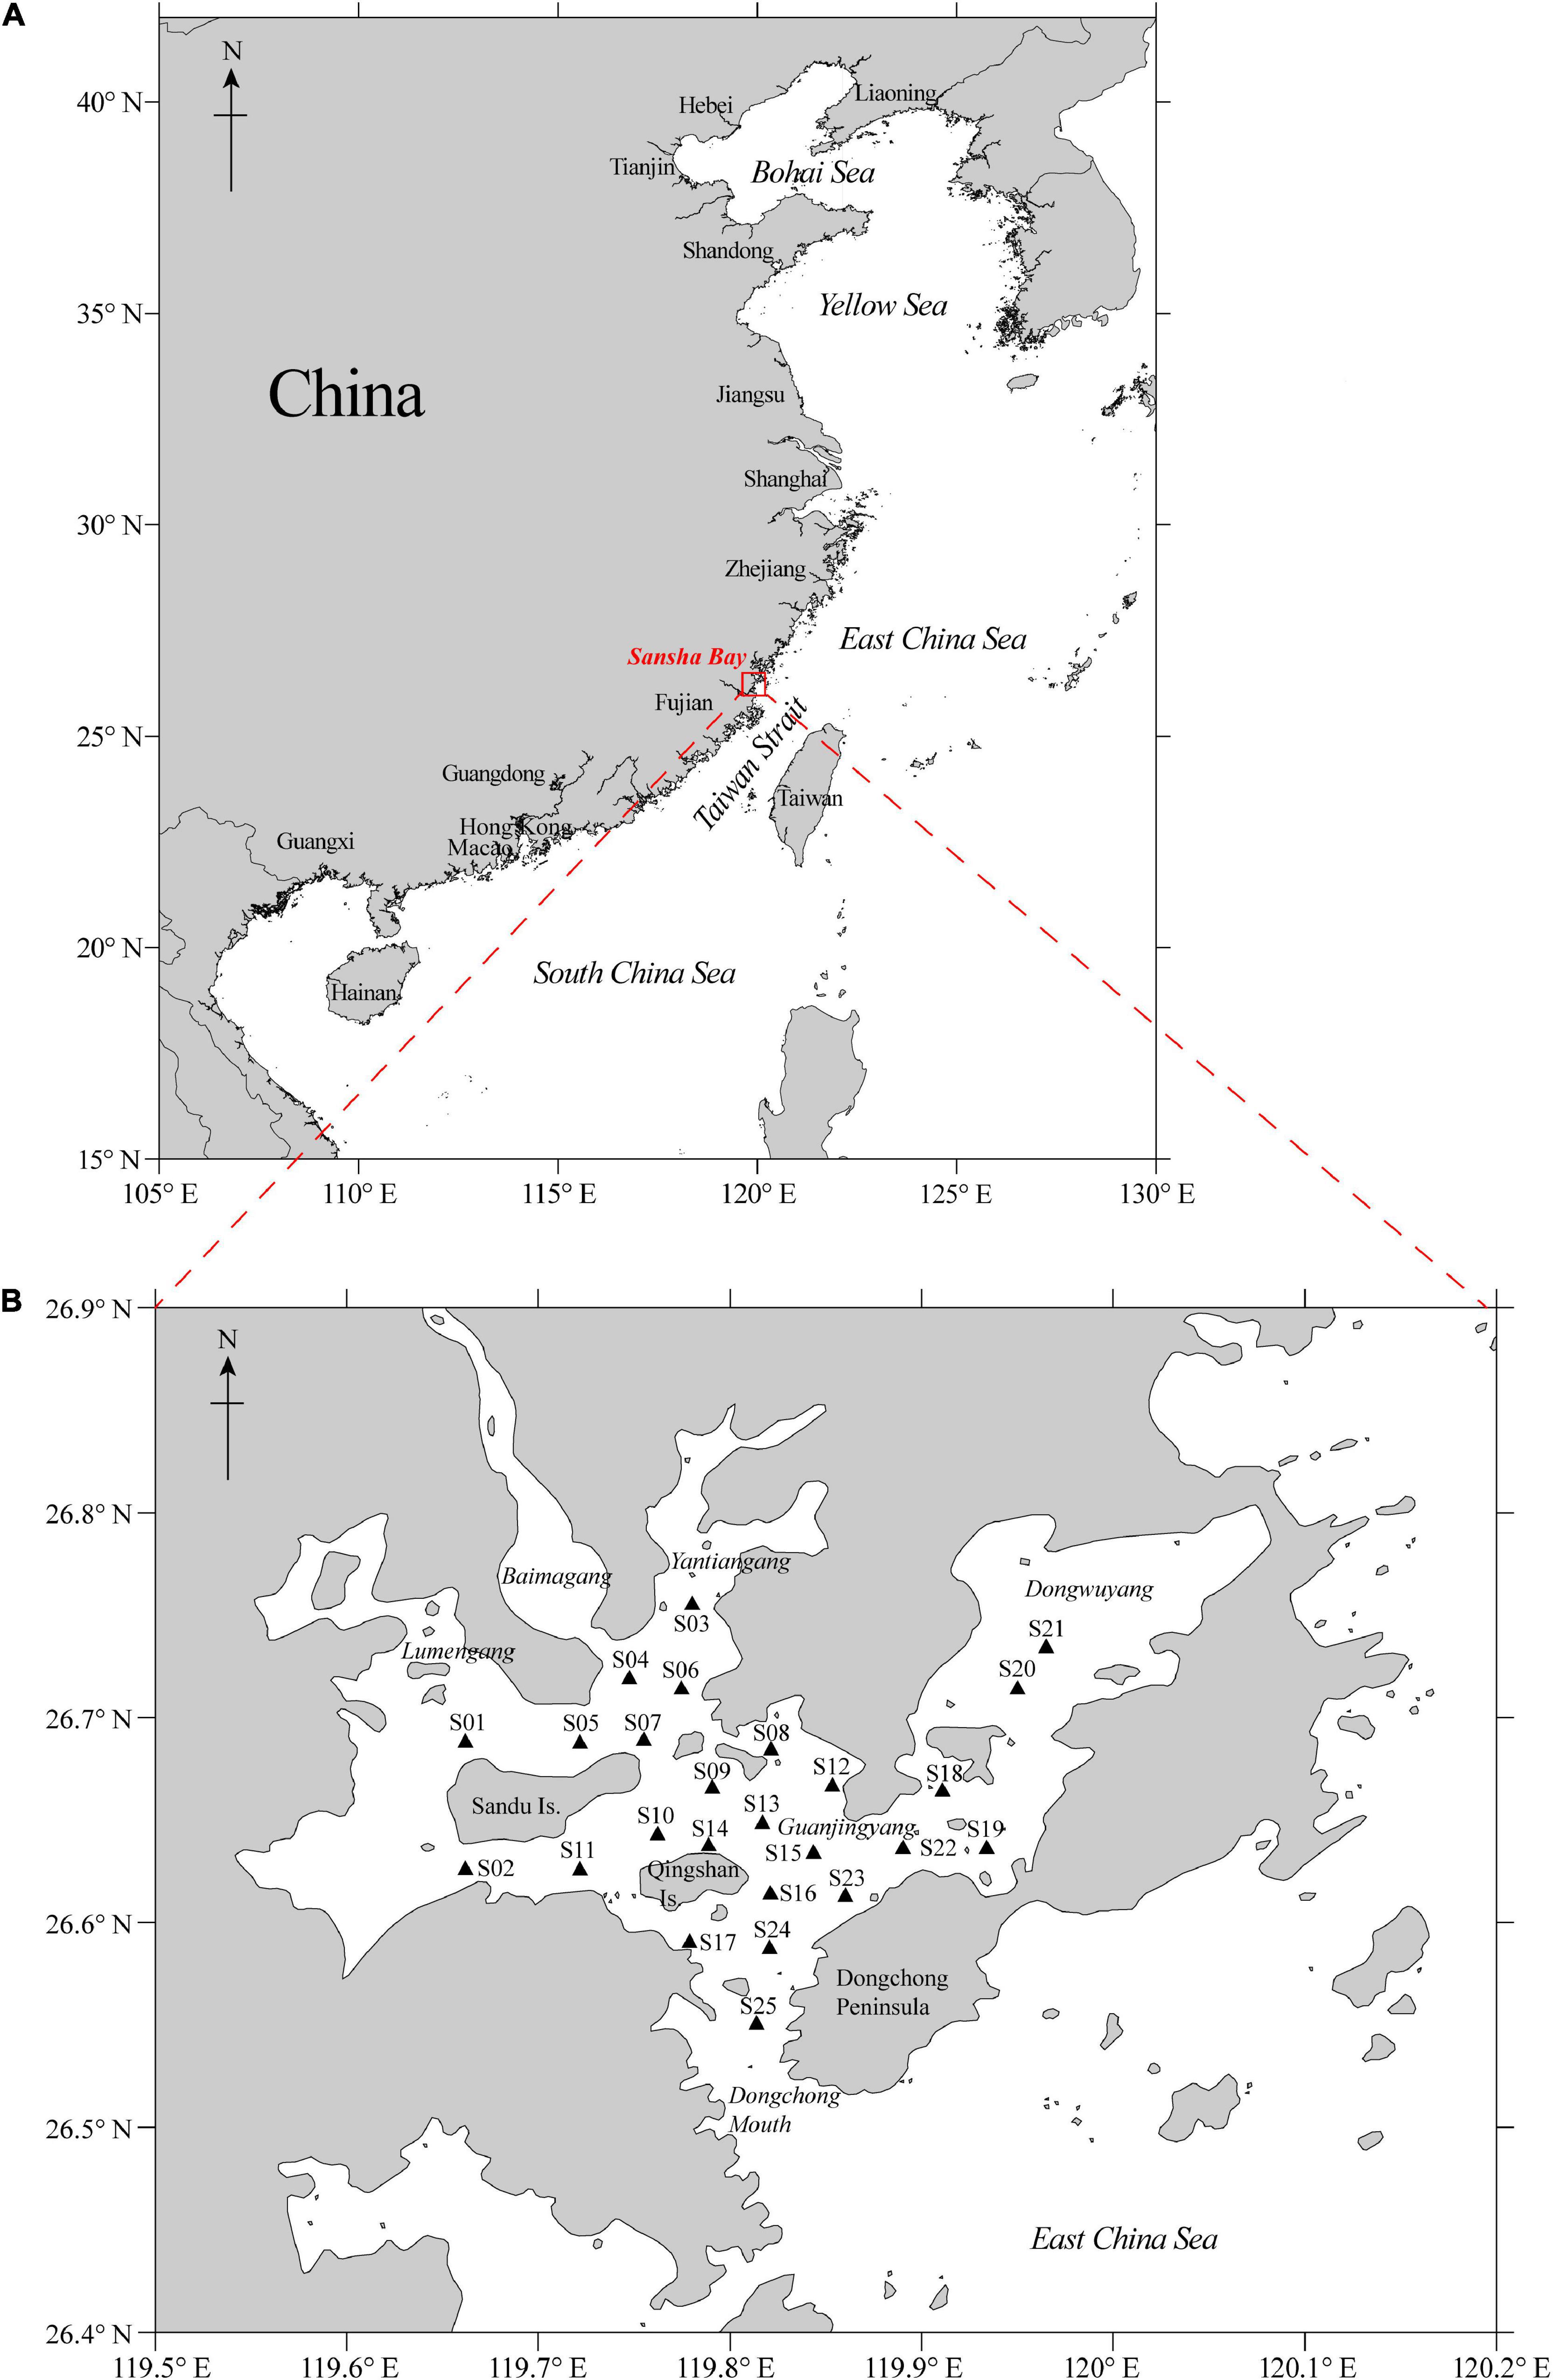
Figure 1. (A) Map of mainland China and (B) ichthyoplankton sampling stations (n = 25) in Sansha Bay, Fujian Province, China.
In Sansha Bay, species composition and assemblages of ichthyoplankton, which are essential for the estimation of spawning sites, reproductive seasons, and conservative strategies (Parrish et al., 1981; Bailey and Houde, 1989; Oliveira and Ferreira, 2008), remain insufficient attention. Species composition and temporal and spatial distribution of fish eggs and larvae were investigated only four times (i.e., 1990, 2007, 2008, and 2010) historically, mainly seasonally, and the samples were identified by external morphology only (Dai, 2006; Wang et al., 2010; Shen, 2011; Xu, 2018), which may lead to the missing of certain species and underestimate the diversity of the real species. The results of these previous studies showed that Sansha Bay was important for fish reproduction, and fish egg and larva density (ind./m3) were high in spring and summer. Moreover, the ichthyoplankton abundance of traditionally important fishery species showed dramatic declines over years. It merits further monthly and accurate studies with multiple identification methods and a high spatial coverage to evaluate the current status and long-term dynamics of ichthyoplankton assemblages in Sansha Bay.
In this study, we designed 25 stations throughout Sansha Bay for the ichthyoplankton collection. We conducted sampling monthly from April to September in 2019 covering the peak spawning seasons (i.e., spring and summer) mentioned earlier and applied DNA barcoding technique for species identification after external morphology examination, aiming to obtain a relative accurate species composition, to provide detailed characteristics of the ichthyoplankton assemblages, and to analyze the influence of abiotic and biotic variables on the distribution of ichthyoplankton in Sansha Bay. The results can be used to evaluate the current status of this traditional spawning ground and to compare the changes of ichthyoplankton composition and spatial distribution over the past three decades in Sansha Bay.
Materials and Methods
Ichthyoplankton Collection
Ichthyoplankton samples were collected from 25 stations (S01−S25) (26.50−26.85°N, 119.52−120.09°E) in Sansha Bay, Fujian Province of China (Figure 1B). The sampling was conducted monthly from April to September 2019 within the first 3−5 days of the full moon or new moon phases during daytime.
The standard plankton net used for horizontal tows is 80 cm in net opening diameter (i.e., 0.5 m2 net opening area) and 505 μm in net mesh size (GB/T 12763.6, 2007). At each station, the net was towed horizontally right below the sea surface with the speed of approximately 2 km for 5−10 min.
The standard plankton net used for vertical tows is 50 cm in net opening diameter (i.e., 0.2 m2 net opening area) and 505 μm in net mesh size (GB/T 12763.6, 2007).
On board, ichthyoplankton samples collected were fixed with the formaldehyde concentration of 5%. The samples were further transferred to 95% ethanol solution within 12 h for the purpose of DNA barcoding.
Collection of Abiotic and Biotic Factors
Sea surface temperature, salinity, dissolved oxygen, and pH were measured using YSI EXO2 Multiparameter Sonde during plankton sampling at each station.
Chlorophyll a (Chla) samples were collected and analyzed in the laboratory through fluorospectrophotometry within 24 h. For a sampling of vertical phytoplankton, the standard plankton net used is 37 cm in net opening diameter (i.e., 0.1 m2 net opening area) and 77 μm in net mesh size (GB/T 12763.6, 2007). On board, phytoplankton samples were fixed in Lugol’s iodine solution with a concentration of 10%. For a sampling of vertical zooplankton, the standard plankton net used is the same as the vertical ichthyoplankton collection above. On board, zooplankton samples were fixed in the formaldehyde solution with a concentration of 5%.
Ichthyoplankton and Plankton Identification
In the laboratory, all fish eggs and larvae collected were sorted and pooled under a dissecting microscope (Zeiss Stemi 2000-C, Germany) according to the external morphological features (Zhang et al., 1985; Shao et al., 2001; Wan and Zhang, 2016). For each egg or larva with a specific morphological feature, photo images were collected using the Leica M165FC Fluorescent Stereo Microscope and Canon EOS 600D Digital SLR Camera, and one or more samples were selected for DNA extraction and barcode COI fragment obtaining. Sizes of eggs and larvae were not measured because they were fixed and dehydrated in 95% ethanol solution for at least 2 months before sorting.
Genomic DNA was extracted using the Takara MiniBEST Universal Genomic DNA Extraction Kit Ver. 5.0 according to manufacturer specifications and further used with no dilution for amplification and sequencing. A PCR was conducted, and the COI fragment was amplified using three universal COI gene primer pairs (i.e., LCO1490−HCO2198, FishF1−FishR1, and FishF2−FishR2) (Folmer et al., 1994; Ward et al., 2005) to obtain the target COI gene fragment (about 630 bp). For each PCR product, sequencing was performed using both corresponding forward and reverse primers that are used for PCR (Sangon Biotech, China).
Raw sequences were assembled using Bioedit 7.2. Assembled sequences of fish eggs and larvae were identified using reference sequences published in GenBank (NCBI)1 or by the Barcode of Life Data System.2 To assign a sequence to a species, genus, or family level, we required that the sequence matches with the database by at least 99.60, 91.29, or 85.48%, respectively (Hou et al., 2017). All sequences were further confirmed by ML and NJ phylogenetic trees with sequences from the GenBank and BOLD system using MEGA 6.06 with 1,000 bootstrap pseudo-replications. Categorization of species taxonomy was followed as suggested by Nelson et al. (2016).
Moreover, phytoplankton and zooplankton samples collected were identified based on the external morphology under a microscope (Liu et al., 2020a), following the taxonomic books in the region (Guo, 2003; Lin, 2009; Zhang et al., 2010; Ding, 2013; Slotwinski et al., 2014; Sun et al., 2015).
Plankton Calculations
In the laboratory, the densities of ichthyoplankton (i.e., eggs and larvae) from horizontal tows were standardized:
where A is the density of ichthyoplankton (ind./m3), N is the number of ichthyoplankton (individuals) per plankton net, and V is the seawater volumes filtered into the plankton net (m3).
V was calculated by a flow meter (HYDRO-BIOS) attached to the center of the plankton net:
where R is the number of revolution noted from HYDRO-BIOS, 0.3R means that when the flow meter rotates one number, the net moves 0.3 m based on HYDRO-BIOS product manual, and S is the net opening area (m2).
The dominant species of ichthyoplankton (i.e., eggs and larvae together) from horizontal tows were determined using the Index of Relative Importance (IRI) (Pinkas et al., 1971; Zhu et al., 2002):
where N% and F% are relative abundance and frequency of occurrence of a specific species, respectively. Species with IRI ≥ 0.02 were considered to be a dominant species.
The three diversity indices, namely, the Shannon-Wiener diversity index (H′), Pielou’s evenness index (J′), and Margalef’s richness index (d), were calculated (Margalef, 1958; Shannon and Wiener, 1963; Pielou, 1966) to evaluate the current status of ichthyoplankton in Sansha Bay:
where S is the total number of ichthyoplankton species, N is the total number of individuals, and Pi is the proportion of the number of individuals for a specific ichthyoplankton species to the total number of individuals.
In addition, densities of phytoplankton and zooplankton from vertical tows were also calculated as for ichthyoplankton aforementioned:
where A is the density of phytoplankton (cells/m3) or zooplankton (ind./m3), N is the number of phytoplankton (cells) or zooplankton (individuals) per plankton net, and V is the seawater volumes filtered into the plankton net (m3).
Data Analysis
We used only data from horizontal tows for further analyses for at least two reasons. First, the number of eggs and larvae and diversity of ichthyoplankton species from horizontal tows were much higher than those of vertical tows in sampling during every month. Second, the depths of sampling stations varied largely from as shallow as 1 m to about 40 m. Therefore, the seawater volumes filtered into the vertical tow nets varied largely that it subsequently influenced the number of eggs and larvae and the diversity of ichthyoplankton species collected. The vertical tow samples were only used for species diversity supplements.
For the data analysis below and specific calculation above (e.g., IRI), we combined the number of egg and larva samples together (Zhang et al., 2016; Huang et al., 2017; Hou et al., 2021a). A short hatchery period (i.e., hours to several days) and limited independent swimming capability of larvae were also the considerations for the combination of egg and larva data for analyses (Woynarovich and Horváth, 1984; Pauly and Pullin, 1988; Lechner et al., 2016; Downie et al., 2020).
The one-way ANOVA test was conducted with the IBM SPSS Statistics version 16.0 for revealing the significance of the monthly changes of environmental factors, the diversity indices, the spatial variation of average ichthyoplankton density, and the variation of average species richness among 25 stations; when necessary (ANOVA, p < 0.05, n > 2), a post hoc least significant difference (LSD) test was added. The cluster analysis and nonmetric multidimensional scaling (nMDS) based on the Bray-Curtis similarity and square root average density of ichthyoplankton were performed to clarify the temporal and spatial distribution patterns of the assemblages. After the cluster analysis, the tests for identifying the discrimination between two observed sample clusters (SIMPEROF) and the similarities (ANOSIM) were performed using PRIMER version 6.0 to assess the significance and discrimination between sample clusters (Clarke and Gorley, 2006).
The detrended correspondence analysis (DCA) and canonical correlation analysis (CCA) or redundancy analysis (RDA) were performed using CANOCO version 5.0 to analyze the constrained relationships between environmental factors and ichthyoplankton communities. Before the analysis, DCA was performed to determine a suitable response according to the maximum gradient of length (>4, CCA; 3−4, CCA or RDA; <3, RDA) (Šmilauer and Lepš, 2014). Because the maximum gradient length of DCA was 6.34 (>4), CCA was subsequently selected in this study. Only species that occurred in >10% of the catches, based on all species density, were included in the analysis to reduce the effect of rare species. Data of species density were log (10,000x + 1) transformed to minimize the dominant effect of some species (Clarke et al., 2014). A Monte Carlo permutation test with 999 permutations was performed to confirm the key factors significantly affecting the assemblages (p ≤ 0.05; Arora and Mehra, 2009; Hou et al., 2021a). The variance inflation factor (VIF) was conducted to examine the collinearity between independent environment variables. VIF < 10 indicated that the environmental variables were not collinear and were fit for CCA (Graham, 2003; Huang et al., 2017). The importance of the environmental variables was measured by interset correlation coefficients, when the value of interset correlation coefficients ≥| ±0.4| variables were regarded conservatively as biologically important (Rakocinski et al., 1996; Ramos et al., 2017).
Results
Abiotic and Biotic Factors
From April to September 2019, with the significant increase of sea surface temperature (F = 290.20, p < 0.05), salinity also showed an upward trend (F = 36.15, p < 0.05), while dissolved oxygen (F = 168.23, p < 0.05) and pH (F = 283.25, p < 0.05) illustrated a downward trend (Table 1).
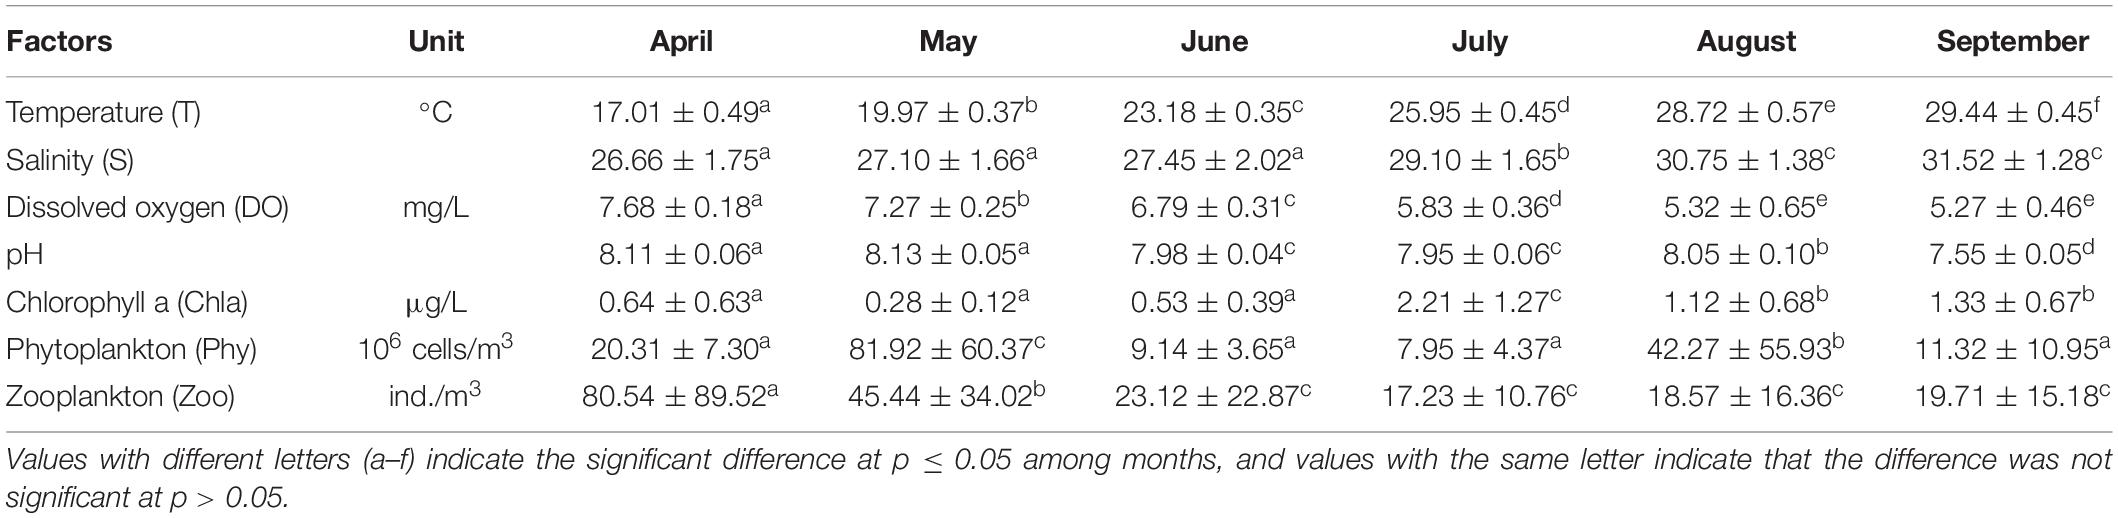
Table 1. Temporal variation in abiotic and biotic factors (mean ± SD, n = 25 stations) from April to September 2019 in Sansha Bay of Fujian Province, China.
Chla peaked in July, with significant intermonth variations (F = 22.91, p < 0.05), and the densities of phytoplankton (F = 17.47, p < 0.05) and zooplankton (F = 8.908, p < 0.05) peaked in May and April, respectively (Table 1).
Ichthyoplankton Composition
A total of 25,449 ichthyoplankton samples, including 24,757 fish eggs and 692 larvae, were collected from horizontal tows. A total of 370 ichthyoplankton samples, including 315 eggs and 55 larvae, were collected from vertical tows. The numbers of eggs and larvae from horizontal tows were much higher than those of vertical tows.
According to different morphological features, 619 fish eggs and 192 larvae were selected for photography and further DNA extraction, from which high-quality COI fragments were obtained from 335 fish eggs (54.1%) and 117 larvae (60.9%). In total, 60 taxa were identified, 52 at species level, including 26 from eggs and 43 from larvae (Supplementary Table 1).
From horizontal tows, 58 taxa were identified from 15 orders, 23 families with 51 taxa at species level; Gobiiformes was the most diverse order, representing 39.7% of all taxa (Supplementary Table 1 and Supplementary Figure 1). Additionally, four larvae were identified at the genus level (i.e., Pseudogobius and Rhinogobius in Gobiiformes, Hyporhamphus in Beloniformes, and Hippichthys in Syngnathiformes), and three larvae at the family level (i.e., Gobiidae in Gobiiformes and Blenniidae in Blenniformes).
From vertical tows, 31 taxa were identified from 9 orders, 13 families with 27 at the species level, 3 at the genus level, and 1 at the family level (Supplementary Table 2). Among these, 29 taxa were also recorded in horizontal tow samples, and only two species [i.e., Acentrogobius sp. and Lateolabrax japonicus (Cuvier, 1828)] were only found in vertical tow samples. Eggs and larvae of two alien species, the red drum Sciaenops ocellatus (Linnaeus, 1766) (Sciaenidae) in Acanthuriformes and the gilthead seabream Sparus aurata (Linnaeus, 1758) (Sparidae) in Spariformes, were collected in horizontal tows, S. ocellatus eggs in August and September and S. aurata larvae in June (Supplementary Table 1). Eggs and larvae of L. crocea, a critically endangered species in the IUCN Red List, were collected in April−June in horizontal and vertical tows (Supplementary Tables 1, 2).
Ichthyoplankton from Engraulidae (two species), Soleidae (one species), Serranidae (one species), Leiognathidae (two species), Sciaenidae (two species), and Sparidae (two species) were dominant (IRI ≥ 0.02; Table 2 and Supplementary Table 1), accounting for 90.3% of the horizontal tow samples. The yellow drum Nibea albiflora (Richardson, 1846) was dominant in May−September 2019 with a peak of IRI in September (IRI = 0.51).
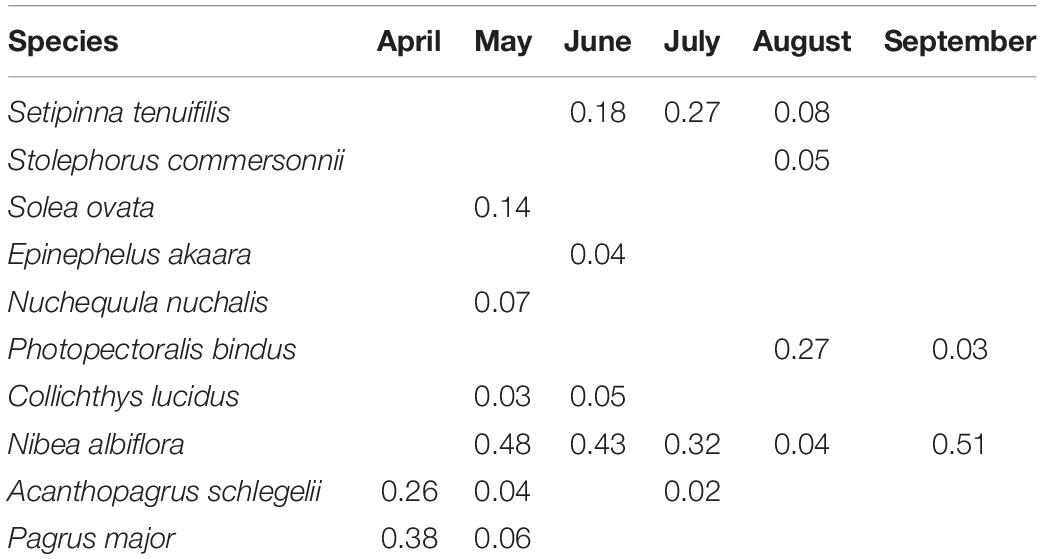
Table 2. Dominant ichthyoplankton species (IRI ≥ 0.02) from April to September 2019 in Sansha Bay of Fujian Province, China.
The three diversity indices showed significant differences from April to September (H′: F = 10.39, p < 0.05; J′: F = 2.54, p < 0.05; d: F = 16.14, p < 0.05; Figure 2). The highest H′ and d were found in May, while the lowest H′ and d were found in September; J′ in August was significantly higher than the other months.
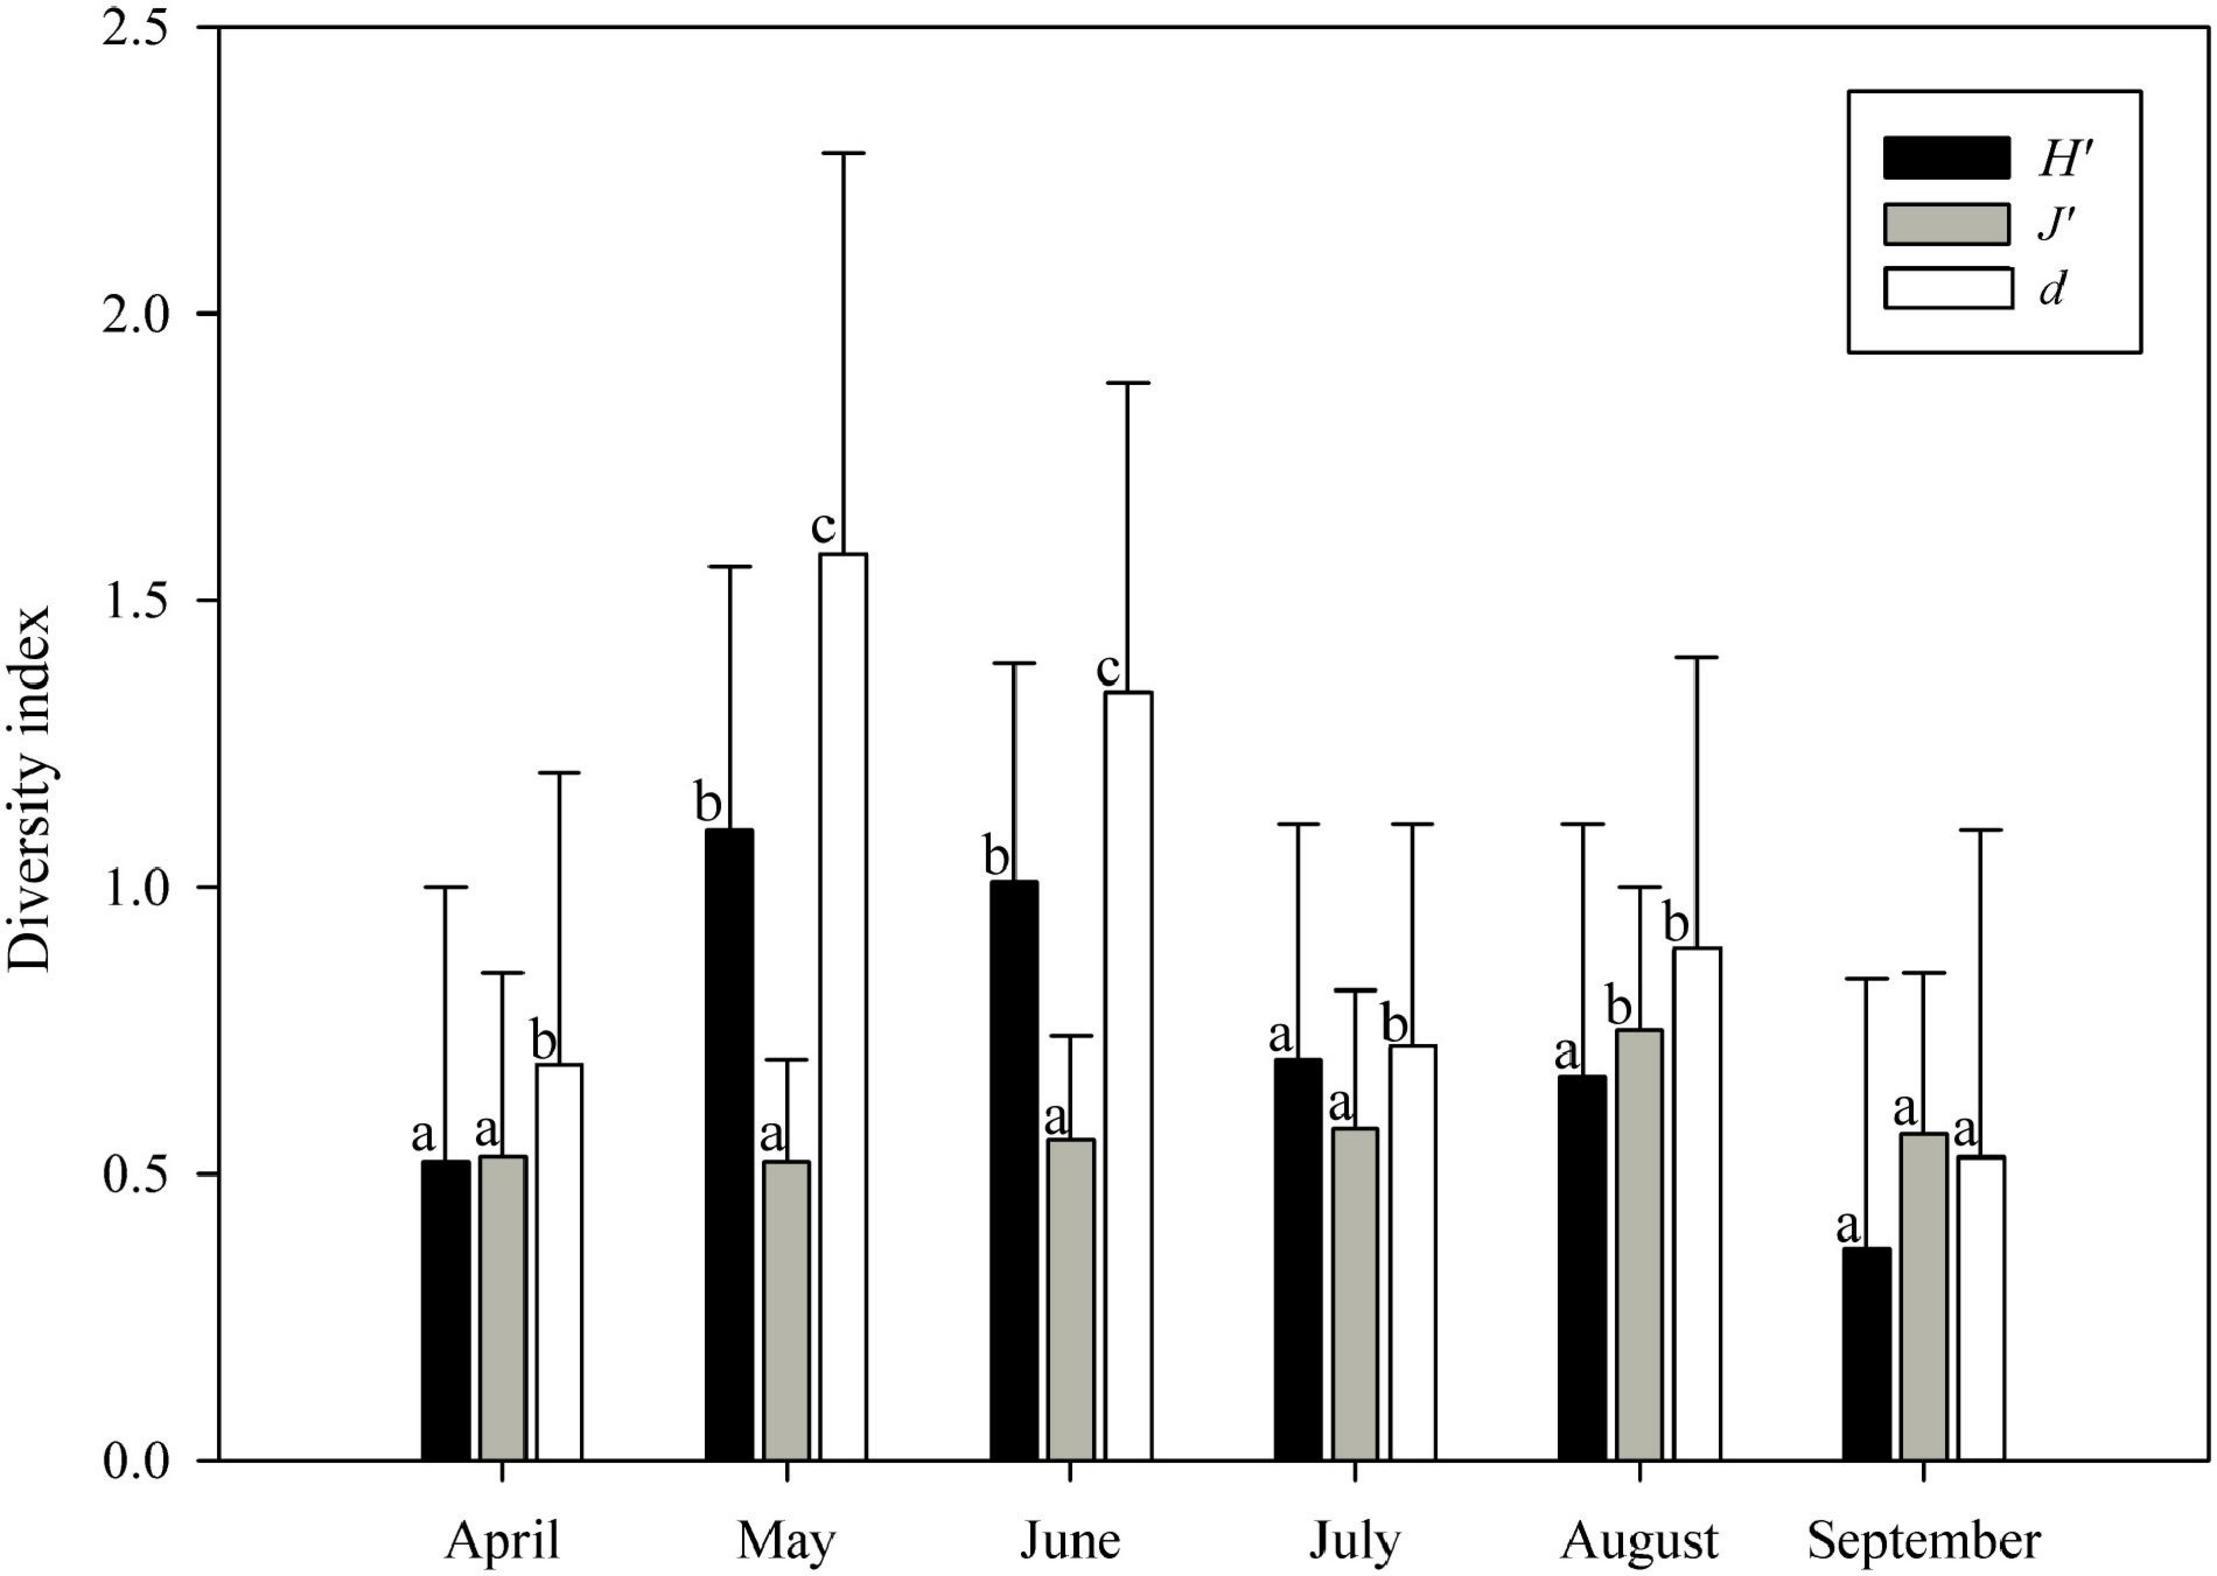
Figure 2. Temporal variation of the three ichthyoplankton diversity indices (mean + standard deviation [SD], n = 25 stations) from April to September 2019 in Sansha Bay. H′, Shannon-Wiener diversity index; J′, Pielou’s evenness index; d, Margalef’s richness index. Values with different letters (a–c) indicate the significant difference at p ≤ 0.05 among months, and values with the same letter indicate that the difference was not significant at p > 0.05.
Temporal and Spatial Distribution Pattern of Ichthyoplankton
The ichthyoplankton richness ranged from 11 species (July) to 32 species (May) in horizontal tows (Supplementary Table 1). The average density of ichthyoplankton ranged from 0.18 ind./m3 (August) to 2.10 ind./m3 (May) (Figure 3).
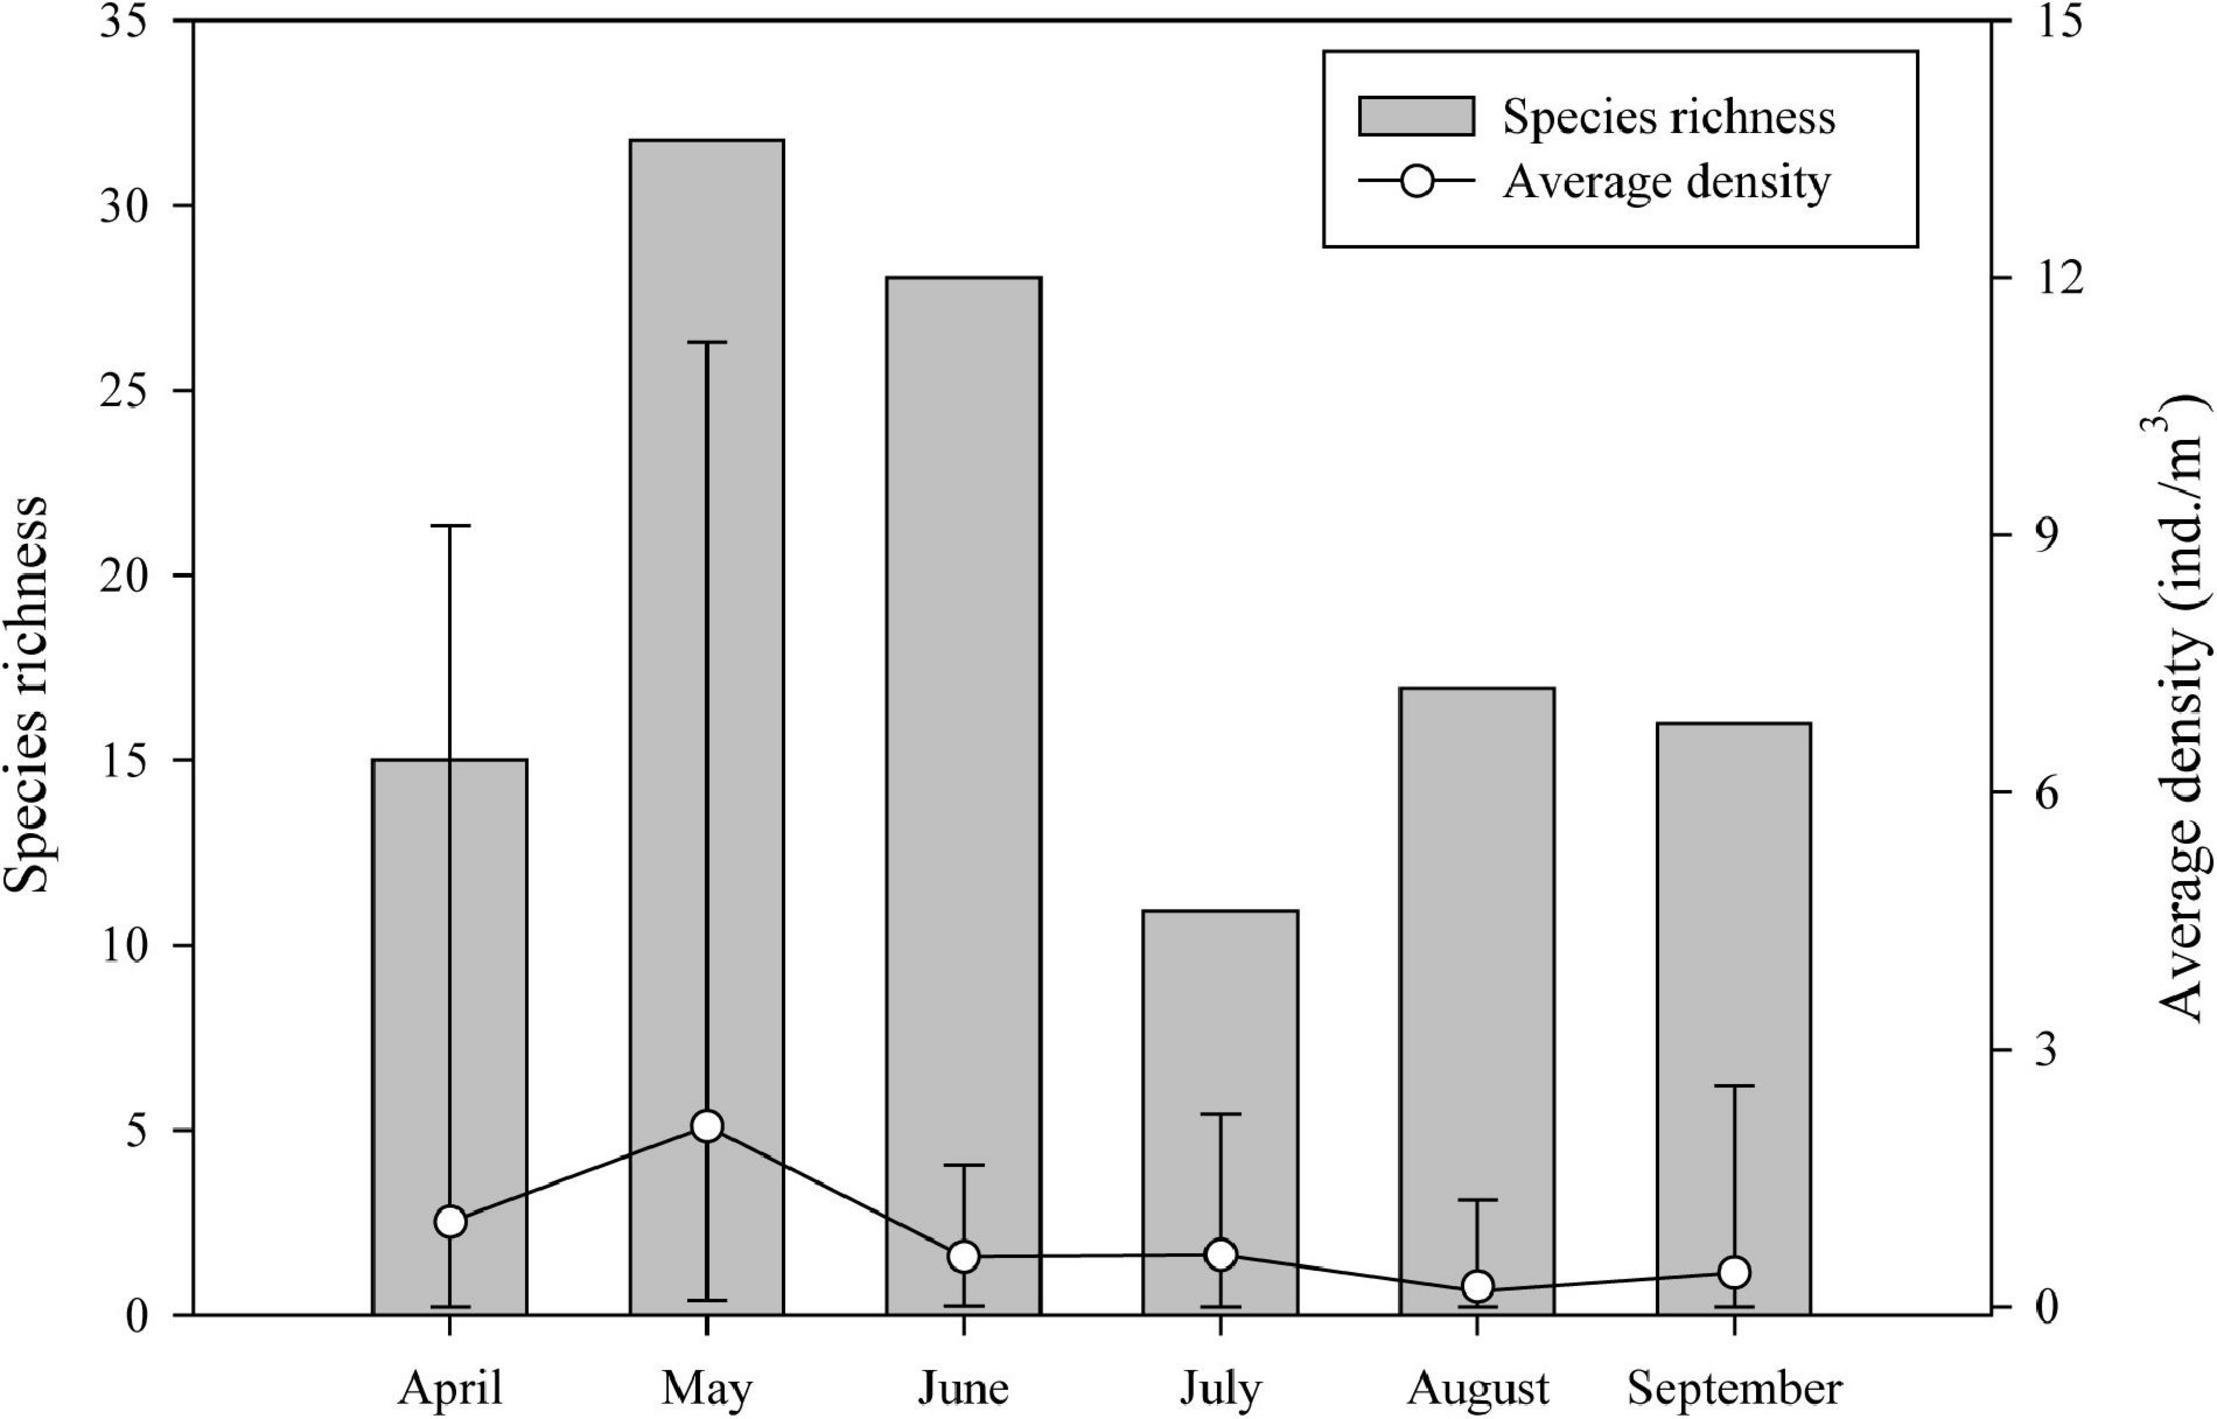
Figure 3. Temporal distribution of the ichthyoplankton richness and average density (ind./m3) (n = 25 stations) from April to September 2019 by horizontal tows in Sansha Bay of Fujian Province, China. Error bars: maximum and minimum densities.
The ichthyoplankton were classified into five representative assemblages in the Bray-Curtis similarity at 36.79% (p = 0.001), namely, April, May, June, July, and August−September (Figure 4A). The results of nMDS (Figure 4B) are consistent with those of the cluster analysis at the stress value < 0.2, illustrating the reliability of the results (Clarke et al., 2014). The R-statistic values by ANOSIM revealed the dissimilarity between the five assemblages over time (sample statistic: Global R = 0.656, p = 0.001; Supplementary Table 3). The ichthyoplankton assemblages of April, May, June, and July differed significantly from August and September, and no significant difference was found between August and September.
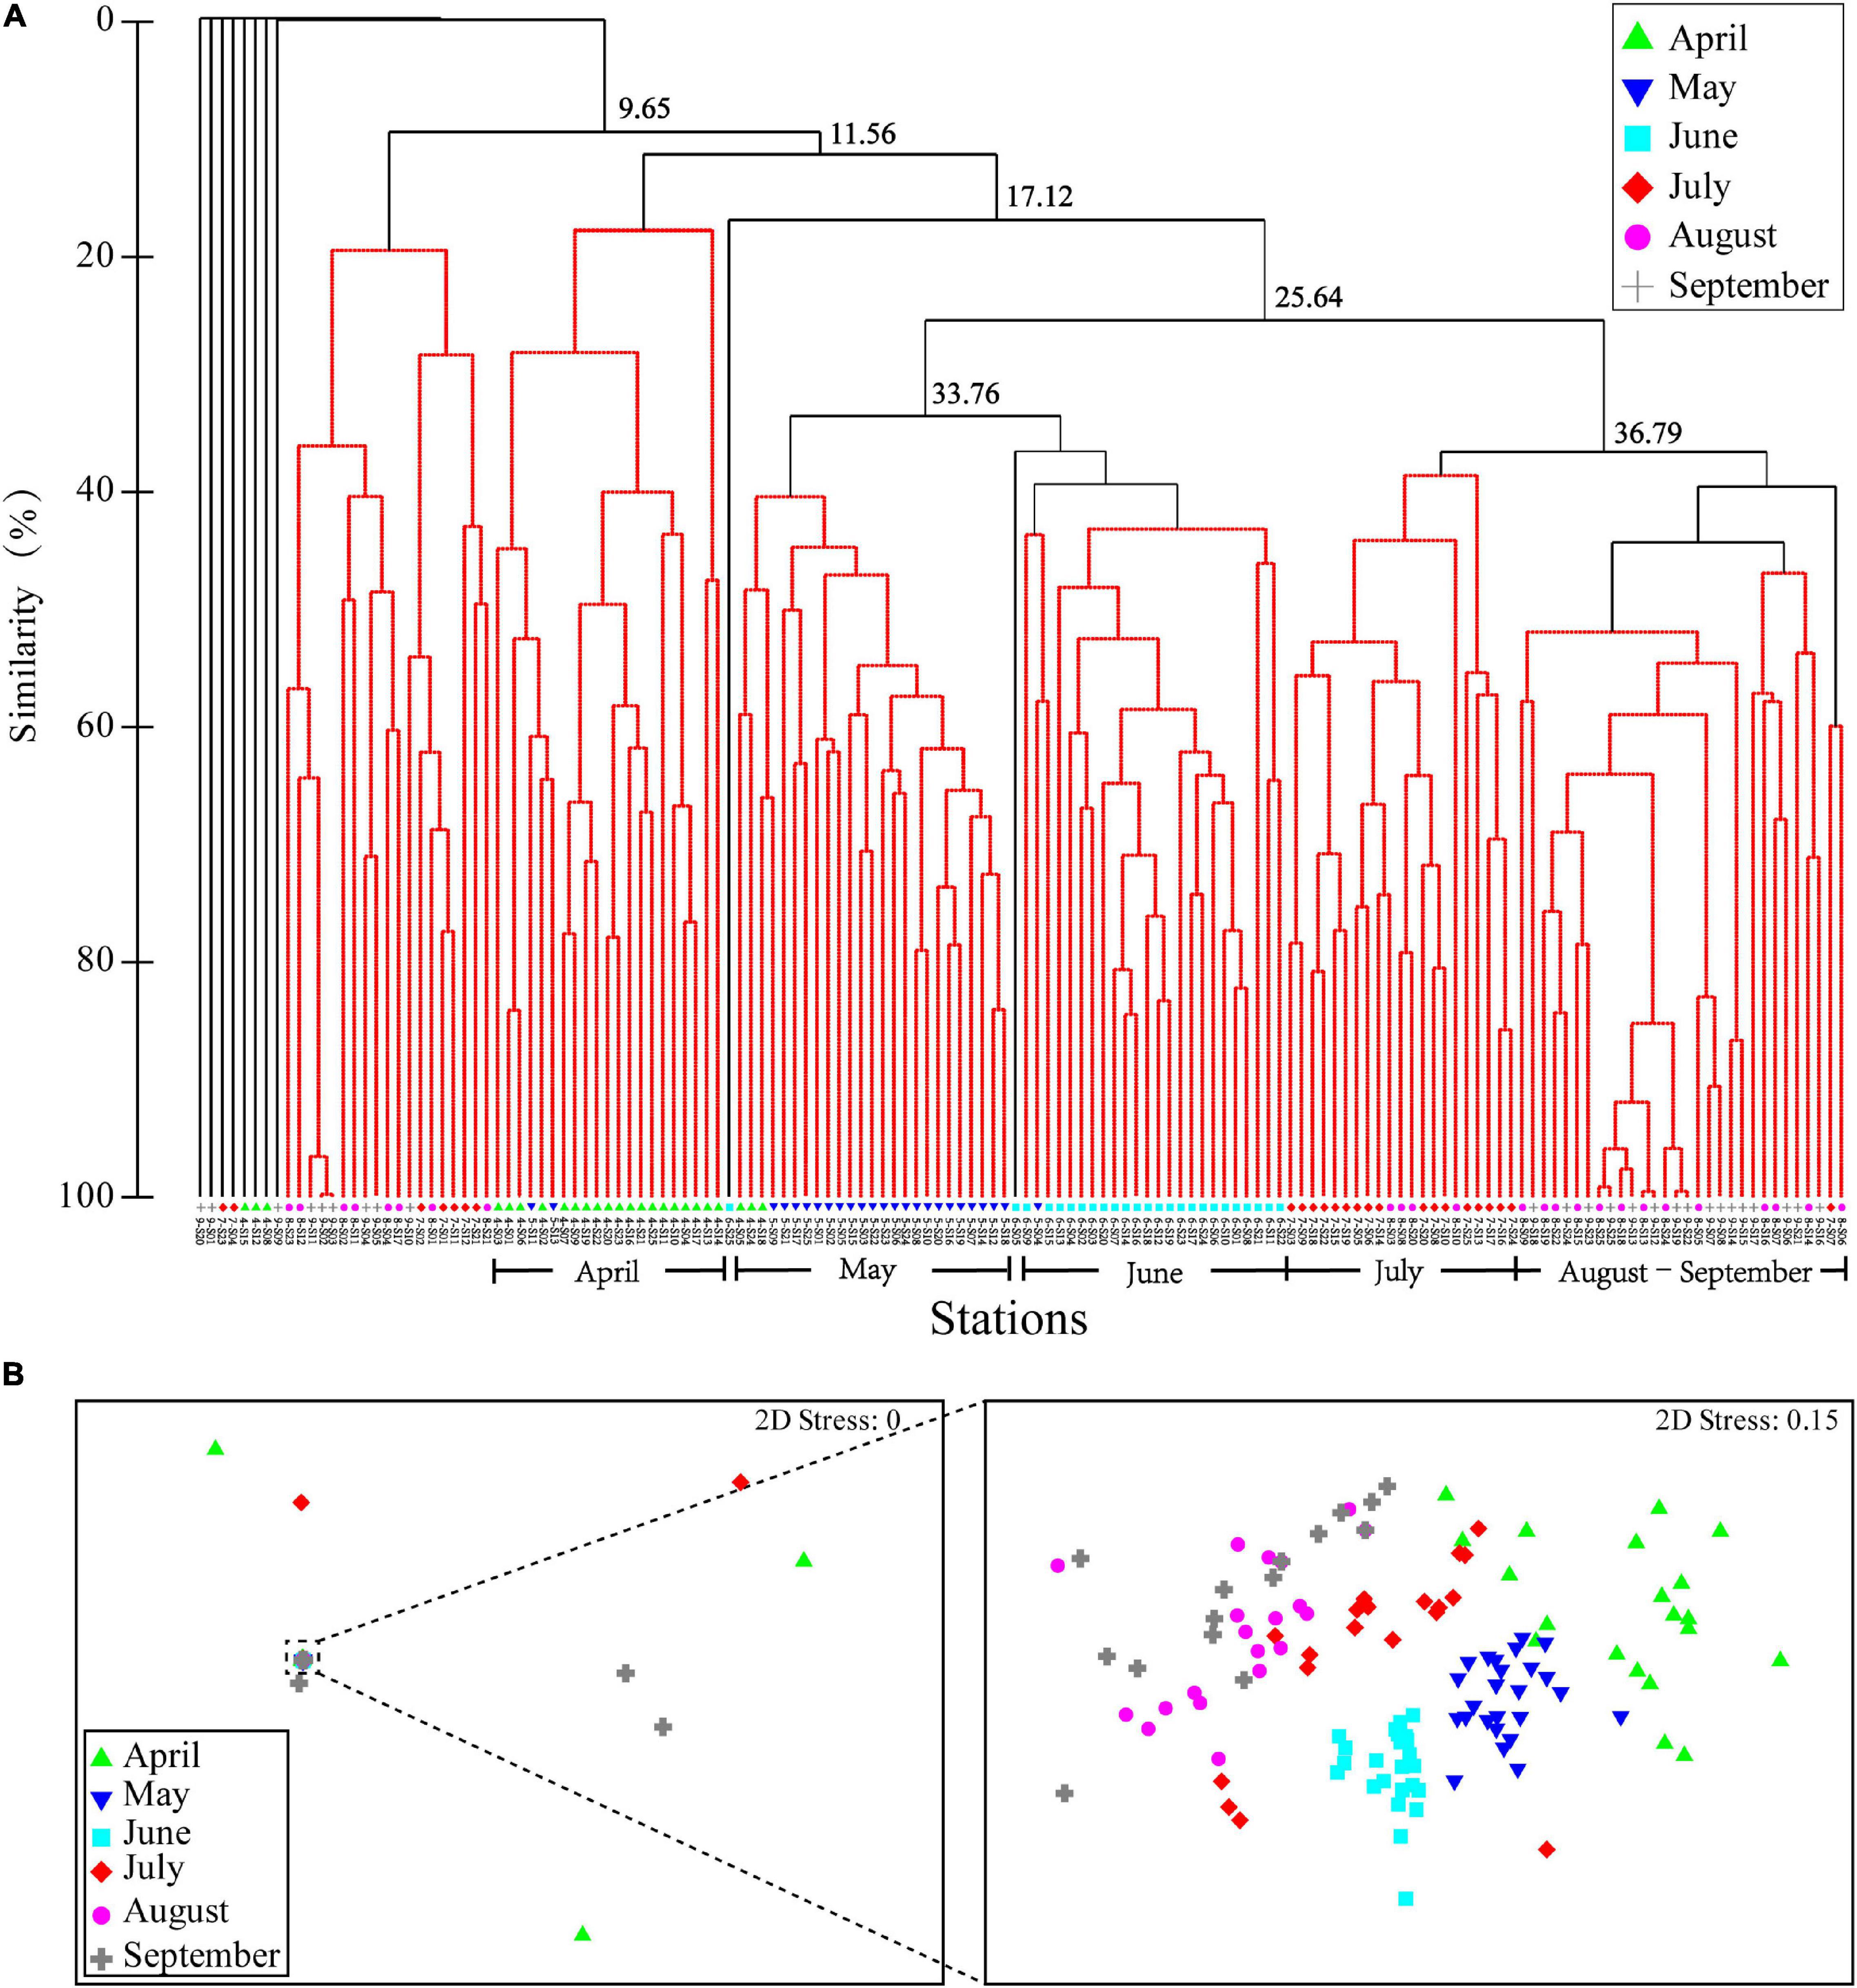
Figure 4. (A) Dendrogram resulting from the cluster analysis and nonmetric multidimensional scaling (nMDS) ordination of spatial and (B) the temporal patterns of ichthyoplankton assemblages in Sansha Bay of Fujian Province, China. Samples were collected from April to September 2019. In panel A, the black lines indicate the significant difference at p ≤ 0.05, and the red lines indicate no significant difference at p > 0.05.
Although the cluster analysis of spatial assemblage was not significant (SIMPEROF, p > 0.05), ichthyoplankton density (total taxa) (Figure 5) and richness (Figure 6) varied by station and month. The highest density and species richness occurred in May, from May-S22 and May-S01, respectively. High density occurred mainly in S12–S25 in Guanjingyang and along the Dongchong Peninsula coastline (i.e., southeast Sansha Bay) into Dongwuyang (i.e., northeast Sansha Bay) in April−September, except for August, and low density occurred mainly in S01–S11 in northwest waters of Sandu Island in April−September (ANOVA, F = 8.270, p < 0.05). Although the spatial patterns for the species richness were not clear, it showed that around Sandu Island, especially S02, S03, S05, and S06, had a relatively high richness (ANOVA, F = 7.953, p < 0.05) during most of the sampling period.
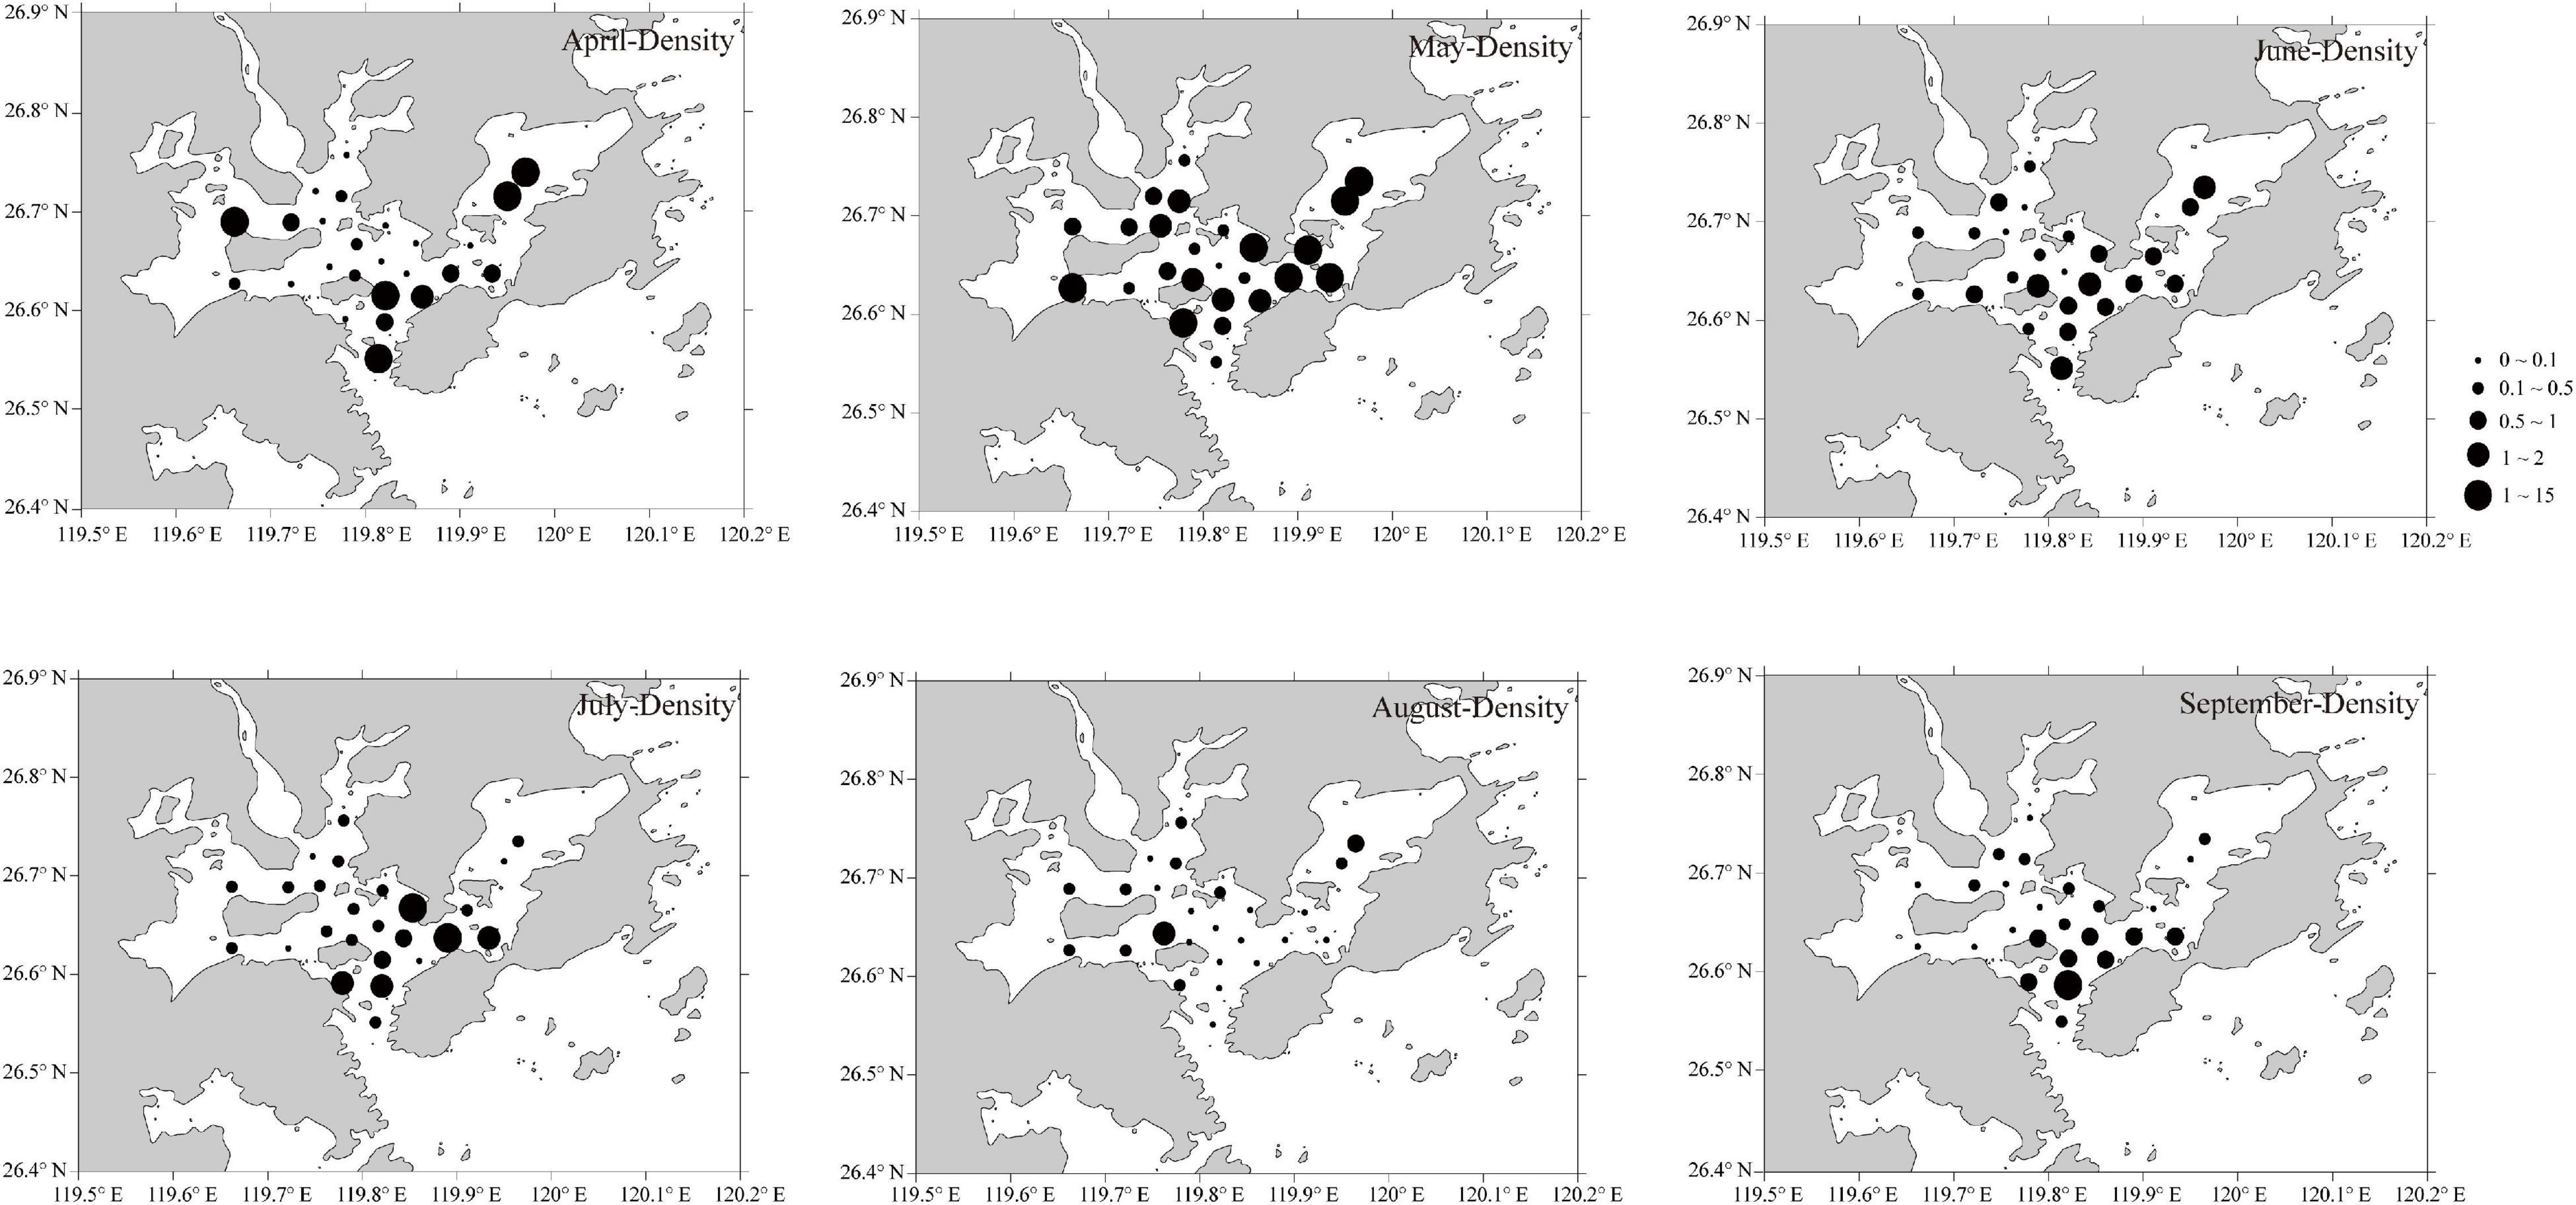
Figure 5. Spatial variation of ichthyoplankton density from April to September 2019 in Sansha Bay of Fujian Province, China.
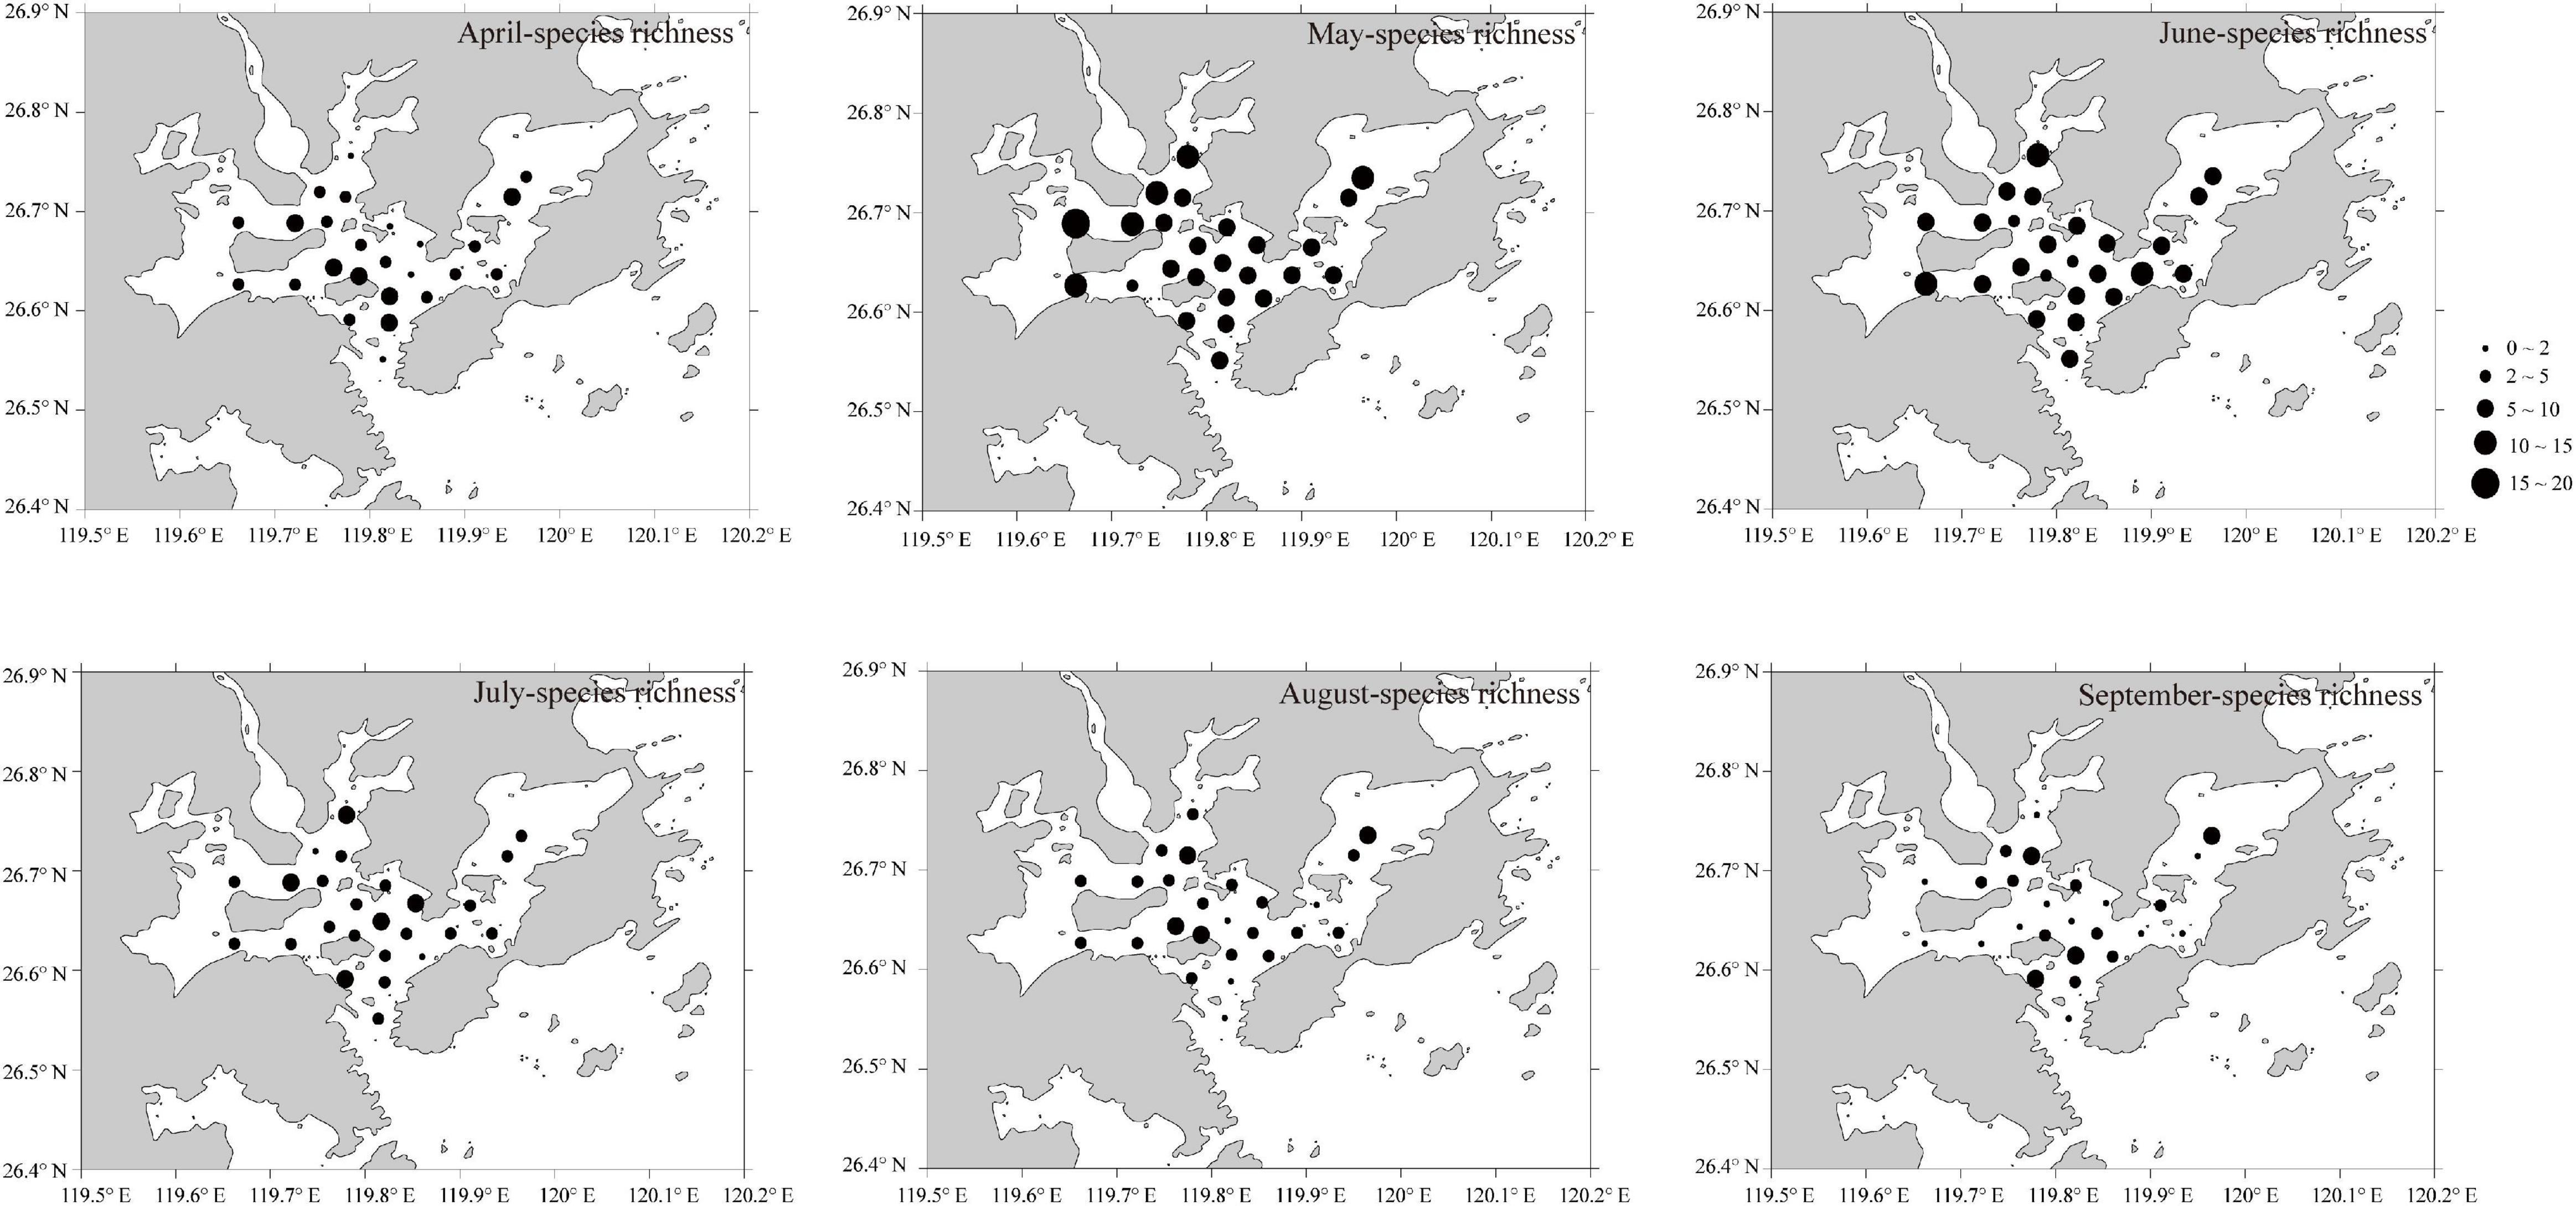
Figure 6. Spatial variation of ichthyoplankton species richness from April to September 2019 in Sansha Bay of Fujian Province, China.
Relationship Between Ichthyoplankton Assemblages and Abiotic and Biotic Factors
The variance inflation factor (VIF) test and Monte Carlo permutation test indicated that abiotic factors (i.e., T, S, DO, and pH) and biotic factors (i.e., Chla, Phy, and Zoo) were not collinear (VIF < 10) and contributed significantly to explain ichthyoplankton assemblage structure (p < 0.05; Table 3).
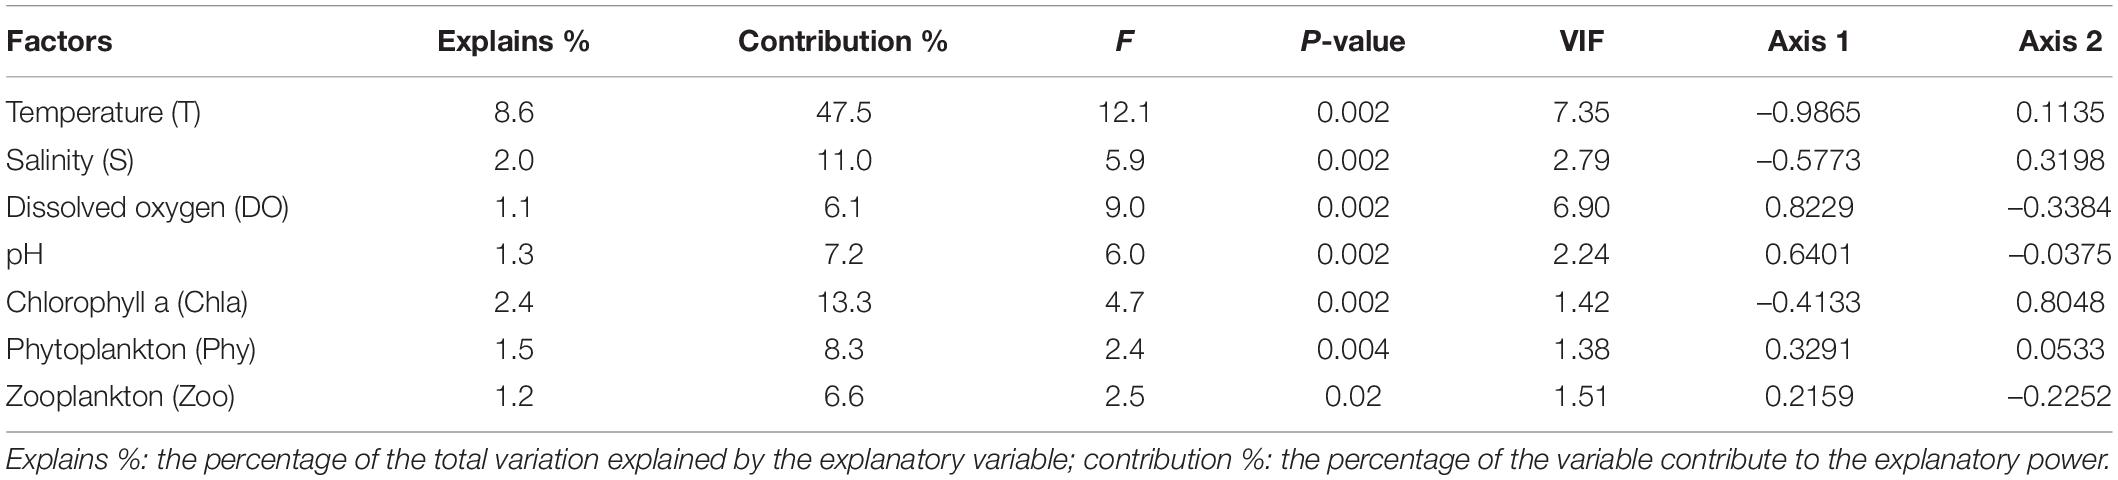
Table 3. Results of Monte Carlo test of F-ratios and the interset correlations of environmental variables with the first two canonical correlation analysis (CCA) axes.
The sum of all canonical eigenvalues occupied 18.12% of the sum of all eigenvalues. The cumulative percentage variance of species was 15.79%, and cumulative percentage variance of species environment was 87.12% (Table 4). The first two CCA axes (i.e., axes 1 and 2) explained 73.65% of the cumulative percentage variance of species and 73.67% of the cumulative percentage variance of species environment.
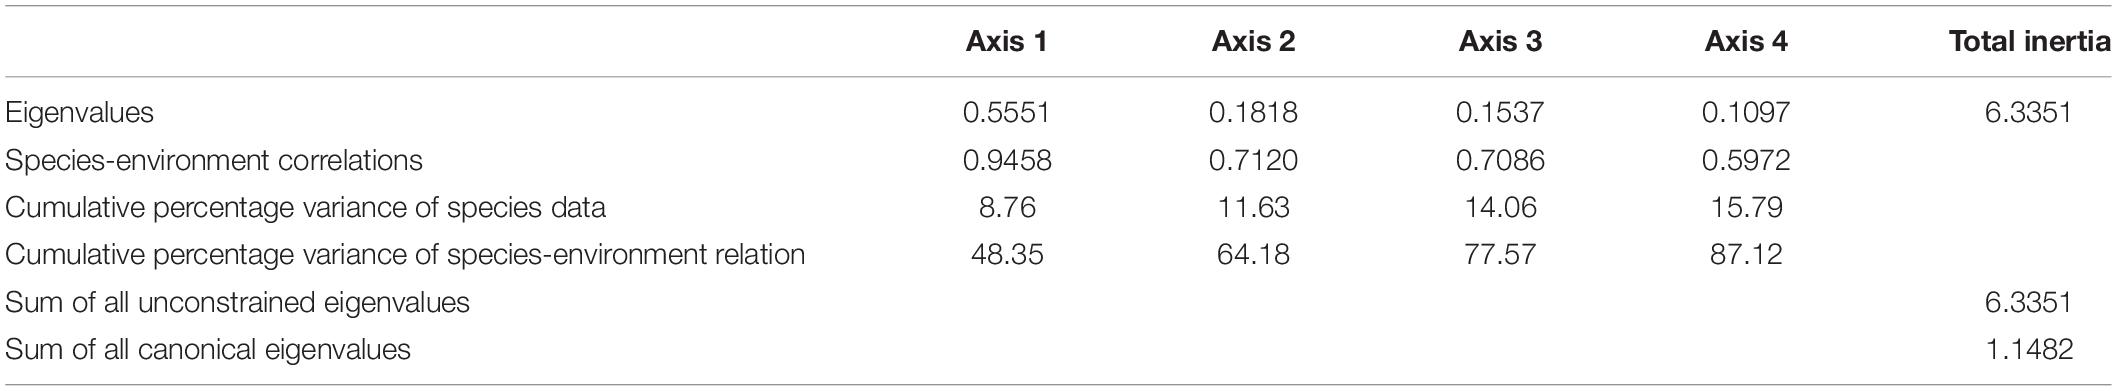
Table 4. Canonical correlation analysis relating ichthyoplankton assemblages to abiotic and biotic factors in Sansha Bay of Fujian Province, China.
Abiotic and biotic factors explained 18.1% variation in ichthyoplankton assemblages among months (Table 3). The main factors affecting ichthyoplankton assemblages were pH, DO, Phy, and Zoo, which were positively related with the first CCA axis in April and May, and were T, S, and Chla, which were negatively correlated with the first CCA axis while positively related with the second CCA axis in July, August, and September (Figure 7A and Table 3). Correlations between abiotic and biotic factors and the distribution of ichthyoplankton species were depicted in CCA (Figure 7B). Omobranchus punctatus (Opun) showed a close relationship with Chla; Nibea albiflora (Nalb), Boleophthalmus pectinirostris (Bpec), and Setipinna tenuifilis (Sten) were closely associated with S and Chla; and Aulopareia unicolor (Auni), Taenioides anguillaris (Tang), Gobiidae sp.-2 (Gibi2), and Stolephorus niphonius (Scom) showed a positive relationship with T but a negative relationship with pH. Acentrogobius caninus (Acan), Tridentiger barbatus (Tbar), Parachaeturichthys polynema (Ppol), Konosirus punctatus (Kpun) and Tridentiger bifasciatus (Tbif), Pagrus major (Pmaj) and Larimichthys crocea (Lcro) positively related with DO, pH, Phy and Zoo.
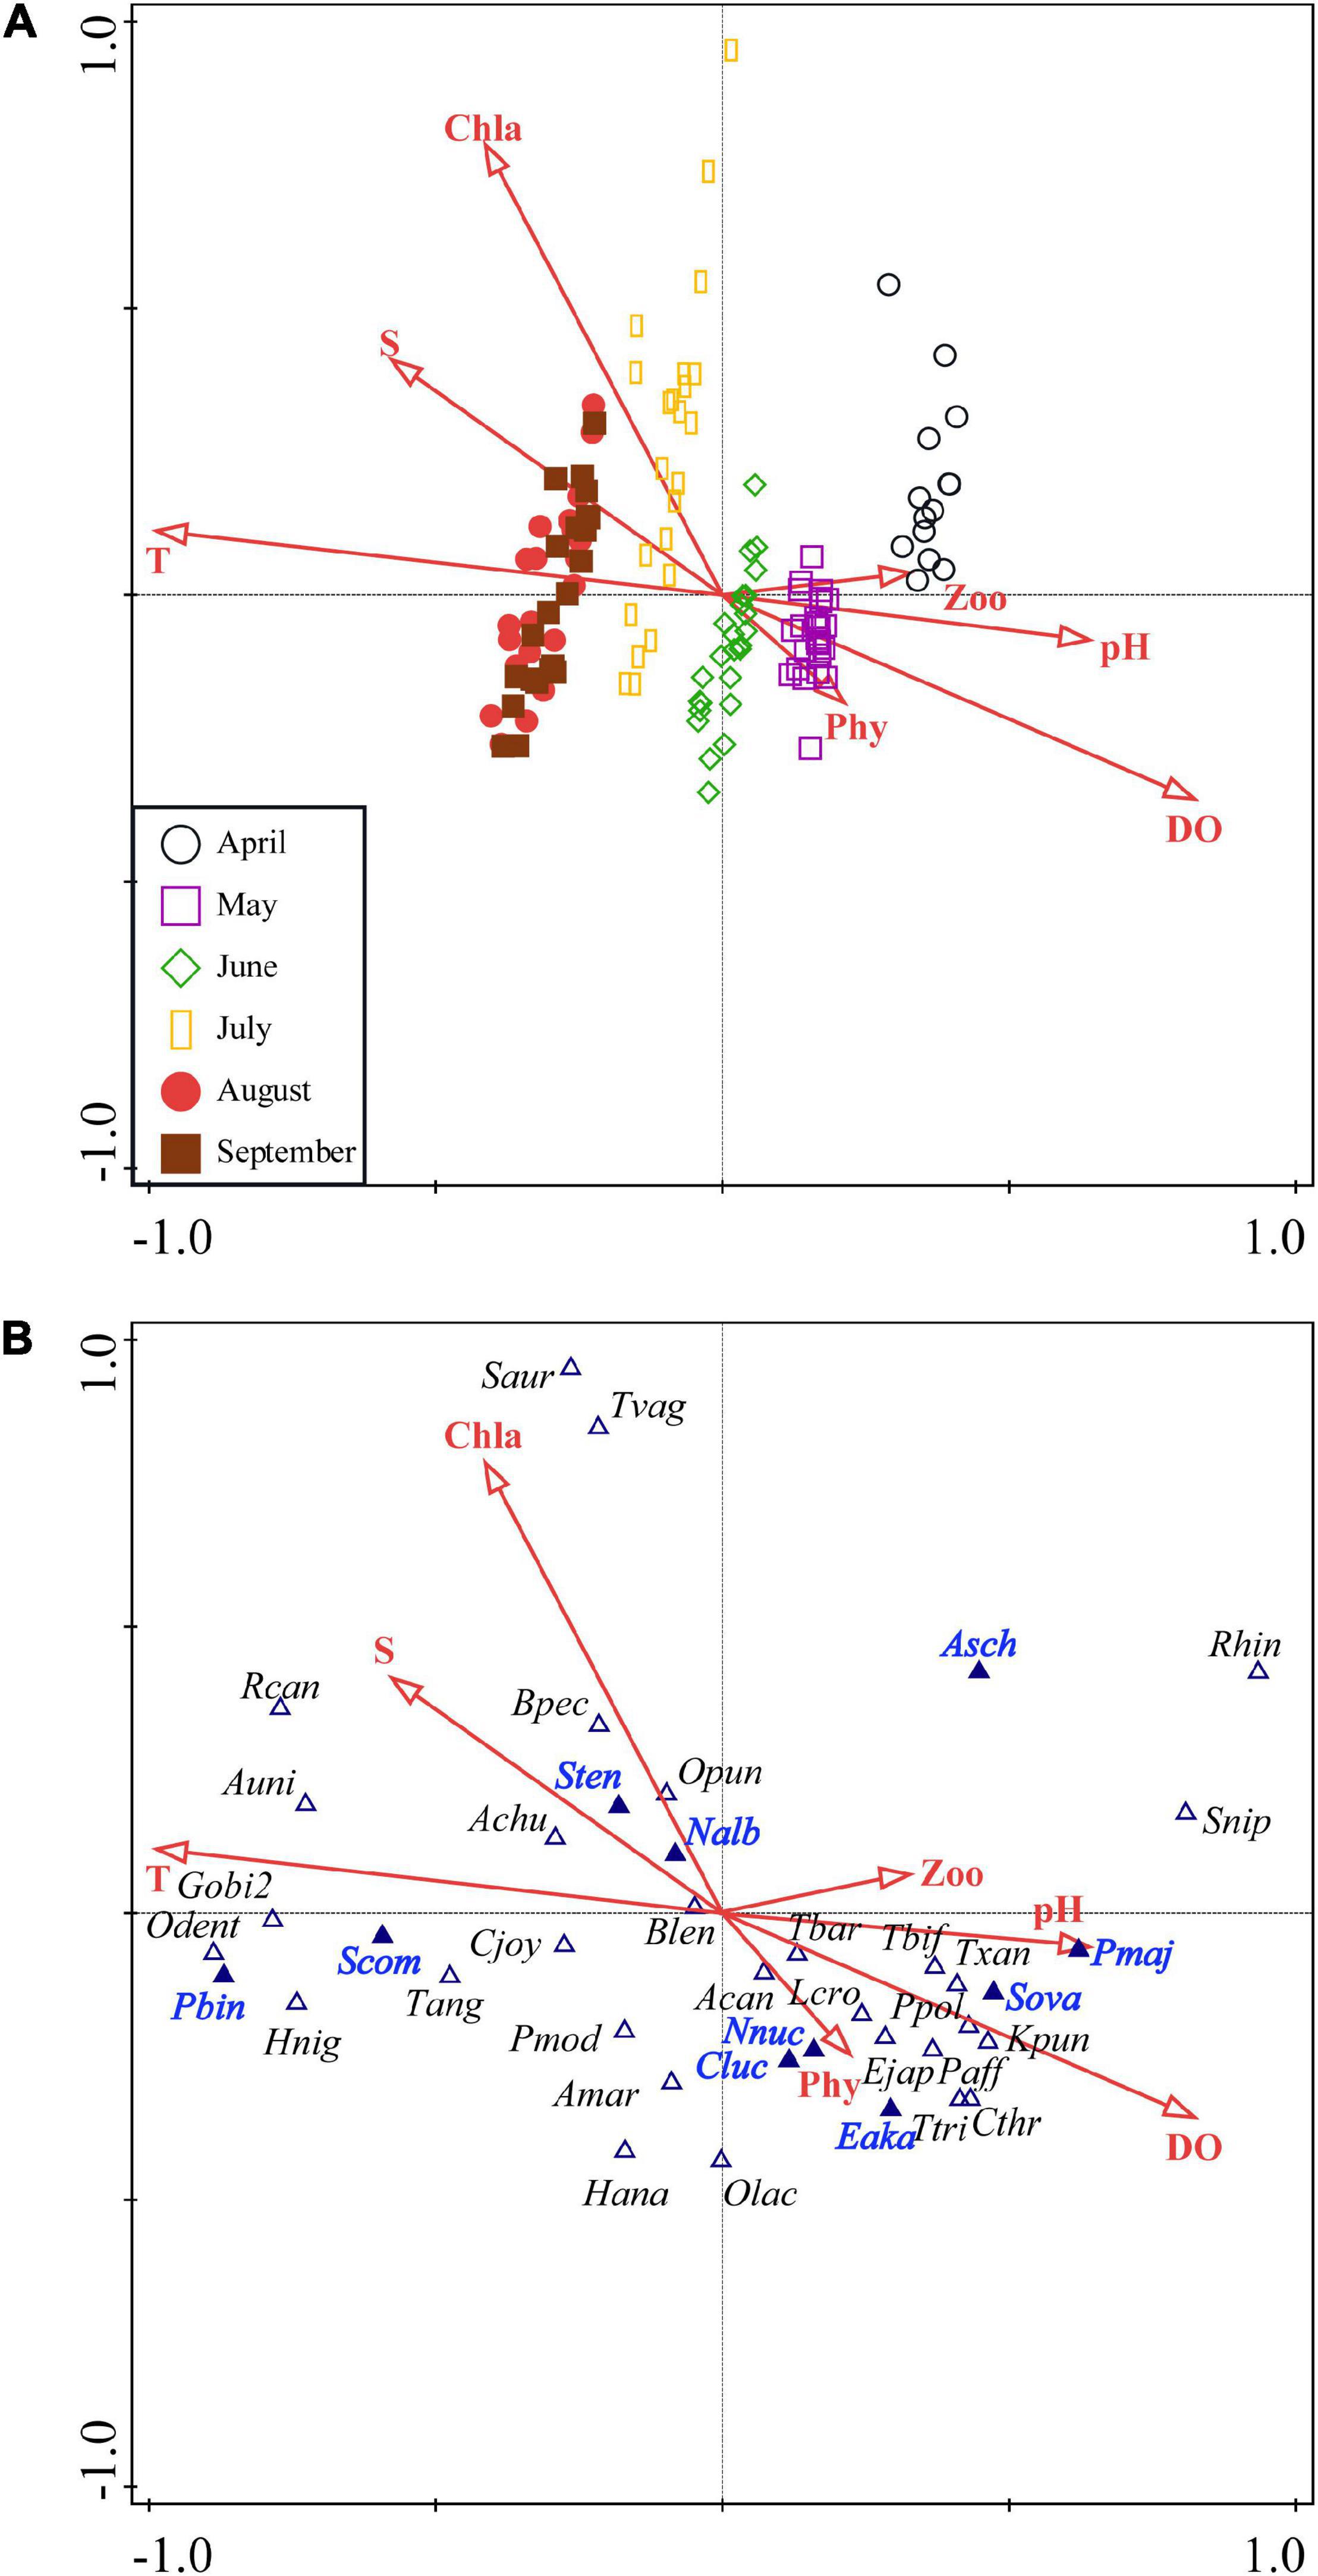
Figure 7. Canonical correspondence analysis (CCA) diagram for ichthyoplankton assemblages (A) and species (B) with abiotic and biotic factors in Sansha Bay of Fujian Province, China. The abbreviations in panel (B) are species names shown in Supplementary Table 1. The dominant species are shown in blue and bold. Sten, Setipinna tenuifilis; Scom, Stolephorus commersonnii; Sova, Solea ovata; Eaka, Epinephelus akaara; Nnuc, Nuchequula nuchalis;, Pbin, Photopectoralis bindus; Cluc, Collichthys lucidus; Nalb, Nibea albiflora; Asch, Acanthopagrus schlegelii; Pmaj, Pagrus major; T, temperature; S, salinity; DO, dissolved oxygen; Chla, chlorophyll a; Phy, phytoplankton; Zoo, zooplankton.
Discussion
Ichthyoplankton Composition and Variation
We reported the first results combining the external morphology and DNA barcode technique to identify ichthyoplankton samples collected from April to September 2019 in Sansha Bay, which made the species richness increase significantly. In total, 60 taxa were identified from horizontal and vertical tows in this study, significantly higher than previous surveys (23−46 species in 1990−2010) from the same sampling area (Table 5). The high ichthyoplankton richness in this study was mainly from Gobiidae (21 species) and contributed to the application of COI gene fragment analysis with the high detection rate at the species level, rising from 39.1 to 74.2% (1990−2010) to more than 87.10% (2019) (Table 5).
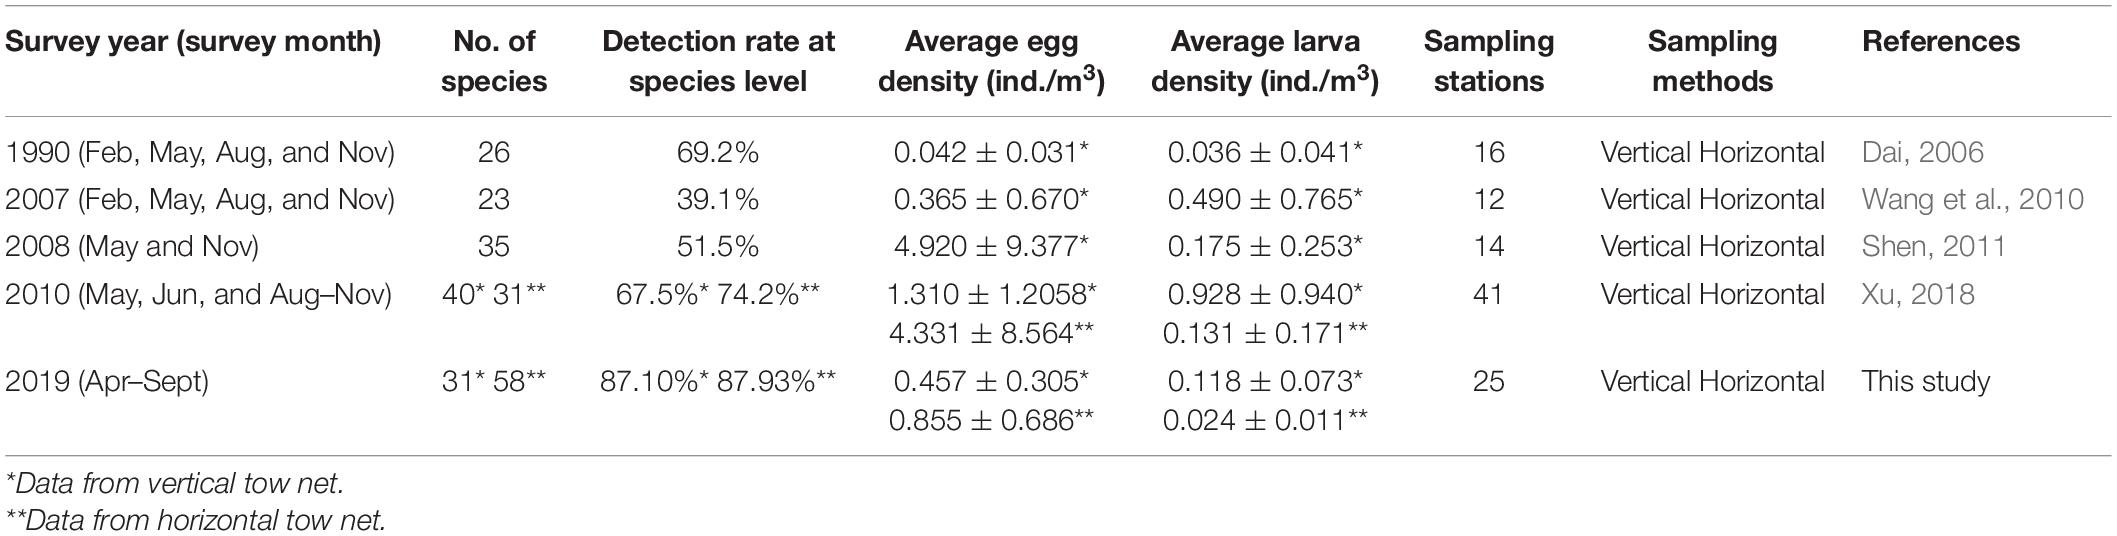
Table 5. The interannual variations of the number of species and the average density (ind./m3) (mean ± SD, n = 4 in 1990 and 2007, n = 2 in 2008, and n = 6 in 2010 and 2019) of fish eggs and larvae throughout the years in Sansha Bay of Fujian Province, China.
The development of local or regional fish species COI barcodes library is highly recommended (Hou et al., 2021b). We demonstrated the importance of the accuracy and integrity of COI barcodes database in ichthyoplankton identification following the morphological feature collection. The development of a morphological database combining COI barcodes library of ichthyoplankton is needed for future investigation reference (Hubert et al., 2015; Hou et al., 2021a). In this study, we first preserved the ichthyoplankton samples in 5% neutral formalin and then transferred to 95% ethanol in less than 12 h. High-quality COI gene fragments obtained from eggs and larvae were 54.1 and 60.9%, respectively.
The 60 ichthyoplankton taxa identified in this study inferred the underestimation of the ichthyoplankton diversity in Sansha Bay because many fish larvae have a vertical distribution pattern on a diel basis (Ahlstrom, 1959; Rodríguez et al., 2006; Auth et al., 2007). Although we realized the importance of both day and night sampling for understanding the ichthyoplankton composition and assemblage, night sampling was not applied mainly for safety considerations. Moreover, adhesive eggs are not able to collect using plankton nets. In the future, sampling methods need to be modified to obtain more ichthyoplankton samples.
The abundance of ichthyoplankton species (proportion of individuals) in Sansha Bay has changed over time. For example, a high abundance was found in the black sea bream Acanthopagrus schlegelii (Bleeker, 1854) (22%) and the bighead hairtail Trichiurus lepturus Linnaeus, 1758 (16%) in 1990, changed to Labridae sp. (47.1%) in 2007, to Sciaenidae spp. (80.63%) and Cynoglossidae spp. (14.18%) in 2008, and to Sciaenidae (41.19%), Sparidae (33.67%), and Engraulidae (11.36%) in this study (Dai, 2006; Wang et al., 2010; Shen, 2011). The shift of major ichthyoplankton composition may be driven by intensive fishery pressure, habitats loss, or climate change (Bui et al., 2010; Fodrie et al., 2010; Shen, 2011; McCain et al., 2016; Curran et al., 2021). In contrast, the sampling frequency (monthly or seasonally), spawning ground, and station setting may also influence the ichthyoplankton composition. The temporal and spatial variation of high ichthyoplankton density was detected from 1990 to 2019 (Figure 8) in Sansha Bay.
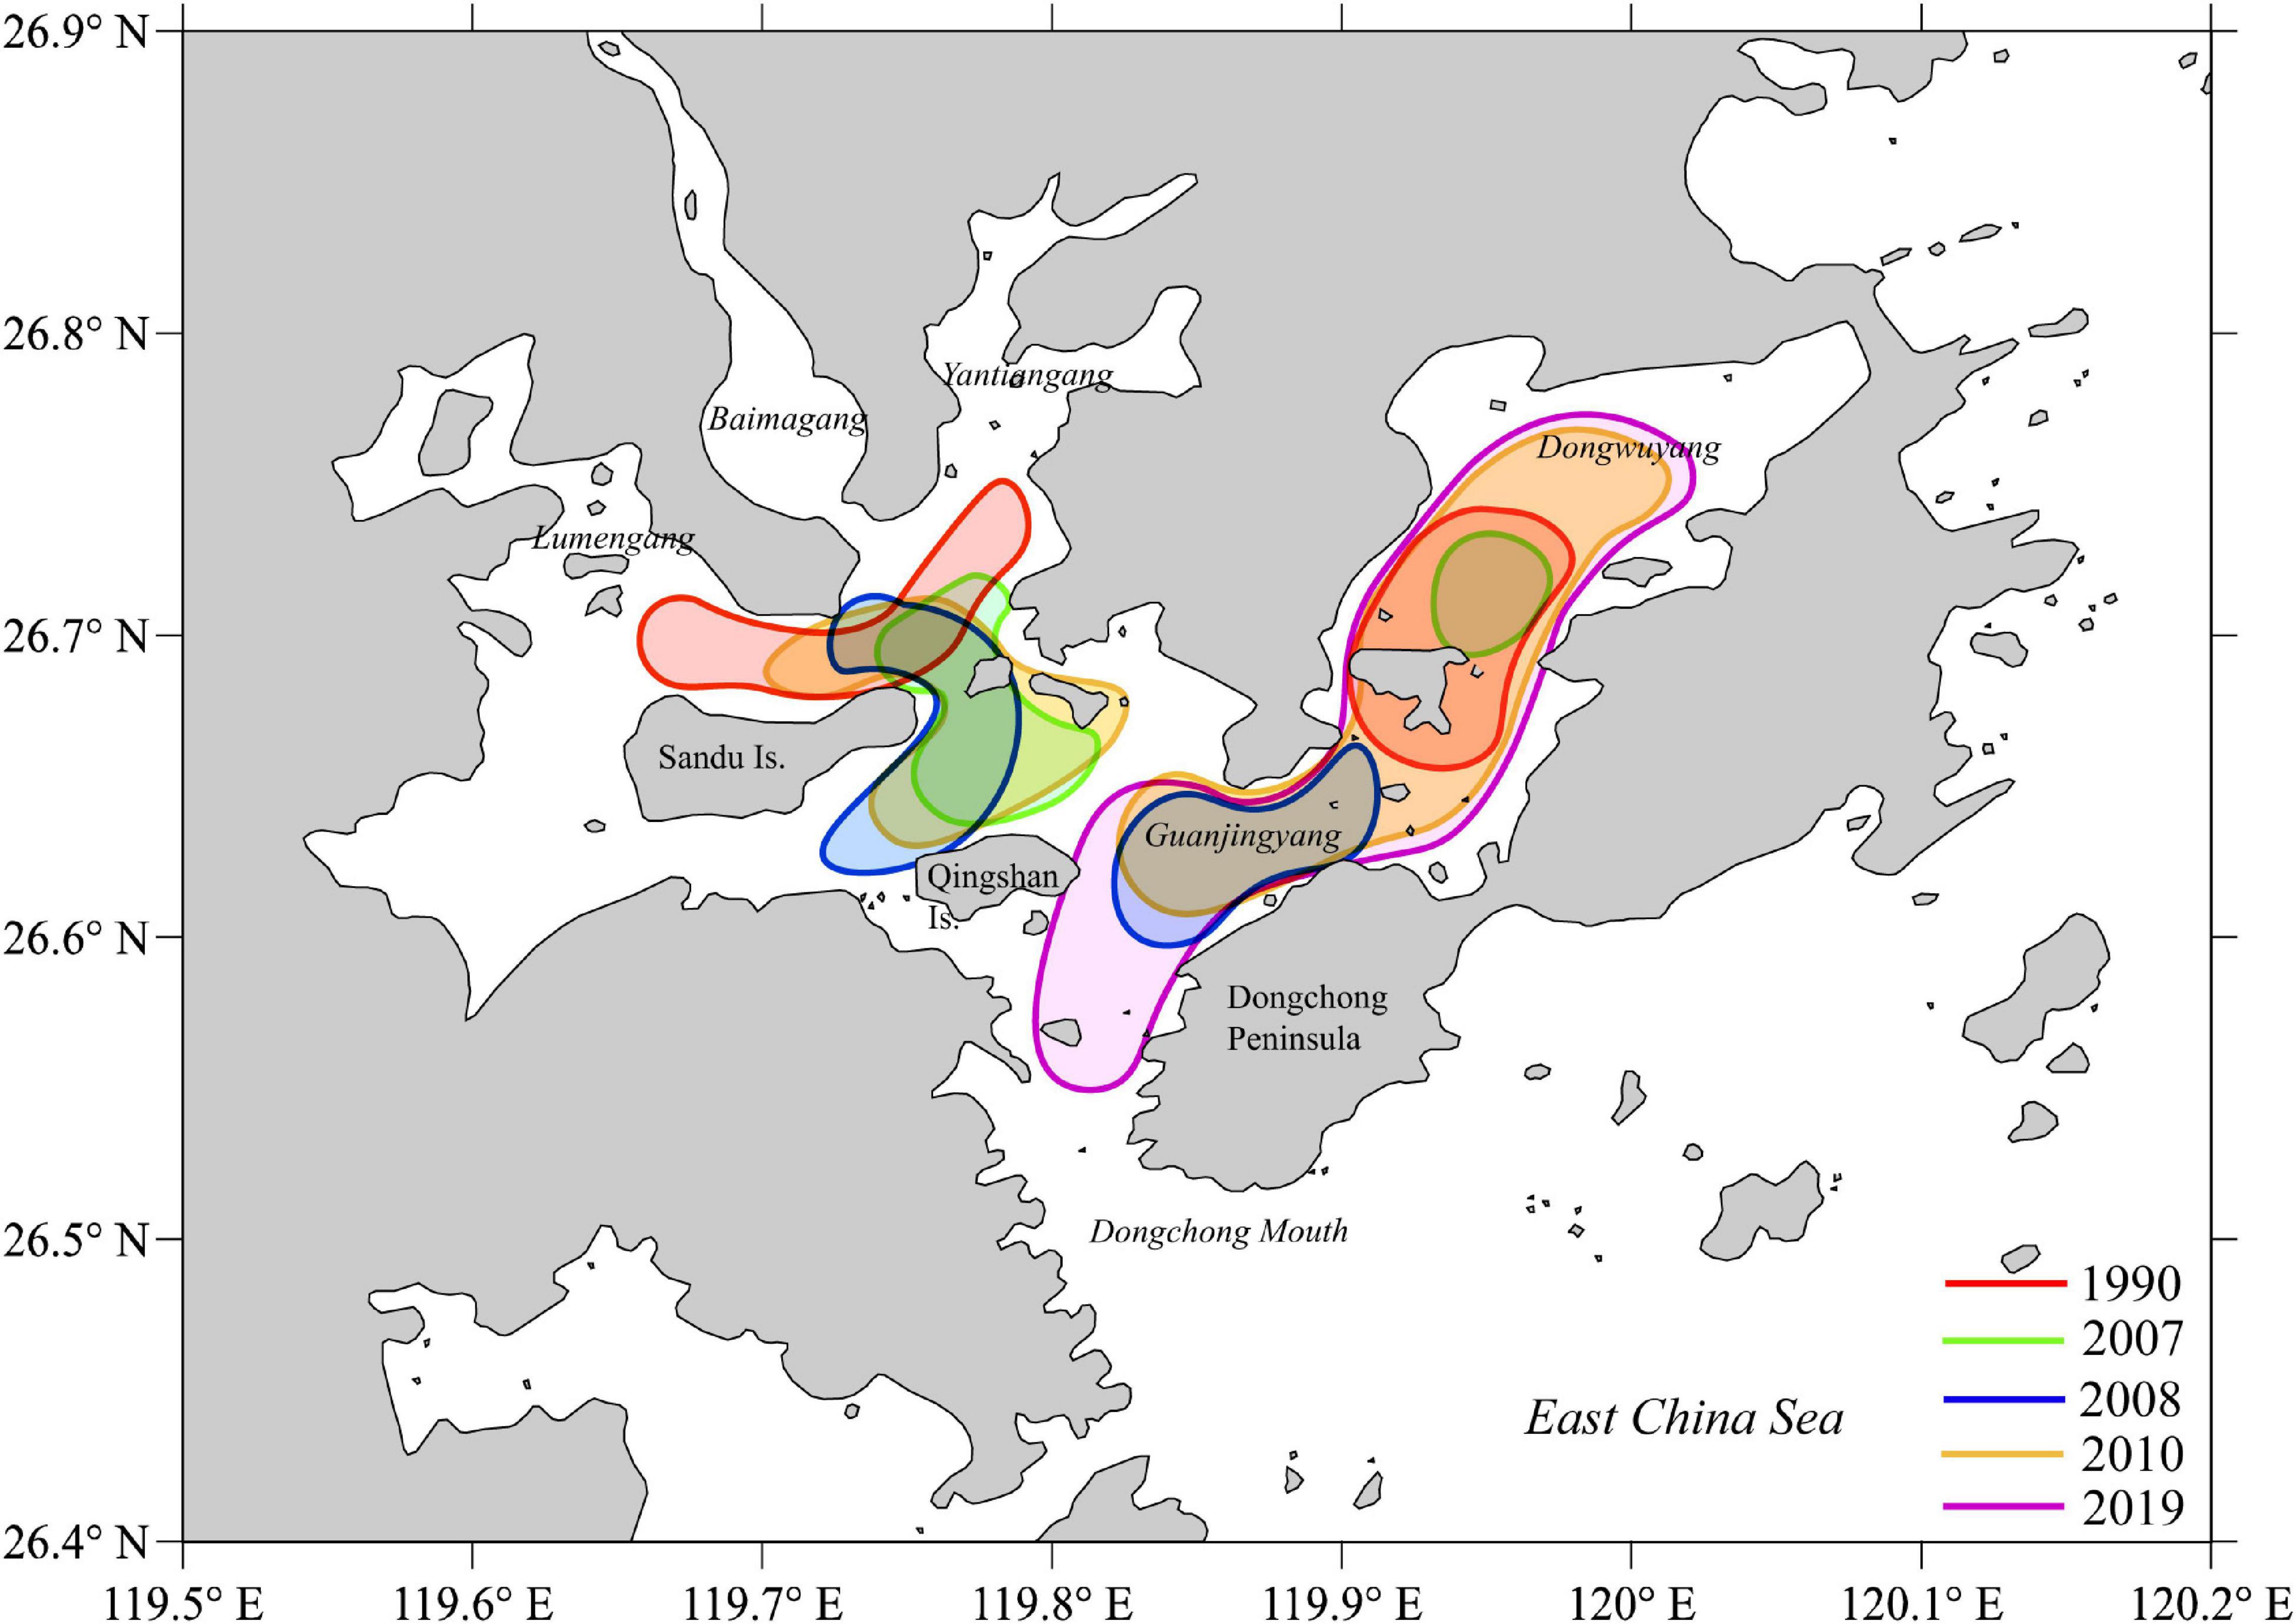
Figure 8. The high ichthyoplankton density areas from 1990 to 2019 in Sansha Bay of Fujian Province, China.
Spawning Activities in Sansha Bay
This study confirmed that Sansha Bay is an important area for fish reproduction, for pelagic, demersal, and benthic species, including some commercially important species. One of the most traditionally important fishery species in Sansha Bay was L. crocea, a well-known species from spawning and overwintering aggregations in Chinese coastal waters (Liu and Sadovy de Mitcheson, 2008). It was documented that L. crocea migrated into Sansha Bay in May and June to spawn through the narrow Dongchong Channel (Chu and Wu, 1985). Eggs and larvae of L. crocea were collected in May, June, August, October, and November (Dai, 2006; Shen, 2011; Xu, 2018), confirming the existence of two spawning seasons (spring and autumn) in the region (Liu and Sadovy de Mitcheson, 2008). In this study, eggs and larvae of L. crocea were collected in April−June because only spring spawning season was focused (Supplementary Tables 1, 2), and mature females and mature males were also caught in April−June by fixed nets in Sansha Bay following the confirmation by gonadal histology (Liu et al., 2020a). It is the first record that L. crocea also spawned in April. Further understanding the reproductive dynamic and migration pattern for L. crocea in the Sansha Bay will help us assess the stock status of this critically endangered species (Liu et al., 2020b).
Two sciaenid species, namely, the bighead croaker Collichthys lucidus (Richardson, 1844) and N. albiflora, have been of commercial importance in Fujian waters (Chu and Wu, 1985). Juveniles and adults can be caught by fixed nets in Sansha Bay throughout the sampling period of April−September (Liu et al., 2020a). Ichthyoplankton samples (eggs as majority) of C. lucidus and N. albiflora were collected in May, June, and August and in April−September, respectively, with dominant in May and June, and in May−September, respectively (Supplementary Table 1 and Table 2). However, ichthyoplankton of C. lucidus and N. albiflora were not collected in previous studies in 1990, 2007, 2008, and 2010 (Dai, 2006; Wang et al., 2010; Shen, 2011; Xu, 2018). Based on the external morphology identification of these previous studies, it was possible that the eggs and larvae of the two species were grouped as Sciaenidae species. In contrast, the reproductive dynamics of C. lucidus and N. albiflora have not been examined in Sansha Bay; therefore, it is unclear if their reproductive behavior has changed over time. For C. lucidus, the spawning and peak spawning seasons in Pearl River Estuary, approximately 800 km south of Sansha Bay, were December–July and May, respectively (Ou et al., 2012). For N. albiflora, the spawning and peak spawning seasons in Xiangshan Bay (Zhejiang Province), approximately 400 km north of Sansha Bay, were May−July and June–July, respectively (Lin et al., 2013). The variation on spawning seasons of the same species in different geological locations merits further assessments.
In Fujian waters, seabreams (Sparidae) such as A. schlegelii and the red seabream Pagrus major (Temminck and Schlegel, 1843) mainly spawned in February−April and October−December, respectively (Chu, 1985). The eggs and larvae of A. schlegelii were collected from April to August in Sansha Bay (Wang et al., 2010; Shen, 2011; Xu, 2018; this study), indicating the species has a longer spawning season, extending from spring to summer. For P. major, the eggs and larvae were collected in November 1990 (Dai, 2006) and in April and May 2019 (this study) in Sansha Bay, indicating the existence of spring and autumn spawning seasons of the species.
In the East China Sea, the spawning season of T. lepturus is March−August, producing pelagic eggs, and the spawning grounds are known offshore of Chinese waters (Chu, 1985; Nakamura and Parin, 1993; Xu and Chen, 2015). However, T. lepturus was dominant in ichthyoplankton samples (eggs) in May and August 1990 in Sansha Bay (Dai, 2006), inferring its possible spawning grounds in nearshore and semi-closed bays. It was not collected in 2007, 2008, 2010, and 2019 surveys covering its spawning season in Sansha Bay (Wang et al., 2010; Shen, 2011; Xu, 2018; this study). Nearly 100% of T. lepturus collected in Sansha Bay using fixed nets were young juveniles (3.2−46.1 cm total length, TL) in May−September 2019 (Liu et al., 2020a). Although the spawning ground function of T. lepturus in the Sansha Bay is still not clear, its nursery ground function is clear.
The Indo-Pacific king mackerel Scomberomorus guttatus (Bloch and Schneider, 1801) and the Japanese Spanish mackerel S. niphonius are pelagic, forming spawning migrations from deep waters to shallow waters in spring and spawning in May and June in Sansha Bay (Wu, 1985). Ichthyoplankton of S. guttatus and S. niphonius were collected in June 2010 (Xu, 2018), and in April and May 2019 (this study), confirming the spawning ground function of the Sansha Bay for the two species.
Ichthyoplankton of two alien species were first collected in Sansha Bay in this study; eggs of S. ocellatus in August and September 2019, and larvae of S. aurata in June 2019 (Supplementary Table 1). The two species were introduced into China for mariculture purposes from United States in 1991 and from France in 2001, respectively, and juveniles and adults have dispersed in coastal waters of China (Wang and Ji, 1996; Liu et al., 1998; Wang et al., 2006; Lin et al., 2020; Zhang, 2020). It is likely that S. ocellatus has established reproductive wild stocks in Chinese waters (Lin et al., 2020). Both species are commonly cultured in floating cages in Sansha Bay, and their juveniles (S. ocellatus: 35.8 cm TL, n = 1; S. aurata: 3.7−31.2 cm TL, n = 9) were collected using the fixed nets in 2019 (Liu et al., 2020a). This study revealed that S. ocellatus and S. aurata can reproduce and may be able to establish spawning population in Sansha Bay.
Ichthyoplankton Assemblages
Five main temporal ichthyoplankton assemblages were apparently separately in Sansha Bay. The densities of ichthyoplankton along Dongchong Peninsula coastline into Dongwuyang (S12–S25) were higher than those in the northwest waters of Sandu Island (S01–S11) with the significant high salinity (this study) and high tidal currents speed (Lin et al., 2018), and the dominant species were from Engraulidae [S. tenuifilis], Soleidae (Solea ovata Richardson, 1846), Serranidae [Epinephelus akaara (Temminck and Schlegel, 1842)], Sciaenidae (N. albiflora and C. lucidus), and Sparidae (A. schlegelii and P. major), including pelagic, demersal, and benthic species. The results indicated that these species may prefer spawning in waters with high salinity and strong currents, or fish eggs and larvae were dispersed to there by currents.
The spatial distribution patterns of ichthyoplankton varied over the past three decades in Sansha Bay, and three zones can be considered as core areas (Dai, 2006; Wang et al., 2010; Shen, 2011; Xu, 2018; this study; Figure 8). First, it is around Sandu Island. The high ichthyoplankton density area was in the north in 1990, then, shifted to the east in the late 2000s, and was not important in 2019. Second, it is in Guanjingyang waters with an extension to the Dongchong mouth. The high ichthyoplankton density was found in 2008, 2010, and 2019. Third, it is in Dongwuyang waters. The high ichthyoplankton density was found in 1990, 2007, 2010, and 2019. Overall, the high ichthyoplankton density areas remain the same in Guanjingyang and Dongwuyang over the past three decades and reduce largely from 1990 in Sandu Island water.
Influence of Abiotic and Biotic Factors
Studies revealed that both abiotic and biotic factors shaped the fish assemblages (including fish reproduction stocks and ichthyoplankton) (Olivar, 1990; Marshall and Elliott, 1998; Pombo et al., 2005; Zhang et al., 2015; Hsieh et al., 2016; Rodriguez, 2019). Temperature and salinity influence fish distribution through the different preferences and tolerances of the species. Temperature is likely to be the dominant factor influencing the variability of migration, spawning, and recruitment (Gibson et al., 1993; Marshall and Elliott, 1998) and the abundance and distribution of phytoplankton, zooplankton, and ichthyoplankton (Siokou-Frangou et al., 1998; Rautio, 2001; Hsieh et al., 2005; Gogoi et al., 2021). In this study, seven abiotic and biotic factors, including T, S, DO, pH, Chla, Phy, and Zoo, significantly structured the ichthyoplankton assemblages in Sansha Bay, and temperature was also the dominant factor and then salinity and Chla.
Fish spawning and nursing behavior could be affected by spatial and temporal distribution of preys (Cushing, 1990). Besides, food suitability and availability have been proposed as major factors to determine the survival of early-stage larval fishes, e.g., the main foods of fish larvae are phytoplankton (diatoms, flagellates, and ciliates) and zooplankton (pelecypods, euphausiids, Mysidacea, and copepods) (Govoni et al., 1983; MacKenzie et al., 1996; Platt et al., 2003; Guevara et al., 2005; Nakagawa et al., 2007; Ajiboye et al., 2011; Abo-Taleb, 2019). The dominant species of phytoplankton and zooplankton in May and June (peak spawning season) in Sansha Bay were mainly from Bacillariophyta and copepods (Liu et al., 2020a), all of which may play important roles as feeds for fish larvae and young juveniles to further impact the distribution pattern of ichthyoplankton in Sansha Bay.
Chla, representing the primary productivity, is associated with phytoplankton and zooplankton abundance and always has a positive correlation with phytoplankton abundance (Felip and Catalan, 2000). In this study, the red tide forming species Noctiluca scintillans (Macartney) (Kofoid and Swezy, 1921) bloomed in May 2019, which was without chloroplast and purely phagotrophic (Balch and Haxo, 1984; Zhang et al., 2020), resulting in apparently high abundance of phytoplankton and low concentration of Chla (Nakamura, 1998). Moreover, N. scintillas can feed on phytoplankton, zooplankton, and even fish eggs and larvae (Nakamura, 1998; Quevedo et al., 1999; Umani et al., 2004); therefore, the impact of biotic factor Chla related with N. scintillas might have a negative correlation with Phy, Zoo, and certain ichthyoplankton species (Figure 7).
Although seven abiotic and biotic variables were integrated for analysis, only 18.1% of the variability observed in ichthyoplankton was explained (Table 3), which suggested that other factors could influence the ichthyoplankton assemblage, e.g., ocean currents, substrates, and human activities (Bascompte et al., 2005; Lopes et al., 2006; Daskalov et al., 2007; Muhling et al., 2008; Vilchis et al., 2009; Zhou et al., 2011; Vandendriessche et al., 2016).
Conclusion
In this study, 60 taxa ichthyoplankton were identified from horizontal and vertical tows by combining DNA barcoding and external morphology from April to September 2019 in Sansha Bay of Fujian Province, China. Among these, 52 taxa were identified at species level, 5 taxa at genus, and 3 taxa at family level. The 10 dominant species were from Engraulidae (S. tenuifilis and Stolephorus commersonnii), Serranidae (E. akaara), Leiognathidae (Photopectoralis bindus and Nuchequula nuchalis), Sciaenidae (N. albiflora and C. lucidus), and Sparidae (P. major and A. schlegelii). The temporal distribution of ichthyoplankton were divided into five assemblages, namely, April, May, June, July, and August−September with a high density occurred mainly in Guanjingyang and along the Dongchong Peninsula coastline into Dongwuyang. The temporal and spatial patterns were closely related to both abiotic and biotic factors. Temperature was the main factor influencing the assemblage structure and then Chla and salinity. Other factors, such as ocean currents, substrates, and other anthropogenic activities still need further investigation. Currently, little is explored to understand the entire life cycles of the dominant and commercially important fish species in Sansha Bay and its adjacent waters, the East China Sea. To achieve effective fishery stock management, understanding different life stages and their habitat uses, and the connectivity among different life stages are highly recommended.
Data Availability Statement
The datasets presented in this study can be found in online repositories. The names of the repository/repositories and accession number(s) can be found below: NCBI (accession: OK012006-OK012065).
Author Contributions
YJ wrote the first draft and organized the sampling trips. YJ, B-AL, H-YH, G-MD, ML, and L-MZ conducted the sample collection. B-AL, H-YH, and GZ performed the molecular analysis. YJ, B-AL, and L-TY performed the data analyses. ML and L-MZ revised the manuscript. All authors contributed to the article preparation and approved the submission.
Funding
This work was supported by the National Key Research and Development Program of China (2018YFD0900702-3 and 2018YFC1406501) and the Fujian Province Ocean and Fisheries Bureau of China (contract no. [3500]HTZB[GK]2019007-1-1). The funders had no role in data collection and analysis, decision to publish, or preparation of the manuscript.
Conflict of Interest
The authors declare that the research was conducted in the absence of any commercial or financial relationships that could be construed as a potential conflict of interest.
Publisher’s Note
All claims expressed in this article are solely those of the authors and do not necessarily represent those of their affiliated organizations, or those of the publisher, the editors and the reviewers. Any product that may be evaluated in this article, or claim that may be made by its manufacturer, is not guaranteed or endorsed by the publisher.
Acknowledgments
The authors thank Zhe-ying Lin, Qing Xu, Qing-qiang Ren, Jia-hao Song, Lv-ping Fang, Qiong Wang, and Wei-di Yang for sample collection and laboratory work and two reviewers for helpful comments.
Supplementary Material
The Supplementary Material for this article can be found online at: https://www.frontiersin.org/articles/10.3389/fmars.2021.758089/full#supplementary-material
Footnotes
References
Abo-Taleb, H. (2019). “Importance of plankton to fish community,” in Biological Research in Aquatic Science, ed. Y. Bozkurt (London: IntechOpen), 83–92.
Ahlstrom, E. H. (1959). Vertical distribution of pelagic fish eggs and larvae off California and Baja California. Fish. Bul. 161, 107–146.
Ajiboye, O. O., Yakubu, A. F., Adams, T. E., Olaji, E. D., and Nwogu, N. A. (2011). A review of the use of copepods in marine fish larviculture. Rev. Fish. Biol. Fish. 21, 225–246. doi: 10.1007/s11160-010-9169-3
Arora, J., and Mehra, N. K. (2009). Seasonal dynamics of zooplankton in a shallow eutrophic man-made hyposaline lake in Delhi (India): role of environmental factors. Hydrobiologia 626, 27–40. doi: 10.1007/s10750-009-9735-7
Auth, T. D., Brodeur, R. D., and Fisher, K. M. (2007). Diel variation in vertical distribution of an offshore ichthyoplankton community off the Oregon coast. Fish. Bul. 105, 313–326. doi: 10.1016/j.dsr.2016.05.014
Bailey, K. M., and Houde, E. D. (1989). Predation on eggs and larvae of marine fishes and recruitment problem. Adv. Mar. Biol. 25, 1–83. doi: 10.1016/S0065-2881(08)60187-X
Balch, W. M., and Haxo, F. T. (1984). Spectral properties of Noctiluca miliaris Suriray, a heterotrophic dinoflagellate. J. Plankton. Res. 6, 515–525. doi: 10.1093/plankt/6.3.515
Bascompte, J., Melián, C. J., and Sala, E. (2005). Interaction strength combinations and the overfishing of a marine food web. Proc. Natl. Acad. Sci. U.S.A. 102, 5443–5447.
Becker, R. A., Sales, N. G., Santos, G. M., Santos, G. B., and Carvalho, D. C. (2015). DNA barcoding and morphological identification of neotropical ichthyoplankton from Upper Paraná and São Francisco. J. Fish Biol. 87, 159–168. doi: 10.1111/jfb.12707
Bui, A. O. V., Ouellet, P., Castonguay, M., and Brêthes, J.-C. (2010). Ichthyoplankton community structure in the northwest Gulf of St. Lawrence (Canada): past and present. Mar. Ecol. Prog. Ser. 412, 189–205.
Chu, Y. (1985). The Fishes of Fujian Province (Part II). Fujian: Fujian Science and Technology Press.
Chu, Y., Lo, Y., and Wu, H. (1963). A Study on the Classification of the Sciaenoid Fishes of China, with Description of New Genera and Species. Shanghai: Science and Technology Press.
Chu, Y., and Wu, H. (1985). “Sciaenidae,” in The Fishes of Fujian Province (Part II), ed. Y. Chu (Fujian: Fujian Science and Technology Press), 101–136.
Clarke, K. R., Gorley, R. N., Somerfield, P. J., and Warwick, R. M. (2014). Change in Marine Communities: An Approach to Statistical Analysis and Interpretation. Plymouth: PRIMER-E.
Costa, M. J., Cabral, H. N., Drake, P., Economou, A. N., Fernandez-Delgado, C., Gordo, L., et al. (2002). “Chapter 3: recruitment and production of commercial species in estuaries,” in Fishes in Estuaries, eds M. Elliott and K. Hemingway (Oxford: Blackwell Sciences Ltd), 54–123.
Curran, M. C., Wiggins, J. J., and Wilber, D. H. (2021). Flatfish habitat use of a small southeastern US Tidal Creek: long- and short-term occupancy patterns. Estuar. Coast. 44, 1547–1556.
Cushing, D. H. (1990). Plankton production and year-class strength in fish populations: an update of the match/mismatch hypothesis. Adv. Mar. Biol. 26, 249–293. doi: 10.1016/s0065-2881(08)60202-3
Dai, Y. (2006). Distribution of fish eggs, larva and juveniles in Sansha Bay. Fujian J. Oceanogr. Taiwan 25, 256–261.
Daskalov, G. M., Grishin, A. N., Rodionov, S., and Mihneva, V. (2007). Trophic cascades triggered by overfishing reveal possible mechanisms of ecosystem regime shifts. Proc. Natl. Acad. Sci. U.S.A. 104, 10518–10523. doi: 10.1073/pnas.0701100104
Downie, A. T., Illing, B., Faria, A. M., and Rummer, J. L. (2020). Swimming performance of marine fish larvae: review of a universal trait under ecological and environmental pressure. Rev. Fish Biol. Fish. 30, 93–98. doi: 10.1007/s11160-019-09592-w
Felip, M., and Catalan, J. (2000). The relationship between phytoplankton bivolume and chlorophyll in a deep oligotrophic lake: decoupling in their spatial and temporal maxima. J. Plankton. Res. 22, 91–105. doi: 10.1093/plankt/22.1.91
Fodrie, F. J., Heck, K. L. Jr., Powers, S. P., Graham, W. M., and Robinson, K. L. (2010). Climate-related, decadal-scale assemblage changes of seagrass-associated fishes in the northern Gulf of Mexico. Glob. Change Biol. 16, 48–59.
Folmer, O., Black, M., Hoeh, W., Lutz, R., and Vrijenhoek, R. (1994). DNA primers for amplification of mitochondrial cytochrome c oxidase subunit I from diverse metazoan invertebrates. Mol. Mar. Biol. Biotech. 3, 294–299.
GB/T 12763.6 (2007). Specifications for Oceanographic Survey-Part 6: Marine Biological Survey. Beijin: Standards Press of China.
Gibson, R. N., Ansell, A. D., and Robb, L. (1993). Seasonal and annual variations in abundance and species composition of fish and macrocrustacean communities on a Scottish sandy beach. Mar. Ecol. Prog. Ser. 98, 89–105.
Gogoi, P., Das, S. K., Sarkar, S. D., Chanu, T. N., Manna, R. K., Sengupta, A., et al. (2021). Environmental factors driving phytoplankton assemblage pattern and diversity: insights from Sundarban eco-region, India. Ecohydro. Hydrobiol. 21, 351–367. doi: 10.1016/j.ecohyd.2020.09.005
Govoni, J. J., Hoss, D. E., and Chester, A. J. (1983). Comparative feeding of three species of larval fishes in the Northern Gluf of Mexico: Brevootia patronus, Leiostomus xanthurus, and Micropogonias undulatus. Mar. Ecol. Prog. Ser. 13, 189–199. doi: 10.3354/meps013189
Graham, M. H. (2003). Confronting multicollinearity in ecological multiple regression. Ecology 84, 2809–2815. doi: 10.1890/02-3114
Guevara, M., Lodeiros, C., Donato, M. D., Graciani, C., and Freites, L. (2005). Nutritional quality of Metamysidopsis insularis Brattegard (Crustacea: Mysidacea). Aquac. Nurtr. 11, 315–319.
Hamre, K., Yúfera, M., Rønnestad, I., Boglione, C., Conceição, L. E. C., and Izquierdo, M. (2013). Fish larval nutrition and feed formulation: knowledge gaps and bottlenecks for advances in larval rearing. Rev. Aquac. 5, S26–S58. doi: 10.1111/j.1753-5131.2012.01086.x
Harada, A. E., Lindgren, E. A., Hermsmeier, M. C., Rogowski, P. A., Terrill, E., and Burton, R. S. (2015). Monitoring spawning activity in a southern California marine protected area using molecular identification of fish eggs. PLOS One 10:e0134647. doi: 10.1371/journal.pone.0134647
Hou, G., Chen, W.-T., Lu, H.-S., Cheng, F., and Xie, S.-G. (2017). Developing a DNA barcode library for perciform fishes in the South China Sea: species identification, accuracy and cryptic diversity. Mol. Ecol. Resou. 00, 1–11. doi: 10.1111/1755-0998.12718
Hou, G., Wang, J., Liu, L., Chen, Y., Pan, C., Lin, J., et al. (2021a). Assemblage structure of the ichthyoplankton and its relationship with environmental factors in spring and autumn off the Pearl River estuary. Front. Mar. Sci. 8:732970. doi: 10.3389/fmars.2021.732970
Hou, G., Chen, Y., Wang, S., Wang, J., Chen, W., and Zhang, H. (2021b). Formalin-fixed fish larvae could be effectively identified by DNA barcodes: a case study on thousands of specimens in South China Sea. Front. Mar. Sci. 8:634575. doi: 10.3389/fmars.2021.634575
Hsieh, C.-H., Chen, C.-S., and Chiu, T.-S. (2005). Composition and abundance of copepods and ichthyoplankton in Taiwan Strait (western North Pacific) are influenced by seasonal monsoons. Mar. Freshw. Res. 56, 153–161. doi: 10.1071/MF04058
Hsieh, H.-Y., Lo, W.-T., Chen, H.-H., and Meng, P.-J. (2016). Larval fish assemblages and hydrographic characteristics in the coastal waters of southwestern Taiwan during non- and post-typhoon summers. Zool. Stud. 55, 18. doi: 10.6620/ZS.2016.55-18
Huang, D., Zhang, X., Jiang, Z., Arbi, I., Jiang, X., Huang, X., et al. (2017). Seasonal fluctuations of ichthyoplankton assemblage in the northeastern South China Sea influenced by the Kuroshio intrusion. J. Geophys. Res. Oceans 122, 7253–7266. doi: 10.1002/2017JC012906
Hubert, N., Espiau, B., Meyer, C., and Planes, S. (2015). Identifying the ichthyoplankton of a coral reef using DNA barcodes. Mol. Ecol. Resour. 15, 57–67. doi: 10.1111/1755-0998.12293
Kerr, M., Browning, J., Bønnelycke, E., Zhang, Y., Hu, C., Armenteros, M., et al. (2020). DNA barcoding of fish eggs collected off northwestern Cuba and across the Florida Straits demonstrates egg Transport by mesoscale eddies. Fish. Oceanogr. 29, 340–348. doi: 10.1111/fog.12475
Ko, H.-L., Wang, Y.-T., Chui, T.-S., Lee, M.-A., Leu, M.-Y., Chang, K.-Z., et al. (2013). Evaluating the accuracy of morphological identification of larval fishes by applying DNA barcoding. PLoS One 8:e53451. doi: 10.1371/journal.pone.0053451
Lechner, A., Keckeis, H., and Humphries, P. (2016). Patterns and processes in the drift of early developmental stages of fish in rivers: a review. Rev. Fish Biol. Fish. 26, 471–498. doi: 10.1007/s11160-016-9437-y
Li, K., Yin, J., Huang, L., and Lin, Z. (2014). Seasonal variations in diversity and abundance of surface ichthyoplankton in northern South China Sea. Acta Oceanol. Sin. 33, 145–154. doi: 10.1007/s13131-014-0533-3
Lin, B. A., Wang, Y. W., Li, J. L., Kang, B., Fang, L. P., Zheng, L. M., et al. (2020). First records of small juveniles of the red drum Sciaenops ocellatus (Linnaeus, 1766) in a subtropical mangrove habitat of China. BioInvasions Rec. 9, 96–102. doi: 10.3391/bir.2020.9.1.13
Lin, J., You, Y., and Liu, G. (2018). Numerical research of the tidal currents in Sansha Bay. J. Fish. Res. 40, 413–424. doi: 10.14012/j.cnki.fjsc.2018.06.001
Lin, N., Jiang, Y., Yuan, X., Ling, J., Yang, L., and Li, S. (2013). Reproductive biology of Nibea albiflora in Xiangshan Bay. Mar. Fish. 35, 389–395.
Liu, H., Mao, X., and Wang, B. (1998). A preliminary study on technique for fully artificial breeding of red drum Sciaenops ocellatus. J. Fish. Sci. China 5, 114–116.
Liu, M., and Sadovy de Mitcheson, Y. (2008). Profile of a fishery collapse: why mariculture failed to save the large yellow croaker. Fish Fish. 9, 219–242. doi: 10.1111/j.1467-2979.2008.00278.x
Liu, M., Jiang, Y., Zheng, L. M., Yang, W. D., and Chen, D. (2020a). Large Yellow Croaker (Larimichthys crocea) Stock Assessment in its Spawning Protection Area. Xiamen: Xiamen University, 216.
Liu, M., Cheng, J.-H., Nguyen Van, Q., Sasaki, K., Hoshino, K., Sakai, T., et al. (2020b). Larimichthys crocea. The IUCN Red List of Threatened Species 2020, e.T49182559A49239394.
Llopiz, J. K., Cowen, R. K., Hauff, M. J., Ji, R., Munday, P. L., Muhling, B. A., et al. (2014). Early life history and fisheries oceanography: new questions in a changing world. Oceanography 27, 26–41. doi: 10.5670/oceanog.2014.84
Lopes, R. M., Katsuragawa, M., Dias, J. F., Montú, M. A., Muelbert, J. H., Gorri, C., et al. (2006). Zooplankton and ichthyoplankton distribution on the southern Brazilian shelf: an overview. Sci. Mar. 70, 189–202. doi: 10.3989/scimar.2006.70n2189
MacKenzie, B., John, M. S., and Wieland, K. (1996). Eastern Baltic cod: perspectives from existing data on processes affecting growth and survival of eggs and larvae. Mar. Ecol. Prog. Ser. 134, 265–281. doi: 10.3354/meps134265
Madeira, D., Madeira, C., Costa, O. M., Vinagre, C., Pörtner, H.-O., and Diniz, M. S. (2020). Different sensitivity to heatwaves across the life cycle of fish reflects phenotypic adaptation to environmental niche. Mar. Environ. Res. 162, 105192. doi: 10.1016/j.marenvres.2020.105192
Marshall, S., and Elliott, M. (1998). Environmental influences on the fish assemblage of the Humber estuary. U.K. Estuar. Coast. Shelf Sci. 46, 175–184. doi: 10.1006/ecss.1997.0268
McCain, J. S. P., Cull, D. J., Schneider, D. C., and Lotze, H. K. (2016). Long-term shift in coastal fish communities before and after the collapse of Atlantic cod (Gadus morhua). ICES J. Mar. Sci. 73, 1415–1426. doi: 10.1093/icesjms/fsv216
Muhling, B. A., Beckley, L. E., Koslow, J. A., and Pearce, A. F. (2008). Larval fish assemblages and water mass structure off the oligotrophic south-western Australian coast. Fish. Oceanogr. 17, 16–31. doi: 10.1111/j.1365-2419.2007.00452.x
Nakagawa, Y., Senoo, S., and Miyashita, S. (2007). Protozoa and diatom as primary sources for larvae of the Blue Spotted Snapper Lutjanus rivulatus. Aquacult. Sci. 55, 125–300.
Nakamura, I., and Parin, N. V. (1993). FAO Species Catalogue: Snake Mackerels and Cutlass Fishes of the World (Families Gempylidae and Trichiuridae), Vol. 125. Rome: Food and Agriculture Organization of the United Nations, 99–107.
Nakamura, Y. (1998). Biomass, feeding and production of Noctiluca scintillans in the Seto Inland Sea. Japan. J. Plankton. Res. 20, 2213–2222. doi: 10.1093/plankt/20.11.2213
Nelson, J. S., Grande, T. C., and Wilson, M. V. H. (2016). Fishes of the World, 5th Edn. Hoboken, NJ: John Wiley & Sons, Inc.
Oeberst, R., Klenz, B., Gröhsler, T., Dichey-Collas, M., Nash, R. D. M., and Zimmermann, C. (2009). When is year-class strength determined in western Baltic herring? ICES J. Mar. Sci. 66, 1667–1672. doi: 10.1093/icesjms/fsp143
Olivar, M. P. (1990). Spatial patterns of ichthyoplankton distribution in relation to hydrographic features in the Northern Benguela region. Mar. Biol. 106, 39–48. doi: 10.1007/bf02114672
Oliveira, E. C., and Ferreira, E. J. C. (2008). Spawning areas, dispersion and microhabitats of fish larvae in the Anavilhanas Ecological Station, rio Negro, Amazonas State, Brazil. Neotrop. Ichthyol. 6, 559–566. doi: 10.1590/s1679-62252008000400003
Ou, Y., Liao, R., Li, J., and Gou, X. (2012). Studies on the spawning period and growth of Collichthys lucidus in estuary of Pearl River based on otolith daily annulus. J. Oceanogr. Taiwan Strait. 31, 85–88.
Parrish, R. H., Nelson, C. R., and Bakun, A. (1981). Transport mechanisms and reproductive success of fishes in the California current. Biol. Oceanogr. 1, 175–203.
Pauly, D., and Pullin, R. S. V. (1988). Hatching time in spherical, pelagic, marine fish eggs in response to temperature and egg size. Environ. Biol. Fish. 21, 261–271. doi: 10.1007/bf00004892
Petitgas, P., Rijnsdorp, A. D., Dickey-Collas, M., Engelhard, G. H., Peck, M. A., Pinnegar, J. K., et al. (2013). Impacts of climate change on the complex life cycles of fish. Fish Oceanogr. 22, 121–139. doi: 10.1111/fog.12010
Pielou, E. C. (1966). The measurement of diversity in different types of biological collections. J. Theor. Biol. 13, 131–144. doi: 10.1016/0022-5193(66)90013-0
Pinkas, L., Oliphant, M. S., and Iverson, I. L. K. (1971). Food habits of albacore, bluefin tuna and bonito in California waters. Fish Bull. 152, 1–105. doi: 10.1201/b18714-2
Platt, T., Fuentes-Yaco, C., and Frank, K. T. (2003). Spring algal bloom and larval fish survival. Nature. 423, 397–398. doi: 10.1038/423398b
Pombo, L., Elliott, M., and Rebelo, J. E. (2005). Environmental influences on fish assemblage distribution of an estuarine coastal lagoon. Ria de Aveiro (Portugal). Sci. Mar. 69, 143–159. doi: 10.15517/rbt.v57i1-2.11293
Quevedo, M., Gonzalez-quiros, R., and Anadon, R. (1999). Evidence of heavy predation by Noctiluca scintillans on Acartia clausi (Copepoda) eggs off the central Cantabrian coast (NW Spain). Oceanol. Acta. 22, 127–131. doi: 10.1016/S0399-1784(99)80039-5
Rakocinski, C. F., Lyczkowski-Shultz, J., and Richardson, S. L. (1996). Ichthyoplankton assemblage structure in Mississippi sound as revealed by canonical correspondence analysis. Estua. Coast. Shelf Sci. 43, 237–257. doi: 10.1006/ecss.1996.0067
Ramos, S., Paris, C., and Angélico, M. M. (2017). Larval fish dispersal along an estuarine–ocean gradient. Can. J. Fish. Aquat. Sci. 1, 1462–1473. doi: 10.1139/cjfas-2016-0325
Rautio, M. (2001). Zooplankton assemblages related to environmental characteristics in threeline ponds in Finnish Lapland. Arct. Antarct. Alp. Res. 33, 289–298. doi: 10.1080/15230430.2001.12003433
Rijnsdorp, A. D., Peck, M. A., Engelhard, G. H., and Möllmann, C. and Pinnegar, J. K. (2009). Resolving the effect of climate change on fish populations. ICES J. Mar. Sci. 66, 1570–1583. doi: 10.1093/icesjms/fsp056
Rodríguez, J. M., Hernández-León, S., and Barton, E. D. (2006). Vertical distribution of fish larvae in the Canaries-African coastal transition zone in summer. Mar. Biol. 149, 885–897. doi: 10.1007/s00227-006-0270-z
Rodriguez, J. M. (2019). Assemblage structure of ichthyoplankton in the NE Atlantic in spring under contrasting hydrographic conditions. Sci. Rep. 9:8363. doi: 10.1038/s41598-019-44918-5
Santos, R. V. S., Ramos, S., and Bonecker, A. C. T. (2017). Environmental control on larval stages of fish subject to specific salinity range in tropical estuaries. Reg. Stud. Mar. Sci. 13, 42–53. doi: 10.1016/j.rsma.2017.03.010
Shannon, C. E., and Wiener, W. (1963). The Mathematical Theory of Communication. Champaign, IL: University of Illinois Press.
Shao, K. T., Yang, R. S., Chen, K. C., and Lee, Y. S. (2001). An Identification Guide of Marine Fish Eggs from Taiwan. Taipei: Institute of Zoology, Academia Sinica.
Shen, C. (2011). Species composition and abundance temporal-spatial distribution of fish egg, larvae and juveniles in Sansha Bay of Fujian. Mar. Fish. 33, 361–367.
Siokou-Frangou, I., Papathanassiou, E., Lepretre, A., and Frontier, S. (1998). Zooplankton assemblages and influence of environmental parameters on them in a Mediterranean coastal area. J. Plankton. Res. 20, 847–870. doi: 10.1093/plankt/20.5.847
Slotwinski, A., Coman, F., and Richardson, A. J. (2014). Introductory Guide to Zooplankton Identification. Brisbane, QID: Integrated Marine Observing System.
Šmilauer, P., and Lepš, J. (2014). Multivariate Analysis of Ecological Data Using CANOCO 5. Cambridge: Cambridge University Press.
Sun, S., Li, C., Cheng, F., Jin, X., and Yang, B. (2015). Atlas Of Common Zooplankton of the Chinese Costal Seas. Beijing: Ocean Press.
Umani, S. F., Beran, A., Parlato, S., Virgilio, D., Zollet, T., Olazabal, A. D., et al. (2004). Noctiluca scintillans Macartney in the Northern Adriatic Sea: long-term dynamics, relationships with temperature and eutrophication, and role in the food web. J. Plankton. Res. 26, 545–561. doi: 10.1093/plankt/fbh045
Vandendriessche, S., Costa, A. M., and Hostens, K. (2016). “Wind farms and their influence on the occurrence of ichthyoplankton and squid larvae,” in Environmental Impacts of Offshore Wind Farms in the Belgian Part of the North Sea: Environmental impact monitoring reloaded, eds S. Degraer, R. Brabant, B. Rumes, and L. Vigin (Brussels: Royal Belgian Institute of Natural Sciences), 117–140.
Vilchis, L. I., Balance, L. T., and Watson, W. (2009). Temporal variability of neustonic ichthyoplankton assemblages of the eastern Pacific warm pool: Can community structure be linked to climate variability. Deep-Sea Res. Part I. 56, 125–140. doi: 10.1016/j.dsr.2008.08.004
Wan, R. J., and Zhang, R. Z. (2016). Fish Eggs, Larvae and Juveniles in the Offshore Waters of China and Their Adjacent Waters. Shanghai: Shanghai Scientific and Technical Publishers.
Wang, B., and Ji, B. (1996). On techniques for rearing fries of Sciaenops ocellatus. Shandong Fish. 13, 21–23.
Wang, J., Lin, Y., Zhou, M., and Liu, Y. (2010). The ecological distribution of fish eggs and larvae in Sansha Bay, Fujian. J. Xiamen Univ. (Natural Science) 49, 116–121.
Wang, X., Liu, Y., and Guo, W. (2019). Evaluation of environmental quality and change trend in Sansha Bay mariculture area in recent ten years. J. Fish. Res. 41, 519–525.
Wang, Y. H., Ma, Y., and Tao, B. C. (2006). Effect of temperature and salinity on the hatching rate of Gilthead Seabream, Sparus aurata. Fish. Mod. 5, 21–22.
Ward, R. D., Zemlak, T. S., Innes, B. H., Last, P. R., and Hebert, P. D. (2005). DNA barcoding Australia’s fish species. Phil. Trans. R. Soc. B. 360, 1847–1857. doi: 10.1098/rstb.2005.1716
Woynarovich, E., and Horváth, L. (1984). “Chapter 4: Artificial propagation of finfish,” in The Artificial Propagation of Warm-Water Finfishes-A Manual for Extension. FAO Fish. Tech. Pap. (201), (Rome: FAO), 183.
Wu, H. (1985). “Scombridae,” in The Fishes of Fujian Province (Part II), ed. Y. Chu (Fujian: Fujian Science and Technology Press), 404–424.
Xu, Z. (2018). Resources and Environmental Characteristics in Wild Large Yellow Croaker (Larimichthys crocea) Breeding Waters of Guanjingyang. Beijing: Ocean Press.
Xu, Z., and Chen, J. (2015). Migratory routes of Trichiurus lepturus in the East China Sea, Yellow Sea and Bohai Sea. J. Fish. China 39, 824–835.
Yu, Z. Y., Lian, Z. S., Zhu, Y. G., Wang, W. Y., and Ni, Z. Q. (1988). “Fishery natural environment and resources,” in Fujian Province Fishery Resources, ed. Z. Q. Ni (Fujian: Fujian Science and Technology Press), 1–65.
Zhan, W., Luo, B., Chen, R.-Y., Mao, G.-M., Liu, F., Xu, D.-D., et al. (2016). Observation of embryonic larva and juvenile development of small yellow croaker, Larimichthys polyactis. Oceanol. Limnol. Sin. 47, 1033–1039.
Zhang, G. (2020). Study on the Diversity and Assemblage Structure of Fish Eggs and Larvae in Daya Bay and Adjacent Waters. MSc dissertation. Xiamen: Xiamen University.
Zhang, H., Xian, W., and Liu, S. (2015). Ichthyoplankton assemblage structure of spring in the Yangtze Estuary revealed by biological and environmental visions. PeerJ. 3, e1186. doi: 10.7717/peerj.1186
Zhang, H., Xian, W., and Liu, S. (2016). Autumn ichthyoplankton assemblage in the Yangtze Estuary shaped by environmental factors. PeerJ. 4:e1922. doi: 10.7717/peerj.1922
Zhang, R. Z., Lu, S. F., and Zhao, C. Y. (1985). Fish Eggs and Larvae in the Offshore Waters of China. Shanghai: Shanghai Scientific and Technical Publishers.
Zhang, S., Li, C., Cheung, S., Sun, M., Song, S., Guo, W., et al. (2020). Snapshot of peptidomics of the red time forming species Noctiluca scintillans. Front. Mar. Sci. 7:569807. doi: 10.3389/fmars.2020.569807
Zhang, W., Zhao, N., Tao, Z., and Zhang, C. (2010). Illustrated Guide to Marine Planktonic Copepods in China Seas. Beijing: Science Press.
Zhou, M., Lin, Y., Yang, S., Cao, W., and Zheng, L. (2011). Composition and ecological distribution of ichthyoplankton in eastern Beibu Gulf. Acta Oceanol. Sin. 30, 94–105. doi: 10.1007/s13131-011-0095-6
Keywords: abiotic and biotic factors, Chinese waters, DNA barcoding, fish eggs and larvae, spatial and temporal distribution
Citation: Jiang Y, Lin B-a, He H-y, Ding G-m, Yan L-t, Zhang G, Liu M and Zheng L-m (2021) Species Composition and Assemblages of Ichthyoplankton in Sansha Bay, Fujian Province, China. Front. Mar. Sci. 8:758089. doi: 10.3389/fmars.2021.758089
Received: 13 August 2021; Accepted: 08 November 2021;
Published: 07 December 2021.
Edited by:
Hui Zhang, Institute of Oceanology, Chinese Academy of Sciences (CAS), ChinaReviewed by:
Gang Hou, Fisheries College, Guangdong Ocean University, ChinaBruce Pfirrmann, University of South Carolina, United States
Copyright © 2021 Jiang, Lin, He, Ding, Yan, Zhang, Liu and Zheng. This is an open-access article distributed under the terms of the Creative Commons Attribution License (CC BY). The use, distribution or reproduction in other forums is permitted, provided the original author(s) and the copyright owner(s) are credited and that the original publication in this journal is cited, in accordance with accepted academic practice. No use, distribution or reproduction is permitted which does not comply with these terms.
*Correspondence: Min Liu, minliuxm@xmu.edu.cn; Lian-ming Zheng, zhlm@xmu.edu.cn
†Present address: Yan Jiang, State Key Laboratory of Marine Pollution, City University of Hong Kong, Kowloon Tong, Hong Kong SAR, China