 Serena R. Wright1*David Righton1Joachim Naulaerts2Robert J. Schallert3Chris A. Griffiths1,4Taylor Chapple3,5Daniel Madigan3Vladimir Laptikhovsky1Victoria Bendall1Rhys Hobbs2Doug Beare6Elizabeth Clingham7Barbara Block3Martin A. Collins8
- 1Centre for Environment Fisheries and Aquaculture Science, Lowestoft, United Kingdom
- 2Marine and Fisheries Conservation Section, Environment, Natural Resources & Planning Portfolio, St Helena Government, Jamestown, Saint Helena
- 3Hopkins Marine Station, Tuna Research and Conservation Center, Stanford University, Pacific Grove, CA, United States
- 4Department of Animal and Plant Sciences, University of Sheffield, Sheffield, United Kingdom
- 5Hatfield Marine Science Center, Oregon State University, Newport, OR, United States
- 6ICCAT Secretariat, Madrid, Spain
- 7Foreign, Commonwealth and Development Office, Jamestown, Saint Helena
- 8British Antarctic Survey, NERC, Cambridge, United Kingdom
The yellowfin tuna (Thunnus albacares: YFT) is a widely distributed, migratory species that supports valuable commercial fisheries. Landings of YFT are seasonally and spatially variable, reflecting changes in their availability and accessibility to different fleets and metiers which, in turn, has implications for sustainable management. Understanding the dynamics of YFT behaviour and how it is affected by biological and ecological factors is therefore of consequence to fisheries management design. Archival and pop-up satellite tags (PSAT) were used in the South Atlantic Ocean around St Helena between 2015 and 2020 to collect information on the movements, foraging and locomotory behaviour of YFT. The study aimed to (1) identify vertical behaviour of YFT within St Helena’s EEZ; (2) assess the timing and depth of potential feeding events and (3) to use the information to inform on the catchability of YFT to the local pole and line fishing fleet. Results indicate that the YFT daytime behaviour shifted between shallow with high incidence of fast starts in surface waters in summer months (December to April), to deep with high incidence of strikes at depth in colder months (May to November). Catchability of YFT was significantly reduced between May and November as YFT spent more time at depths below 100 m during the day, which coincides with a reduction in the quantity of YFT caught by the inshore fleet.
Introduction
The yellowfin tuna (Thunnus albacares; YFT) is distributed throughout the tropical and subtropical oceans (FAO, 2020), with most YFT landed in the Atlantic Ocean targeted by sub-surface fishing gear (FAO, 2020). Its global distribution and accessibility in surface waters (Schaefer et al., 2014) makes YFT a commercially important species for many communities, particularly small island developing states and other remote islands. Though the spatial range of the species is important for management, the vertical distribution of YFT in the water column can also have implications on their availability to fishers in space and time.
Electronic tags have been used to provide an in-depth understanding of spatio-temporal movements and behaviour (Block et al., 2005) and fisheries mortality (Kurota et al., 2009). These tags provide a means of obtaining high-resolution data sampled over prolonged periods of time (sometimes over several years), which has been used to increase knowledge of tuna behaviour, including the environmental drivers of movement and habitat utilisation (Schaefer et al., 2007). Vertical movement analysis from previous tag studies show that YFT often remain at depths above the thermocline, though deeper waters are frequented depending on the foraging strategy of the tuna, with deep diving during the day between 200 and 400 m (targeting prey in the deep scattering layer) (Schaefer et al., 2007), and occasional deep dives in excess of 1,000 m (Dagorn et al., 2006; Schaefer et al., 2007, 2011). YFT habitat use varies with age with greater daytime average depths for larger fish (Schaefer et al., 2007). The drivers of changes in habitat use for YFT can include temperature, chlorophyll a and dissolved oxygen (Pecoraro et al., 2017), with temperature identified as the most influential environmental variable at a large spatial scale (Schaefer et al., 2007).
In recent years electronic tagging has been used to help validate stock assessment methods and to explore the accuracy of abundance estimates in support of fisheries management, as reviewed in Sippel et al. (2015). Abundance estimates from fishery-dependent data such as catch per unit effort (CPUE) needs to be standardised to help account for factors which affect CPUE but are not related to changes in abundance such as catchability (Lynch et al., 2012). Catchability can therefore be used to correct for gear-related biases in CPUE, thus improving population biomass estimates which are based on catch statistics (Goodyear et al., 2003). For example, deep longlining gears can result in the overestimation of abundance of pelagic species like bigeye tuna (Thunnus obesus) and underestimates of abundance of epipelagic species like sailfish (Ward and Myers, 2005).
To assess the catchability of a population to specific gears, the vertical behaviour of fish can be studied using electronic tags (Ward and Myers, 2005). However, other factors which may affect catchability must also be considered. For example in visual predators like YFT, limitations in visibility at night may reduce catchability by surface gears during this time as tuna are unlikely to see and consume bait. Thus, the inclusion of information about the feeding behaviour of the fish is also important and can improve estimates of catchability (Ward and Myers, 2005). Accelerometers can provide a means to estimate the depths that feeding may happen by extracting the periods of time when fast-starts (bursts in acceleration) occur (Rice and Hale, 2010; Broell et al., 2013; Gleiss et al., 2013). Fast starts represent brief and sudden accelerations which are used by fish during predator and prey encounters (Domenici and Blake, 1997). Recent tagging studies on bluefin tuna (Thunnus thynnus) show the potential that accelerometers have to record kinematics of large tuna in the wild (Gleiss et al., 2019).
In the South Atlantic, YFT are mostly caught by purse seine and longline fleets operating in and around the Gulf of Guinea (ICCAT, 2019). Bait boats are also used to target YFT, including around the remote island of St Helena (−5.7089 longitude, -15.965 latitude). Within St Helena’s Exclusive Economic Zone (EEZ), YFT are caught throughout the year by a local artisanal fishery that catches between 100 and 400 tonnes of YFT per year using pole and line methods (Collins, 2017). Recent analysis of the horizontal movements of tagged YFT indicates that there is a high degree of fidelity to the area (Wright et al., 2021). Results from this study are summarised in Figure 1. Landings of YFT can vary seasonally for the inshore fishing fleet, with the drivers of this seasonality in fishing success remaining uncertain, though this could be linked to changes in fishing effort, or changes in the vertical behaviour and catchability of YFT on the grounds targeting tuna.
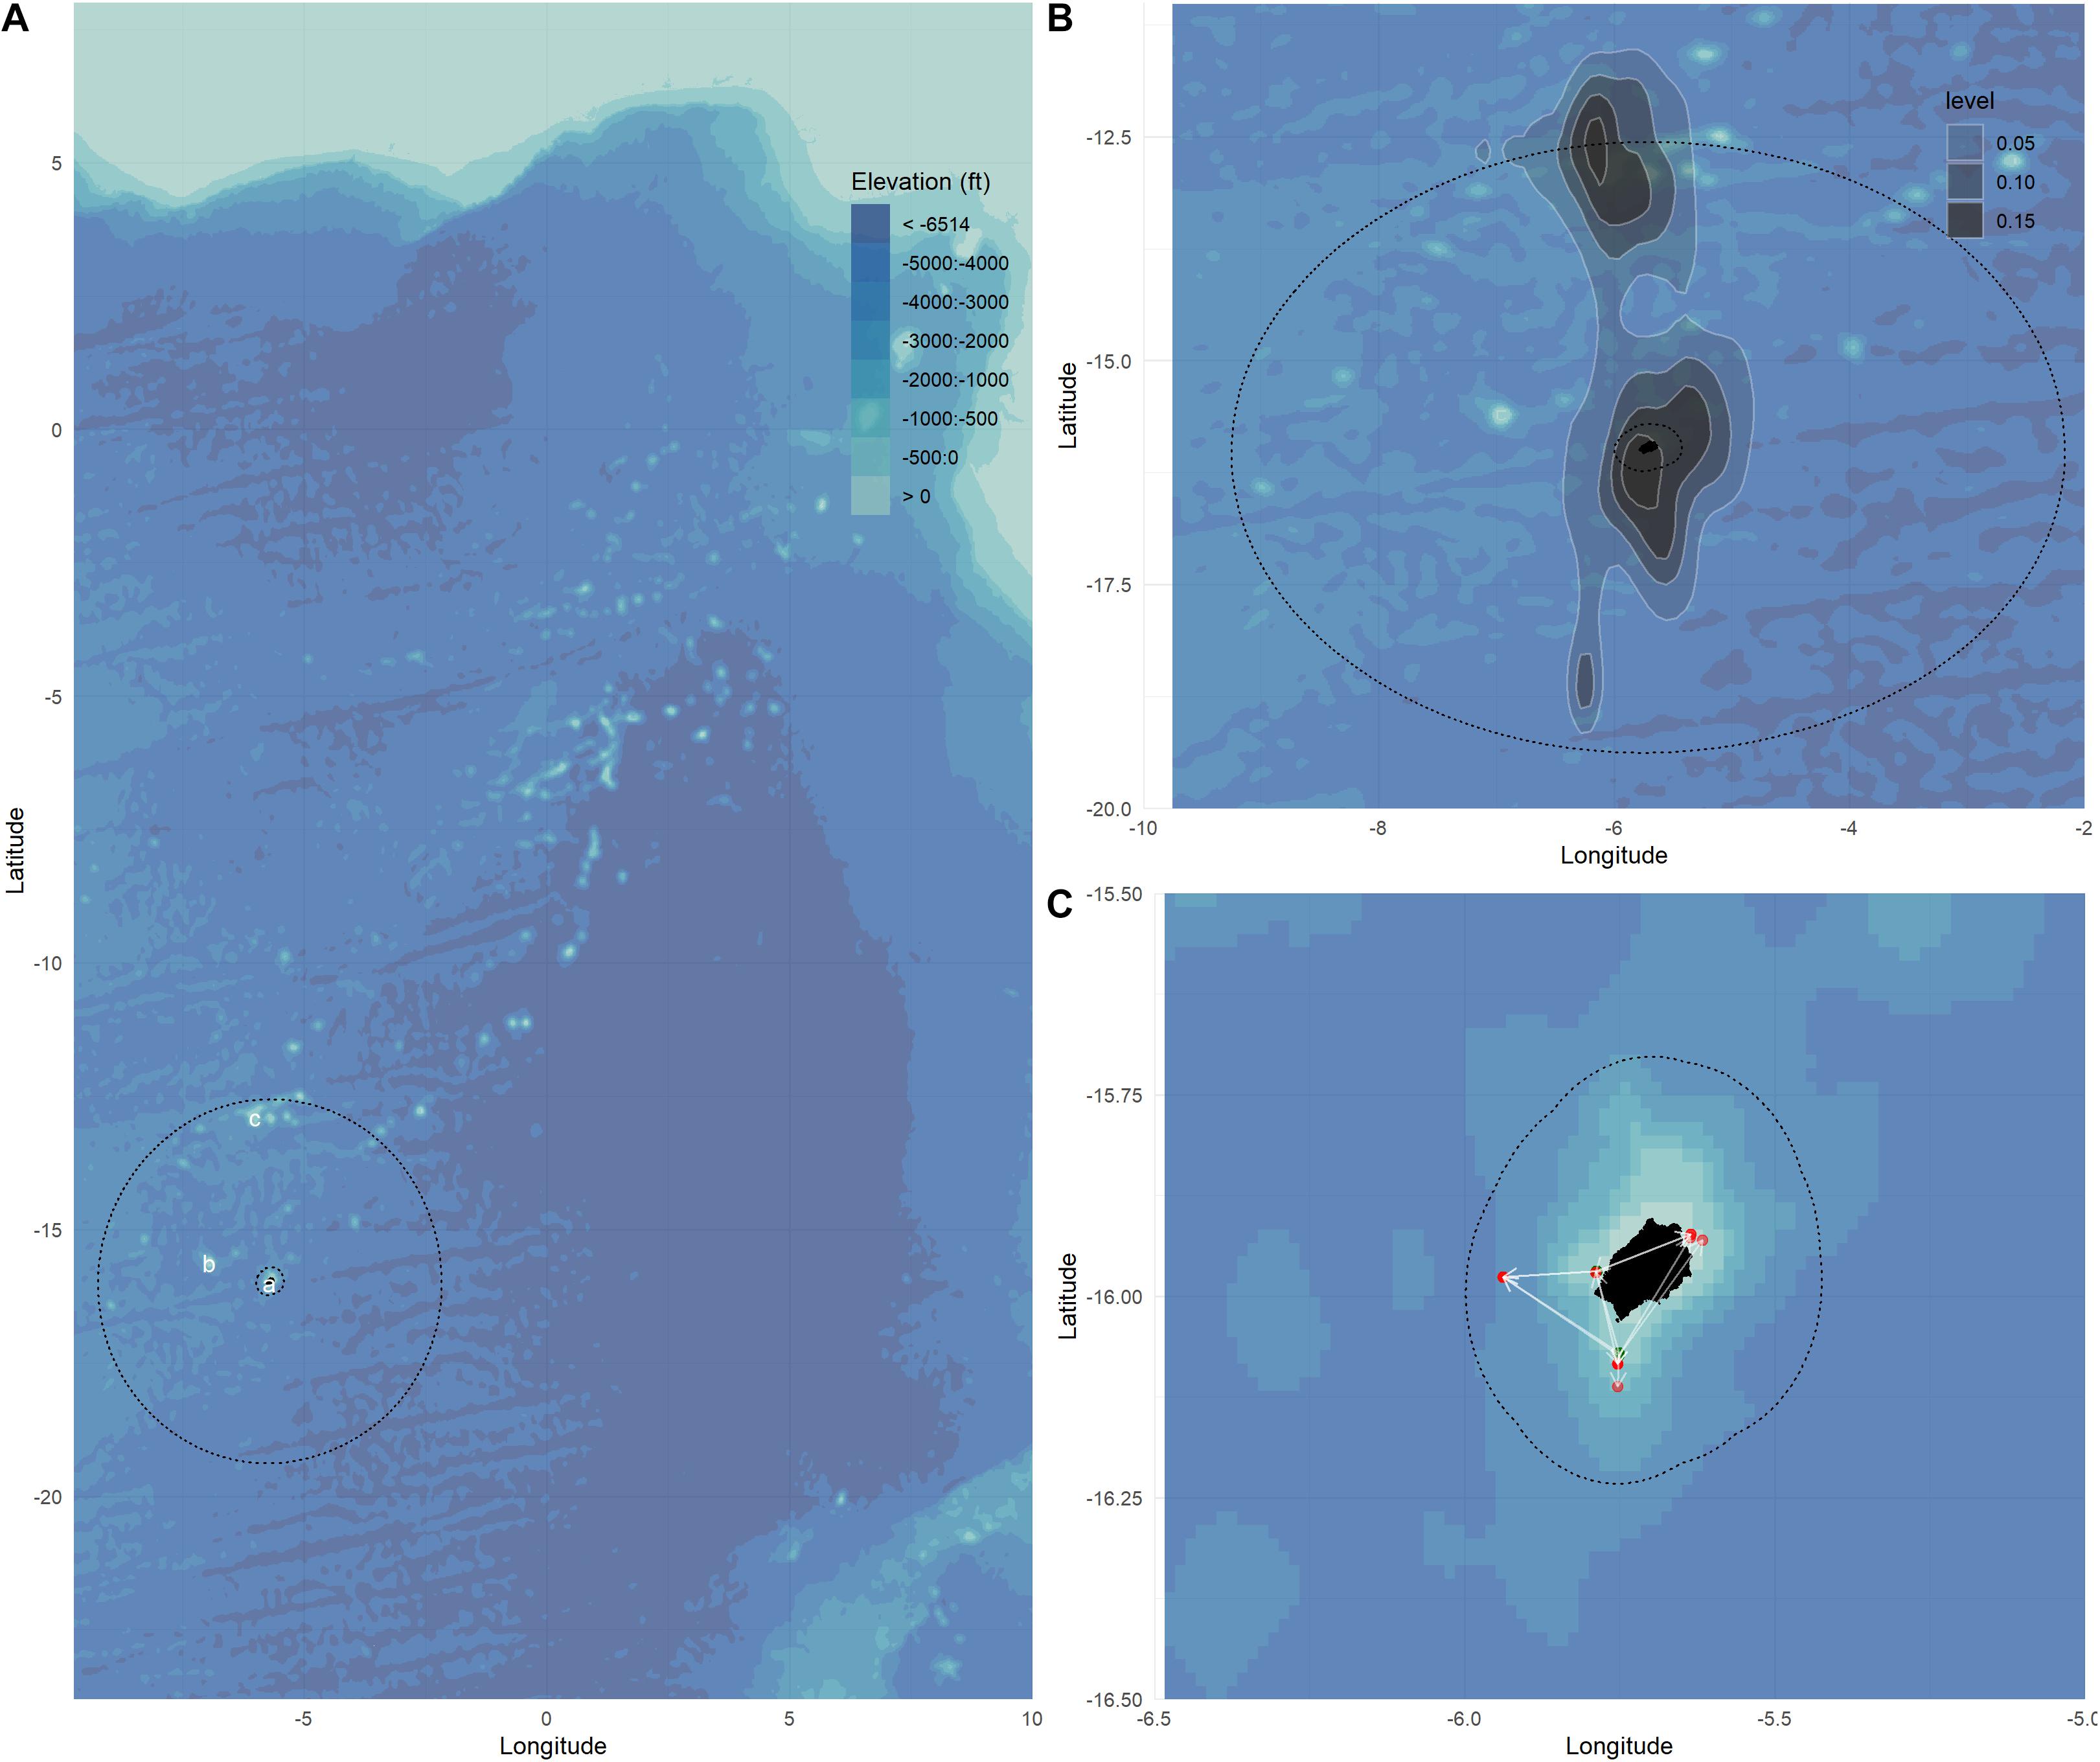
Figure 1. (A) The St Helena Exclusive Economic Zone (EEZ) in the South Atlantic including the fishing regions inshore (a), Bonaparte Seamount (b), and Cardno Seamount (c). (B) Map showing the kernel density of daily position estimates from satellite tagged tuna, and (C) release (green) and recovery (red) locations for archivally tagged yellowfin tuna. Bathymetry provided from the General Bathymetric Chart of the Oceans, GEBCO (ca. 1 km grid size) (Schenke, 2016).
The aim of this study is therefore threefold: (1) to identify the seasonal and diurnal vertical behaviour of YFT within St Helena’s EEZ, (2) to combine depth and acceleration measurements to assess the timing and depth of potential feeding events, and (3) to use the information from (1) and (2) to inform on the catchability of YFT to the local pole and line fishing fleet.
Materials and Methods
Study Area
There are three main tuna fishing areas in St Helena’s EEZ: inshore regions (within 30 miles of land), Bonaparte Seamount to the north west of St Helena and Cardno Seamount to the north of St Helena, just inside the 200 nautical mile EEZ boundary (Figure 1A). Electronic tags (archival and PSAT) were deployed inshore and at Cardno Seamount, reflecting the fishing regions closest to land and at the limits of St Helena’s EEZ boundary.
Tag Deployments
The yellowfin tuna were caught using hook-and-line methods with barbless circle hooks and live or cut bait (Scomber colias or Decapterus sp.). Once on the vessel, a YFT was placed in a v-shaped sponge lined with marine plastic, and a saltwater hose was immediately inserted into it’s mouth to oxygenate the gills and a soft cloth soaked in a protective solution (PolyAqua®) was placed over the eyes. Methods used for specific electronic tag deployments are detailed in Wright et al. (2021). Briefly, YFT were tagged with MiniPAT satellite tags (Wildlife Computers, Redmond, WA, United States, n = 22) in November 2016 and December 2018 using methods detailed in Schaefer et al. (2007). Satellite tags which were recovered recorded depth, temperature, light and acceleration at between 1 and 5 s resolution. Archival tags were deployed on YFT in March 2018 (n = 48), December 2018 (n = 16) and January 2019 (n = 8). YFT tagged with archival devices were released with Cefas Technology Limited1 G5 tags (with a conventional tag attached), or Lotek ArcGeo tags2. Tagging methods for G5 tag releases are provided in Wright et al. (2021). Lotek tag releases were deployed using the same methods as G5 tags, except without anaesthesia and local analgesia. Archival tags were programmed to record depth and temperature at 1 min resolution. For the present study only recovered tags were included in the analysis.
Once electronically tagged, YFT were also double tagged with conventional tags on each side of the second dorsal fin. All YFT were measured (curved fork length; CFL or straight fork length; SFL), and a proportion were sampled for genetics (fin clip) and stable isotope analysis (muscle biopsy). CFL was standardised to SFL using a conversion factor [SFL = 8 + 0.96 cm CFL (Scida et al., 2001)]. All future lengths refer to SFL.
A reward of £100 was paid for YFT returned with archival or PSAT tags. Tagged YFT were either returned opportunistically or commercially landed. Data on recovery location, size of fish, sex, and maturity were recorded when possible.
Commercial Landings
All commercially caught YFT (tagged or not) were landed at the St Helena Fisheries Corporation processing plant. The gilled and gutted weight of all YFT (combined weights, but also individual weights where possible) were collected from landings data between 2015 and 2020.
Analytical Methods
Initial processing of the data returned from the tags was carried out by trimming the time series data based on the release and recapture date. A range of movement metrics were then calculated for each recovered fish: including dominant day/night behaviour and time spent below and above specific temperatures and depths, as detailed below. Analysis of YFT vertical movement was conducted in R (R-4.0.2), with all non-geographical figures created using ggplot2 (version 3.3.2).
Vertical Movements
The depth and temperature experience of YFT was aggregated and summarised by day. The time of day was distinguished using the sunrise.set function from the “StreamMetabolism” package (Sefick, 2016). A 30-min buffer before and after sunrise and sunset was used to define the crepuscular phase. Comparisons of monthly average depth during the day and during the night were compared using a two-sample Wilcoxon test with significance set at P<0.05. To assess the level of lunar illumination each night, the lunar.illumination function was used from the “Lunar” package (version 0.1-04, Lazaridis, 2014). Comparisons of the mean depth during the night with the lunar illumination were made using the Wilcoxon test (P < 0.05).
Daily behavioural classification was carried out to assess whether YFT were significantly deeper during the day compared to the night. The twilight phase was excluded for this analysis to ensure that only depth during the day and night were compared. Similar methods for the classification of the vertical movements were used in Griffiths et al. (2020). Based on the outcome of a two-sample Wilcoxon test, each 24-h cycle was classified as: (1) diel vertical migration (DVM), (2) reverse diel vertical migration (rDVM), or (3) no difference in depth. If depth was significantly deeper during the day than during the night, the fish was considered to be exhibiting DVM. If the reverse was true, the fish was exhibiting rDVM. Alternatively, if the Wilcoxon test yielded a non-significant result (P > 0.05), the day was classified as having no significant difference between day and night. To investigate seasonal changes, time spent in each vertical movement behaviour was summarised by calendar month.
Measurement of “Fast Starts”
For recovered PSAT tags (tuna 1116004, 1116009, and 83842), analysis was carried out on depth, temperature and acceleration signals. Depth, temperature and acceleration were recorded at 1 s (tuna 1116004) and 5 s resolution (1116009 and 83842). An example trace for tuna 1116009 is provided in Supplementary Figure 1. For consistency, all traces were standardised to 5 s resolution prior to processing. Acceleration was recorded on three axes of motion reflecting surge (X), heave (Y), and sway (Z) of the tuna, providing the pitch angle of the YFT and the magnitude of acceleration. Pitch angle was calculated from static surging acceleration [pitch = arcsine (α static surge) – β], where pitch (°) refers to the animal’s orientation with regard to the horizontal plane, α static surge refers to the smoothed surging acceleration and β to the offset of the tag’s axis in relation to the animal’s axis (Figure 2). β was determined using the method described in Kawatsu et al. (2010), by using the regression of vertical velocity and pitch. The magnitude of acceleration (MA) was calculated as the vector norm:
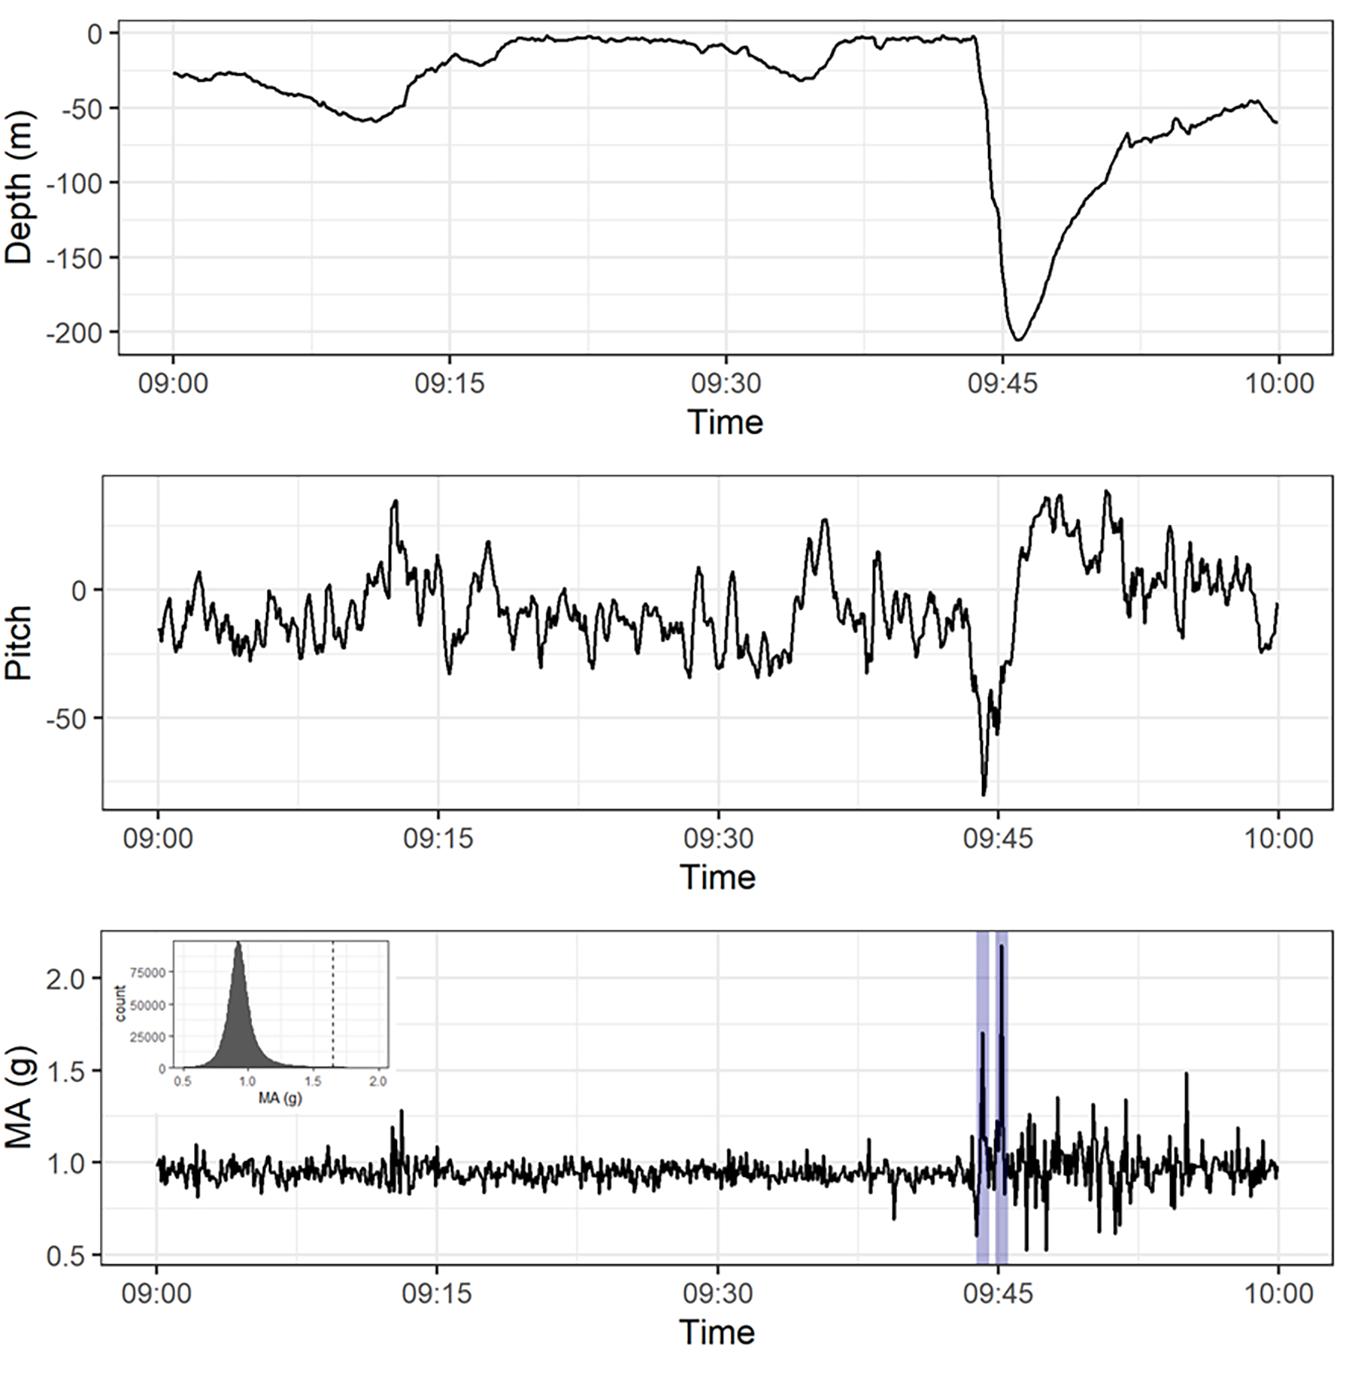
Figure 2. Depth, pitch, and magnitude of acceleration (MA) for yellowfin tuna 1116009 between 09:00 and 10:00 on 22/11/2016. The blue lines in the MA chart indicate where fast starts were identified, with the inset chart showing the histogram of MA values and the dashed line reflects the threshold defined for fast starts.
To identify when potential feeding events occurred, the timing of fast starts was assessed for each accelerometer tagged YFT. Fast starts are defined as brief sudden accelerations used by fish during predator-prey encounters and can be considered a form of burst swimming (Domenici and Blake, 1997). For the YFT in the present study, it is not possible to assess the exact threshold when a fast start occurred without video footage recording fast start behaviour and aligning with the time series of acceleration (Broell et al., 2013). YFT target fast-moving prey including small pelagic fish and squids (Laptikhovsky et al., 2020), with multiple prey consumed in a single feeding period. Acceleration during these feeding bouts should therefore result in rapid acceleration above the normal steady swimming behaviour of the tuna. Previous studies have identified fast starts by using thresholds linked to the standard deviation of MA for great sculpin (Myoxocephalus polyacanthocephalus) which is a sit and wait predator (Broell et al., 2013). In the present study, to identify potential fast starts, the periods of time when MA exceeded the 99th percentile (the upper 1% of MA) were identified (Figure 2).
The relatively low sampling frequency used in the present study will mean that a proportion of fast starts will not have been recorded (fast starts are sub-second events). The effect that down-sampling had on the identification of fast-start events was assessed by comparing the timing and frequency of fast starts when down-sampled from 3 to 12 s for an individual YFT (Supplementary Figure 1). Though the down-sampling reduced the quantity of fast starts measured, the relative signal for the entire trace remained consistent, indicating that down-sampled traces can still be used to identify the periods of time when fast-start (burst acceleration) events occurred.
Landings and Catchability
The capture of YFT within St Helena’s EEZ is by pole and line methods only, with fishing mostly taking place during sunrise and daylight hours. To ensure that landings were representative of the local commercial fishing fleet, landings per unit effort was calculated as the quantity of YFT landed per vessel per day. Five inshore vessels were used for this analysis as they had fishing effort for tropical tuna throughout the year. Discussions with several skippers revealed that the fishery mostly targets YFT at a depth range of 55–100 m. To calculate a metric of catchability in the local pole and line fishery based on YFT depth utilisation (Cd) we calculated the proportion of time that tagged YFT spent in waters less than 100 m deep and were therefore on the tuna fishing grounds regularly targeted by the local fishing fleet. Depths deeper than 100 m are therefore defined as deep. Only measurements taken during the day were considered, with Cd aggregated at a monthly level for illustrative purposes.
Results
Twenty-seven tuna tags were recovered between 2017 and 2020, with 3 PSATs, 14 G5 archival tags, and 10 Lotek archival tags recovered (Table 1). All tuna were released inshore except for PSAT tagged tuna 83842 which was released at Cardno Seamount (Table 1). PSAT tagged tuna were between 101 and 125 cm and were at liberty between 45 and 232 days. Archivally tagged tuna were between 64 and 87 cm and were at liberty between 9 and 293 days. All geolocated tuna remained within or in close proximity to St Helena’s EEZ for the entire time at liberty with all recoveries on the grounds that they were released within 293 days (Figure 1). See Wright et al. (2021) for in-depth analysis of the horizontal movement of the yellowfin tuna tagged within St Helena’s EEZ.
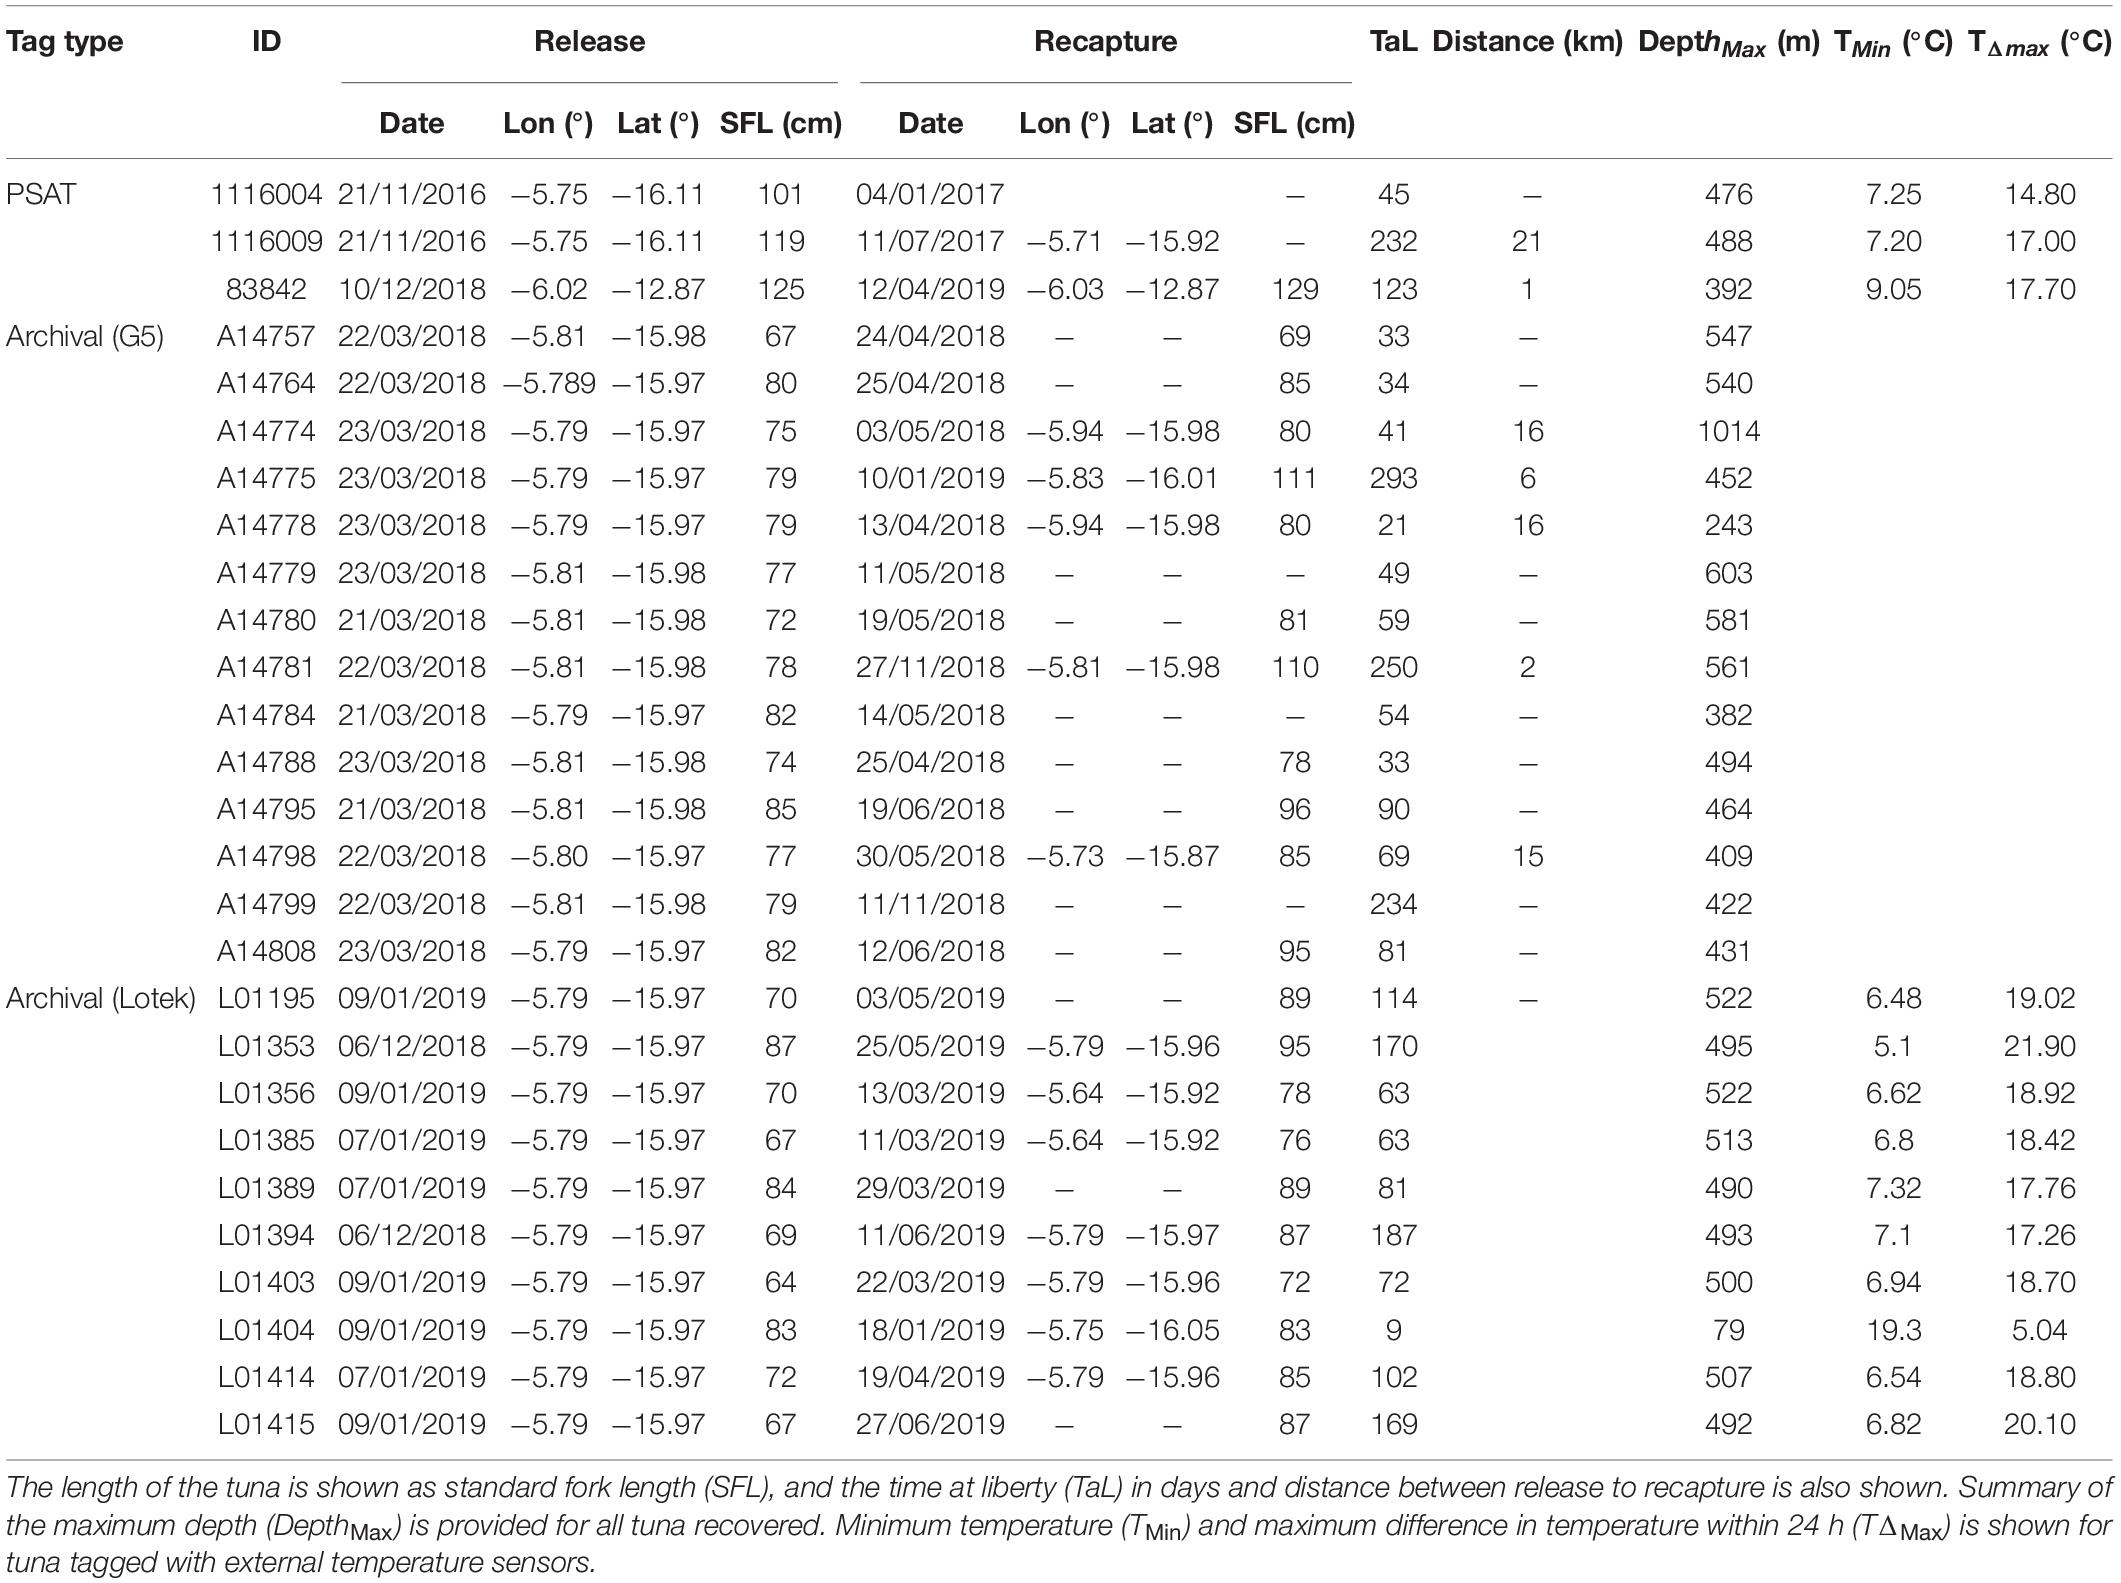
Table 1. PSAT and archival tag release and recovery information for yellowfin tuna (Thunnus albacares) tagged in the St Helena EEZ, including the date, longitude (lon) and latitude (lat) of release and recovery.
Vertical Distribution by Time of Day
The yellowfin tuna occurred in surface waters down to 1,014 m (Table 2). When all depth and temperature experience were summarised, YFT spent the majority of time (94%) in the surface waters (<100 m) at water temperatures above 20°C (88%), with internal body cavity temperatures mostly above 22°C (86%) (Supplementary Figure 2). The minimum temperature experienced by the YFT was 6.5°C (Tag L01195) which occurred on a dive to 500 m. The maximum difference in temperature within a 24-h period was 20.1°C which occurred on a dive to 200 m in January (Tag L01415; Table 1).
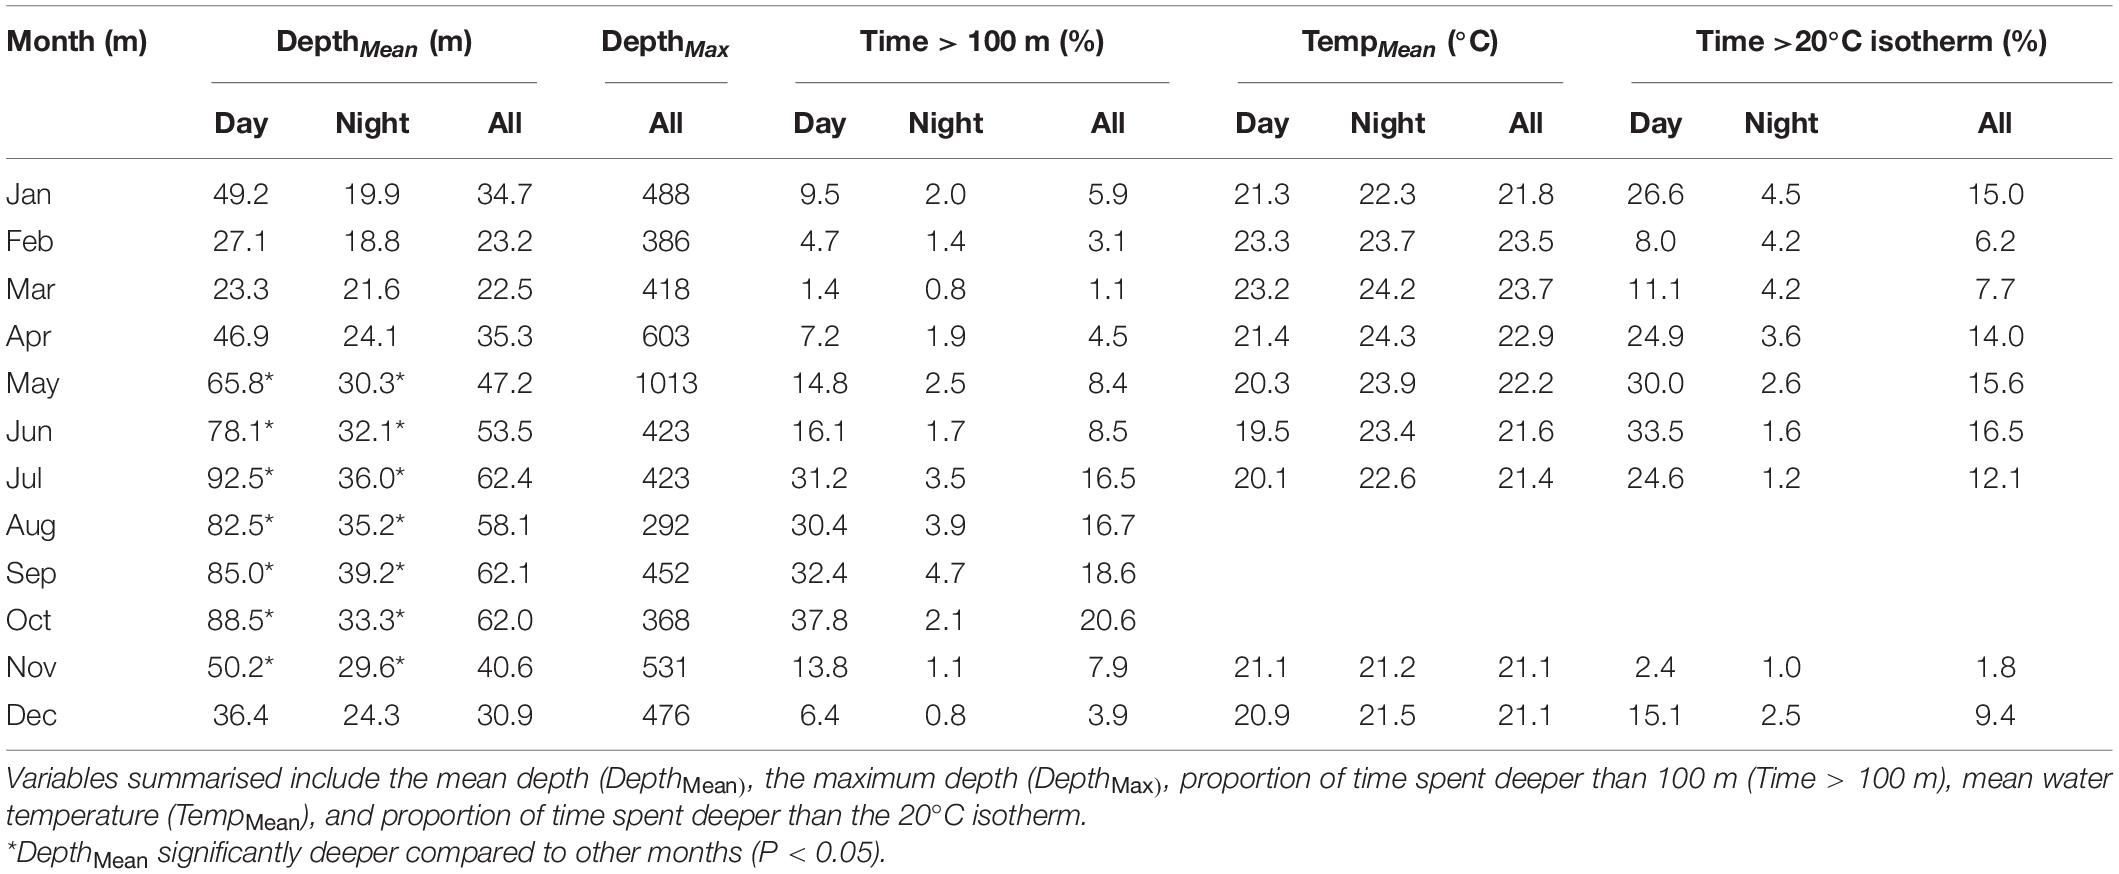
Table 2. Seasonal change in depth and temperature experience of electronically tagged yellowfin tuna during the day, night and within a 24 h period (All).
An actogram of the depth use for four YFT provides an overview of behavioural change by time of day and season (Figure 3). During the night, YFT consistently remained shallow (<50 m), whilst during the day more time was spent deep (>100 m), with deep dives often occurring at sunrise and during the day (Figure 3). The average depth during the night varied with the lunar phase, with shallower dives (averaging around 20 m) when there was low illumination (new moon), and significantly deeper dives (averaging between 30 and 40 m) when illumination levels exceeded 0.85 (full moon; Supplementary Figure 3).
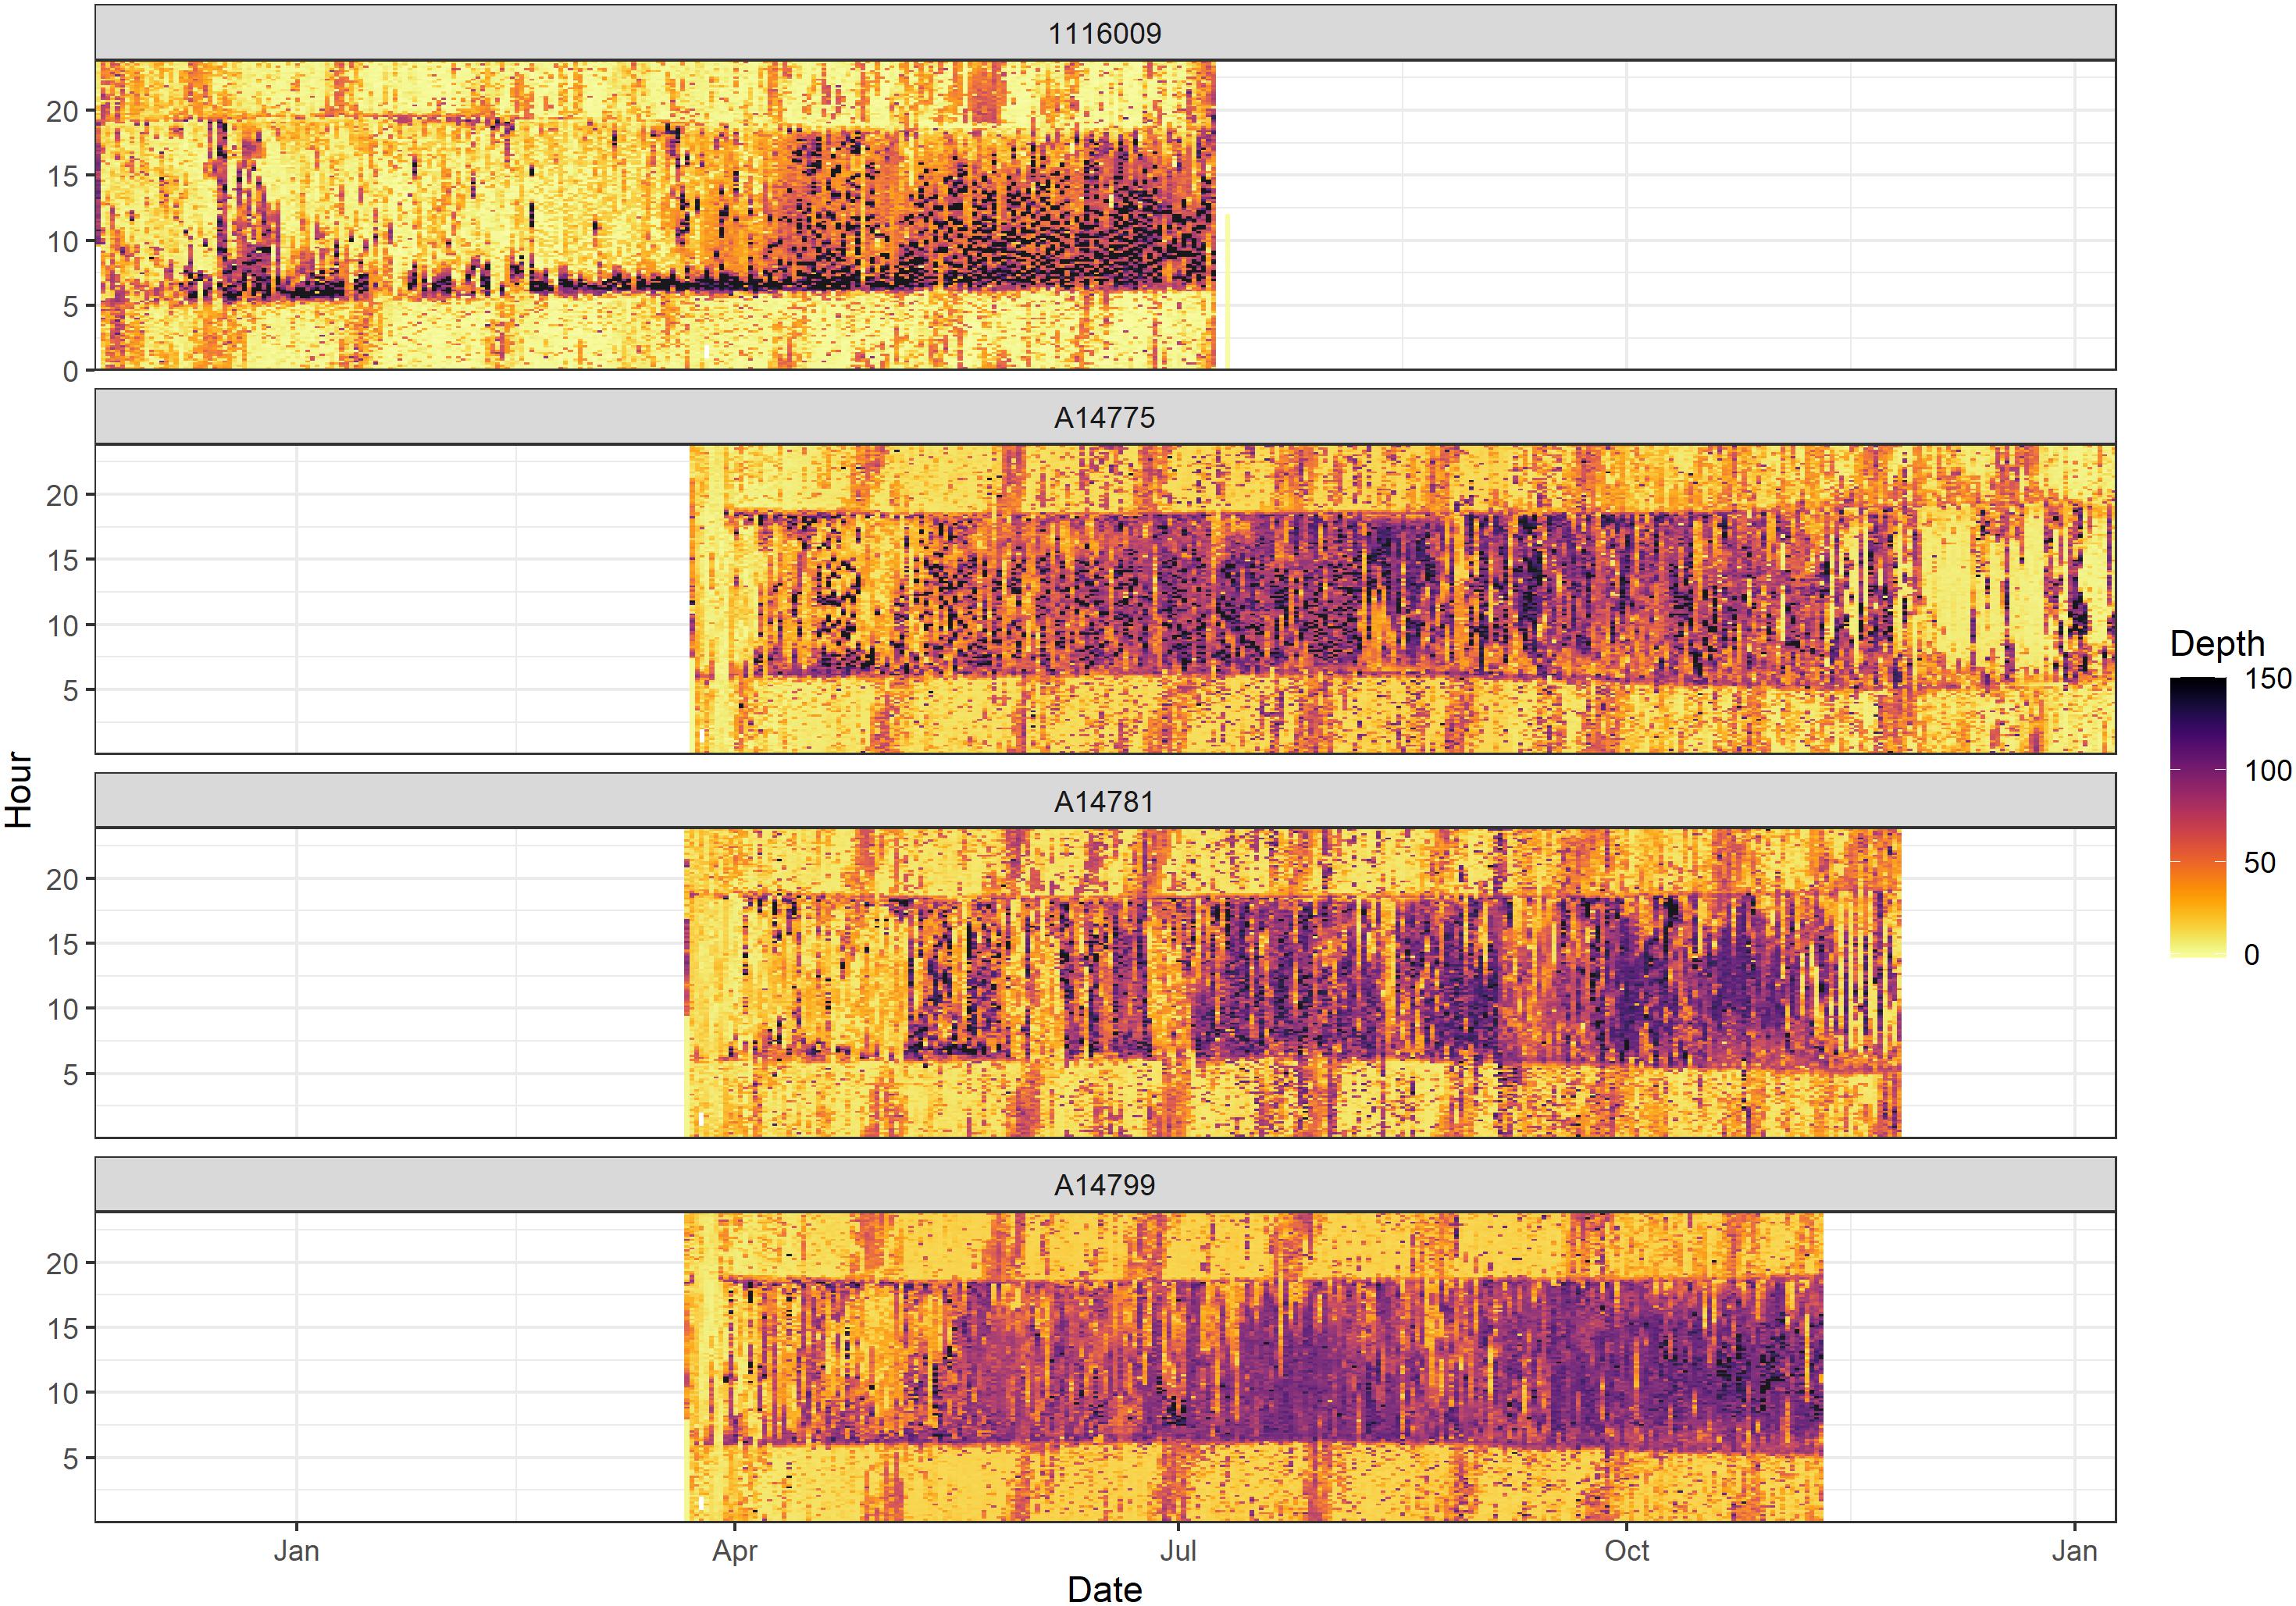
Figure 3. Actogram showing the depth utilisation of yellowfin tuna 1116009, A14775, A14781, and A14799. Month is shown on the X axis and hour of the day is shown on the Y axis.
The magnitude of acceleration was used to assess the timing and the depth of potential strikes on prey (fast starts). MA was typically higher during the ascent of dives (Figure 2). The timing and depth of fast starts was used to assess potential feeding or strike events of the YFT (Figure 4A). There were three depth-strata where fast starts consistently occurred; surface waters (<20 m), at the boundary of the mixed layer (100 m) and in the deep scattering layer (∼300 m) (Figure 4B). Fast starts in the shallowest waters occurred both during the day and night. Fast starts in the mixed layer or deep scatter layer occurred at sunrise and during the day (Figure 4A). When all months were combined, fast starts peaked at sunrise and sunset, with lowest levels during the night (Figure 4C).
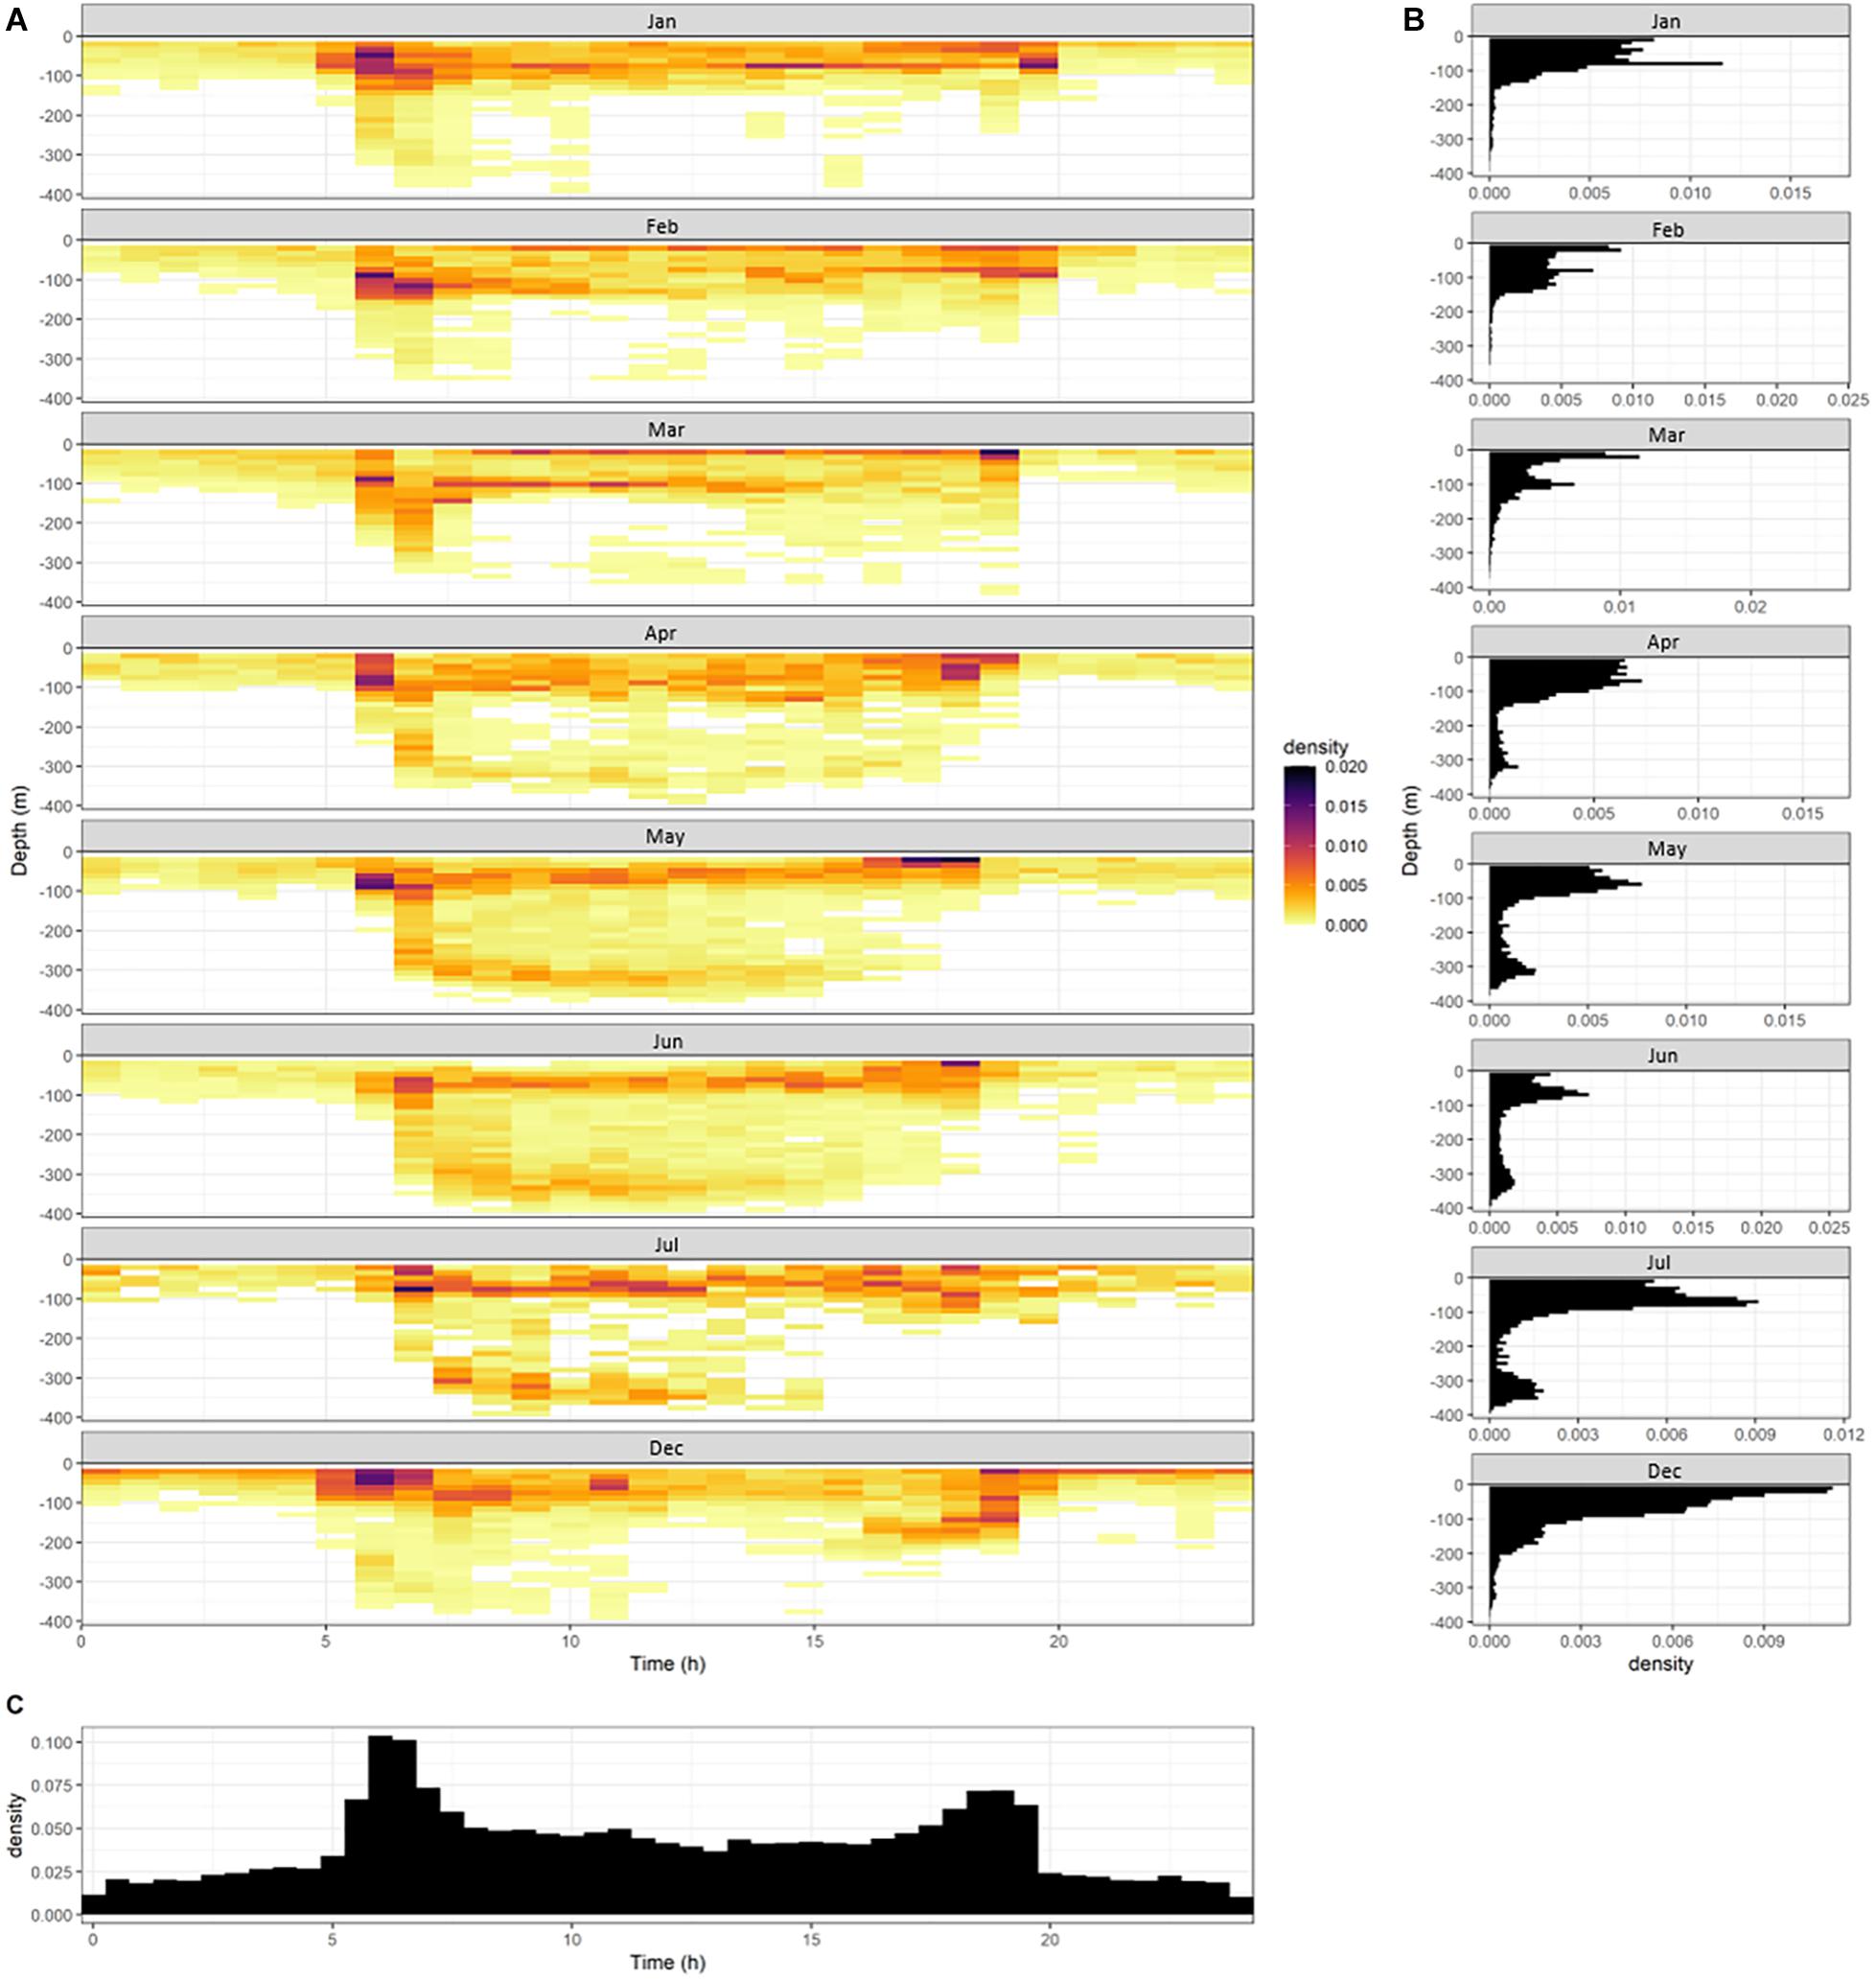
Figure 4. (A) Density plot showing the time of day and the depth at which fast starts occurred by month. Noting that no accelerometer tagged tuna were at liberty between August and November. (B) Frequency of fast start events by depth, and (C) frequency of fast start events by time of day.
For the entire time at liberty the pitch angle averaged 0° at depth, which is linked to the correction factor used for the pitch angle which was based on the vertical speed (Supplementary Figure 4A). When the pitch angle for each fast start was extracted, there was a significantly elevated pitch angles at depths below 150 m compared to surface waters (Table 3 and Supplementary Figure 4B):
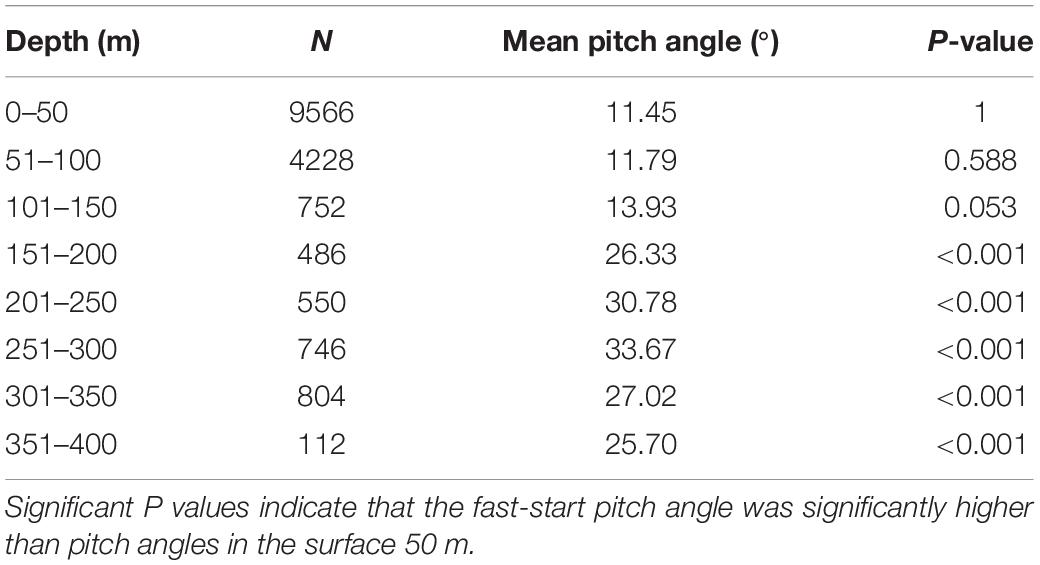
Table 3. Summary of two-sample t-test scores comparing surface fast-start pitch angles (<50 m) to fast-start pitch angles at depths exceeding 50 m.
Vertical Distribution, Landings, and Catchability by Season
The yellowfin tuna had significantly deeper average depths between May and November (Table 2), with an increased incidence of rDVM between December and March, indicating more time spent shallower during the day at this time (Figure 5B) which is reflecting as significantly higher Cd for these months (Figure 5A). Changes in vertical behaviour were also linked to changes in the timing of fast starts, with an increased frequency of deep (>100 m) fast starts between May and July as tuna increased the proportion of time spent at depth. In comparison, more fast starts occurred in surface waters between December and March (Figure 4).
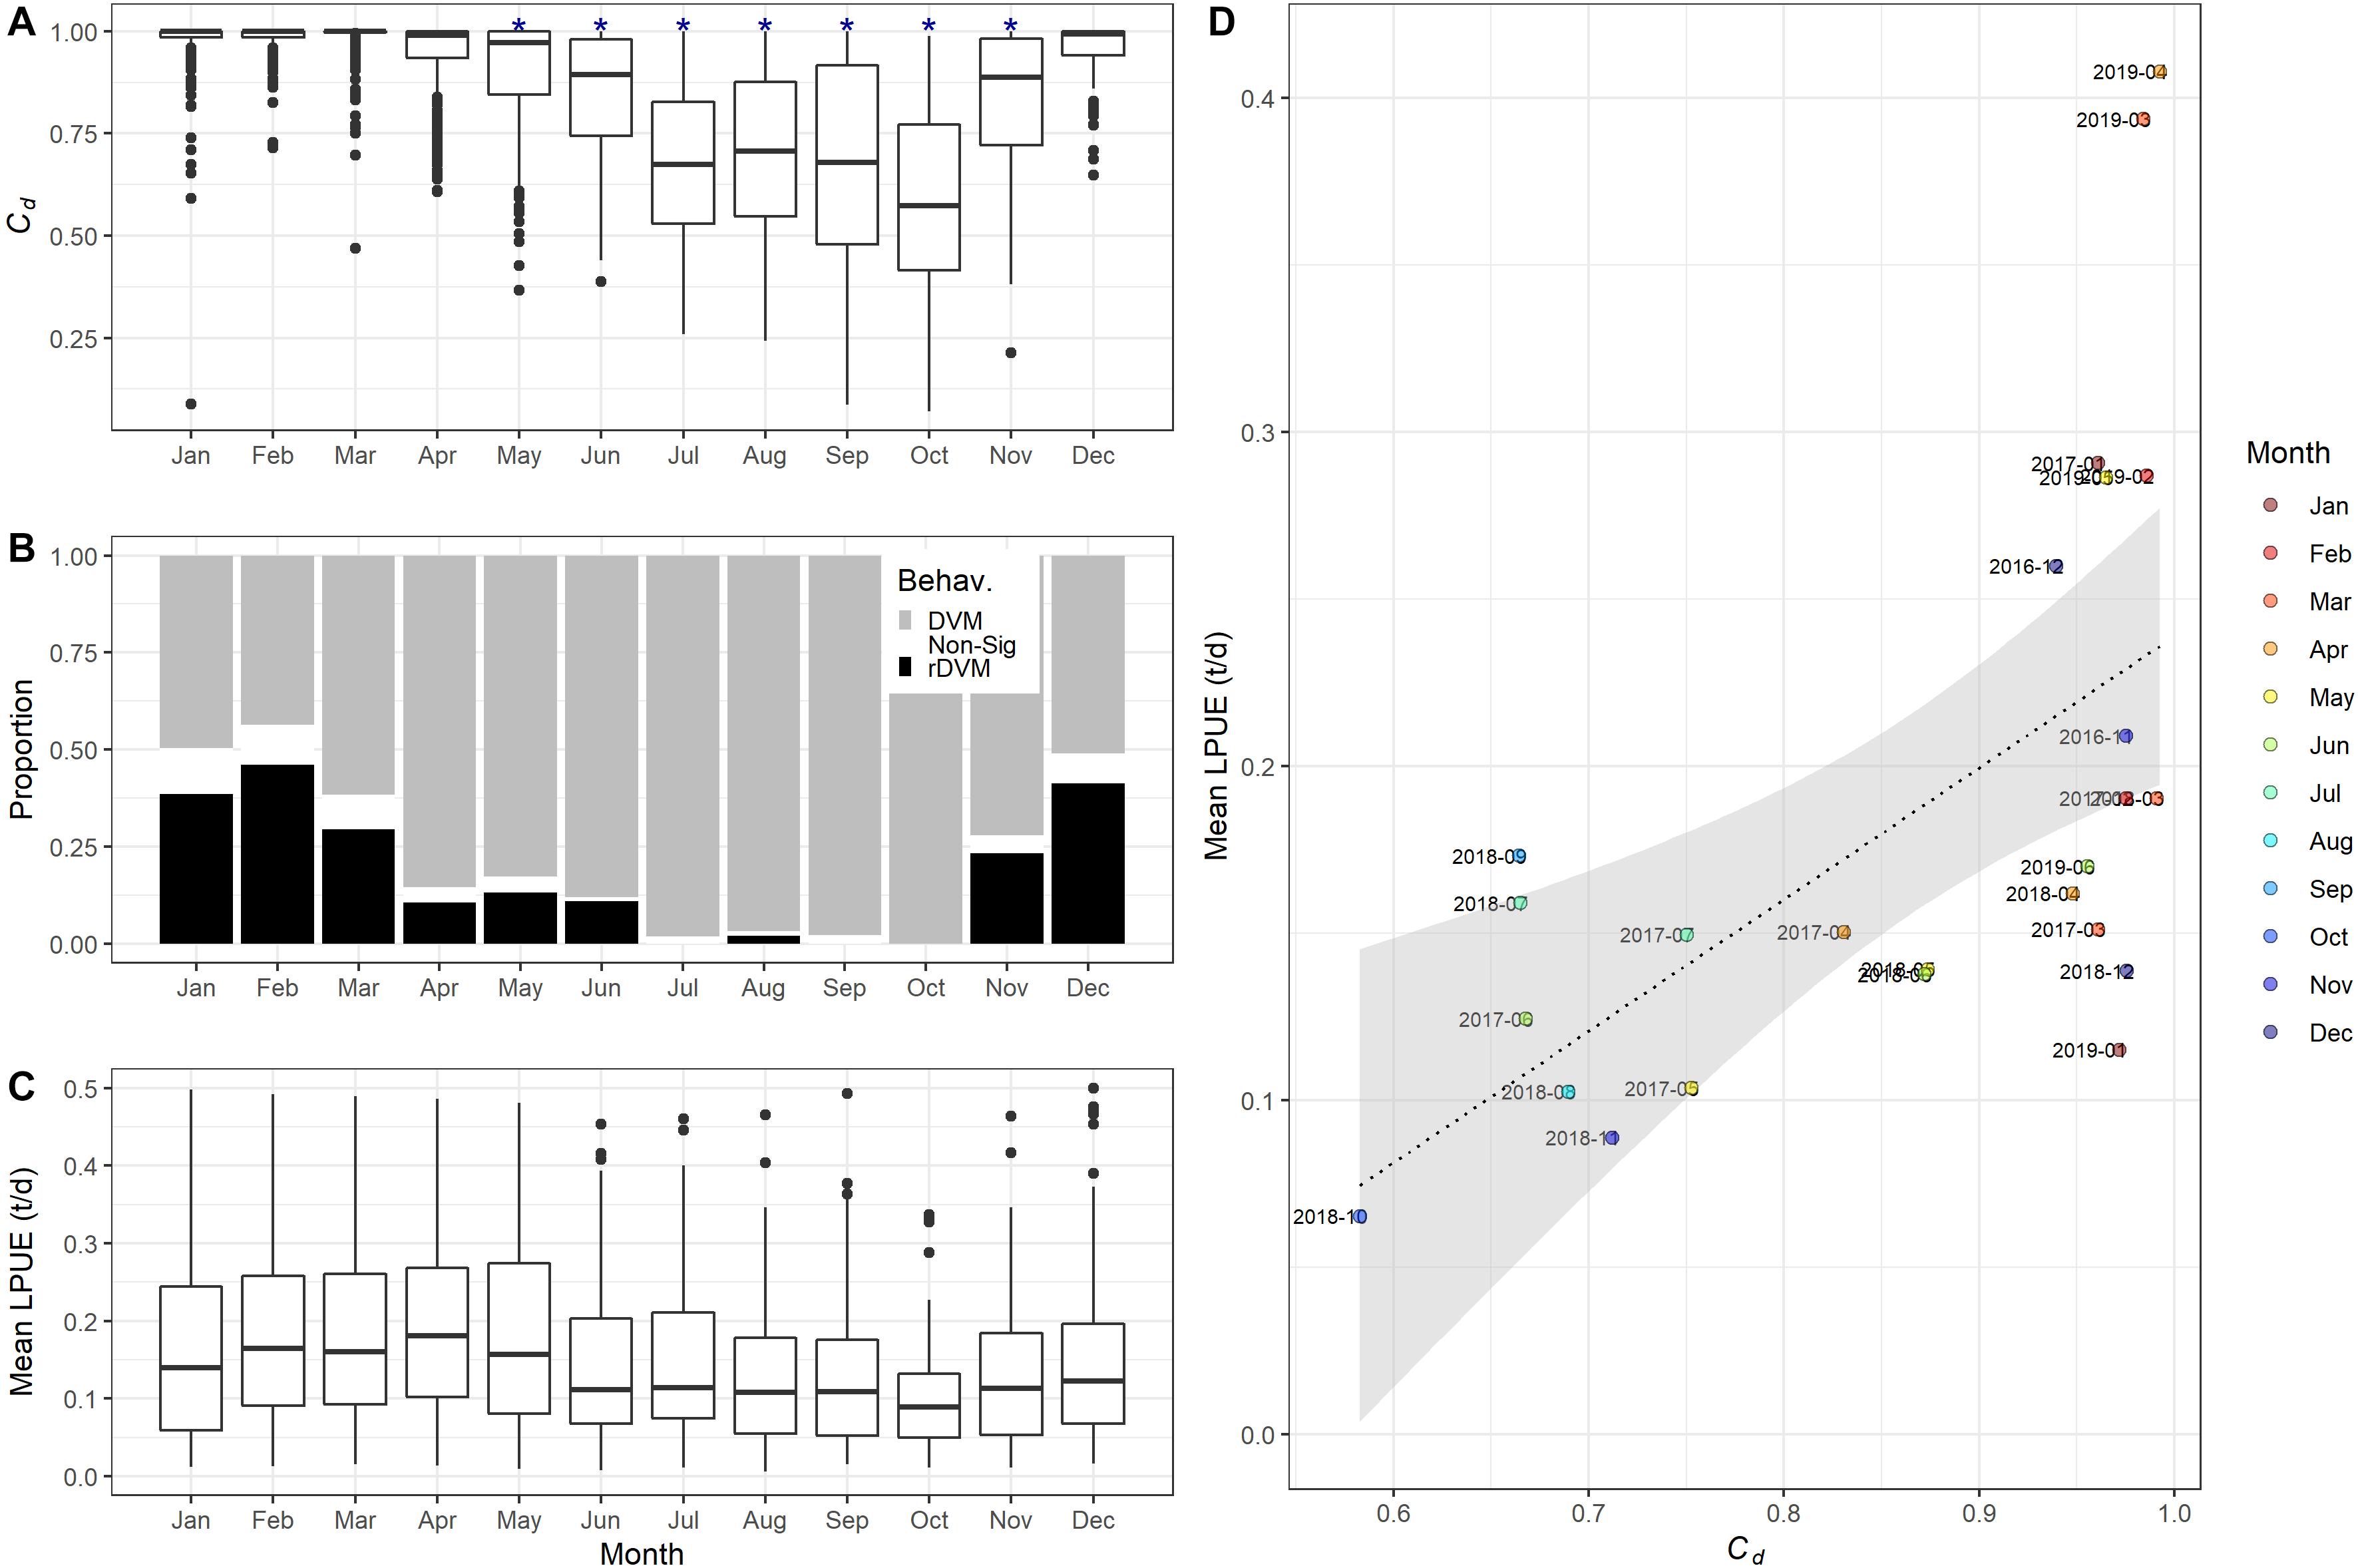
Figure 5. (A) Monthly proportion of time that tagged yellowfin tuna spent utilising depths shallower than 100 m (Cd). Significantly lower Cd compared to other months denoted with asterisk (P < 0.05). (B) Monthly proportion of time spent in each vertical movement behaviour [diel vertical migrations (DVM), when there was no significant difference in depth use between night and day (Non-Sig) and reverse DVM (rDVM)]. (C) Monthly mean landings per vessel per day (LPUE) for the yellowfin tuna fishing fleet of St Helena. (D) Correlation between Cd and mean total landings per month with linear model.
Comparisons between the average LPUE of YFT and the behaviour of YFT is shown in Figure 5. Average LPUE was highest between January and April with a mean LPUE of between 0.21 and 0.22 t landed per day per vessel (Figure 5C). Between June and November LPUE then reduced to between 0.11 and 0.16 t per day per vessel (Supplementary Table 1). The seasonal reduction in total inshore landings is consistent between individual fishing vessels inshore (Supplementary Figure 6). When mean LPUE for a given month and year was compared to the time spent in surface waters (Cd), there was a significant increase in the mean LPUE with Cd (P = 0.0015, adj. r2 = 0.33, F-stat = 12.95; Figure 5D).
Discussion
Behaviour by Time of Day
Vertical movements of YFT can be influenced by a number of factors, including oceanographic features and prey behaviours (Block et al., 1997; Brill et al., 1999; Hoolihan et al., 2014). YFT in the present study spent more time deep during the day (with more deep dives) compared to the night (DVM). DVM enables pelagic predators to target prey residing in deeper waters during the day and is a common behavioural strategy for oceanic predators (Chapman et al., 2007; Coelho et al., 2015).
There was a clear switch in YFT behaviour at sunrise and sunset, with increases in activity level and depth range during the crepuscular phases (Figures 3, 4). Other large marine animals also show crepuscular increases in activity level which have been linked to feeding behaviour (Gleiss et al., 2013). For example, spotted dolphins increase activity and deep dives at sunset to coincide with the movement of the deep scattering layer to surface waters (Scott and Chivers, 2009). Increased incidence of fast start events at sunrise and sunset may be linked to this period having the highest predicted feeding rates (Thygesen and Patterson, 2019).
The yellowfin tuna spent the night in surface waters, with behaviour affected by the level of illumination resulting in deeper dives when there was a full moon. The link between depth and the level of light at night may indicate that tuna track prey which are deeper during the full moon or are trying to avoid predation. Similar links between depth and lunar illumination have been made for other pelagic predators including bigeye tuna, Thunnus obesus (Dagorn et al., 2000), grey reef sharks, Carcharhinus amblyrhynchos (Vianna et al., 2013), and white sharks, Carcharodon carcharias (Weng et al., 2007).
Physiology of Deep Dives
The yellowfin tuna are visual predators, with maximum depth limited by their cardiac function, which prevents them from spending prolonged time in deep, cold waters (Brill and Lutcavage, 2001). Previous studies indicate that there is a 72% decrease in cardiac output when the temperature drops from 25 to 10°C (Blank et al., 2002), which has implications for the energy available to flee from predators and to pursue prey. In addition to cold being a physiological barrier for these regional endotherms, the depth of the oxygen minimum layer could also be a limiting factor (Nimit et al., 2020). Therefore, feeding on prey in deep, cold waters has physiological implications for YFT with a trade-off between diving deep to search for prey and the physiological stressors at such depths. However, deep dives may be required for foraging on particular prey items or potentially for eluding predators (Block et al., 1997; Hoolihan et al., 2014). YFT from the present study had dives to a maximum depth of 1014 m and experienced ambient water temperatures as low as 6.4°C, which is within the range reported in previous studies [max depth of 1,600 m (Schaefer et al., 2014)].
Previous studies have alluded to YFT feeding on prey within the deep scattering layer, with a suggestion that further research is required to better understand the relationship between predators and their prey (Weng et al., 2009). The use of accelerometers provides a means to assess the timing of fast starts which are indicative of animals fleeing from predators or striking at prey (Harper and Blake, 1991; Broell et al., 2013). In the present study, the behaviour of YFT in deep waters close to the deep-scattering layer indicates that fast-starts (potential feeding events) occurred predominantly on dive ascents. YFT are visual predators with heated vision which helps with prey detection in relatively low light levels as shown in billfish (Fritsches et al., 2005). This visual adaptation provides an advantage over their cold-blooded prey in low-light environments, with tuna able to attack prey from below. The timing of fast starts on ascents in the present study suggests that YFT strike at prey which are above them in the water column and may be silhouetted against surface ambient light, making prey more visible from below.
Behaviour in Relation to Prey Availability
The yellowfin tuna are known as relatively non-selective, opportunistic feeders and consume a broad range of available prey (Laptikhovsky et al., 2020). They can utilise species that are available only for a short period of time due to temporal increases in abundance like swimming crabs (Dissanayake et al., 2008).
Analysis of stomach contents from St Helena’s YFT population is summarised in Laptikhovsky et al. (2020). Although in the tropics, St Helena experiences considerable seasonal environmental variation (e.g., SST ∼18 to 26°C) which result in discrete and highly seasonal spawning events, providing crucial feeding opportunities for YFT. An increased incidence of rDVM in the summer season is consistent with YFT seeking to exploit seasonally available productivity close to St Helena island, including the butterfly fish Chaetodon sanctaehelenae (Laptikhovsky et al., 2020). YFT likely target butterfly fish and similar juvenile neritic fish during the day as these species are inactive and rest on the seabed during the night, and so are unavailable to the tuna during this time (Ehrlich et al., 2009). The night was the period with the lowest frequency of fast starts, indicating that this period was likely the least important for feeding YFT.
As foraging opportunities decline in shallow waters in the colder months, YFT may need to target prey at other, potentially less optimal or physiologically taxing depths including the deep scattering layer, resulting in behaviour dominated by DVM in these months. Previous studies show similar diel patterns which have been linked to YFT tracking the behaviour of prey inhabiting the deep scattering layer (Weng et al., 2009). The increasing role of crustaceans in the cold season (Laptikhovsky et al., 2020) might also explain the switch in behaviour to strict predominance of DVM as mesopelagic shrimps became available at night and in relatively deep lower epi-pelagic region (Burdett, 2016).
Vertical Distribution by Season and Implications for Catchability
The targeting of YFT within St Helena’s EEZ is by pole and line fishing vessels at sunrise and during the day. The fishery targets tropical tuna by using a combination of cut bait, live bait and trolling in surface waters which means that fishing operations are limited to relatively shallow fishing grounds (surface 100 m). Catchability of YFT was significantly reduced between May and November as YFT spent more time at depths below 100 m during the day, which coincides with a reduction in the quantity of YFT caught by the inshore fleet. Although YFT were distributed in waters from the surface to depths in excess of 400 m, the accelerometery data indicated that fast starts occurred predominantly in surface waters (depths < 100 m) and in depths of 300–400 m, noting that the timing and frequency of fast-starts varied by the time of day and season.
For the regional stock assessment for YFT, the International Commission for the Conservation of Atlantic Tuna (ICCAT) uses CPUE from a number of fleets in operation in the Atlantic Ocean, including longline, purse seine, and bait boat (ICCAT, 2019). Noting that trends in CPUE can be influenced by a number of factors in addition to stock abundance (Goodyear et al., 2003). CPUE needs standardisation as a means to remove (or minimise) the impact of other factors unrelated to stock abundance. Therefore, the behaviour of the YFT and catchability by different gears needs to be accounted for. So, for the local bait boat fishery, the reduction in LPUE between May and November coincides with reduced catchability in the same months as tuna spend more time at depths < 100 m. If the behaviour of YFT in the wider Atlantic mimics the behaviour of YFT within St Helena’s EEZ, monthly catchability should vary for the different gears. For example, in the months where there is reduced catchability for surface targeting fleets like bait boats, there should be an increase in catchability for deep set gears like long lines.
Conclusion
Remote volcanic islands and seamounts are known to produce local upwellings and this has been linked to aggregations of pelagic prey and predators (Pitcher et al., 2007; Sergi et al., 2020). Previous studies have shown that YFT have extended fidelity to St Helena waters, with St Helena considered to be a feeding ground for tuna (Wright et al., 2021). Results from the present study provides evidence of diurnal and seasonal variability in the behaviour and catchability of YFT in the South Atlantic around the island of St Helena. This study shows the potential for electronic tags recording acceleration to be used to predict the depth and time when feeding behaviours occur. Future studies could explore the use of electronic tags to create models of catchability in space and time which can be used to help validate and standardise CPUE at a regional level, including assessing the drivers of spatial changes in catchability.
Data Availability Statement
The raw data supporting the conclusions of this article will be made available by the authors, without undue reservation.
Ethics Statement
The animal study was reviewed and approved by Animal Welfare Board, Cefas.
Author Contributions
SW, MC, DR, TC, and CG made substantial contributions to the conception, design, and analysis or interpretation of the work. JN, RS, RH, DB, DM, VB, SW, BB, and EC were involved in the acquisition of data for the work. All authors contributed to the article and approved the submitted version.
Funding
Funding was provided through the Blue Belt Programme, UK Government Darwin Plus Initiative (DPLUS039), and the Atlantic Ocean Tuna Tagging Programme (AOTTP) with support from the Cefas manuscript writing budget.
Conflict of Interest
The authors declare that the research was conducted in the absence of any commercial or financial relationships that could be construed as a potential conflict of interest.
Acknowledgments
The authors would like to thank the St Helena Fishermen’s Association, St Helena Fisheries Corporation and Commercial, and Recreational Fishers of St Helena, for their continued support in releasing and recovering tagged fish. All electronic (PSAT and archival) tuna tagging is carried out by staff trained and competent to perform this procedure under the UK Home Office Animals (Scientific Procedures) Act 1986, or under IACUC Animal Care Plan for Stanford University.
Supplementary Material
The Supplementary Material for this article can be found online at: https://www.frontiersin.org/articles/10.3389/fmars.2021.664593/full#supplementary-material
Footnotes
References
Blank, J. M., Morrissette, J. M., Davie, P. S., and Block, B. A. (2002). Effects of temperature, epinephrine and Ca2+ on the hearts of yellowfin tuna (Thunnus albacares). J. Exp. Biol. 205(Pt 13), 1881–1888.
Block, B. A., Keen, J. E., Castillo, B., Dewar, H., Freund, E. V., Marcinek, D. J., et al. (1997). Environmental preferences of yellowfin tuna (Thunnus albacares) at the northern extent of its range. Mar. Biol. 130, 119–132. doi: 10.1007/s002270050231
Block, B. A., Teo, S. L. H., Walli, A., Boustany, A., Stokesbury, M. J. W., Farwell, C. J., et al. (2005). Electronic tagging and population structure of Atlantic bluefin tuna. Nature 434, 1121–1127. doi: 10.1038/nature03463
Brill, R., and Lutcavage, M. E. (2001). Understanding environmental influences on movements and depth distributions of tunas and billfishes can significantly improve population assessments. Am. Fish. Soc. Symp. 25, 179–198.
Brill, R. W., Block, B. A., Boggs, C. H., Bigelow, K. A., Freund, E. V., and Marcinek, D. J. (1999). Horizontal movements and depth distribution of large adult yellowfin tuna (Thunnus albacares) near the Hawaiian Islands, recorded using ultrasonic telemetry: implications for the physiological ecology of pelagic fishes. Mar. Biol. 133, 395–408. doi: 10.1007/s002270050478
Broell, F., Noda, T., Wright, S., Domenici, P., Steffensen, J. F., Auclair, J.-P., et al. (2013). Accelerometer tags: detecting and identifying activities in fish and the effect of sampling frequency. J. Exp. Biol. 216, 1255–1264. doi: 10.1242/jeb.077396
Burdett, E. A. (2016). NSUWorks Geographic and Depth Distributions of Decapod Shrimps (Caridea: Oplophoridae) from the Northeastern Gulf of Mexico with Notes on Ontogeny and Reproductive Seasonality. Master’s thesis. Fort Lauderdale FL: Nova Southeastern University.
Chapman, D., Pikitch, E., Babcock, E., and Shivji, M. (2007). Deep-diving and diel changes in vertical habitat use by Caribbean reef sharks Carcharhinus perezi. Mar. Ecol. Prog. Ser. 344, 271–275. doi: 10.3354/meps06941
Coelho, R., Fernandez-Carvalho, J., and Santos, M. N. (2015). Habitat use and diel vertical migration of bigeye thresher shark: overlap with pelagic longline fishing gear. Mar. Environ. Res. 112, 91–99. doi: 10.1016/J.MARENVRES.2015.10.009
Collins, M. (2017). South Atlantic Overseas Territories Commercial Fisheries Management Review: St Helena. An Independent Report by Marecol. Commissioned by RSPB. Avaialable online at: https://www.rspb.org.uk/globalassets/downloads/documents/conservation-projects/ukots-hidden-treasures/2017/st-helena-fisheries-detailed-report-2017.pdf
Dagorn, L., Bach, P., and Josse, E. (2000). Movement patterns of large bigeye tuna (Thunnus obesus) in the open ocean, determined using ultrasonic telemetry. Mar. Biol. 136, 361–371.
Dagorn, L., Holland, K. N., Hallier, J.-P., Taquet, M., Moreno, G., Sancho, G., et al. (2006). Deep diving behavior observed in yellowfin tuna (Thunnus albacares). Aquat. Living Resour. 19, 85–88. doi: 10.1051/alr:2006008
Dissanayake, D., Samaraweera, E., and Amarasiri, C. (2008). Fishery and feeding habits of yellowfin tuna (Thunnus albacares) targeted by coastal tuna longlining in the north western and north eastern coasts of Sri Lanka. Sri Lanka J. Aquat. Sci. 13:1. doi: 10.4038/sljas.v13i0.2203
Domenici, P., and Blake, R. (1997). The kinematics and performance of fish fast-start swimming. J. Exp. Biol. 200, 1165–1178.
Ehrlich, P. R., Talbot, F. H., Russell, B. C., and Anderson, G. R. V. (2009). The behaviour of chaetodontid fishes with special reference to Lorenz’ “poster colouration” hypothesis∗. J. Zool. 183, 213–228. doi: 10.1111/j.1469-7998.1977.tb04183.x
FAO (2020). The state of the World Fisheries and Aquaculture 2020. Rome: Sustainability in Action. doi: https://doi.org/10/4060/ca9229en
Fritsches, K. A., Brill, R. W., and Warrant, E. J. (2005). Warm eyes provide superior vision in swordfishes. Curr. Biol. 15, 55–58. doi: 10.1016/J.CUB.2004.12.064
Gleiss, A. C., Schallert, R. J., Dale, J. J., Wilson, S. G., and Block, B. A. (2019). Direct measurement of swimming and diving kinematics of giant Atlantic bluefin tuna (Thunnus thynnus). R. Soc. Open Sci. 6:190203. doi: 10.1098/rsos.190203
Gleiss, A. C., Wright, S., Liebsch, N., Wilson, R. P., and Norman, B. (2013). Contrasting diel patterns in vertical movement and locomotor activity of whale sharks at Ningaloo Reef. Mar. Biol. 160, 2981–2992. doi: 10.1007/s00227-013-2288-3
Goodyear, C., Die, D., Kerstetter, D., Olson, D., Prince, E., and Scott, G. (2003). Habitat standardization of CPUE Indices: research needs. Collect. Vol. Sci. Pap. ICCAT 55, 613–623.
Griffiths, C. A., Wright, S. R., Silva, J. F., Ellis, J. R., Righton, D. A., and McCully Phillips, S. R. (2020). Horizontal and vertical movements of starry smooth-hound Mustelus asterias in the northeast Atlantic. PLoS One 15:e0239480. doi: 10.1371/journal.pone.0239480
Harper, D. G., and Blake, R. W. (1991). Prey capture and the fast-start performance of Northern pike Esox lucius. J. Exp. Biol. 155, 175–192.
Hoolihan, J. P., Wells, R. J. D., Luo, J., Falterman, B., Prince, E. D., and Rooker, J. R. (2014). Vertical and horizontal movements of yellowfin tuna in the Gulf of Mexico. Mar. Coast. Fish. 6, 211–222. doi: 10.1080/19425120.2014.935900
Kawatsu, S., Sato, K., Watanabe, Y., Hyodo, S., Breves, J. P., Fox, B. K., et al. (2010). A new method to calibrate attachment angles of data loggers in swimming sharks. EURASIP J. Adv. Signal Proc. 2010, 1–7. doi: 10.1155/2010/732586
Kurota, H., McAllister, M. K., Lawson, G. L., Nogueira, J. I., Teo, S. L. H., and Block, B. A. (2009). A sequential Bayesian methodology to estimate movement and exploitation rates using electronic and conventional tag data: application to Atlantic bluefin tuna (Thunnus thynnus). Can. J. Fish. Aquat. Sci. 66, 321–342. doi: 10.1139/F08-197
Laptikhovsky, V., Naulaerts, J., Clingham, E., Collins, M. A., Cranfield, M., Henry, L., et al. (2020). Comparative feeding strategies of yellowfin tuna around St Helena and adjacent seamounts of the South Atlantic Ocean. J. Appl. Ichthyol 37:jai.14122. doi: 10.1111/jai.14122
Lynch, P. D., Shertzer, K. W., and Latour, R. J. (2012). Performance of methods used to estimate indices of abundance for highly migratory species. Fish. Res. 12, 27–39. doi: 10.1016/J.FISHRES.2012.02.005
Nimit, K., Masuluri, N. K., Berger, A. M., Bright, R. P., Prakash, S., Tvs, U., et al. (2020). Oceanographic preferences of yellowfin tuna (Thunnus albacares) in warm stratified oceans: a remote sensing approach. Int. J. Remote Sens. 41, 5785–5805. doi: 10.1080/01431161.2019.1707903
Pecoraro, C., Zudaire, I., Bodin, N., Murua, H., Taconet, P., Díaz-Jaimes, P., et al. (2017). Putting all the pieces together: integrating current knowledge of the biology, ecology, fisheries status, stock structure and management of yellowfin tuna (Thunnus albacares). Rev. Fish Biol. Fish. 27, 811–841. doi: 10.1007/s11160-016-9460-z
Pitcher, T. J., Morato, T., Hart, P. J. B., Clark, M. R., Haggan, N., and Santos, R. S. (eds) (2007). Seamounts: Ecology, Fisheries & Conservation. Oxford: Blackwell Publishing Ltd, doi: 10.1002/9780470691953
Rice, A., and Hale, M. E. (2010). “The role of locomotion in feeding performance of fishes,” in Fish Locomotion: An Ethoecological Approach, eds P. Domenici and B. Kapoor, (New Hampshire: Science Publishers), 171–199.
Schaefer, K. M., Fuller, D. W., and Aldana, G. (2014). Movements, behavior, and habitat utilization of yellowfin tuna (Thunnus albacares) in waters surrounding the Revillagigedo Islands Archipelago Biosphere Reserve. Mexico. Fish. Oceanogr. 23, 65–82. doi: 10.1111/fog.12047
Schaefer, K. M., Fuller, D. W., and Block, B. A. (2007). Movements, behavior, and habitat utilization of yellowfin tuna (Thunnus albacares) in the northeastern Pacific Ocean, ascertained through archival tag data. Mar. Biol. 152, 503–525. doi: 10.1007/s00227-007-0689-x
Schaefer, K. M., Fuller, D. W., and Block, B. A. (2011). Movements, behavior, and habitat utilization of yellowfin tuna (Thunnus albacares) in the Pacific Ocean off Baja California, Mexico, determined from archival tag data analyses, including unscented Kalman filtering. Fish. Res. 112, 22–37. doi: 10.1016/J.FISHRES.2011.08.006
Schenke, H. (2016). “General Bathymetric Chart of the Oceans (GEBCO),” in Encyclopedia of Marine Geosciences. Encyclopedia of Earth Sciences Series, eds J. Harff, M. Meschede, S. Petersen, and J. Thiede, (Dordrecht: Springer).
Scida, P., Rainosek, A., and Lowery, T. (2001). Length conversions for yellowfin tuna (Thunnus albacares) caught in the western North Atlantic Ocean. Col. Vol. Sci. Pap. ICCAT 52, 528–532.
Scott, M. D., and Chivers, S. J. (2009). Movements and diving behavior of pelagic spotted dolphins. Mar. Mammal Sci. 25, 137–160. doi: 10.1111/j.1748-7692.2008.00241.x
Sefick, S. (2016). Stream Metabolism-A package for calculating single station metabolism from diurnal Oxygen curves R package version 1.1.2.
Sergi, S., Baudena, A., Cotté, C., Ardyna, M., Blain, S., and d’Ovidio, F. (2020). Interaction of the antarctic circumpolar current with seamounts fuels moderate blooms but vast foraging grounds for multiple marine predators. Front. Mar. Sci. 7:416. doi: 10.3389/fmars.2020.00416
Sippel, T., Paige Eveson, J., Galuardi, B., Lam, C., Hoyle, S., Maunder, M., et al. (2015). Using movement data from electronic tags in fisheries stock assessment: A review of models, technology and experimental design. Fish. Res. 163, 152–160. doi: 10.1016/J.FISHRES.2014.04.006
Thygesen, U. H., and Patterson, T. A. (2019). Oceanic diel vertical migrations arising from a predator-prey game. Theor. Ecol. 12, 17–29. doi: 10.1007/s12080-018-0385-0
Vianna, G. M. S., Meekan, M. G., Meeuwig, J. J., and Speed, C. W. (2013). Environmental influences on patterns of vertical movement and site fidelity of grey reef sharks (Carcharhinus amblyrhynchos) at aggregation sites. PLoS One 8:e60331. doi: 10.1371/journal.pone.0060331
Ward, P., and Myers, R. A. (2005). Inferring the depth distribution of catchability for pelagic fishes and correcting for variations in the depth of longline fishing gear. Can. J. Fish. Aquat. Sci. 62, 1130–1142. doi: 10.1139/F05-021
Weng, K., O’Sullivan, J., and Lowe, C. (2007). Movements, behavior and habitat preferences of juvenile white sharks Carcharodon carcharias in the eastern Pacific. Mar Ecol Prog. 338, 211–224.
Weng, K. C., Stokesbury, M. J. W., Boustany, A. M., Seitz, A. C., Teo, S. L. H., Miller, S. K., et al. (2009). Habitat and behaviour of yellowfin tuna Thunnus albacares in the Gulf of Mexico determined using pop-up satellite archival tags. J. Fish Biol. 74, 1434–1449. doi: 10.1111/j.1095-8649.2009.02209.x
Keywords: satellite tags, archival tags, acceleration, fast-start, tagging–internal tag
Citation: Wright SR, Righton D, Naulaerts J, Schallert RJ, Griffiths CA, Chapple T, Madigan D, Laptikhovsky V, Bendall V, Hobbs R, Beare D, Clingham E, Block B and Collins MA (2021) Yellowfin Tuna Behavioural Ecology and Catchability in the South Atlantic: The Right Place at the Right Time (and Depth). Front. Mar. Sci. 8:664593. doi: 10.3389/fmars.2021.664593
Received: 05 February 2021; Accepted: 03 May 2021;
Published: 28 May 2021.
Edited by:
Fausto Tinti, University of Bologna, ItalyReviewed by:
Philippe S. Sabarros, Institut de Recherche pour le Développement, FranceMing-An Lee, National Taiwan Ocean University, Taiwan
Copyright © 2021 Wright, Righton, Naulaerts, Schallert, Griffiths, Chapple, Madigan, Laptikhovsky, Bendall, Hobbs, Beare, Clingham, Block and Collins. This is an open-access article distributed under the terms of the Creative Commons Attribution License (CC BY). The use, distribution or reproduction in other forums is permitted, provided the original author(s) and the copyright owner(s) are credited and that the original publication in this journal is cited, in accordance with accepted academic practice. No use, distribution or reproduction is permitted which does not comply with these terms.
*Correspondence: Serena R. Wright, serena.wright@cefas.co.uk