 Jeffrey C. Drazen
- 1Department of Oceanography, University of Hawai‘i at Mānoa, Honolulu, HI, United States
- 2Monterey Bay Aquarium Research Institute, Moss Landing, CA, United States
- 3Ocean BioGeosciences Group, National Oceanography Centre, Southampton, United Kingdom
We synthesize and analyze data from visual transecting approaches and baited camera studies to evaluate fish and invertebrate scavenger communities across the Clarion-Clipperton Zone (CCZ), an area of intense deep-sea mining interest, and neighboring areas of the abyssal Pacific. In abyssal regions including the CCZ most of the top predators are large mobile fishes and crustaceans, and the majority of these are also opportunistic scavengers. Top predators can exert important ecosystem influences and they can be susceptible to sustained anthropogenic disturbances, necessitating their study in the CCZ mining region. In total 157 baited camera deployments from 3 mining exploration license areas, 4 APEIs (Areas of Particular Environmental Interest – one type of no mining zone) and 4 other areas in the Pacific (Hawaii, California, New Zealand and Guam) and 122 visual transects from 7 exploration license areas, 4 no mining zones, and the Peru Basin (DISCOL area) were examined. Many taxa were observed in both sampling techniques but visual transects viewed few fishes overall. Fish and scavenger communities and diversity varied across the CCZ, significantly for baited camera data with a parallel but insignificant pattern for visual transects suggesting that even for these highly mobile species, not all regions of the CCZ are equivalent and the CCZ cannot be managed as one homogenous region. Further CCZ communities were different than communities elsewhere in the abyssal Pacific. The regional variations in community composition are largely the result of varying abundances of species rather than species presence/absence given that most, but not all, of the fishes and scavengers observed have very large ranges. On a more local scale, seamounts had a significantly different scavenger community than neighboring abyssal plains and thus contribute to regional diversity. Visual transect data revealed a similar but insignificant pattern due to low sample sizes. Given the coarse spatial resolution of sampling of fish and scavenger communities in the CCZ, it is not possible to evaluate if no mining zones (APEIs) adequately represent these communities nor where, or if, any biogeographic boundaries exist in the CCZ region. It is possible to conclude that a network of APEIs that covers the spectrum of available habitats at regional and more local scales will be key to conserving fish and scavenger biodiversity.
Introduction
Interest in exploitation of manganese nodules on the deep seafloor has increased dramatically in the last two decades. Much of this interest continues to be focused on the Clarion Clipperton Zone (CCZ). The CCZ covers about 6 million km2 of the subtropical eastern North Pacific, roughly between Hawaii and central America (Lodge et al., 2014). This abyssal region ranges in depth from about 4,000 to 5,500 m. It is bounded by the Clarion fracture zone to the north and the Clipperton fracture zone to the south. This area spans gradients in overlying primary production, nodule density and includes a large number of deep seamounts and abyssal hills (Wedding et al., 2013).
Research into the ecological effects of deep-sea polymetallic nodule mining began in the 1970’s and it has informed the International Seabed Authority (ISA) in its task of the management of deep-sea mining including the need to ensure the effective protection of the marine environment. Early research in the CCZ focused on understanding the potential for recovery of benthic communities to simulated mining disturbances. Six experiments in the CCZ and another in the south Pacific at the DISCOL site have shown severe reductions in faunal densities and diversity post-disturbance with generally slow recovery (reviewed in Jones et al., 2017). As a means of protecting the marine environment in the Area, the ISA has formalized a process of regional environmental management plans that includes a spatial management component for the CCZ (Wedding et al., 2013). This largely consists of a system of nine no mining areas or Areas of Particular Environmental Interest (APEI) that were established based on ecological principals and what was known of the distribution of community drivers such as seafloor organic matter flux and nodule density. Furthermore, the ISA requires that mining contractors develop ecological baselines in their exploration license areas (hereafter simply called license areas) as part of their applications for mining and by which to assess future environmental impacts. To meet the goals of effective spatial management and monitoring of environmental effects, a flurry of new research has occurred. This research has focused on establishing ecological baselines prior to mining, generating faunal habitat associations (Amon et al., 2017; Simon-Lledó et al., 2019b, c, 2020), and evaluating biogeography and species or population connectivity (Kersten et al., 2017; Taboada et al., 2018; Bribiesca-Contreras et al., 2021). Given the accumulated, yet sparse, knowledge about abyssal CCZ ecosystems and faunal groups, broad scale syntheses of the distributions of communities and their spatial variability are timely and could help evaluate spatial management plans such as the appropriateness of the APEI network.
It is vital to include studies on the abundance, diversity, and community structure of top predators both in broad scale syntheses and when conducting the mandated baseline surveys, assessing possible environmental impacts of mining activities, and planning spatial management strategies. In abyssal regions, including the CCZ most of the top predators are large mobile fishes and crustaceans, and the majority of these are also opportunistic scavengers (Drazen and Sutton, 2017). Top trophic level animals have been shown to control prey biomass or abundance, exert selective pressures, influence prey diversity, and alter the behavior and habitat choices of potential prey (Myers et al., 2007; Polovina et al., 2009; Estes et al., 2011; Ripple et al., 2014; Drazen and Sutton, 2017). Top predators are also highly susceptible to both direct and indirect anthropogenic changes, particularly habitat alteration, because many have large habitat requirements (Fosså et al., 2002; Ryall and Fahrig, 2006; Ripple et al., 2014; Wenger et al., 2017). The importance of this faunal group is recognized by the ISA and demersal fishes and scavengers are a baseline taxonomic group recommended for study. Changes in the abundance, composition, and size distribution of deep-sea fishes and shrimps have been documented in response to direct activities such as fishing and to its indirect habitat alteration (Watling and Norse, 1998; Devine et al., 2006; Morato et al., 2006; Puig et al., 2012; Pusceddu et al., 2014; Mindel et al., 2017) and in at least one case for mine tailings disposal at upper bathyal depths (Brewer et al., 2007). Fishes and mobile scavengers have been sampled in the CCZ during various programs (Jones et al., 2017; Linley et al., 2017; Harbour et al., 2020) and ecologically, they are an important group for a regional synthesis.
Abyssal top predators are most frequently sampled using visual transecting approaches and baited cameras. Visual transecting with remotely operated vehicles (ROVs), towed cameras and autonomous underwater vehicles (AUVs) can provide valuable and quantitative measures of density and diversity (e.g., Milligan et al., 2016; Drazen et al., 2019). However, these animals are highly mobile, sensitive to light and noise, and generally occur at low densities. For example, in an extensive underwater survey of the Porcupine Abyssal Plain in the Atlantic, only 0.11 to 0.29% of images from AUV camera surveys contained fish (Milligan et al., 2016). This can lead to underestimations of top predator densities, unless large areas are surveyed. A complementary approach is the use of baited cameras (Bailey et al., 2007) that can attract these scavenging fishes and invertebrates to the camera system where they can be quantified (e.g., Linley et al., 2017; Harbour et al., 2020). Baited camera systems have been used to census fish populations from shallow to deep water and to evaluate the fish diversity, relative abundance and community composition and to assess the efficacy of spatial management plans (Priede and Bagley, 2000; Bailey et al., 2007; Linley et al., 2017; Sackett et al., 2017). However, baited cameras do present the challenge that only a subset of the fauna will be attracted and its often very difficult to quantify absolute densities because the area of attraction is unknown or roughly approximated (Priede and Bagley, 2000; Farnsworth et al., 2007). Given the pros and cons of both methods, it is most useful to combine visual transect and baited camera techniques (e.g., Drazen et al., 2019).
In this paper we synthesize and analyze data from both visual transecting approaches and baited camera studies to evaluate the diversity, abundance, distribution and community structure of fishes and scavengers across the CCZ region. Our goals were to describe these communities across the region for the first time, address whether these mobile animal communities differ across the region and to other abyssal regions in the Pacific, begin to understand some of the environmental drivers of any differences found, evaluate if biogeographic boundaries exist, and finally address whether the current system of APEIs are likely to contain fish and scavenger communities that are representative of the region overall.
Materials and Methods
Image Transect Data
Quantitative and qualitative assessments of fish distributions were made using seabed imaging transects at abyssal depths (3,000–6,000 m). Images were obtained using cameras mounted on ROVs, autonomous underwater vehicles (AUVs) and towed cameras (Table 1; and see caption for a list of acronyms for station abbreviations). We considered these methods broadly comparable. All the data compared quantitatively used downward-facing imagery at similar altitudes. Only the data from Vanreusel et al. (2016) and Cuvelier et al. (2020) were taken at a slightly oblique angle (to avoid the ROV frame in the image), and these data were only used in the presence-only analysis (see below). All three platform types create noise, light and water movement, which may influence fish behavior, leading to avoidance or attraction, usually on a species-specific basis. There are some differences between platforms, including in survey speed (all < 1.5 m s–1), light (AUVs do not have continuous lighting, the other platforms do), size (ROVs are bigger and less hydrodynamic than other platforms) and propulsion method (ROV and AUVs are self-propelled), so comparisons between gear types should be treated with some caution. It appears that there is greater variation between species responses than between platform types (e.g., Trenkel et al., 2004).
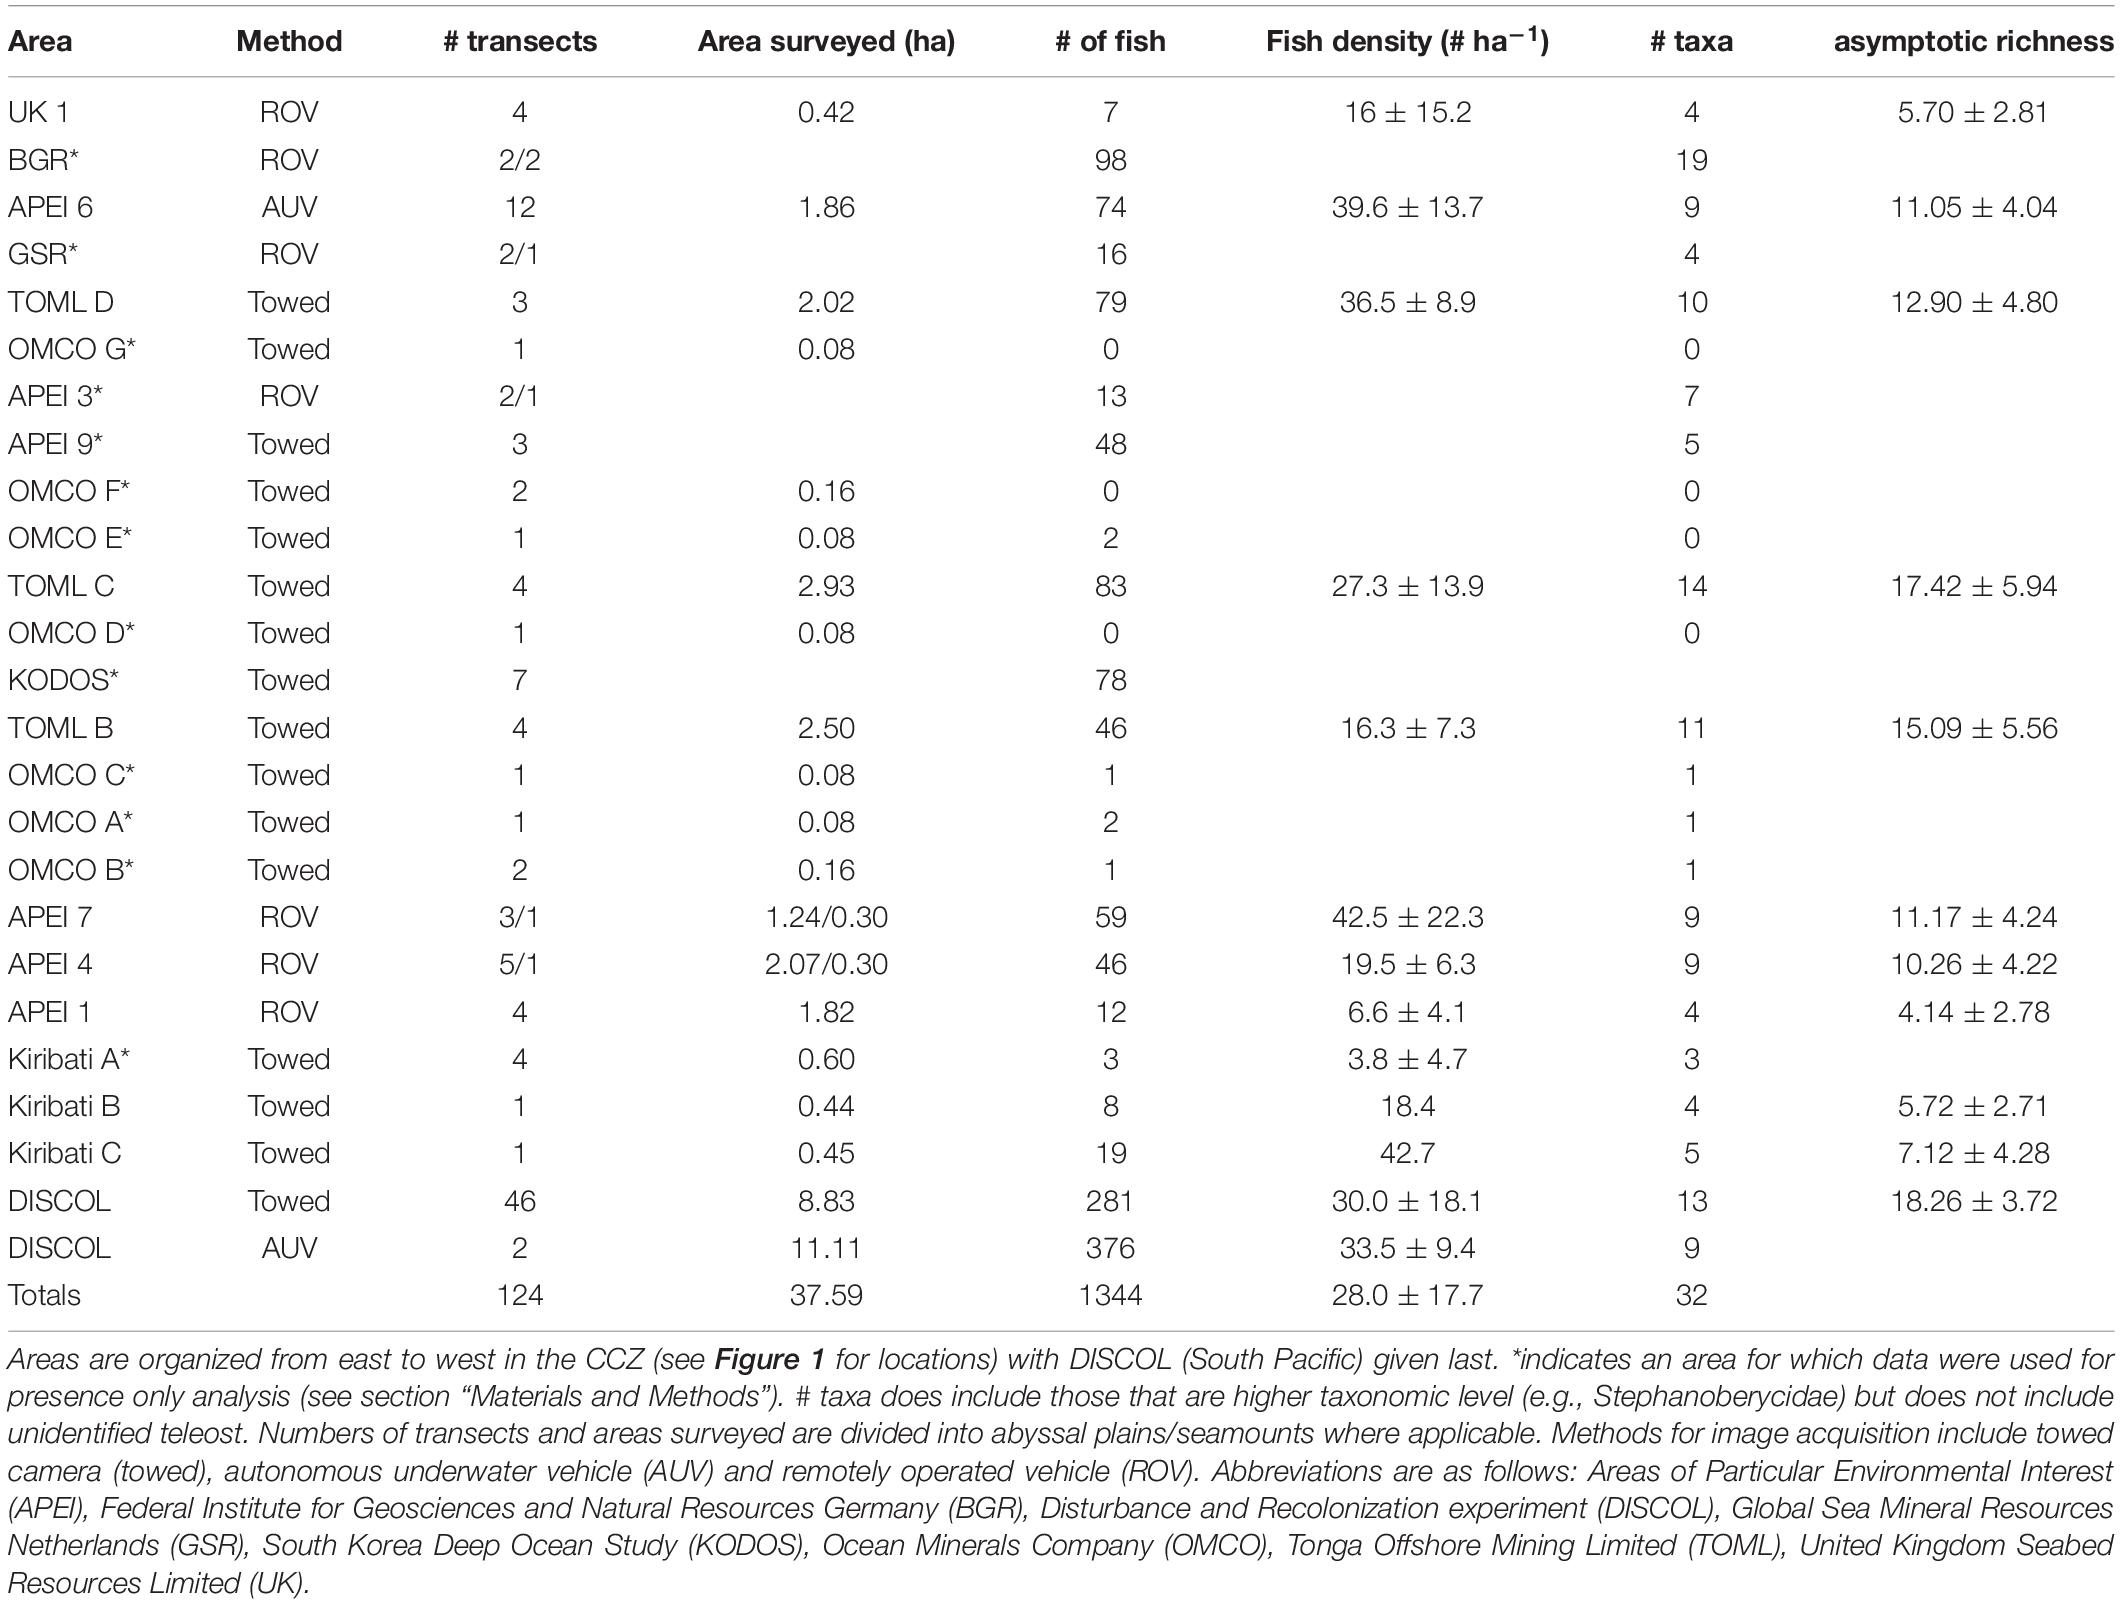
Table 1. Camera survey areas, sampling metrics and associated estimates for fish density (mean ± std dev), number of taxa observed (see also Figure 3), and asymptotic taxa richness (see section “Materials and Methods”) with 95% confidence intervals (for quantitative transects).
A total of 24 areas were evaluated including six APEIs, contractor areas and areas to the periphery of the CCZ. Out of these, the 13 datasets with the highest image resolution, lowest above-seabed altitude (2–5 m) of collection, and with precise measurements of the seabed area encompassed by sampling (minimum 4,000 m2) were used for quantitative evaluation. These included data from (east to west): two sites within the eastern Kiribati EEZ (data from Kiribati A was excluded as only 3 fish were observed, Simon-Lledó et al., 2019d); western CCZ APEIs 1, 4, and 7 (Durden et al., 2021); TOML areas B, C, and D (Simon-Lledó et al., 2020); eastern CCZ APEI6 (Simon-Lledó et al., 2019b, c), and the UK-1 area (Amon et al., 2016). Fish abundance, diversity, and community composition were extracted from each quantitative dataset (Table 1). In addition, we included fish community data collected in 2015 from the Peru Basin (DISCOL area; Figure 1), a well-studied abyssal nodule area, for some comparisons (Drazen et al., 2019; Simon-Lledó et al., 2019a).
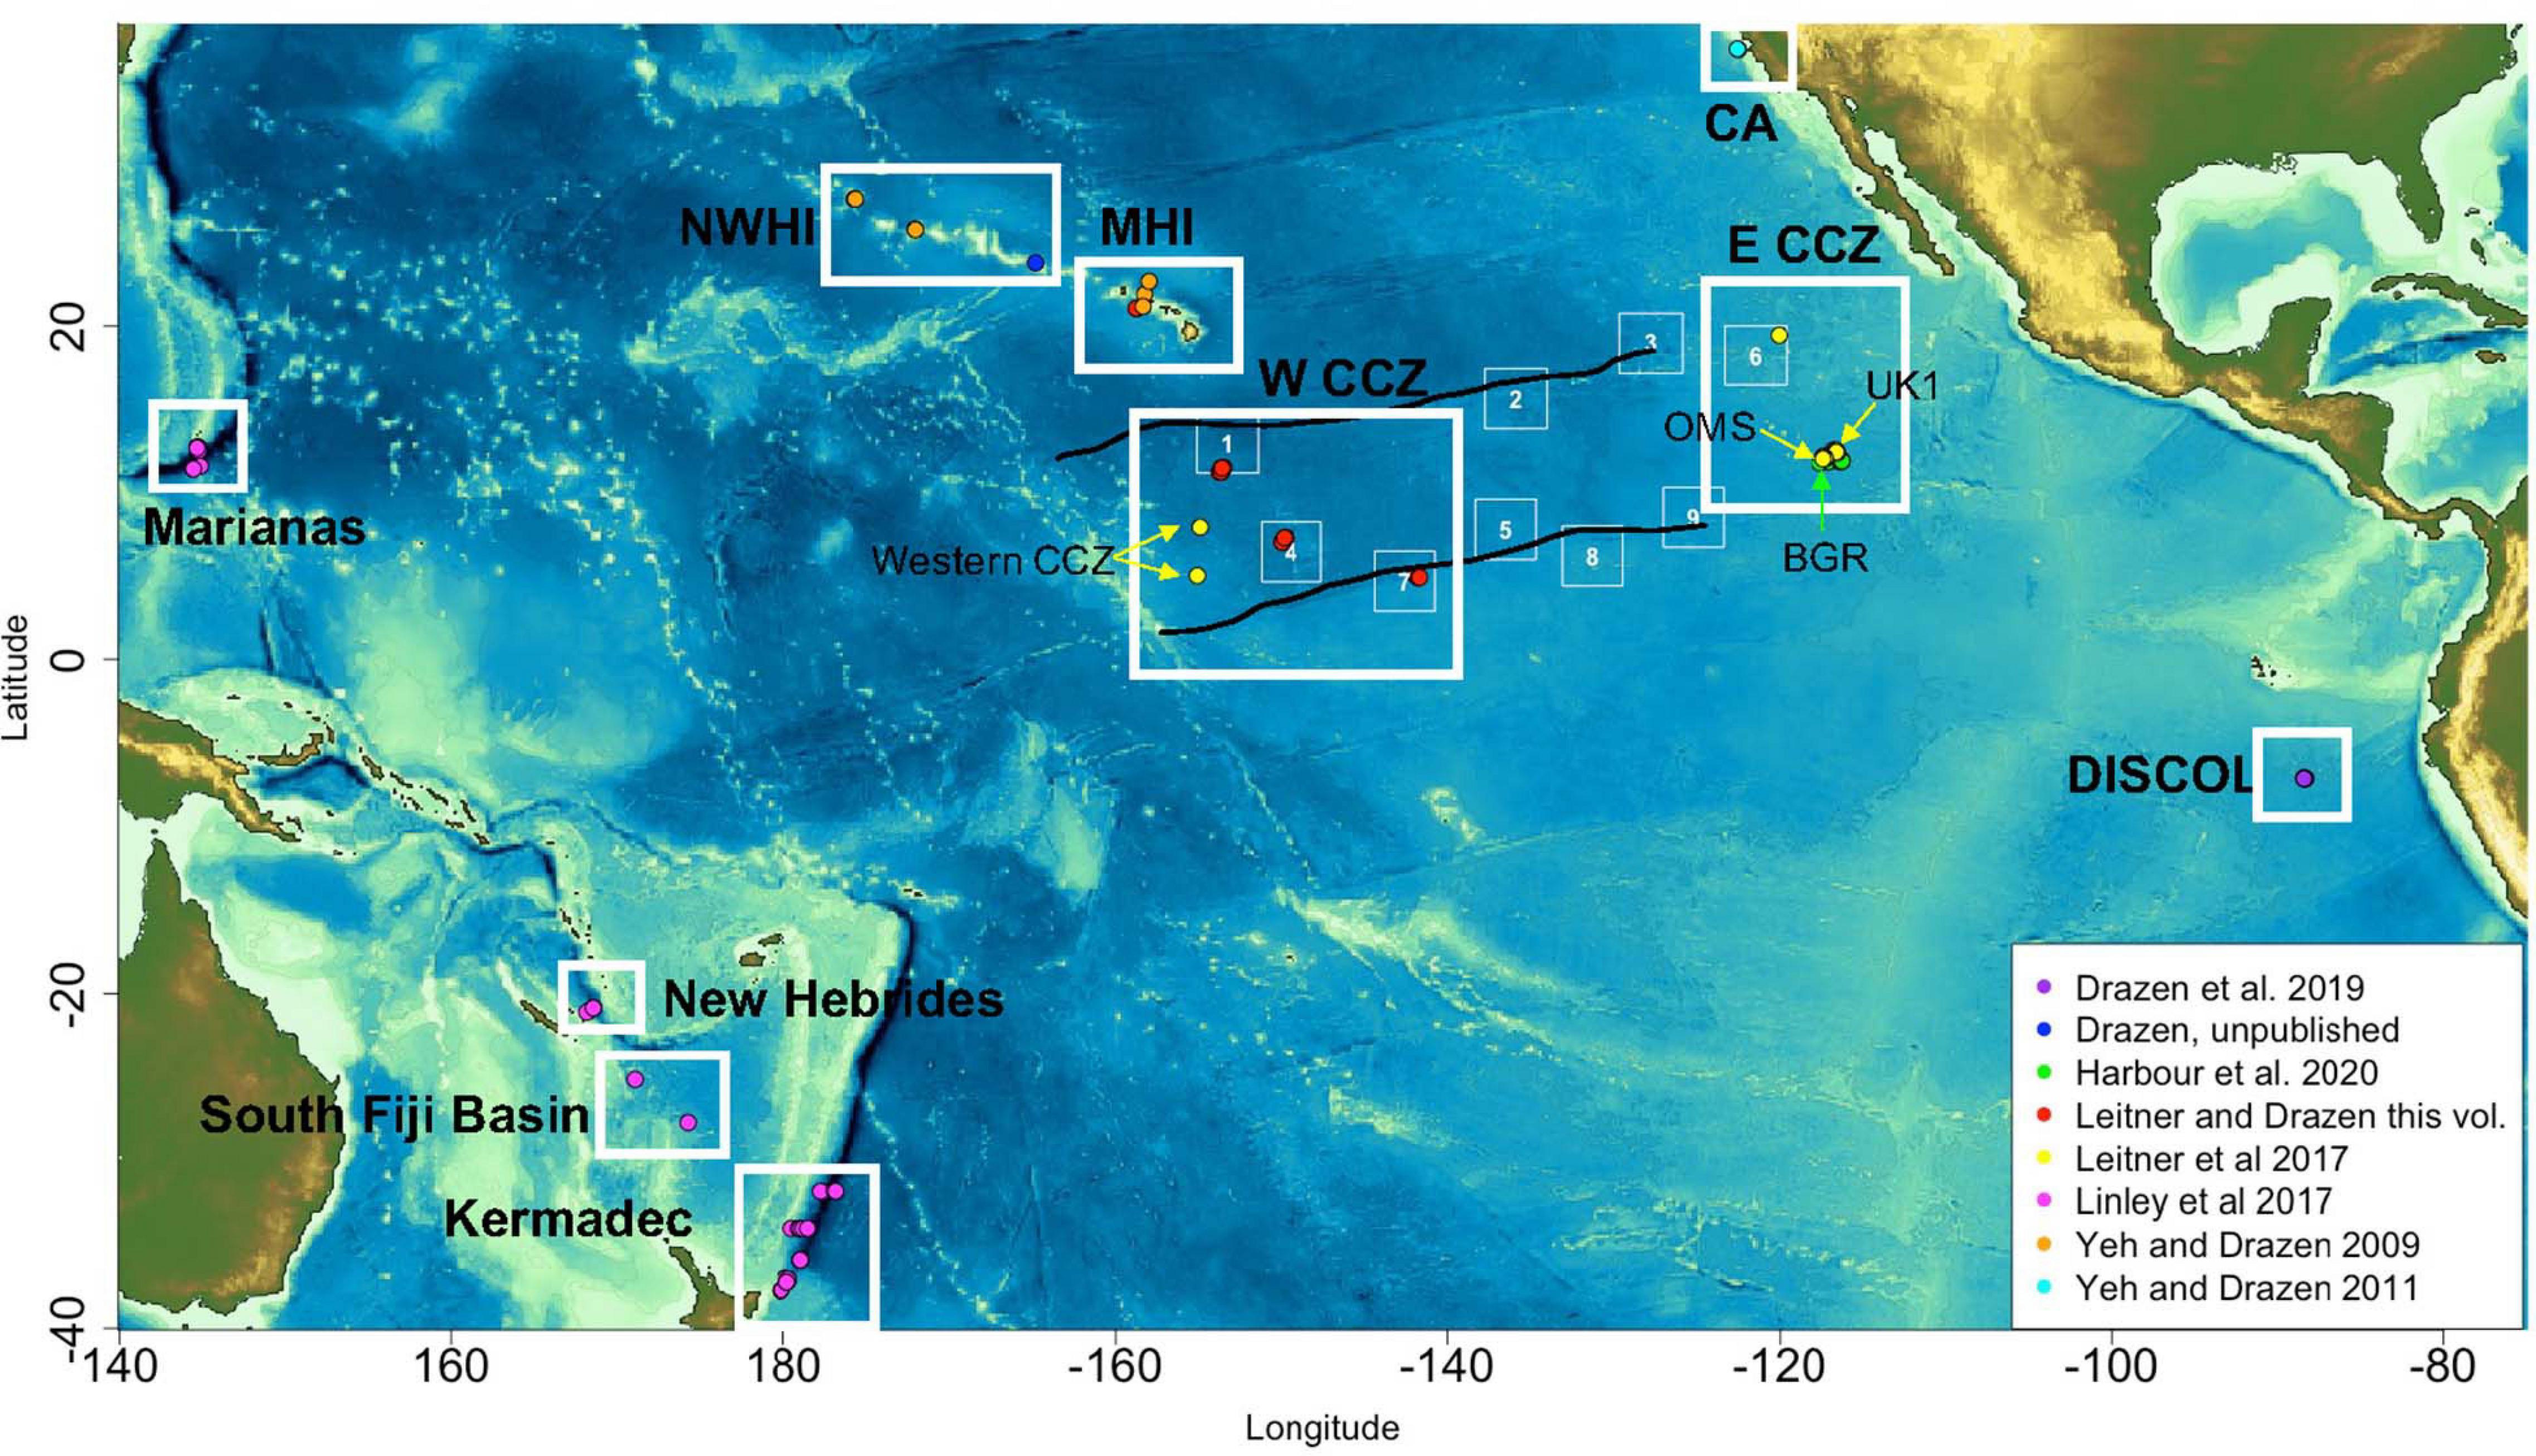
Figure 1. Baited camera sample locations across the Pacific and CCZ region by study. White boxes represent general provinces of sampling.
We also evaluated several datasets for presence of taxa only. The area surveyed is very important. Few fish in a small area may be an artifact of low sampling effort but few fish in a large surveyed area suggests that there is truly a low density of fishes rather than a sampling artifact. We used a threshold of 1,000 m2, based upon an analysis of sample area effects on all megafauna (Simon-Lledó et al., 2019b). Data from a towed camera used in the OMCO A-G sites (McQuaid, 2020), fell below this threshold and were used only for presence information. Measures of diversity and community composition are dependent upon adequate number of specimens sampled. Hence, even if a large area is sampled and density may be derived, the observation of few animals reduces confidence in community composition metrics. For this reason, Kiribati A was only used for presence data (3 fish observed, each representing a different taxa). Data were also made available from towed cameras from KODOS and APEI 9 areas and while counts of fishes were available only a subset of images were available to confirm identities (Ju et al., unpublished data). ROV data from BGR, GSR, and APEI 3 plains and seamounts (Cuvelier et al., 2020) included exploration and opportunistic sampling and Cuvelier et al. (2020) did not feel data for fishes were representative of the whole community, so only taxon presence was used.
Baited Camera Data
Baited cameras are deployed as free vehicle moorings for short (12–48 h) deployments to the seabed. Bait attracts mobile fishes and scavengers to the area in front of the camera for a census. Still photographs or video clips are recorded in time lapse over the duration of the deployment from either an overhead vertical position or a horizontal/oblique position.
Given the mobile nature of the abyssal fish and scavenger fauna, all available baited camera deployments across the Pacific Ocean, including those in the CCZ, were assembled. Data were gathered from the literature and by contribution of raw data by lead scientists of past studies. A total of 12 studies representing 158 deployments were compiled (Table 2 and Figure 1). Three studies representing 43 deployments were directly from the CCZ region: OMS and UK1 (Linley et al., 2017), APEIs 1, 4, 6, and 7 (Linley et al., 2017; Leitner et al., 2021a) and BGR (Harbour et al., 2020). The remainder ranged from New Zealand to California and south to the Peru Basin DISCOL site (Priede and Smith, 1986; Priede et al., 1990, 1994; Jamieson et al., 2009, 2011; Yeh and Drazen, 2009, 2011; Linley et al., 2017; Drazen et al., 2019). Data included camera viewing angle and area, duration of deployment and sampling interval to facilitate sample intercomparison. Only studies that occurred at abyssal depths (3,000–6,000 m) and presented the maximum number of animals visible during deployment (MaxN) were included. Many studies also presented the time of first arrival for each taxon which has been used as an indicator of relative abundance if current speeds and fish swimming speeds are available (Priede and Bagley, 2000). Often these metrics were not available in the studies examined so we used MaxN for assessment of diversity and community composition.
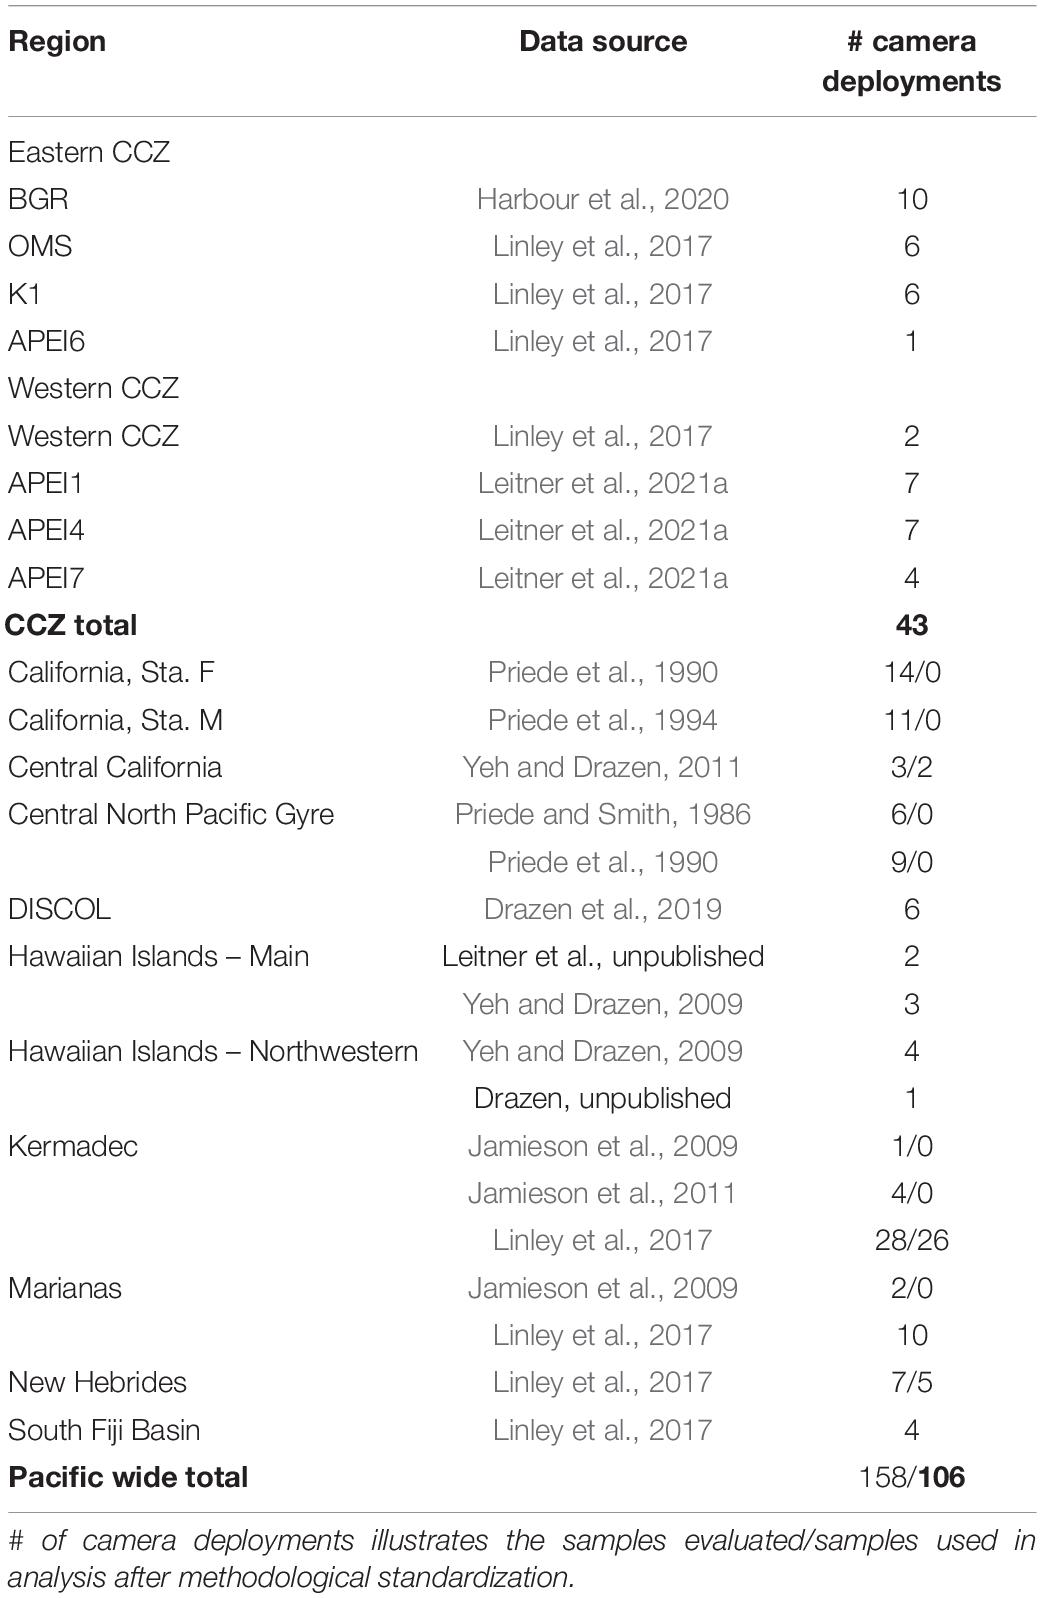
Table 2. Summary of available published and unpublished baited camera datasets from across the Pacific Ocean between 3,000–6,000 m depth (abyssal) by region and data source.
Several methodological issues were evaluated. First, deployment durations varied considerably across the dataset from <5 to 67 h. Examination of this data showed that deployments <5 h had much lower MaxN compared to regionally co-occurring deployments, and so they were eliminated (n = 4; Linley et al., 2017). One deployment used non-standard bait (Yeh and Drazen, 2011) which is also known to affect survey results (Fleury and Drazen, 2013; Wraith et al., 2013) and was eliminated. Finally, while no differences between vertical and oblique camera views was detectable, six deployments used a very small viewing area (<0.5 m2; Jamieson et al., 2009, 2011), MDS results (not shown) suggested different community structure for these deployments compared to other deployments in their area/depth, so they were excluded. The final data set for analysis included 106 deployments across the Pacific of which 43 deployments where from the CCZ (Table 2).
Taxonomic Standardization
To standardize fish identification across the datasets we compiled imagery of abyssal fish observations into a single CCZ abyssal photographic fish guide (Supplementary Material). It included inputs from taxonomists, from the University of Hawaii video annotation group (The Deep-sea Animal Research Center1) who had worked on observations elsewhere in the Pacific as part of the CAPSTONE project (Kennedy et al., 2019), and from the Hawaii Undersea Research Laboratory database (see above link). Voucher specimens from trapping studies were available for a small number of taxa. For instance, morphological taxonomy and/or barcoding approaches were used to confirm identities of the most common and widespread taxon Coryphaenoides armatus/yaquinae (Gaither et al., 2015; Linley et al., 2017) and for a few other species such as Pachycara nazca, Illyophis arx, Cerataspis monstrosus, and Hymenopenaeus nereus. All transects were annotated using this consistent photo guide, most in the annotation platform BIIGLE (Langenkämper et al., 2017). This ensured a high degree of taxonomic consistency which is required for a broad synthesis of the data.
Considerable effort was applied to ensure that all of the data used the same taxonomy and identified taxa consistently (Supplementary Material). A number of earlier studies from off California and in the central North Pacific (Priede and Smith, 1986; Priede et al., 1990, 1994) had been conducted for purposes other than biodiversity assessment and taxa were all identified as Coryphaenoides armatus/yaquinae. These studies had to be omitted from the analysis. For the remaining studies there was variability in a few key taxa (Macrouridae, Bassozetus, and Synaphobranchidae) as these groups have few obvious visual characteristics to confirm identifications. In a few cases higher taxa (genus, family) had to be used for consistency across studies (Supplementary Table 2).
Statistical Analysis
Environmental Data
Environmental data were obtained from literature sources. Depth was taken from measurements made during sampling. Particulate organic carbon (POC) flux to the seafloor was obtained from Lutz et al. (2007) and extracted for all sample positions from an equal-area grid of 9-km resolution. These data were calculated using an exponential flux algorithm applied to satellite-derived net primary production data obtained during the period from August 1997 to June 2004. Nodule abundance was taken from regional models with an interpolated resolution of 1 km2 (McQuaid, 2020). Relative elevation, quantified using broadscale Bathymetric Position Index (BPI), was calculated using a 100 km scale factor from 1 km2 (inner radius) resolution General Bathymetric Chart of the Oceans (GEBCO) bathymetry data and extracted from McQuaid (2020) for all sample locations2. Deployments were also identified by their habitat or stratum, including seamount, abyssal plain, island flank and trench edge.
Diversity
Diversity of fish assemblages sampled with both quantitative image transecting and baited cameras were assessed using Hill numbers which calculate rarified taxa richness (q = 0), exponential Shannon diversity (q = 1), and the inverse of Simpson diversity (q = 2) for each region as well as asymptotic diversity estimates for each site. This approach was used to help constrain the disparities between numbers of observations in each region. Hill numbers were calculated using the iNEXT function in the iNEXT R package (R version 4.0.2) including 95% confidence intervals around the resulting rarefaction and extrapolation sampling curves, which allows for robust comparison of the diversity metrics between sites (Chao et al., 2014; Hsieh et al., 2020).
To further explore differences in fish and scavenger diversity between the eastern and western CCZ, rarified and extrapolated diversity was compared between the two regions also using the iNEXT function in the iNEXT R package. To evaluate the additional diversity provided by samples from CCZ seamounts, the diversity metrics were compared between the eastern and western CCZ excluding seamount deployments. To investigate the drivers of the spatial variability in diversity across the CCZ and across the Pacific from the baited camera dataset, we also used generalized linear models with a gamma error distribution and a log link function to relate observed and asymptotic diversity estimates (for q = 0,1,2) to average station environmental predictors. For the CCZ analysis the predictors used were: POC flux, nodule abundance, and BPI as well as habitat stratum to account for clustering by sampling area. Longitude was excluded due to correlation with stratum and POC flux across the CCZ. For the Pacific analysis the predictors used were: POC flux, habitat type, and longitude.
Community Composition
Community composition was evaluated for both transect and baited camera approaches using multidimensional scaling (MDS), cluster analysis (group average linkage) with associated significance testing using SIMPROF (1,000 permutations) in Primer v6.1 (Clarke and Gorley, 2006). Transect data used fish densities to standardize for variations in total sampling and observations between studies. Densities were square root transformed and a Bray-Curtis similarity matrix was used. For the baited camera data, we used a similar approach with square root transformed MaxN data and a Bray-Curtis similarity matrix. For all sampling approaches, the taxa most responsible for significant (SIMPROF) differences between groups of deployments were identified using a similarity percentages (SIMPER) approach. Where significant structuring in community composition was found, we evaluated the effects of the potential environmental drivers including estimated POC flux (Lutz et al., 2007), depth, habitat stratum (seamount, abyssal plain, trench edge, island flank), and longitude. Nodule abundance was not included because of a high correlation with the longitude predictor (Pearson correlation 0.81) since the dataset included areas outside the CCZ with no nodules. Habitat type was used in favor of the continuous variable BPI because the main goal of this analysis was to ask whether community compositions varies across these morphological habitat categories rather than whether it varies across a gradient of local elevation where island flanks, for example, would have similar values (close to 0) as abyssal plains. PERMANOVA tests with marginal significance tests were used to evaluate the significance of each predictor variable such that the test was repeated multiple times, each time with the full dataset, with the predictors reordered each time so that each predictor variable was the last one to be added to the analysis (reordered model, not reduced model). Significance for each predictor was then evaluated only from partial R-squared values (the proportion of the sum of squares from the total) generated by the corresponding marginal PERMANOVA test (Oksanen et al., 2016, adonis documentation). Data were visualized using a constrained ordination using the same taxa data and predictors using the function capscale() from the R package vegan (Oksanen et al., 2016), which performs a canonical analysis of principle coordinates analysis (CAP). Permutations (n = 9,999) were stratified by region to account for spatial autocorrelation and nestedness.
Biogeography
To evaluate species ranges and biogeographies of fishes and scavengers, we took two approaches. First, using baited camera data (both fishes and other scavengers) we examined overlap in taxa occurrence between individual deployment locations as a function of the geographic distance between the stations. Every pair of stations was assigned a geographic separate distance based on their locations and a number of shared taxa. Shared taxa were then plotted as a function of geographic separation. Second, using both baited camera and transect data (both quantitative and qualitative transects) converted to presence data we compared species overlap (fishes only in this case) by location to estimate how widespread these animals are both across the CCZ and across the Pacific. The overlap was as a frequency histogram of the number of taxa observed in numbers of sampled areas (e.g., how many taxa in one area, two areas etc.).
Diversity and community composition analyses were run in PRIMER v6. Other statistics were run in R version 4.0.2.
Results
Camera Transect Data (CCZ Only)
The camera transect data frequently included very few fishes (Table 1). For instance, four transects in Kiribati A (0.60 ha) observed only 3 fish each its own taxon. Some of the OMCO stations only sampled ∼800 m2 (0.08 ha) in a single transect and observed no fish at all. In contrast some of the TOML areas in the eastern/central CCZ and the APEIs had survey data covering 1.5 to over 2 hectares and observed up to 83 fishes. The DISCOL site in the south Pacific was the most intensively sampled location by far, with a survey that covered nearly 20 hectares and observed 649 individual fishes.
Fish density and diversity varied greatly across the CCZ. From the quantitative transects total fish density ranged from 6.6 fish ha–1 in the northwestern APEI 1 to just over 42 fish ha–1 in the west equatorial APEI 7 and Kiribati C areas (Table 1 and Figure 2). There was no significant correlation between mean fish density at each station and its corresponding seafloor POC flux (r = 0.64, p = 0.17). Rarefied diversity curves suggested that species richness was highest in two areas of Kiribati and lowest in APEI 6 and the DISCOL site (Figure 3). Generally, most of the rarefaction curves were not yet nearing an asymptote suggesting that additional sampling is required to characterize the full fish community. The exception was for the DISCOL area (649 fishes representing 17 taxa).
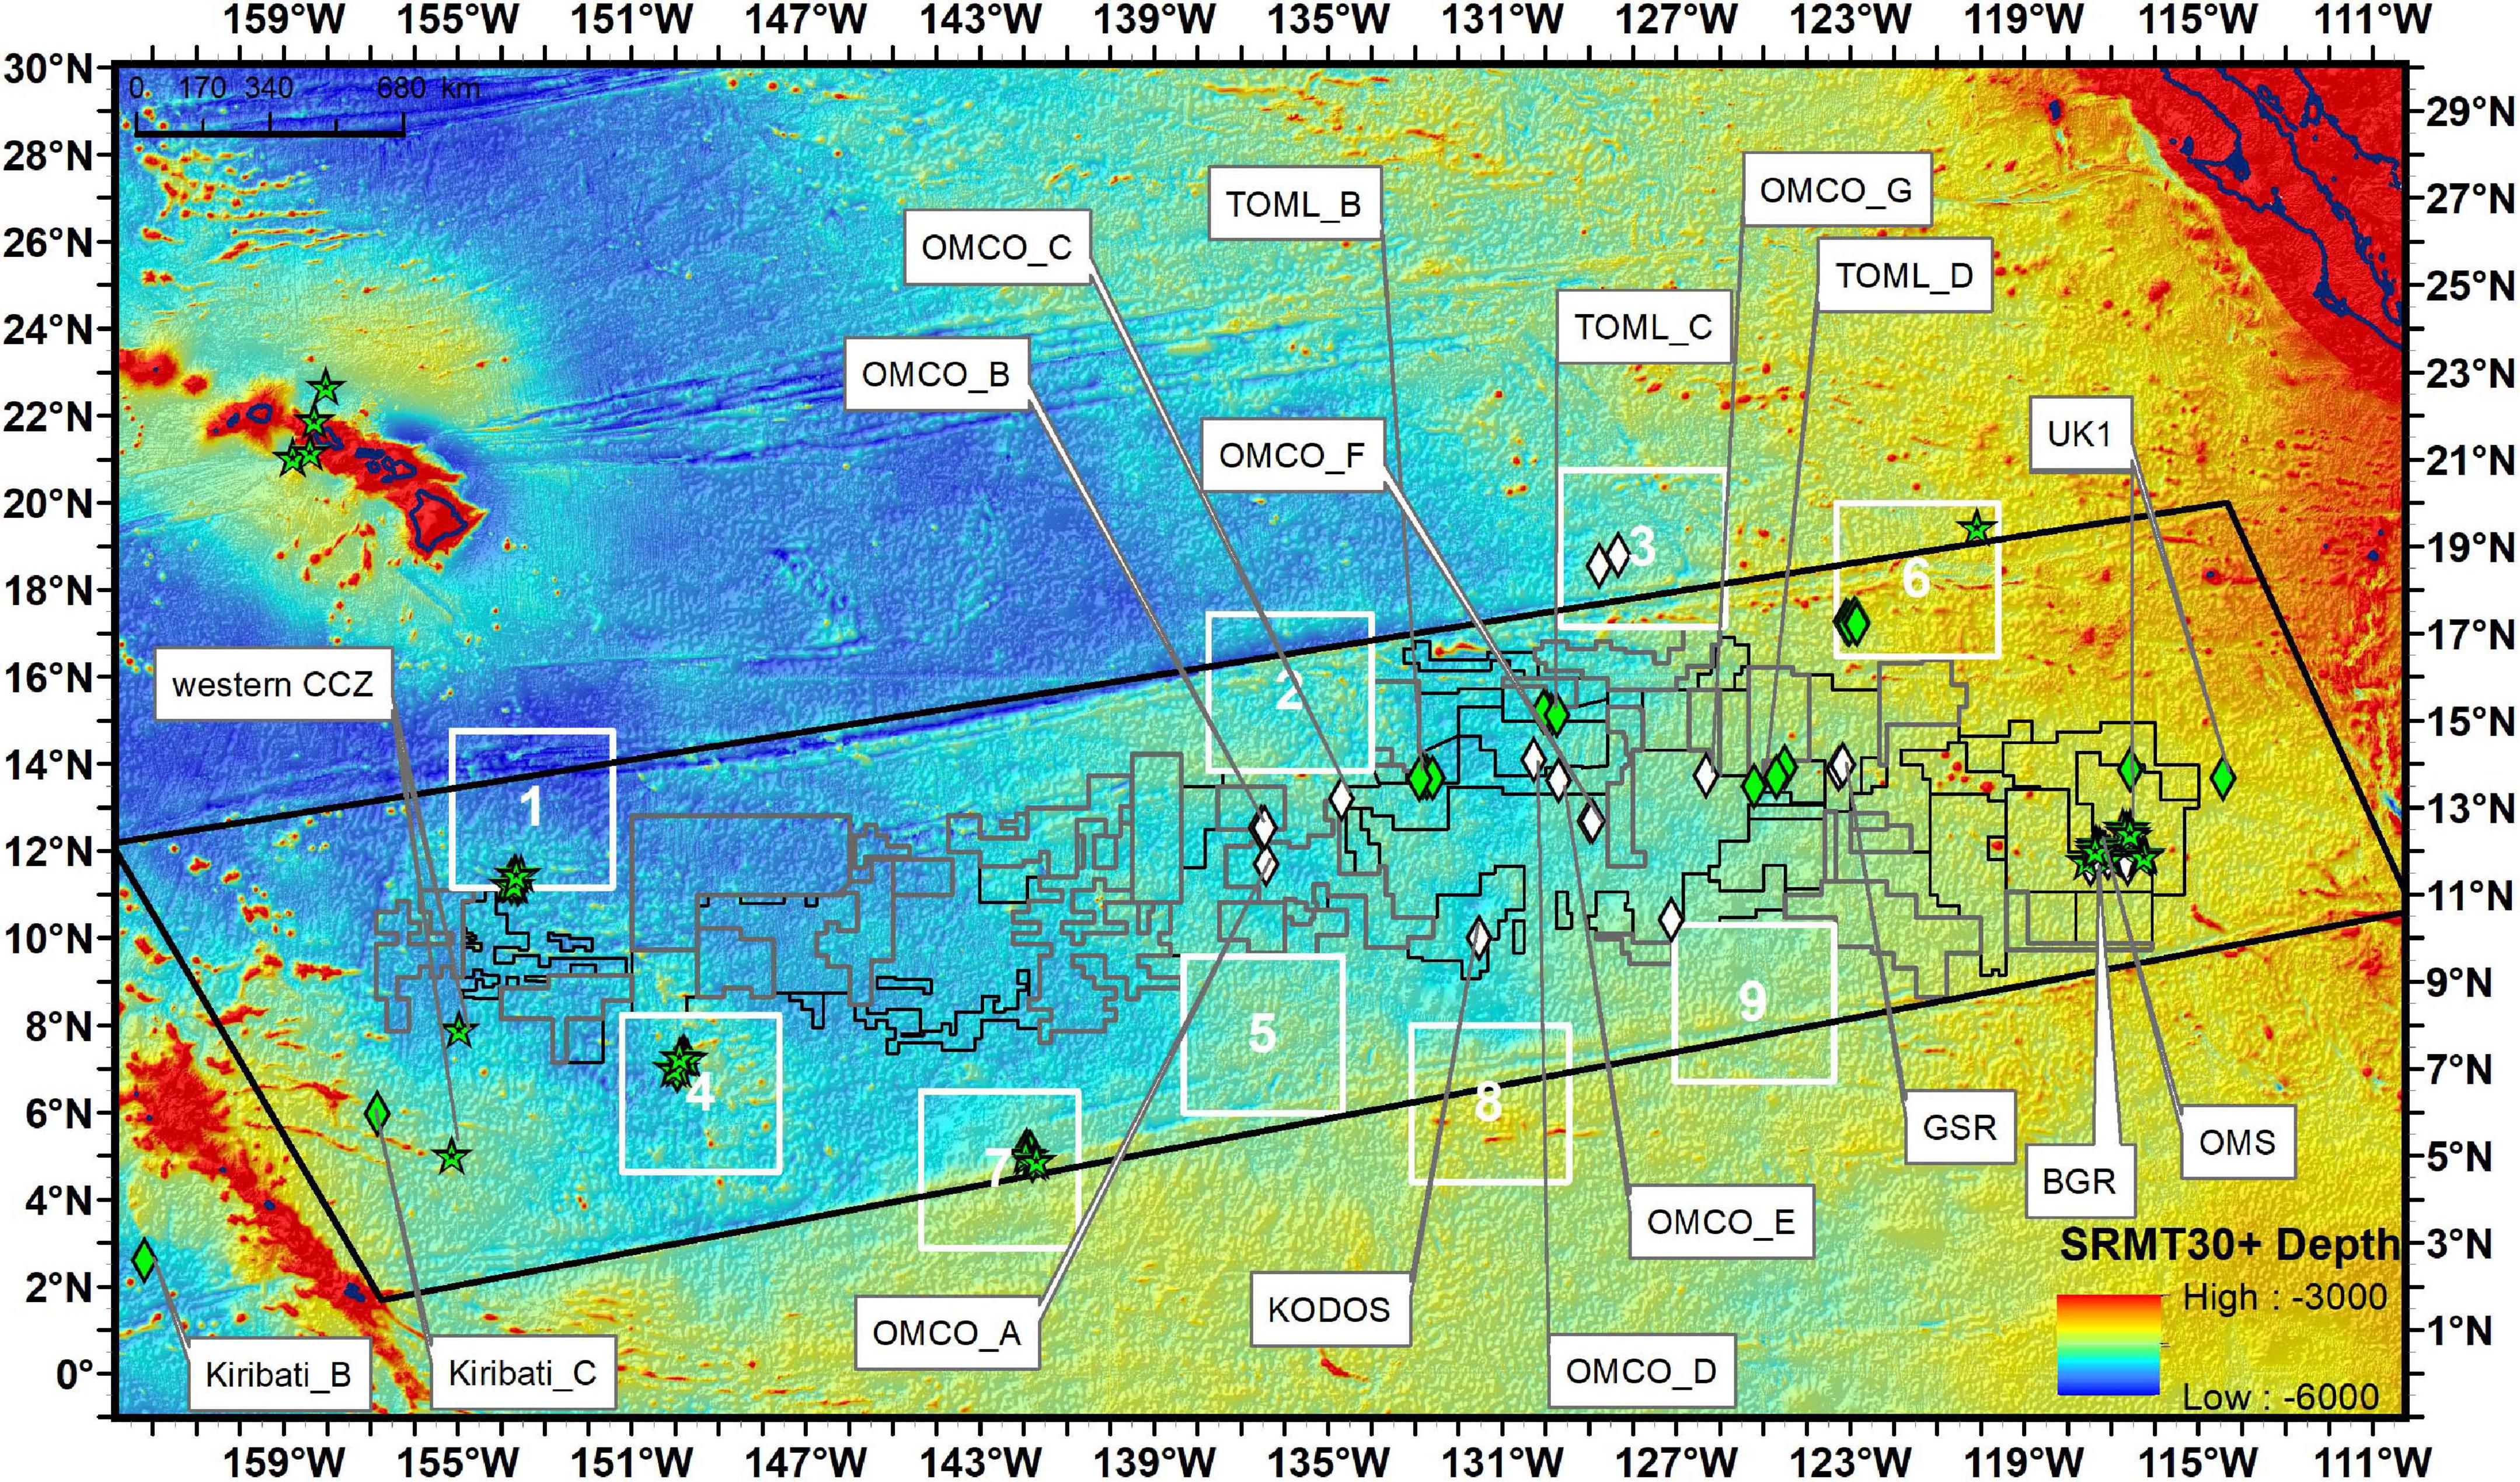
Figure 2. Locations of visual transects (diamonds) and baited camera sample (stars) locations across the CCZ. Quantitative visual transects are in green and non-quantitative in white symbols. Study locations are given as abbreviations (see Table 1).
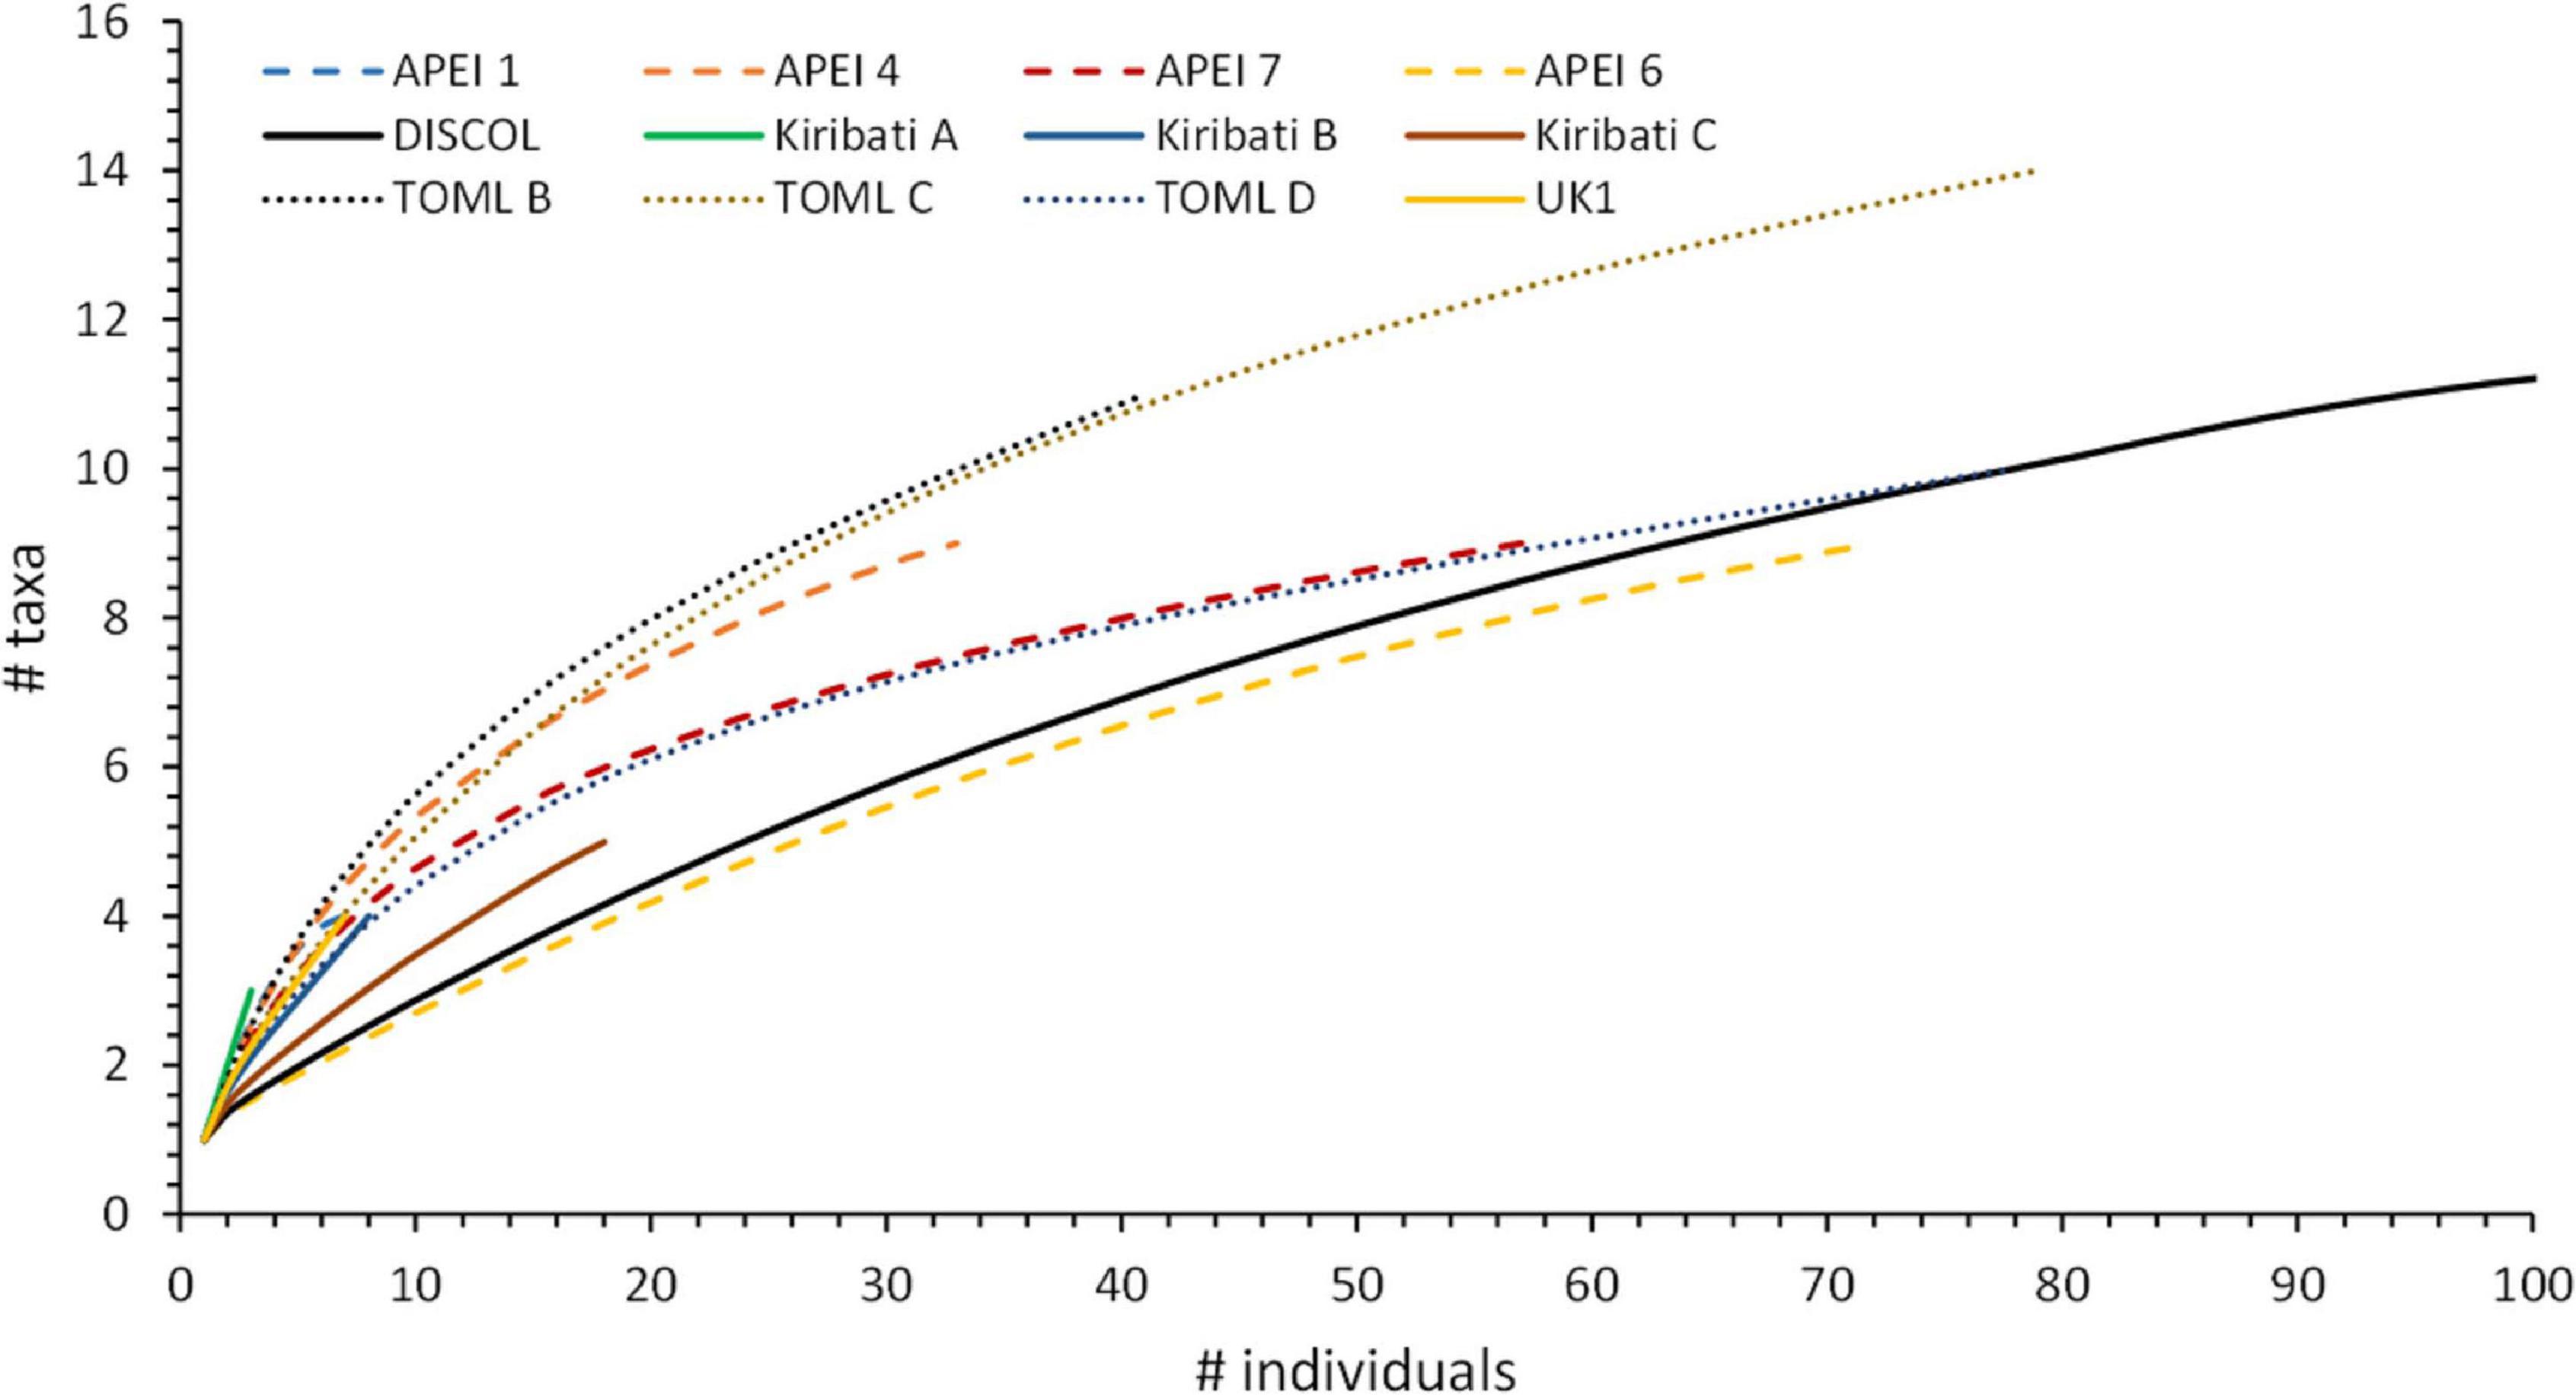
Figure 3. Rarefied fish diversity from quantitative camera transect data by region. Note that for DISCOL considerably more fish were observed and the curve extends to 17 taxa.
The fish community across the CCZ was dominated by a few common taxa. The most frequently encountered taxa and the one with the highest density was by far Ipnops meadi. Other abundant taxa included Abyssoberyx sp., Bassozetus sp. B, Coryphaenoides armatus/yaquinae, Ophidiid sp. 5, Ilyophis arx, and Typhlonus nasus (Figure 4). These were also the most frequently observed across transects except for Ilyophis arx that was locally abundant at only a few locations (Leitner et al., 2021a, see below and Supplementary Table 1). Variability in community composition was high between the transects, so while there was some apparent structure across the CCZ, no statistically significant groupings were found (SIMPROF, p > 0.05; Figure 5). Generally, transects that were located farther to the west in the CCZ were located to the right of the MDS space progressing from APEIs 1 and 4 and the Kiribati transects to transects from the TOML and APEI6 locations to the left of the MDS space. Additionally, transects in APEI 4 and 7 (one each) that occurred on seamounts rather than the abyssal plain were located to the bottom of the MDS with high densities of the synaphobranchid eel, I. arx (Figure 5).
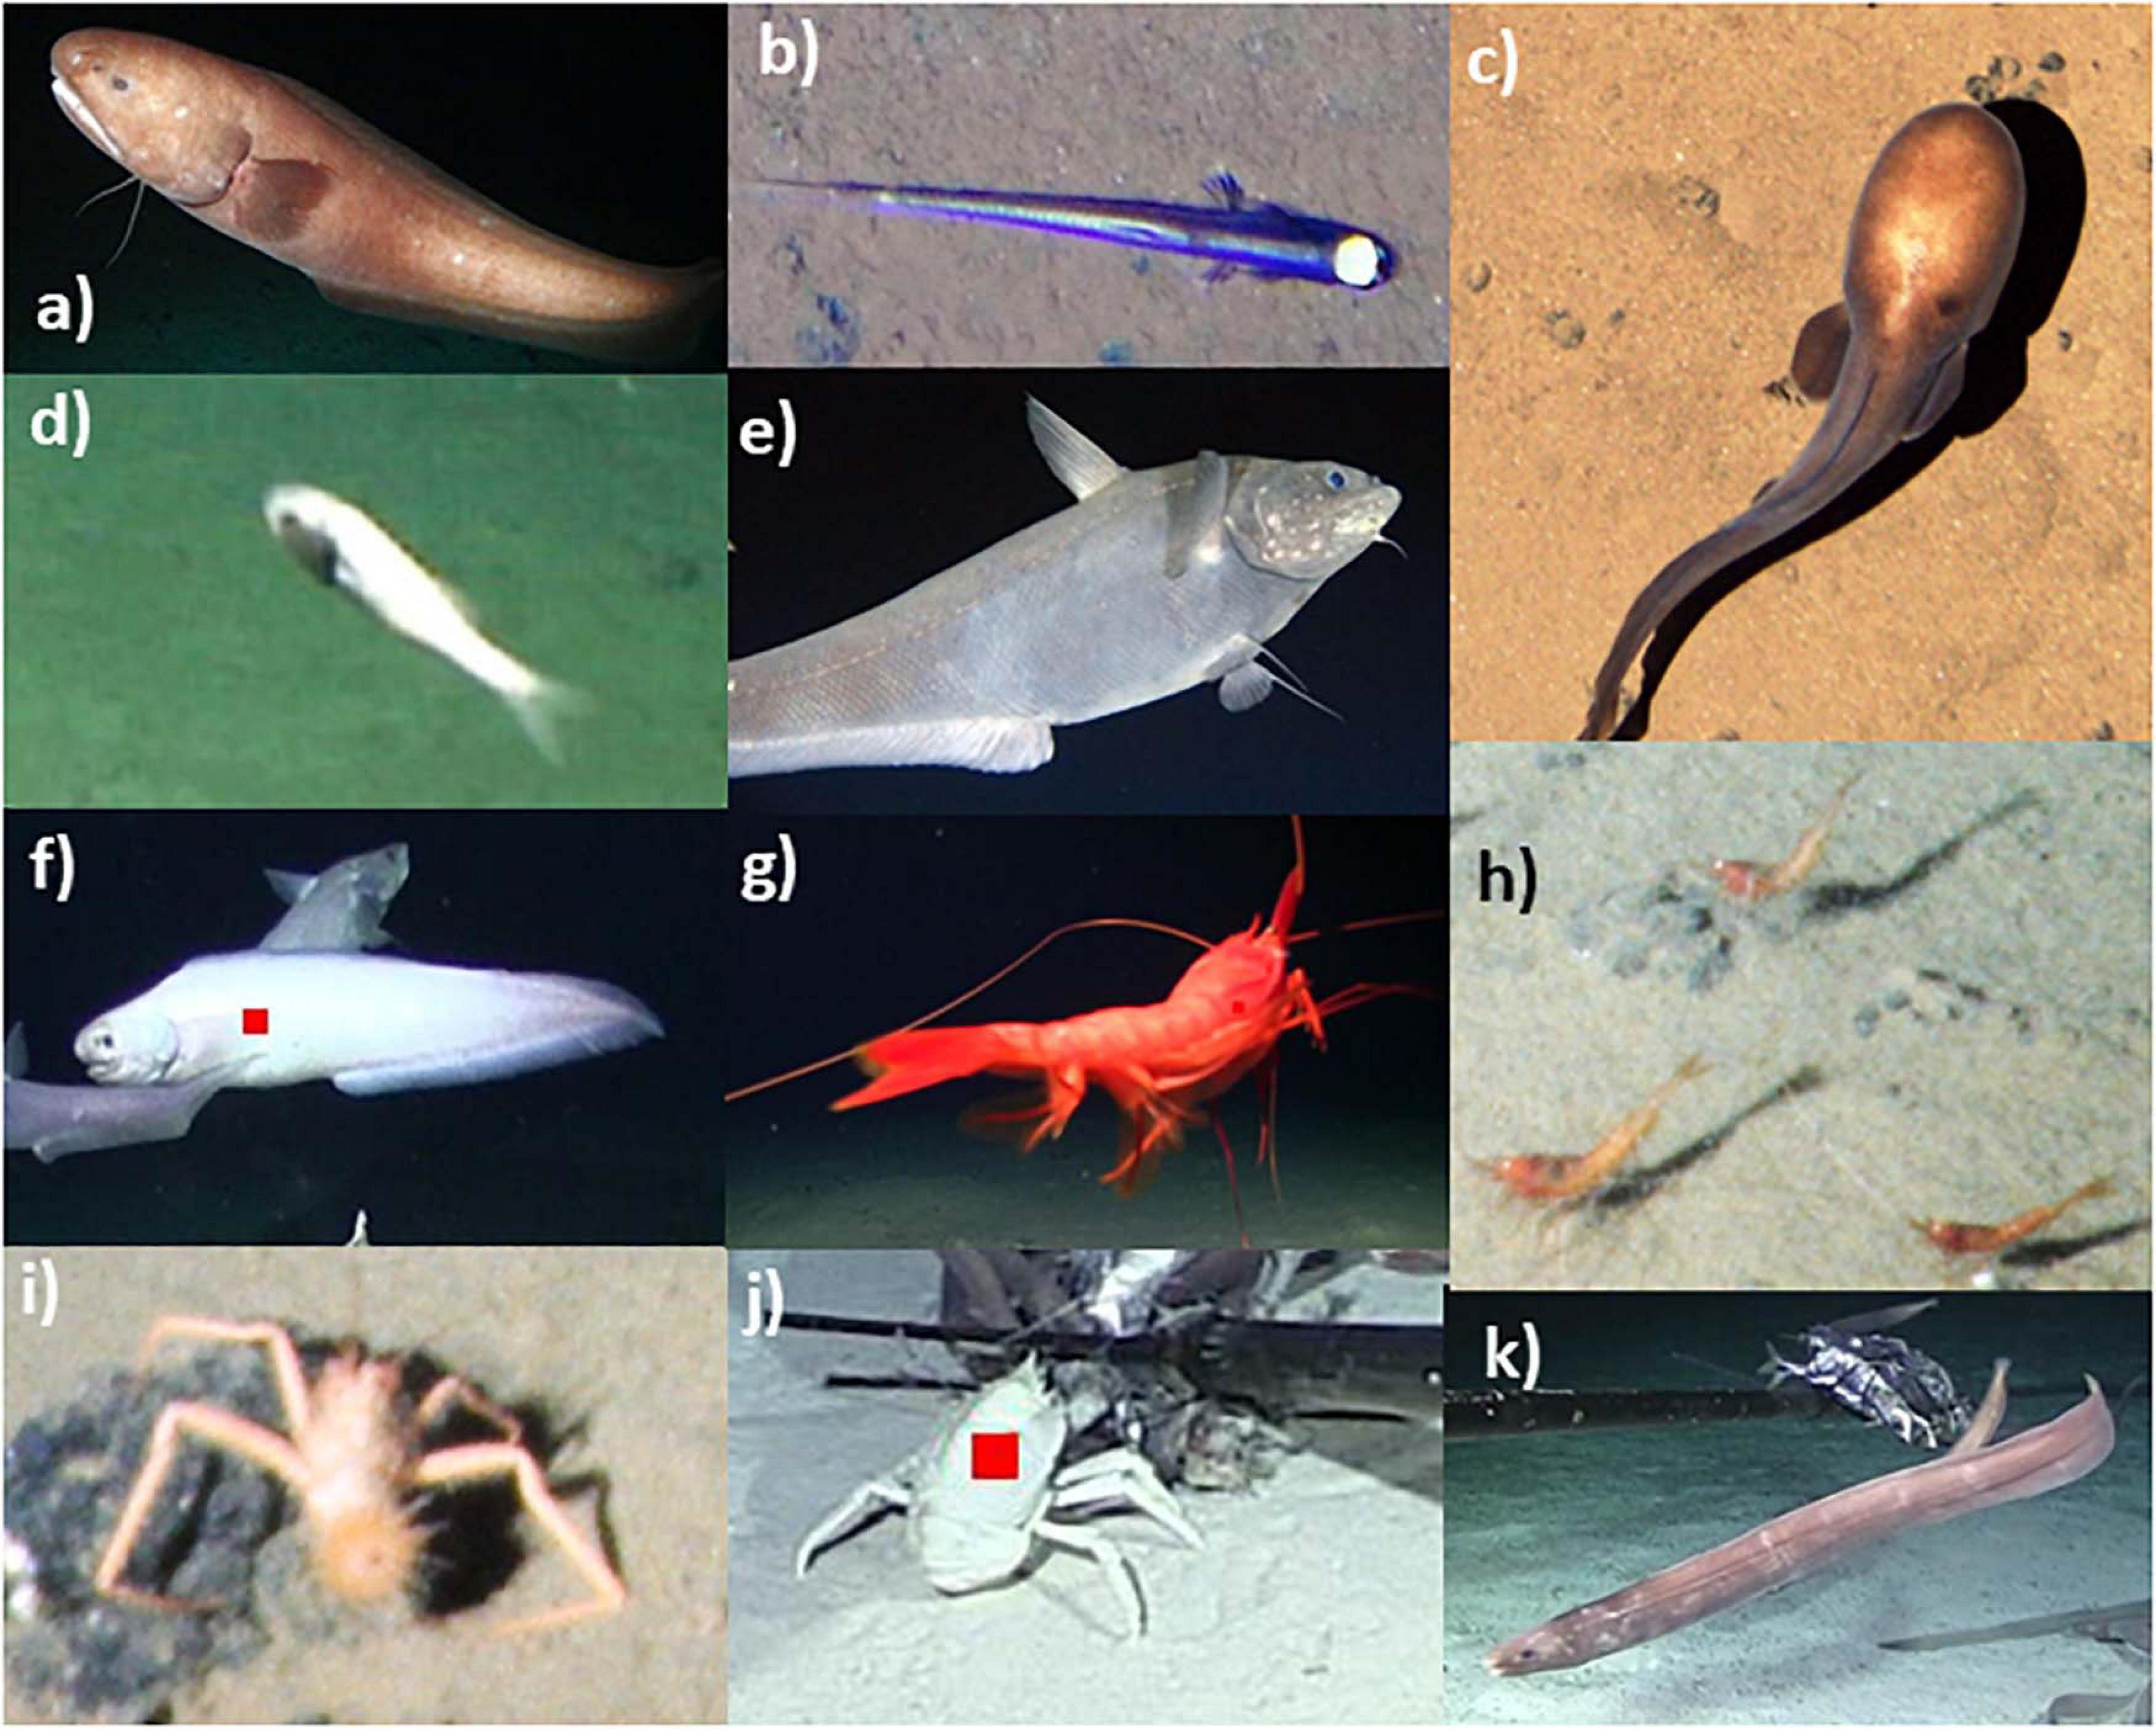
Figure 4. Representative fishes and invertebrate scavengers observed in visual transects and baited cameras. (a) Bassozetus cf. nasus, (b) Ipnops meadi, (c) Typhlonus nasus, (d) Abyssoberyx sp., (e) Coryphaenoides armatus/yaquinae, (f) Barathrites iris, (g) Cerataspis monstrosus, (h) Hymenopenaeus nereus, (i) Probeebei mirabilis, (j) Munidopsis sp., (k) Ilyophis arx.
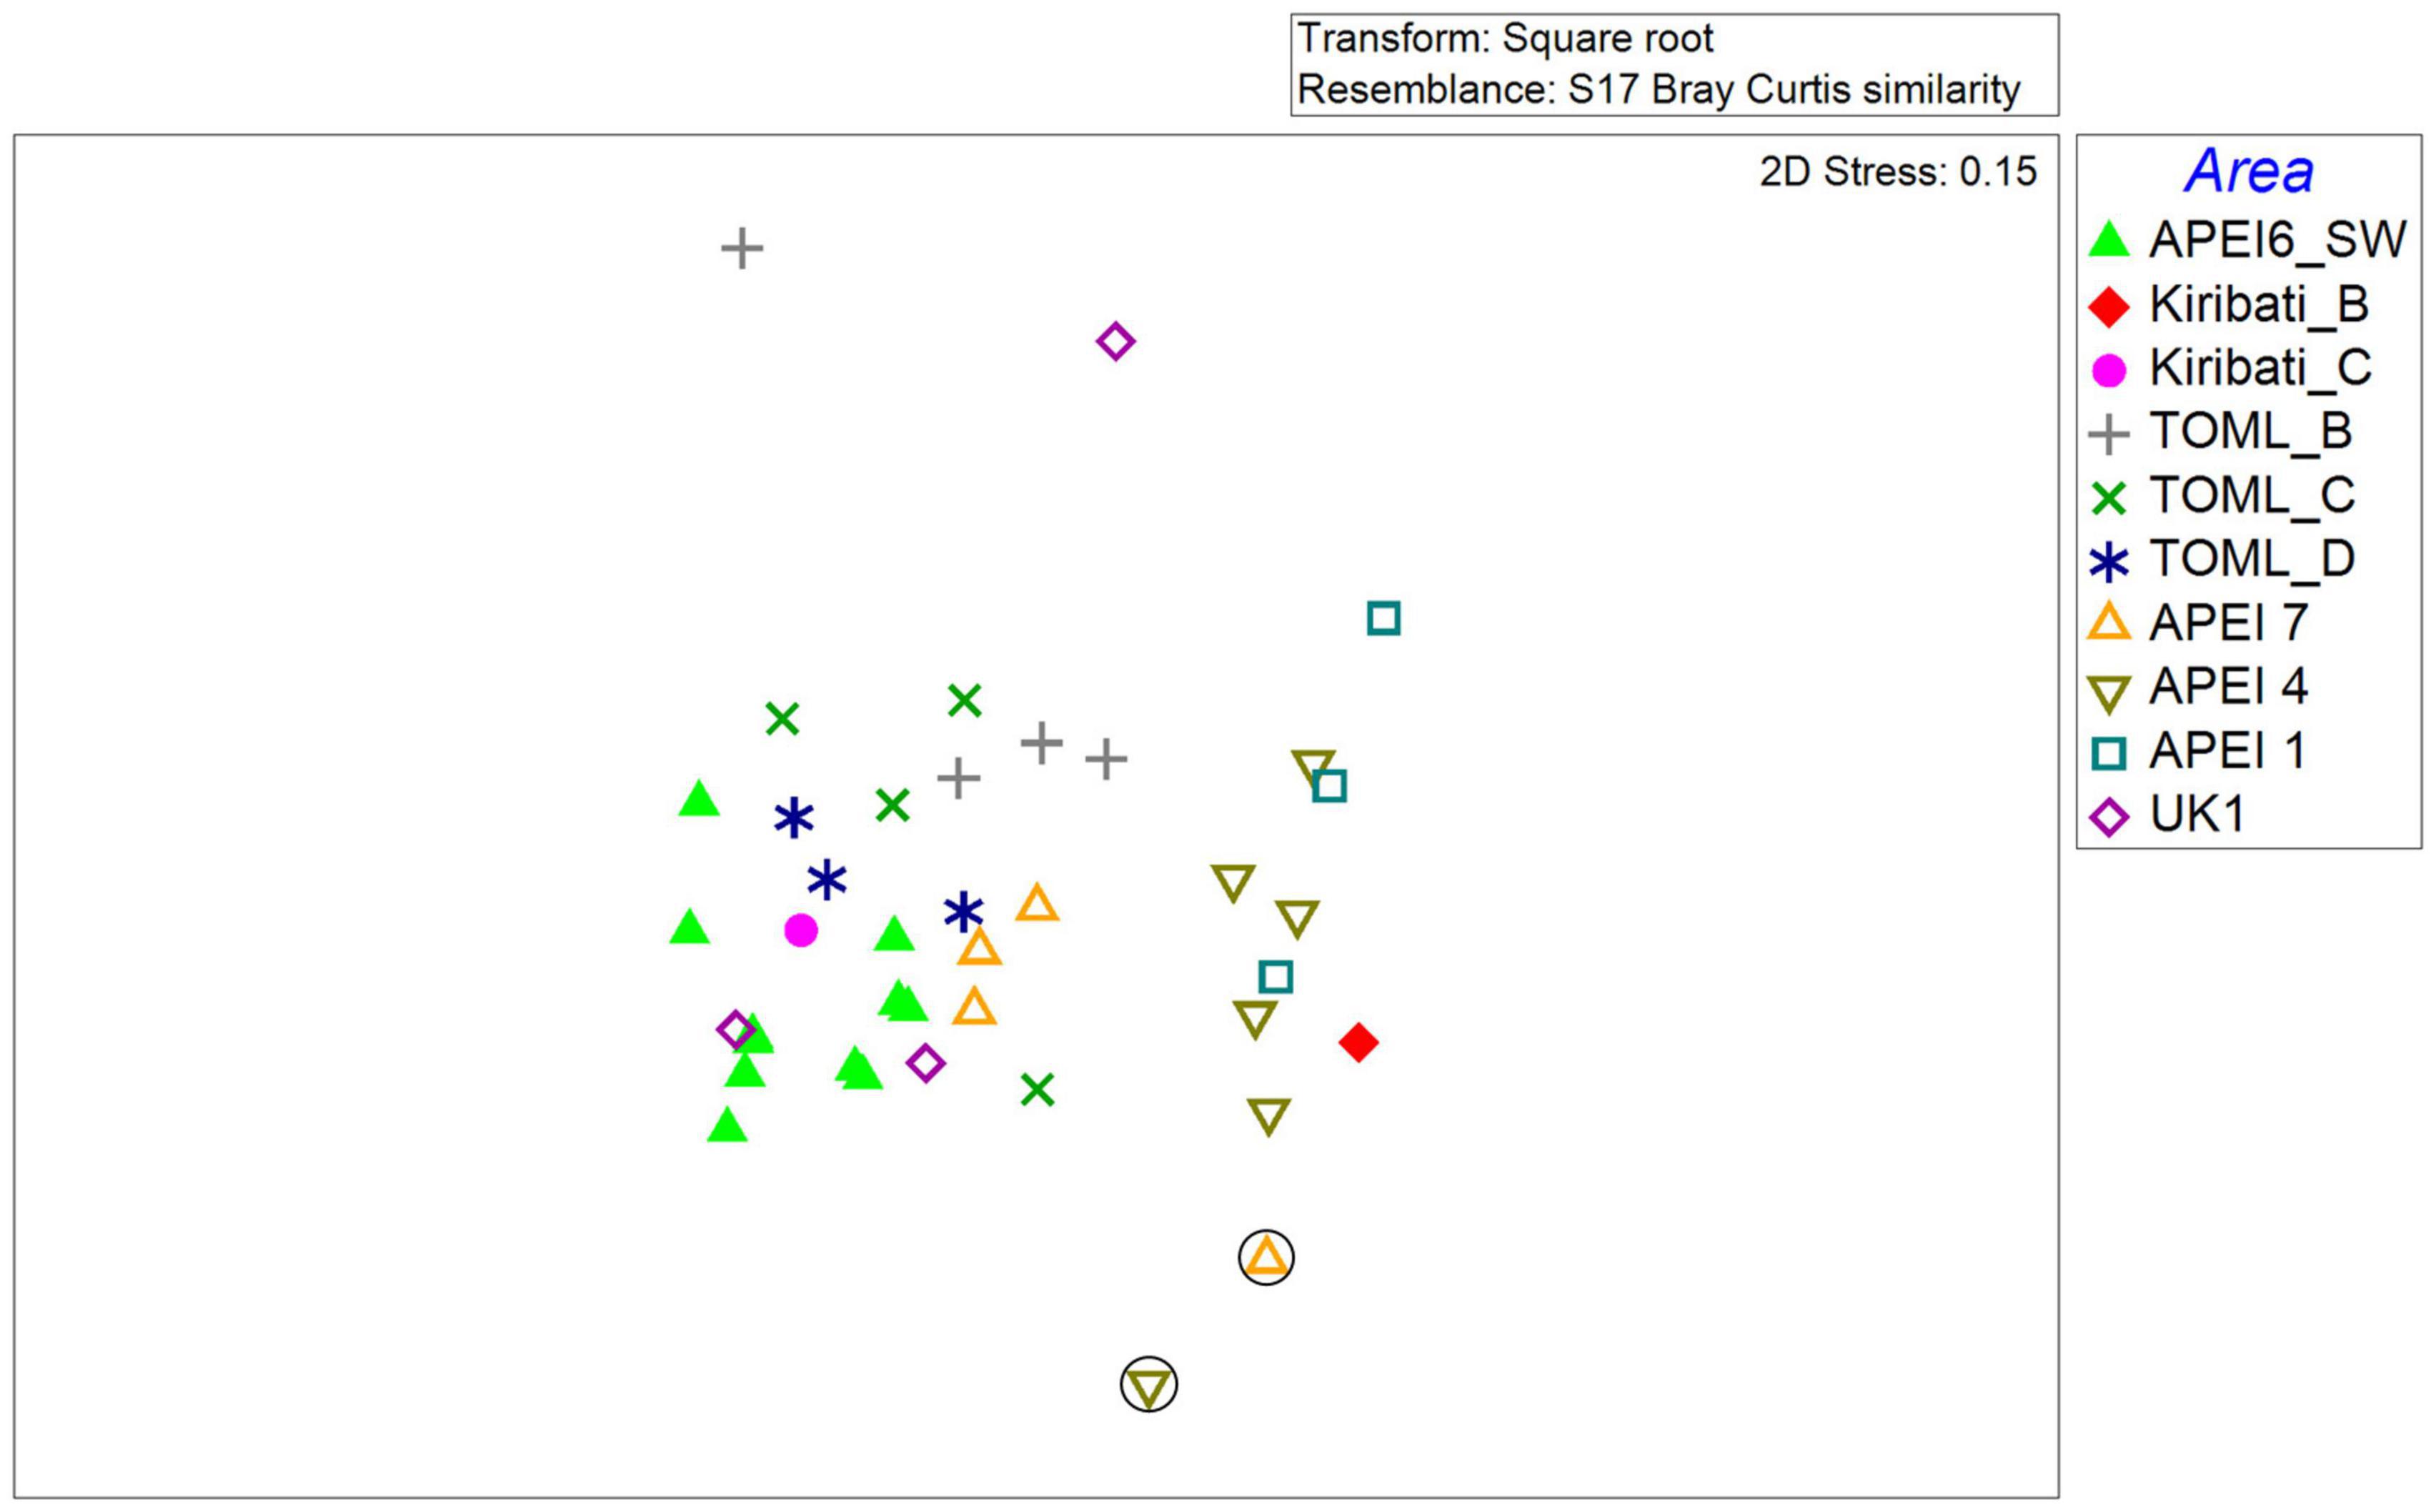
Figure 5. MDS plot of fish community composition based on a square root transformed Bray-Curtis similarity matrix of fish densities for each quantitative transect in each area across the CCZ. Circled symbols represent transects on abyssal seamounts.
Baited Camera Data
Baited camera studies provide a complementary examination of fish and scavenger communities across the CCZ. From the 43 deployments the most commonly observed fish were C. armatus/yaquinae, Bassozetus nasus, Barathrites iris, and Pachycara spp. (Figure 4; Supplementary Table 2). A total of 16 fish taxa were observed in the CCZ region. This represents 44% (14 of 32) of the total fish fauna observed in the camera transects. Furthermore, the baited cameras observed two taxa (Ophididae sp1, Histiobranchus bathybius) that were not observed in the camera transects and the Pachycara spp., observed with both methods, could be resolved to two species in the baited camera observations. Sixteen invertebrate taxa were observed from the CCZ baited camera deployments including shrimps, ophiuroids, a Plesiodiatematid urchin, Munidopsis crabs, and a few octopuses (Figure 4; Supplementary Table 2). Shrimp dominated the invertebrate scavenger assemblage across the CCZ, including Hymenopenaeus nereus and Penaeoids represented by Cerataspis monstrosus and Benthesicymidae. This latter group was very difficult to distinguish from imagery. Across the Pacific abyss, a total of 48 scavenging taxa were observed. There were sixteen taxa not observed in the CCZ, 10 that were restricted to the CCZ observations and 22 taxa that were held in common.
Scavenger assemblages varied significantly across the Pacific (Figure 6; SIMPROF, p < 0.05). The CCZ communities generally grouped by sampling area and were distinct from those found off California, the Northwestern Hawaiian Islands, and the western Pacific (e.g., Kermadec and Marianas areas). The CCZ communities were similar to deeper abyssal samples off the main Hawaiian Islands which were occasionally included in significant groups of primarily CCZ samples (p < 0.05; SIMPROF). DISCOL samples were also more similar to CCZ samples but these still formed a statistically different outgroup (p < 0.05; SIMPROF) because of the frequent occurrence of the hermit crab Probeebei mirabilis (SIMPER dissimilarity to CCZ groups = 10–15%).
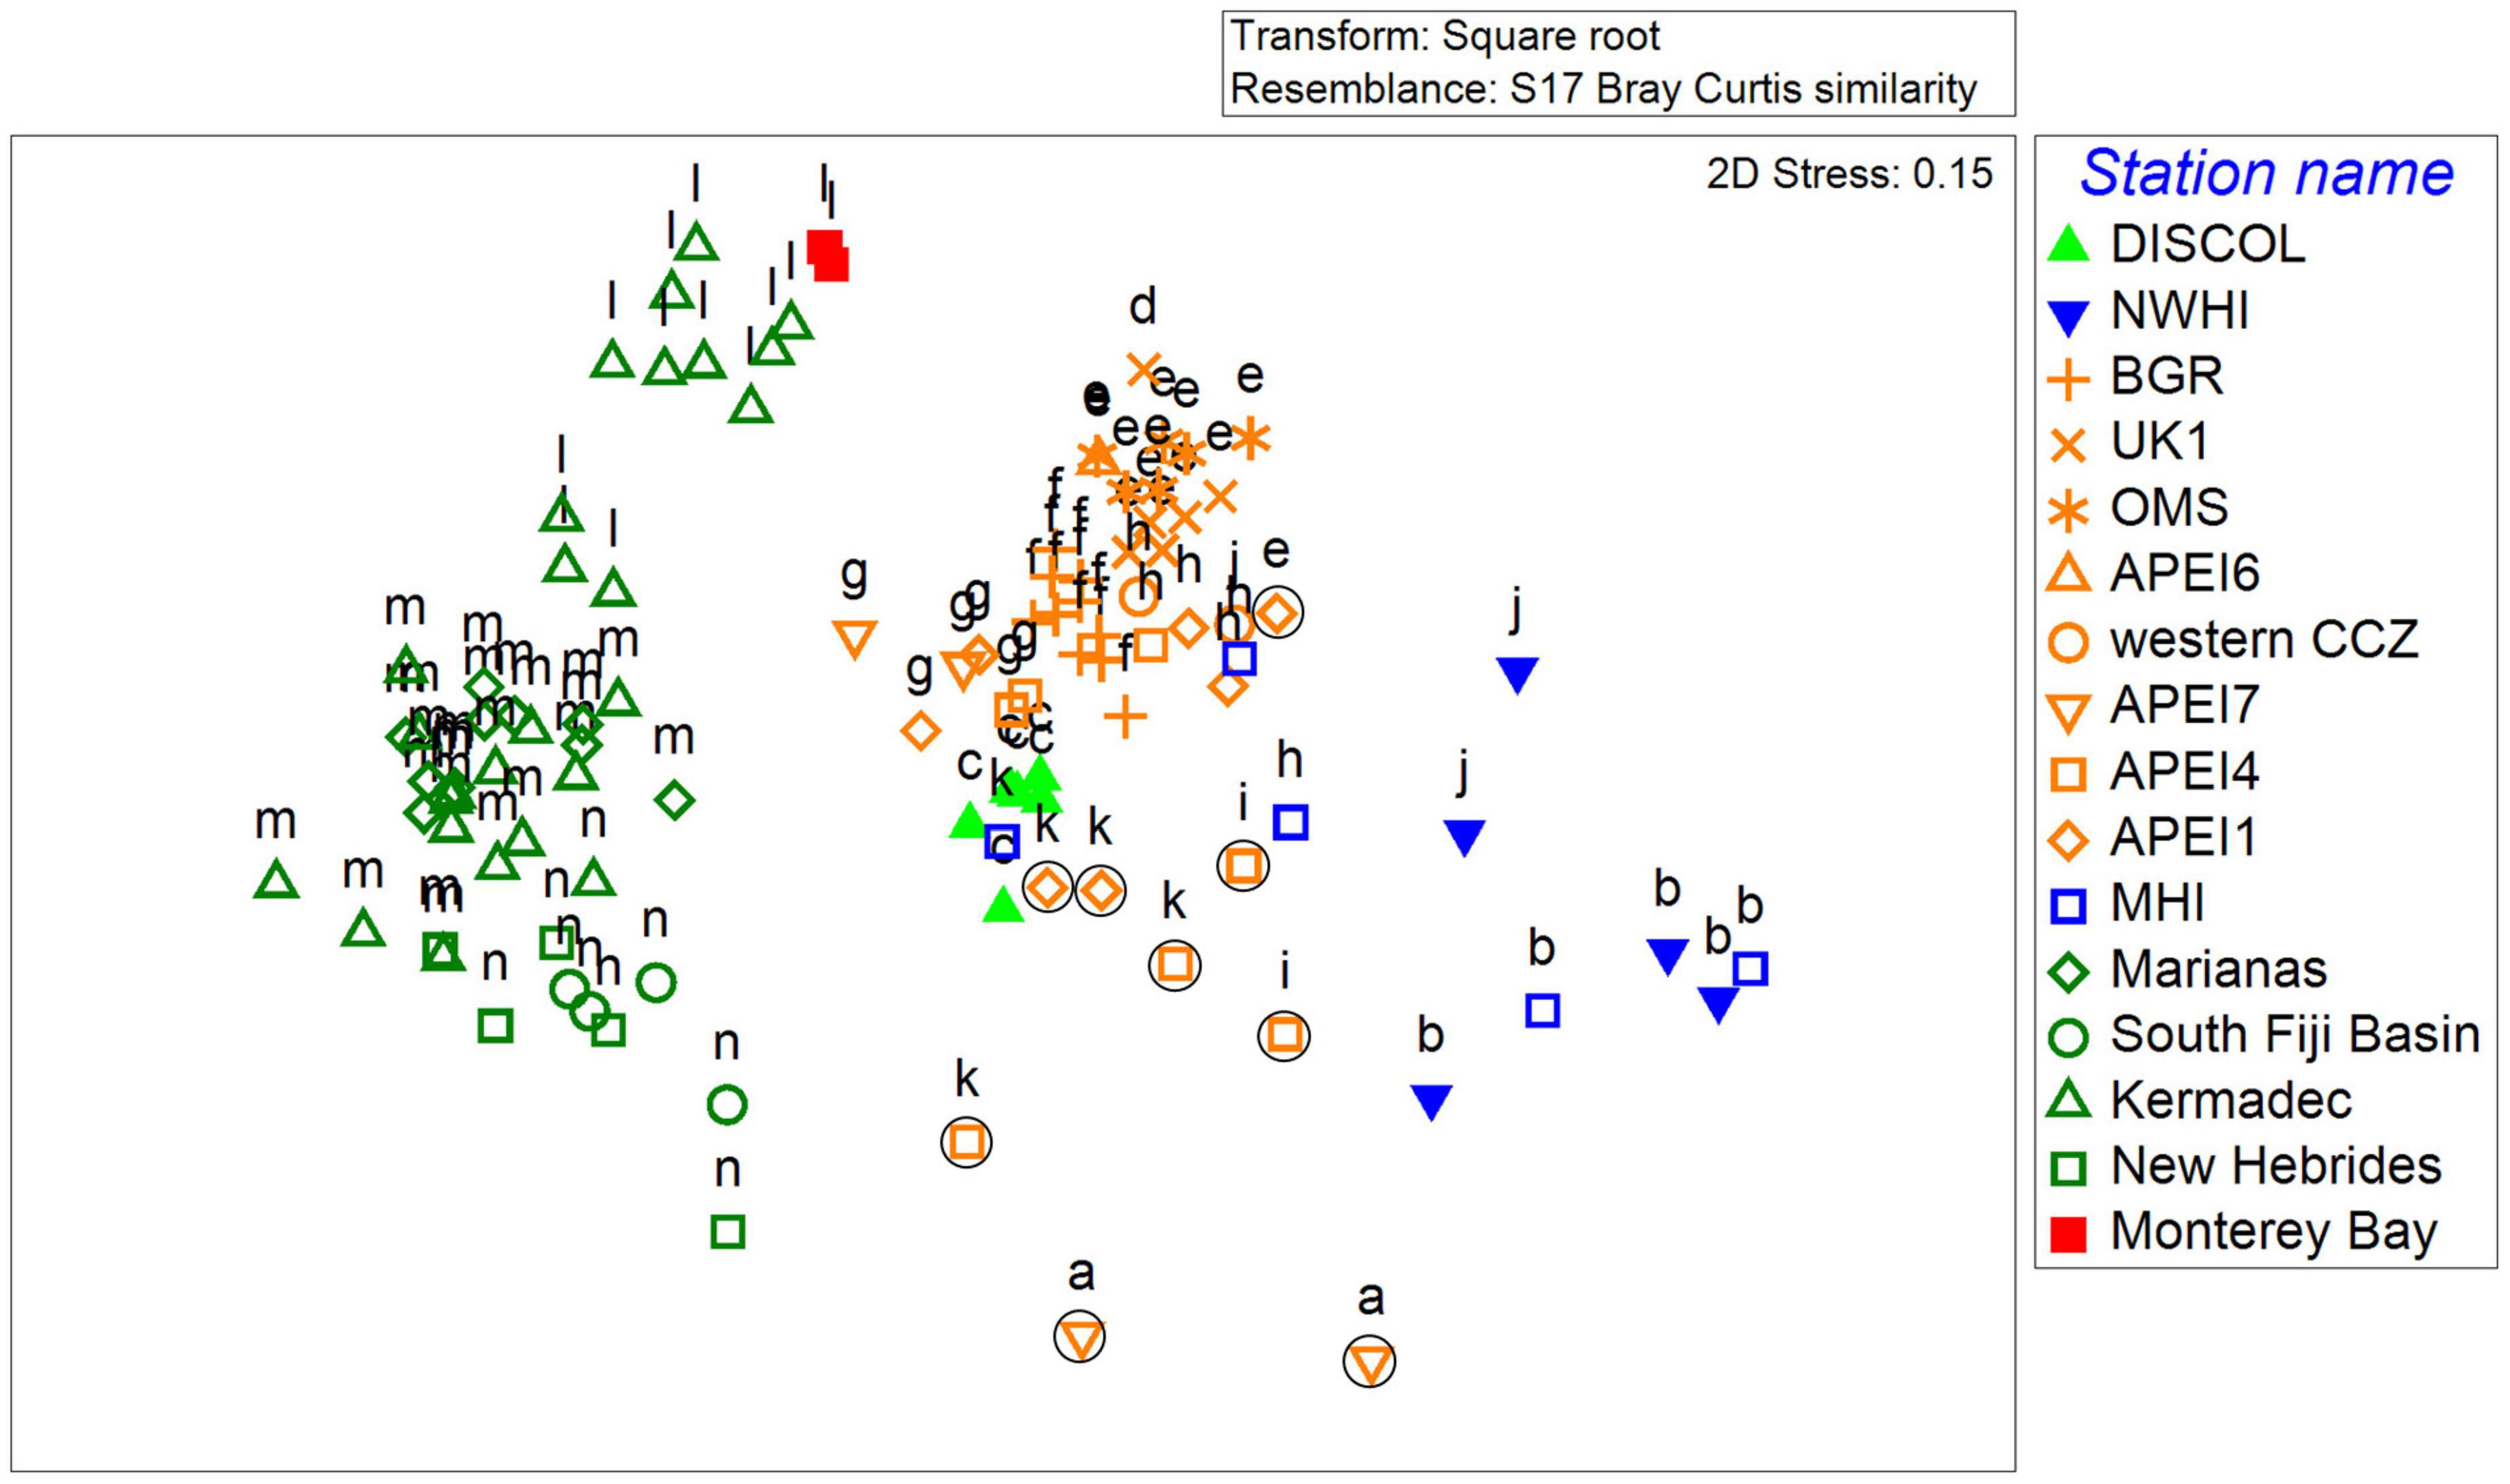
Figure 6. MDS analysis of scavenger communities (MaxN data) across the Pacific. CCZ deployments are in orange, Hawaii locations in blue, DISCOL in light green, the western Pacific locations in dark green, and central California in red. Seamount deployments from the CCZ are circled. Letters above symbols represent significantly similar deployments (p < 0.05; SIMPROF).
The scavenger assemblages also varied significantly within the CCZ (Figure 6). There was an east to west variability with the most eastern license areas (e.g., OMS, UK1, group e) clustering significantly from the western APEIs (p < 0.05; SIMPROF, groups g and h). The differences between these groups was largely driven by higher abundances of the shrimp H. nereus and lower abundances of the fishes Barathrites iris and C. armatus/yaquinae and in the eastern license areas (SIMPER group e vs. g, h). It was even more evident that the seamount samples from the western APEIs had a distinct community from their surrounding abyssal plains. These represented three distinct clusters of deployments (see a, i, and k in Figure 6) much less similar to the rest of the deployments. The two clusters representing seamounts in APEI 4 and 7 were largely driven by the occurrence of the eel, Ilyophis arx, for APEI 7 deployments (SIMPER, I. arx drove 33 to 39% of dissimilarity compared to neighboring plains) and fewer C. armatus/yaquinae and both more I. arx and C. monstrosus for APEI 4 seamounts. Interestingly, the main and northwestern Hawaiian island deployments that were on the island flanks (similar to seamounts) at depths of about 3,000 meters also clustered together (SIMPROF, p < 0.05, group b in Figure 6).
Diversity also varied across the Pacific and CCZ. Asymptotic taxa richness values were slightly higher on the abyssal plains in the western CCZ compared to the license areas in the eastern CCZ (Table 3). These diversities were comparable to those found in Hawaii and DISCOL and higher than those from California and the western Pacific. Looking only at the samples from within the CCZ, the eastern CCZ seems to have a significantly lower estimated species richness than the west (18 versus 29.5 with non-overlapping confidence intervals; Figure 7A); however, excluding the additional diversity that the western seamount deployments give to the west, the estimated number of species is no longer significantly different between the regions (22.2 in the east versus 22.5 in the western abyssal plains, overlapping confidence intervals; Figure 7B) and no differences were found for H’ or Simpson diversity either. This finding again highlights the importance of macroscale habitat features such as seamounts.
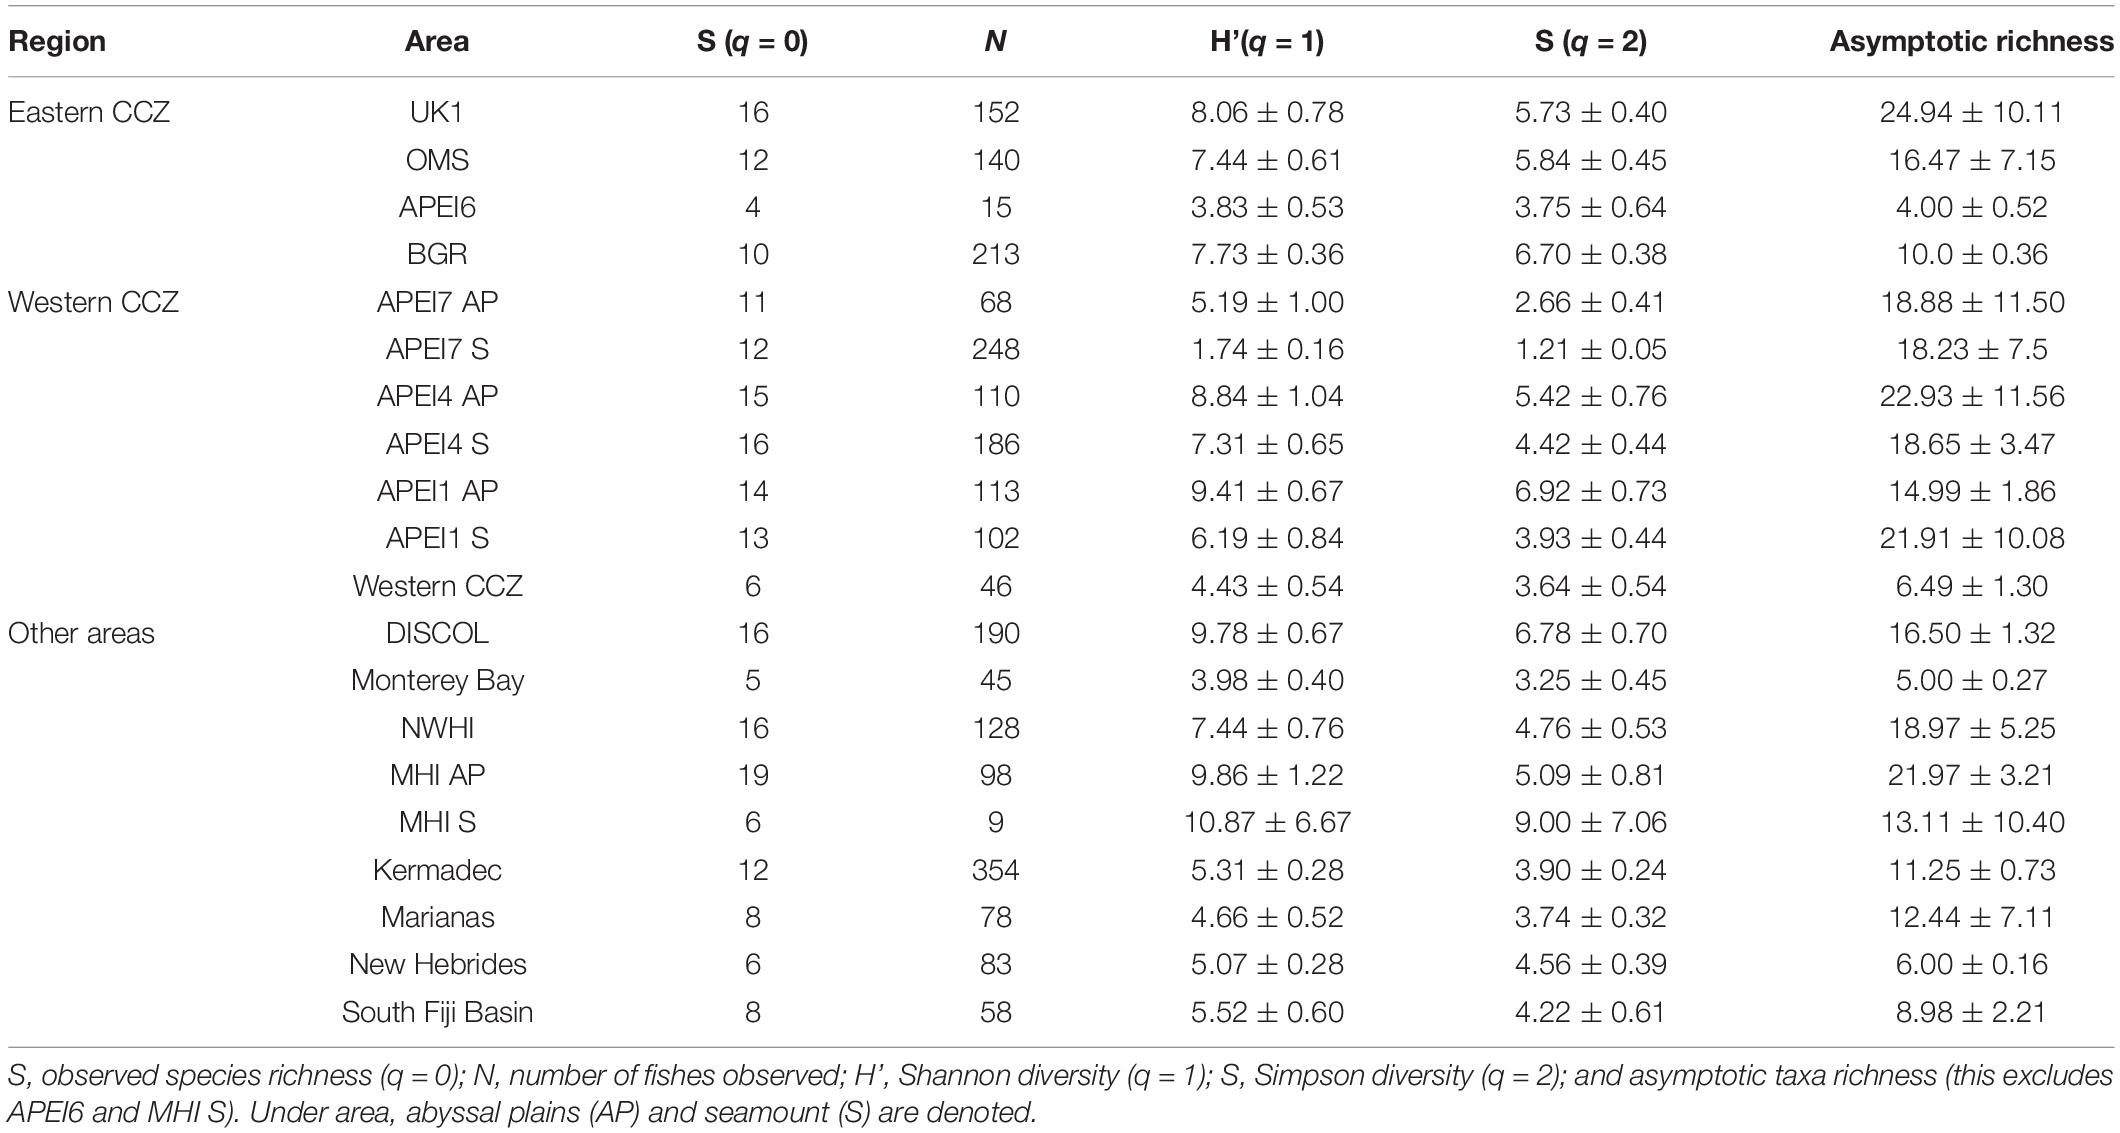
Table 3. Diversity measures (with standard errors) from baited camera deployments in the abyssal Pacific ordered from east to west in the CCZ followed by other areas of the Pacific.
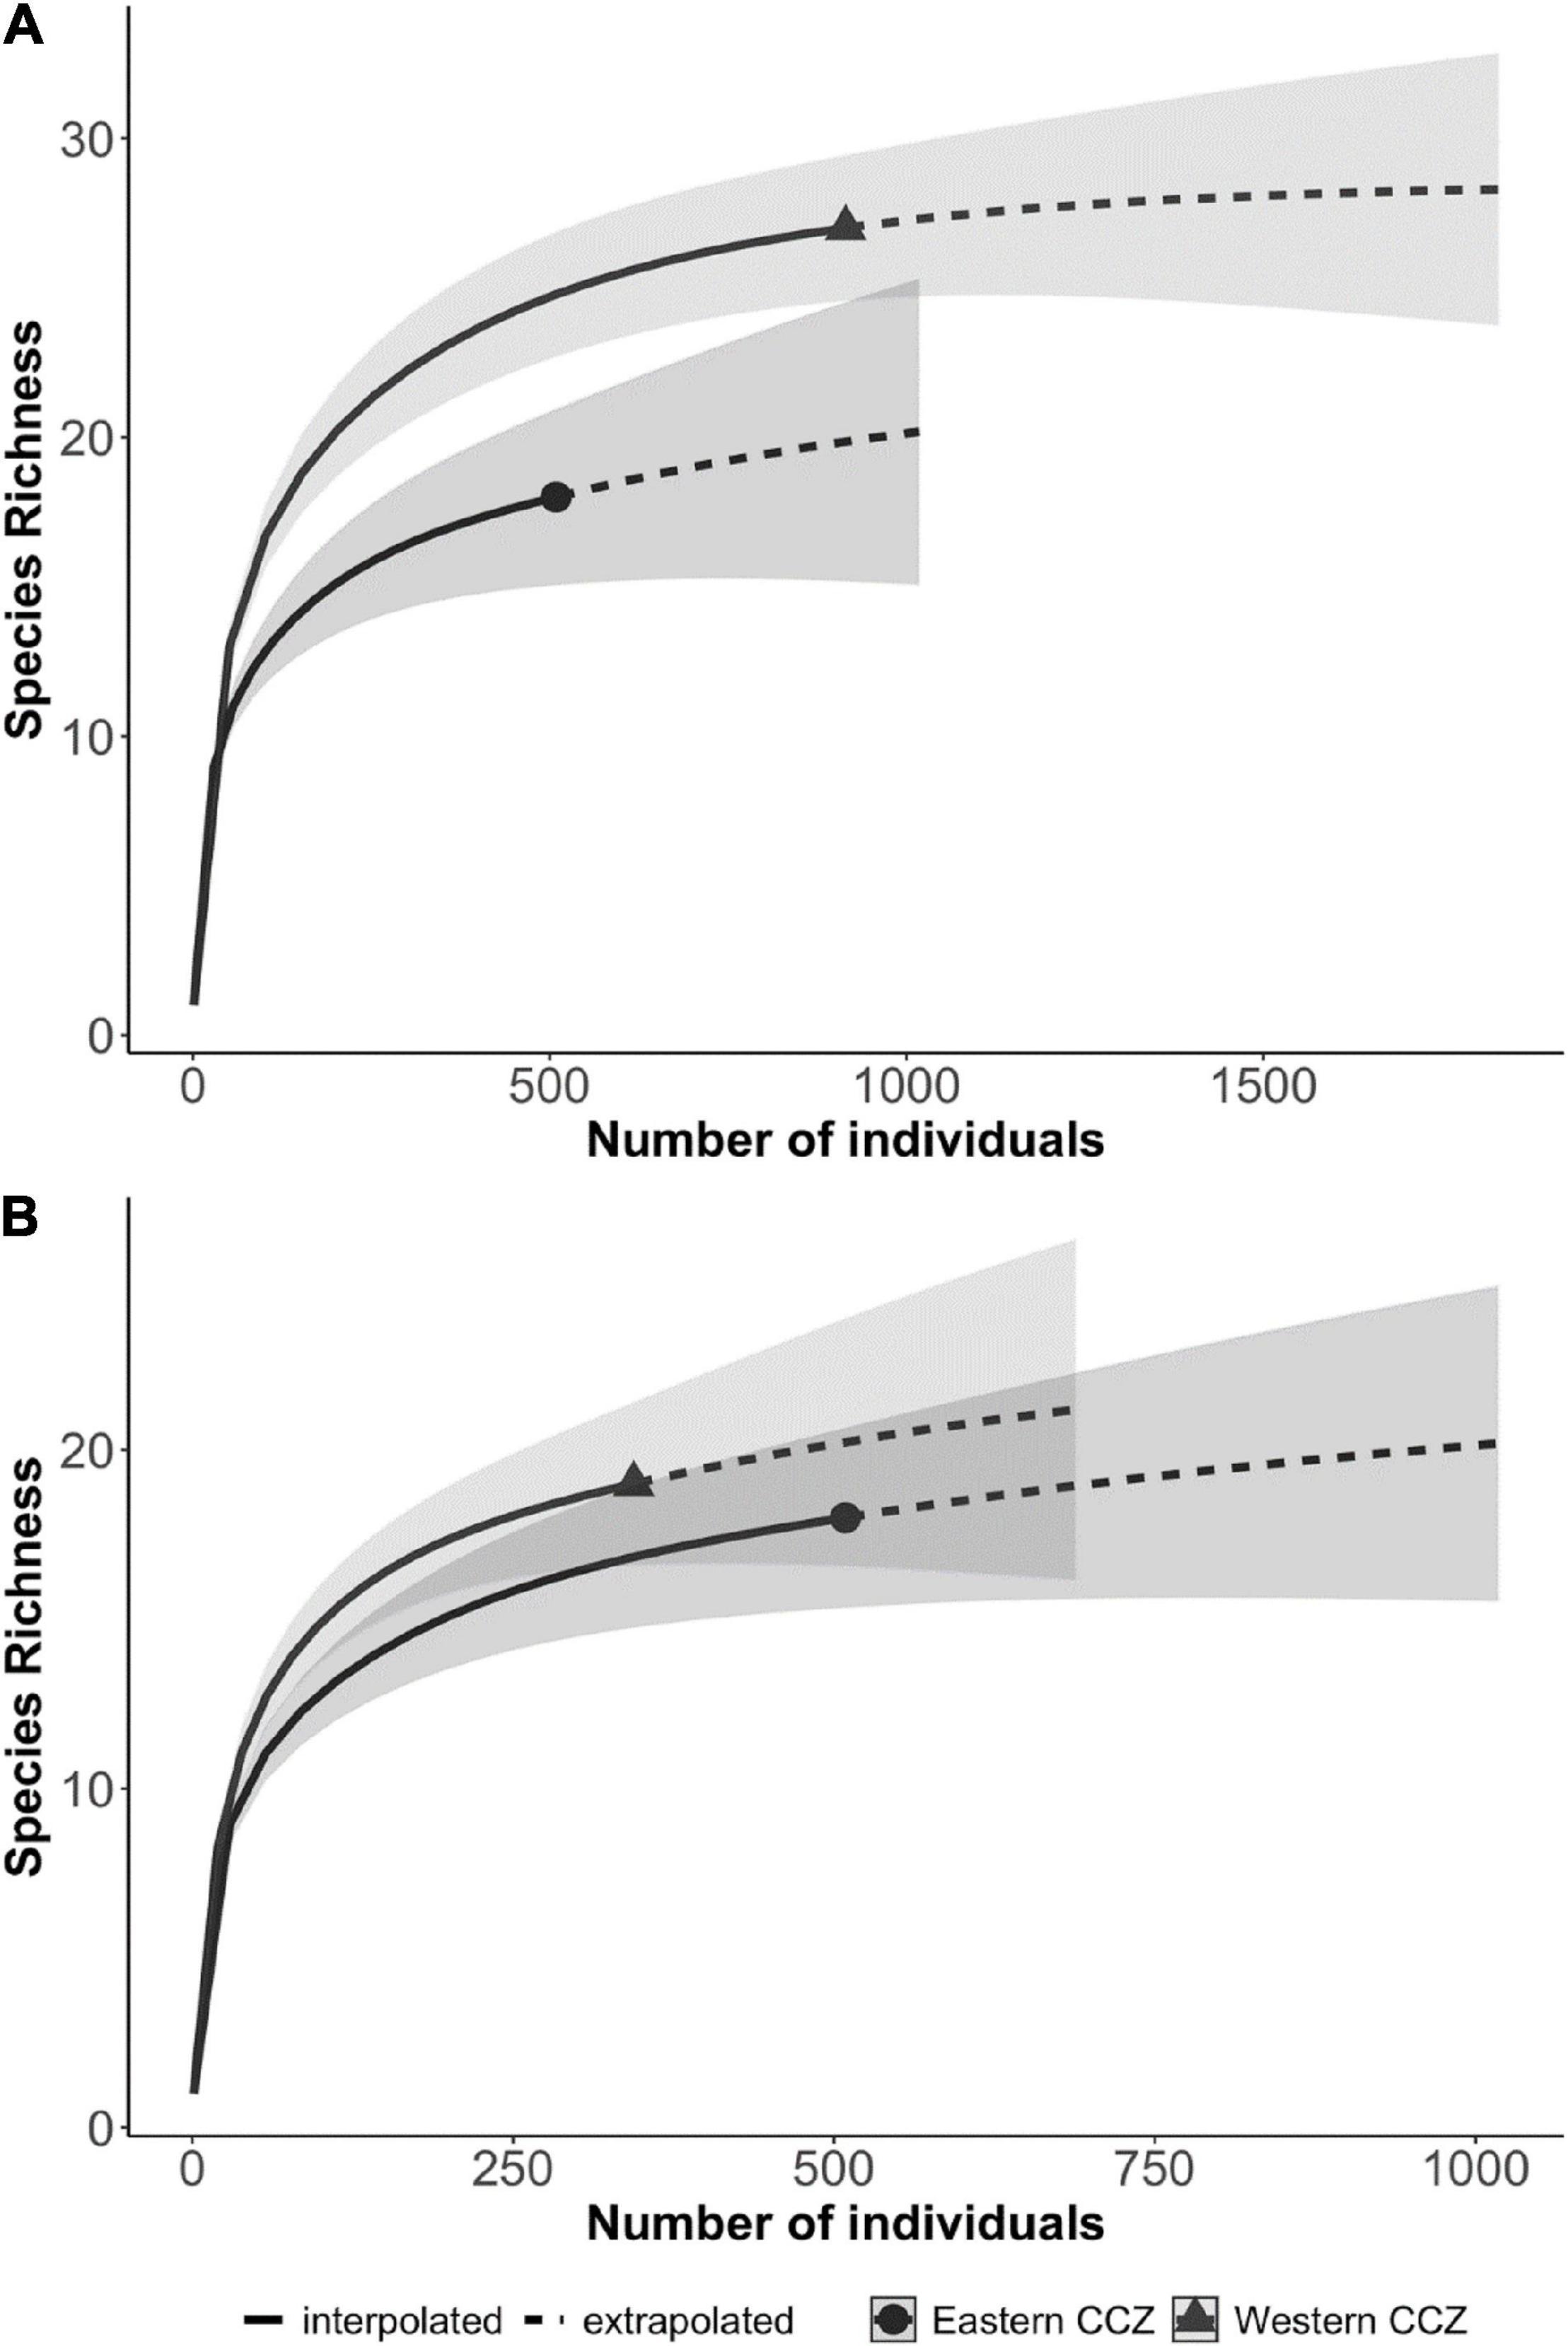
Figure 7. Fish and scavenger diversity (estimated morphotype richness) compared between the eastern and western CCZ (A) including all CCZ baited camera deployments and (B) excluding all seamount deployments (bottom).
We evaluated the drivers of the spatial variability in diversity across the CCZ from the baited camera dataset. In all cases models of the asymptotic diversity estimate agreed with models of observed values. None of these environmental variables significantly explained variation in species richness metrics across the CCZ (glm, p > 0.05). There was a significant positive relationship between nodule abundance and both Shannon (q = 1) and Simpson (q = 2) diversity across the CCZ (glm, p < 0.05). There was a significant negative relationship between Simpson diversity and POC flux within CCZ stations (glm, p < 0.05). In particular, the APEI7 seamount sites (n = 2) had very low diversity and high seafloor POC flux. When these data points were removed the relationship was no longer significant. Across the Pacific there was a significant negative relationship between observed morphospecies richness and POC flux (glm, p < 0.05), though this relationship was marginally significant for the asymptotic richness estimate (p = 0.057). Across the Pacific baited camera deployments there was also a significant effect of seamounts on Simpson diversity, where seamounts had significantly lower Simpson diversity than abyssal plains (p < 0.05).
We also evaluated the drivers of the large variation in community composition across the Pacific and CCZ (Figure 6) using CAP analysis (Figure 8). The first axis was largely related to longitude (east to west across the Pacific), suggesting regional variations, but without an indication of why this variation exists environmentally (PERMANOVA marginal significance test, p = 0.057). The first axis was also highly correlated with the trench edge habitat type; the communities from the western Pacific region (still at depths of 3,000–6,000 m). Depth was also correlated with this axis which explained some variation and generally the western sites were deeper than the eastern ones (Supplementary Table 2). The second axis is largely aligned with variations in POC flux and to a lesser extent, with depth. The cluster of points representing the CCZ, the top left quadrat (Figure 8), is largely distributed along this axis. Deployments on seamounts and island flanks are generally clustered together as well. The effect of POC flux was non-significant (PERMANOVA marginal significance test, p > 0.05), and both depth and habitat type (abyssal plain, seamount, island flank, trench, and basin) were highly statistically significant (PERMANOVA marginal significance test, p < 0.01) in structuring scavenger communities across the Pacific. When evaluating only the CCZ deployments, a second CAP showed dramatic clustering by BBPI (significant marginal test, p < 0.05; result not shown), which indicates that macroscale habitat is the most important driver in determining the structure of scavenger communities within the CCZ only. Other factors included in the CCZ-only analysis were non-significant (CAP; modeled POC flux, model predicted nodule abundance, depth).
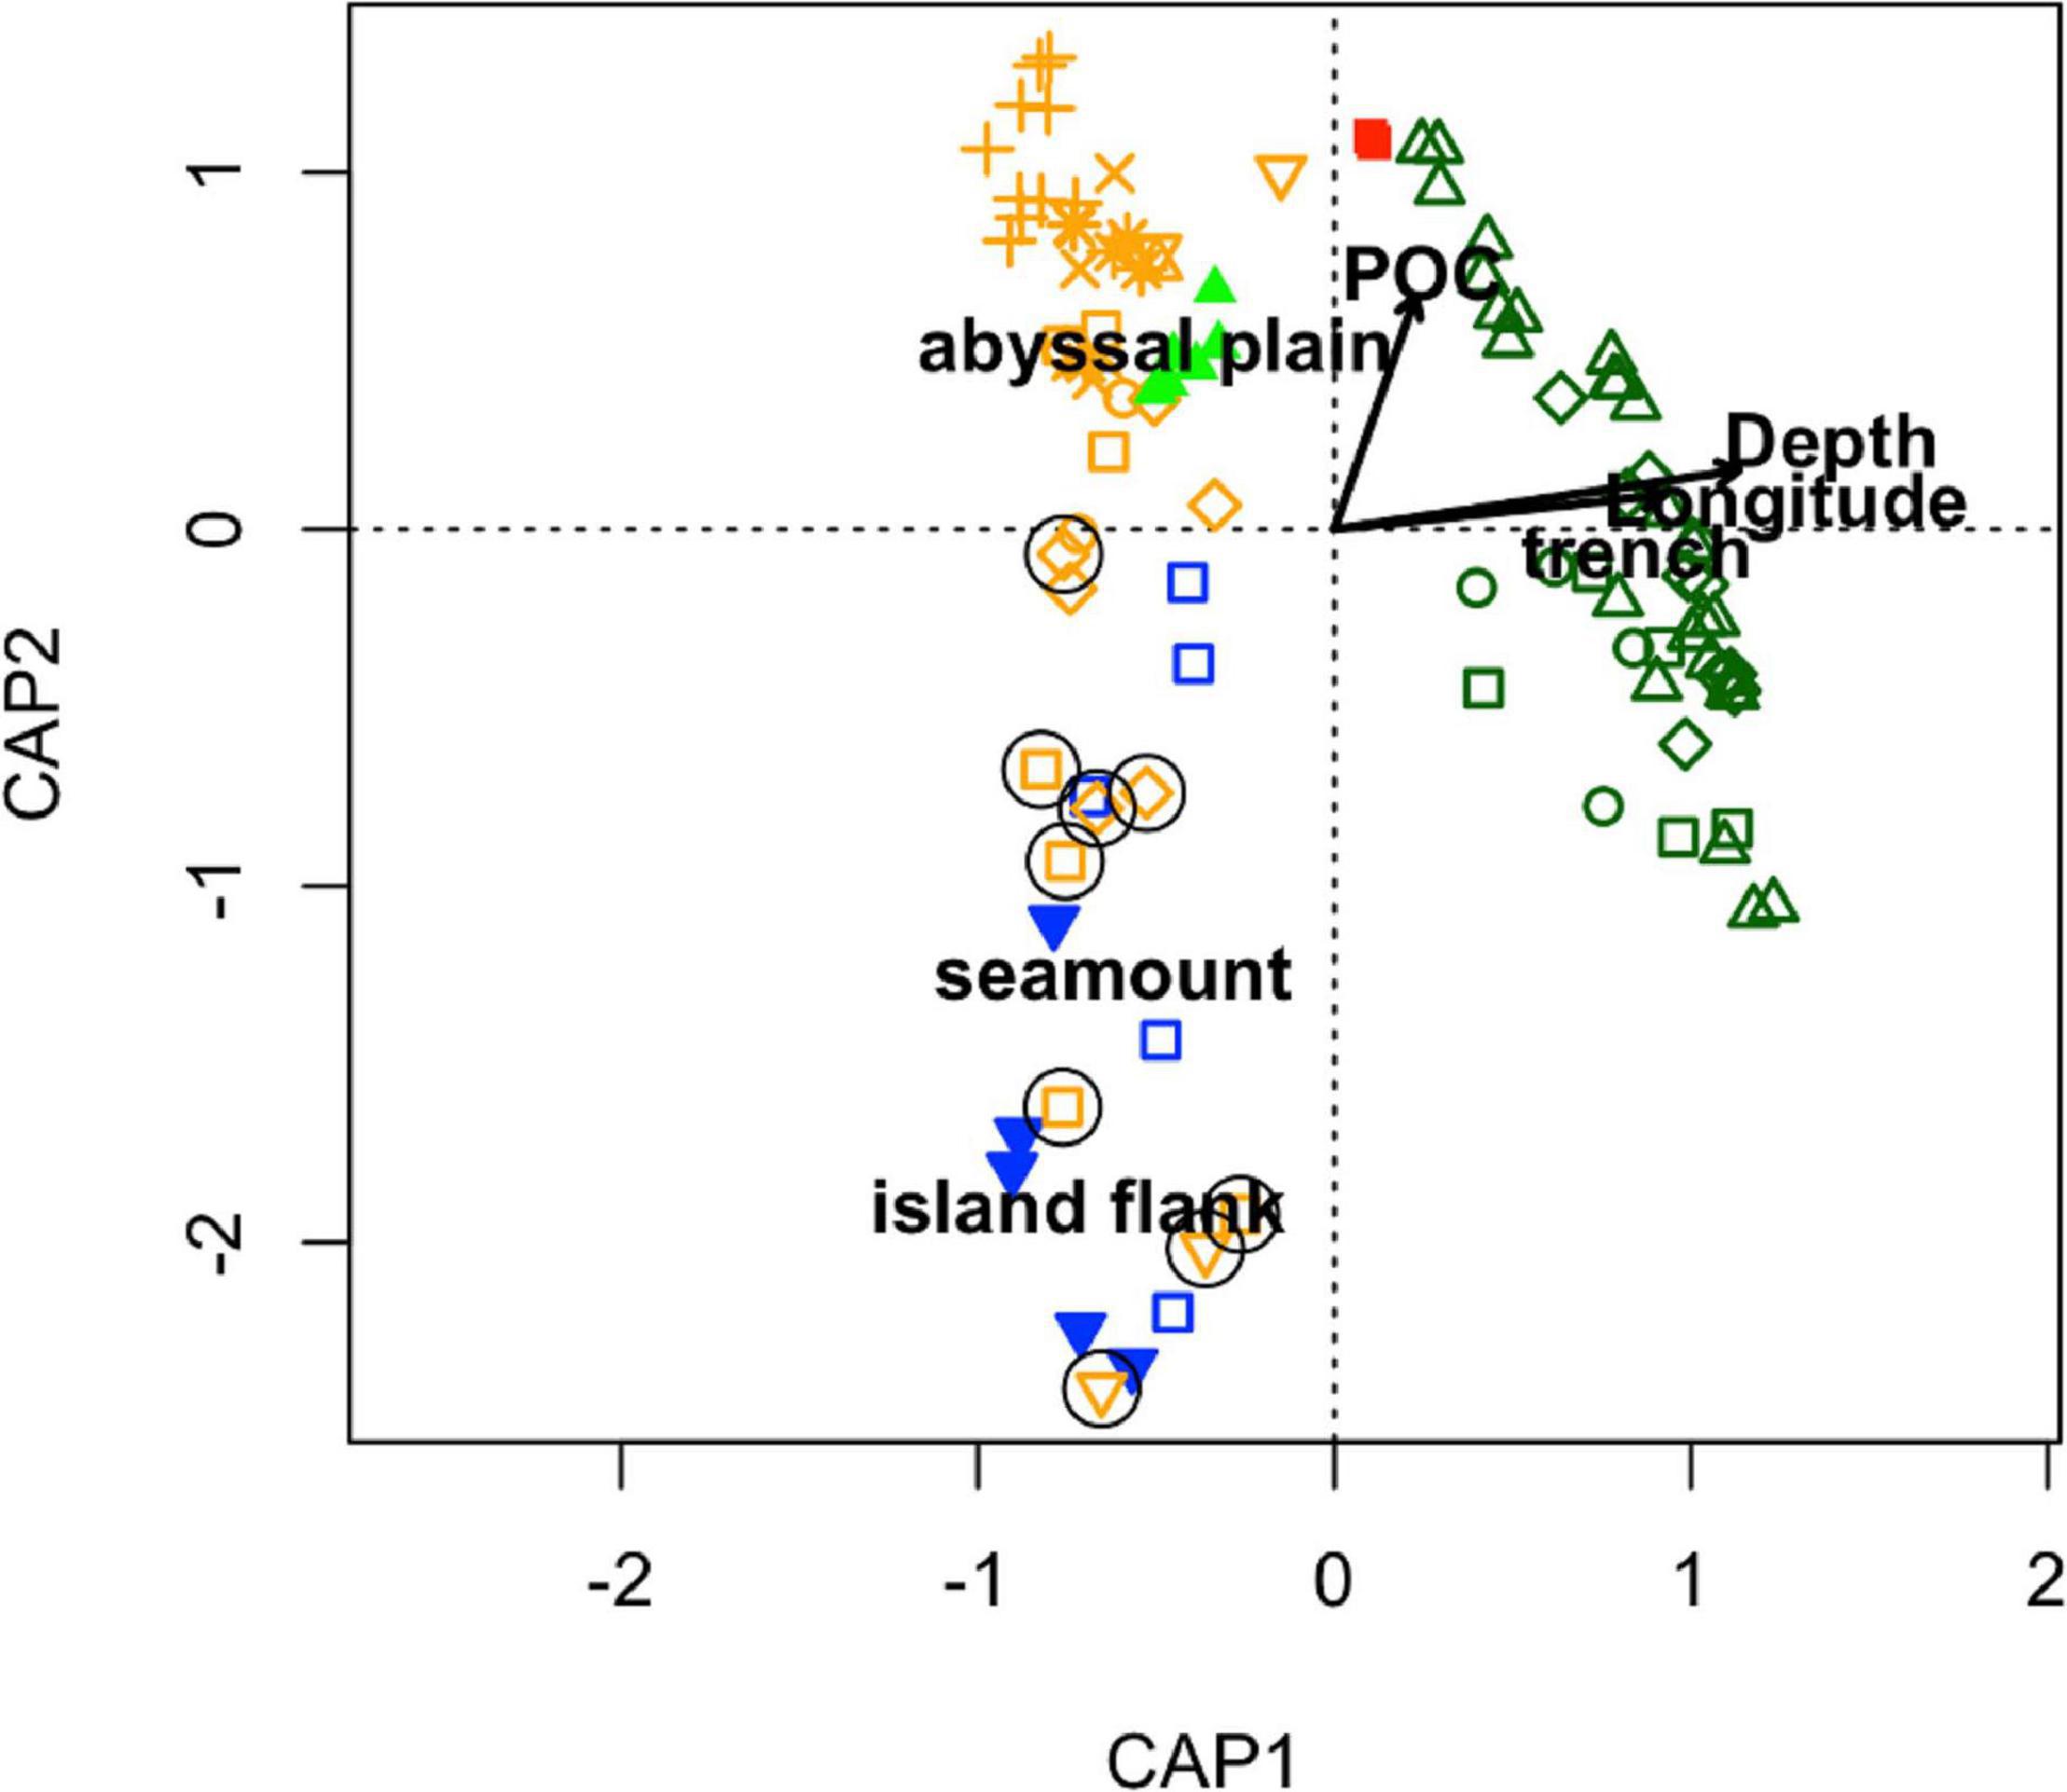
Figure 8. Principal coordinate analysis of the baited camera community composition data (points) across the Pacific evaluated in relation to the environmental drivers particulate organic carbon flux as estimated by Lutz et al. (2007) (lutz_poc), longitude, and depth (arrows with lengths twice biplot scores) and habitat types (centroids). Seamount deployments are circled and symbols are as in Figure 5.
Fish and Scavenger Ranges and Overlap
The biogeographic ranges of scavenging taxa were evaluated using the baited camera data. Many species of mobile fishes and scavengers had wide ranges as expected (Figure 9 and Table 4) with several locations <2,000 km from one another having as many as 14 shared taxa. Numbers of shared species decline with increasing distance between station locations. At the scale of the CCZ (∼4000 km across) sites share from ∼1 to 6 species, which matches the result of changes in the fish community across the CCZ region.
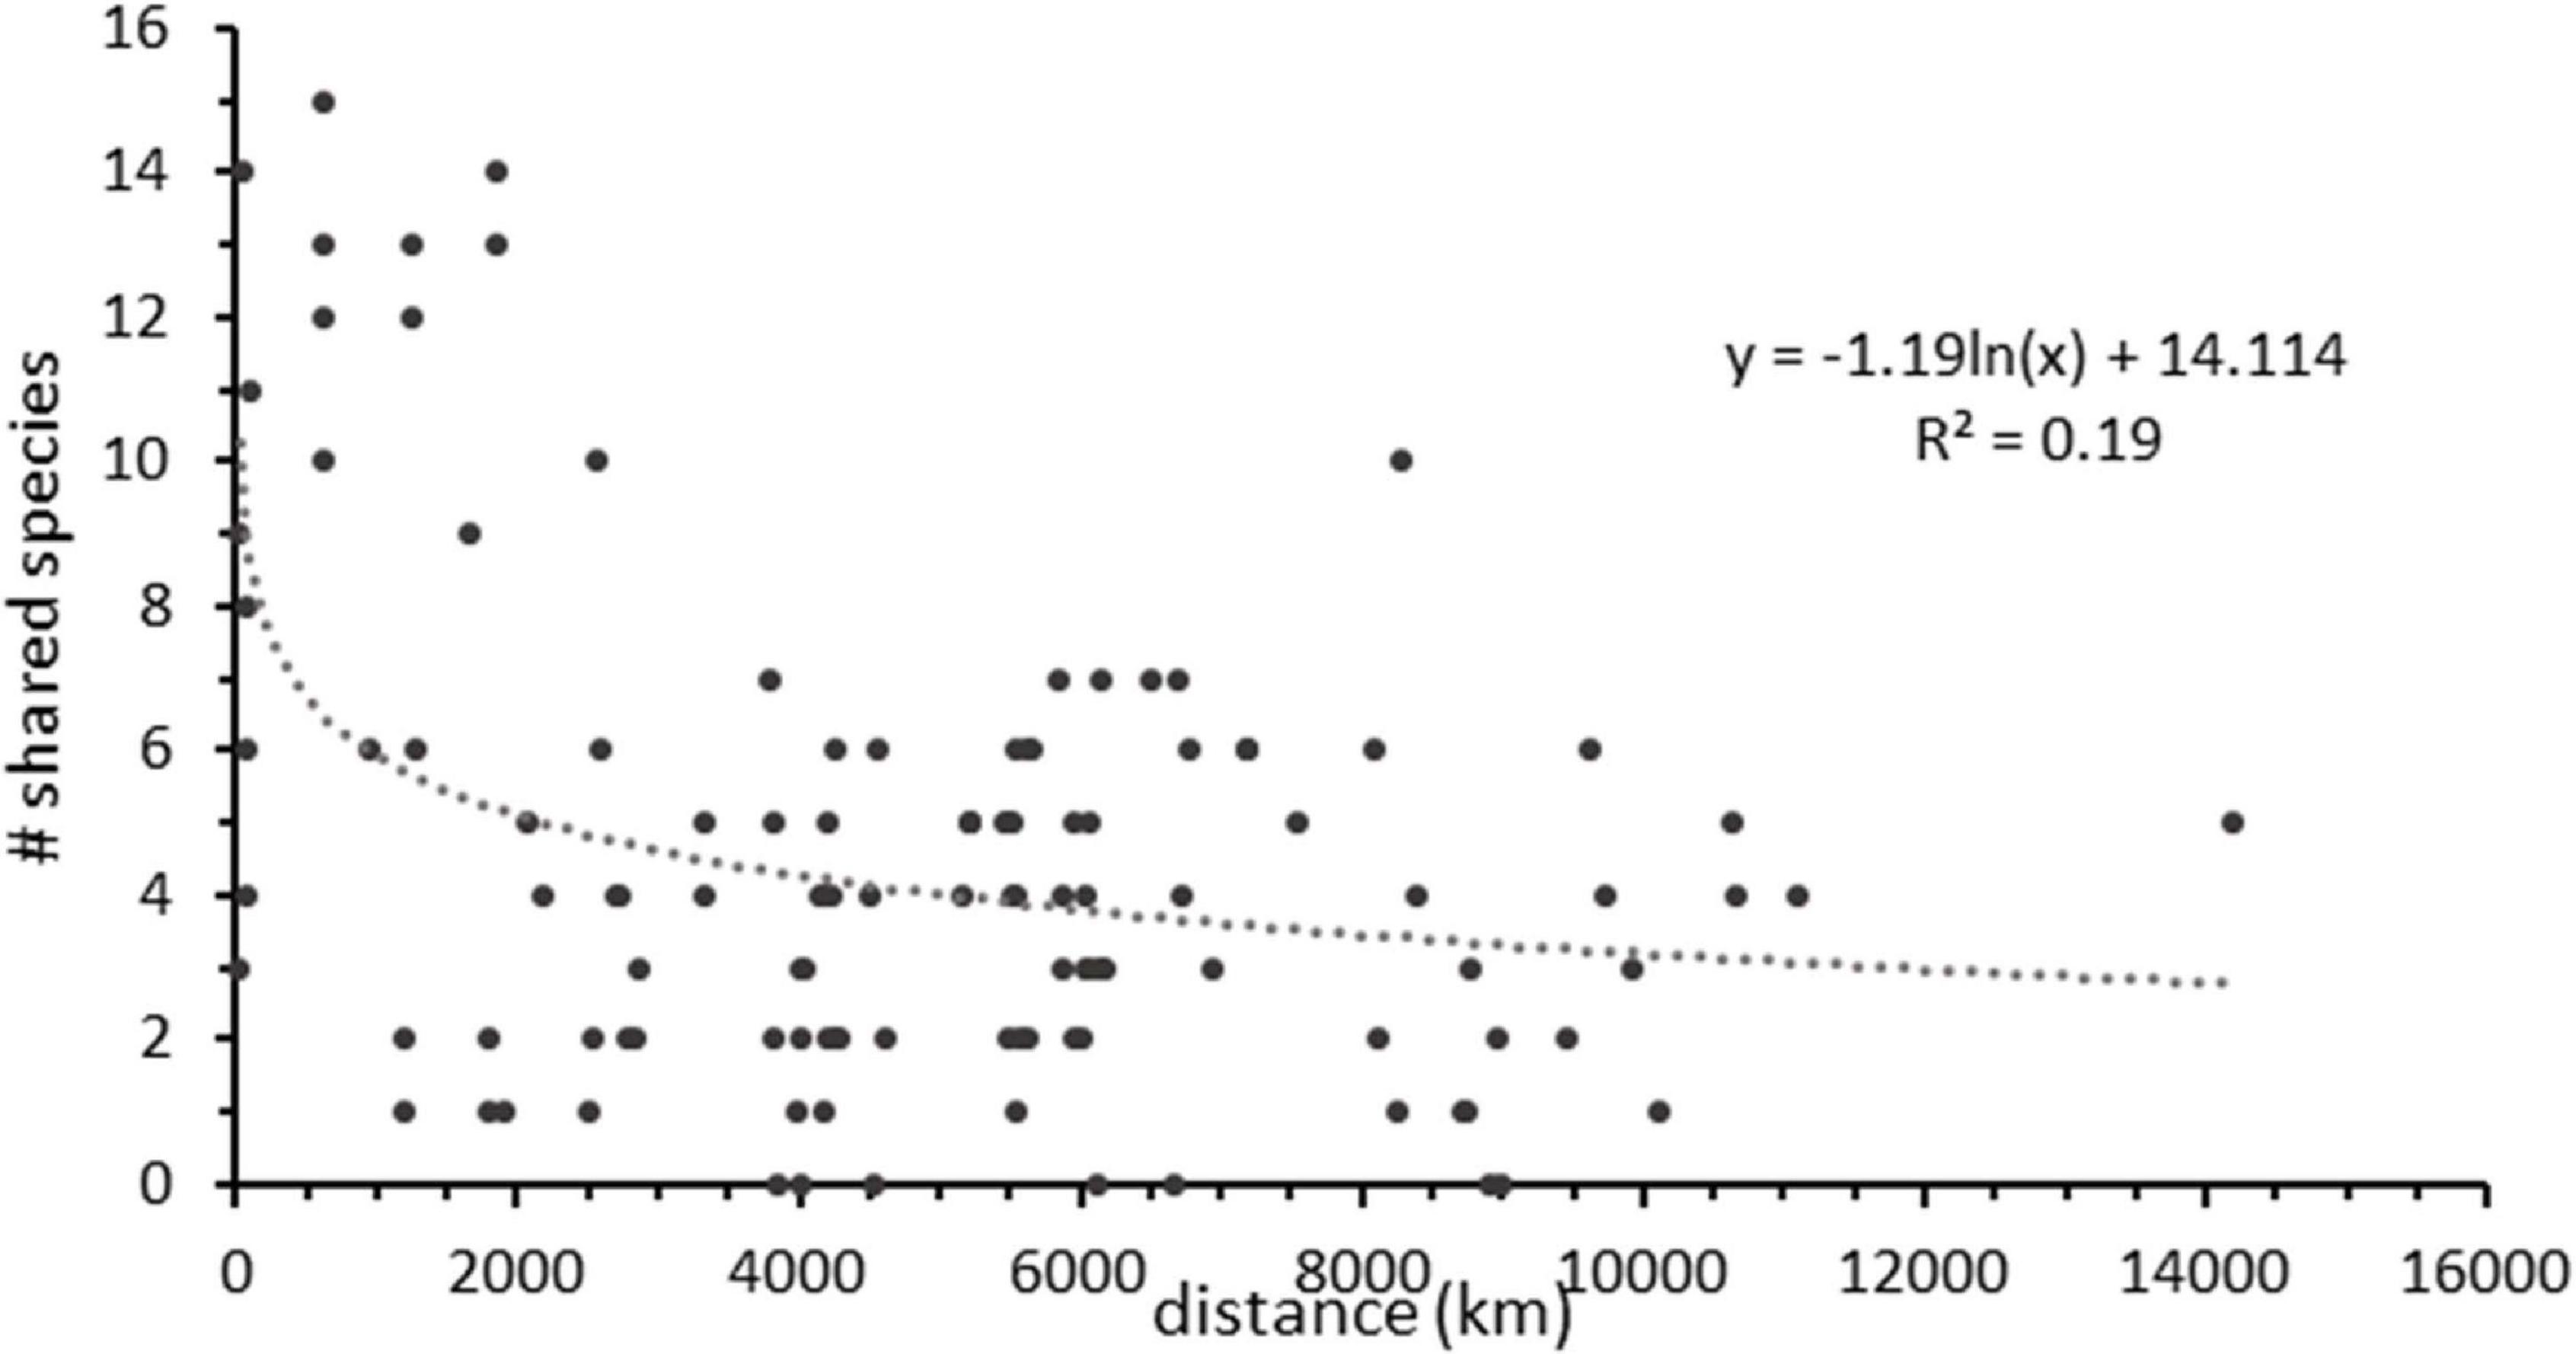
Figure 9. The number of shared scavenger taxa between all possible combinations of baited camera station pairs as a function of distance (km) between the pair.
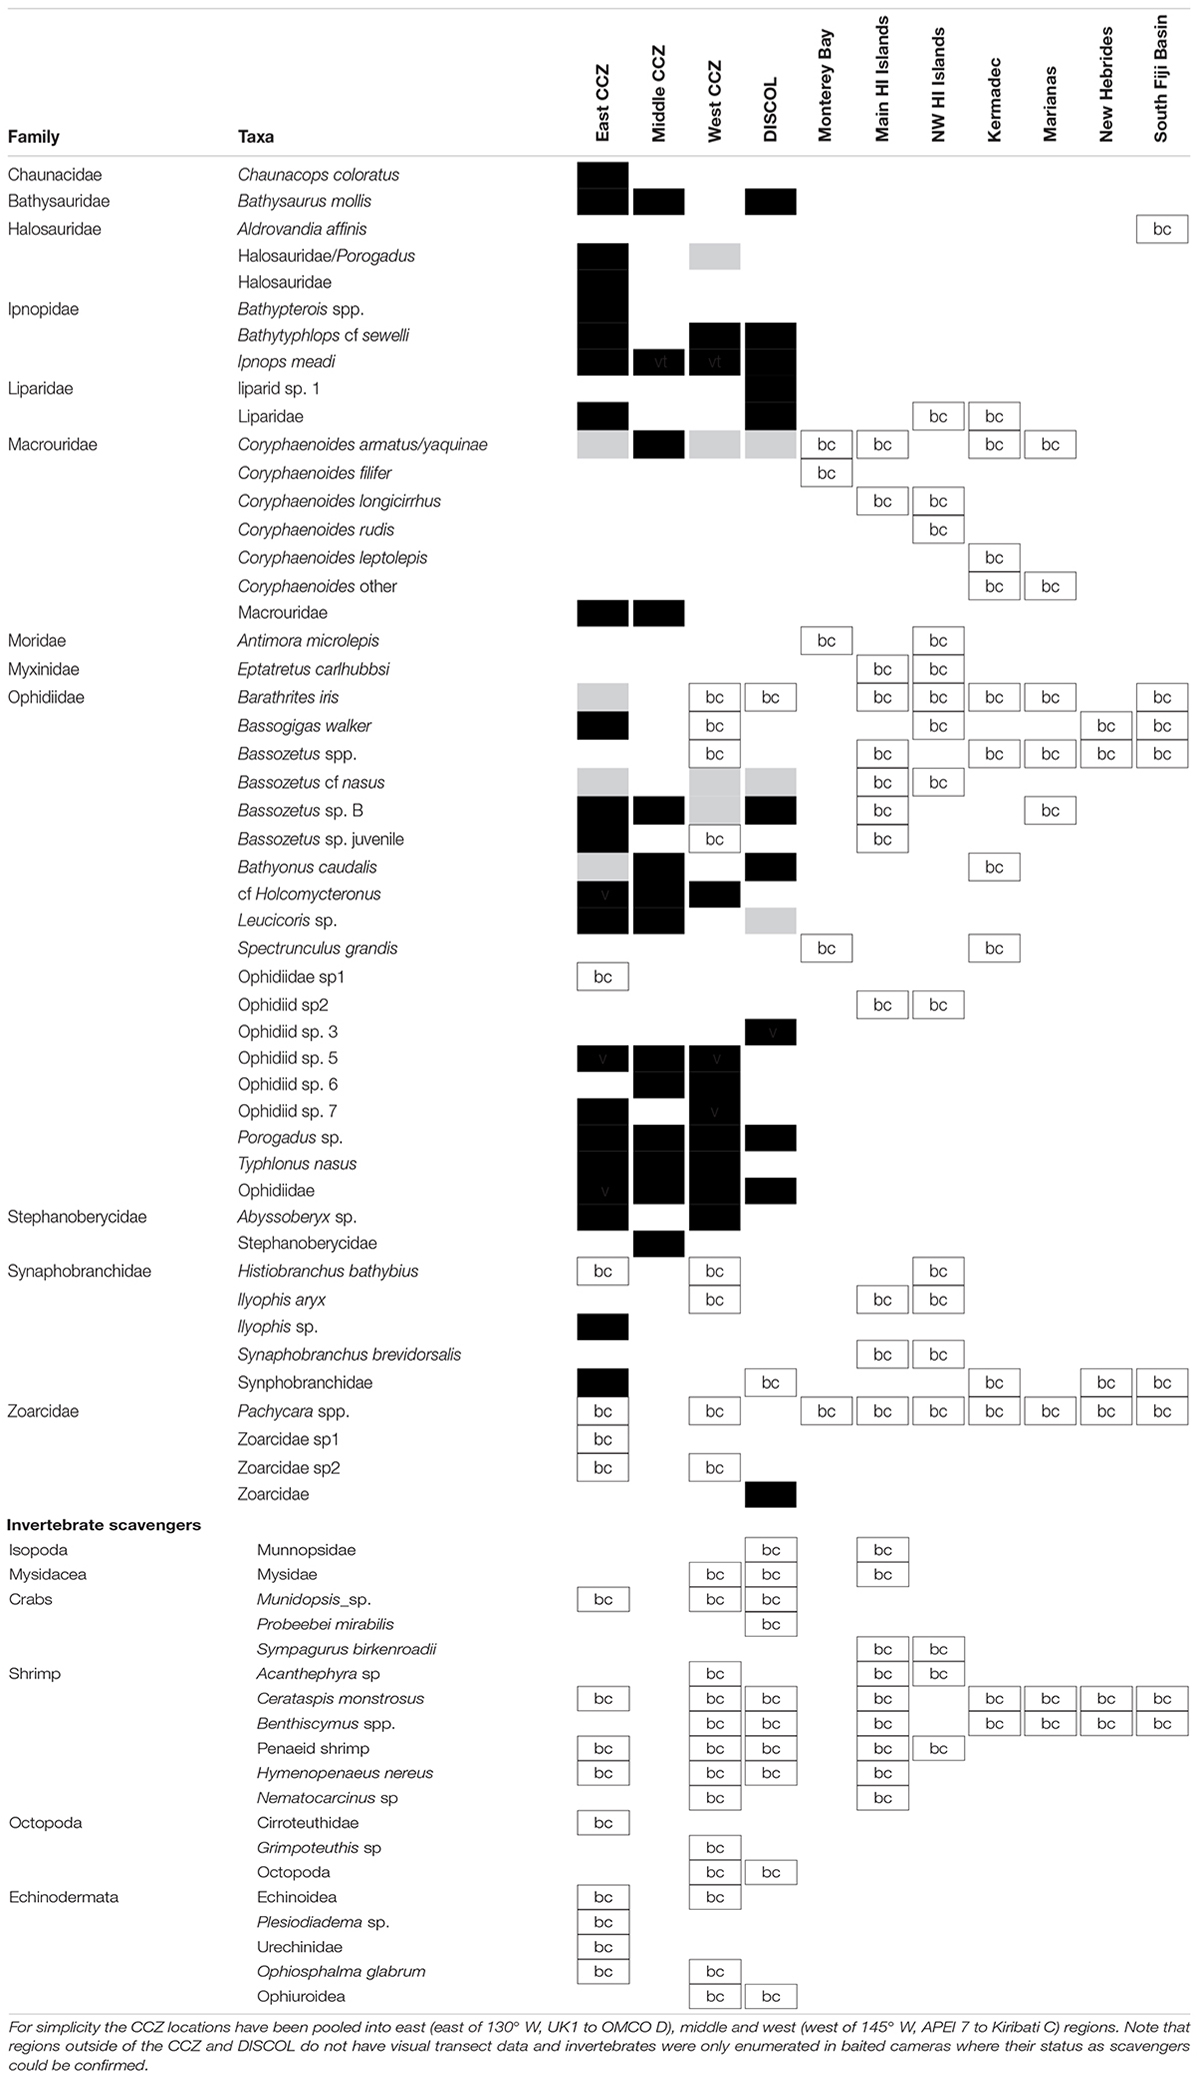
Table 4. Presence and absence of fishes and scavengers observed in visual transects (black cells), baited camera deployments (white cells with “bc”), or both (gray cells).
The transect and baited camera data were combined to evaluate the ranges of fish species across the abyssal Pacific and in relation to the APEI network. Many fishes have very broad overlap between the sites (Figure 10), with C. armatus/yaquinae occurring at 20 of the 28 locations evaluated. In contrast to these widespread taxa, 9 taxa were found at a single site and a further 9 at only two sites across the Pacific.
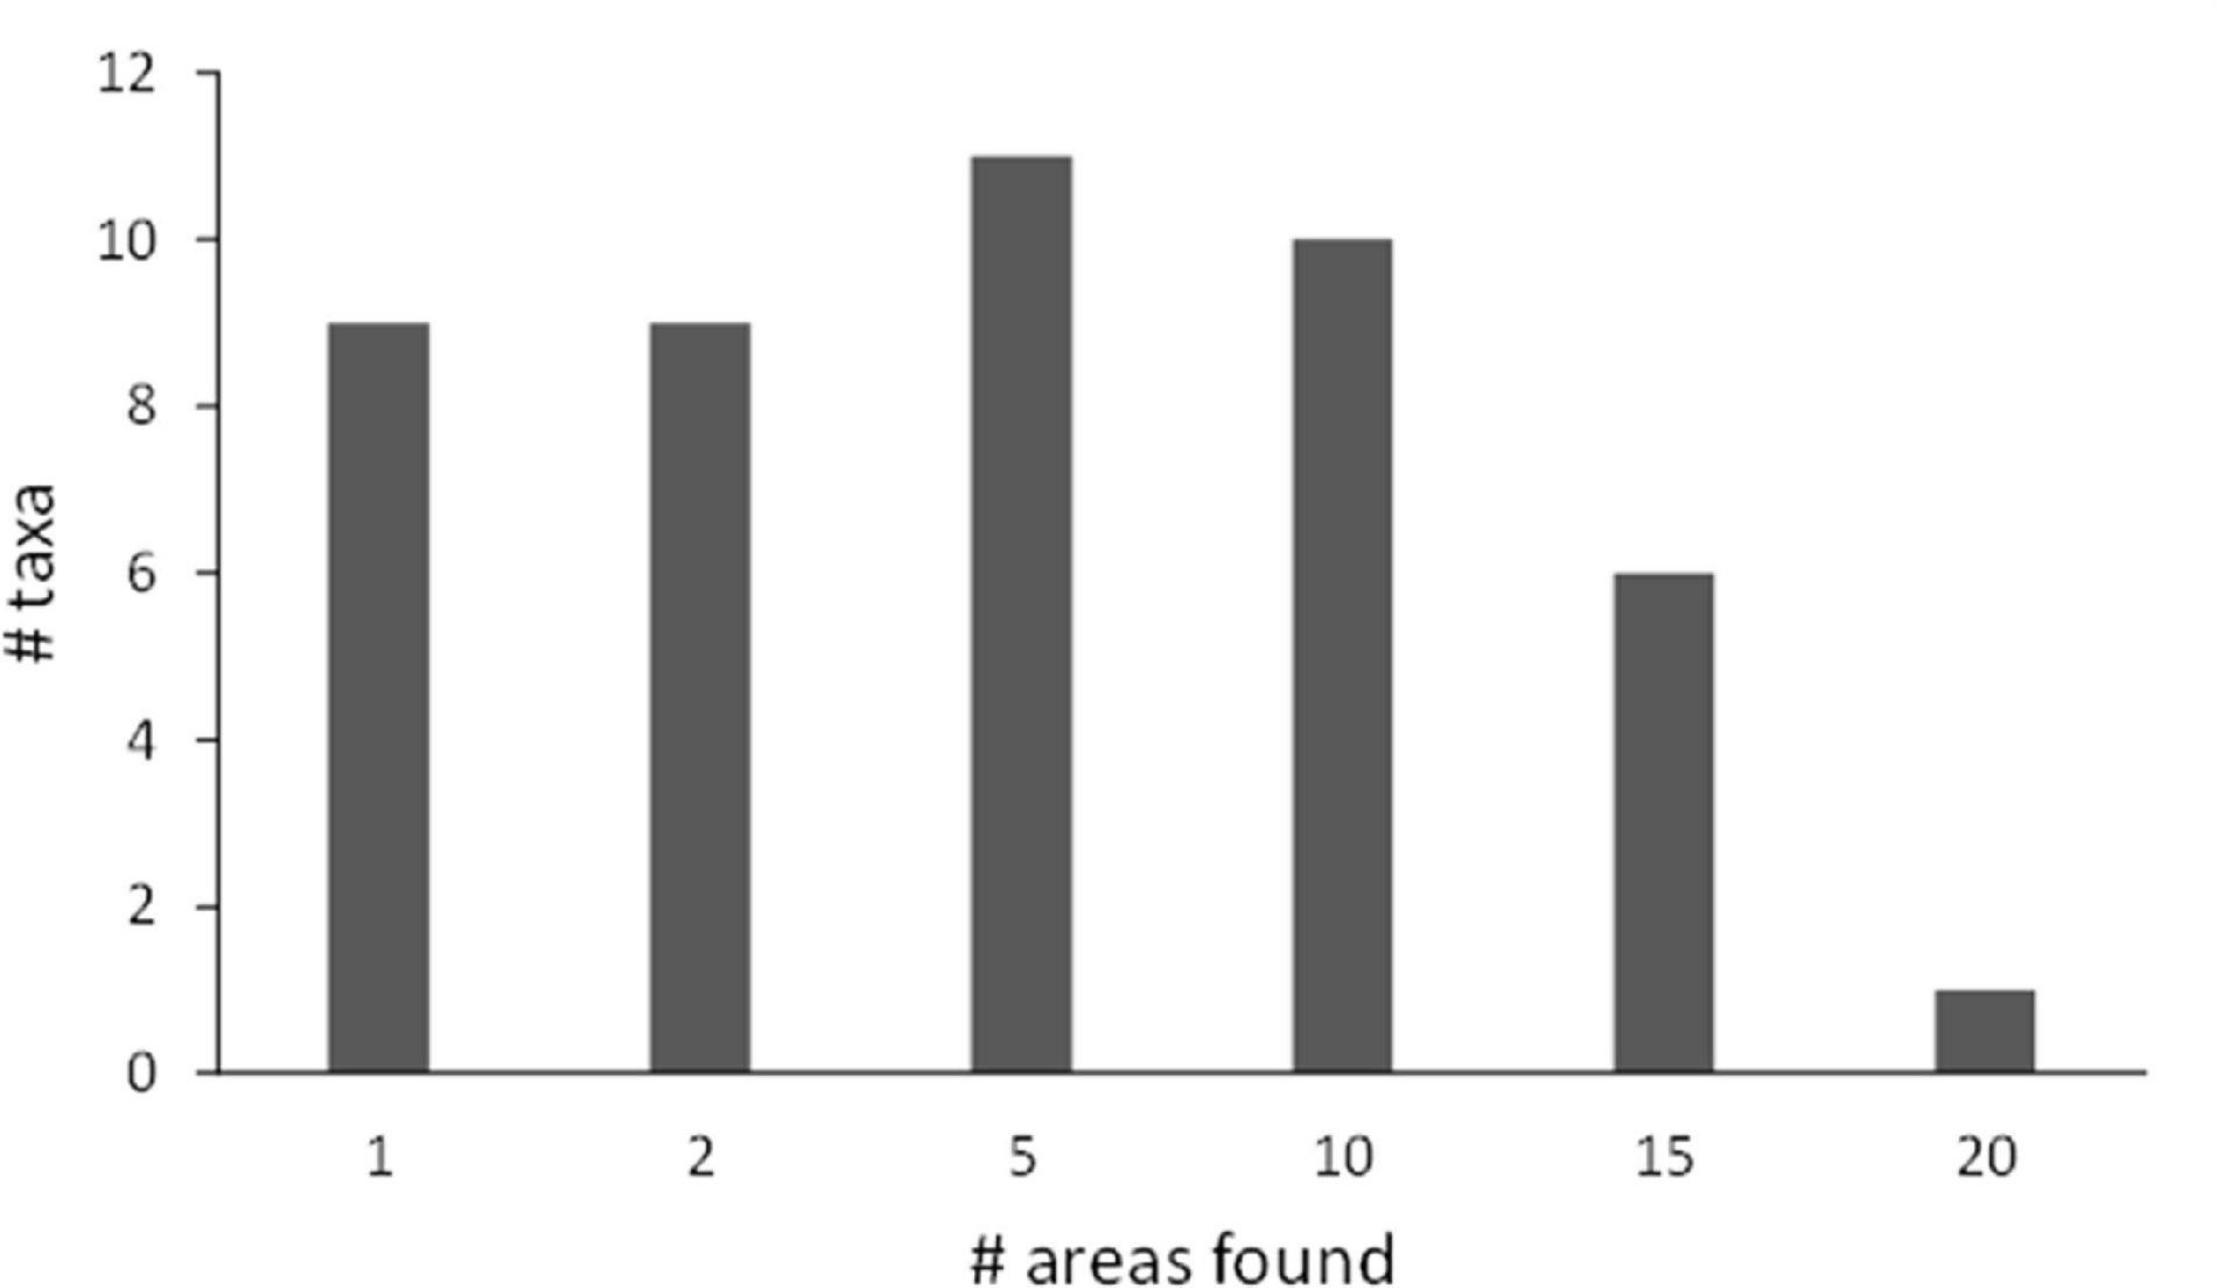
Figure 10. Frequency distribution of the numbers of fish taxa with varying levels of species overlap (# of sites in which each was found out of 28 sites that had identified fish) across the Pacific from both camera transect and baited camera data.
Discussion
We present the first synthesis of fish and scavenger communities across the CCZ. Data are still limited. We have taken care to standardize our use of data across different types of visual transecting and baited camera deployments (see section “Materials and Methods”). Future studies utilizing parallel ROV and AUV or towed camera methods within the CCZ may provide more robust comparisons than possible here for visual transecting approaches. It is possible that more subtle differences in community composition between areas within the CCZ exist but were not detectable with the current analysis due to low sample sizes or variance between studies. Given many ongoing studies in the region, additional synthesis will be warranted in the future.
Recognizing the limitations with the data available, it is clear that there is a relatively diverse fish and scavenger community across the CCZ that has a number of similarities and differences to the communities of other regions. 32 taxa were observed in the transects and an additional 2 were only seen in baited camera deployments. The most common taxa observed in transects was the fish Ipnops meadi. This fish is also commonly observed at the DISCOL site but neither it, nor its congeners, are common in the abyssal NE Pacific (Pearcy et al., 1982; Cailliet et al., 1999; Priede et al., 2020) or the NE Atlantic (Priede et al., 2010) except south of about 32° N where a lower productivity regime apparently alters the abyssal fish community and the confamilial, Bathymicrops regis, can be very abundant (Merrett and Fasham, 1998; Christiansen et al., 2015). Ophidiids are particularly abundant and speciose in the CCZ similar to findings in other abyssal subtropical regions such as the Caribbean (Anderson et al., 1985; Crabtree et al., 1991) and subtropical Atlantic (Merrett and Fasham, 1998) but in contrast to temperate latitudes (Merrett et al., 1991; Cailliet et al., 1999; Cousins and Priede, 2012; Milligan et al., 2016). Common to nearly all abyssal studies is the macrourid C. armatus/yaquinae (reviewed in King and Priede, 2008), and the CCZ is no exception. Indeed, while the baited camera studies show that the CCZ has a distinct fish and scavenger community compared to other areas of the Pacific, C. armatus/yaquinae is seen throughout (Table 4).
The CCZ is very large and while general comparisons can be made across the globe, it is clear that the abyssal fish and scavenger communities vary significantly across the CCZ. While the transect data was only suggestive in this regard, the communities differed significantly from east to west in the baited camera data. Using smaller amounts of data this regional variation in community composition has been observed before (Linley et al., 2017; Harbour et al., 2020; Simon-Lledó et al., 2020). This suggests that even for mobile fishes that not all regions of the CCZ are equivalent. Abyssal fish and/or scavenger community change has been attributed to variation in overlying surface water productivity (Crabtree et al., 1991; Merrett and Fasham, 1998; Linley et al., 2017) and, more recently, nodule cover (Linley et al., 2017), as has also been seen in other megafauna (Simon-Lledó et al., 2019c). We did find a positive correlation between Shannon and Simpson diversity and nodule cover but these drivers did not significantly covary with community composition in the CCZ. However, this may derive from sparse data (e.g., n = 10 regions/habitats for CCZ) and environmental data layers that were model predictions rather than empirically derived variables, suggesting low statistical power to detect environmental patterns. Depth was a significant driver (p < 0.01) of community composition in the baited camera dataset. Depth clearly creates zonation in deep-sea communities (Carney, 2005; Priede, 2017). Though most frequently evaluated at slope depths, even small changes in depth (∼10 m) have now been shown to alter abyssal benthic invertebrate megafaunal communities (Durden et al., 2020). Whether depth is related to the CCZ fish and scavenger community composition because of differences in species pressure adaptations or, more likely, if depth is a proxy for some other covarying environmental driver (e.g., local variation in food accumulation or current regime), cannot be ascertained.
One environmental driver that had a strong effect on fish and scavenger communities was macroscale habitat type, and BPI, a continuous variable that describes habitat types based on their bathymetric profile. Across the Pacific habitat types, seamounts, abyssal plains, island flanks, and trenches, significantly influenced the composition of the fish and scavenger community. In the CCZ, seamounts had a greater influence on scavenger assemblages than sampling region in many cases (Figure 6). Indeed some taxa appear to specialize on abyssal seamounts such as the eel Ilyophis arx (Leitner et al., 2021a). Synaphobranchid eels also were present in the two seamount visual transects but couldn’t be identified to species (Figure 5). However, these transects were not statistically different from plains. It is clear that abyssal seamounts contribute to regional diversity in the CCZ (Cuvelier et al., 2020). These results corroborate our findings and suggest that seamount habitats must be considered in spatial management as distinct from the plains. Further differentiation of the fish community between finer-scale habitats (e.g., ridges and troughs) are not possible with the dataset, but cannot be excluded.
Many fishes and scavengers have very large (as shown here), even worldwide, biogeographic ranges (King and Priede, 2008; Gaither et al., 2015). Indeed, the regional variations in community composition discussed above are largely the result of varying abundances of species rather than species presence/absence. It should be noted that there are a few species that have small ranges too (Figure 10). Though sampling in this analysis is sparse which can lead to erroneous conclusions about ranges (pseudoendemism) we observed some taxa only on seamounts (even with abyssal deployments from 15 to 20 km away; Leitner et al., 2021b) and 9 fish taxa were observed in only one region each and another 9 in two regions each (see also Simon-Lledó et al., 2020; Leitner et al., 2021a). Taxa such as the Liparidae and Zoarcidae frequently have regional endemics (Anderson and Fedorov, 2004; Chernova et al., 2004). Despite generally large ranges it is not presently possible to determine if any biogeographic boundaries exist in the CCZ region owing to the coarse spatial resolution of the data. It is also important to note that the present analysis is largely based on morphological taxonomy, specifically photographic identification. Future physical sampling could yield greater diversity and split existing taxa, such that taxa with apparently widespread distributions are actually confined to smaller biogeographies. Additionally, we have not evaluated any population level ranges which can be quite important to evaluate connectivity and recolonization rates. Ideally datasets could be compared to those employing eDNA approaches. However, specimens for fishes and scavengers are limited which makes their coverage in barcoding databases very sparse. We need a concentrated fish and scavenger sampling effort using benthic trawls and traps across the CCZ where captured specimens are first morphologically identified and then barcoded with entry into global databases for future reference.
The changes in fish and scavenger community composition across the CCZ suggest that the distributed nature of the network of APEIs is likely very important for their conservation. It is clear already that the CCZ communities are different than those in much of the rest of the Pacific including some large protected areas such as Mariana Trench National Monument and Papahānaumokuākea Marine National Monument (the Northwestern Hawaiian Islands in our analysis) (Kennedy et al., 2019). Even for very mobile fishes and scavengers protected areas are needed in the immediate mining region to protect fish and scavenger communities. The regional environmental management plan for the CCZ is currently being reviewed by the ISA to ensure that the APEIs will preserve a fauna that is similar to the neighboring license areas (Wedding et al., 2015). While it seems clear that their distributed nature is beneficial for conservation of fish communities, at this stage fish and scavenger data is too limited to compare communities between license areas and neighboring APEIs to evaluate their representivity on more local scales. In those regions where we have data from APEIs, we are missing data from neighboring license areas (western CCZ), and in those regions where we have data from license areas, we are missing data from neighboring APEIs (eastern CCZ). Additionally, there is no currently available data from the central CCZ.
The ISA requires contractors to perform baseline assessment of license areas in the CCZ that include studies of top predators and scavengers (ISBA/25/LTC/6/Rev.13). This initial synthesis (including the fish guide in Supplementary Materials) will hopefully provide a foundation for these future studies. We urge contractors to conduct megafaunal transect studies that cover enough area to provide robust fish data. Many transecting studies done to date were not quantitative or did not cover enough area to provide robust estimates of fish density, diversity and community composition. Exact areas will vary based on local densities and diversities but the areas with the most asymptotic rarefaction curves in this study included DISCOL, APEIs 6 and 7, and TOML D where the survey areas ranged from 1.3 to 11 hectares. Comparative methodological studies that more fully evaluate potential differences between ROV, AUV and towed camera systems are also needed. Baited camera studies will complement such transecting approaches. Though their effort is hard to quantify, they captured a large fraction (44%) of the fish taxa observed in visual transects and two that were not observed otherwise. At least one study has suggested that at one place and time, ∼10 deployments may adequately capture diversity and relative abundances of scavenging taxa within one habitat type (Harbour et al., 2020). Baited camera approaches already enable statistically meaningful comparisons between locations within the CCZ (Figure 6) but are currently unevenly distributed, existing for eastern CCZ license areas and western CCZ APEIs only. Baited camera deployments should be expanded into more CCZ regions using standard methods: a view area of 1–3 m2, duration of 18–24 h at the seafloor, and using 1 kg of mackerel or similar bait tied tightly to the camera system in the field of view. We must urge taxonomic consistency during annotation (see Supplementary Material) by working with others to ensure consistency and especially with taxonomists by providing samples and funding (e.g., Glover et al., 2016). There are a number of taxa, particularly the diverse ophidiids, where we need significant additional specimens for vouchers and tissue to create DNA barcodes for eDNA work. Results from all analyses should be shared and will enable further evaluation of the APEIs, environmental drivers of community patterns, identify biogeographic boundaries, and perhaps lead to understanding seasonal and interannual variations that have been documented in other parts of the abyss (Priede et al., 2003; Drazen et al., 2012). As well as the scientific value, this will form an important part of the broad-scale understanding needed to inform regional management.
Data Availability Statement
The original contributions presented in the study are included in the article/Supplementary Material, further inquiries can be directed to the corresponding author.
Ethics Statement
The animal study was reviewed and approved by the Animal Care and Use Committee, Office of Research Compliance, University of Hawai‘i at Mānoa, protocol #14-1934.
Author Contributions
JD and AL conceived of the study, compiled, and analyzed the baited camera data. DJ and ES-L compiled the visual transect data and assisted JD and AL in analysis. JD wrote the first draft of the manuscript. All authors contributed to manuscript revision, read, and approved the submitted version.
Funding
This project was provided to JD and AL by the Gordon and Betty Moore Foundation (grant no. 5596), NOAA Office of Exploration and Research (grant # NA17OAR0110209), the Pew Charitable Trusts, and the Benioff Ocean Initiative. DJ received funding through the One Ocean Hub, a collaborative research for sustainable development programme funded by UK Research and Innovation (UKRI) through the UK Global Challenges Research Fund (GCRF) under NERC grant NE/S008950/1. This work was part of the NERC Seabed Mining And Resilience To EXperimental impact (SMARTEX) project (Grant Reference NE/T003537/1). This is SOEST contribution # 11379.
Conflict of Interest
The authors declare that the research was conducted in the absence of any commercial or financial relationships that could be construed as a potential conflict of interest.
Publisher’s Note
All claims expressed in this article are solely those of the authors and do not necessarily represent those of their affiliated organizations, or those of the publisher, the editors and the reviewers. Any product that may be evaluated in this article, or claim that may be made by its manufacturer, is not guaranteed or endorsed by the publisher.
Acknowledgments
Many thanks to the many scientists who assisted by contributing raw data from published and unpublished works: Monty Priede (U. Aberdeen), Tom Linley and Alan Jamieson (Newcastle U.), Se-Jong Ju (Korea Institute of Ocean Science and Technology), Andrew Sweetman and Rob Harbour (Heriot-Watt U.), Jennifer Durden (U. Southampton), Daphne Cuvelier (U. of Azores), Kirsty McQuaid and Kerry Howell (Plymouth U), John Parianos and Christina Pomee (Tonga Ocean Minerals Limited). Thanks to Victoria Gronwald for assistance in annotation of video transects from the DeepCCZ cruise, Sage Morningstar and Eric Klingberg for assistance in annotation of baited camera data from DISCOL and Station ALOHA. Numerous taxonomists assisted with animal identification: Mary Wicksten, Bruce Mundy, M. Eric Anderson, David G. Smith, Virginia Moriwake, Meagan Putts, Sarah Bingo, and Michelle Gaither. Thanks to Craig Smith and all the organizers of the CCZ data synthesis workshop held at Friday Harbor Marine Laboratory in October 2019. Malcolm Clark provided thoughtful insights and discussion during the workshop. This manuscript, in a more preliminary form, was released as part of a report published by the International Seabed Authority (ISA, 2020).
Supplementary Material
The Supplementary Material for this article can be found online at: https://www.frontiersin.org/articles/10.3389/fmars.2021.630616/full#supplementary-material
Footnotes
References
Amon, D. J., Ziegler, A. F., Dahlgren, T. G., Glover, A. G., Goineau, A., Gooday, A. J., et al. (2016). Insights into the abundance and diversity of abyssal megafauna in a polymetallic-nodule region in the eastern Clarion-Clipperton Zone. Sci. Rep. 6:30492.
Amon, D., Ziegler, A. F., Drazen, J. C., Grisschenko, A. V., Leitner, A. B., Lindsay, D. J., et al. (2017). Megafauna of the UKSRL exploration contract area and eastern clarion-clipperton zone in the pacific ocean: Annelida, Arthropoda, Bryozoa, Chordata, Ctenophora, Mollusca. Biodivers. Data J. 5:e14598.
Anderson, M. E., Crabtree, R. E., Carter, H. J., Sulak, K. J., and Richardson, M. D. (1985). Distribution of demersal fishes of the Caribbean Sea found below 2,000 meters. Bull. Mar. Sci. 37, 794–807.
Anderson, M. E., and Fedorov, V. V. (2004). Family Zoarcidae Swainson 1839 eelpouts. California Acad. Sci. Annotated Checklists Fishes 34, 1–58.
Bailey, D. M., King, N. J., and Priede, I. G. (2007). Cameras and carcasses: historical and current methods for using artificial food falls to study deep-water animals. Mar. Ecol. Prog. Ser. 350, 179–191. doi: 10.3354/meps07187
Brewer, D. T., Milton, D. A., Fry, G. C., Dennis, D. M., Heales, D. S., and Venables, W. N. (2007). Impacts of gold mine waste disposal on deepwater fish in a pristine tropical marine system. Mar. Pollut. Bull. 54, 309–321. doi: 10.1016/j.marpolbul.2006.10.011
Bribiesca-Contreras, G., Dahlgren, T. G., Drazen, J. C., Drennan, R., Horton, T., Jones, D. O. B., et al. (2021). Biogeography and connectivity across habitat types and geographical scales in Pacific abyssal scavenging amphipods. Front. Mar. Sci. 8, 705237. doi: 10.3389/fmars.2021.705237
Cailliet, G. M., Andrews, A. H., Wakefield, W. W., Moreno, G., and Rhodes, K. L. (1999). Fish faunal and habitat analyses using trawls, camera sleds and submersibles in benthic deep-sea habitats off central California. Oceanologica Acta 22, 579–592. doi: 10.1016/s0399-1784(00)88949-5
Carney, R. S. (2005). Zonation of deep biota on continental margins. Oceanogr. Mar. Biol. Annu. Rev. 43, 211–278. doi: 10.1201/9781420037449.ch6
Chao, A., Gotelli, N. J., Hsieh, T., Sander, E. L., Ma, K., Colwell, R. K., et al. (2014). Rarefaction and extrapolation with Hill numbers: a framework for sampling and estimation in species diversity studies. Ecol. Monogr. 84, 45–67. doi: 10.1890/13-0133.1
Chernova, N. V., Stein, D. L., and Andriashev, A. P. (2004). Family Liparidae (Scopoli 1777) — snailfishes. California Acad. Sci. Annotated Checklists Fishes 31, 1–72.
Christiansen, B., Vieira, R. P., Christiansen, S., Denda, A., Oliveira, F., and Gonçalves, J. M. S. (2015). The fish fauna of Ampère Seamount (NE Atlantic) and the adjacent abyssal plain. Helgol. Mar. Res. 69, 13–23. doi: 10.1007/s10152-014-0413-4
Clarke, K. R., and Gorley, R. N. (2006). PRIMER v6: User Manual and Tutorial. Plymouth: PRIMER-E Ltd.
Cousins, N. J., and Priede, I. G. (2012). Abyssal demersal fish fauna composition in two contrasting productivity regions of the Crozet Plateau, Southern Indian Ocean. Deep Sea Res. Part I Oceanogr. Res. Papers 64, 71–77. doi: 10.1016/j.dsr.2012.02.003
Crabtree, R. E., Carter, J., and Musick, J. A. (1991). The comparative feeding ecology of temperate and tropical deep-sea fishes from the western North Atlantic. Deep Sea Res. 38, 1277–1298. doi: 10.1016/0198-0149(91)90027-d
Cuvelier, D., Ribeiro, P. A., Ramalho, S. P., Kersken, D., Martinez Arbizu, P., and Colaço, A. (2020). Are seamounts refuge areas for fauna from polymetallic nodule fields? Biogeosciences 17, 2657–2680. doi: 10.5194/bg-17-2657-2020
Devine, J. A., Baker, K. D., and Haedrich, R. L. (2006). Deep-sea fishes qualify as endangered. Nature 439:29. doi: 10.1038/439029a
Drazen, J. C., Bailey, D. M., Ruhl, H., and Smith, K. L. Jr. (2012). The role of carrion supply in the abundance of deep-water fish off California. PLoS One 7:e49332. doi: 10.1371/journal.pone.0049332
Drazen, J. C., Leitner, A. B., Morningstar, S., Marcon, Y., Greinert, J., and Purser, A. (2019). Observations of deep-sea fishes and mobile scavengers from the abyssal DISCOL experimental mining area. Biogeosciences 16, 3133–3146. doi: 10.5194/bg-16-3133-2019
Drazen, J. C., and Sutton, T. T. (2017). Dining in the deep: the feeding ecology of deep-sea fishes. Annu. Rev. Mar. Sci. 9, 337–366. doi: 10.1146/annurev-marine-010816-060543
Durden, J. M., Bett, B. J., and Ruhl, H. A. (2020). Subtle variation in abyssal terrain induces significant change in benthic megafaunal abundance, diversity, and community structure. Progr. Oceanogr. 186:102395. doi: 10.1016/j.pocean.2020.102395
Durden, J. M., Putts, M., Bingo, S., Leitner, A. B., Drazen, J. C., Gooday, A., et al. (2021). Megafaunal ecology of the western Clarion Clipperton Zone. Front. Mar. Sci. 8:671062. doi: 10.3389/fmars.2021.671062
Estes, J. A., Terborgh, J., Brashares, J. S., Power, M. E., Berger, J., Bond, W. J., et al. (2011). Trophic downgrading of planet Earth. Science 333, 301–306.
Farnsworth, K. D., Thygesen, U. H., Ditlevsen, S., and King, N. J. (2007). How to estimate scavenger fish abundance using baited camera data. Mar. Ecol. Prog. Series 350, 223–234. doi: 10.3354/meps07190
Fleury, A. G., and Drazen, J. C. (2013). Abyssal scavenging communities attracted to sargassum and fish in the Sargasso sea. Deep Sea Res. I 72, 141–147. doi: 10.1016/j.dsr.2012.11.004
Fosså, J. H., Mortensen, P. B., and Furevik, D. M. (2002). The deep-water coral Lophelia pertusa in Norwegian waters: distribution and fishery impacts. Hydrobiologia 471, 1–12.
Gaither, M. R., Bowen, B. W., Rocha, L. A., and Briggs, J. C. (2015). Fishes that rule the world: circumtropical distributions revisited. Fish Fish. 17, 664–679.
Glover, A., Dahlgren, T., Wiklund, H., Mohrbeck, I., and Smith, C. (2016). An end-to-end DNA taxonomy methodology for benthic biodiversity survey in the clarion-clipperton zone, central Pacific abyss. J. Mar. Sci. Eng. 4:2. doi: 10.3390/jmse4010002
Harbour, R. P., Leitner, A., Ruehlemann, C., Vink, A., and Sweetman, A. K. (2020). Benthic and demersal scavenger biodiversity in the eastern end of the Clarion-Clipperton Zone - an area marked for polymetallic nodule mining. Front. Mar. Sci. 7:458. doi: 10.3389/fmars.2020.00458
Hsieh, T. C., Ma, K. H., and Chao, A. (2020). iNEXT: iNterpolation and EXTrapolation for Species Diversity. R Package Version 2.0.20. Available online at: http://chao.stat.nthu.edu.tw/wordpress/software-download/ (Online) (accessed January 28, 2020).
ISA (2020). “Deep CCZ Biodiversity Synthesis Workshop Friday Harbor, Washington, USA, 1-4 October 2019: WORKSHOP REPORT,” in ISA Workshop Report, eds C. R. Smith and M. R. Clark (Kingston: International Seabed Authority).
Jamieson, A., Fujii, T., Solan, M., Matsumoto, A. K., Bagley, P. M., and Priede, I. G. (2009). Liparid and macrourid fishes of the hadal zone: in situ observations of activity and feeding behaviour. Proc. R. Soc. B: Biol. Sci. 276, 1037–1045. doi: 10.1098/rspb.2008.1670
Jamieson, A. J., Kilgallen, N. M., Rowden, A. A., Fujii, T., Horton, T., Lörz, A. N., et al. (2011). Bait-attending fauna of the Kermadec Trench, SW Pacific Ocean: evidence for an ecotone across the abyssal-hadal transition zone. Deep Sea Res. Part I: Oceanogr. Res.arch Papers 58, 49–62. doi: 10.1016/j.dsr.2010.11.003
Jones, D. O. B., Kaiser, S., Sweetman, A. K., Smith, C. R., Menot, L., Vink, A., et al. (2017). Biological responses to disturbance from simulated deep-sea polymetallic nodule mining. PLoS One 12:e0171750. doi: 10.1371/journal.pone.0171750
Kennedy, B. R. C., Cantwell, K., Malik, M., Kelley, C., Potter, J., Elliott, K., et al. (2019). The unknown and the unexplored: Insights into the Pacific deep-sea following NOAA CAPSTONE expeditions. Front. Mar. Sci. 6:480. doi: 10.3389/fmars.2019.00480
Kersten, O., Smith, C. R., and Vetter, E. W. (2017). Abyssal near-bottom dispersal stages of benthic invertebrates in the Clarion-Clipperton polymetallic nodule province. Deep Sea Res. I 127, 31–40. doi: 10.1016/j.dsr.2017.07.001
King, N. J., and Priede, I. G. (2008). “Coryphaenoides armatus, the Abyssal Grenadier: Global distribution, abundance, and ecology as determined by baited landers,” in Grenadiers of the World Oceans: Biology, Stock Assessment, and Fisheries, eds A. M. Orlov and T. Iwamoto (Bethesda, MD: American Fisheries Society), 139–161.
Langenkämper, D., Zurowietz, M., Schoening, T., and Nattkemper, T. W. (2017). BIIGLE 2.0 – Browsing and annotating large marine image collections. Front. Mar. Sci. 4:83. doi: 10.3389/fmars.2017.00083
Leitner, A. B., Durden, J. M., Smith, C. R., Klingberg, E., and Drazen, J. C. (2021a). Synaphobranchid swarms at an abyssal seamount summit: the largest aggregation of fishes ever observed at abyssal depths. Deep Sea Res. I 167, 103423. doi: 10.1016/j.dsr.2020.103423
Leitner, A. B., Neuheimer, A. B., Donlon, E., Smith, C. R., and Drazen, J. C. (2017). Environmental and bathymetric influences on abyssal bait-attending communities of the Clarion Clipperton Zone. Deep Sea Res. I 125, 65–80. doi: 10.1016/j.dsr.2017.04.017
Leitner, A. B., Smith, C. R., and Drazen, J. C. (2021b). Testing the seamount refuge hypothesis for predators and scavengers in the western Clarion-Clipperton Zone. Front. Mar. Sci. 8, 636305. doi: 10.3389/fmars.2021.636305
Linley, T. D., Stewart, A., Mcmillan, P., Clark, M., Gerringer, M., Drazen, J. C., et al. (2017). Bait attending fishes of the abyssal zone and hadal boundary: community structure, functional groups and species distribution in the Kermadec, New Hebrides and Mariana trenches. Deep Sea Res. I 121, 38–53.
Lodge, M., Johnson, D., Le Gurun, G., Wengler, M., Weaver, P., and Gunn, V. (2014). Seabed mining: international seabed authority environmental management plan for the Clarion–Clipperton Zone. A partnership approach. Mar. Policy 49, 66–72. doi: 10.1016/j.marpol.2014.04.006
Lutz, M. J., Caldeira, K., Dunbar, R. B., and Behrenfeld, M. J. (2007). Seasonal rhythms of net primary production and particulate organic carbon flux to depth describe the efficiency of biological pump in the global ocean. J. Geophys. Res. C. Oceans 112:C10011.
McQuaid, K. (2020). Ecological Studies of an Abyssal Nodule Province to Inform the Management of deep-Sea Mining. Ph.D. dissertation. Plymouth: University of Plymouth.
Merrett, N. R., and Fasham, M. J. R. (1998). Demersal ichthyofauna distribution in the abyssal North Atlantic revisited: the effect of sample size on ordination. Mar. Ecol. Progr. Series 173, 267–274. doi: 10.3354/meps173267
Merrett, N. R., Haedrich, R. L., Gordon, J. D. M., and Stehmann, M. (1991). Deep demersal fish assemblage structure in the Porcupine Seabight (eastern North Atlantic): Results of single warp trawling at lower slope to abyssal soundings. J. Mar. Biol. Assoc. U.K. Plymouth 71, 359–373. doi: 10.1017/s002531540005164x
Milligan, R. J., Morris, K. J., Bett, B. J., Durden, J. M., Jones, D. O. B., Robert, K., et al. (2016). High resolution study of the spatial distributions of abyssal fishes by autonomous underwater vehicle. Sci. Rep. 6:26095.
Mindel, B. L., Neat, F. C., Webb, T. J., and Blanchard, J. L. (2017). Size-based indicators show depth-dependent change over time in the deep sea. ICES J. Mar. Sci. 75, 113–121. doi: 10.1093/icesjms/fsx110
Morato, T., Watson, R., Pitcher, T. J., and Pauly, D. (2006). Fishing down the deep. Fish Fish. 7, 24–34. doi: 10.1111/j.1467-2979.2006.00205.x
Myers, R. A., Baum, J. K., Shepherd, T. D., Powers, S. P., and Peterson, C. H. (2007). Cascading effects of the loss of apex predatory sharks from a coastal ocean. Science 315, 1846–1850. doi: 10.1126/science.1138657
Oksanen, J., Blanchet, F., Kind, R., Legendre, P., Minchin, P., O’hara, R., et al. (2016). Vegan: Community Ecology Package.
Pearcy, W. G., Stein, D. L., and Carney, R. S. (1982). The deep-sea benthic fish fauna of the northeastern Pacific Ocean on Cascadia and Tufts abyssal plains and adjoining continental slopes. Biol. Oceanogr. 1, 375–428.
Polovina, J., Abecassis, M., Howell, E. A., and Woodworth, P. (2009). Changes among the upper trophic levels in the central North Pacific subtropical gyre ecosystem, 1996-2006. Fish. Bull. 107, 523–531.
Priede, I. G. (2017). Deep-Sea Fishes: Biology, Diversity, Ecology and Fisheries. Cambridge: Cambridge University Press.
Priede, I. G., and Bagley, P. M. (2000). In situ studies on deep-sea demersal fishes using autonomous unmanned ladder platforms. Oceanogr. Mar. Biol. Annu. Rev. 38, 357–392.
Priede, I. G., Bagley, P. M., and Smith, K. L. Jr. (1994). Seasonal change in activity of abyssal demersal scavenging grenadiers Coryphaenoides (Nematonurus) armatus in the eastern North Pacific Ocean. Limnol. Oceanogr. 39, 279–285. doi: 10.4319/lo.1994.39.2.0279
Priede, I. G., Deary, A. R., Bailey, D. M., and Smith, K. L. Jr. (2003). Low activity and seasonal change in population size structure of grenadiers in the oligotrophic abyssal Central North Pacific Ocean. J. Fish Biol. 63, 187–196. doi: 10.1046/j.1095-8649.2003.00142.x
Priede, I. G., Drazen, J. C., Bailey, D. M., Kuhnz, L. A., and Fabian, D. (2020). Abyssal demersal fishes recorded at station M (34°50′N, 123° 00′W, 4100 m depth) in the northeast Pacific Ocean: an annotated check list and synthesis. Deep Sea Res. Part II Top. Stud. Oceanogr. 173:104648. doi: 10.1016/j.dsr2.2019.104648
Priede, I. G., Godbold, J. A., King, N. J., Collins, M. A., Bailey, D. M., and Gordon, J. D. M. (2010). Deep-sea demersal fish species richness in the Porcupine Seabight. NE Atlantic Ocean: global and regional patterns. Mar. Ecol. 31, 247–260. doi: 10.1111/j.1439-0485.2009.00330.x
Priede, I. G., Smith, K. L. Jr., and Armstrong, J. D. (1990). Foraging behavior of abyssal grenadier fish: Inferences from acoustic tagging and tracking in the North Pacific Ocean. Deep Sea Res. 37, 81–101. doi: 10.1016/0198-0149(90)90030-y
Priede, I. G., and Smith, K. L. (1986). Behaviour of the abyssal grenadier, Coryphaenoides yaquinae, monitored using ingestible acoustic transmitters in the Pacific Ocean. J. Fish Biol. 29, 199–206. doi: 10.1111/j.1095-8649.1986.tb05011.x
Puig, P., Canals, M., Company, J. B., Martin, J., Amblas, D., Lastras, G., et al. (2012). Ploughing the deep sea floor. Nature 489, 286–289. doi: 10.1038/nature11410
Pusceddu, A., Bianchelli, S., Martín, J., Puig, P., Palanques, A., Masqué, P., et al. (2014). Chronic and intensive bottom trawling impairs deep-sea biodiversity and ecosystem functioning. Proc. Natl. Acad. Sci.U.S.A. 111, 8861–8866. doi: 10.1073/pnas.1405454111
Ripple, W. J., Estes, J. A., Beschta, R. L., Wilmers, C. C., Ritchie, E. G., Hebblewhite, M., et al. (2014). Status and ecological effects of the World’s largest carnivores. Science 343:1241484. doi: 10.1126/science.1241484
Ryall, K. L., and Fahrig, L. (2006). Response of predators to loss and fragmentation of prey habitat: a review of theory. Ecology 87, 1086–1093. doi: 10.1890/0012-9658(2006)87[1086:roptla]2.0.co;2
Sackett, D., Kelley, C. D., and Drazen, J. C. (2017). Spilling over deepwater boundaries; evidence of spillover from two deepwater protected areas in Hawaii. Mar. Ecol. Progr. Series 568, 175–190. doi: 10.3354/meps12049
Simon-Lledó, E., Bett, B. J., Huvenne, V. A. I, Köser, K., Schoening, T., Greinert, J., et al. (2019a). Biological effects 26 years after simulated deep-sea mining. Sci. Rep. 9:8040.
Simon-Lledó, E., Bett, B. J., Huvenne, V. A. I, Schoening, T., Benoist, N. M. A., Jeffreys, R. M., et al. (2019b). Megafaunal variation in the abyssal landscape of the Clarion Clipperton Zone. Progr. Oceanogr. 170, 119–133. doi: 10.1016/j.pocean.2018.11.003
Simon-Lledó, E., Bett, B. J., Huvenne, V. A. I, Schoening, T., Benoist, N. M. A., and Jones, D. O. B. (2019c). Ecology of a polymetallic nodule occurrence gradient: Implications for deep-sea mining. Limnol. Oceanogr. 64, 1883–1894. doi: 10.1002/lno.11157
Simon-Lledó, E., Thompson, S., Yool, A., Flynn, A., Pomee, C., Parianos, J., et al. (2019d). Preliminary observations of the abyssal megafauna of kiribati. Front. Mar. Sci. 6:605.
Simon-Lledó, E., Pomee, C., Ahokava, A., Drazen, J. C., Leitner, A. B., Flynn, A., et al. (2020). Multi-scale variations in invertebrate and fish megafauna in the mid-eastern Clarion Clipperton Zone. Progr. Oceanogr. 187:102405. doi: 10.1016/j.pocean.2020.102405
Taboada, S., Riesgo, A., Wiklund, H., Paterson, G. L. J., Koutsouveli, V., Santodomingo, N., et al. (2018). Implications of population connectivity studies for the design of marine protected areas in the deep sea: an example of a demosponge from the Clarion-Clipperton Zone. Mol. Ecol. 27, 4657–4679. doi: 10.1111/mec.14888
Trenkel, V. M., Lorance, P., and Mahevas, S. (2004). Do visual transects provide true population density estimates for deepwater fish? ICES J. Mar. Sci. 61, 1050–1056.
Vanreusel, A., Hilario, A., Ribeiro, P. A., Menot, L., and Arbizu, P. M. (2016). Threatened by mining, polymetallic nodules are required to preserve abyssal epifauna. Sci. Rep. 6:26808.
Watling, L., and Norse, E. A. (1998). Disturbance of the sea bed by mobile fishing gear: a comparison toforest clearcutting. Conservation. Biology 12, 1180–1197. doi: 10.1046/j.1523-1739.1998.0120061180.x
Wedding, L. M., Friedlander, A. M., Kittinger, J. N., Watling, L., Gaines, S. D., Bennett, M., et al. (2013). From principles to practice: a spatial approach to systematic conservation planning in the deep sea. Proc. R. Soc. B Biol. Sci. 280:20131684. doi: 10.1098/rspb.2013.1684
Wedding, L. M., Reiter, S. M., Smith, C. R., Gjerde, K. M., Kittinger, J. N., Friedlander, A. M., et al. (2015). Managing mining of the deep seabed. Science 349, 144–145.
Wenger, A. S., Harvey, E., Wilson, S., Rawson, C., Newman, S. J., Clarke, D., et al. (2017). A critical analysis of the direct effects of dredging on fish. Fish Fish. 18, 967–985. doi: 10.1111/faf.12218
Wraith, J., Lynch, T., Minchinton, T. E., Broad, A., and Davis, A. R. (2013). Bait type affects fish assemblages and feeding guilds observed at baited remote underwater video stations. Mar. Ecol. Progr. Series 477, 189–199. doi: 10.3354/meps10137
Yeh, J., and Drazen, J. C. (2009). Depth zonation and bathymetric trends of deep-sea megafaunal scavengers of the Hawaiian Islands. Deep Sea Res. I 56, 251–266. doi: 10.1016/j.dsr.2008.08.005
Keywords: baited camera, deep sea mining, marine protected areas, visual transects, abyssal
Citation: Drazen JC, Leitner AB, Jones DOB and Simon-Lledó E (2021) Regional Variation in Communities of Demersal Fishes and Scavengers Across the CCZ and Pacific Ocean. Front. Mar. Sci. 8:630616. doi: 10.3389/fmars.2021.630616
Received: 18 November 2020; Accepted: 20 July 2021;
Published: 30 August 2021.
Edited by:
Malcolm Ross Clark, National Institute of Water and Atmospheric Research (NIWA), New ZealandReviewed by:
Francis Neat, World Maritime University, SwedenRosanna J. Milligan, Nova Southeastern University, United States
Copyright © 2021 Drazen, Leitner, Jones and Simon-Lledó. This is an open-access article distributed under the terms of the Creative Commons Attribution License (CC BY). The use, distribution or reproduction in other forums is permitted, provided the original author(s) and the copyright owner(s) are credited and that the original publication in this journal is cited, in accordance with accepted academic practice. No use, distribution or reproduction is permitted which does not comply with these terms.
*Correspondence: Jeffrey C. Drazen, jdrazen@hawaii.edu