 Julia Indivero
 Allison N. Myers-Pigg
 Nicholas D. Ward
95% of researchers rate our articles as excellent or good
Learn more about the work of our research integrity team to safeguard the quality of each article we publish.
Find out more
ORIGINAL RESEARCH article
Front. Mar. Sci. , 28 June 2021
Sec. Marine Biogeochemistry
Volume 8 - 2021 | https://doi.org/10.3389/fmars.2021.607644
Where rivers meet the sea, tides can exert a physical and chemical influence on the lower reaches of a river. How tidal dynamics in these tidal river reaches interact with upstream hydrological drivers such as storm rainfall, which ultimately determines the quantity and composition of material transferred from watersheds to estuaries, is currently unknown. We monitored a small freshwater tidal river in the Pacific Northwest, United States in high resolution over 1 year to evaluate the relative importance of tides vs. upstream hydrological flows (i.e., base flow and precipitation events) on basic physico-chemical parameters (pH, dissolved oxygen, turbidity, specific conductivity, and temperature), and how these interactions relate to the downstream estuary. Tidal variability and diurnal cycles (i.e., solar radiation) dominated water physico-chemical variability in the summer, but the influence of these drivers was overshadowed by storm-driven sharp pulses in river physico-chemistry during the remainder of the year. Within such events, we found incidences of counterclockwise hysteresis of pH, counterclockwise hysteresis of dissolved oxygen, and clockwise hysteresis of turbidity, although systematic trends were not observed across events. The dominance of storm rainfall in the river’s physico-chemistry dynamics, and similar pulses of decreased pH observed in adjacent estuarine waters, suggest that the linkage between tidal streams and the broader system is variable throughout the year. High-frequency monitoring of tidal river biogeochemistry is therefore crucial to enable the assessment of how the relative strength of these drivers may change with future sea level rise and altered precipitation patterns to modulate biogeochemical dynamics across the land-ocean-atmosphere continuum.
Rainfall from storms is disproportionally important for the transport of materials from terrestrial to aquatic ecosystems, resultant from the large flushing of solutes and materials over short periods of time to river systems (Hinton et al., 1997; Buffam et al., 2001; McClain et al., 2003; Inamdar et al., 2006; Holmes et al., 2008; Fellman et al., 2009; Ward et al., 2012; Vaughan et al., 2017). The role such events play in linking terrestrial and marine ecosystems makes understanding river chemistry vital for understanding global biogeochemical dynamics (Zhuang and Yang, 2018).
Tidally influenced rivers, where river discharge is influenced by tides yet the river does not necessarily receive direct seawater intrusion except in the case of small creeks, are particularly dynamic due to the dual oceanic and landward influence on water chemistry and physics (Ensign et al., 2012; Ward et al., 2017). The predicted increased frequency and intensity of storms with climatic shifts (Walsh et al., 2016) may alter the freshwater inputs to river systems, and sea level rise may cause freshwater tidal effects to extend farther inland (Ensign and Noe, 2018). These future environmental changes may alter the balance between the underlying hydrologic drivers of river chemistry, necessitating a greater understanding of the interplay between them.
The interplay between hydrologic drivers and water chemistry dynamics also shifts on a variety of timescales. High-resolution monitoring is required to elucidate drivers of water chemistry variability over time scales ranging from hours to seasons to years. For example, in a study evaluating 15 years of high-frequency data from several United States estuaries, pH and dissolved oxygen (DO) variability were primarily driven by metabolic processes on diel to seasonal timescales (Baumann and Smith, 2017). Both heterotrophic metabolism and terrestrial soil influences contributed to pH dynamics in a tropical estuary monitored over several months (Proum et al., 2018). DO variability in a tidal creek was influenced by disparate drivers: in summer, hydrology, climate, and biotic factors jointly influenced DO, while in the winter hydrology more prominently determined observed DO dynamics (Nelson et al., 2017). Thus, differences in drivers of water chemistry across systems and seasons must be properly constrained with high-resolution datasets in order to understand the role of tidal rivers in Earth system cycles. Here, we consider the impact of tidal and upstream hydrological drivers (i.e., base flow and precipitation) on river chemistry in a small, freshwater tidal river that is impacted by tides but does not experience seawater mixing.
High-resolution monitoring of water chemistry parameters can help extricate these patterns by capturing sub-daily (e.g., tidal) changes and ephemeral events, such as storm rainfall, that may be missed during discrete sampling at longer intervals (Blaen et al., 2016; Kämäri et al., 2018; Regier et al., 2021). For instance, evaluating patterns within storm rainfall events can reveal hysteresis effects, wherein there is a differing response of river physico-chemical parameters to river discharge on the rising and falling limb of the event, that can help identify the source and flushing pattern of solutes. Generally, clockwise hysteresis (i.e., a higher concentration of the parameter on the rising than the falling limb) indicates a more proximal and exhaustible source (e.g., House and Warwick, 1998) while counterclockwise hysteresis (i.e., a higher concentration on the falling than the rising limb) indicates a more distal source with a longer transport time (e.g., Bowes et al., 2009).
There is a long history of hysteresis analysis of parameters such as suspended sediments (Whitfield and Schreier, 1981; Williams, 1989; Asselman, 1999; Tananaev, 2012) and other solutes, such as phosphorus and nitrate (House and Warwick, 1998; Bowes et al., 2005) using discrete sampling. More recently, high-resolution monitoring has enabled fine-scale tracking of how these parameters change in a river over the course of storm rainfall (Jeong et al., 2012; Lloyd et al., 2016b; Vaughan et al., 2017; Kämäri et al., 2018; Rose et al., 2018).
However, there has been less examination of hysteresis of broader water quality measurements in tandem. Kämäri et al. (2018) measured chemical oxygen demand, in addition to suspended solids and nitrate, at high resolution as an indicator of organic matter (OM) content during storm and run-off events and found seasonal differences in chemical oxygen demand dynamics. Rose (2003) found clockwise hysteresis of specific conductance and both clockwise and counterclockwise hysteresis of pH through discrete sampling of storm events. In situ continuous sensors have more recently increased the capacity for assessing hysteresis effects of a broader suite of water quality parameters at high resolution, such as OM quality indicators (Wagner et al., 2019). Furthermore, evaluating how parameters such as pH and DO behave at high resolution throughout the course of storm rainfall can facilitate a better understanding of how these short-term events impact river chemistry at a bulk level, informing more time-consuming molecular-level measurements (Wagner et al., 2019).
Water chemistry dynamics of rivers (e.g., Kämäri et al., 2018) and estuaries (e.g., Baumann and Smith, 2017; Nelson et al., 2017; Proum et al., 2018) have been more frequently examined than freshwater tidal rivers, yet approximately 2,850 km of tidal freshwater rivers exist in the eastern United States alone (Ensign and Noe, 2018; Tagestad et al., 2021). One study modeling pH in the tidal freshwater portion of the Potomac River estuary found that hydrology, specifically low discharge, was the predominant influence on pH by increasing residence time and thus algal production (Cerco et al., 2013). While tidal river chemistry is likely influenced significantly by both freshwater and marine processes, the relationship between these processes in freshwater tidal rivers is an area of needed research. Marine influence on tidal river chemistry likely diminishes with stream size; for example, while the influence of tides on discharge can be observed 1000 km upstream of the Amazon River’s mouth, its freshwater plume extends ∼60 km offshore (Sawakuchi et al., 2017). In this case, while no marine-derived material is exchanged with the tidal river, water level fluctuations still drive variability in parameters such as CO2 saturation due to hydrodynamic controls on microbial respiration (Ward et al., 2018) as well as semi-diurnal floodplain inundation.
Physical and chemical properties in smaller freshwater tidal rivers may differ from larger freshwater tidal rivers such as the Amazon River, and therefore constitute a distinct type of tidal system likely with different drivers. Additionally, these low-order coastal streams represent the majority (66%) of total tidal stream length in the United States (Tagestad et al., 2021). The dynamics of nutrient, carbon, and lignin export in the Union River, a river with a freshwater tidal stretch in western Washington state, United States, during storm rainfall events were previously examined (Ward et al., 2012). Discrete samples collected during storm rainfall from the furthest downstream, non-tidal reach of the river indicated that there were two distinct pools of nutrients, a deep pool slowly mobilized by base flow throughout the year and a shallow subsurface soil layer that were exhaustively flushed during subsequent storms.
With this context in mind, we carried out high-resolution in situ monitoring of a previously unstudied freshwater tidal stretch of the Union River at a site that is upstream of any measurable salinity influence yet is depth-impacted by the tides. We monitored this site over the course of a hydrologic year in order to extricate the temporal interplay between hydrologic drivers on water physico-chemistry parameters. We explored (1) how a broad suite of physico-chemical parameters (pH, DO, turbidity, specific conductivity [SPC], and temperature) varied at sub-daily, daily, and seasonal scales, (2) the drivers of physico-chemical variability in the tidal Union River throughout the year, (3) the dynamics of intra-storm processes, and (4) how pH patterns from the river relates to the Hood Canal estuarine system into which it drains. We discerned patterns of water physico-chemistry variability in this distinct freshwater tidal system through application of an analytical method developed by Nelson et al. (2017), previously only utilized in an estuarine setting. We hypothesize that the influence of tidal vs. watershed drivers of tidal river physico-chemistry variability will change throughout the year and that estuarine chemistry will respond to pulses observed in the Union River (and presumably other rivers in the region). Finally, we suggest that examining the short- and long-term patterns of these smaller systems will better elucidate potential shifting drivers of biogeochemical dynamics with future environmental change in the coupled river-estuarine system.
The Union River drains into the southeast tip of Lynch Cove in the Hood Canal, in southern Puget Sound in Washington state (Figure 1). The Union River is one of many lowland draining streams that account for approximately 24% of the freshwater input into the Hood Canal (Steinberg et al., 2011). The Union River catchment is covered in primarily coniferous (∼23% mature, ∼15% young) and mixed deciduous (∼30%) forests (Steinberg et al., 2011). Union River discharge is dominated by fall and winter storm rainfall, unlike the large mountainous watersheds of the Olympic Mountains that are dominated by spring snowmelt (Ward et al., 2012). More than 60% of the total annual precipitation occurs between November and January, and less than 10% occurs between June and August (Peterson et al., 1997).
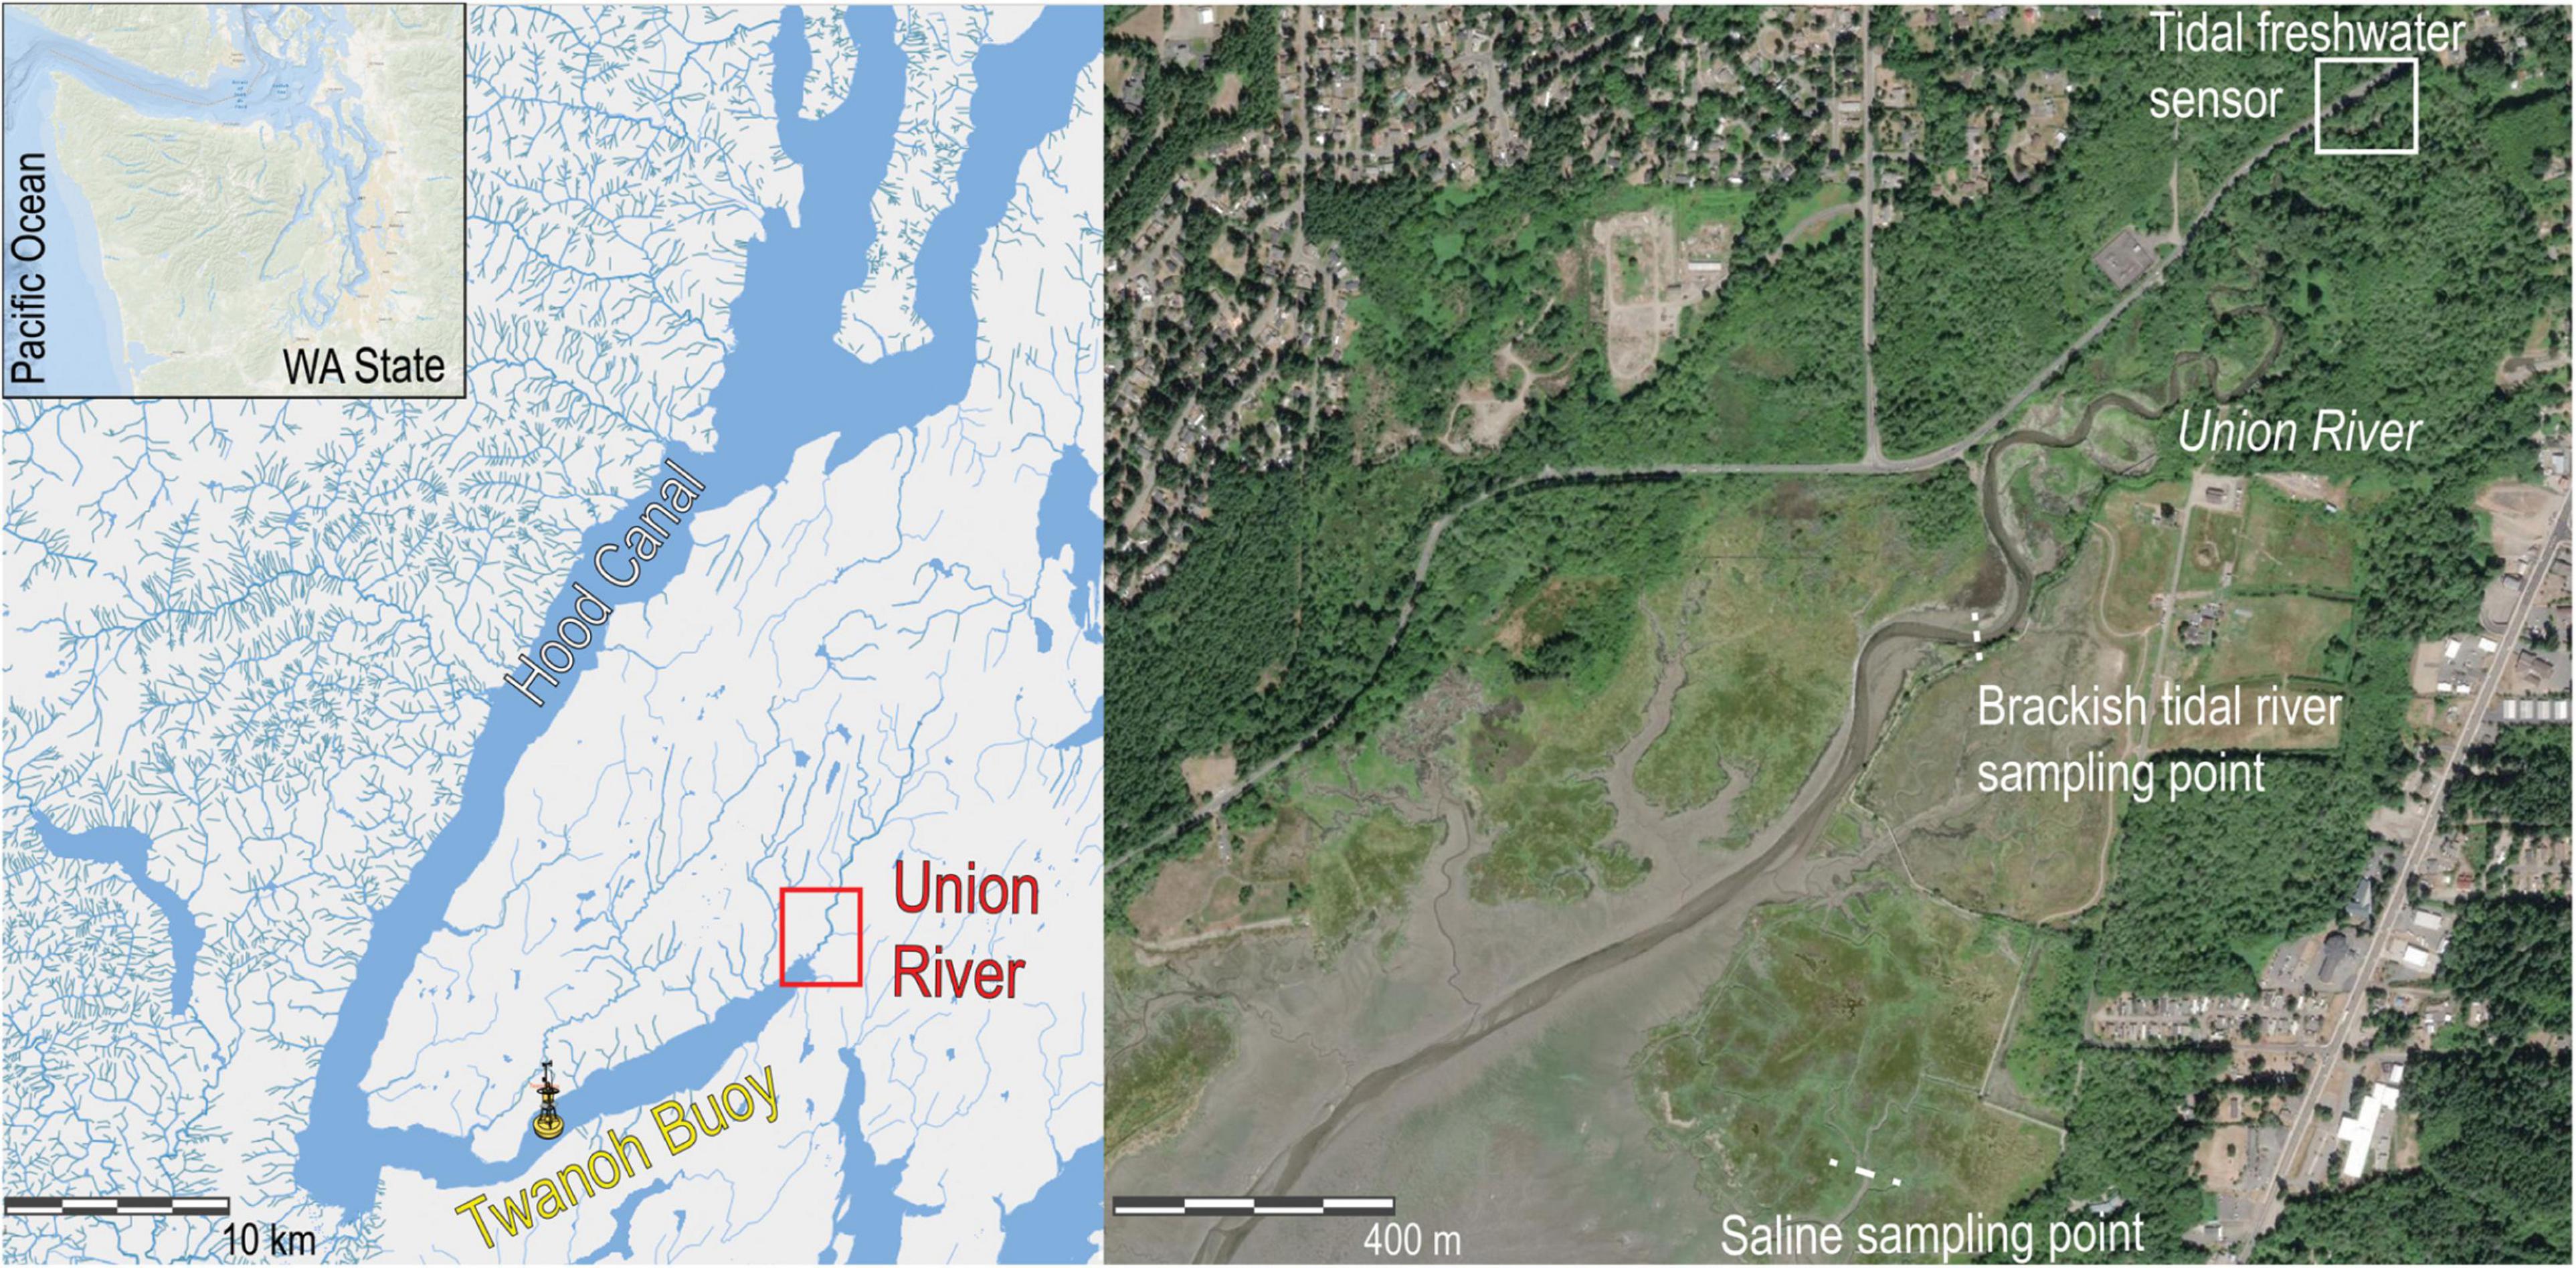
Figure 1. Location of the Union River (47.452050 N, -122.833807 W) and Twanoh Buoy (47.375 N, -123.008 W) in the Puget Sound of Washington state, United States. Map was created using ArcGIS 10.5 software (ESRI, 2017). Coordinate System: GCS WGS 1984.
The monitored reach of the river is upstream of any measurable salinity influence (as seen in the conductivity data), yet its depth is still impacted by marine tides. The sensor was located roughly 2.3 km upstream from the mouth of the river. The river is approximately 7 m wide where the sensor was installed and had an average depth of 0.67 m throughout the study period. At the river mouth, the channel width increases to roughly 55 m. Detailed bathymetric data is not available for the river reach between the sensor location and river mouth.
A YSI EXO2 multiparameter sonde (YSI, Yellow Springs, OH, United States) was deployed in the Union River (47.452050 N, -122.833807 W) from October 16th, 2017-October 12th, 2018 at a point in the river that remains fresh year-round but is impacted by tides. The sonde was fixed at approximately 0.25 m from the bottom of the river. The sonde was equipped with the following sensors: depth, DO (percent saturated relative to atmosphere), SPC (conductivity normalized conductivity at 25°C, μS cm–1), temperature (°C), pH, and turbidity (Formazin Nephelometric Unit, FNU). Probes were calibrated following manufacturer instructions prior to deployment. Approximately at monthly intervals, the sonde was exchanged with a clean, calibrated sonde. Dissolved oxygen was calibrated to 100% water-saturated air, SPC was calibrated with 10,000 μS cm–1 standard (YSI), pH was calibrated with pH 4.0, 7.0, and 10.0 standards (Thermo Fisher Scientific), and turbidity was calibrated with 126 FNU standard (YSI). All sensors from the removed sonde were then cleaned with deionized water and calibrated. We did not find significant fouling of sensors between calibrations. Additionally, pre- and post-calibration values were evaluated for sensor drift following manufacturer instructions, and no significant drift was observed. Measurements were taken every 5 min from October 16th to December 4th, 2017 and every 15 min from December 21st, 2017 to October 12th, 2018 after we determined that a longer interval was sufficient. There is a gap from December 4th to December 21st, 2017 when the sonde had to be removed for logistical reasons. Raw data were manually evaluated for aberrant values (e.g., from measurements taken when the sonde was being removed from or placed in the river) and were removed on a case-by-case basis if they were determined to be erroneous. Turbidity values greater than 4000 FNU, which is the maximum detection of the sensor according to the manufacturer guidelines, were removed. A sensor maintenance issue was identified on 06/15/2018 and turbidity data from after this date were also removed from analysis.
Since discharge data for the Union River is not available, we utilized data for a nearby river, Huge Creek (47.3894 N, -122.6978 W) (USGS, 2018), and estimated Union River discharge using a conversion factor determined for the two rivers. Direct measurements of Union River discharge made during base and high flow periods in 2008 by Ward et al. (2012) were compared to USGS discharge data during the same period. The average ratio of Union River discharge to Huge Creek discharge ±1 SD was 5.37 ± 1.01. This ratio was applied to USGS Huge Creek data during the study period to estimate Union River discharge. Calculated discharge data was visually compared to river stage measured by the sonde (Supplementary Figure 1). Although there were periods when estimated discharge and measured stage deviated, the two data sources generally agreed during the storm events examined for hysteresis (see section “Data Analysis”). Discrepancies between discharge and stage data are likely linked to a combination of the accuracy of our sonde’s depth sensor (0.04 m), slight changes in sensor depth during maintenance periods, and local variability in the magnitude and timing of rainfall over the Huge Creek and Union River watersheds. Daily precipitation data for Bremerton, WA (47.58367 N, -122.61683 W) for the entire study period was also downloaded (NOAA, 2018). pH data from the Hood Canal estuary was downloaded from the ORCA-UW Twanoh Buoy (47.375 N, -123.008 W) (ORCA-UW, 2018). The Twanoh Buoy is approximately 16.6 km from the sonde installed in the Union River, and about 14.3 km southwest from the mouth of the Union River. Buoy data was only available for a portion of the study period, November 2017 through April 2018. Discharge data for the Skokomish River, the largest river draining into the Hood Canal, was additionally downloaded (USGS, 2020) to aid interpretations of Hood Canal buoy data.
One sampling campaign was performed on 3/29/2018 to evaluate how surface water salinity and pH increases from the sensor location to the river mouth. A YSI Pro Plus handheld meter with a pH probe and salinity probe was calibrated using the same buffers used for the river sonde described above. Measurements were made by placing the probe directly into the surface water as far away from the riverbank as the researcher could safely wade.
All data analysis was conducted using RStudio (2016) at a significance level of p < 0.05 using statistical functions available in the base package (average, standard deviation, Spearman’s rank correlation, Pearson’s correlation). To identify correlations between measured physico-chemical parameters, all parameters were averaged by hour and hourly averages of all combinations of pH, dissolved oxygen, depth, turbidity, specific conductivity, temperature, and turbidity were assessed using Pearson’s correlation. Overall seasonal and daily trends were examined with monthly averages and standard deviations of parameters and through visual analysis of time series data. We additionally compared average daily pH in the Union River and Hood Canal with Pearson’s correlation to assess how the river compared to its drainage area in the Puget Sound. We compared average hourly pH in the Union River and Hood Canal with Pearson’s correlation by month to assess how the relationship varied over the course of the year.
We analyzed physico-chemical parameters in the Union River and Hood Canal over the course of the year under tidal and sub-tidal scales by quantifying tidal vs. non-tidal variability, following the method outlined in Nelson et al. (2017). This tidal variability index was previously used by Nelson et al. (2017) for an estuarine system with high seawater mixing, but this tidal analysis method has not previously been tested for a freshwater tidal system.
Data were divided into tidal cycle based on the timing of the high and low tides, resulting in one flood and one ebb phase for each tidal cycle (i.e., there were two tidal cycles per day). We then calculated the average and standard deviation of each parameter for each tidal cycle. For each month, the tidal cycle standard deviations for each parameter were averaged to obtain the average intracycle variability (σintra). Since the actual timing of tidal cycles was used in these calculations, diurnal variability due to day/night cycles should not be represented in the σintra value and rather is incorporated into the σinter value. Average intercycle variability (σinter) for each month was calculated as the standard deviations of the tidal cycle means for each parameter. The ratio of σintra:σinter was also calculated (i.e., a value of 1 indicated tidal and non-tidal variability were equal). Essentially, the intracycle and intracycle variability values provide a comparison between how much a parameter varies within each tidal cycle vs. how much it varies across the month. A σintra:σinter greater than 1 indicates that the variation in the parameter between high and low tide within a tidal cycle outweighed how much the magnitude of the parameter varied throughout the whole month.
To compare variability values for the Union River and Hood Canal, the ratio of the Hood Canal variability ratio to the Union River variability ratio was also calculated. Spearman’s rank correlation was used to assess the relationship between average monthly discharge data and the ratio values to evaluate the link between discharge levels and tidal variability. Spearman’s rank correlation was used because the average and ratio values did not meet the assumptions for linear regression.
To further explore the impact of storm rainfall events (i.e., “storms”) on water physico-chemistry, we assessed physico-chemical parameters for hysteresis. In this study, hysteresis is defined as the nonlinear relationship between discharge and physico-chemical parameters i.e., the physico-chemical parameter responds differently to the same discharge values on the rising limb leading up to the peak of the storm and the subsequent falling limb. Storm rainfall events were first separated in the hydrograph by identifying the largest abrupt increases in the Union River hydrograph (Figure 2), and were determined to end when the hydrograph flattened, returning to the pre-peak baseline, after the peak. Larger events that resulted in multiple peaks were categorized as separate storms, such as storms 1 and 2 (see Figure 2). Physico-chemical parameters were then graphed against river discharge and shaded from light to dark in chronological order to visualize the pattern of the parameter over the course of the storm (e.g., Figure 7). The shapes of the hysteresis graphs were categorized visually by loop direction (counterclockwise or clockwise) and loop shape based on (Williams, 1989): no hysteresis (i.e., single-valued line), clockwise loop, counterclockwise loop, single-line plus a loop, figure-eight loop, and complex loop (i.e., hysteresis is clearly present but difficult to define).
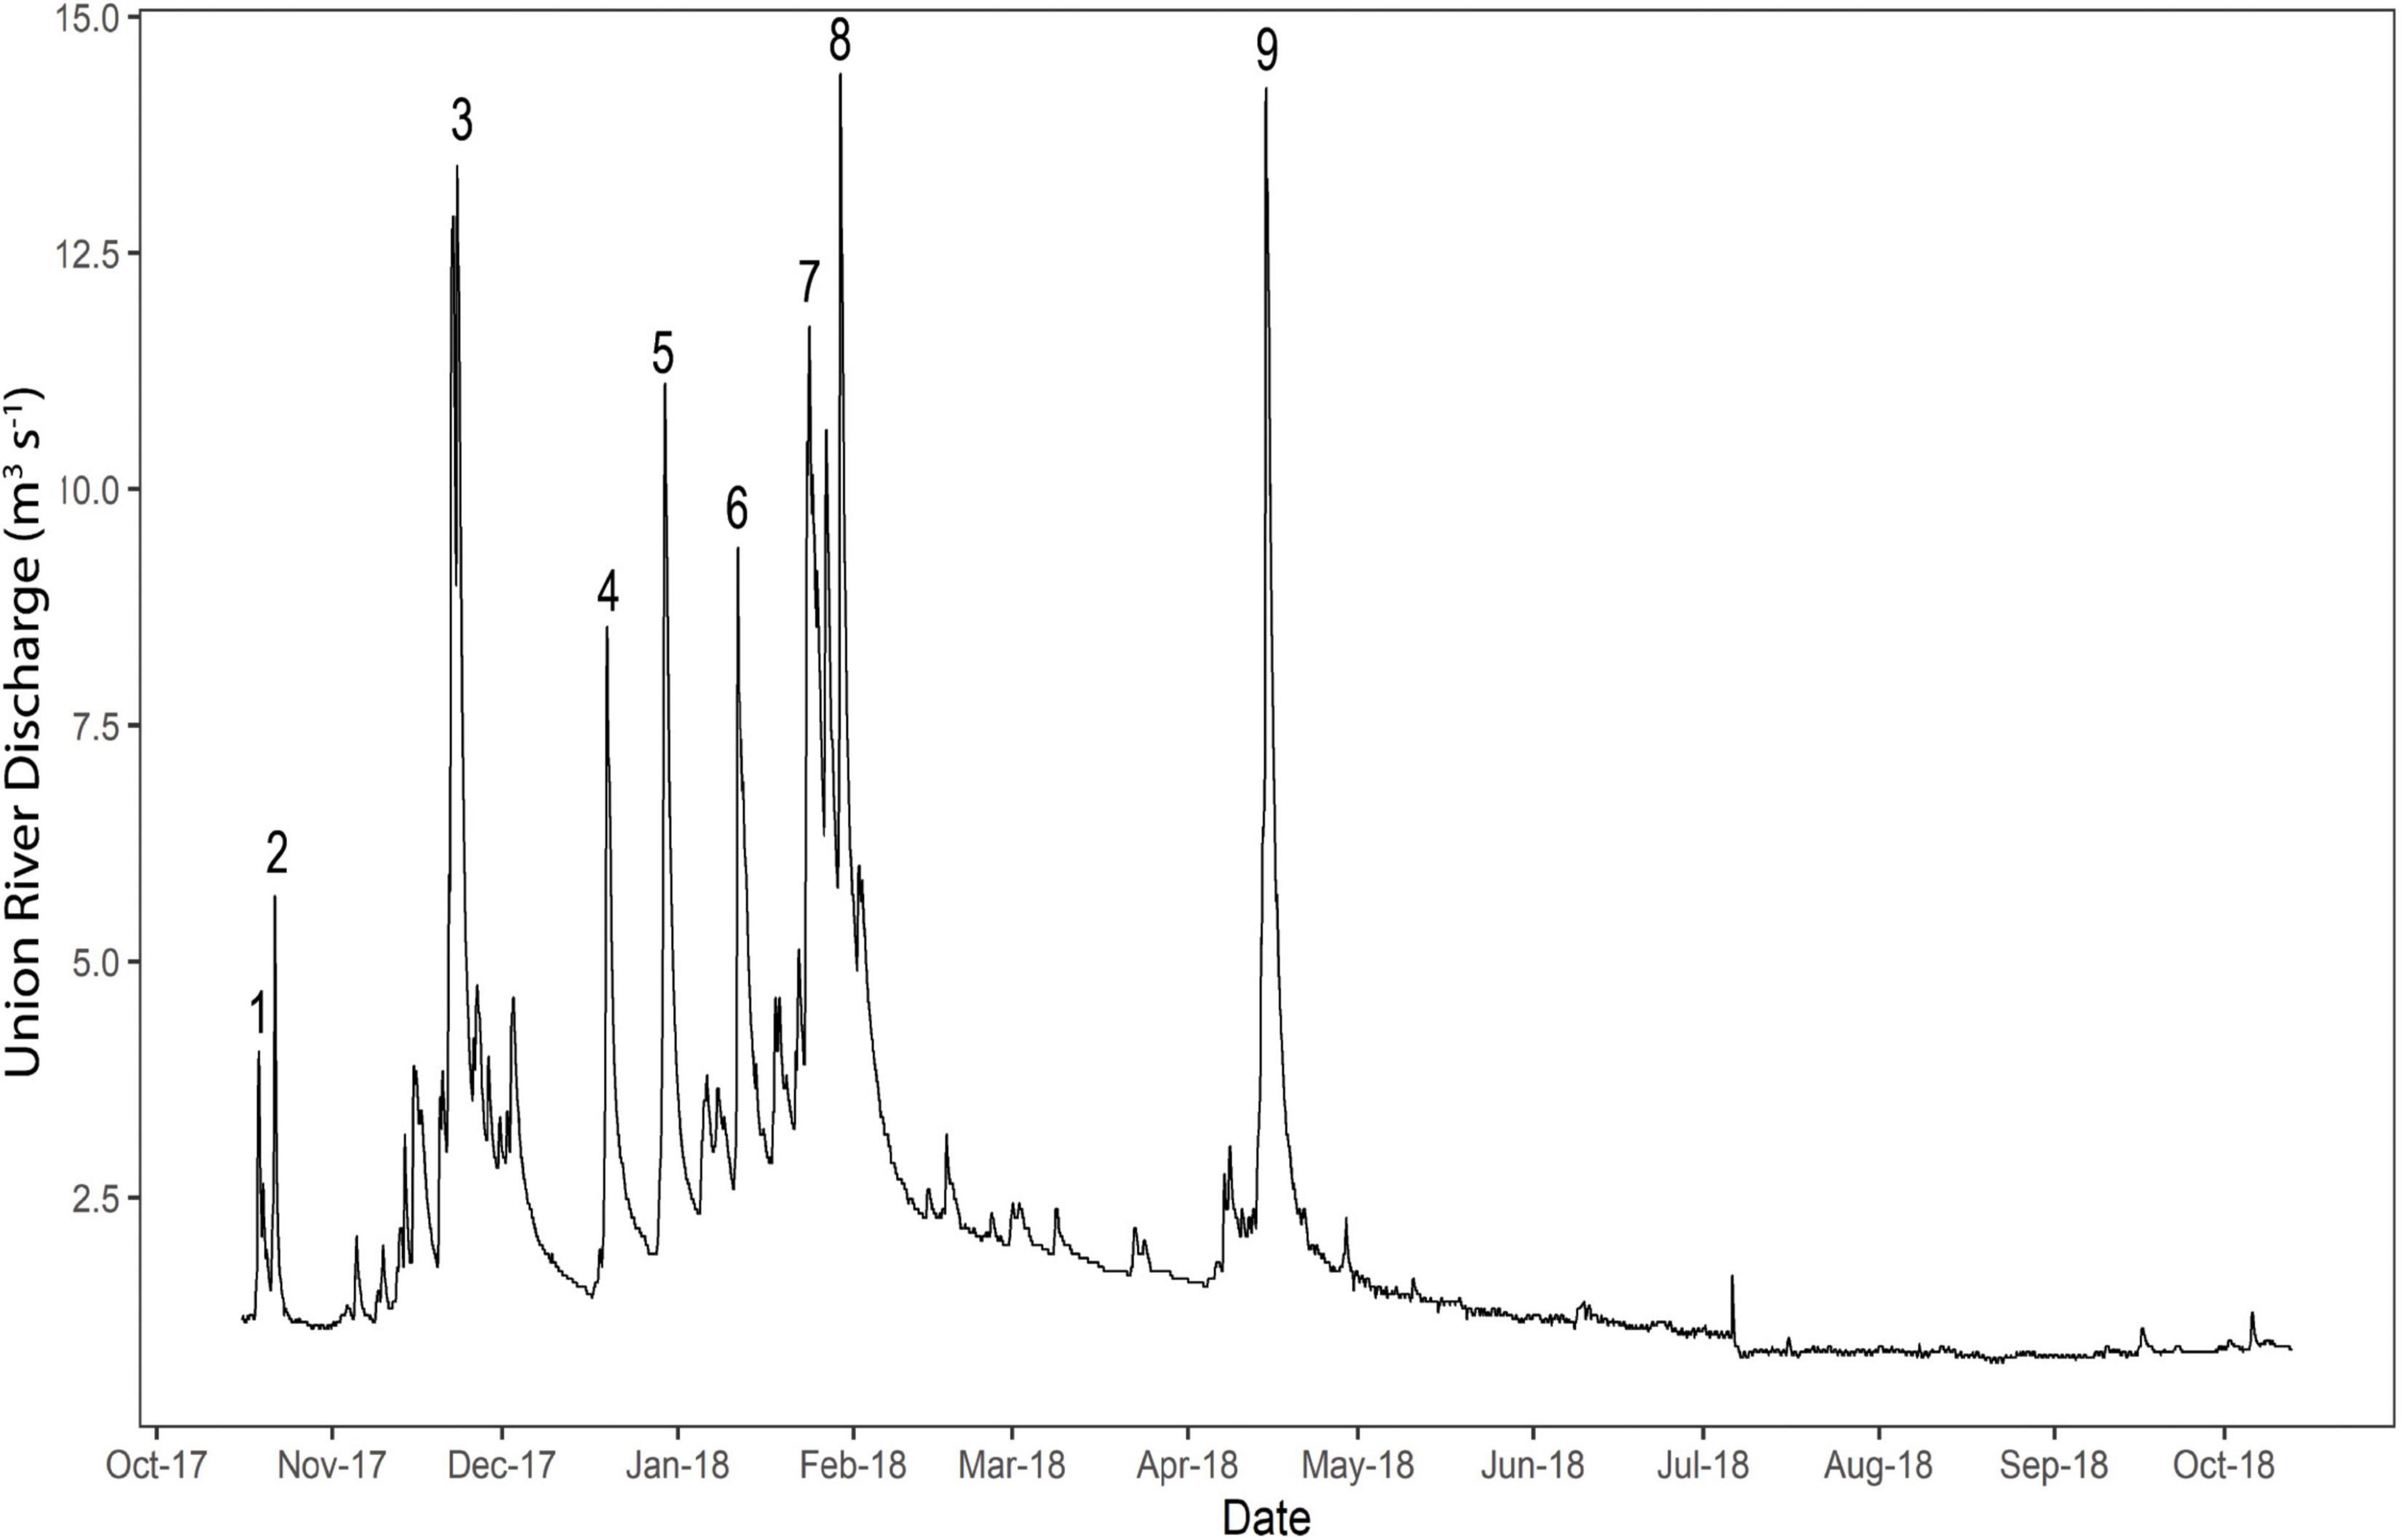
Figure 2. Time series of discharge corrected from Huge Creek discharge data (USGS, 2018) with the storm rainfall (1-9) identified.
We calculated the hysteresis index developed by Lloyd et al. (2016b) to quantify the hysteresis patterns and compare between storms. The HI ranges from -1 to 1, with negative values indicating counterclockwise hysteresis and positive values clockwise hysteresis. First, we normalized discharge and physico-chemical parameters:
Qi and Ci are the discharge and physico-chemical parameter values at time step i, Qmax and Qmin, and Cmax and Cmin, are the maximum and minimum discharge and physico-chemical values, respectively, in each storm. For each percentile of discharge (i.e., j, 10%, 20%, 25%, 30%, 40%, 50%, 60%, 70%, 75%, 80%, and 90%) in each storm we found the physico-chemical value on the rising (Cj,rising) and the falling (Cj,falling) limb. The hysteresis index at each discharge interval (HIj) was then calculated by subtracting the rising from the falling limb:
If data did not exist on both rising and falling limbs (e.g., if discharge did not return to baseflow level), then HIj was not calculated. Physico-chemical values were interpolated between two adjacent measurements if necessary (e.g., for HI10 on the rising limb, C10, rising may be interpolated between the physico-chemical values at percentiles 0.099 and 0.11 because there was no measurement at the exact 10% discharge percentile). The overall hysteresis index for each storm was calculated as the average of all HIj values for that storm. The HI values were compared to the visual analysis of hysteresis shape to determine the overall hysteresis type. For example, the HI for a figure-eight loop is often calculated as 0 due to canceling out of each loop. Visual analysis provided a confirmation of the HI values. The relationship between HI values and storm hydrological characteristics were assessed using Spearman’s rank correlation. We used Spearman’s rank correlation as the monthly averages did not meet the assumptions for linear regression. We tested HI values against the magnitude of the hydrographic peak of the storm (Qpeak), the duration of the storm (in days), the cumulative precipitation during the storm, the average river discharge during the storm, the cumulative precipitation from the end of the previous storm to the beginning of the storm (antecedent precipitation), and time since the previous storm (in days).
A seasonal pattern was observed for physico-chemical parameters in the Union River (see Supplementary Table 1 for monthly summary). From October through April (i.e., fall/winter/spring), physico-chemical parameters were characterized by greater extremes and greater variability than the period of May through September (i.e., summer) (Figure 3). pH, for instance, had frequent sharp declines throughout the period of October through April, but had much more consistent values the remainder of the year (Figure 3). This corresponded to an overall lower pH in fall/winter/spring months but higher variability; for instance, pH averaged 7.27 ± 0.14 in November 2017 and 7.52 ± 0.03 in August 2018 (Supplementary Table 1). Similarly, SPC sharply dropped in fall/winter/spring months and was both higher and less variable in the summer (Figure 3). In November 2017, SPC averaged 83.7 ± 26.5 μS cm–1; in August 2018, it averaged 112 ± 0.473 μS cm–1 (Supplementary Table 1). Turbidity also frequently peaked from October 2017 to April 2018 (Figure 2), but remained relatively constant throughout the summer, corresponding to higher standard deviations in the fall/winter/spring (240 ± 589 FNU in November 2017) than the summer (2.21 ± 1.16 FNU in May 2018). DO was relatively consistent on a monthly scale and showed similar levels of variation throughout the year, with average monthly values ranging from 88.7 to 94.9% atmospheric saturation (Supplementary Table 1). Average temperature followed a seasonal trend, rising during the summer (12.7 ± 0.9°C in August 2018) and decreasing during fall and winter (8.4 ± 0.9°C in November 2017).
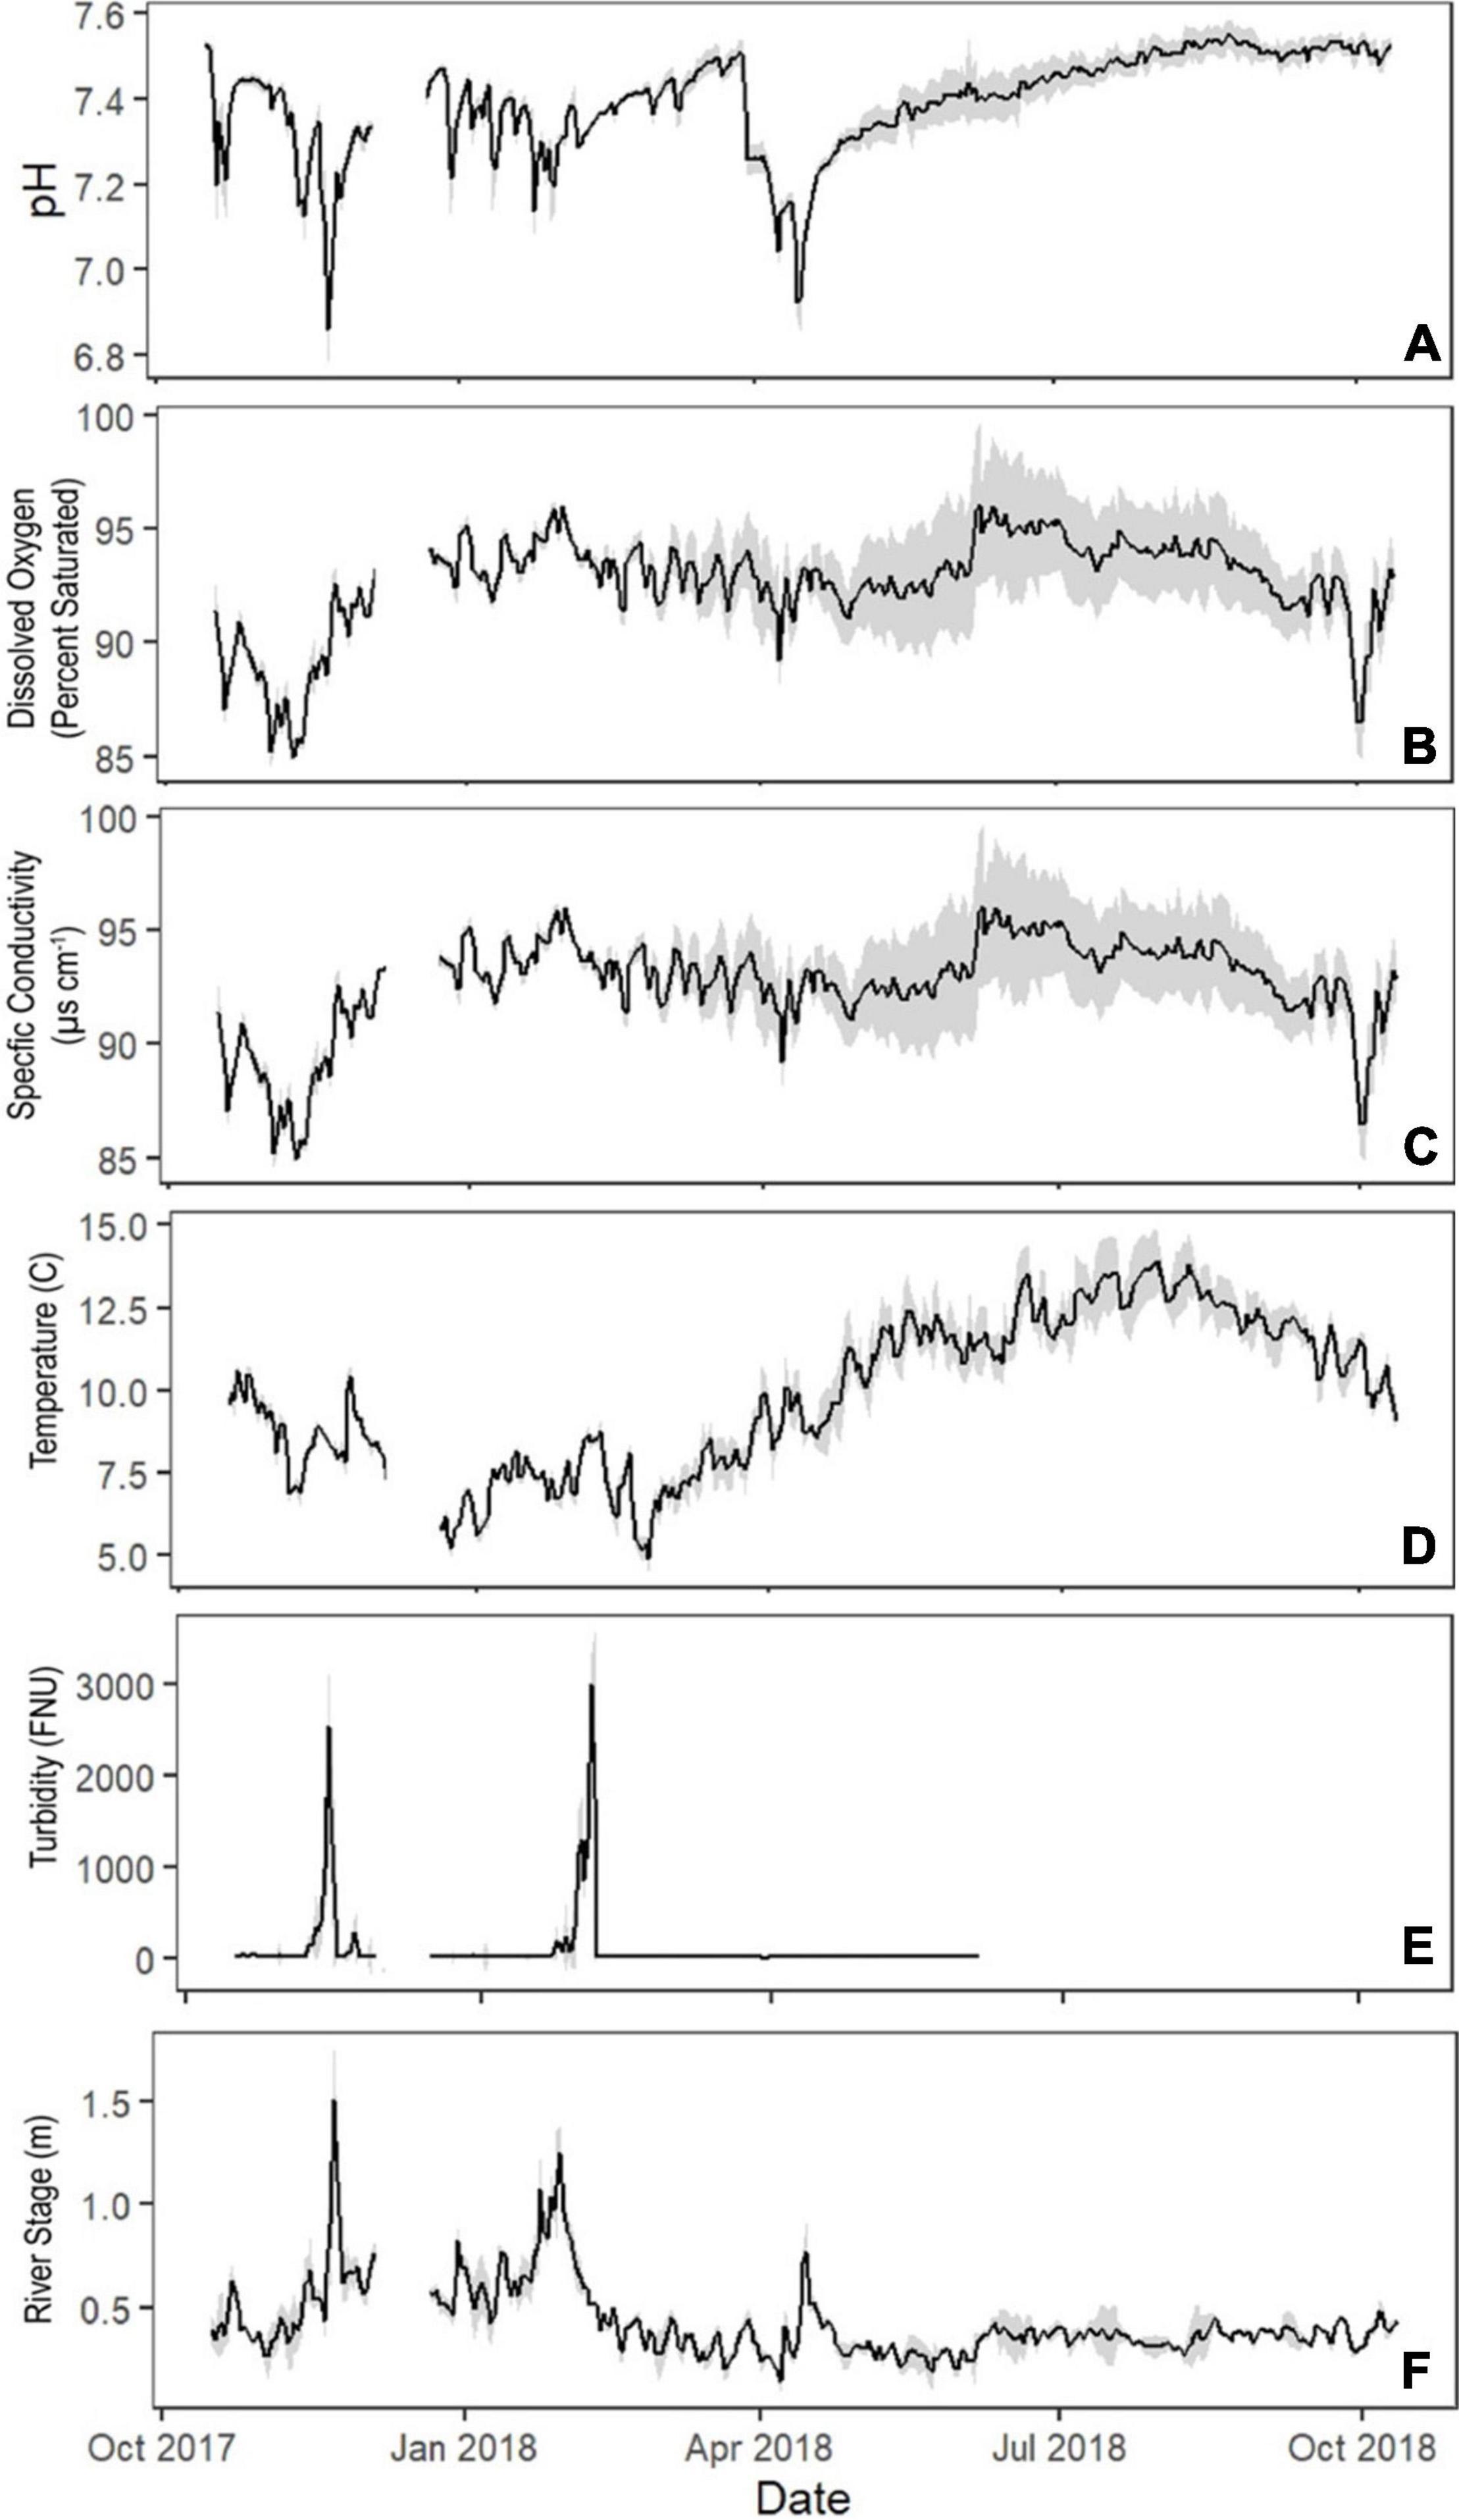
Figure 3. Time series of (A) pH, (B) dissolved oxygen (percent saturated), (C) specific conductivity (μS cm–1), (D) temperature (°C), (E) turbidity (FNU), and (F) river stage (m) over the course of the study period, October 16th, 2017 through October 12th, 2018. Blue background delineates distinct period of storm-driven parameter behavior (greater variability) over the course of the year. Measurements were taken every 5 min from October 16th to December 4th, 2017, and every 15 min from December 21st, 2017 to October 12th, 2018. Turbidity data above the detection range (4000 FNU) were removed, as well as turbidity data after June 15th, 2018 due to a sensor maintenance issue.
During the summer months, SPC, temperature, DO, and pH all followed primarily diurnal cycles linked to day/night hours with modifications to the sinusoidal trend caused by tidal variability in depth (Figure 4). SPC and temperature generally peaked from 16:00 to 18:00 in the summer (Figure 4), whereas DO and pH generally peaked 1-2 h prior (Figure 4). DO and pH both had slight increases overlain on the day/night trend associated with peak high tide depths. Turbidity showed little variability in the summer due to either day/night or tidal cycles.
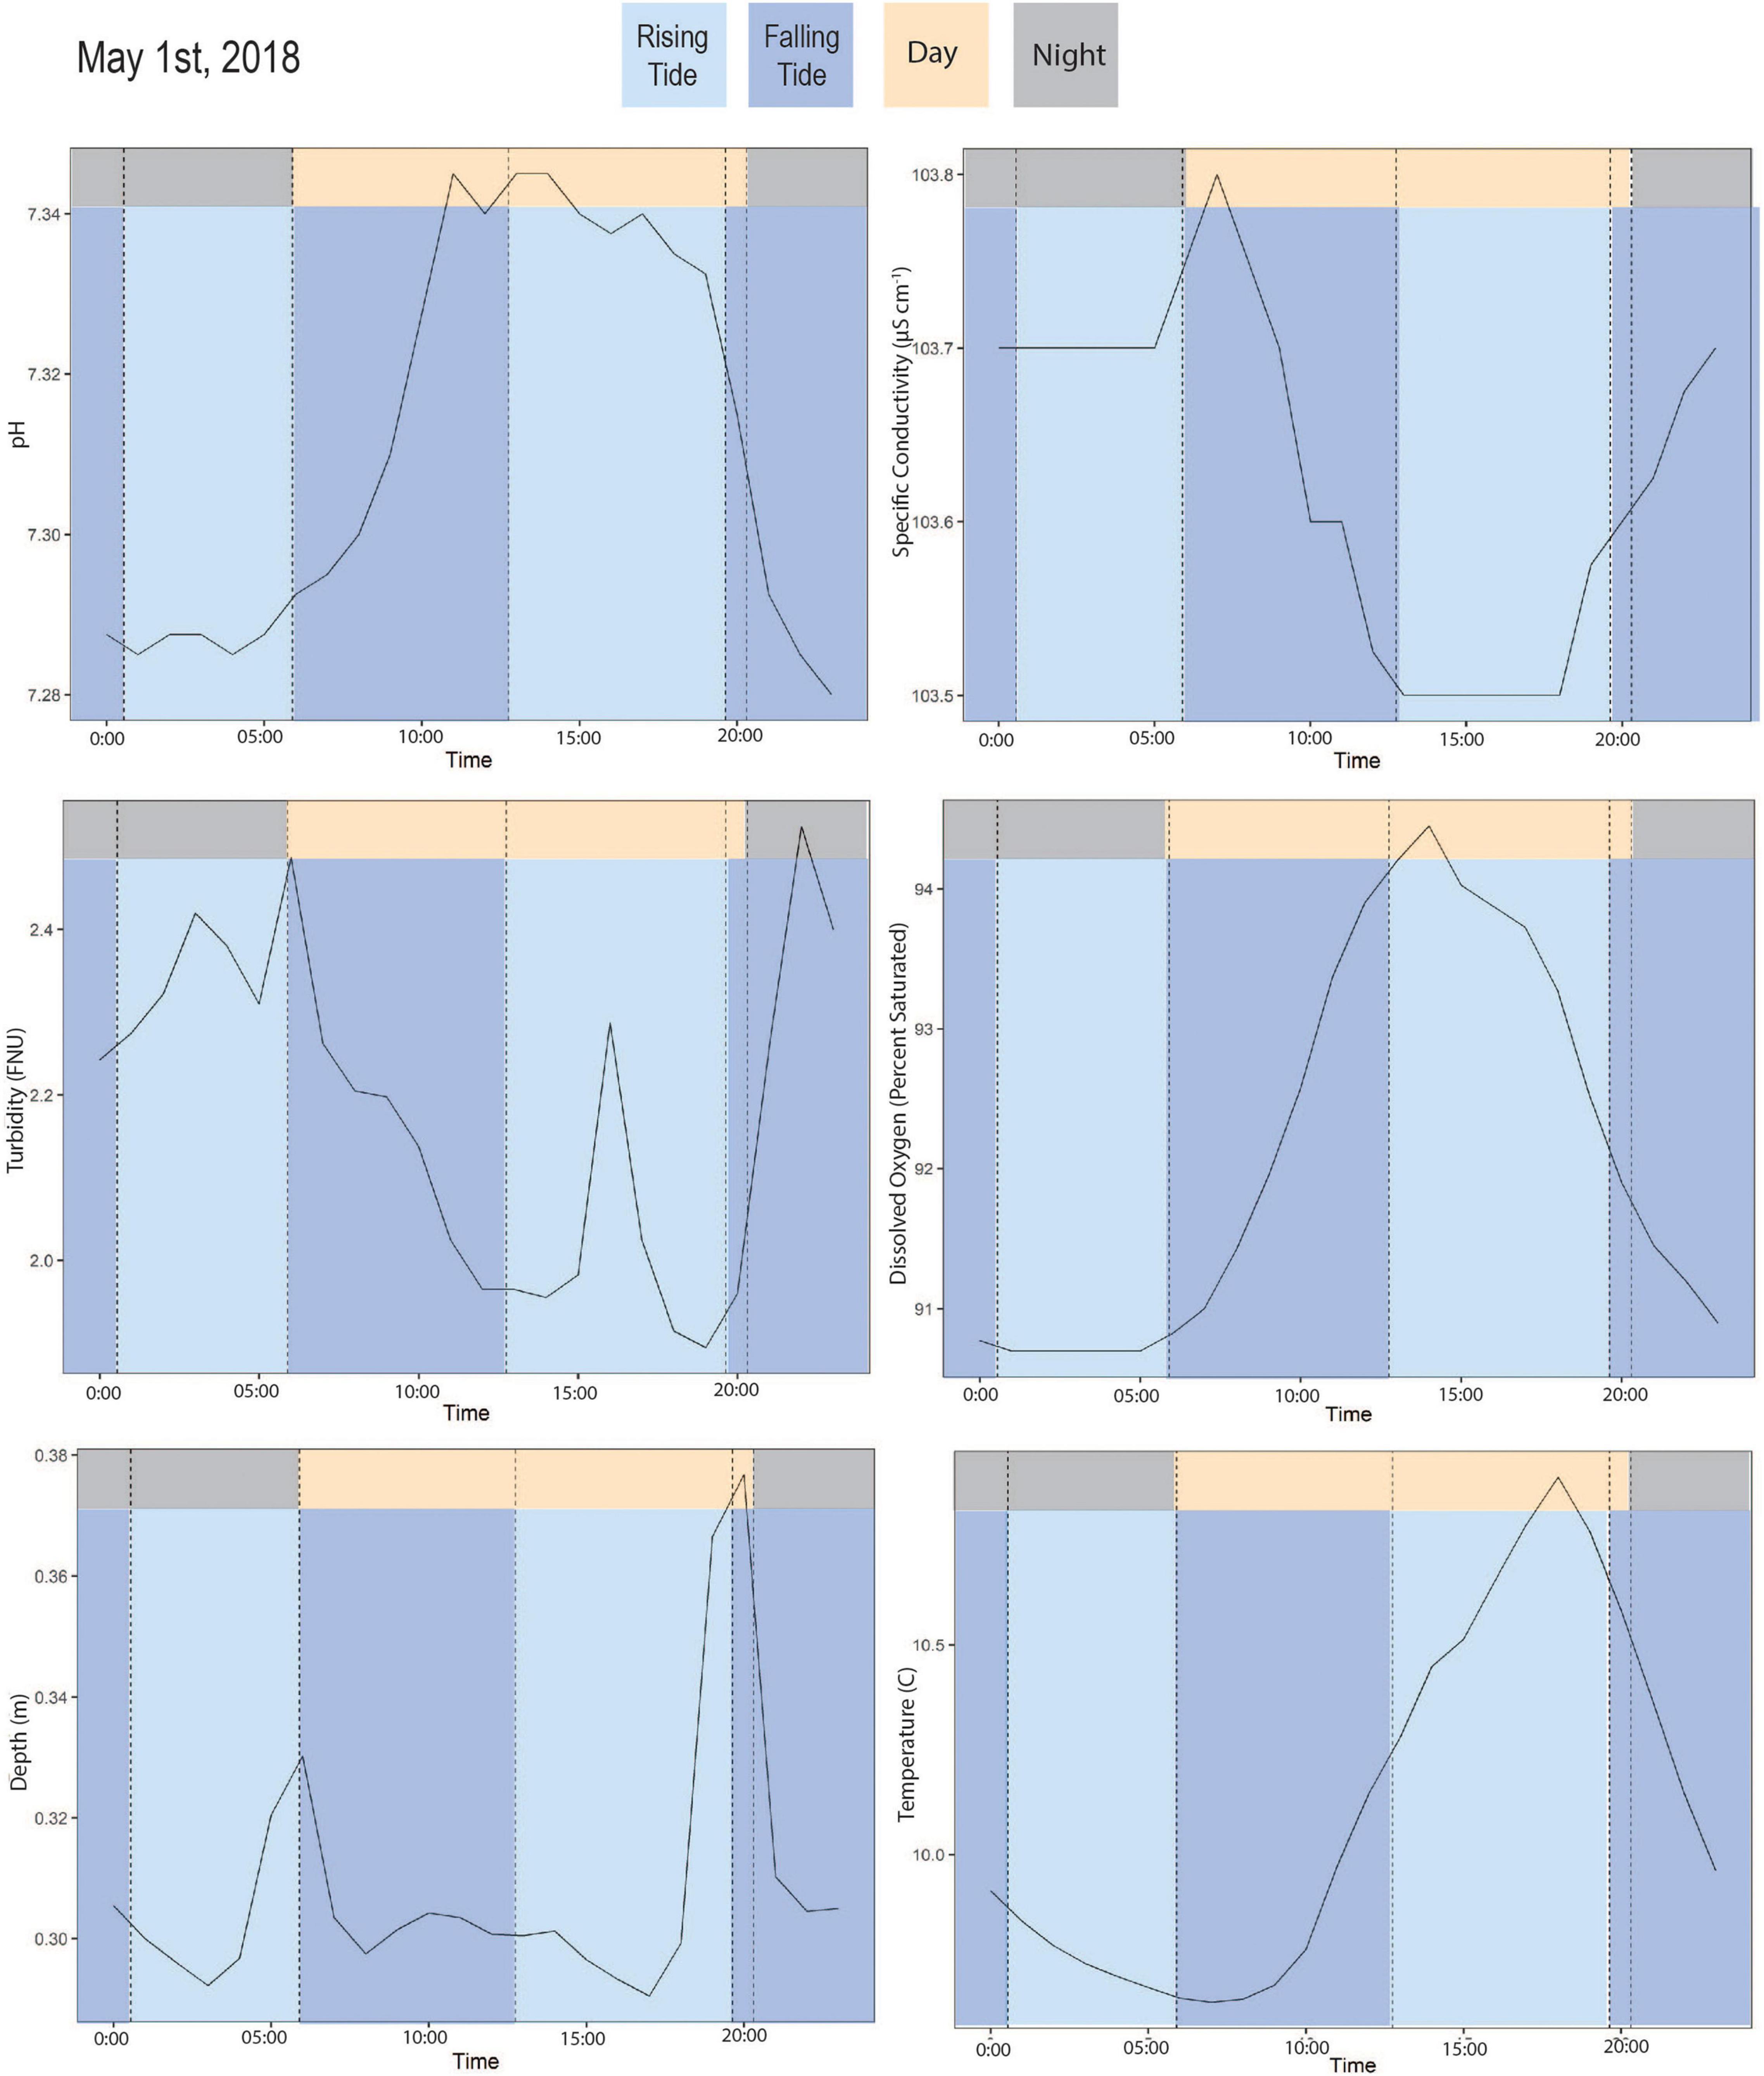
Figure 4. Time series of example summer day (May 1st, 2018) averaged by hour of pH, specific conductivity, dissolved oxygen, turbidity, temperature, and depth. Colors indicate rising tide and falling tide (determined by timing of high and low tide) and day and night (determined by sunrise and sunset time).
Hourly averages of physico-chemical parameters were all significantly correlated with each other (p < 0.001); however, most of the correlations were very weak (Supplementary Table 2). Of the parameters most strongly linked, SPC and depth were negatively correlated (R = −0.75, p < 0.001) and SPC and pH were positively correlated (R = 0.58, p < 0.001).
The average depth at the sensor location was 0.67 m throughout the study period with a minimum and maximum depth of 0.26 m and 2.03m, respectively. Average river discharge was 2.08 m3 s–1. Assuming an average channel width of 28.5 m between the sensor location and the river mouth and a constant depth since bathymetric data is unavailable, we conservatively estimate a water transit time of 6 h between the sensor and the river mouth; using a width of 7 m (i.e., at the sensor’s location) reduces the transit time to 1.5 h. These values are rough estimates and are presented for hydrodynamic context.
Salinity in surface waters measured at high tide during one sampling campaign on 3/29/2018 ranged from 0 psu where the sensor was located to 0.4 psu roughly midway to the river mouth (1.4 km downstream of the sensor) and 12.9 psu at the river mouth (2.3 km downstream of the sensor location). pH values also increased along this reach from 6.36 at the sensor, to 7.02 midway to the mouth, to 7.78 at the river mouth. Average salinity measured at the Twanoh buoy in Hood Canal on the same day was 24.4 psu with minimum and maximum values of 19.5 psu and 29.6 psu.
pH values in the Hood Canal estuary (Twanoh Buoy), 14.3 km offshore from the Union River mouth, followed similar temporal trends as the Union River (Figure 5). For instance, pH in both the Union River and Hood Canal dropped in late October and late November 2017, generally increased from February through mid-March 2018, and declined again in April 2018. On average throughout the year, pH in the Union River was 0.46 units lower than observations at the Twanoh Buoy, in agreement with the increasing trend observed during our sampling campaign along the lower river towards the estuary. Daily average pH in the Union River and Hood Canal were significantly correlated, though the relationship was not strong (R = 0.47, p < 0.001) (Figure 5). However, this correlation fluctuated seasonally (Supplementary Table 3). While from October 2017 through February 2018 there was a relatively consistent positive correlation (with R = 0.311−0.660, p < 0.001), there was an abrupt de-coupling in the relationship in March and April 2018, with no correlation (R = −0.028, p = 0.44 in March 2018 and R = −0.110, p = 0.095 in April 2018) (Supplementary Table 3).
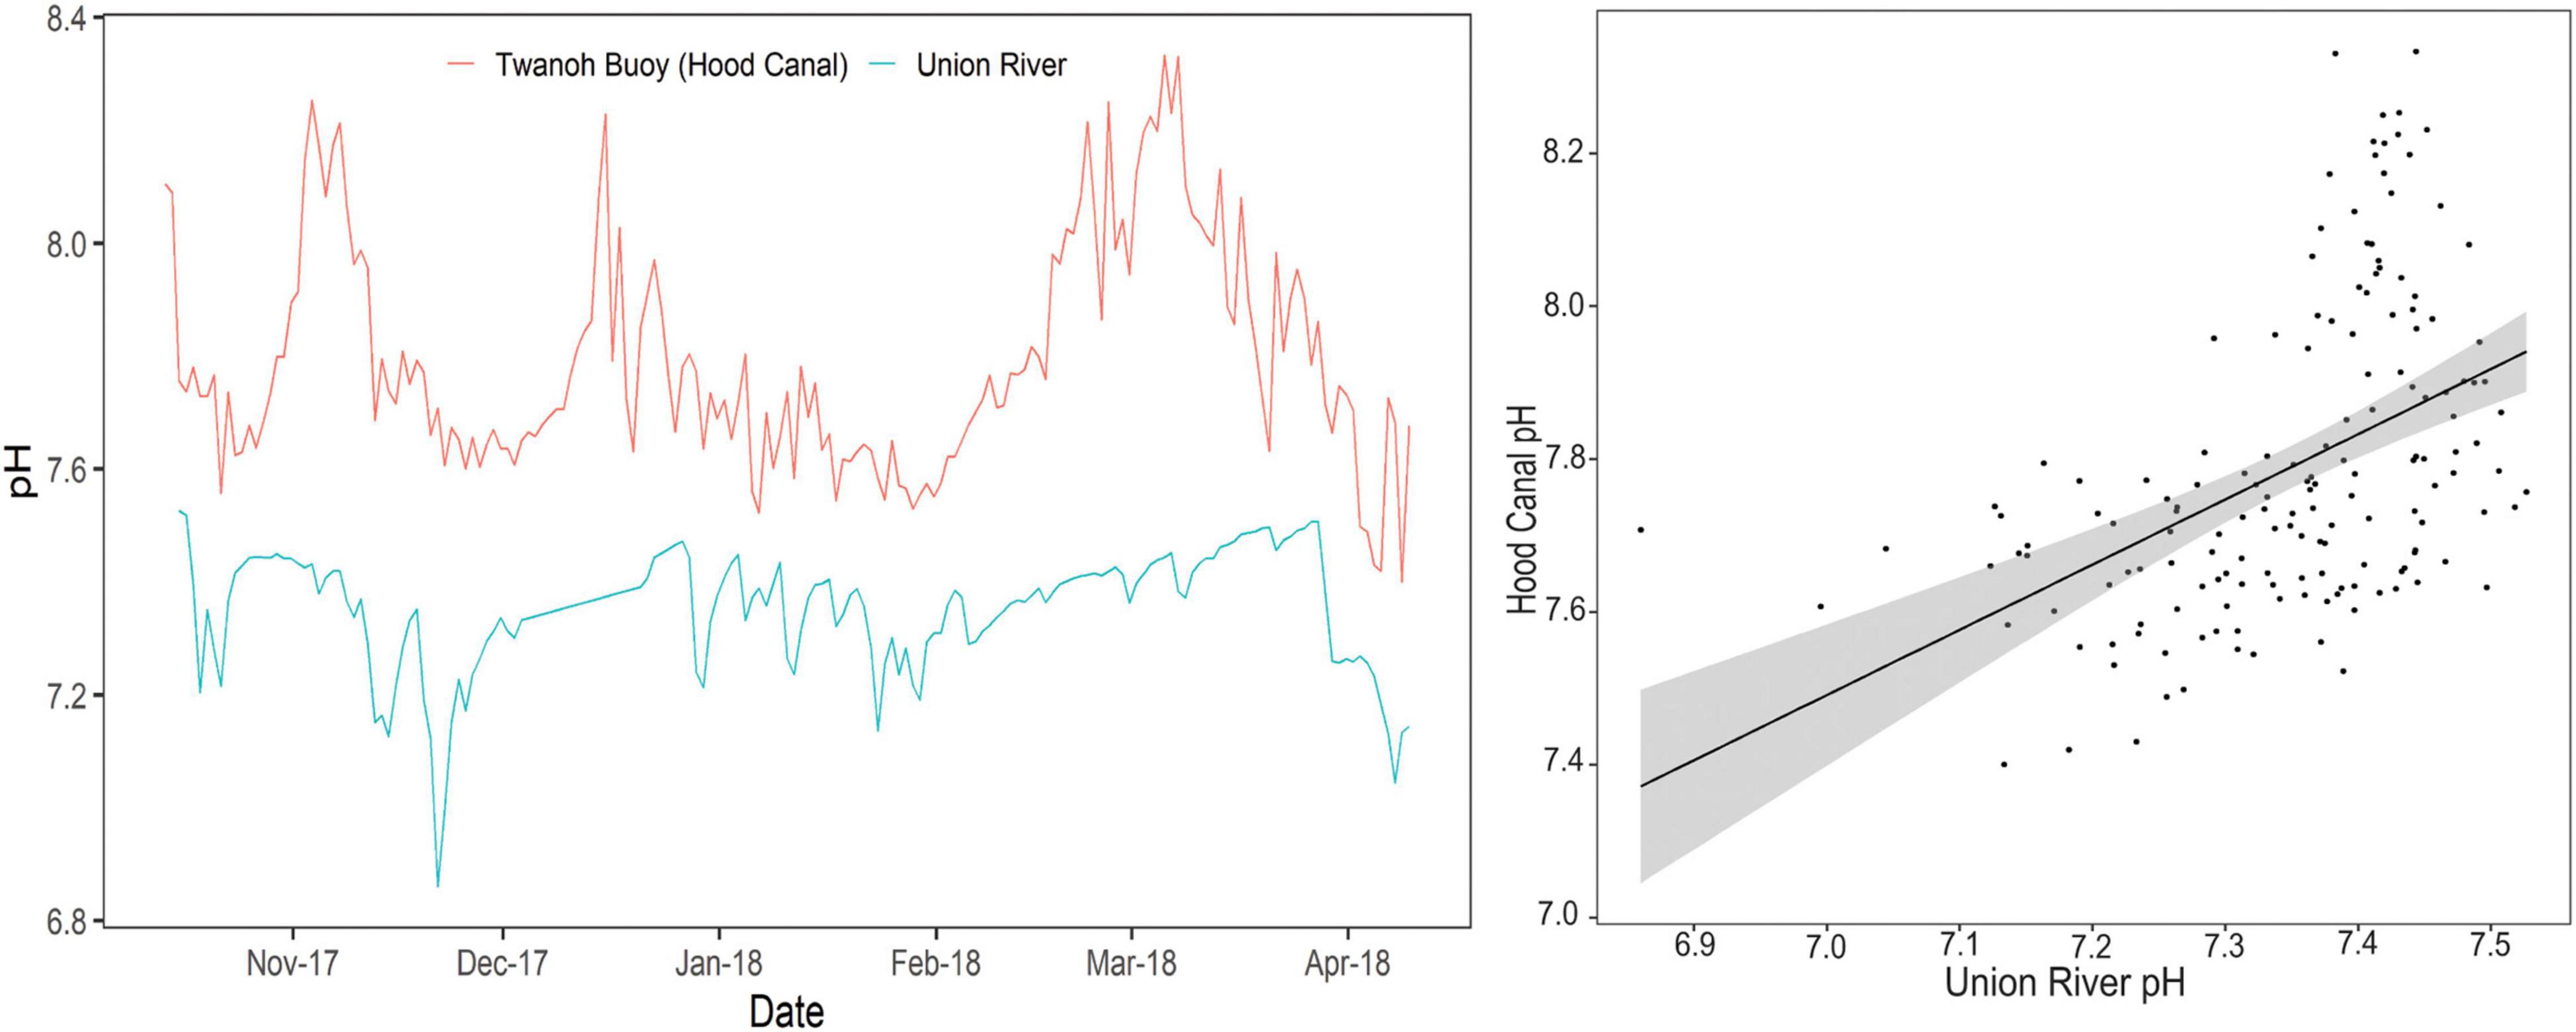
Figure 5. (Left) Daily average pH in the Union River and in the Hood Canal measured at the Twanoh Buoy by (ORCA-UW, 2018) from October 13th, 2017 to April 9th, 2018. Date is displayed as Month-YY. (Right) Daily average pH in the Union River compared to the Hood Canal (r = 0.47, p < 0.001).
Overall, for certain parameters intracycle (i.e., tidal) variability was evident in the summer but was overshadowed by intercycle variability the remainder of the year (see Table 1 for complete intracycle and intercycle variability values and ratios). Intercycle variability of pH and SPC was lower in May through October 2018, and likely linked to day/night cycles during this period, compared to October 2017 through April 2018 when intercycle variability is most likely due to storm rainfall (Figure 3). Intracycle variability of pH stayed relatively constant throughout the year (ranging from 0.010 to 0.042), while intercycle dropped from a high of 0.141 in November 2017 to a low of 0.017 in September 2018 (Table 1). The drop in intercycle variability in the spring/summer corresponded to an increase in the ratio of intracycle:intercycle variability during this period, with a ratio greater than 1.0 (i.e., tidally dominant) from June through September 2018 (Figure 6). DO followed a similar pattern, with the intracycle:intercycle variability rising to above 1.0 in March 2018 and from May through August 2018. Though intercycle variability of SPC followed a similar pattern to DO and pH-dropping during the summer-the ratio remained below 1.0 throughout the entire year (Table 1 and Figure 6). Turbidity had a less consistent pattern, with the intra:inter cycle ratio reaching above 1.0 in December 2017, February 2018, and June 2018 (Figure 6 and Table 1).
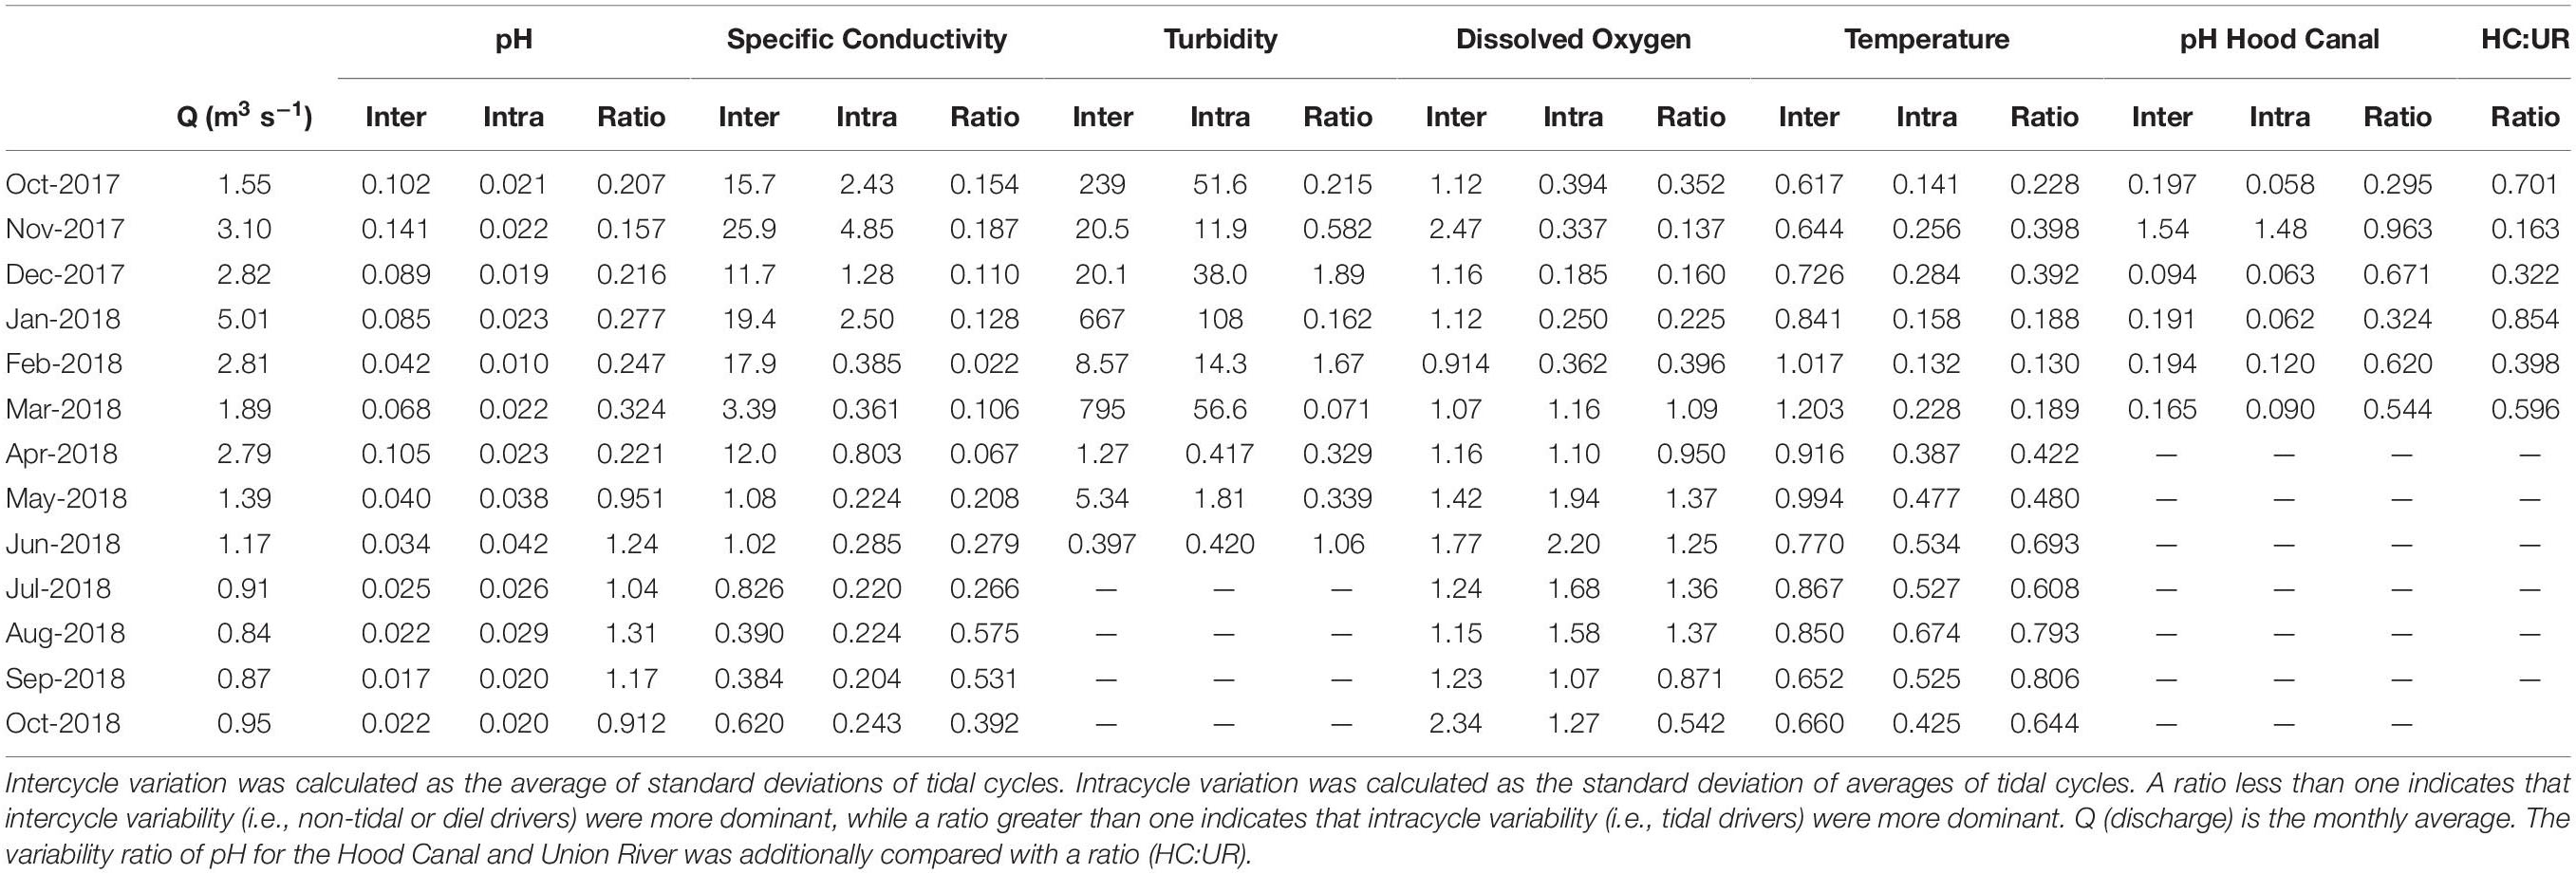
Table 1. Intercycle and intracycle variability, and the ratio of intra:interycle variability for all study months.
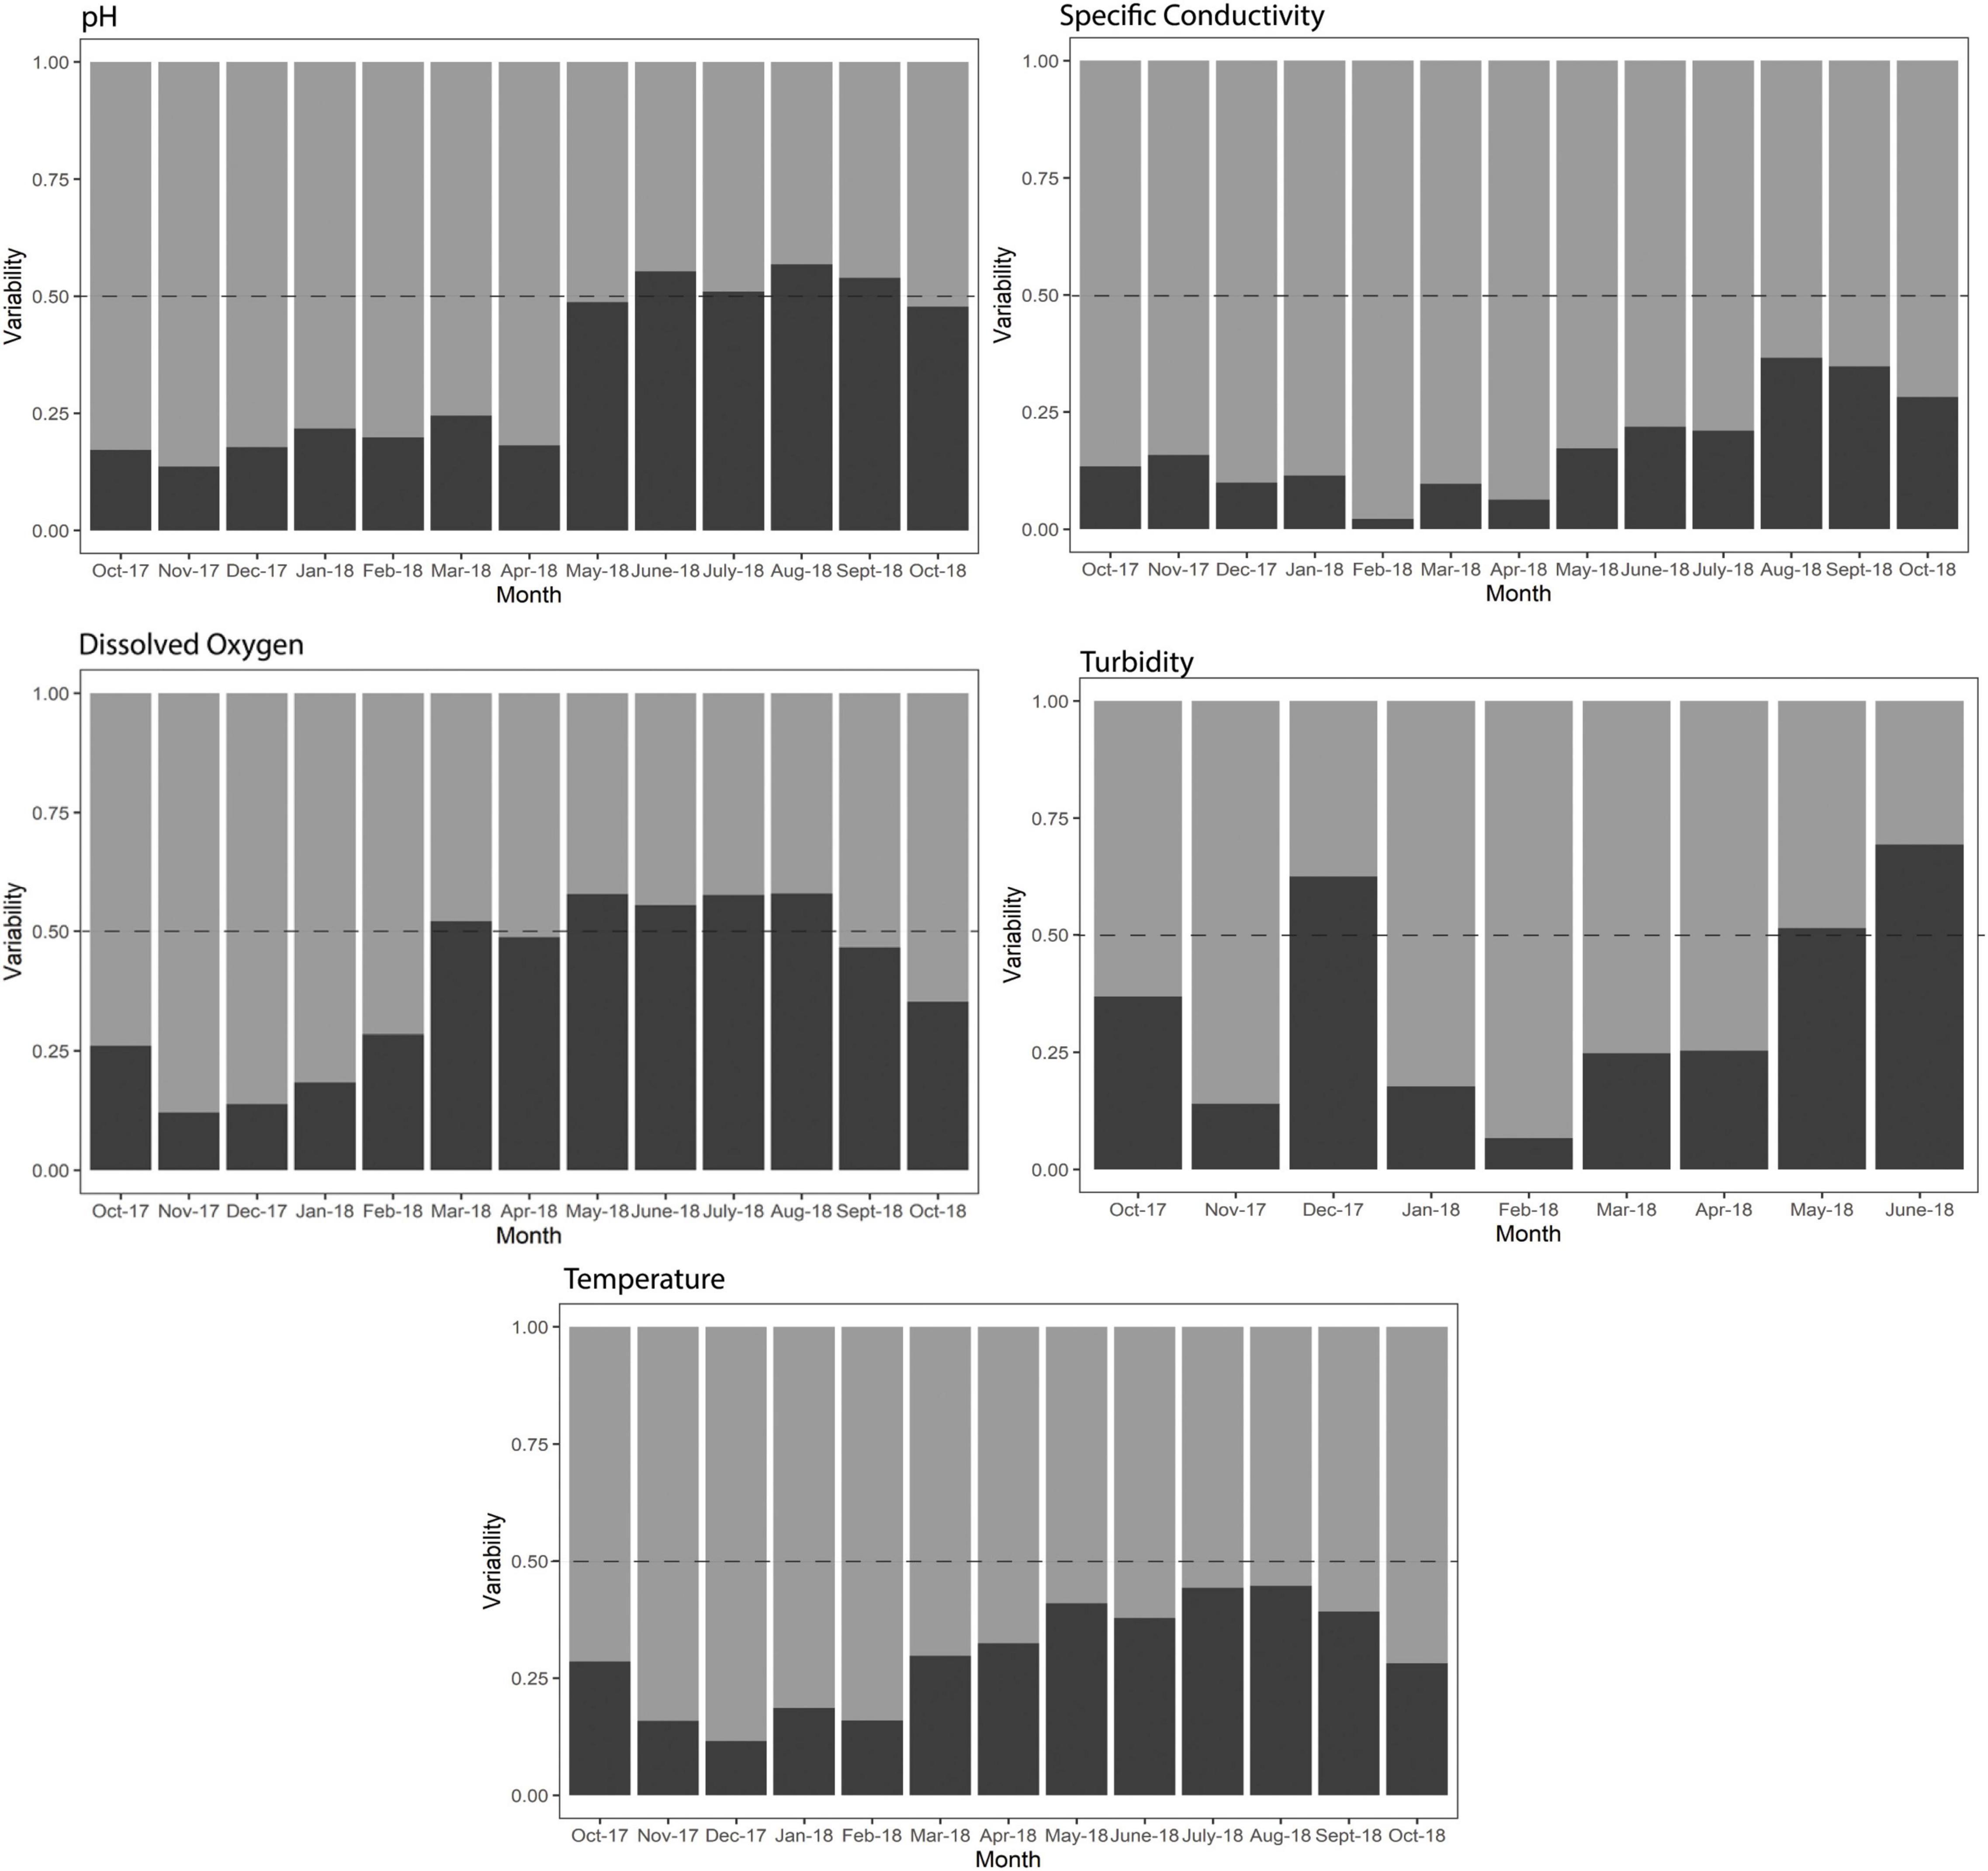
Figure 6. Monthly intercycle (i.e., non-tidal) and intracycle (i.e., tidal) variability for pH, turbidity, dissolved oxygen, specific conductivity, and temperature in the Union River shown as relative proportion for each month. The dashed line indicates a relative proportion of 0.50: i.e., intra-and intercycle variability for that month were equal. Intracycle variability >0.5 (above the dashed line) indicates that tidal variability was dominant, whereas intracycle variability <0.5 (below the dashed line) indicates that non-tidal variability was dominant. Intracycle variability is calculated as the monthly average of tidal cycle standard deviations for each parameter. Intercycle variability is calculated as the monthly standard deviation of tidal cycle mean.
Average monthly discharge of the Union River was strongly negatively correlated to the monthly ratio of intra:inter cycle variability of pH (ρ = −0.81, p = 0.001), specific conductivity (ρ = −0.79, p = 0.002), temperature (ρ = −0.82 p < 0.001), and dissolved oxygen (ρ = −0.75, p = 0.004) (Supplementary Table 4). Overall, higher river discharge (due to higher precipitation during storms) was associated with a decline in the relative impact of tidal cycles on these physico-chemical parameters. Average monthly discharge was not correlated to the ratio for turbidity (ρ = −0.63, p = 0.076).
pH in Hood Canal consistently had higher intracycle (i.e., tidal) variability and variability ratio values for the period of overlapping data (October 2017—March 2018) (Table 1). During October 2017, January 2018, and March 2018, variability ratio values between the Hood Canal and Union River were most similar, with a ratio of the Hood Canal to Union River of 0.7, 0.85, and 0.59, respectively (Table 1).
Overall, nine storm rainfall events (i.e., “storms”) were identified in the hydrograph (Figure 2). Storm 3 was excluded from hysteresis analysis as it took place during a gap in our sonde deployment. Table 2 shows a complete summary of the storms, and Figure 7 provides some visual examples of hysteresis. Of the eight storms we analyzed, two storms exhibited counterclockwise hysteresis of pH and one storm showed clockwise hysteresis (Table 2). The remaining five storms showed no hysteresis (Table 2). During Storm 9, for instance, pH was drastically lower on the rising than the falling limb of the storm (Figure 7). Storms 1 and 5 showed clockwise hysteresis of turbidity, and storm 7 had counterclockwise hysteresis (Table 2). SPC showed counterclockwise hysteresis in storms 1 and 3, clockwise hysteresis in storms 2, 5, 6, and 8, and figure-eight hysteresis in storm 9 (Table 2). There was clockwise hysteresis of DO in storm 3, counterclockwise hysteresis in storms 5-8, and figure-eight hysteresis in storms 1-2 (HI = 0.199 and −0.231, but visual analysis showed figure-eight loops) (Table 2).
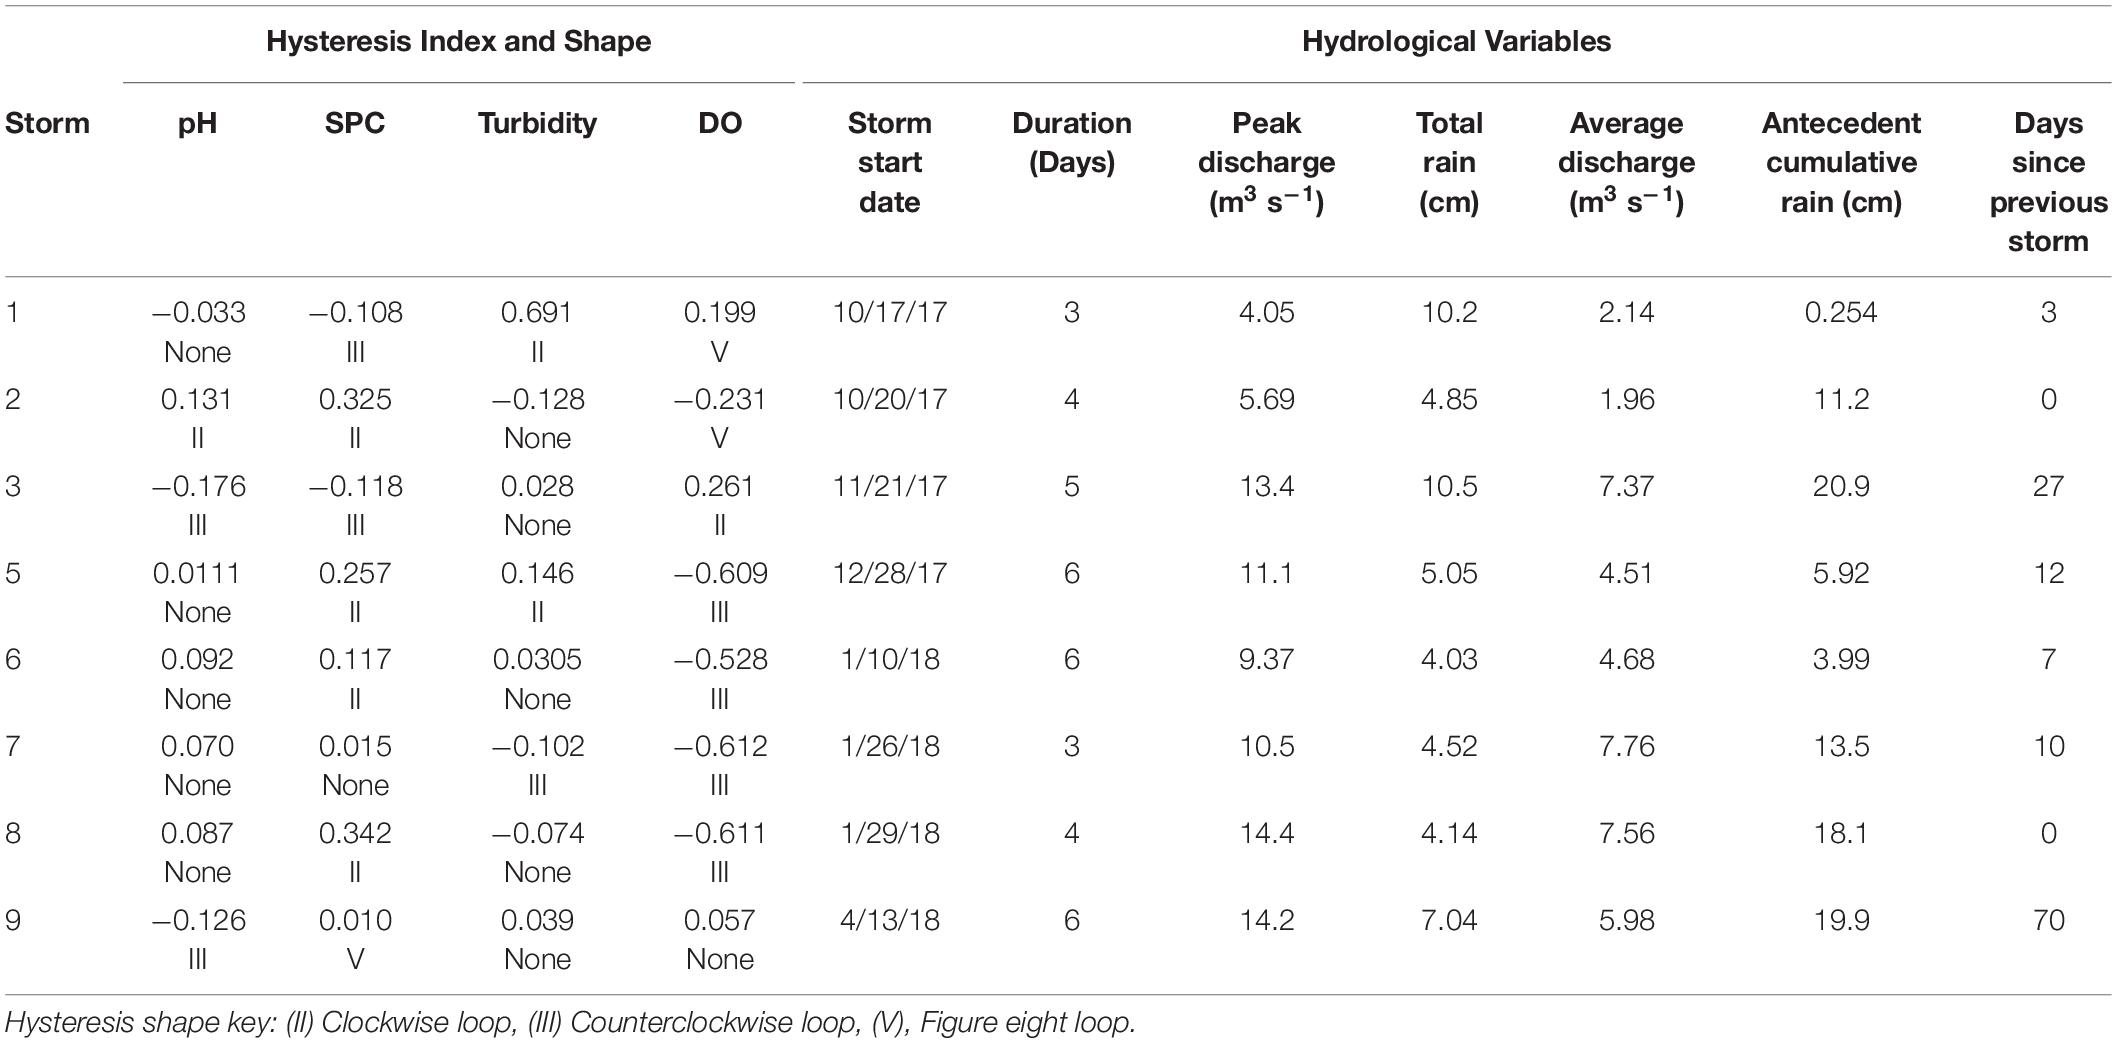
Table 2. Hysteresis Index and hysteresis shape for pH, specific conductivity (SPC), and turbidity and hydrological variables for each storm.
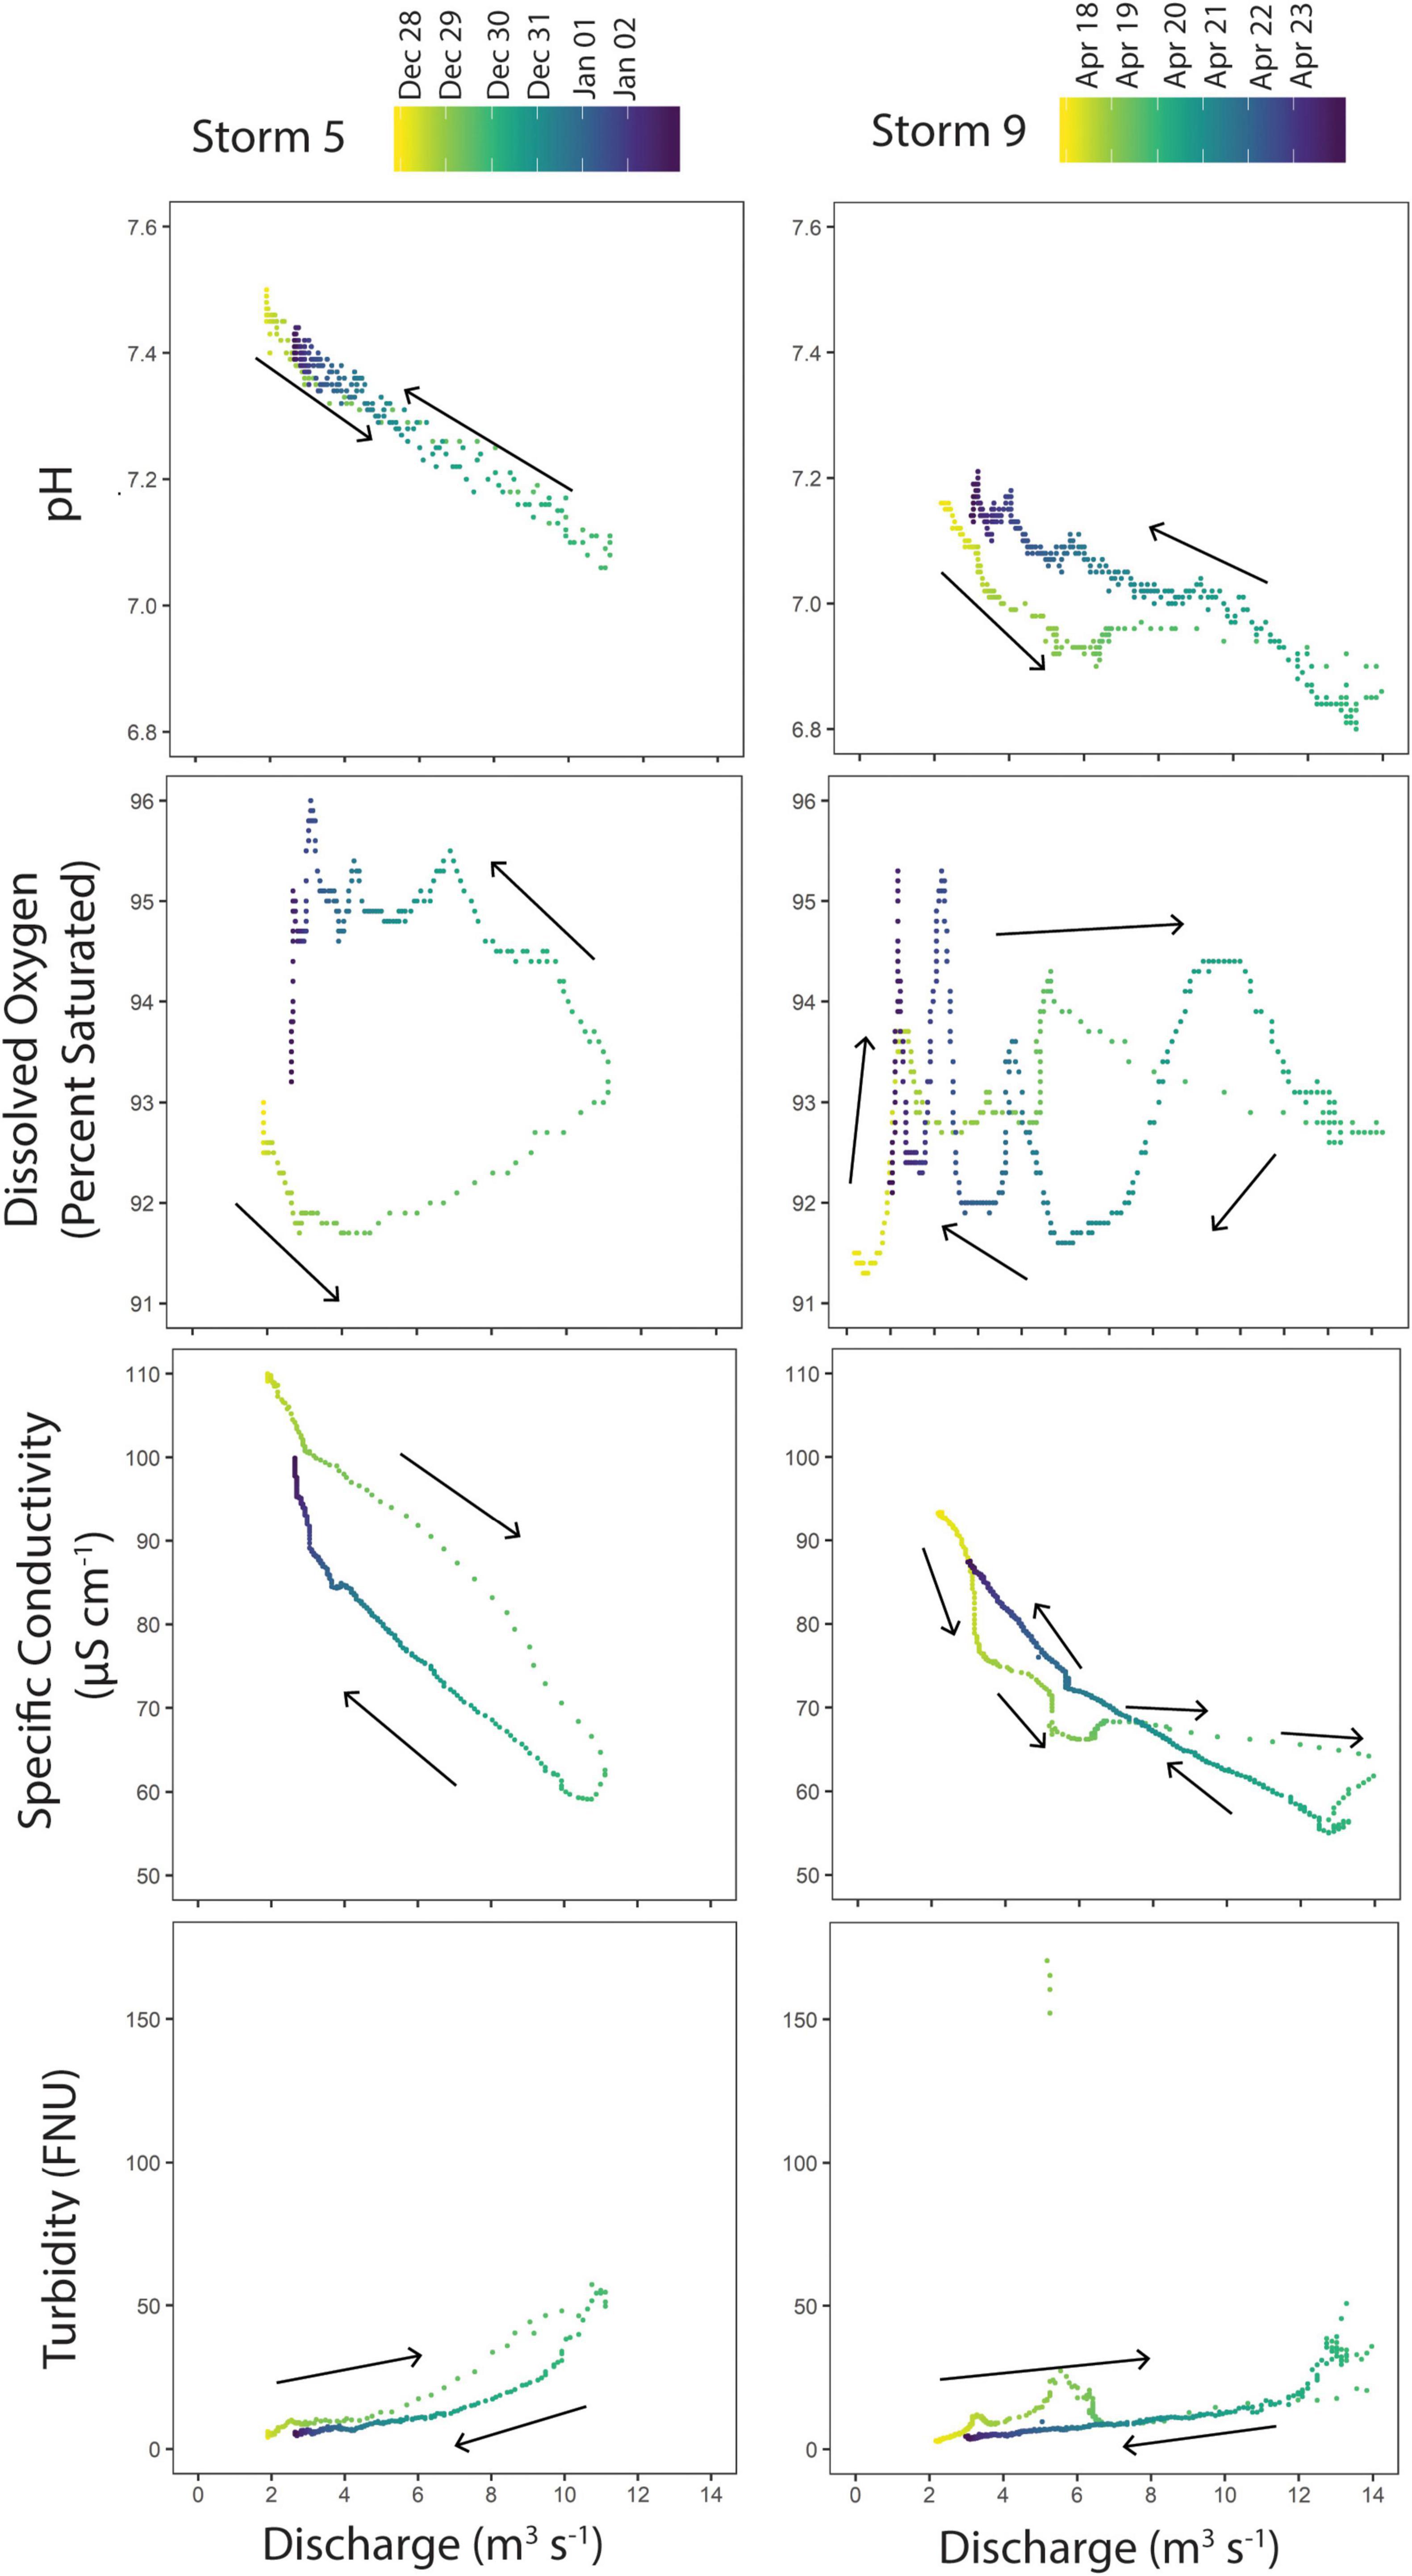
Figure 7. Examples of hysteresis observed for pH, dissolved oxygen, specific conductivity, and turbidity for two storms on the Union River. Two example storms are shown to demonstrate different types of hysteresis seen during the 2017–2018 study.
There was not a relationship between most hydrological variables and hysteresis index values (Supplementary Table 4). However, total rain during the storm was negatively correlated to SPC (ρ = −0.74, p = 0.030) and positively correlated to the hysteresis index of DO (ρ = 0.79, p = 0.028). Hysteresis index of pH was also negatively correlated to total rain during the storm (ρ = −0.83, p = 0.01) and to the number of days since the previous storm (ρ = −0.77, p = 0.027) i.e., the longer the time since the previous storm and the more rain during a storm, the stronger the counterclockwise hysteresis in pH.
We observed two distinct periods in water physico-chemistry throughout the course of the year. During fall/winter/spring when storm rainfall events were prevalent, water quality changed at much greater magnitudes, with more spikes and steep declines during storm rainfall (Figure 3). For pH and SPC, this was reflected in both (1) greater monthly variability during this period, and (2) lower monthly averages in these parameters (Supplementary Table 1). By contrast during the summer, the pattern was reversed: there was much less variation in pH and SPC and both parameters were on average higher. Turbidity similarly experienced large drops and spikes during the fall/winter/spring period and more consistent, low values during the summer.
This seasonality was driven by shifting relative influence of tidal and diurnal (day/night) drivers compared to landward hydrologic forces (i.e., rainfall) on this stretch of the Union River. During the summer, variability in river physico-chemistry was driven by tidal hydrodynamics and diurnal cycles; however, during the fall, winter, and spring, variability was strongly driven by storm hydrology (i.e., increased precipitation and river discharge) that overwhelmed any tidal and solar influence on the system.
The seasonal shift is evidenced by the pattern of intra- (i.e., tidal) and intercycle (i.e., non-tidal) variability values over the course of the year. The ratio of intra- to intercycle variability increased during the summer months, indicating a greater relative impact of tidal variability on water physico-chemistry. This ratio increase was driven by a decline in intercycle variability during the summer, as intracycle variability values remained relatively constant throughout the year. For instance, intercycle variability of pH decreased from 0.102 in October 2018 to 0.022 in August 2018 while intracycle (i.e., tidal) variability remained constant at 0.021 in October 2018 and 0.029 in August 2018, corresponding to a rise in the intra:intercycle ratio from 0.207 to 1.33 (Figure 6 and Table 2). This shift is linked to the seasonal pattern of storm rainfall and associated river discharge, as demonstrated in the negative correlation between river discharge and the variability ratios of pH, SPC, and DO. Months with higher river discharge had lower relative tidal influence. Overall, high river discharge from storm rainfall drove variability in physico-chemistry during fall/winter/spring; as storm rainfall receded in the summer, lower river discharge diminished watershed geochemical inputs and allowed the influence of tides and diurnal cycles to predominate.
During summer months, these various tidal and diurnal influences on river physico-chemistry therefore became more apparent as high storm-driven freshwater discharge dropped. For instance, summer increases in SPC during the afternoon (Figure 4) indicate that base flow in the Union River is likely influenced by evapotranspiration, reducing flow and concentrating ions in the river during the hottest hours of the day (Lundquist and Cayan, 2002). Higher average and less variable SPC during summer months (Supplementary Table 1) further reflect a more stable, base river flow during this period compared to the more erratic pulses and drops from storm rainfall during the remainder of the year (Figure 3). Additionally, increased average DO and pH during summer vs. winter months (Supplementary Table 1) are likely linked to enhanced primary productivity relative to respiration during daylight hours (Hall and Hotchkiss, 2017), while slight increases in both parameters at peak high tide (Figure 4) could be related to either primary production inputs from the estuary or perhaps decreased river flow, which has been shown to suppress respiration and potentially enhance primary production in the tidal Amazon River (Ward et al., 2018). Likewise, in smaller tidal rivers CO2 levels have been shown to increase (associated with decreased pH) during low tide due to inputs from the riparian zone that are suppressed at high tide (Atkins et al., 2013). Similarly in the Union River, the greater relative impact of tides on pH variability in the summer (Table 2) may be due to changes in riparian CO2 inputs that only are apparent with the decreased freshwater flow.
Storm rainfall events similarly dominated turbidity patterns during the fall/winter/spring period, causing more frequent and greater magnitude spikes, while turbidity dropped to low, more stable values during the summer (Figure 3). This corresponded to high intercycle variability during these months and a rapid decline as storm rainfall tapered off in the summer (Table 2). For instance, intercycle variability was 239 in October 2018 yet dropped to 0.397 in June 2018 (Table 2). However, there was not a consistent pattern in tidal variability throughout the year; during the summer, for instance, turbidity was not strongly driven by tides even without the presence of storm rainfall (Table 2). The high turbidity peaks during storm periods and consistently low (near zero) turbidity values during the summer months (Figure 3) indicate that precipitation events may be the key driver of riverine sediment transport in this system, as has been previously suggested (McClain et al., 2003; Inamdar et al., 2006).
Because of the dominance of storm rainfall events (i.e., “storms”) in driving water quality during the majority of the year in the Union River and the overall importance of storm rainfall in flushing dissolved carbon, nutrients, and other materials from terrestrial to aquatic systems (Buffam et al., 2001; Holmes et al., 2008; Fellman et al., 2009; Ward et al., 2012; Thom et al., 2018), understanding the internal dynamics of storm events is crucial. Here, we examined the dynamics of intra-storm patterns through hysteresis analysis of all storm events during the study period and found incidences of counterclockwise hysteresis of pH, counterclockwise hysteresis of DO, and clockwise hysteresis of turbidity (Table 2).
Examining hysteresis patterns for storms is useful for extricating the mechanisms behind how storm rainfall impacts water physico-chemistry. Clockwise hysteresis patterns are often attributed to a nearby material source that is quickly flushed during the beginning of a storm rainfall and depleted as the storm progresses, causing a lower value on the falling limb of the hydrograph (Bowes et al., 2005), whereas counterclockwise hysteresis indicates a more distal source with a longer transport time (e.g., Bowes et al., 2009). Our observations of hysteresis are therefore consistent with a shift in water source from base flow to shallow subsurface flow during storm rainfall, or surface runoff in extreme cases when rainfall occurs more rapidly than soil infiltration and/or soils are fully saturated (Horton, 1933). For example, decreases in conductivity are likely a result of dilution of base flow, similar to findings that silica concentrations measured every 3 h decreased during storms in the Union River (Ward et al., 2012).
However, though we found frequent hysteresis in river physico-chemistry, there were not fully consistent patterns in each parameter across all storms. Other studies have similarly found large variation in hysteresis patterns within a catchment that are often linked to the variety of differences between storm rainfall and landscape characteristics (Andrea et al., 2006; Gao and Josefson, 2012; Sherriff et al., 2016). The inconsistency in such patterns across events suggest that there are complex relationships between a constituent and its export throughout an event, such as in situ production or depletion (Heffernan and Cohen, 2010), and component mixing from multiple sources (Evans and Davies, 1998).
We found multiple storms with clockwise hysteresis of turbidity, which aligns with many studies that have similarly found clockwise patterns in suspended solids (e.g., see Bowes et al., 2005), turbidity (e.g., Martin et al., 2014), and DOC (Hood et al., 2006) during storm events. Increases in turbidity on the rising limb of storm rainfall are often resultant of flushing of soluble soil organic matter (Raymond and Saiers, 2010) and enhanced surface soil erosion (Coynel et al., 2005). However, we additionally observed one storm with counterclockwise hysteresis of turbidity (Table 2). The storm with counterclockwise hysteresis (Storm 2) was a secondary discharge peak immediately following a previous peak (Storm 1) that had strong clockwise hysteresis (Table 2). This would be consistent with a proximal source of sediment, such as from the streambed, quickly flushed out during the first peak (i.e., Storm 1). By the time Storm 2 began, the proximal source was exhausted, and the higher turbidity on the falling limb of Storm 2 (i.e., the counterclockwise hysteresis) was sourced from more distal runoff or subsurface sources later in the course of the storm rainfall. Overall, there was inconsistency in the behavior of turbidity in the system that may reflect complex sources of solutes.
Previous work has shown both clockwise and counterclockwise hysteresis of pH (Rose, 2003), however hysteresis of pH has overall been infrequently examined. Though there was variation in pH hysteresis patterns, we found counterclockwise hysteresis to be most common, with lower pH values (i.e., higher acidity) on the rising limb than the falling limb (Table 2). This is likely linked to shifting water sources throughout the storm. The soils surrounding the Union River are a mix of alluvial and low-humic gley soils, with soil along the lower valley characterized as medium to strongly acidic (Ness et al., 1960). This suggests that often during storm rainfall there is a source of acidity that is quickly flushed into the river and depleted throughout the course of the storm. CO2 produced during soil respiration and organic acids in the soil are both also sources of acidity during storm rainfall, particularly in smaller streams that receive significant amounts of terrestrially produced dissolved inorganic and organic carbon compared to larger rivers (Drake et al., 2018). The negative correlation of pH hysteresis index to the time since the previous storm and to the cumulative precipitation further supports this process (Supplementary Table 4). A longer interval between storm rainfall would allow for soluble organic acids and CO2 to be produced or accumulate within the soils, lowering the soil pH (Hedley and Bolan, 2003; Rukshana et al., 2011), and a storm with more precipitation could have a more powerful flushing effect. Other studies have similarly found that higher storm precipitation levels and drier antecedent conditions can create stronger hysteresis responses (House and Warwick, 1998; Bowes et al., 2005; Jeong et al., 2012; Gellis, 2013; Lloyd et al., 2016a).
Overall, the hysteresis pattern of turbidity and pH that we observed in the Union River suggests that there is a nearby source of organic matter, sediment, and acidity that is quickly flushed into the river during storms. Previous observations of the patterns of nutrient and lignin concentrations in the Union River over the course of storm rainfall suggested that a shallow pool of organic matter accumulated over the summer and was flushed during the first autumn storm events (Ward et al., 2012), consistent with the shifts in river physico-chemistry observed herein during these storm events.
Hysteresis analysis is crucial for understanding internal river dynamics because of the predominance of storm rainfall in driving river phyisco-chemistry in the Union River during the majority of the year. Freshwater discharge from rivers is known to be a major influence on estuarine processes (Cross and Williams, 1981; Sklar and Browder, 1998), including nutrient levels and primary production (Howarth et al., 2000; Wetz et al., 2011), hydrodynamic characteristics (Sheldon and Burd, 2014) and geochemistry (Sklar and Browder, 1998; Royer et al., 2001; Lane et al., 2007). For instance, freshwater input to an estuary in the southeastern United States was found to be correlated to large-scale climate indices, indicating how smaller river systems can mediate the impact of climate on larger estuary systems (Sheldon and Burd, 2014). Understanding the internal behavior of small systems such as the Union River can therefore help extricate impacts on the larger estuarine system.
Our findings of the predominance of storm rainfall in driving river physico-chemical variability during the majority of the year (see Section “Distinct Seasonality in River Physico-Chemistry: Storm Rainfall vs. Tidal Influence”) and the hysteretic nature of physico-chemical parameters (see section “Internal Storm Rainfall Hysteresis”) indicate that storm rainfall may be a key area to focus on for understanding the connection between smaller systems and the larger estuary. For instance, based on the turbidity and pH patterns observed during storms, these events are likely important contributors of the Union River’s overall export of dissolved organic carbon (DOC) and suspended solids to the Hood Canal basin, as has been observed in a variety of other systems (Hinton et al., 1997; Hood et al., 2006). For example, ∼90% of the DOC exported from small eastern US watersheds occurs during events (Newton et al., 2007), and, likewise, the majority of sedimentary material is exported during events in Pacific Northwest, US rivers (Goñi et al., 2013). Previous research on the Union River has additionally found that the concentration of terrestrially derived lignin in both the dissolved and particulate phase doubled during periods of increased river discharge in the Union River during the fall storm rainfall season (Ward et al., 2012). Together, this further supports the role of storm rainfall as important hot moments for connectivity between small rivers such as the Union River to the estuary.
We additionally observed that internal dynamics in the Union River appeared to reverberate in the larger Hood Canal estuary, as pH in the Union River was weakly correlated with pH in the Hood Canal and overall showed similar trends in fluctuations throughout the year (Figure 5). The steep declines in pH in the Union River during fall and winter storms were mirrored in a lower pH in the Hood Canal compared to other periods of the year (Figure 5). The connection between the Union River and Hood Canal was disrupted during spring (March and April 2018), as evidenced by the abrupt shift in correlation in those months (ranging from R = 0.311—0.66, p < 0.001) compared to October 2017—February 2018 (R = −0.028, p = 0.44 and R = −0.111, p = 0.094, respectively) (Supplementary Table 3). The de-coupling in March and April is likely because pH in Hood Canal is controlled by the combined influence of the 43 different rivers draining into Hood Canal (Steinberg et al., 2011), particularly the Skokomish River, which has an order magnitude higher discharge than the Union River (Supplementary Figure 2) and similar patterns in terms of storm rainfall responses in DOM (Ward et al., 2012). Thus, timing of pH variability in Hood Canal due to riverine influence will be linked to the discharge-weighted timing of all 43 rivers draining the surrounding landscape. Rivers draining the Olympic Mountains account for ∼76% of the freshwater discharge into Hood Canal, a significant fraction of which is snowmelt during March and April. As a result, snowmelt contributions from mountainous rivers likely outweighs the influence of lowland rivers on the estuary during the spring. This similarly aligns with the pattern of intra- and intercycle variability observed in the Hood Canal. Hood Canal had consistently higher intracycle (i.e., tidal) variability compared to the Union River as one would expect (Table 1). However, Hood Canal showed greater similarity to Union River tidal variability ratios during October 2018, January 2018, and March 2018 (Table 1), when storm- and snowmelt-driven higher discharge would cause greater relative freshwater input and dampen tidal control over Hood Canal dynamics. Together, the variability ratios are suggestive of temporal shifts in the biogeochemical connectivity between the basin’s river and the Hood Canal estuary.
Because of the link between rivers and estuaries, the impact of environmental changes on the rivers draining into Hood Canal may have broader implications for shifting behavior of the Hood Canal estuary system in response to environmental stressors. Since the beginning of the industrial age, the pH of the world’s oceans has decreased by about 0.1 units and is expected to decrease by 0.3-0.4 by the end of this century (Feely et al., 2004), signifying that the physico-chemistry of this estuary is experiencing notable change that will likely continue in the future. Likewise, the impact of salinity into freshwater rivers in the Puget Sound are modeled to increase in duration and reach in the coming century (Khangaonkar et al., 2018). With changing nutrient loadings and terrestrial stressors, the Hood Canal estuary has also been experiencing persistent hypoxic episodes over the last few decades (Khangaonkar et al., 2018). Land use in the area has also been shown to be an important driver of riverine export, with N2-fixing alder trees contributing significantly to river nitrogen export (Steinberg et al., 2011) and related estuarine hypoxia (Newton et al., 2007). The increase in sea level may additionally impact physical and biogeochemical processes farther inland (Ensign and Noe, 2018). Therefore, the drivers of riverine physico-chemistry and estuarine physico-chemistry, while complex, are ultimately linked. Shifts in the dominant drivers behind the coupled dynamics of the greater river-estuary system are therefore important to ascertain. Though studying these coupled river-estuary systems can be costly and logistically challenging (Sklar and Browder, 1998), first discerning the intricacies of their smaller components can provide a manageable representation to predict future trends. Here, we demonstrate that high-frequency measurements are particularly important for understanding the drivers of rapid variability in both rivers and their interface with the ocean, and such efforts can inform on seasonality of hot moments in biogeochemical cycling.
Understanding the extent to which different components of river physico-chemistry shift in response to storm rainfall, diel, and tidal cycles throughout the year is necessary for understanding how future environmental change may alter the interplay between these processes and impact the river system’s overall biogeochemical behavior. The Union River, a small freshwater tidal river, represents a distinct tidal system with differing drivers from other tidal systems. For example, estuaries are driven largely by marine exchange, and larger tidal rivers (such as the Amazon River) are dominated by in situ processes and interactions with the freshwater floodplain resultant from higher freshwater discharge. The stretch of the Union River monitored in this study is an example of a freshwater tidal system where freshwater discharge is high enough to prevent extensive estuarine influence (i.e., there is very little seawater intrusion), yet not so much to initiate floodplain dynamics.
Tidal systems across the United States predominantly consist of small coastal watersheds like the Union River, representing the majority (66%) of total tidal stream length, yet are poorly researched (Tagestad et al., 2021). These low-order coastal streams are particularly vulnerable to sea level rise (Tagestad et al., 2021), as sea level rise increases both the extent of rivers experiencing tidal influence (Ensign and Noe, 2018) and increases estuarine mixing in previously freshwater tidal systems. In the Union River, for instance, there is currently a clear seasonality to the drivers of river biogeochemistry in this system, and only a small tidal influence. Monitoring these smaller freshwater tidal rivers such as the Union River can allow us to track how sea level rise alters these dynamics.
In the Union River, we found a seasonal shift in drivers, with storm rainfall dominating river physico-chemistry variability in the fall, winter, and spring, and tides and diurnal (i.e., solar-driven evaporation and biotic metabolism) cycles becoming more predominant in the summer as storm rainfall, and thus freshwater discharge, receded (Figure 6). The strength of and balance between these drivers and yearly dynamics of river physico-chemistry may shift with future environmental change, as the complex dynamics in coastal freshwater river systems are susceptible to multiple avenues of future environmental stressors (Scavia et al., 2002). For one, seasonality of hydrologic variability is likely to become more extreme, such as a decrease in spring freshwater discharge through decreased snowmelt runoff (Kämäri et al., 2018), increased likelihood of extreme storm rainfall events (Meehl et al., 2000) and altered precipitation levels (Zhuang and Yang, 2018). For instance, as snowmelt from larger rivers seemed to overwhelm any influence of the Union River on Hood Canal pH during spring, a simultaneous increase in storm rainfall and decline in snowmelt due to climate change may contribute to a greater relative influence of the Union River and other similar smaller systems in the Hood Canal region. Additionally, the duration of time that the variability in physico-chemistry is dominantly driven by tides in a freshwater tidal river reach, such as elucidated here, may increase with future changes in precipitation and snowmelt patterns. Lastly, sea level rise may push the freshwater tidal portion of rivers upstream, extending the area of rivers that are exposed to the impact of tides (Ensign et al., 2012). It is therefore important to understand the influence of tidal forces on freshwater tidal river reaches; however, how an increase in the extent of the freshwater tidal stretch of a river may impact broader ecosystem functions—such as vegetation, nutrient, and sediment characteristics—is largely unexplored (Conner et al., 2007; Ensign et al., 2012). Long-term, high-resolution monitoring, combined with inter/intracycle analyses and intra-event hysteresis such as those presented here, will help to elucidate long-term trends in the patterns of such datasets. This will enable us to better understand how future environmental changes in sea level and precipitation may alter the relationship between the dual drivers of freshwater tidal rivers and affect the different facets of the river-estuary system.
All data can be found in the tables and figures of the manuscript. Summaries of monthly averages and statistical evaluations can be found in the Supplementary Material. A .xlsx file containing all processed sensor data and the correction factors for calculating Union River discharge for Hug Creek discharge has also been uploaded to the figshare repository and can be accessed at:http://doi.org/10.6084/m9.figshare.c.4610651.v4 and http://doi.org/10.6084/m9.figshare.c.4610651.v3. Measurements from the Oceanic Remote Chemical Analyzer (ORCA) moorings are collected and freely provided by PIs John Mickett, Jan Newton, and Zoltan Szuts at the Applied Physics Lab of the University of Washington as funded by the NOAA Integrated Ocean Observing System (IOOS) division through the Northwest Association of Networked Ocean Observing Systems (NANOOS) project, with additional funding by the Washington Ocean Acidification Center. Data are available from http://nvs.nanoos.org/ and https://nwem.apl.washington.edu/.
JI and NW conceptualized the study. JI conducted the data analysis and wrote the manuscript with significant input from AM-P and NW. All authors interpreted the data.
Support for JI was provided by the Department of Energy, Science Undergraduate Laboratory Internships (SULI). Data collection for this research was part of the PREMIS Initiative, conducted under the Laboratory Directed Research and Development Program at Pacific Northwest National Laboratory (PNNL). Data analysis was performed as part of the U.S. Department of Energy funded COMPASS-FME project. PNNL is operated by Battelle for the U.S. Department of Energy under Contract DE-AC05-76RL01830.
The authors declare that the research was conducted in the absence of any commercial or financial relationships that could be construed as a potential conflict of interest.
We would like to thank the Hood Canal Salmon Enhancement Group for coordination with the field site. We would also like to thank the Oceanic Remote Chemical Analyzer (ORCA) mooring program for providing estuarine data.
The Supplementary Material for this article can be found online at: https://www.frontiersin.org/articles/10.3389/fmars.2021.607644/full#supplementary-material
Andrea, B., Francesc, G., Jérôme, L., Eusebi, V., and Francesc, S. (2006). Cross-site comparison of variability of DOC and nitrate c–q hysteresis during the autumn–winter period in three Mediterranean headwater streams: a synthetic approach. Biogeochemistry 77, 327–349. doi: 10.1007/s10533-005-0711-7
Asselman, N. E. (1999). Suspended sediment dynamics in a large drainage basin: the river rhine. Hydrol. Process. 13, 1437–1450. doi: 10.1002/(SICI)1099-1085(199907)13:10<1437::AID-HYP821<3.0.CO;2-J
Atkins, M. L., Santos, I. R., Ruiz-Halpern, S., and Maher, D. T. (2013). Carbon dioxide dynamics driven by groundwater discharge in a coastal floodplain creek. J. Hydrol. 493, 30–42. doi: 10.1016/j.jhydrol.2013.04.008
Baumann, H., and Smith, E. M. (2017). Quantifying metabolically driven pH and oxygen fluctuations in US nearshore habitats at diel to interannual time scales. Estuar. Coasts 41, 1102–1117. doi: 10.1007/s12237-017-0321-3
Blaen, P. J., Khamis, K., Lloyd, C. E., Bradley, C., Hannah, D., and Krause, S. (2016). Real-time monitoring of nutrients and dissolved organic matter in rivers: capturing event dynamics, technological opportunities and future directions. Sci. Total Environ. 569, 647–660. doi: 10.1016/j.scitotenv.2016.06.116
Bowes, M. J., House, W. A., Hodgkinson, R. A., and Leach, D. V. (2005). Phosphorus–discharge hysteresis during storm events along a river catchment: the River Swale, UK. Water Res. 39, 751–762. doi: 10.1016/j.watres.2004.11.027
Bowes, M. J., Smith, J. T., and Neal, C. (2009). The value of high-resolution nutrient monitoring: a case study of the River Frome. Dorset, UK. J. Hydrol. 378, 82–96. doi: 10.1016/j.jhydrol.2009.09.015
Buffam, I., Galloway, J. N., Blum, L. K., and McGlathery, K. J. (2001). A stormflow/baseflow comparison of dissolved organic matter concentrations and bioavailability in an Appalachian stream. Biogeochemistry 53, 269–306.
Cerco, C. F., Threadgill, T., Noel, M. R., and Hinz, S. (2013). Modeling the pH in the tidal fresh Potomac River under conditions of varying hydrology and loads. Ecol. Modell. 257, 101–112. doi: 10.1016/j.ecolmodel.2013.02.011
Conner, W. H., Doyle, T. W., and Krauss, K. W. (2007). Ecology of Tidal Freshwater Forested Wetlands of the Southeastern United States. Berlin: Springer.
Coynel, A., Etcheber, H., Abril, G., Maneux, E., Dumas, J., and Hurtrez, J.-E. (2005). Contribution of small mountainous rivers to particulate organic carbon input in the Bay of Biscay. Biogeochemistry 74, 151–171. doi: 10.1007/s10533-004-3362-1
Cross, R. D., and Williams, D. L. (1981). Proceedings of National Symposium on Freshwater Inflow to Estuaries, Report Rep. 81/04. Washington, DC: U.S. Fish and Wildlife Service.
Drake, T. W., Raymond, P. A., and Spencer, R. G. (2018). Terrestrial carbon inputs to inland waters: a current synthesis of estimates and uncertainty. Limnol. Oceanogr. Lett. 3, 132–142. doi: 10.1002/lol2.10055
Ensign, S. H., and Noe, G. B. (2018). Tidal extension and sea-level rise: recommendations for a research agenda. Front. Ecol. Environ. 16:37–43. doi: 10.1002/fee.1745
Ensign, S. H., Noe, G. B., Hupp, C. R., and Fagherazzi, S. (2012). A meeting of the waters: Interdisciplinary challenges and opportunities in tidal rivers. Eos Trans. Am. Geophys. Union 93, 455–456. doi: 10.1029/2012eo450004
Evans, C., and Davies, T. D. (1998). Causes of concentration/discharge hysteresis and its potential as a tool for analysis of episode hydrochemistry. Water Resour. Res. 34, 129–137. doi: 10.1029/97WR01881
Feely, R., Sabine, C., Lee, K., Berelson, W., Kleypas, J., Fabry, V., et al. (2004). Impact of anthropogenic CO2 on the CaCO3 system in the oceans. Science 305, 362–366. doi: 10.1126/science.1097329
Fellman, J. B., Hood, E., Edwards, R. T., and D’Amore, D. V. (2009). Changes in the concentration, biodegradability, and fluorescent properties of dissolved organic matter during stormflows in coastal temperate watersheds. J. Geophys. Res. Biogeosci. 114:G01021.
Gao, P., and Josefson, M. (2012). Event-based suspended sediment dynamics in a central New York watershed. Geomorphology 139, 425–437. doi: 10.1016/j.geomorph.2011.11.007
Gellis, A. C. (2013). Factors influencing storm-generated suspended-sediment concentrations and loads in four basins of contrasting land use, humid-tropical puerto rico. CATENA 104, 39–57. doi: 10.1016/j.catena.2012.10.018
Goñi, M. A., Hatten, J. A., Wheatcroft, R. A., and Borgeld, J. C. (2013). Particulate organic matter export by two contrasting small mountainous rivers from the Pacific Northwest. USA. J. Geophys. Res. Biogeosci. 118, 112–134. doi: 10.1002/jgrg.20024
Hall, R. O., and Hotchkiss, E. R. (2017). “Chapter 34 - stream metabolism,” in Methods in Stream Ecology, 3rd Edn, eds G. A. Lamberti and F. R. Hauer (Cambridge MA: Academic Press), 219–233. doi: 10.1016/b978-0-12-813047-6.00012-7
Hedley, M. J., and Bolan, N. S. (2003). “Role of carbon, nitrogen, and sulfur cycles in soil acidification,” in Handbook of Soil Acidity, ed. Z. Rengel (New York: CRC Press), 43–70. doi: 10.1201/9780203912317
Heffernan, J. B., and Cohen, M. J. (2010). Direct and indirect coupling of primary production and diel nitrate dynamics in a subtropical spring−fed river. Limnol. Oceanogr. 55, 677–688. doi: 10.4319/lo.2010.55.2.0677
Hinton, M., Schiff, S., and English, M. (1997). The significance of storms for the concentration and export of dissolved organic carbon from two Precambrian Shield catchments. Biogeochemistry 36, 67–88.
Holmes, R. M., McClelland, J. W., Raymond, P. A., Frazer, B. B., Peterson, B. J., and Stieglitz, M. (2008). Lability of DOC transported by Alaskan rivers to the Arctic Ocean. Geophys. Res. Lett. 35:L03402.
Hood, E., Gooseff, M. N., and Johnson, S. L. (2006). Changes in the character of stream water dissolved organic carbon during flushing in three small watersheds, Oregon. J. Geophys. Res. Biogeosci. 111:G01007. doi: 10.1029/2005JG000082
Horton, R. E. (1933). The role of infiltration in the hydrologic cycle. Eos Trans. Am. Geophys. Union 14, 446–460. doi: 10.1029/TR014i001p00446
House, W. A., and Warwick, M. S. (1998). Hysteresis of the solute concentration/discharge relationship in rivers during storms. Water Res. 32, 2279–2290. doi: 10.1016/S0043-1354(97)00473-9
Howarth, R. W., Swaney, D. P., Butler, T. J., and Marino, R. (2000). Rapid communication: climatic control on eutrophication of the Hudson River Estuary. Ecosystems 3, 210–215. doi: 10.1007/s100210000020
Inamdar, S., O’leary, N., Mitchell, M., and Riley, J. (2006). The impact of storm events on solute exports from a glaciated forested watershed in western New York. USA. Hydrol. Process. An Int. J. 20, 3423–3439. doi: 10.1002/hyp.6141
Jeong, J. J., Bartsch, S., Fleckenstein, J. H., Matzner, E., Tenhunen, J. D., Lee, S. D., et al. (2012). Differential storm responses of dissolved and particulate organic carbon in a mountainous headwater stream, investigated by high-frequency, in situ optical measurements. J. Geophys. Res. Biogeosci. 117:G03013. doi: 10.1029/2012JG001999
Kämäri, M., Tattari, S., Lotsari, E., Koskiaho, J., and Lloyd, C. (2018). High-frequency monitoring reveals seasonal and event-scale water quality variation in a temporally frozen river. J. Hydrol. 564, 619–639. doi: 10.1016/j.jhydrol.2018.07.037
Khangaonkar, T., Nugraha, A., Xu, W., Long, W., Bianucci, L., Ahmed, A., et al. (2018). Analysis of hypoxia and sensitivity to nutrient pollution in Salish Sea. J. Geophys. Res. Oceans 123, 4735–4761. doi: 10.1029/2017jc013650
Lane, R. R., Day, J. W. Jr., Marx, B. D., Reyes, E., Hyfield, E., and Day, J. N. (2007). The effects of riverine discharge on temperature, salinity, suspended sediment and chlorophyll a in a Mississippi delta estuary measured using a flow-through system. Estuar. Coast. Shelf Sci. 74, 145–154. doi: 10.1016/j.ecss.2007.04.008
Lloyd, C., Freer, J., Johnes, P., and Collins, A. (2016a). Using hysteresis analysis of high-resolution water quality monitoring data, including uncertainty, to infer controls on nutrient and sediment transfer in catchments. Sci. Total Environ. 543, 388–404. doi: 10.1016/j.scitotenv.2015.11.028
Lloyd, C., Freer, J., Johnes, P., and Collins, A. (2016b). Technical note: testing an improved index for analysing storm discharge-concentration hysteresis. Hydrol. Earth Syst. Sci. 20, 625–632. doi: 10.5194/hess-20-625-2016
Lundquist, J. D., and Cayan, D. R. (2002). Seasonal and spatial patterns in diurnal cycles in streamflow in the western United States. J. Hydrometeorol. 3, 591–603. doi: 10.1175/1525-75412002003<0591:SASPID<2.0.CO;2
Martin, S. E., Conklin, M. H., and Bales, R. C. (2014). Seasonal accumulation and depletion of local sediment stores of four headwater catchments. Water 6, 2144–2163. doi: 10.3390/w6072144
McClain, M. E., Boyer, E. W., Dent, C. L., Gergel, S. E., Grimm, N. B., Groffman, P. M., et al. (2003). Biogeochemical hot spots and hot moments at the interface of terrestrial and aquatic ecosystems. Ecosystems 6, 301–312. doi: 10.1007/s10021-003-0161-9
Meehl, G. A., Zwiers, F., Evans, J., Knutson, T., Mearns, L., and Whetton, P. (2000). Trends in extreme weather and climate events: issues related to modeling extremes in projections of future climate change. Bull. Am. Meteorol. Soc. 81, 427–436. doi: 10.1175/1520-0477(2000)081<0427:tiewac>2.3.co;2
Nelson, N. G., Muñoz-Carpena, R., Neale, P. J., Tzortziou, M., and Megonigal, J. P. (2017). Temporal variability in the importance of hydrologic, biotic, and climatic descriptors of dissolved oxygen dynamics in a shallow tidal-marsh creek. Water Resour. Res. 53, 7103–7120. doi: 10.1002/2016WR020196
Ness, A., Fowler, R., and Parvin, R. (1960). Soil Survey of Mason County, Washington. Washington, DC: United States Department of Agriculture.
Newton, J., Bassin, C., Devol, A., Kawase, M., Ruef, W., Warner, M., et al. (2007). “Hypoxia in hood canal: an overview of status and contributing factors,” in Paper Presented at Proceedings of the 2007 Georgia Basin Puget Sound Research Conference, (Vancouver BC).
Peterson, D. L., Schreiner, E. G., and Buckingham, N. M. (1997). Gradients, vegetation and climate: spatial and temporal dynamics in the Olympic Mountains, USA. Global Ecol. Biogeogr. Lett. 6, 7–17. doi: 10.2307/2997523
Proum, S., Santos, J. H., Lim, L. H., and Marshall, D. J. (2018). Tidal and seasonal variation in carbonate chemistry, pH and salinity for a mineral-acidified tropical estuarine system. Reg. Stud. Mar. Sci. 17, 17–27. doi: 10.1016/j.rsma.2017.11.004
Raymond, P. A., and Saiers, J. E. (2010). Event controlled DOC export from forested watersheds. Biogeochemistry 100, 197–209. doi: 10.1007/s10533-010-9416-7
Regier, P., Ward, N. D., Indivero, J., Wiese Moore, C., Norwood, M., and Myers-Pigg, A. (2021). Biogeochemical control points of connectivity between a tidal creek and its floodplain. Limnol. Oceanogr. Lett. 6, 134–142. doi: 10.1002/lol2.10183
Rose, L. A., Karwan, D. L., and Godsey, S. E. (2018). Concentration-discharge relationships describe solute and sediment mobilization, reaction, and transport at event and longer timescales. Hydrol. process. 32, 2829–2844. doi: 10.1002/hyp.13235
Rose, S. (2003). Comparative solute–discharge hysteresis analysis for an urbanized and a ‘control basin’in the Georgia (USA) Piedmont. J. Hydrol. 284, 45–56. doi: 10.1016/j.jhydrol.2003.07.001
Royer, T. C., Grosch, C. E., and Mysak, L. A. (2001). Interdecadal variability of Northeast Pacific coastal freshwater and its implications on biological productivity. Prog. Oceanogr. 49, 95–111. doi: 10.1016/s0079-6611(01)00017-9
Rukshana, F., Butterly, C., Baldock, J., and Tang, C. (2011). Model organic compounds differ in their effects on pH changes of two soils differing in initial pH. Biol. Fertil. Soils 47, 51–62. doi: 10.1007/s00374-010-0498-0
Sawakuchi, H. O., Neu, V., Ward, N. D., Barros, M. D. L. C., Valerio, A. M., Gagne-Maynard, W., et al. (2017). Carbon dioxide emissions along the lower Amazon River. Front. Mar. Sci. 4:76. doi: 10.3389/fmars.2017.00076
Scavia, D., Field, J. C., Boesch, D. F., Buddemeier, R. W., Burkett, V., Cayan, D. R., et al. (2002). Climate change impacts on US coastal and marine ecosystems. Estuaries 25, 149–164.
Sheldon, J. E., and Burd, A. B. (2014). Alternating effects of climate drivers on Altamaha River discharge to coastal Georgia. USA. Estuar. Coasts 37, 772–788. doi: 10.1007/s12237-013-9715-z
Sherriff, S. C., Rowan, J. S., Fenton, O., Jordan, P., Melland, A. R., Mellander, P. E., et al. (2016). Storm event suspended sediment-discharge hysteresis and controls in agricultural watersheds: implications for watershed scale sediment management. Environ. Sci. Technol. 50, 1769–1778. doi: 10.1021/acs.est.5b04573
Sklar, F. H., and Browder, J. A. (1998). Coastal environmental impacts brought about by alterations to freshwater flow in the Gulf of Mexico. Environ. Manag. 22, 547–562. doi: 10.1007/s002679900127
Steinberg, P. D., Brett, M. T., Bechtold, J. S., Richey, J. E., Porensky, L. M., and Smith, S. N. (2011). The influence of watershed characteristics on nitrogen export to and marine fate in Hood Canal. Washington, USA. Biogeochemistry 106, 415–433. doi: 10.1007/s10533-010-9521-7
Tagestad, J., Ward, N. D., Butman, D., and Stegen, J. (2021). Small streams dominate US tidal reaches and will be disproportionately impacted by sea-level rise. Sci. Total Environ. 753:141944. doi: 10.1016/j.scitotenv.2020.141944
Tananaev, N. (2012). Hysteresis effect in the seasonal variations in the relationship between water discharge and suspended load in rivers of permafrost zone in Siberia and Far East. Water Resour. 39, 648–656. doi: 10.1134/S0097807812060073
Thom, R. M., Breithaupt, S. A., Diefenderfer, H. L., Borde, A. B., Roegner, G. C., Johnson, G. E., et al. (2018). Storm-driven particulate organic matter flux connects a tidal tributary floodplain wetland, mainstem river, and estuary. Ecol. Appl. 28, 1420–1434. doi: 10.1002/eap.1759
Vaughan, M. C. H., Bowden, W. B., Shanley, J. B., Vermilyea, A., Sleeper, R., Gold, A. J., et al. (2017). High-frequency dissolved organic carbon and nitrate measurements reveal differences in storm hysteresis and loading in relation to land cover and seasonality. Water Resour. Res. 53, 5345–5363. doi: 10.1002/2017wr020491
Wagner, S., Fair, J. H., Matt, S., Hosen, J. D., Raymond, P., Saiers, J., et al. (2019). Molecular hysteresis: hydrologically driven changes in riverine dissolved organic matter chemistry during a storm event. J. Geophys. Res. Biogeosci. 124, 759–774. doi: 10.1029/2018JG004817
Walsh, K. J., McBride, J. L., Klotzbach, P. J., Balachandran, S., Camargo, S. J., Holland, G., et al. (2016). Tropical cyclones and climate change. Wiley Interdis. Rev. Clim. Chang. 7, 65–89. doi: 10.1016/b978-0-12-382225-3.00508-9
Ward, N. D., Bianchi, T. S., Medeiros, P. M., Seidel, M., Richey, J. E., Keil, R. G., et al. (2017). Where carbon goes when water flows: carbon cycling across the aquatic continuum. Front. Mar. Sci. 4:7.
Ward, N. D., Richey, J. E., and Keil, R. G. (2012). Temporal variation in river nutrient and dissolved lignin phenol concentrations and the impact of storm events on nutrient loading to Hood Canal. Washington, USA. Biogeochemistry 111, 629–645. doi: 10.1007/s10533-012-9700-9
Ward, N. D., Sawakuchi, H. O., Neu, V., Less, D. F., Valerio, A. M., Cunha, A. C., et al. (2018). Velocity-amplified microbial respiration rates in the lower Amazon River. Limnol. Oceanogr. Lett. 3, 265–274. doi: 10.1002/lol2.10062
Wetz, M. S., Hutchinson, E. A., Lunetta, R. S., Paerl, H. W., and Christopher Taylor, J. (2011). Severe droughts reduce estuarine primary productivity with cascading effects on higher trophic levels. Limnol. Oceanogr. 56, 627–638. doi: 10.4319/lo.2011.56.2.0627
Whitfield, P. H., and Schreier, H. (1981). Hysteresis in relationships between discharge and water chemistry in the Fraser River basin, British Columbia. Limnol. Oceanogr. 26, 1179–1182. doi: 10.4319/lo.1981.26.6.1179
Williams, G. P. (1989). Sediment concentration versus water discharge during single hydrologic events in rivers. J. Hydrol. 111, 89–106. doi: 10.1016/0022-1694(89)90254-0
Keywords: tidal river, seasonality, biogeochemistry, high-resolution monitoring, hysteresis
Citation: Indivero J, Myers-Pigg AN and Ward ND (2021) Seasonal Changes in the Drivers of Water Physico-Chemistry Variability of a Small Freshwater Tidal River. Front. Mar. Sci. 8:607664. doi: 10.3389/fmars.2021.607644
Received: 17 September 2020; Accepted: 28 May 2021;
Published: 28 June 2021.
Edited by:
Selvaraj Kandasamy, Xiamen University, ChinaReviewed by:
Robert Lane, Canadian Arctic Resources Committee, CanadaCopyright © 2021 Indivero, Myers-Pigg and Ward. This is an open-access article distributed under the terms of the Creative Commons Attribution License (CC BY). The use, distribution or reproduction in other forums is permitted, provided the original author(s) and the copyright owner(s) are credited and that the original publication in this journal is cited, in accordance with accepted academic practice. No use, distribution or reproduction is permitted which does not comply with these terms.
*Correspondence: Julia Indivero, amluZGl2QHV3LmVkdQ==
†Present address: Julia Indivero, School of Aquatic and Fishery Sciences, University of Washington, Seattle, WA, United States
Disclaimer: All claims expressed in this article are solely those of the authors and do not necessarily represent those of their affiliated organizations, or those of the publisher, the editors and the reviewers. Any product that may be evaluated in this article or claim that may be made by its manufacturer is not guaranteed or endorsed by the publisher.
Research integrity at Frontiers
Learn more about the work of our research integrity team to safeguard the quality of each article we publish.