Seasonal Changes in the Drivers of Water Physico-Chemistry Variability of a Small Freshwater Tidal River
 Julia Indivero
 Allison N. Myers-Pigg
 Nicholas D. Ward
- 1Marine and Coastal Research Laboratory, Pacific Northwest National Laboratory, Sequim, WA, United States
- 2Biological Sciences Division, Pacific Northwest National Laboratory, Richland, WA, United States
- 3School of Oceanography, University of Washington, Seattle, WA, United States
A Corrigendum on
Seasonal Changes in the Drivers of Water Physico-Chemistry Variability of a Small Freshwater Tidal River
by Indivero, J., Myers-Pigg, A. N., and Ward, N. D. (2021). Front. Mar. Sci. 8:607664. doi: 10.3389/fmars.2021.607644
In the original article, there was a mistake in Figures 3, 4, 5, 6, and 7 as published. The images did not correspond to their captions. Additionally, the description for Figure 3 incorrectly included the sentence “Blue background delineates distinct period of storm-driven parameter behavior (greater variability) over the course of the year” that referred to an older (unpublished) version of the graph. The correct images for Figures 3, 4, 5, 6, and 7 appear below with the correct figure descriptions.
FIGURE 3
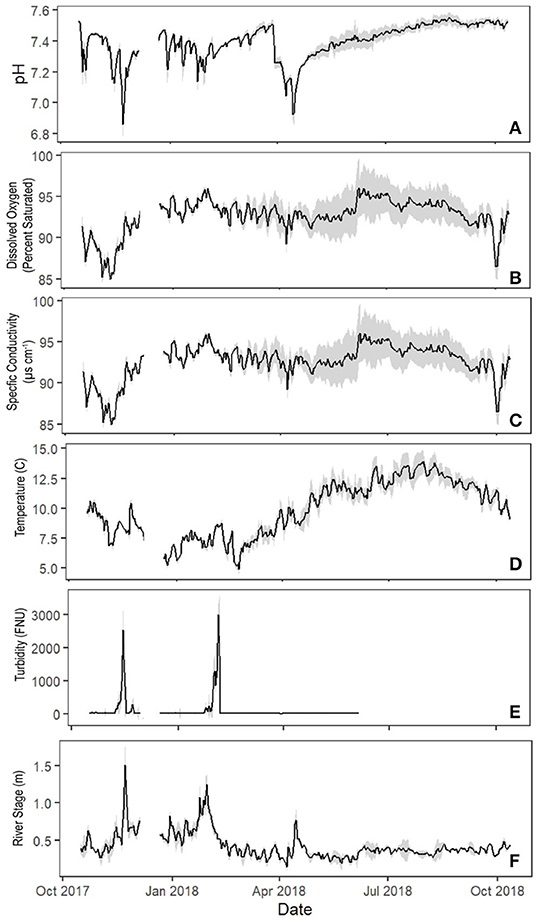
Figure 3. Time series of (A) pH, (B) dissolved oxygen (percent saturated), (C) specific conductivity (μS cm−1), (D) temperature (°C), (E) turbidity (FNU), and (F) river stage (m) over the course of the study period, October 16th, 2017 through October 12th, 2018. Blue background delineates distinct period of storm-driven parameter behavior (greater variability) over the course of the year. Measurements were taken every 5 min from October 16th to December 4th, 2017, and every 15 min from December 21st, 2017 to October 12th, 2018. Turbidity data above the detection range (4000 FNU) were removed, as well as turbidity data after June 15th, 2018 due to a sensor maintenance issue.
FIGURE 4
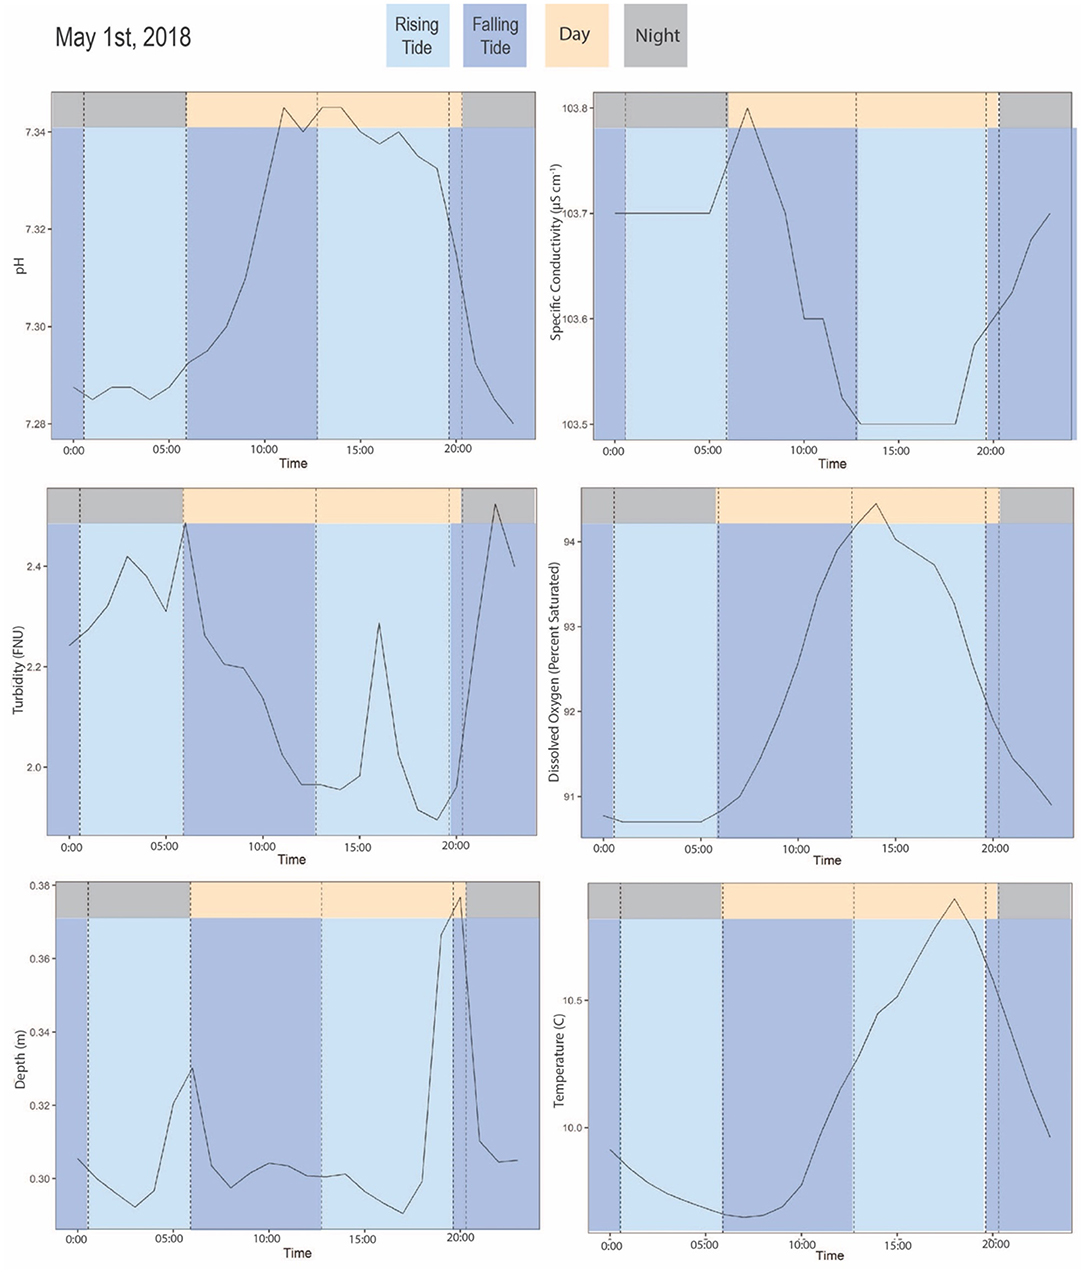
Figure 4. Time series of example summer day (May 1st, 2018) averaged by hour of pH, specific conductivity, dissolved oxygen, turbidity, temperature, and depth. Colors indicate rising tide and falling tide (determined by timing of high and low tide) and day and night (determined by sunrise and sunset time).
FIGURE 5
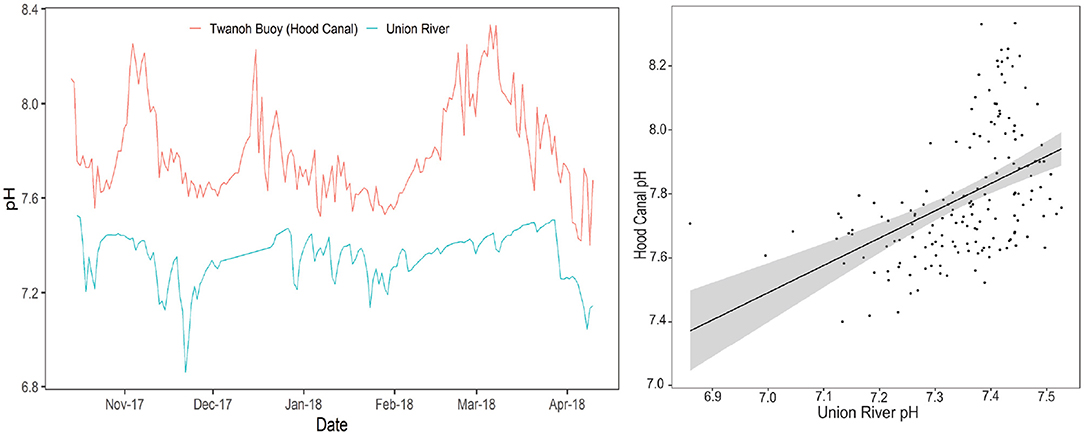
Figure 5. (Left) Daily average pH in the Union River and in the Hood Canal measured at the Twanoh Buoy by (ORCA-UW, 2018) from October 13th, 2017 to April 9th, 2018. Date is displayed as Month-YY. (Right) Daily average pH in the Union River compared to the Hood Canal (r = 0.47, p < 0.001).
FIGURE 6
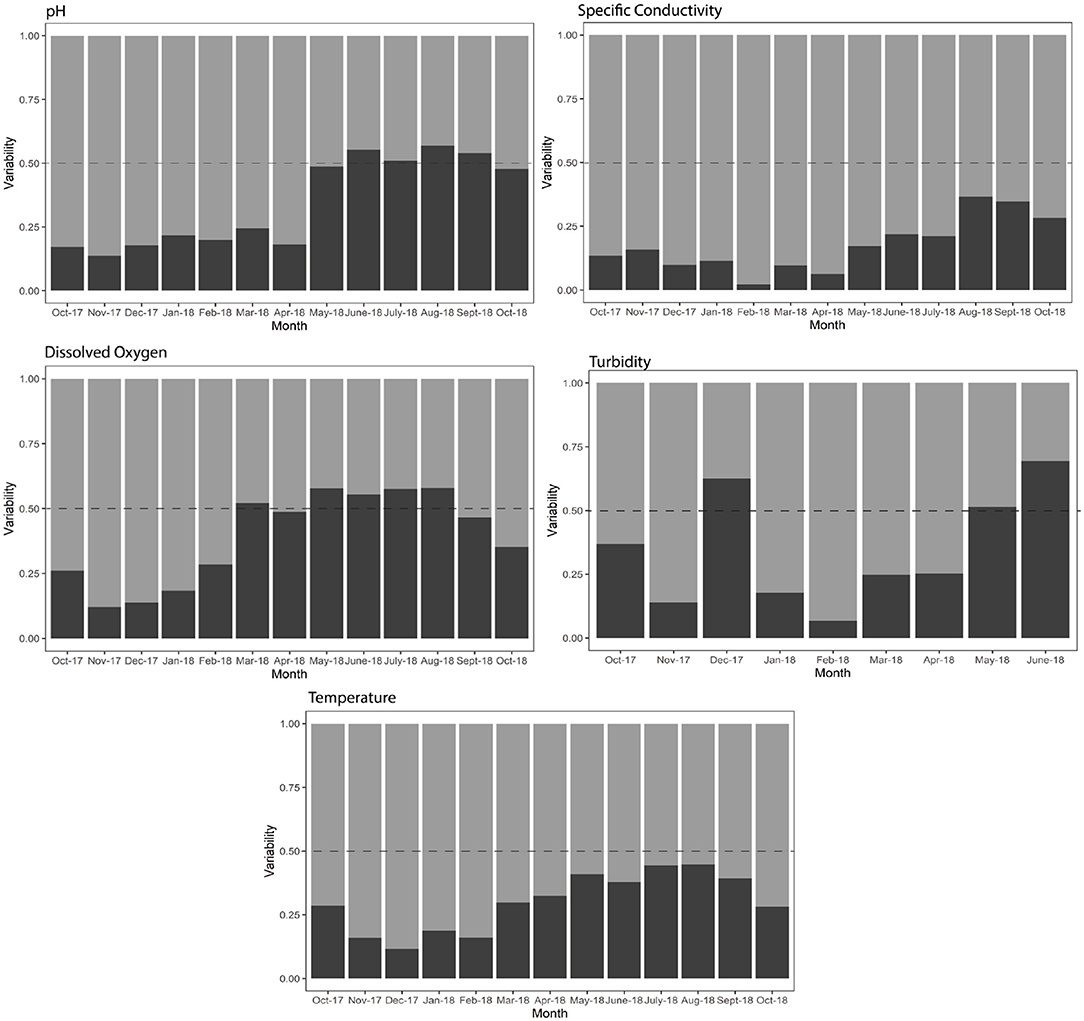
Figure 6. Monthly intercycle (i.e., non-tidal) and intracycle (i.e., tidal) variability for pH, turbidity, dissolved oxygen, specific conductivity, and temperature in the Union River shown as relative proportion for each month. The dashed line indicates a relative proportion of 0.50: i.e., intra-and intercycle variability for that month were equal. Intracycle variability >0.5 (above the dashed line) indicates that tidal variability was dominant, whereas intracycle variability <0.5 (below the dashed line) indicates that non-tidal variability was dominant. Intracycle variability is calculated as the monthly average of tidal cycle standard deviations for each parameter. Intercycle variability is calculated as the monthly standard deviation of tidal cycle mean.
FIGURE 7
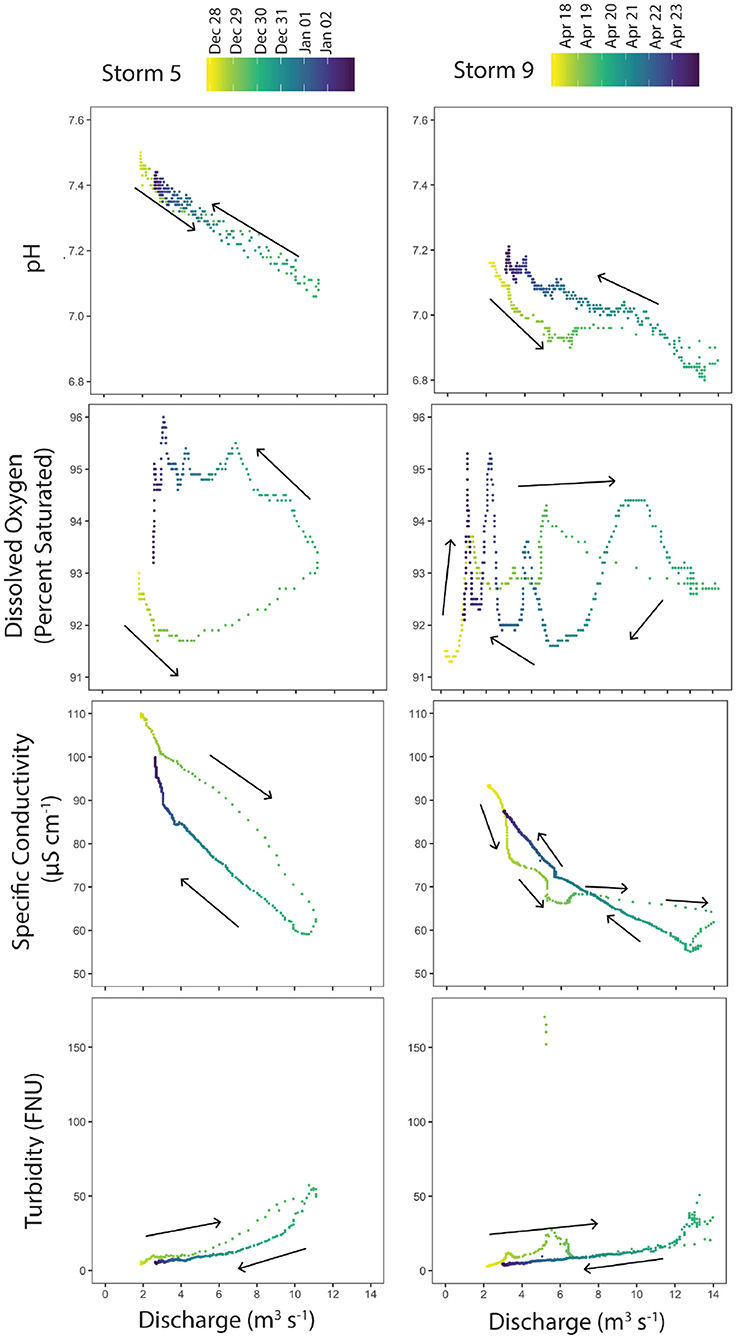
Figure 7. Examples of hysteresis observed for pH, dissolved oxygen, specific conductivity, and turbidity for two storms on the Union River. Two example storms are shown to demonstrate different types of hysteresis seen during the 2017–2018 study.
The authors apologize for this error and state that this does not change the scientific conclusions of the article in any way. The original article has been updated.
Publisher's Note
All claims expressed in this article are solely those of the authors and do not necessarily represent those of their affiliated organizations, or those of the publisher, the editors and the reviewers. Any product that may be evaluated in this article, or claim that may be made by its manufacturer, is not guaranteed or endorsed by the publisher.
Keywords: tidal river, seasonality, biogeochemistry, high-resolution monitoring, hysteresis
Citation: Indivero J, Myers-Pigg AN and Ward ND (2022) Corrigendum: Seasonal Changes in the Drivers of Water Physico-Chemistry Variability of a Small Freshwater Tidal River. Front. Mar. Sci. 8:821316. doi: 10.3389/fmars.2021.821316
Received: 24 November 2021; Accepted: 21 December 2021;
Published: 20 January 2022.
Edited and reviewed by: Antonio Cobelo-Garcia, Spanish National Research Council (CSIC), Spain
Copyright © 2022 Indivero, Myers-Pigg and Ward. This is an open-access article distributed under the terms of the Creative Commons Attribution License (CC BY). The use, distribution or reproduction in other forums is permitted, provided the original author(s) and the copyright owner(s) are credited and that the original publication in this journal is cited, in accordance with accepted academic practice. No use, distribution or reproduction is permitted which does not comply with these terms.
*Correspondence: Julia Indivero, jindiv@uw.edu
†Present Address: Julia Indivero, School of Aquatic and Fishery Sciences, University of Washington, Seattle, WA, United States