 Hang Thi Thu Nguyen
 Stefan Magez
 Magdalena Radwanska
- 1Department of Biochemistry and Microbiology, Ghent University, Ghent, Belgium
- 2Laboratory for Biomedical Research, Ghent University Global Campus, Incheon, Republic of Korea
- 3Laboratory of Cellular and Molecular Immunology, Vrije Universiteit Brussel, Brussels, Belgium
- 4Department of Biomedical Molecular Biology, Ghent University, Ghent, Belgium
Introduction: Trypanosoma evansi parasite infections cause a chronic animal wasting disease called Surra, and cases of atypical Human Trypanosomosis (aHT). In experimental models, T. evansi infections are hallmarked by the early onset of excessive inflammation. Therefore, balancing the production of inflammatory cytokines by anti-inflammatory IL-10 is crucial for prolonged survival.
Methods: To improve the understanding of trypanosomosis induced immunopathology, we used scRNA-seq data from an experimental chronic T. evansi infection mouse model, resembling natural infection in terms of disease characteristics.
Results and discussion: For the first time, obtained results allowed to assess the transcriptomic profile and heterogeneity of splenic CD4+ T cell subsets, during a trypanosome infection. Here, the predominant subpopulation of T cells was represented by Tbx21(T-bet)+ Ccr5+ Id2+ type 1 helper T cells (Th1), followed by Icos+ Cxcr5+Follicular T helper cells (Tfh) and very minor fraction of Il2ra(CD25)+Foxp3+ regulatory T cells (Tregs). Interestingly, the profile of Th1 cells shows that besides Ifng, these cells express high levels of Il10 and Il21, coding for anti-inflammatory and immunoregulatory cytokines. This coincides with the elevated expression of key genes involved in IL-10 and IL-21 secretion pathway such as Stat1 and Stat3, as well as the transcriptional factors Prdm1 (Blimp 1), and Maf (c-Maf). In contrast, there is virtually no IL-10 transcription detected in the Treg population. Finally, differential gene expression and gene ontology analysis of infection-induced Ifng+ Il10+ Il21+ Th1 cells highlights their suppressive function on T cell activation, differentiation and INF-γ production itself. This indicates that during trypanosome infections, the Ifng+ Il10+ Il21+ Th1 cells, rather than Tregs, assume an immune regulatory role that is needed for dampening inflammation.
1 Introduction
Trypanosoma evansi (T. evansi), also referred to as Trypanosoma brucei evansi, is a unicellular salivarian protozoan parasite that causes animal trypanosomosis (Surra) and, in rare cases, atypical Human Trypanosomosis (1, 2). In livestock as well as murine models, T. evansi infections often trigger a chronic wasting disease hallmarked by anemia, muscle breakdown and weight loss (1, 3). Even though T. evansi is genetically related to T. brucei, it lacks the capacity to be cyclically transmitted by tsetse flies due to the partial or complete lack of its kinetoplast DNA. Therefore, T. evansi parasites rely on mechanical transmission by several species of hematophagous flies (4). This has allowed the parasite to spread from the African tsetse belt to other parts of the world (5). In contrast, tsetse transmitted animal infections caused by T. brucei and T. congolense, as well as human trypanosomiasis caused by T. b. gambiense and T. b. rhodesiense, are restricted to sub-Saharan Africa (6).
For several decades, infection-induced cellular responses and their interplay with parasites have been intensively studied to better understanding disease mechanisms. In case of trypanosomosis, this has led to a general understanding of how parasites evade antibody-mediated killing and induce a general state of immunosuppression and disease (7, 8). However, to investigate these events at a cellular resolution, most conventional technologies such as flow cytometry and in vitro culturing techniques are inadequate. The introduction of transcriptome approaches, including scRNA-seq analysis, has more recently allowed acquiring new in-depth knowledge of the pathological events that are associated to trypanosome infections at the level of the brain, the liver, the adipose tissue, and the spleen (3, 9–13). The latter has been of particular importance for the understanding of mechanisms that drive the induction of infection associated anemia, as well as general immunopathology.
As salivarian trypanosomes are extracellular pathogens, the antibody response constitutes the main defence system available to the host. Hence, to be successful, trypanosomes acquired multiple independent methods to circumvent antibody-mediated destruction. Antigenic variation of their surface coat and inhibition of complement-mediated lysis are the main tools employed by trypanosomes to ensure successful development of infection (14, 15). In addition, trypanosomes have acquired the capacity to manipulate the host antibody production capacity by directly affecting B cells and plasma cells (PCs) (16–19). Here, the recent implementation scRNA-seq analysis has provided a detailed cellular map outlining how infection-associated disruption of B cell homeostasis takes place, and how accelerated terminal differentiation into PCs in the absence of naïve B cell replenishment results in the overall abrogation of the host antibody production during chronic trypanosome infections (10, 20).
When considering the host adaptive immune system, three principles are important. Firstly, adaptive B cell responses are T cell dependent. Hence, to get a holistic view on trypanosomosis-associated alterations in B cell homeostasis, a thorough understanding of the T cell biology is needed. Secondly, T cells are hugely important in multiple immune regulatory processes, as they can constitute the main source of an array of cytokines. Finally, the host T cell compartment encompasses a complex array of different cells that include naïve CD4+ cells, CD4+ T helper cells (Th1 and Th2), T follicular helper (Tfh) cells, FOXP3+ regulatory T cells (Tregs), cytotoxic CD8+ T cells, effector memory T cells, tissue resident memory phenotype T (TRM) cells, NKT cells, and depending on a particular pathological context other expanding minor population (Th3, Th9, Th17, Th22, ILC1, 2 and 3) (21–23).
During trypanosome infections, T cells are known to be important drivers of inflammatory pathology. Interestingly, they have also been described as guardians of the immune system through their capacity to produce anti-inflammatory cytokines. This dual role is best reflected by the involvement of trypanosomosis-induced T cells in the induction of both the pro-inflammatory cytokine INF-γ and the anti-inflammatory cytokine IL-10. While the first is crucial for providing the host with an initial immune environment that favors parasitemia control (24, 25), the subsequent induction of IL-10 is essential for the prevention of IFN-γ/TNF driven hyper-inflammation (26–29). So far, it has however been difficult to obtain a consensus view on which T cells and which subpopulations are exactly responsible for individual immune functions, using cellular assays and conventional immunological approaches. As outlined above, these technologies simply lack the resolution to provide detailed answers in this case. For example, while CD4+ Th1 T cells have been considered by several authors to be important for the presence of early-stage IFN-γ (27, 30, 31), the contribution of CD8+ cells in the cytokine profile of extracellular trypanosome infections is more ambiguous (30, 31). When it comes to the role of regulatory T cells that are conventionally considered important for the delivery of anti-inflammatory IL-10, the situation is even more confusing. Here, findings differ between studies using distinct African trypanosome species, and in one case e.g. for experimental models of T. congolense, there is no consensus on the role of these cells. Indeed, while multiple studies have shown the detrimental role of Tregs on infection control (32–36), at least one study has suggested that these cells are mediating prolonged host survival (37). For T. brucei infections, results are more aligned with each other. Indeed, despite the in vitro finding that the differentiation of CD4+ T cells into Tregs can be triggered by the action of T. brucei release extracellular vesicles (TbEVs) (38), in vivo results suggest that there is no expansion of Tregs during infection, and that their role as anti-inflammatory mediators must be minimal (32, 39).
Besides having a role in cytokine production, CD4+ Th cells and Tregs are also crucial for the regulation of activation of antigen presenting cells and in particular B cells. They do so by engaging in cell-cell contact interactions mediated by CTLA-4 (CD152), present on Tregs and activated CD4+ Th cells, and the CD80 and CD86 partners on the antigen presenting cells. In this context, the ‘off’ signal provided by CTLA-4 normally should function as prevention signal for hyper-activation. Interestingly, to the best of our knowledge, so far this interaction has not been addressed in the context of trypanosomosis. Finally, while also Tfh cells are generally considered to be key to a proper antigen stimulation of B cells, as they are needed for affinity maturation and class switching, the role of these cells has so far not been specifically addressed in the context of trypanosomosis. Neither is any information currently available on the contribution of the interactions between CD28, CD40L, ICOS (CD278) and PD1 (CD279) on the Tfh and the complementary binding partners CD86, CD40, ICOSL (CD275 or B7-H2) and PD1L (CD274 or B7-H1) on the B cell.
In conclusion, while trypanosomosis-activated T cells in general are believed to be important for the maintenance of cytokine balances, and are known to play a key role in infection-associated brain pathology (40–42) and liver inflammation (43), they are also considered as key potential players in the disruption of B cell homeostasis that is characteristic for the chronic stage of both livestock and experimental trypanosomosis. Hence, taken the complexity of the T cell repertoire, and the phenotypic changes that could be induced by infections and hamper more conventional immunological investigation approaches, we report here the results of a scRNA-seq analysis with a focus on unraveling the detailed heterogeneity of spleen CD4+ T cells in a chronic T. evansi mouse model. By focussing on the response of various T cell subpopulations to the progressing infection, we are able report for the first time a unique regulatory gene signature for CD4+ Th1 T cells. These cells, rather than Tregs, appear to be the gatekeepers that balance inflammatory and anti-inflammatory cytokines during chronic infection. Finally, a unique gene signature modulation of T follicular helper cells is presented in this study, which is also characteristic the chronic infection stage of trypanosomosis.
2 Material and methods
2.1 Mice and ethics statement
Female C57Bl/6 mice aged 7-9 weeks were purchased from KOATECH (Gyeonggi-do, Korea), housed in individually ventilated cages (IVC), and provided cage enrichment. Experimental animal procedures were authorized by the Ghent University Global Campus Institutional Animal Care (GUGC IACUC). Experimental animal protocol numbers are 2020-016 and 2021-019.
2.2 Parasite and infection
A camel-derived blood stabilate T. evansi Merzouga 93 (ITMAS 150399C), propagated in mice and stored in 50% Alsever`s solution (Sigma-Aldrich, Missouri, USA) and 10% glycerol (final), was obtained from the Institute for Tropical Medicine, Antwerp, Belgium. The stabilate was typed as T. evansi Type A (3). Infection was initiated by intraperitoneal (i.p) injection of with 200 parasites in 100 μL of Dulbecco’s Phosphate Buffered Saline (DPBS; Invitrogen, CA, USA).
2.3 Splenocytes preparation for single cell sequencing
Isolated spleens were homogenized using the using gentleMACS™ Dissociator (Miltenyi Biotec, Bergisch Gladbach, Germany) in 6 mL of DMEM added with 10% FBS (Atlas Biologicals, CO, USA) and 1% penicillin/streptomycin (Sigma-Aldrich, Missouri, USA). After being filtered through a 70µm cell strainer (SPL Life Sciences, Gyeongi-do, Korea) to get rid of any debris, cells were centrifuged at 314 x g at 4°C for 7 minutes. The cell pellet was then re-suspended and incubated in 5 mL of Red blood cell lysis buffer (Biolegend, CA, USA) for exactly 5 minutes on ice. Subsequently, 30 mL of DPBS (Invitrogen, CA, USA) supplemented with 0.04% BSA (Miltenyi Biotec, Bergisch Gladbach, Germany) was added to stop the lysis reaction, followed by a centrifugation (314 x g at 4°C for 7 minutes). After centrifuging, cells were kept in DPBS supplemented with 0.04% BSA on ice. The concentration and viability of cells were assessed by mixing cell suspension in a 1:1 ratio with 0.4% Trypan Blue solution (Sigma-Aldrich, Missouri, USA) before counting using hemocytometer. Approximately 10,000 cells from prepared spleen homogenates with high viability (more than 80%) per sample were used for single-cell partitioning and scRNA-seq library generation using the 10X Genomics Chromium Single Cell 3’ reagent kit v3 (10X Genomics, CA, USA). Sequencing was conducted on a NovaSeq600 platform using TruSeq Illumina primers. For sample preparations, a spleen from a single non-infected and 14 days post infection (dpi) mouse was used. As published previously (3), for 42dpi spleen cells suspension from a single mouse as well as pooled spleen cells suspension from 3 individual mice (1:1:1 ratio) were prepared, enabling the confirmation of reproducibility of the scRNA-seq results.
2.4 Single cell RNA sequencing data processing
2.4.1 Demultiplexing, alignment, and UMI counting
The raw based call (BCL) files generated from sequencer were processed with 10X Genomics Cellranger pipeline. In brief, using cellranger mkfastq, BCL files were demultiplexed into sample-specific FASTQ files. Subsequently, STAR aligner was employed to align sequenced reads to the10X pre-built mouse reference genome package (mm10) in the cellranger count command. Hence, cell barcodes and Unique Molecular Identifiers (UMI) were counted, filtered, and corrected to create expression matrices separately for each sample (non-infected, 14 dpi, 42 dpi), which were then utilized for further processing and analysis.
2.4.2 Ambient RNA and technical noise removal
Prior to analyzing by Seurat package, cellranger count outputs, including expression matrices before and after empty droplets filtering, were utilized by the SoupX software to estimate and remove ambient mRNA contamination for each sample (44). In brief, the ambient RNA expression profile was computed from empty droplets. This profile helps estimating the contamination fraction of the former in each cell, allowing each cell’s expression to be corrected based on the predicted contamination. In addition, genes which are known for causing technical background noise, Gm42418 and AY036118 (45) were manually removed from expression matrices.
2.4.3 Preprocessing and samples merging
Ambient RNA removed expression matrices were used as Seurat (v4.0) inputs to generate 3 individual Seurat objects for each time points (non-infected, 14 dpi, 42 dpi). Standard procedure for filtering low quality cells were applied for each sample separately. Cells having more than 6000 genes, cells expressing mitochondrial genes counting for more than 10% of total genes detected were excluded from analysis. Next, 3 objects were merged to create a combined dataset that contain splenocytes profiles derived from 3 different time point during infection. Subsequently, expression data was normalized using LogNormalize method with the scale factor set as to the default. Harmony package was utilized to remove any batch affect created by the technical differences between samples merging (46).
2.4.4 Dimensional reduction, clustering, and cell type annotation
2000 highly variable genes were detected using FindVariableFeatures command of Seurat package. The former was used to compute a principal component analysis (PCA) of which the output was used for non-linear dimensional reduction using Uniform Manifold Approximation and Projection (UMAP) method. The FindNeighbors and FindClusters functions were implemented for cell clustering. General cell type annotation for combined splenocytes data was carried out using markers collected from literature or based on the signature genes expressed in each cluster as results of FindAllMarkers function.
2.4.5 CD4+ T cell identify and re-clustering
Clusters expressing CD4+ T cell conventional markers such as Trbc1, Cd3e, Cd4 but not Natural Killer T cells such as Klrb1c or CD8 T cells such as Cd8a, Cd8b were identified and extracted from the combined dataset using the Subset function to create a new Seurat object. Starting with the FindVariableFeatures step, this newly generated object was subjected to another round of dimensional reduction and clustering analysis. The cell clusters formed as the result of this re-clustering analysis will be annotated using CD4+ T cell subpopulation markers collected from the literature. The resolution of clustering analysis was increased to further divide the Th1 compartment into sub-populations.
2.4.6 Visualization and downstream analysis
To obtain differentially expressed genes among annotated subpopulations, the Wilcoxon rank sum test was performed with the FindMarkers function of Seurat. All p values were corrected for multiple comparisons using the Benjamin-Hochberg method. The significant different expressed genes (adjusted p value ≤ 0.05) were ranked based on their log2 fold change and used as input of Gene ontology functional analysis using g:Profiler web server (47). Cellchat R package was implemented to predict the cell-cell communication mediated by ligand-receptor co-expression patterns between cell populations based on the database that contains both mouse and human ligand-receptor interaction information (48). For this analysis, the B cell subpopulation including follicular B cell and germinal center B cell were identified from combined dataset as describe in our previous study (10). For visualization, BBrowser3 (BioTuring Inc., San Diego California USA) was used to display the Seurat objects for UMAP and gene expression.
3 Results
3.1 scRNA-seq analysis of splenocytes during T. evansi infection
To systematically investigate the transcriptional landscape of the host’s immune cells during T. evansi infection, scRNA-seq was performed on splenocytes samples collected from mice at three different time points: Non-infected, 14 days post infection (dpi), and 42 dpi (Figure 1A). As T. evansi Merzouga 93 model causes chronic infection in mice that can persist up to 16 weeks (10), data from days 14 and 42 represent the host immune cells transcriptome profile during the acute and chronic stages of infection, respectively. Homogenized single-cell suspensions from isolated spleens were directly utilized to construct libraries for scRNA-seq, without any cell sorting processes. For each time point, sequencing was performed and processed individually using the 10X Genomics pipeline. The number of UMI counts, the number of identified genes, and the proportion of mitochondrial genes were used in the quality assessment step to select high quality cells for further investigation. Notably, in order to capture neutrophil population that only express a few hundred genes rather than thousands as in other immune cells (49), only an upper threshold for the number of identified genes (6000 genes) was set to eliminate doublets, with no lower threshold specified. An ambient RNA removal step was mandatory while handling from infected mice, as the latter have an excessive quantity of ambient RNA contamination coming from immunoglobulin coding genes that leaked out from plasma cells during the GEM generation process. Additionally, genes known to generate technical background noise, such as Gm42418 and AY036118, were deleted from expression matrices prior to Seurat processing and downstream analysis (Figure 1A).
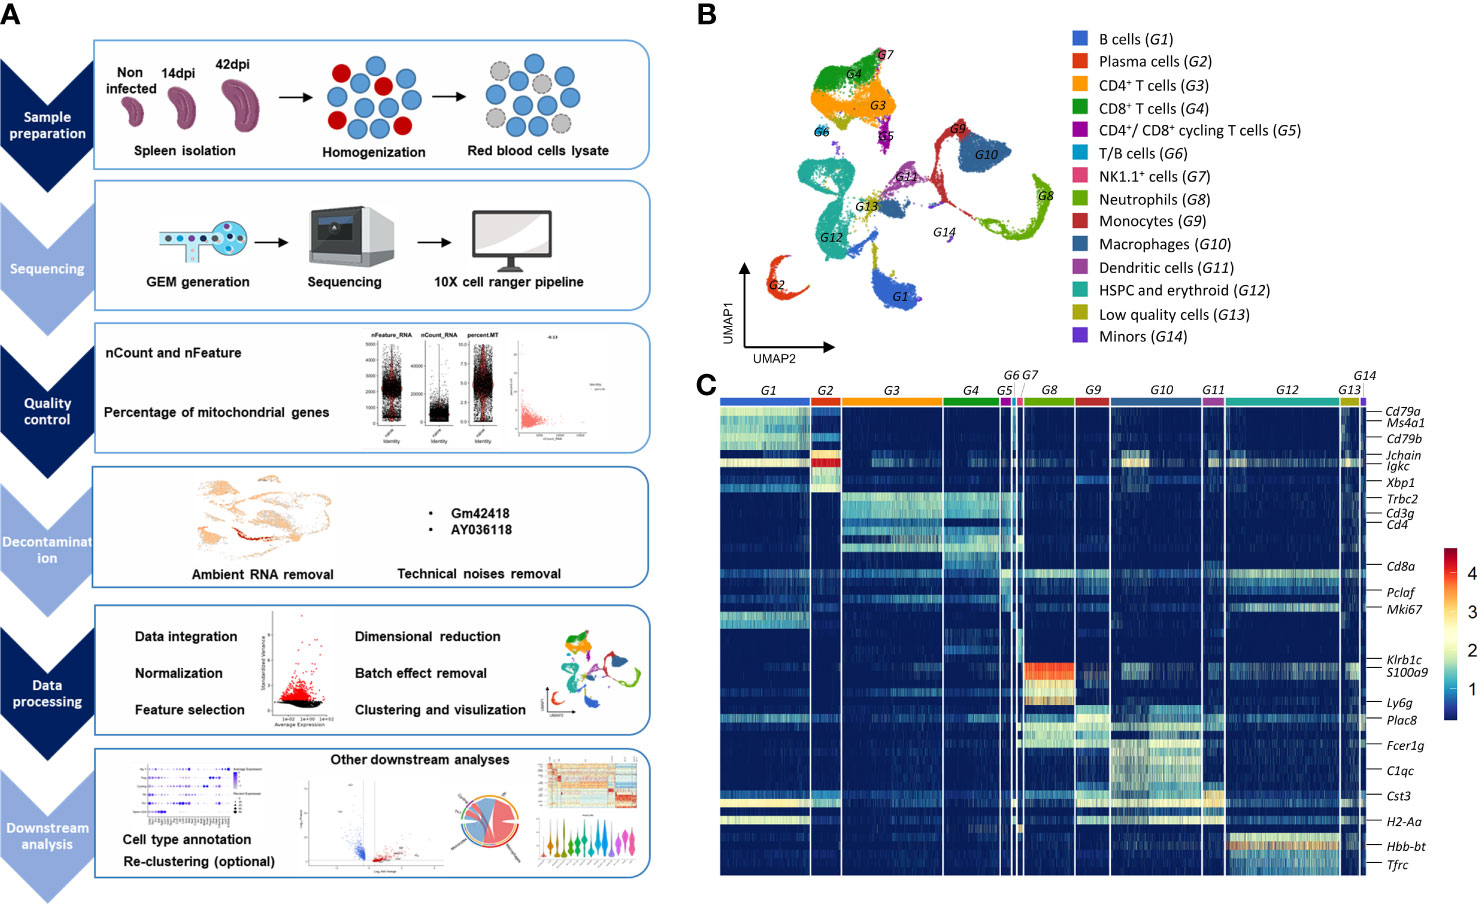
Figure 1 Overview of the approaches used for analyzing transcriptomic landscape of splenocytes during T. evansi infection. (A) Experimental setup for scRNA-seq experiment. (B) UMAP projection of total spleen cells combined from all datasets. Cell clusters are colored as results of cell type annotation using curated marker gene list. (C) Heatmap showing average expression of combined top five differentially expressed genes per each cell group, allowing cell type annotation. Only major genes are highlighted. The name of cell groups (G1 to G14) is same as in (B).
Unsupervised graph-based clustering of a total of 30,321 cells integrated from three datasets at three different time points yielded 33 clusters, which were further annotated to 14 cell groups, based on the expression of canonical cell type markers (Figures 1B, C). B cells (G1), plasma cells (G2), CD4+ (G3) and CD8+ (G4) T cells, NK1.1+ cells (G7), neutrophils (G8), monocytes (G9), macrophages (G10), dendritic cells (G11), and stem cell and erythroid lineage cells (G12) have been identified (Figure 1B). During infection, highly proliferating activated CD4+ and CD8+ T cells formed a distinct group (G5), which was distinguished not only by their cell type makers (Cd3g, Trbc1, and Cd4 or Cd8a), but also by proliferation-related genes including Mki67 and Pclaf. Notably, because no lower threshold for the number of identified genes was set in order to capture neutrophils population, some low quality cells (low number of detected genes) that exhibited no expression of neutrophil markers such as S100a9 or Ly6g were included in the study. These cells had however no upregulated genes in their profiles. Hence, they were labeled as low quality cells (G13) and were eliminated from further analysis. Additionally, cells in the B/T cell group (G6) with high expression levels of both B cell markers (Cd79a, Ms4a1, Cd79b) and T cell markers (Cd3g, Trbc1, Cd4) were also removed from further analysis because they were reported as an artifact caused by contact-dependent interaction between T cells and B cells (50, 51).
3.2 Stepwise cells clustering reveals heterogeneity of CD4+ T cell subpopulations and the predominant of Th1 cells during T. evansi infection
CD4+ T cells (G3 and Cd4 expressing cells within G5) were selected from the integrated dataset, and subjected to a new round of dimensional reduction and unsupervised clustering analysis. This approach yielded distinct 6 clusters which were annotated to 6 different subpopulations of CD4+ T cells (Figure 2A) including Naïve CD4+ T cell, T follicular helper cells (Tfh), type 1 helper T cell (Th1), cycling T cell, regulatory T cell (Treg), and a newly discovered myeloid cell phenotype expressing T cell (My T). Figure 2B shows the list of genes utilized for annotation, as well as the expression profiles of all subpopulations on those genes. Naïve CD4+ T cells were identified by their enhanced expression of Il7r, Sell, and Ccr7 genes, as well as their low expression of the memory and effector T cell marker Cd44. Th1 cells highly express Ccr5, Id2, Ccl5, and Tbx21, the gene coding for well-known transcription factor T-bet. Interestingly, in this setting Th1 cells also exhibit high expression level of Ifng, encoding for IFN-γ, one of the key inflammatory cytokines produced in response to trypanosome infections. Multiple signature genes of type 2 helper T cells (Th2) and T helper 17 cells (Th17) were used in attempt to identify these two subpopulations, but the lack of consistent expression finally indicated the absence of both populations (Figure S1). The transcription factors Tox2 and Bcl6, and Cxcr5 were used for Tfh identification. The cycling T cell subpopulation was marked by the upregulated expression of two proliferating genes Mki67 and Pclaf, while Tregs were specifically distinguished by the transcription factor Foxp3, Il2ra coding for the IL-2 receptor, and the co-inhibitory molecule Ctla4. Intriguingly, clustering analysis showed a subpopulation of CD4+ My T cells, strongly expressing myeloid cell signature genes including Apoe, Lyz2, and S100a9. This subpopulation of Cd3e+Trbc1+ T cells can express genes usually associated with the myeloid transcriptome (52). It is the first time this subset has been observed in trypanosomosis. To characterise a possible role of My T cells during infection, a cell-cell interaction analysis was performed using Cellchat. The obtained results reveal a network of molecular communication between My T cells, macrophages, monocytes, dendritic cells, follicular B cells, and neutrophils, in chronically infected mice. Figure S2 indicates that My T cells communicate with macrophages, based on interaction between integrin alpha-4/beta-1 (ITGA4/ITGB1) and vascular adhesion protein 1 (Vcam1). Another dominant interface involves Ccl5 gene expression by My T cells, signaling to Ccr5 expressing macrophages, Ccr5+/Ccr1+ monocytes, and Ccr1+ neutrophils. These interactions between C-C motif chemokine 5 and its receptors trigger T cell migration to the infection site. In addition, expression of Selplg by My T cells indicates a possible interaction with neutrophils expressing Sell. While the Selplg gene encodes p-selectin glycoprotein ligand 1, Sell codes for calcium-dependent L -selectin, mediating cell adhesion by binding to glycoproteins on neighboring cells. Finally, our data suggests that macrophages, monocytes, dendritic cells and B cells could communicate with My T cells by engaging in antigen presentation.
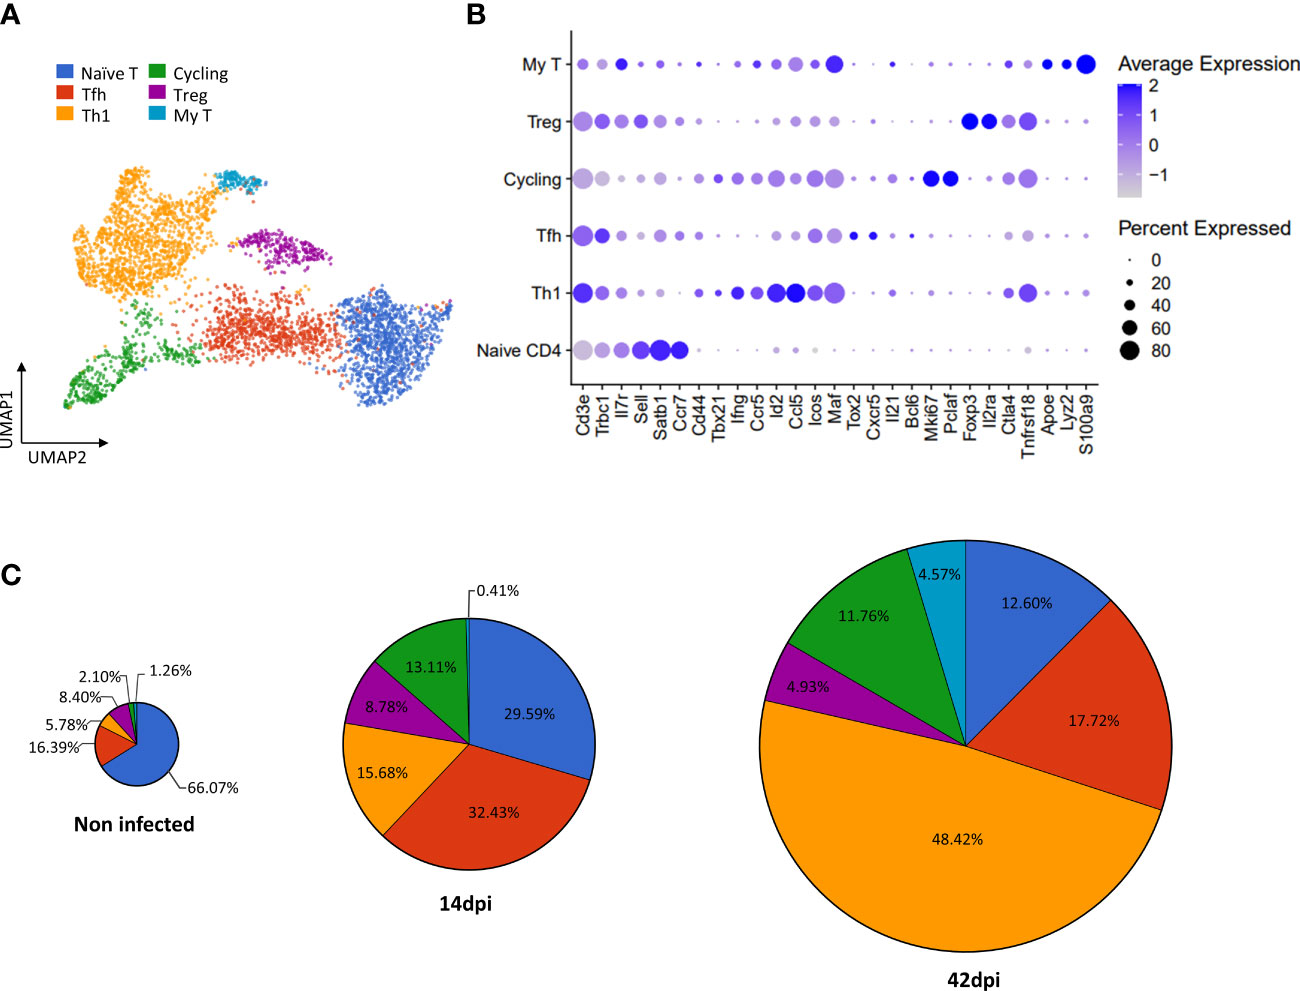
Figure 2 scRNA-seq based identification of CD4+ T cell subpopulations and alterations of their absolute number during T. evansi infection. (A) UMAP projection of CD4+ T cells colored by annotated subpopulations. Naïve CD4 T cell, Tfh: Follicular helper T cells, Th1: T helper 1 cells, cycling: Cycling CD4+ T cells, Tregs: Regulatory T cells, My T: T cells expressing myeloid gene markers. (B) Average expression of gene markers used for annotating T cell subpopulations. (C) Proportion of total cell number for each subpopulation during infection.
Based on the outlined cell annotations, infection-induced alterations of cell number for each subpopulation were calculated (Figure 2C). As T. evansi infections induce T cell activation, the naïve CD4+ T cell count shows a continuous decrease in percentage, from 66.07% in the non-infected sample, to 29.59% at 14 dpi and 12.60% at 42 dpi. On the other hand, effector T cells including cycling T cells and Th1 cells rapidly expand their population. Indeed, while Th1 cells contribute for only 5.78% of total CD4+ T cells during homeostasis, their population size increased rapidly, reaching 15.68% at 14 dpi and 48.42% at 42 dpi. It is worth mentioning that aside from the increase in percentage, the rise in absolute total spleen cell number caused by infection-induced splenomegaly, results in an increased absolute number of Th1 cells in infected mice. Tfh cells account for 32.40% of total CD4+ T cells on day 14 post infection, which is twice the percentage found in the non-infected sample. However, in the chronic stage (42 dpi), the fraction of these cells drops to 17.72%. Surprisingly, Tregs which are expected to play a significant role in modulating inflammation during chronic stage of trypanosomosis, represent only 8.78% of the total T ell population at 14dpi. This number further decreases to 4.93% by day 42 post infection. Finally, whereas My T cells are present as a minor subpopulation in non-infected and 14 dpi conditions (1.26% and 0.41%, respectively), they contribute to 4.57% of CD4+ T cells during the chronic stage of infection.
3.3 Transcriptome profiles of Th1 cells show an activation phenotype during infection.
Annotation and quantification of cell types show that Th1 cells accumulate and dominate in the absence of Th2 and Th17 cells, indicating a persistent inflammatory type 1 response throughout T. evansi infection. While a helper type 1 response with the production of inflammatory cytokines may aid in the reduction of parasite load during the acute stage, prolonged inflammatory response is frequently associated with immunopathology. Thus, in order to better understand the role of accumulating Th1 T cells in disease progression, the possible functions of this subpopulation were investigated in greater detail via their transcriptome profiles (Figure 3). Besides expressing the transcription factor T-bet (Tbx21), differential expression analysis reveals that Th1 cells exhibit enhanced expression levels of Ifng and Il21. The overall gene expression pattern of Th1 cells shows some degree of heterogeneity (Figure 3A). To provide in-depth analysis of cellular diversity, Th1 cells were further divided into 4 subpopulations (S1-S4) by increasing the resolution of clustering analysis. As demonstrated in Figure S3, subpopulation S1 shows upregulation of genes coding for Ifng, Il10, and molecules involved in T cell activation and survival such as Nkg7 or Lgals1. On other hand, cells in S2 have upregulated expression of the Srgn gene, responsible for regulation of TNF secretion. Subpopulation S3-S4 show transcription patterns related to T cell differentiation, hallmarked by elevated expression of Klf2 and Id2 genes, encoding factors reinforcing differentiation to Th1. Interestingly, also cycling T cells express Tbx21, Ifng, Il21 genes, albeit to a lesser extent, suggesting that the cycling T cells subpopulation leans towards a the Th1 cell phenotype (Figure 3A).
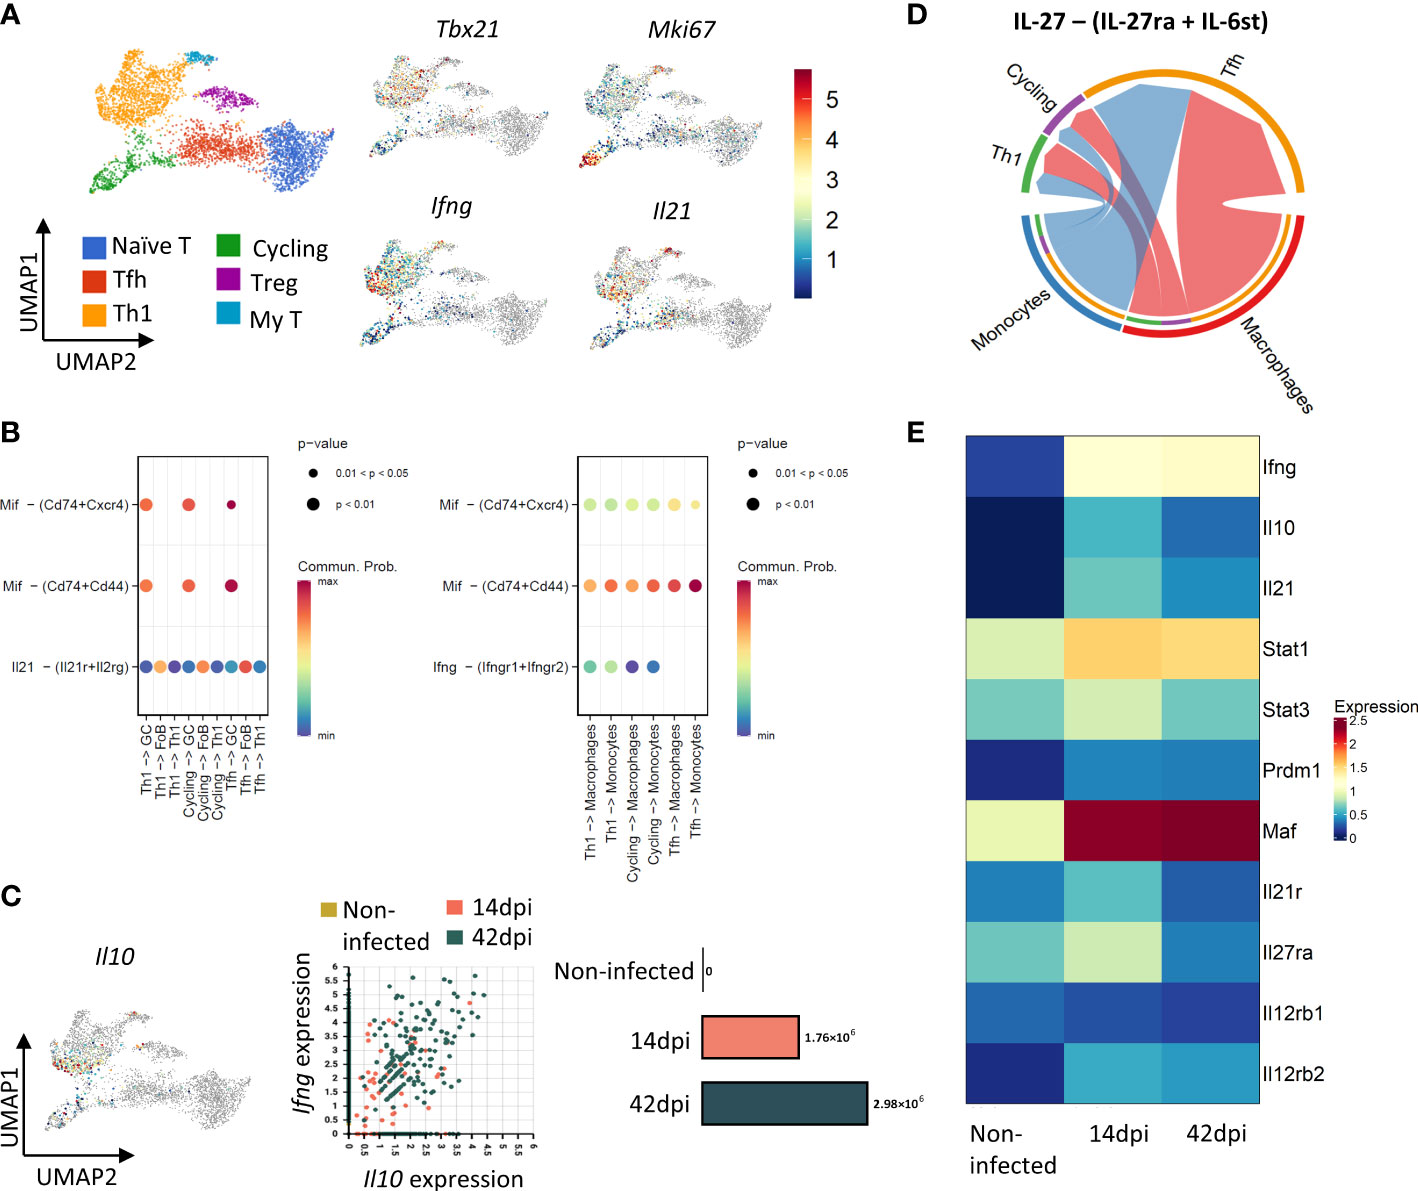
Figure 3 CD4+Th1 cells show helper and regulatory phenotypes during T. evansi infection. (A) UMAP projection of CD4+ T cells colored by their subpopulation (left panel) and by their expression of Tbx21 (T-bet), Ifng (INF-γ), Mki67 (KI67), and Il21 (right panel). Color scale indicates gene expression level; grey color: No expression observed. (B) Inferred signaling communication between CD4+ T cells and B cells (left panel), Monocytes – Macrophages (right panel) at 14 dpi. (C) Left panel: UMAP showing expression of Il10. Right panels: Distribution of Th1 cells based on their Ifng and Il10 expression level and absolute number of Cd4+Ifng+Il10+ T cells across time point. (D) Inferred IL-27 signaling communication between Monocytes and Macrophages and CD4+ T cells at 14d pi. (E) Heatmap showing average expression of genes related to induction of IL10 expression and Il12 receptor signaling in Th1 cells across time point.
As the main function of Th1 cells during the acute stage of infection is helping the onset of inflammation, the probability pattern of cell-cell communication among populations was examined by computing the expression of genes coding for signaling ligands, receptors, and secreted molecules within cell clusters of the 14 dpi scRNA-seq dataset (Figure 3B). Results indicate a significant interaction between Th1 cells and B cell, monocytes and macrophages. Besides cell-cell contacts involving MHC-II interaction, co-stimulation, and intercellular adhesion (Figure S4), Th1 cells engage in communication between B cells and monocytes/macrophages via the interactions between Th1-derived Macrophage migration inhibitory factor (MIF) and its CD74/CD44/CXCR4 receptors (Figure 3B) (53). The analysis also suggests that infection triggers IL-21 mediated signalling between Th1, Tfh, cycling T cells and the IL-21 receptor expressed on Follicular B cells (FoB) and, to a lesser extent, germinal center B cells (GC) (Figure 3B, left panel). Furthermore, IFN-γ signaling is demonstrated between Th1 cells and monocytes as well as macrophages (Figure 3B, right panel). Taken together, cell-cell interaction analysis indicates that by day 14 of infection, Th1 T cells show a transcriptome signature that is indicative of assisting B cells and innate immune cells in their response to infection.
Surprisingly, a fraction of the Th1 cell population is characterized by simultaneous a high expression of Il10 and Ifng. The number of these ‘double expressors’ increases towards the end of infection (Figure 3C). At the same time, cell-cell contact analysis suggests IL-27-driven communication between macrophages/monocytes and Th1/cycling T cells (Figure 3D). High expression of IL-27 coding genes including Il27 (Il27a) and Ebi3 (Il27b) were recorded in monocytes and macrophages (Figure S5), coinciding with upregulation of IL-27 receptor gene Il27ra in Th1 cells by 14 dpi (Figure 3E). As the IL-27 signalling pathway is known to result in IL-10 production, the expression of genes involved in the IL-27 pathway, such as Stat1, Stat3, Prdm1 (Blimp) and Maf (c-Maf), was checked in Th1 cells. In general, the average expression of these genes peaked by day 14 dpi before slightly decreasing towards 42 dpi, however remaining higher than the levels recorded in non-infected mice (Figure 3E). Th1 cells present in 14dpi and 42 dpi samples also showed upregulated expression of Il12rb2 gene coding β2 subunit of the IL-12 receptor, known to be elevated in the presence of IFN-γ. The expression of Il12rb1 subunit gene of the IL-12 receptor remained low in all samples.
3.4 Th1 cells, but not Tregs, exhibit an IL-10 regulatory signature during T. evansi infection
During chronic infections, the production of IL-10 is often thought of as a main functional characteristic of Tregs, preventing excessive inflammatory pathology. However, our scRNA-seq dataset has shown virtually no Foxp3+Il2ra+ Tregs with high Il10 gene expression (Figure 3C, left panel). Additionally, infection-induced Treg cells do not express any cytokines involved in trypanosomosis control or pathology (Figure S6). In contrast, the majority of cells expressing Il10 are Th1 cells, suggesting an alternative role of these cells, besides helping the onset of infection associated inflammatory responses. Interestingly, while Th1 cells maintained elevated expression of Il10ra gene at both time points of infection, Tregs transiently upregulated expression at 14 dpi followed by downregulation at 42 dpi (Figure S6). Hence, a detailed differential gene expression analysis was performed to compare the transcriptome profiles of infection induced Th1 cells (14 and 42 dpi respectively) with Th1 cells from non-infected controls (Figures 4A, C). Next, upregulated genes at 14 dpi and 42 dpi were subjected to further functional Gene ontology analysis (Figures 4 B, D). The results show that by 14 dpi, Th1 cells upregulated genes previously described as being involved in (i) responses to infection, such as the defense response to protozoan parasites, (ii) lymphocytes and T cell activation including their metabolic pathways such as proteolysis or cellular protein metabolic process, and (iii) positive cytokines production pathways. Additionally, Th1 cells at 14 dpi also upregulated genes related to programed cell death via apoptotic process (Figure 4B). In contrast, by 42 dpi, Th1 cells upregulated genes more related to (i) regulatory pathways involved in T cells and immune system activation or (ii) negative regulation of cytokine production (Figure 4D). It is important to note that both 14 dpi and 42 dpi derived Th1 cells showed upregulation of Il10 compared to Non-infected Th1s (Figures 4A, C). When compared to 14 dpi, the 42 dpi-derived Th1 cells were characterized by the increased expression of genes involved in negative regulation of lymphocytes and T cell differentiation as well as negative regulation of IFN-γ production (Figure 4F).
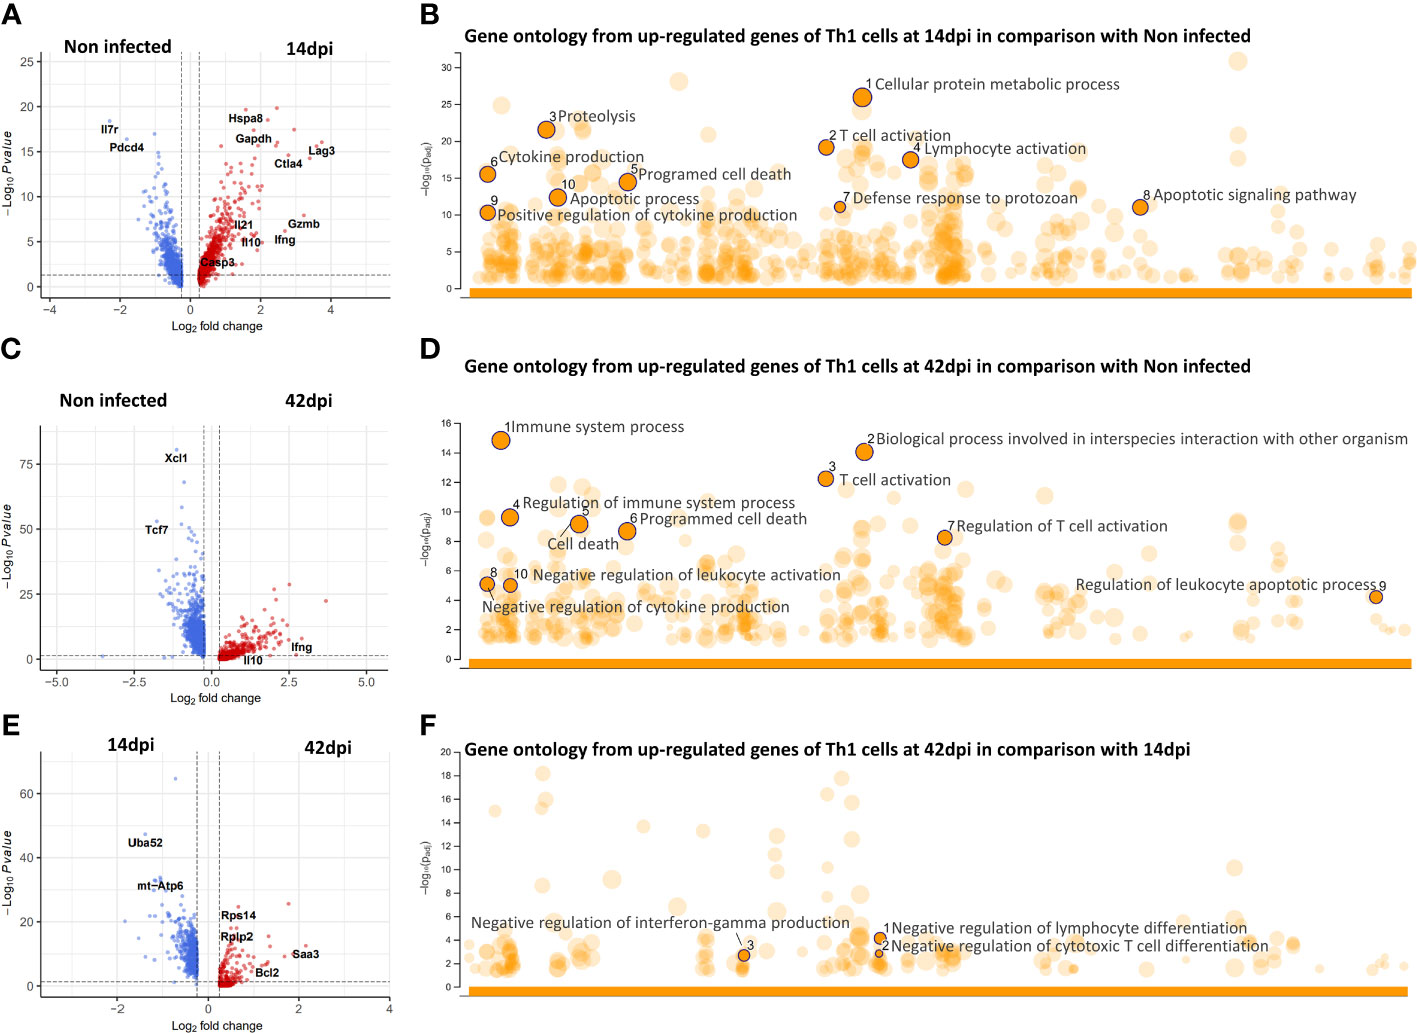
Figure 4 Differential gene expression and gene ontology analysis of CD4+Th1 cells during infection. (A, C, E) Volcano plots showing differential expressed genes of Th1 cells between experimental conditions. (B, D, F) Gene ontology enrichment based on upregulated genes from respective DEG analysis.
3.5 Ctla4 gene expression on Tfh may play a role in germinal center response
During early T. evansi infection (14 dpi), the Tfh subpopulation is characterized by a high expression level of Ctla4, the gene coding for co-inhibitory receptor CTLR-4, involved in regulation of Tfh activation during germinal center response (Figures 5A, B). As antigen presenting follicular dendritic cells, B cells, and Tfh cells all participate in germinal center formation upon infection, intercellular communication between these cells was examined at 14 dpi. Figure 5C shows that in addition to the B7-2 (CD86)-CD28 signaling pathway, the interaction between B7-2 (CD86) and the inhibitory molecule CTLR-4 on Tfh was induced. This, in turn, may have a negative effect on antigen presentation, B cell selection and survival in germinal centers (54). Due to infection-induce depletion of B cell populations including germinal center B cells (GCs) and FoBs (10), the same analysis is impossible to performed at 42dpi. Finally, it is worth mentioning that the expression of Ctla4 gene within the Treg population was downregulated at 42 dpi (Figure 5B), once more indicating the limited regulatory function of this cell type during the chronic stage of infection.
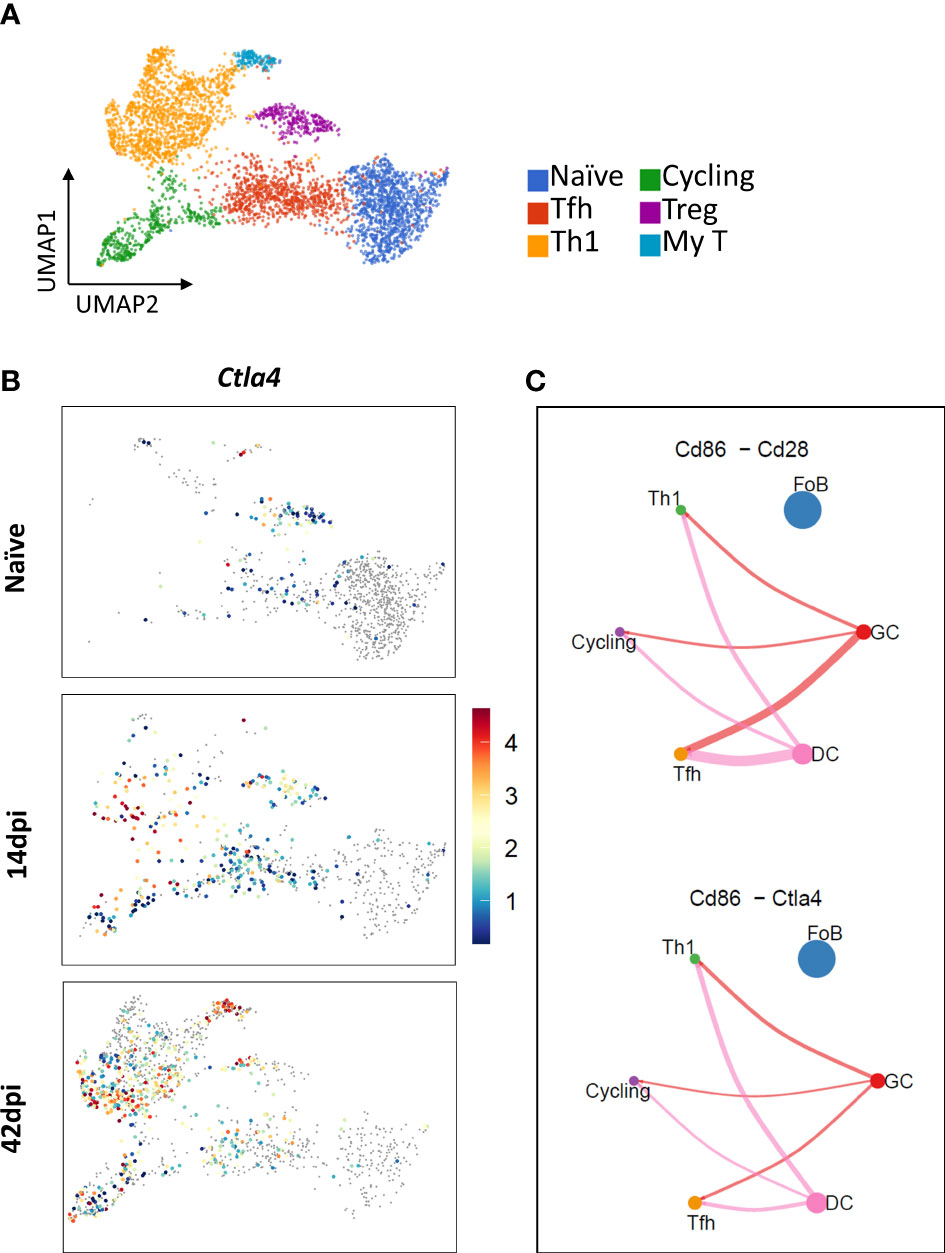
Figure 5 Expression of Ctla4 gene encoding inhibitory receptor CTRL-4 in Tfh and Tregs, and interactions of Tfh-, Th1-, and cycling T cells with GCs and FoBs. (A) UMAP projection of CD4 T cells colored by annotated subpopulations. (B) UMAP projection showing expression level of Ctla4 across time points during infection. Color scale indicates gene expression level; grey color: No expression observed. (C) Inferred B7-2 (CD86) – CD28/CTLA-4 interactions between Dendritic cells (DC, pink circle), B cells (FoB as blue circle and GC as red circle), and T cells (Th1 as green circle, cycling T cells as purple circle, and Tfh as yellow circle) at 14 dpi. Circle size is proportional to the number of cells in each subpopulation and line width represents the interaction probability.
4 Discussion
The implementation of scRNA-seq technology in infectious disease researches is constantly increasing our understanding of host-pathogen interactions. In the field of trypanosomosis research in particular, the use of scRNA-seq has recently revealed significant new findings on immune cell heterogeneity and response mechanisms to infection. These help to better understanding intercellular communications during infection, within various tissue microenvironments (3, 10, 12, 13). Taking advantage of the technique, our present study provides a comprehensive customized pipeline for the handling of infection-derived scRNA-seq datasets, capturing (i) the transcriptomic landscape of immune cells, and (ii) the heterogeneity and alteration of CD4+ T cells in particular, along with their potential interactions with other cell populations. In order to understand the pathology of trypanosome infections in either humans or animals, a focus on T cell biology is crucial. Indeed, the initiation of the inflammatory brain pathology observed in sleeping sickness patients, as well as the subsequent infiltration of trypanosomes deep into the brain parenchyma, are both initiated through the activation of the host T cell compartment (7). In animal trypanosomosis, which is generally not associated with neurological pathology but is rather characterized by a severe anemia driven wasting disorder, inflammation is also trigger by the early activation of T cells (30). As the first signs of T-cell initiated trypanosomosis inflammation in experimental infection model have been reported in the host’s spleen, this cellular immune compartment was chosen as the target here. As a result, this study is the first in its kind to identify and define a new regulatory function of CD4+ Th1 cells, induced during the progression of trypanosome infections.
In the spleen, cell type annotation and quantification analysis demonstrated the heterogeneity of CD4+ T cells during T. evansi infection, revealing the presence of 6 distinct cell subpopulations. These include Naïve CD4+ T cells, Th1s, Tfhs, Tregs, cycling T cells, and My T cells. Interestingly, no Th2 cells were present in this C57BL/6 infection model. Likewise, the clustering of scRNA-seq data did not yield a Th17 cell population here. These observations corroborate earlier observations from a T. congolense infection model, showing that Th2 and Th17 cells mainly occur in hyper-susceptible BALB/c mice, which suffer from early infection, induce mortality and fail to develop a chronic well-controlled parasitemia phase (55). Interestingly, My T cells, a newly discovered subpopulation of T cells, do appear in our analysis. The biological functionality of these is elusive at this stage (52). Our dataset however shows that in T. evansi infections, this cell population expresses low to moderate level of genes related to cytokines production.
Resistance to T. brucei and T. congolense relies on the capacity of the host to mount an early Th1 response, hallmarked by production of pro-inflammatory cytokines such as INF-γ and TNFα, as well as nitric oxide (NO) (25, 56–58). In case of T. evansi, the control of infection is mainly attributed to induction of early IgM responses (10, 59). However, in a setting of intracellular antigen vaccination, followed by lethal T. evansi challenge, increased INF-γ production is also considered as a correlate of protection (60). In our study, we demonstrate that infection-induced immunity of mice is polarized toward a Th1 response, with an exponential growth and dominance of Tbx21+ Ccr5+ Id2+Th1 cells at 14 and 42 dpi. The transcriptome profile-suggested function of these cells differs however between the acute and chronic stages of infection. Indeed, during the acute stage, cell-cell contact analysis proposes the participation of Th1 cells in the response to infection by producing INF-γ. As such helping to activate monocytes and macrophages. In addition, these cells are also responsible for the production of Macrophages Migration Inhibitor Factor (MIF) and IL-21. The presence of Mif transcription upregulation is interesting, as during trypanosomosis it is a crucial mediator of inflammation, triggering B cell and monocyte/macrophage chemotaxis (29). On the other hand, T cell-derived IL-21 signaling is considered critical for the induction of Aicda, Blimp1, and Xbp-1 expression in B cells, thus driving terminal differentiation into IgGs producing PCs (61). This is in line with our previous finding, showing that during T. evansi infection B cells exhibit an accelerated terminal differentiation in to IgG+ PCs (10). Unfortunately, in case of trypanosome infections, this adaptive response appears ineffective in controlling parasitemia. Indeed, we have suggested in the past that T. evansi parasites hijack and accelerate the natural host IgG differentiation process, as a decoy mechanism to evade the lethal killing effect of IgMs. Consequently, the positive helper function of Th1 during early T. evansi infection is mainly attributed to their capacity to produce INF-γ, needed for subsequent production of TNF and trypanotoxic nitric oxide (NO) by activated macrophages. This is confirmed by functional gene ontology analysis using upregulated gene list of Th1 cells at acute stage of infection, showing a signature of positive cytokine production and lymphocytes/T cell activation.
It is known that in order to counterbalance INF-γ-associated inflammation, the trypanosome infected host must be able to mount an anti-inflammatory IL-10 response. An imbalance between these two leads to the early death of the host (3, 26, 62). Interestingly, our analysis demonstrates that the accumulation of Th1 cells throughout infection goes along with the induction of double-positive Il10+Ifng+ CD4+ T cells. This observation corroborates a previous report, showing the induction of CD4+IL-10+INF-γ+ cells by flow cytometry in T. brucei infected mice (28). In contrast, such cells were not found during the analysis of T. congolense infections (34), indicating that both parasites might have developed different ways of interacting with the immune system during the early stage of infection. This should hardly be surprising as T. congolense parasites are unable to extravagate from the bloodstream, while T. brucei and T. evansi parasites are known to use various tissues as survival niches (9, 12, 63, 64). It is worth noting that the phenotype of the Il10+Ifng+ CD4+ T cells described in this study is very similar to type 1 regulatory T cells (Tr1), as both are Foxp3- CD4+ T cells. However, as demonstrated in our analysis, Il10+Ifng+Th1 cells exhibit a transient expression profile of Il10 while maintaining a high expression level of the Th1 specific marker Tbx21 (T-bet). Unsupervised clustering analysis categorized these cells in the same cluster with conventional Th1 cells, suggesting that upregulation of Il10 is a response of Th1 to infection, rather than the emergency of a distinct subpopulation. Compared to non-infected Th1 cells, infection induces upregulation of genes related to the IL-27 and IL-21 signaling, both pathways are known to trigger Il10 transcription (65–68). At the same time cell-cell contact analysis suggests an IL-27-driven communication between macrophages/monocytes and T cells. Based on our data, we propose that during trypanosome infection monocytes and macrophages secrete IL-27, which binds to IL-27 receptor on Th1 cells. This in turn triggers STAT1 and STAT3-dependent transcription of c-Maf or Blimp1, which drive Il10 and Il21 gene transcription. Subsequently, IL-10 and IL-21 production by Th1 cells is initiated. In addition, binding of IL-21 to the IL-21 surface receptor on Th1 cells further enhances autocrine IL-10 secretion. This transcriptomic discovery explains the why a previous trypanosomosis pathology study found a crucial role of IL-27 signaling on CD4+ Th1 cells, necessary for preventing early host mortality via inhibition of a T-cell driven hyper-inflammation (69).
As outlined above, IL-10 is necessary for prolonged survival of trypanosome infected animal (58, 62). Although IL-10 can be secreted by a wide variety of cells (70–72), production by Tregs has been proposed to be important in various infection models (73). With respect to trypanosome infections, these cells however have only been found during chronic T. congolense infections. In contrast, while the artificial induction of Tregs was shown to have a beneficial effect on the survival of T. brucei infected mice, the induction of these cells by the infection itself has never been demonstrated (39). In our study, only a minor increase in Treg numbers was observed at 14 dpi, followed by a decline in cell frequency during the chronic infection stage. Most importantly, these cells showed little to no expression of Il10. Hence, we propose that in T. evansi infection induced Tregs do not play a major role in regulating anti-inflammatory response. Instead, we proposed that IL-10 production from IL-10+INF-γ+Th1 cells is crucial for dampening inflammation, similarly to what was found in T. gondii and L. major infection (74, 75). Indeed, our data show that upregulation of Il10 during T. evansi infection may be an autocrine regulation signal of Th1 cells, dampening INF-γ triggered hyper-activation. In addition, the fact that Il10 was upregulated as early as 14 dpi, may be a signature of the T cells immunosuppression (76, 77). When considering trypanosomosis-associated immunosuppression, the presence of a Tfh cells during acute stage of T. evansi infection is another important finding. These cells normally play a key role in the activation process of follicular and germinal center B cells, involving the interaction between of the B7-2 (CD86) molecule on B cell and dendritic cell surface and CD28 on the surface of T cells (78). However, at 14 dpi Tfh cells were shown to express high level of Clta4. This inhibitory molecule was originally thought to be primarily expressed by Treg, where it competes with CD28 for binding B7 molecules to block costimulatory signaling (73). By showing its expression on Tfh at 14 dpi, our analysis suggests that triggering the induction of the CD86-CTLA-4 interaction will lead to a lack of cos-stimulatory signal, which subsequently will result in inefficient germinal center response (GC) during acute stage of T. evansi infection. This finding is in line with our results that reported the lack of GC formation during T. evansi infection progression (10). The biological significance of this finding is that it explains why the immune system of a trypanosome infected host gears towards production of low-affinity polyclonal antibodies, and is prevented from making high-affinity specific anti-parasite antibodies.
5 Conclusions
In conclusion, our study utilized a scRNA-seq analysis to capture the T. evansi parasitemia associated transcriptomic profile of CD4+ T cells. This high-resolution approach provides results that allow to speculate on the function of CD4+ T cell subpopulations in response to infection. First, our results demonstrate the induction of a distinct Ifng+ Il10+ Il21+ Th1 T cell population. The latter assists in controlling the early phase of infection, while self-regulating its hyper-activation during chronic stage. This, in turn, contributes to reduction of inflammation-induced pathology, allowing prolonged survival of infected animals. In addition, we show that during T. evansi infections Tregs do not contribute in a major way to the expression of regulatory cytokines, and hence must only play a limited role in control of inflammation during chronic infection. Finally, based on the combined cell transcriptome analysis, we suggested a new immunosuppressive role for CD4+ Tfh cells during the chromic stage of trypanosomosis.
Data availability statement
scRNA sequencing (scRNA-seq) datasets used in this study are publicly available in the BioStudies EMBL-EBI database (www.ebi.ac.uk/biostudies). The datasets can be accessed under the accession numbers E-MTAB-10174, which originated from https://doi.org/10.1371/journal.ppat.1010026, and E-MTAB-12109, which originated from https://doi.org/10.3389/fimmu.2022.1051647.
Ethics statement
The animal study was reviewed and approved by Ghent University Global Campus Institutional Animal Care (GUGC IACUC).
Author contributions
Conceptualization, MR, SM, HN, Investigation, HN, MR, SM, Data analysis and interpretation, HN, MR, SM, Writing, HN, SM, MR, Critical revision, MR, SM, Visualization, HN, Funding Acquisition, SM, MR. All authors contributed to the article and approved the submitted version.
Funding
This work was supported by Ghent University Global Campus core funding, UGent BOF grant number BOF.STG.2018.0009.01/01N01518 and FWO grant number G013518N.
Acknowledgments
We thank Boyoon Choi for the discussion on Gene ontology analysis. We also would like to thank Bolortsetseg Baatar for the assistance in samples preparation.
Conflict of interest
The authors declare that the research was conducted in the absence of any commercial or financial relationships that could be construed as a potential conflict of interest.
Publisher’s note
All claims expressed in this article are solely those of the authors and do not necessarily represent those of their affiliated organizations, or those of the publisher, the editors and the reviewers. Any product that may be evaluated in this article, or claim that may be made by its manufacturer, is not guaranteed or endorsed by the publisher.
Supplementary material
The Supplementary Material for this article can be found online at: https://www.frontiersin.org/articles/10.3389/fitd.2023.1127022/full#supplementary-material
References
1. Desquesnes M, Holzmuller P, Lai DH, Dargantes A, Lun ZR, Jittaplapong S. Trypanosoma evansi and surra: A review and perspectives on origin, history, distribution, taxonomy, morphology, hosts, and pathogenic effects. BioMed Res Int (2013) 2013:194176. doi: 10.1155/2013/194176
2. Kumar R, Gupta S, Bhutia WD, Vaid RK, Kumar S. Atypical human trypanosomosis: Potentially emerging disease with lack of understanding. Zoonoses Public Health (2022) 69(4):259–76. doi: 10.1111/zph.12945
3. Nguyen HTT, Radwanska M, Magez S. Tipping the balance between erythroid cell differentiation and induction of anemia in response to the inflammatory pathology associated with chronic trypanosome infections. Front Immunol (2022) 13:1051647. doi: 10.3389/fimmu.2022.1051647
4. Desquesnes M, Dargantes A, Lai DH, Lun ZR, Holzmuller P, Jittapalapong S. Trypanosoma evansi and surra: A review and perspectives on transmission, epidemiology and control, impact, and zoonotic aspects. BioMed Res Int (2013) 2013:321237. doi: 10.1155/2013/321237
5. Magez S, Pinto Torres JE, Oh S, Radwanska M. Salivarian trypanosomes have adopted intricate host-pathogen interaction mechanisms that ensure survival in plain sight of the adaptive immune system. Pathogens. (2021) 10(6):679. doi: 10.3390/pathogens10060679
6. Radwanska M, Vereecke N, Deleeuw V, Pinto J, Magez S. Salivarian trypanosomosis: A review of parasites involved, their global distribution and their interaction with the innate and adaptive mammalian host immune system. Front Immunol (2018) 9:2253. doi: 10.3389/fimmu.2018.02253
7. Pays E, Radwanska M, Magez S. The pathogenesis of African trypanosomiasis. Annu Rev Pathol: Mechanisms of Disease (2023) 18:19–45. doi: 10.1146/annurev-pathmechdis-031621-025153
8. Magez S, Pinto Torres JE, Obishakin E, Radwanska M. Infections with extracellular trypanosomes require control by efficient innate immune mechanisms and can result in the destruction of the mammalian humoral immune system. Front Immunol (2020) 11:382. doi: 10.3389/fimmu.2020.00382
9. Machado H, Bizarra-Rebelo T, Costa-Sequeira M, Trindade S, Carvalho T, Rijo-Ferreira F, et al. Trypanosoma brucei triggers a broad immune response in the adipose tissue. PloS Pathog (2021) 17(9):e1009933. doi: 10.1371/journal.ppat.1009933
10. Nguyen HTT, Guevarra RB, Magez S, Radwanska M. Single-cell transcriptome profiling and the use of AID deficient mice reveal that b cell activation combined with antibody class switch recombination and somatic hypermutation do not benefit the control of experimental trypanosomosis. PloS Pathog (2021) 17(11):e1010026. doi: 10.1371/journal.ppat.1010026
11. Silva Pereira S, De Niz M, Serre K, Ouarné M, Coelho JE, Franco CA, et al. Immunopathology and trypanosoma congolense parasite sequestration cause acute cerebral trypanosomiasis. Elife. (2022) 11:e77440. doi: 10.7554/eLife.77440
12. Quintana JF, Chandrasegaran P, Sinton MC, Briggs EM, Otto TD, Heslop R, et al. Single cell and spatial transcriptomic analyses reveal microglia-plasma cell crosstalk in the brain during Trypanosoma brucei infection. Nat Commun (2022) 13(1):5752. doi: 10.1038/s41467-022-33542-z
13. De Vlaminck K, Van Hove H, Kancheva D, Scheyltjens I, Pombo Antunes AR, Bastos J, et al. Differential plasticity and fate of brain-resident and recruited macrophages during the onset and resolution of neuroinflammation. Immunity. (2022) 55(11):2085–102.e9. doi: 10.1016/j.immuni.2022.09.005
14. Faria J, Briggs EM, Black JA, McCulloch R. Emergence and adaptation of the cellular machinery directing antigenic variation in the African trypanosome. Curr Opin Microbiol (2022) 70:102209. doi: 10.1016/j.mib.2022.102209
15. Macleod OJS, Cook AD, Webb H, Crow M, Burns R, Redpath M, et al. Invariant surface glycoprotein 65 of Trypanosoma brucei is a complement C3 receptor. Nat Commun (2022) 13(1):5085. doi: 10.1038/s41467-022-32728-9
16. Radwanska M, Guirnalda P, De Trez C, Ryffel B, Black S, Magez S. Trypanosomiasis-induced b cell apoptosis results in loss of protective anti-parasite antibody responses and abolishment of vaccine-induced memory responses. PloS Pathog (2008) 4(5):e1000078. doi: 10.1371/journal.ppat.1000078
17. Frenkel D, Zhang F, Guirnalda P, Haynes C, Bockstal V, Radwanska M, et al. Trypanosoma brucei Co-opts NK cells to kill splenic B2 b cells. PloS Pathog (2016) 12(7):e1005733. doi: 10.1371/journal.ppat.1005733
18. Radwanska M, Nguyen HTT, Magez S. African Trypanosomosis obliterates DTPa vaccine-induced functional memory so that post-treatment bordetella pertussis challenge fails to trigger a protective recall response. Vaccines (2021) 9(6):603. doi: 10.3390/vaccines9060603
19. Moon S, Janssens I, Kim KH, Stijlemans B, Magez S, Radwanska M. Detrimental effect of Trypanosoma brucei brucei infection on memory b cells and host ability to recall protective b-cell responses. J Infect Dis (2022) 226(3):528–40. doi: 10.1093/infdis/jiac112
20. Bockstal V, Guirnalda P, Caljon G, Goenka R, Telfer JC, Frenkel D, et al. T. brucei infection reduces b lymphopoiesis in bone marrow and truncates compensatory splenic lymphopoiesis through transitional b-cell apoptosis. PloS Pathog (2011) 7(6):e1002089. doi: 10.1371/journal.ppat.1002089
21. Gonzalez SM, Taborda NA, Rugeles MT. Role of different subpopulations of CD8(+) T cells during HIV exposure and infection. Front Immunol (2017) 8:936. doi: 10.3389/fimmu.2017.00936
22. Dobrzanski MJ. Expanding roles for CD4 T cells and their subpopulations in tumor immunity and therapy. Front Oncol (2013) 3:63. doi: 10.3389/fonc.2013.00063
23. Zhu X, Zhu J. CD4 T helper cell subsets and related human immunological disorders. Int J Mol Sci (2020) 21(21). doi: 10.3390/ijms21218011
24. Barkhuizen M, Magez S, Atkinson RA, Brombacher F. Interleukin-12p70-dependent interferon- gamma production is crucial for resistance in African trypanosomiasis. J Infect Dis (2007) 196(8):1253–60. doi: 10.1086/521681
25. Hertz CJ, Filutowicz H, Mansfield JM. Resistance to the African trypanosomes is IFN-gamma dependent. J Immunol (1998) 161(12):6775–83. doi: 10.4049/jimmunol.161.12.6775
26. Guilliams M, Movahedi K, Bosschaerts T, VandenDriessche T, Chuah MK, Hérin M, et al. IL-10 dampens TNF/inducible nitric oxide synthase-producing dendritic cell-mediated pathogenicity during parasitic infection. J Immunol (2009) 182(2):1107–18. doi: 10.4049/jimmunol.182.2.1107
27. Shi M, Wei G, Pan W, Tabel H. Experimental African trypanosomiasis: a subset of pathogenic, IFN-gamma-producing, MHC class II-restricted CD4+ T cells mediates early mortality in highly susceptible mice. J Immunol (2006) 176(3):1724–32. doi: 10.4049/jimmunol.176.3.1724
28. De Trez C, Stijlemans B, Bockstal V, Cnops J, Korf H, Van Snick J, et al. A critical blimp-1-Dependent IL-10 regulatory pathway in T cells protects from a lethal pro-inflammatory cytokine storm during acute experimental Trypanosoma brucei infection. Front Immunol (2020) 11:1085. doi: 10.3389/fimmu.2020.01085
29. Stijlemans B, Schoovaerts M, De Baetselier P, Magez S, De Trez C. The role of MIF and IL-10 as molecular yin-yang in the modulation of the host immune microenvironment during infections: African trypanosome infections as a paradigm. Front Immunol (2022) 13:865395. doi: 10.3389/fimmu.2022.865395
30. Cnops J, De Trez C, Stijlemans B, Keirsse J, Kauffmann F, Barkhuizen M, et al. NK-, NKT- and CD8-derived IFNgamma drives myeloid cell activation and erythrophagocytosis, resulting in trypanosomosis-associated acute anemia. PloS Pathog (2015) 11(6):e1004964. doi: 10.1371/journal.ppat.1004964
31. Liu G, Sun D, Wu H, Zhang M, Huan H, Xu J, et al. Distinct contributions of CD4+ and CD8+ T cells to pathogenesis of Trypanosoma brucei infection in the context of gamma interferon and interleukin-10. Infect Immun (2015) 83(7):2785–95. doi: 10.1128/IAI.00357-15
32. Wei G, Tabel H. Regulatory T cells prevent control of experimental African trypanosomiasis. J Immunol (2008) 180(4):2514–21. doi: 10.4049/jimmunol.180.4.2514
33. Onyilagha C, Uzonna JE. Host immune responses and immune evasion strategies in African trypanosomiasis. Front Immunol (2019) 10:2738. doi: 10.3389/fimmu.2019.02738
34. Okwor I, Onyilagha C, Kuriakose S, Mou Z, Jia P, Uzonna JE. Regulatory T cells enhance susceptibility to experimental Trypanosoma congolense infection independent of mouse genetic background. PloS Negl Trop Diseases (2012) 6(7):e1761. doi: 10.1371/journal.pntd.0001761
35. Tabel H, Wei G, Shi M. T Cells and immunopathogenesis of experimental African trypanosomiasis. Immunol Rev (2008) 225:128–39. doi: 10.1111/j.1600-065X.2008.00675.x
36. Onyilagha C, Okwor I, Kuriakose S, Singh R, Uzonna J. Low-dose intradermal infection with trypanosoma congolense leads to expansion of regulatory T cells and enhanced susceptibility to reinfection. Infect Immun (2014) 82(3):1074–83. doi: 10.1128/IAI.01028-13
37. Guilliams M, Oldenhove G, Noel W, Hérin M, Brys L, Loi P, et al. African Trypanosomiasis: naturally occurring regulatory T cells favor trypanotolerance by limiting pathology associated with sustained type 1 inflammation. J Immunol (2007) 179(5):2748–57. doi: 10.4049/jimmunol.179.5.2748
38. Dias-Guerreiro T, Palma-Marques J, Mourata-Gonçalves P, Alexandre-Pires G, Valério-Bolas A, Gabriel Á, et al. African Trypanosomiasis: Extracellular vesicles shed by trypanosoma brucei brucei manipulate host mononuclear cells. Biomedicines (2021) 9(8):1056. doi: 10.3390/biomedicines9081056
39. Guilliams M, Bosschaerts T, Hérin M, Hünig T, Loi P, Flamand V, et al. Experimental expansion of the regulatory T cell population increases resistance to African trypanosomiasis. J Infect Dis (2008) 198(5):781–91. doi: 10.1086/590439
40. Masocha W, Robertson B, Rottenberg ME, Mhlanga J, Sorokin L, Kristensson K. Cerebral vessel laminins and IFN-gamma define Trypanosoma brucei brucei penetration of the blood-brain barrier. J Clin Invest (2004) 114(5):689–94. doi: 10.1172/JCI22104
41. Laperchia C, Palomba M, Seke Etet PF, Rodgers J, Bradley B, Montague P, et al. Trypanosoma brucei invasion and T-cell infiltration of the brain parenchyma in experimental sleeping sickness: Timing and correlation with functional changes. PloS Negl Trop Dis (2016) 10(12):e0005242. doi: 10.1371/journal.pntd.0005242
42. Olivera GC, Vetter L, Tesoriero C, Del Gallo F, Hedberg G, Basile J, et al. Role of T cells during the cerebral infection with trypanosoma brucei. PloS Negl Trop Dis (2021) 15(9):e0009764. doi: 10.1371/journal.pntd.0009764
43. Liu G, Abas O, Strickland AB, Chen Y, Shi M. CXCR6+CD4+ T cells promote mortality during Trypanosoma brucei infection. PloS Pathog (2021) 17(10):e1009968. doi: 10.1371/journal.ppat.1009968
44. Young MD, Behjati S. SoupX removes ambient RNA contamination from droplet-based single-cell RNA sequencing data. Gigascience (2020) 9(12):giaa151. doi: 10.1093/gigascience/giaa151
45. Kimmel JC, Hwang AB, Scaramozza A, Marshall WF, Brack AS. Aging induces aberrant state transition kinetics in murine muscle stem cells. Development (2020) 147(9):dev183855. doi: 10.1242/dev.183855
46. Korsunsky I, Millard N, Fan J, Slowikowski K, Zhang F, Wei K, et al. Fast, sensitive and accurate integration of single-cell data with harmony. Nat Methods (2019) 16(12):1289–96. doi: 10.1038/s41592-019-0619-0
47. Raudvere U, Kolberg L, Kuzmin I, Arak T, Adler P, Peterson H, et al. g:Profiler: a web server for functional enrichment analysis and conversions of gene lists (2019 update). Nucleic Acids Res (2019) 47(W1):W191–w8. doi: 10.1093/nar/gkz369
48. Jin S, Guerrero-Juarez CF, Zhang L, Chang I, Ramos R, Kuan CH, et al. Inference and analysis of cell-cell communication using CellChat. Nat Commun (2021) 12(1):1088. doi: 10.1038/s41467-021-21246-9
49. Hay SB, Ferchen K, ChEtal K, Grimes HL, Salomonis N. The human cell atlas bone marrow single-cell interactive web portal. Exp Hematol (2018) 68:51–61. doi: 10.1016/j.exphem.2018.09.004
50. Nagel A, Möbs C, Raifer H, Wiendl H, Hertl M, Eming R. CD3-positive b cells: a storage-dependent phenomenon. PloS One (2014) 9(10):e110138. doi: 10.1371/journal.pone.0110138
51. Burel JG, Pomaznoy M, Lindestam Arlehamn CS, Seumois G, Vijayanand P, Sette A, et al. The challenge of distinguishing cell-cell complexes from singlet cells in non-imaging flow cytometry and single-cell sorting. Cytomet A (2020) 97(11):1127–35. doi: 10.1002/cyto.a.24027
52. Kiner E, Willie E, Vijaykumar B, Chowdhary K, Schmutz H, Chandler J, et al. Gut CD4(+) T cell phenotypes are a continuum molded by microbes, not by T(H) archetypes. Nat Immunol (2021) 22(2):216–28. doi: 10.1038/s41590-020-00836-7
53. Sánchez-Zuno GA, Bucala R, Hernández-Bello J, Román-Fernández IV, García-Chagollán M, Nicoletti F, et al. Canonical (CD74/CD44) and non-canonical (CXCR2, 4 and 7) MIF receptors are differentially expressed in rheumatoid arthritis patients evaluated by DAS28-ESR. J Clin Med (2021) 11(1):120. doi: 10.3390/jcm11010120
54. Sage PT, Paterson AM, Lovitch SB, Sharpe AH. The coinhibitory receptor CTLA-4 controls b cell responses by modulating T follicular helper, T follicular regulatory, and T regulatory cells. Immunity (2014) 41(6):1026–39. doi: 10.1016/j.immuni.2014.12.005
55. Mou Z, Jia P, Kuriakose S, Khadem F, Uzonna JE. Interleukin-17-mediated control of parasitemia in experimental Trypanosoma congolense infection in mice. Infect Immun (2010) 78(12):5271–9. doi: 10.1128/IAI.00168-10
56. Magez S, Radwanska M, Beschin A, Sekikawa K, De Baetselier P. Tumor necrosis factor alpha is a key mediator in the regulation of experimental trypanosoma brucei infections. Infect Immun (1999) 67(6):3128–32. doi: 10.1128/IAI.67.6.3128-3132.1999
57. Musaya J, Matovu E, Nyirenda M, Chisi J. Role of cytokines in Trypanosoma brucei-induced anaemia: A review of the literature. Malawi Med J (2015) 27(2):45–50. doi: 10.4314/mmj.v27i2.3
58. Shi M, Pan W, Tabel H. Experimental African trypanosomiasis: IFN-gamma mediates early mortality. Eur J Immunol (2003) 33(1):108–18. doi: 10.1002/immu.200390013
59. Baral TN, De Baetselier P, Brombacher F, Magez S. Control of Trypanosoma evansi infection is IgM mediated and does not require a type I inflammatory response. J Infect Dis (2007) 195(10):1513–20. doi: 10.1086/515577
60. Tewari AK, Kurup SP, Baidya S, Barta JR, Sharma B. Protective antibody and cytokine responses in mice following immunization with recombinant beta-tubulin and subsequent Trypanosoma evansi challenge. Parasit Vectors (2015) 8:580. doi: 10.1186/s13071-015-1189-3
61. Moens L, Tangye SG. Cytokine-mediated regulation of plasma cell generation: IL-21 takes center stage. Front Immunol (2014) 5:65. doi: 10.3389/fimmu.2014.00065
62. Namangala B, Noël W, De Baetselier P, Brys L, Beschin A. Relative contribution of interferon-gamma and interleukin-10 to resistance to murine African trypanosomosis. J Infect Dis (2001) 183(12):1794–800. doi: 10.1086/320731
63. Capewell P, Cren-Travaillé C, Marchesi F, Johnston P, Clucas C, Benson RA, et al. The skin is a significant but overlooked anatomical reservoir for vector-borne African trypanosomes. Elife (2016) 5:e17716. doi: 10.7554/eLife.17716
64. Mabille D, Dirkx L, Thys S, Vermeersch M, Montenye D, Govaerts M, et al. Impact of pulmonary African trypanosomes on the immunology and function of the lung. Nat Commun (2022) 13(1):7083. doi: 10.1038/s41467-022-34757-w
65. Engwerda CR, Ng SS, Bunn PT. The regulation of CD4(+) T cell responses during protozoan infections. Front Immunol (2014) 5:498. doi: 10.3389/fimmu.2014.00498
66. Fitzgerald DC, Zhang GX, El-Behi M, Fonseca-Kelly Z, Li H, Yu S, et al. Suppression of autoimmune inflammation of the central nervous system by interleukin 10 secreted by interleukin 27-stimulated T cells. Nat Immunol (2007) 8(12):1372–9. doi: 10.1038/ni1540
67. Awasthi A, Carrier Y, Peron JP, Bettelli E, Kamanaka M, Flavell RA, et al. A dominant function for interleukin 27 in generating interleukin 10-producing anti-inflammatory T cells. Nat Immunol (2007) 8(12):1380–9. doi: 10.1038/ni1541
68. Stumhofer JS, Silver JS, Laurence A, Porrett PM, Harris TH, Turka LA, et al. Interleukins 27 and 6 induce STAT3-mediated T cell production of interleukin 10. Nat Immunol (2007) 8(12):1363–71. doi: 10.1038/ni1537
69. Liu G, Xu J, Wu H, Sun D, Zhang X, Zhu X, et al. IL-27 signaling is crucial for survival of mice infected with African trypanosomes via preventing lethal effects of CD4+ T cells and IFN-γ. PloS Pathog (2015) 11(7):e1005065. doi: 10.1371/journal.ppat.1005065
70. Ouyang W, Rutz S, Crellin NK, Valdez PA, Hymowitz SG. Regulation and functions of the IL-10 family of cytokines in inflammation and disease. Annu Rev Immunol (2011) 29:71–109. doi: 10.1146/annurev-immunol-031210-101312
71. Saraiva M, O'Garra A. The regulation of IL-10 production by immune cells. Nat Rev Immunol (2010) 10(3):170–81. doi: 10.1038/nri2711
72. Moore KW, de Waal Malefyt R, Coffman RL, O'Garra A. Interleukin-10 and the interleukin-10 receptor. Annu Rev Immunol (2001) 19:683–765. doi: 10.1146/annurev.immunol.19.1.683
73. Belkaid Y. Regulatory T cells and infection: A dangerous necessity. Nat Rev Immunol (2007) 7(11):875–88. doi: 10.1038/nri2189
74. Jankovic D, Kullberg MC, Feng CG, Goldszmid RS, Collazo CM, Wilson M, et al. Conventional T-bet(+)Foxp3(-) Th1 cells are the major source of host-protective regulatory IL-10 during intracellular protozoan infection. J Exp Med (2007) 204(2):273–83. doi: 10.1084/jem.20062175
75. Trinchieri G. Interleukin-10 production by effector T cells: Th1 cells show self control. J Exp Med (2007) 204(2):239–43. doi: 10.1084/jem.20070104
76. Silva EM, Guillermo LV, Ribeiro-Gomes FL, De Meis J, Nunes MP, Senra JF, et al. Caspase inhibition reduces lymphocyte apoptosis and improves host immune responses to Trypanosoma cruzi infection. Eur J Immunol (2007) 37(3):738–46. doi: 10.1002/eji.200636790
77. Schleifer KW, Mansfield JM. Suppressor macrophages in African trypanosomiasis inhibit T cell proliferative responses by nitric oxide and prostaglandins. J Immunol (1993) 151(10):5492–503. doi: 10.4049/jimmunol.151.10.5492
Keywords: Trypanosomosis, CD4 T cell, Th1 Cells, Treg - regulatory T cell, IFN-γ, IL-10
Citation: Nguyen HTT, Magez S and Radwanska M (2023) From helping to regulating – A transcriptomic profile of Ifng+ Il10+ Il21+ Cd4+ Th1 cells indicates their role in regulating inflammation during experimental trypanosomosis. Front. Trop. Dis 4:1127022. doi: 10.3389/fitd.2023.1127022
Received: 19 December 2022; Accepted: 06 February 2023;
Published: 22 February 2023.
Edited by:
Marcelo A. Soares, National Cancer Institute (INCA), BrazilReviewed by:
George So Yap, Rutgers University, Newark, United StatesTheo G. M. Oliveira, University of São Paulo, Brazil
Copyright © 2023 Nguyen, Magez and Radwanska. This is an open-access article distributed under the terms of the Creative Commons Attribution License (CC BY). The use, distribution or reproduction in other forums is permitted, provided the original author(s) and the copyright owner(s) are credited and that the original publication in this journal is cited, in accordance with accepted academic practice. No use, distribution or reproduction is permitted which does not comply with these terms.
*Correspondence: Magdalena Radwanska, bWFnZGFsZW5hLnJhZHdhbnNrYUBnaGVudC5hYy5rcg==
†These authors have contributed equally to this work