- 1Department of Respiratory Medicine, Nanjing Chest Hospital, Affiliated Nanjing Brain Hospital, Nanjing Medical University, Nanjing, China
- 2Duke Cancer Institute, Duke University Medical Center, Durham, NC, United States
- 3Department of Population Health Sciences, Duke University School of Medicine, Durham, NC, United States
- 4Department of Respiratory Oncology, Guangxi Cancer Hospital, Guangxi Medical University Cancer Hospital, Nanning, China
- 5Department of Head and Neck Surgery, Guangxi Cancer Hospital, Guangxi Medical University Cancer Hospital, Nanning, China
- 6Department of Biostatistics and Bioinformatics, Duke University School of Medicine, Durham, NC, United States
- 7Departments of Environmental Health and Epidemiology, Harvard TH Chan School of Public Health, Boston, MA, United States
- 8Department of Medicine, Massachusetts General Hospital, Boston, MA, United States
- 9Department of Medicine, Duke University Medical Center, Durham, NC, United States
- 10Duke Global Health Institute, Duke University Medical Center, Durham, NC, United States
Background: T cell exhaustion is a state in which T cells become dysfunctional and is associated with a decreased efficacy of immune checkpoint inhibitors. Lung cancer has the highest mortality among all cancers. However, the roles of genetic variants of the T cell exhaustion-related genes in the prognosis of non-small cell lung cancer (NSCLC) patients has not been reported.
Methods: We conducted a two-stage multivariable Cox proportional hazards regression analysis with two previous genome-wide association study (GWAS) datasets to explore associations between genetic variants in the T cell exhaustion-related genes and survival of NSCLC patients. We also performed expression quantitative trait loci analysis for functional validation of the identified variants.
Results: Of all the 52,103 single nucleotide polymorphisms (SNPs) in 672 T cell exhaustion-related genes, 1,721 SNPs were found to be associated with overall survival (OS) of 1185 NSCLC patients of the discovery GWAS dataset from the Prostate, Lung, Colorectal and Ovarian (PLCO) Cancer Screening Trial, and 125 of these 1,721 SNPs remained significant after validation in an additional independent replication GWAS dataset of 984 patients from the Harvard Lung Cancer Susceptibility (HLCS) Study. In multivariable stepwise Cox model analysis, three independent SNPs (i.e., LRRC8C rs10493829 T>C, OAS2 rs2239193 A>G, and CCL25 rs3136651 T>A) remained significantly associated with OS with hazards ratios (HRs) of 0.86 (95% confidence interval (CI) = 0.77-0.96, P = 0.008), 1.48 (95% CI = 1.18-1.85, P < 0.0001) and 0.78 (95% CI = 0.66-0.91, P = 0.002), respectively. Further combined analysis for these three SNPs suggested that an unfavorable genotype score was associated with a poor OS and disease-specific survival. Expression quantitative trait loci analysis suggested that the LRRC8C rs10493829 C allele was associated with elevated LRRC8C mRNA expression levels in normal lymphoblastoid cells, lung tissue, and whole blood.
Conclusion: Our findings suggested that these functional SNPs in the T cell exhaustion-related genes may be prognostic predictors for survival of NSCLC patients, possibly via a mechanism of modulating corresponding gene expression.
1 Introduction
Lung cancer is the most commonly diagnosed cancer and the leading cause of cancer mortality worldwide (1). The incidence and mortality rates of lung cancer are gradually declining in the developed countries but still increasing in the developing countries. In 2024, the data from the National Cancer Institute estimate that there will be approximately 234,580 new diagnosed cases and 125,070 deaths from lung cancer in the United States (2). The most prevalent histological form of lung cancer is non-small cell lung cancer (NSCLC) that makes up approximately 85% of all lung cancer cases with high incidence and mortality rates (3). At the time of diagnosis, the majority of NSCLC patients are in advanced stages of the disease, and approximately 60% have some evidence of distant metastases (4). With the improvement in early diagnosis and the advent of new therapeutic methods including immunotherapy, the survival rate of lung cancer continues to improve. However, the 5-year relative survival rate is still poor and even worse in the metastatic setting (5). Therefore, new biomarkers for survival are urgently needed to improve the prognosis of NSCLC.
The emergence of immunotherapy has fundamentally transformed treatment landscape and revolutionized clinical prognosis of solid tumors. Tumor microenvironment (TME) refers to the surrounding environment where diverse cancer cells develop and survive (6). Accumulating evidence indicates that TME plays an important role in the initiation and progression of various cancers (7, 8). Cancer immunotherapy stimulates immune responses and modulates TME to activate T cells to exert an anti-tumor effect (9). Cytotoxic T cells are prototypical anti-tumor immune cell to recognize and eliminate tumor cells that present tumor antigens (10). Moreover, T cells account for the majority of tumor infiltrating lymphocytes that are often correlated with a favorable prognosis and a better response to immunotherapy (11, 12). Despite some impressive progress has enhanced the efficiencies and promising long-term responses, immunotherapy resistance is inevitable for most patients (13). T cell exhaustion, a state in which T cells become dysfunctional as a result of persistent antigenic stimulation within the TME, is one of the potential mechanisms of tumor immunotherapy resistance (14). During chronic infection or cancer, naive T cell first differentiates into T cell exhaustion precursor cells that are unable to fully clear antigens and then into terminal T cell exhaustion that ultimately leads to cell death (15–17). It has been shown that T cell exhaustion is associated with a decreased efficacy of immune-checkpoint inhibitors, including an increased expression of exhaustion markers, decreased effector function, and compromised functionality of T cells (18). Furthermore, T cell exhaustion is associated with immune evasion, disease advancement, and poor survival across multiple cancer types (19). However, up to now, the role of T cell exhaustion-related genes in the survival of NSCLC patients is not fully understood.
Accumulating evidence has suggested that genetic variants, such as single-nucleotide polymorphisms (SNPs) in critical genes, play crucial roles in NSCLC progression and prognosis (20, 21). Genome-wide association studies (GWASs) have successfully identified numerous susceptibility loci for complex diseases (22). However, the roles played by genetic variants of the T cell exhaustion-related genes in survival of NSCLC patients remained unknown. Therefore, in the present study, we tested the hypothesis that genetic variants in the T cell exhaustion-related genes are associated with survival of NSCLC patients in a two-stage analysis using genotyping data from two public GWAS datasets.
2 Materials and methods
2.1 The discovery dataset
The Prostate, Lung, Colorectal, and Ovarian (PLCO) cancer screening trial is a randomized controlled trial designed to identify the effectiveness of cancer screening for the four cancers (23, 24). Briefly, a total of approximately 155,000 participants, aged 55-74, were recruited from 10 study centers across the United States and enrolled in the PLCO trial that commenced in November 1993 and continued enrolling participants through July 2001. In the discovery stage of the present study, a genotyping dataset of 1185 Caucasian NSCLC patients with the detailed clinical evaluation including lifestyle and medical history was obtained from the PLCO trial for survival analysis. OS and disease-specific survival (DSS) were used as the time-to-event outcomes, and the participants were followed up from the date of diagnosis to the date of last follow-up or death. Whole blood genomic DNA was genotyped using Illumina HumanHap240Sv1.0 and HumanHap550v3.0 platforms (dbGaP accession numbers: phs000093.v2.P2 and phs000336.v1.p1) (25, 26).
2.2 The validation dataset
The Harvard University Lung Cancer Susceptibility (HLCS) study recruited pathologically confirmed NSCLC patients from Boston at Massachusetts General Hospital since 1991 (27). The GWAS dataset from the HLCS study of 984 Caucasian NSCLC patients was used as the validation dataset to replicate the findings of the PLCO dataset. In the HLCS study, genomic DNA from blood samples was extracted with the Auto Pure Large Sample Nucleic Acid Purification System (QIAGEN Company, Venlo, Limburg, Netherlands) and genotyped using the Illumina Humanhap610-Quad array. Genotyping data was subsequently used for imputation by using the Minimac4 software based on the 1000 Genomes Project (27).
The use of the two GWAS datasets was approved by the Internal Review Board of Duke University School of Medicine (Project #Pro00054575) and the dbGaP database (Project #6404). The comparison of clinical characteristics between the PLCO trial and the HLCS study is shown in Supplementary Table 1.
2.3 Gene selection and SNP imputation
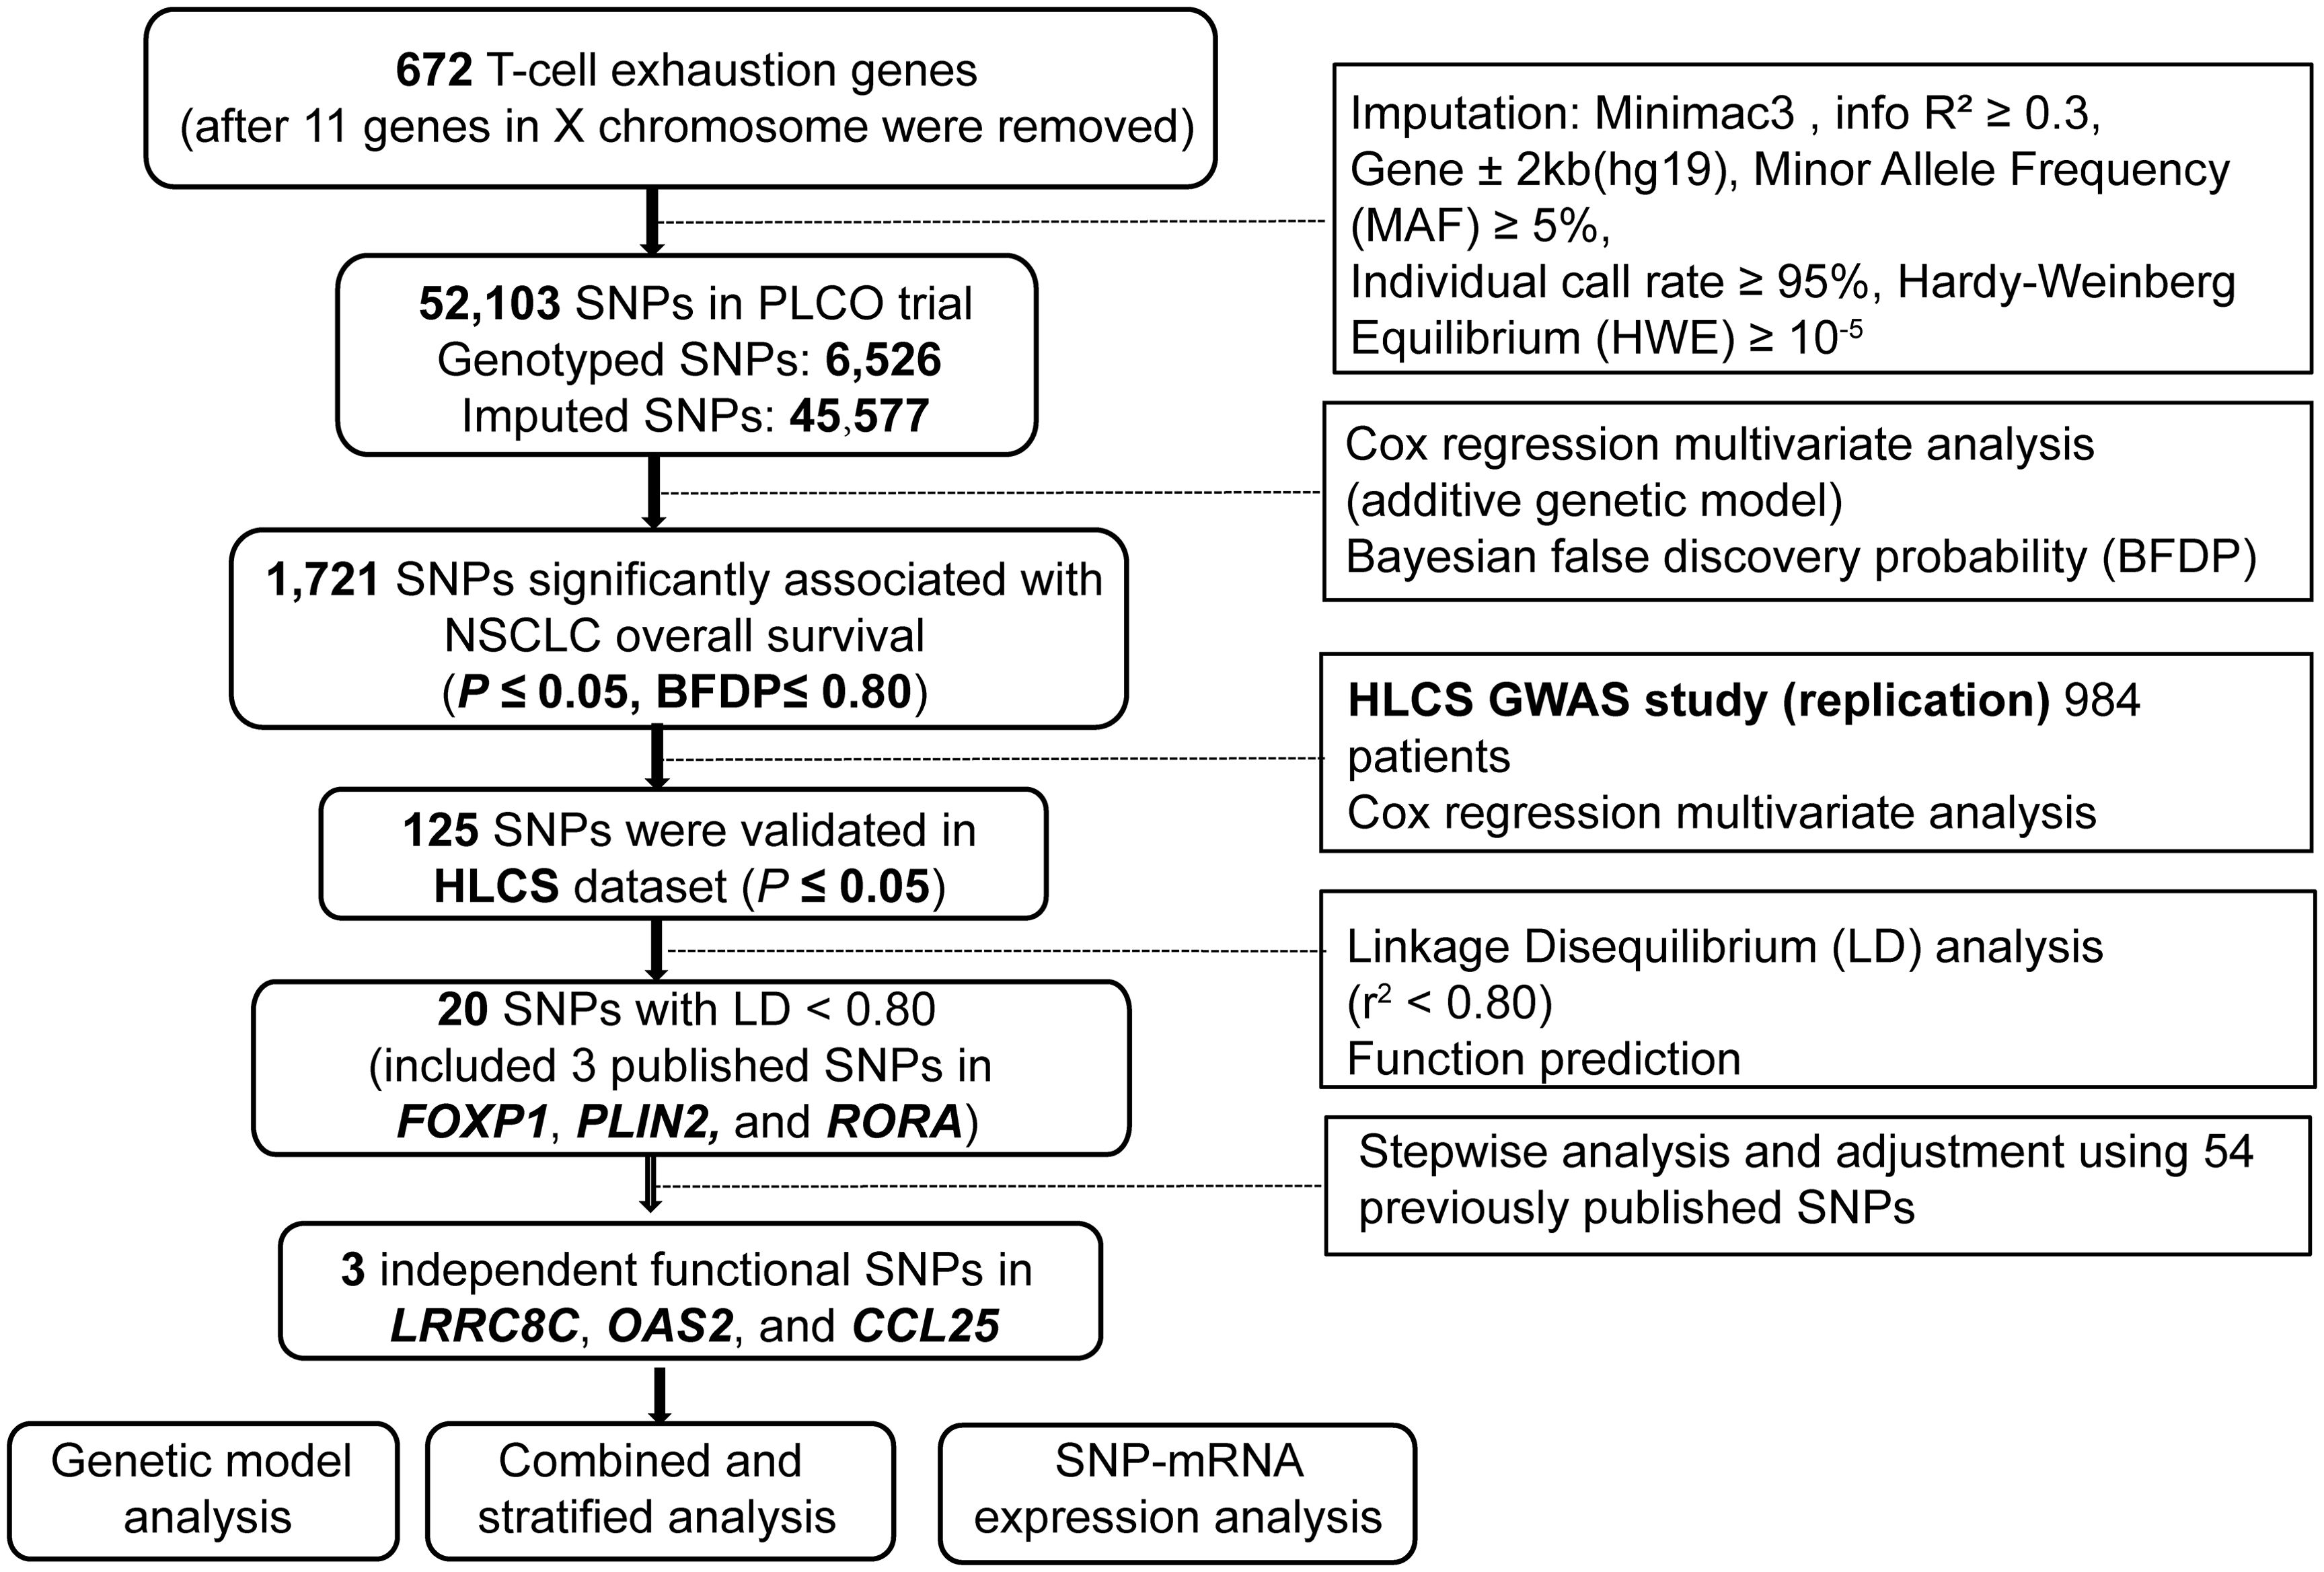
The list of T cell exhaustion-related genes was obtained from a previous study (28). After the removal of 11 genes on the X chromosome, 672 remaining genes were considered candidate genes for further analyses (Supplementary Table 2) and used for imputation with the Minimac4 and the 1000 Genomes Project (phase 3) dataset. Then, we extracted SNPs located in these genes and their ±2 kb flanking regions by the following criteria: r2 ≥ 0.3 (Supplementary Figure 1), a minor allele frequency (MAF) ≥ 0.05, an individual call rate ≥ 95%, and the Hardy-Weinberg equilibrium (HWE) ≥ 1 × 10⁻⁵. As a result, a total of 52,103 candidate SNPs (6,526 genotyped and 45,577 imputed) were selected from the PLCO trial.
2.4 Statistical analyses
In the single-locus analysis, we performed a multivariable Cox proportional hazards regression analysis using the R package GenABEL to estimate associations between 52,103 candidate SNPs and NSCLC survival in the PLCO trial with an additive genetic model (29). The Cox analysis was adjusted for available covariates including age, sex, smoking status, histologic subtype, tumor stage, chemotherapy, radiotherapy, surgery, and the top four of the 10 principal components (PCs) in the PLCO dataset (Supplementary Table 3). We chose OS as the primary endpoint and also assessed DSS as an endpoint in the survival analysis. In consideration of the high linkage disequilibrium (LD) among these imputed SNPs, we applied Bayesian false discovery probability (BFDP) with a cutoff value of 0.80 for multiple testing corrections to filter the probability of potential false-positive results (30, 31). Moreover, we assigned a prior probability of 0.10 to detect an upper bound of 3.0 for an association with adverse genotypes or minor alleles of each SNP with P < 0.05.
The significant SNPs in the PLCO dataset were then validated with the HLCS dataset using a multivariable Cox regression model. The combination of results from both PLCO trial and HLCS study was also performed in the classical inverse variance weighted meta-analysis, in which Cochran’s Q-test and the heterogeneity statistic (I2) were used to assess the inter-study heterogeneity and to determine the appropriate model. Because no inter-study heterogeneity was found (Q-test P-value > 0.10 and the I2 < 50%), the combined meta-analysis was conducted with a fixed-effects model.
Since many SNPs inherit together through disequilibrium and thus may provide redundant information, tagger SNPs were selected to represent groups of the correlated SNPs to reduce both redundancy and the number of statistical tests to be performed. In LD analysis (r2 < 0.8) using Haploview 4.1 with data from the 1000 Genomes Project (32), potential functions of these SNPs were predicted with two online bioinformatics tools, RegulomeDB (http://www.regulomedb.org/) and HaploReg v4.2 (https://pubs.broadinstitute.org/mammals/haploreg/haploreg.php) (33, 34). Subsequently, a multivariable stepwise Cox regression model with adjustment for demographic and clinical variables, the top four PCs, as well as 54 previously published SNPs from the same PLCO GWAS dataset, was performed to identify the associations between independent SNPs and NSCLC survival. Manhattan plots and regional association plots were generated using Haploview4.1 and Locus Zoom (http://http://locuszoom.sph.umich.edu) respectively to visualize these identified SNPs (35).
Subsequently, the unfavorable genotypes of identified SNPs were combined to evaluate their cumulative effects on NSCLC survival. Stratified analysis by subgroups was performed to calculate the inter-study heterogeneity and possible effect modification or interaction. A survival prediction model, constructed using the receiver operating characteristic (ROC) curves and time-dependent area under the curve (AUC) with R (version 3.6.3) package “Survival” and “time ROC”, was employed to assess the prediction accuracy of the clinical and genetic variables on NSCLC survival (36). To evaluate the genotype-phenotype associations of identified SNPs with the corresponding mRNA expression levels, expression quantitative trait loci (eQTL) analyses with a linear regression model were performed using data from two sources: normal lymphoblastoid cells from 373 European descendants in the 1,000 Genomes Project and the genotype-tissue expression (GTEx) project (including 515 normal lung tissues and 670 whole blood samples) (https://www.gtexportal.org/home, V8) (37).
Finally, we used the XIANTAO (https://www.xiantaozi.com) online data analysis tool that helped analyze cancer omics data of the Cancer Genome Atlas (TCGA) database. Here, we used XIANTAO to compare the differences of mRNA expression levels in NSCLC using paired or unpaired t-tests. The online survival analysis platform Kaplan-Meier (http://kmplot.com/analysis/) was also used to assess the correlation between the corresponding mRNA expression levels and the probability of NSCLC survival (38). All statistical analyses were performed using the SAS software (Version 9.4, SAS Institute, Cary, NC, USA), unless specified otherwise.
3 Results
3.1 Associations between SNPs in the T cell exhaustion-related genes and NSCLC survival
In the analysis, we used 1185 NSCLC patients from the PLCO trial and 984 NSCLC patients from the HLCS study. The flow chart of the present study is presented in Figure 1. In the discovery after the BFDP correction, we found that 1,721 SNPs (250 genotyped and 1,471 imputed) out of the 52,103 SNPs in the 672 T cell exhaustion-related genes were significantly associated with NSCLC OS (P ≤ 0.05). These SNPs were then used for validation with the dataset of the HLCS study, in which 125 SNPs in 12 genes remained significant, five genes (MET, PLIN2, OAS2, IRF9, and PRKCH) had only one SNP, and the other seven genes had 120 SNPs, of which 15 SNPs (Supplementary Figure 2) together with the other five SNPs were selected as the tagger SNPs. Biological function prediction of these SNPs was conducted with two online bioinformatics tools of the HaploReg and RegulomeDB projects. As shown in Supplementary Table 4, most SNPs were located in the intronic region of their genes and associated with enhancer histone marks and protein motifs alteration.
3.2 Identification of associations between independent SNPs and NSCLC survival in the PLCO trial
To assess the effect of independent SNPs on NSCLC survival in the PLCO trial, we first performed stepwise multivariable Cox regression analysis. Then, SNPs that remained significant were put into a post-stepwise multivariable Cox model with adjustment for 54 previously reported SNPs in the same PLCO trial. Finally, three independent SNPs (LRRC8C rs10493829 T>C, OAS2 rs2239193 A>G, and CCL25 rs3136651 T>A) remained significantly associated with NSCLC OS (P = 0.008, P = 0.001, and P = 0.002, respectively) (Figure 2). Moreover, the results of meta-analysis for these three identified SNPs across the PLCO trial and HLCS study are presented in Table 1, and no heterogeneity was observed. We also depicted the locations of these three significant SNPs in Manhattan plots (Figure 3) and regional association plots (Figure 4).
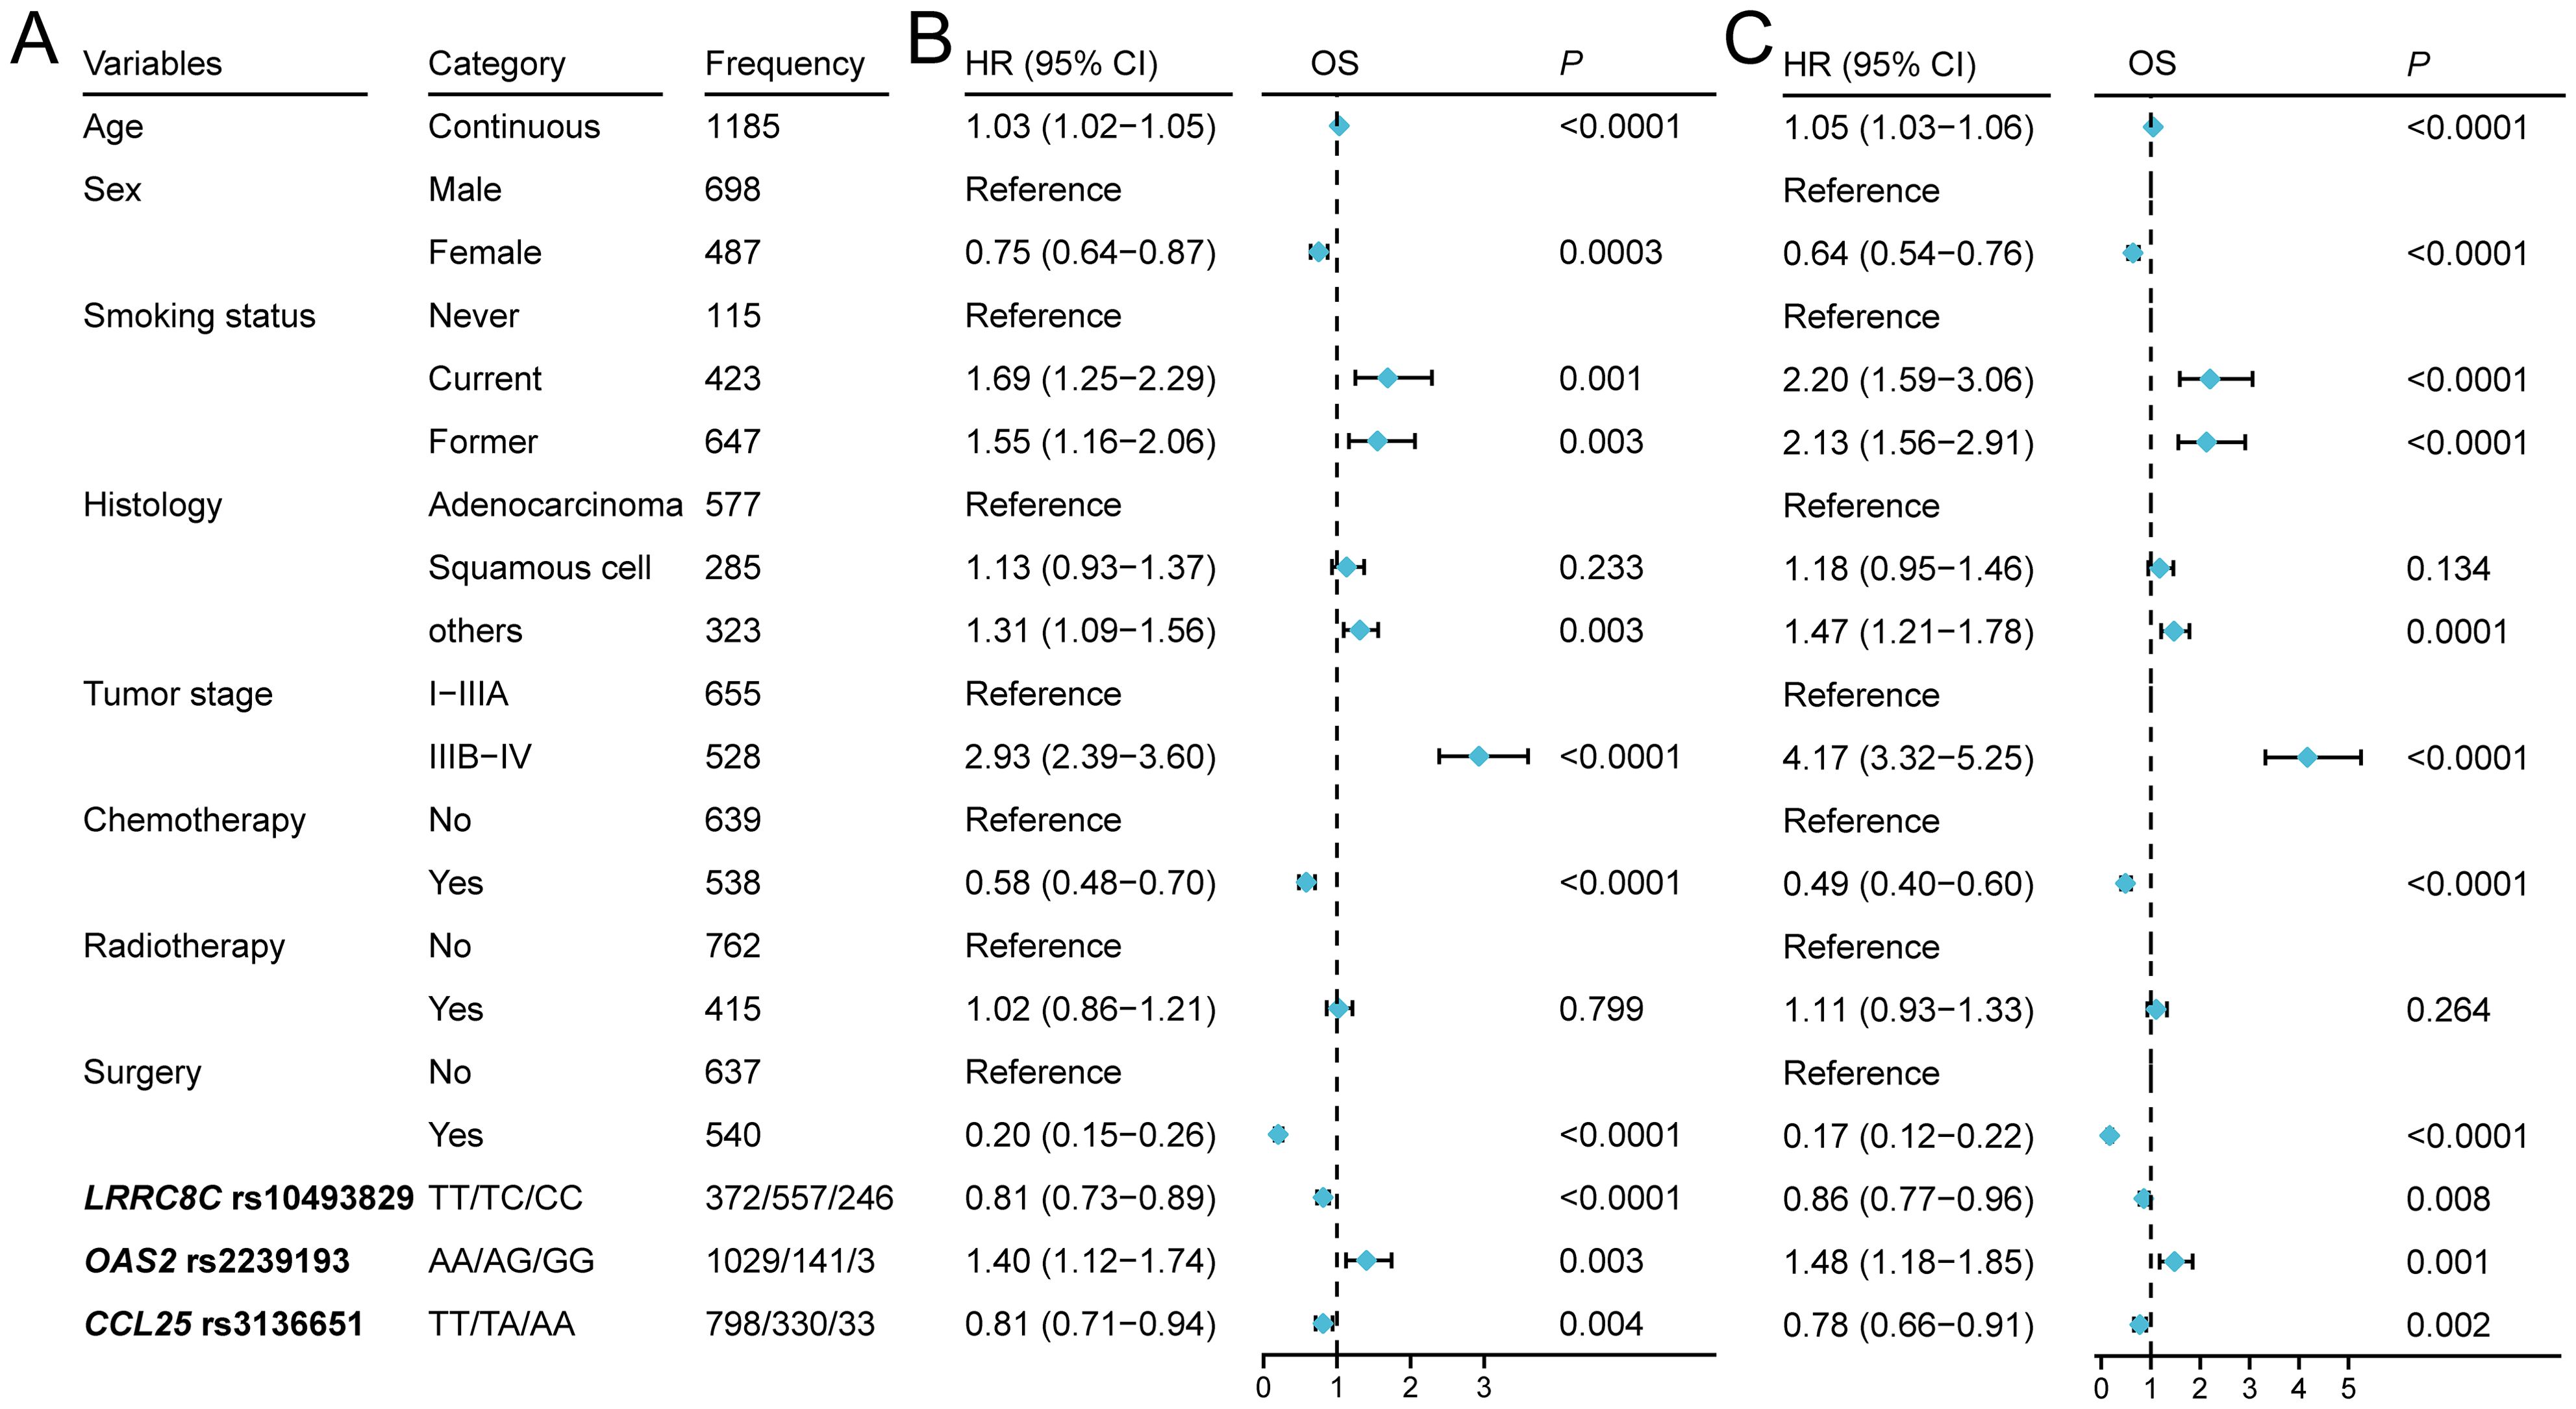
Figure 2. Three independent SNPs in a multivariate Cox proportional hazards regression analysis. (A) The characteristics of three SNPs and other covariates. (B) Forest map indicated the result of stepwise analysis including age, sex, smoking status, tumor stage, histology, chemotherapy, radiotherapy, surgery, PC1, PC2, PC3, PC4, and SNPs. (C) Forest map indicated the result of post-stepwise analysis with adjustment using 54 published SNPs for NSCLC in the same PLCO genotyping dataset: rs779901, rs3806116, rs199731120, rs10794069, rs1732793, rs225390, rs3788142, rs73049469, rs35970494, rs225388, rs7553295, rs1279590, rs73534533, rs677844, rs4978754, rs1555195, rs11660748, rs73440898, rs13040574, rs469783, rs36071574, rs7242481, rs1049493, rs1801701, rs35859010, rs1833970, rs254315, rs425904, rs35385129, rs4487030, rs60571065, rs13213007, rs115613985, rs9673682, rs2011404, rs7867814, rs2547235, rs4733124, rs11787670, rs67715745, rs922782, rs4150236, rs116454384, rs9384742, rs9825224, rs261083, rs76744140, rs6939623, rs113181986, rs2568847, rs11225211, rs10841847, rs2519996, and rs36215.

Table 1. Associations of three significant SNPs with of NSCLC overall survival in both discovery and validation datasets from two published GWASs.
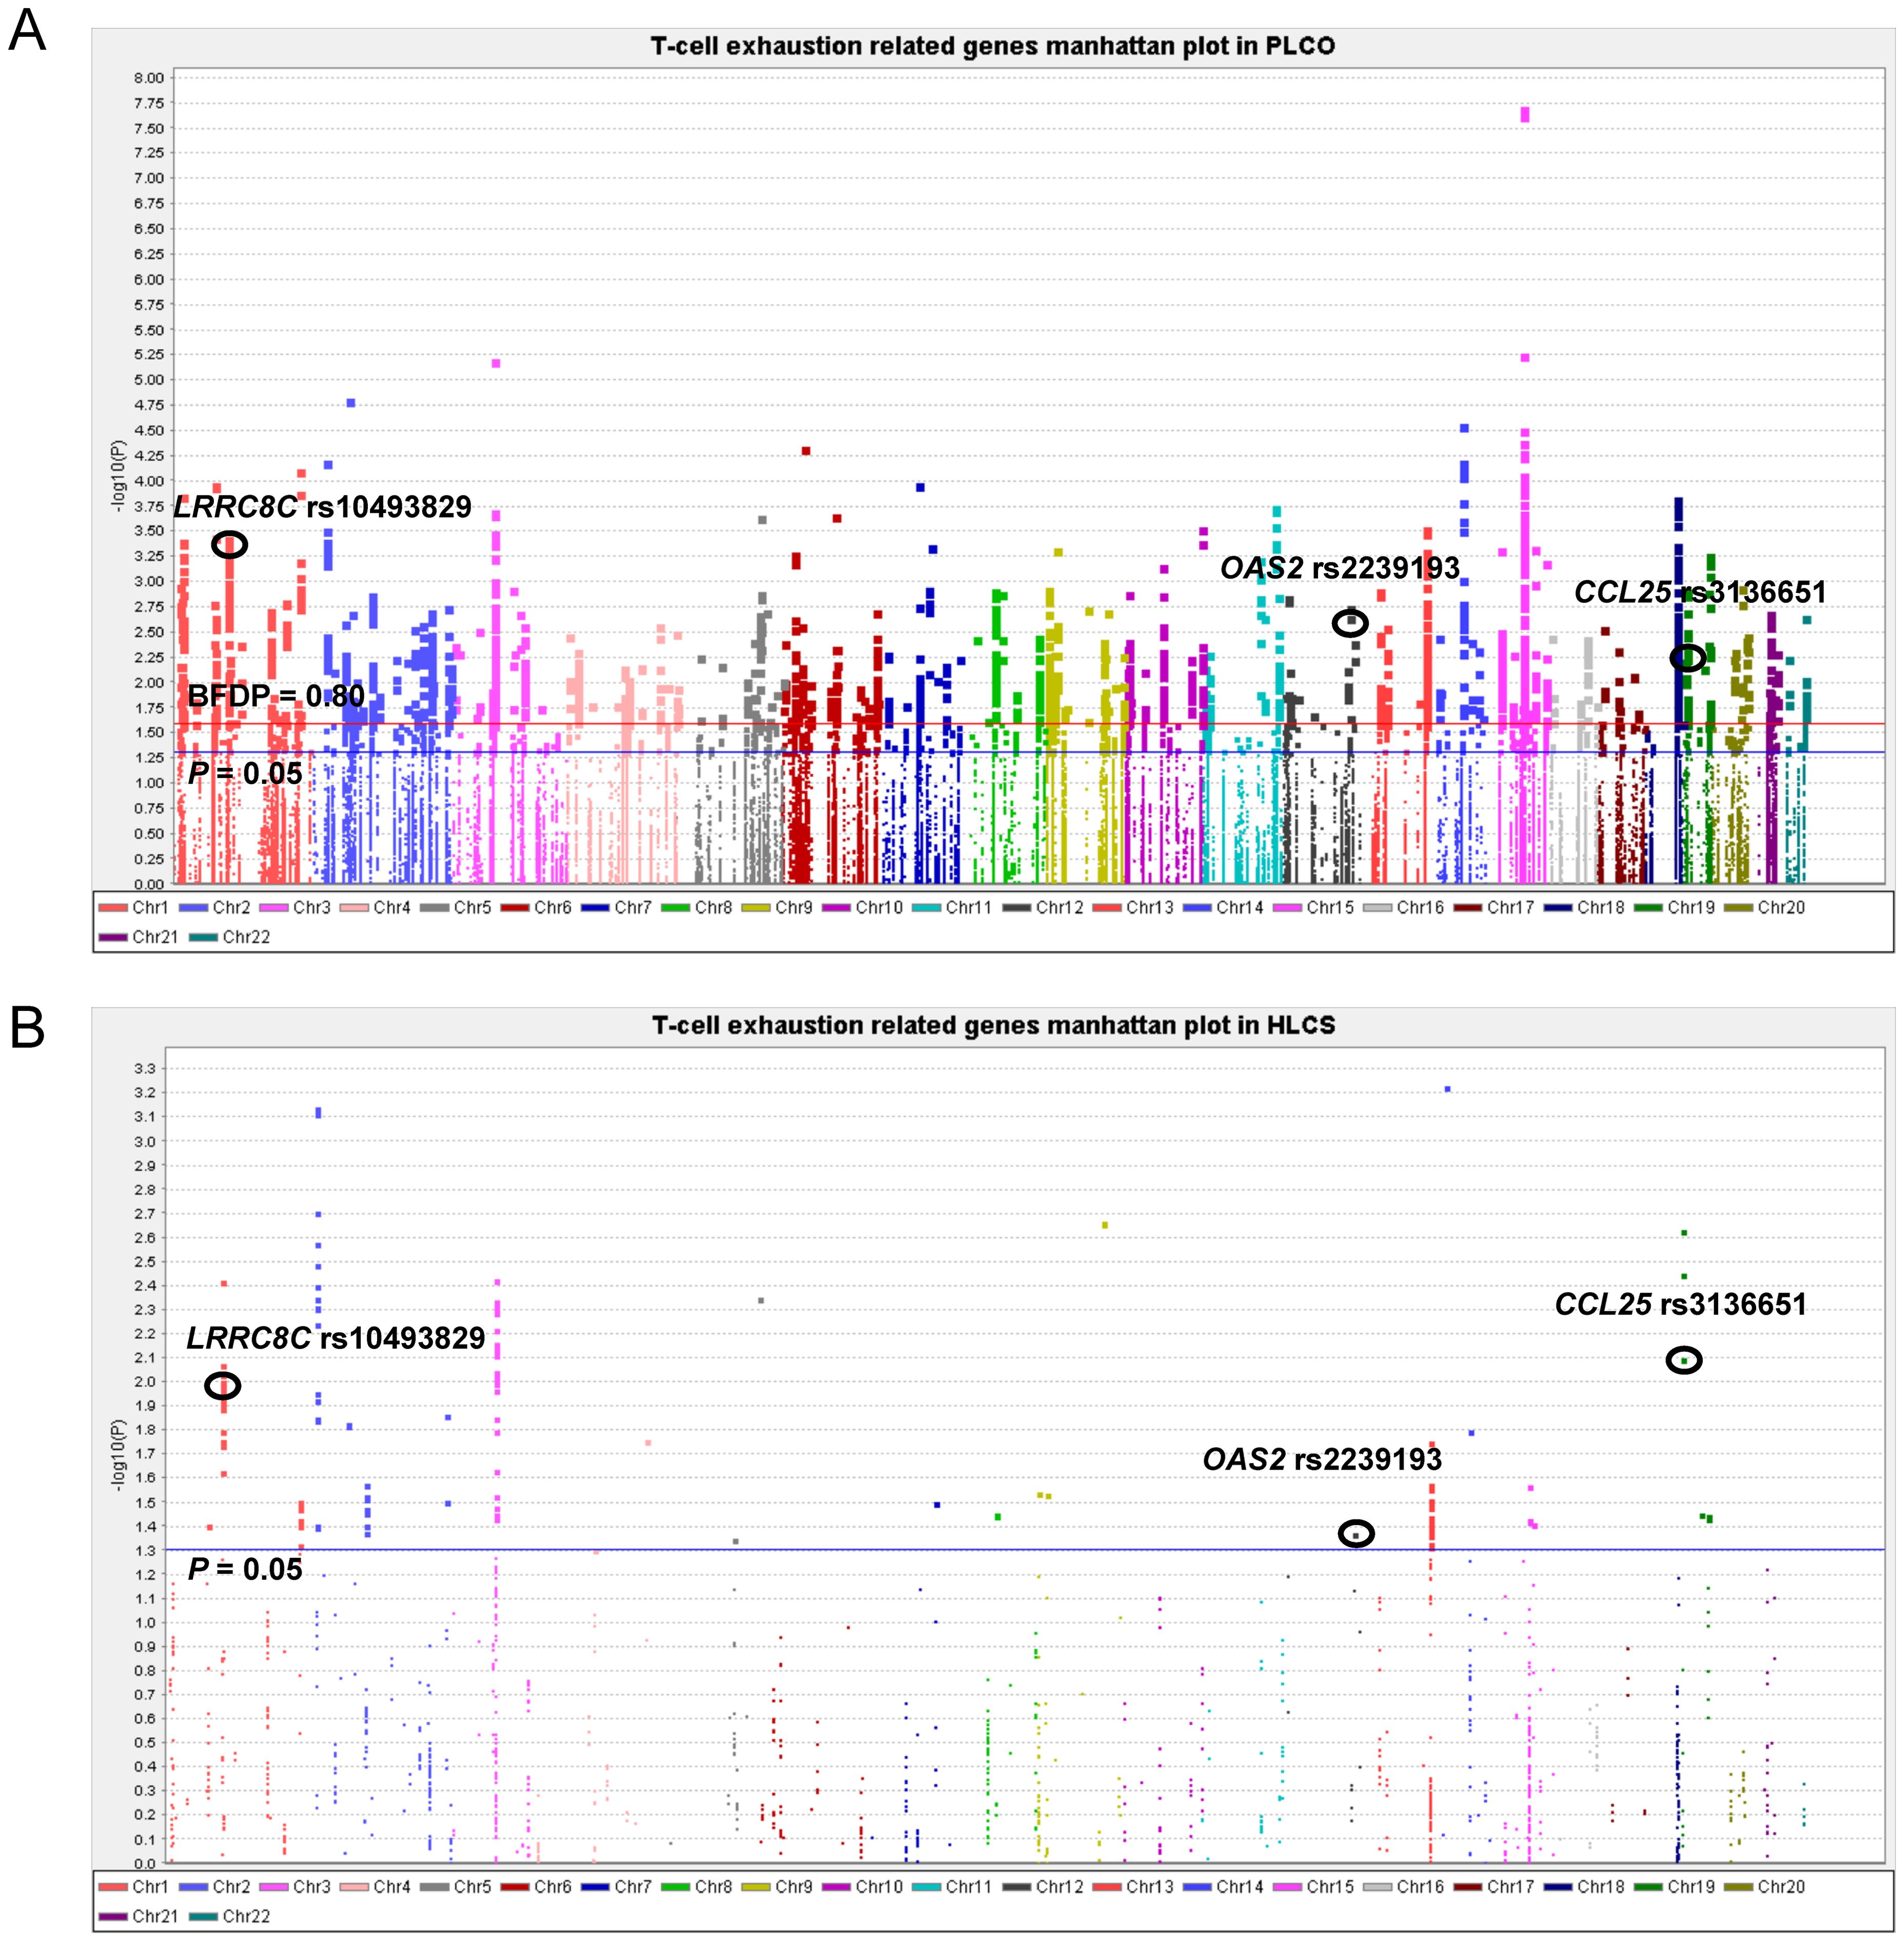
Figure 3. Manhattan plot in the PLCO trial and HLCS study. (A) Manhattan plot for 52,103 SNPs of T-cell exhaustion related genes in the PLCO trial. (B) Manhattan plot for 1,721 SNPs of T-cell exhaustion-related genes in the HLCS study. The blue horizontal line indicates P = 0.05 and the red line indicates BFDP = 0.80.
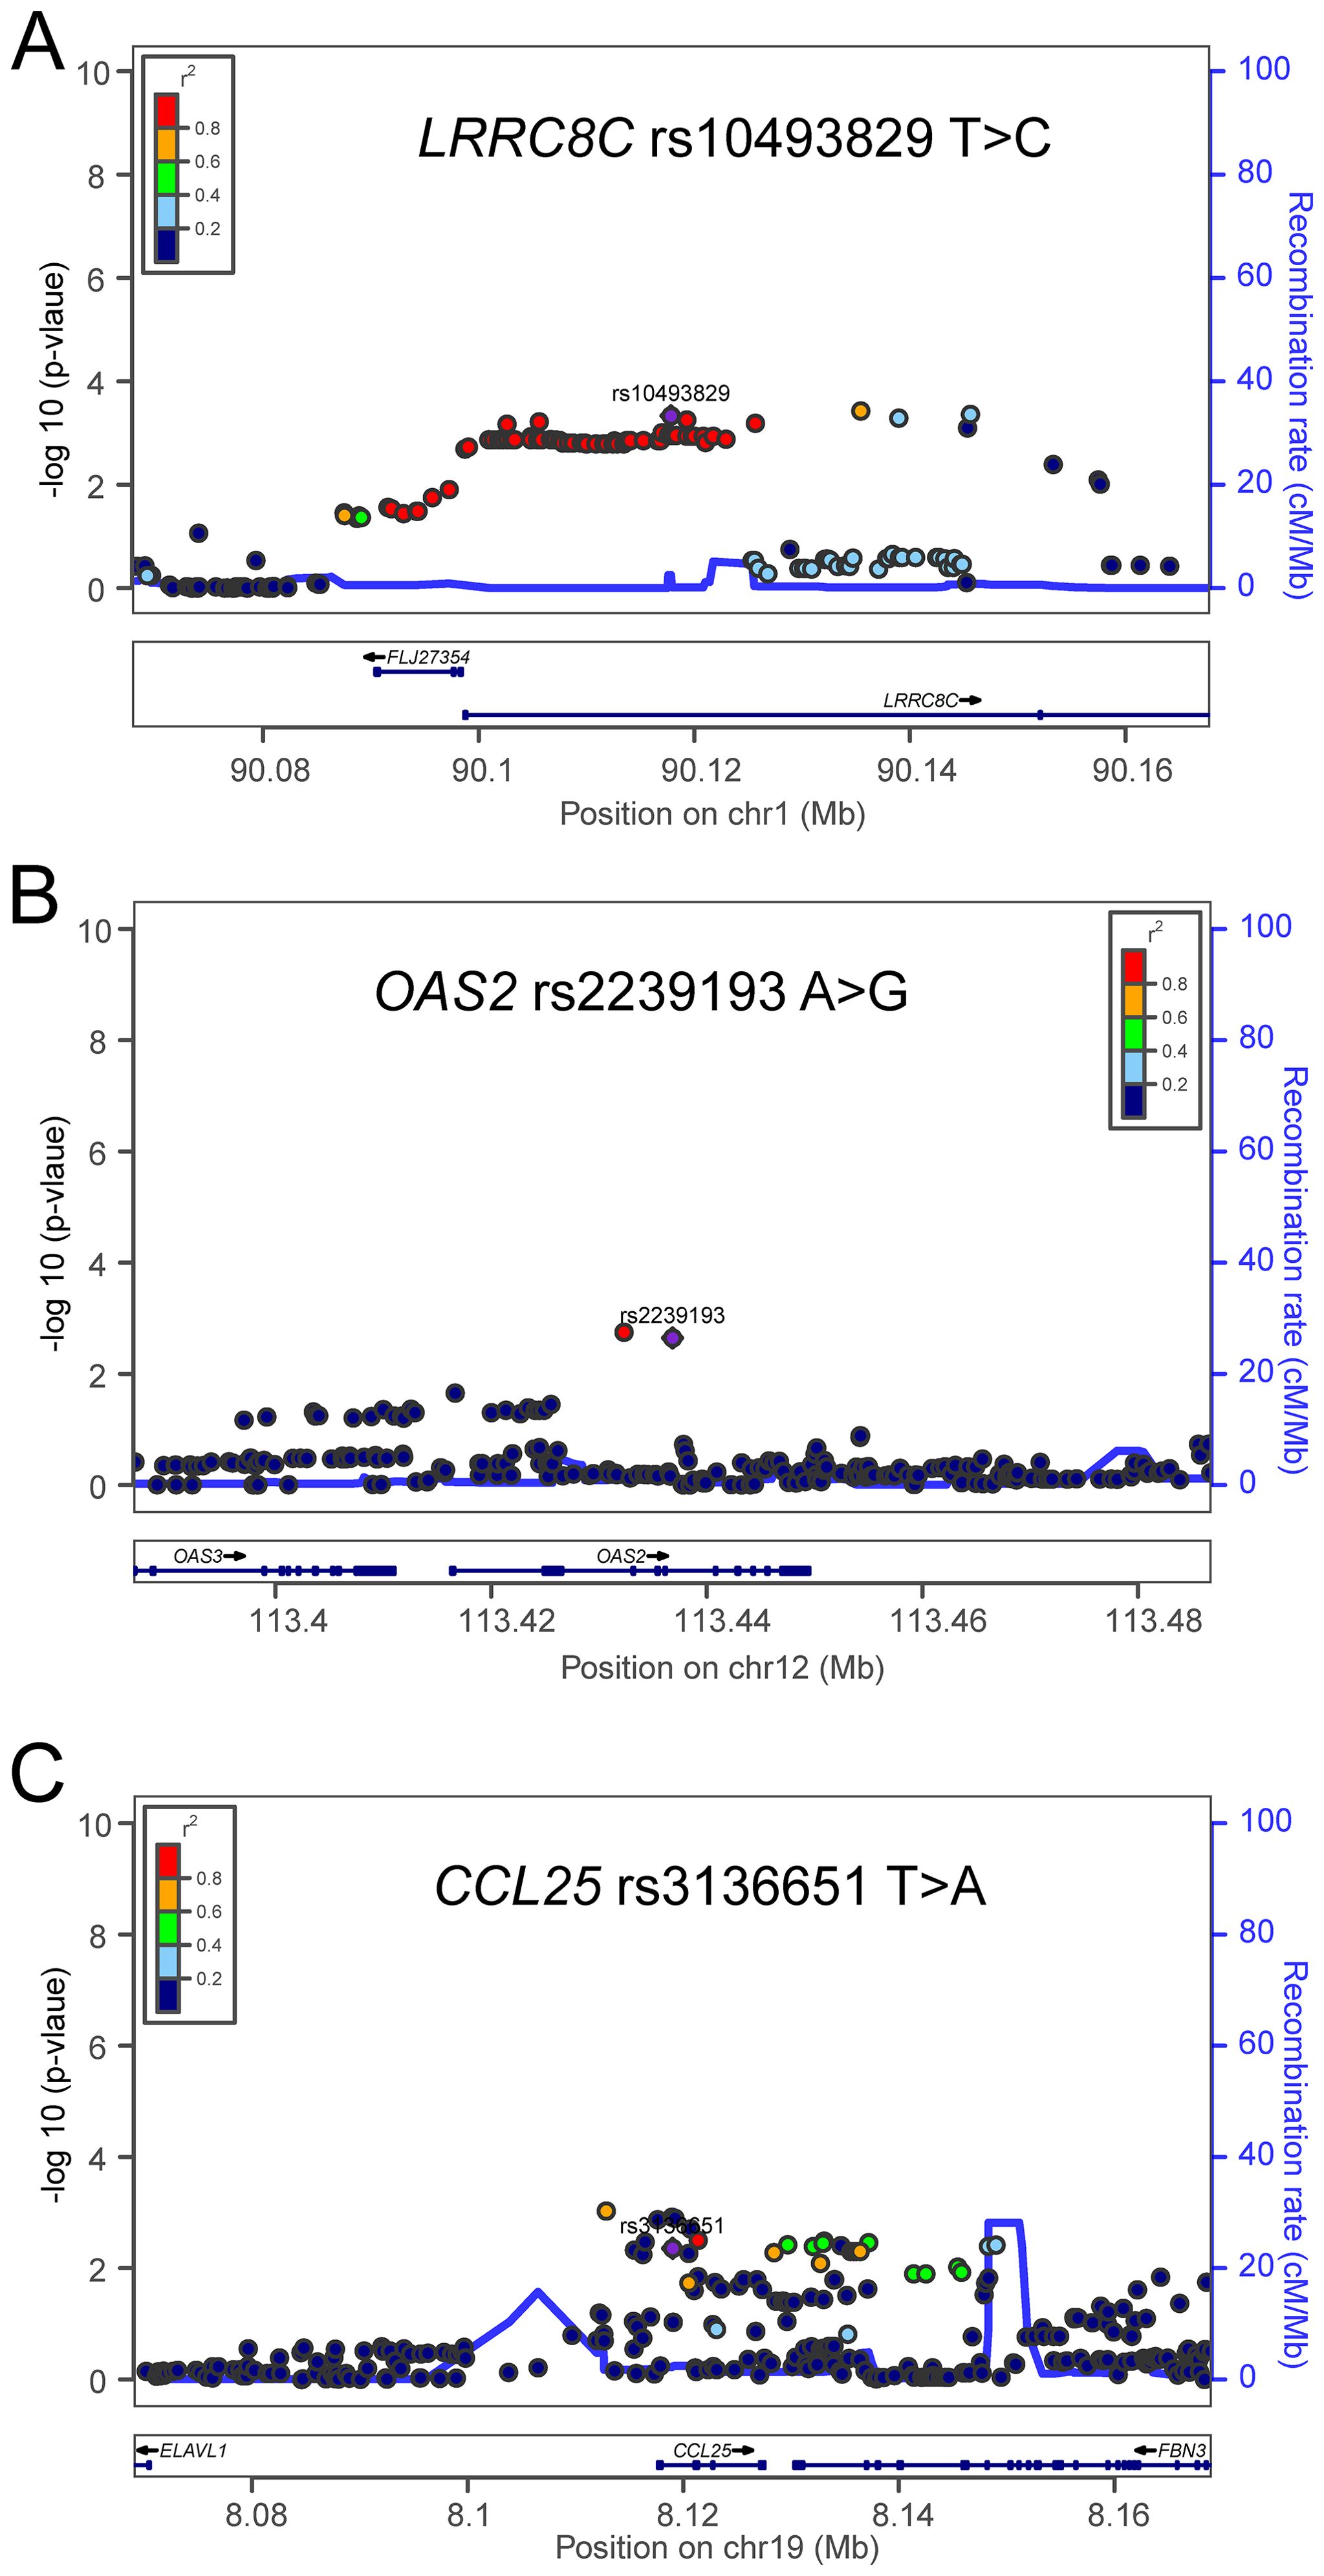
Figure 4. Regional association plots for the three independent SNPs in the T-cell exhaustion related genes. Regional association plots included 50kb up or downstream of (A) LRRC8C, (B) OAS2, and (C) CCL25. Data points are colored according to the level of linkage disequilibrium of each pair of SNPs based on the hg19/1000 Genomes European population. The left-hand y-axis shows the association P-value of individual SNPs in the discovery dataset, which is plotted as -log10 (P) against chromosomal base-pair position. The right-hand y-axis shows the recombination rate estimated from HapMap Data Rel 22/phase II European population.
As shown in Table 2, the LRRC8C rs10493829 C allele and CCL25 rs3136651 A allele were associated with better NSCLC OS (Ptrend = 0.0005 and 0.003, respectively) and DSS (Ptrend = 0.0001 and 0.009, respectively), while the OAS2 rs2239193 G allele was associated with poor NSCLC OS and DSS (Ptrend = 0.002 for both). In a dominant genetic model, compared with the reference genotype, NSCLC patients had a poor survival associated with LRRC8C rs10493829 TT (OS: HR = 1.18, 95% CI = 1.01-1.37, P = 0.035), OAS2 rs2239193 AG+GG (OS: HR = 1.38, 95% CI = 1.11-1.70, P = 0.003; DSS: HR = 1.43, 95% CI = 1.15-1.78, P = 0.001) and CCL25 rs3136651 TT (OS: HR = 1.20, 95% CI = 1.02-1.40, P = 0.024; DSS: HR = 1.19, 95% CI = 1.01-1.40, P = 0.037). As a result, those risk genotypes were considered unfavorable genotypes. We also depicted these results in Kaplan-Meier survival curves (Supplementary Figure 3). These results suggested the three SNPs were independently associated with NSCLC survival.
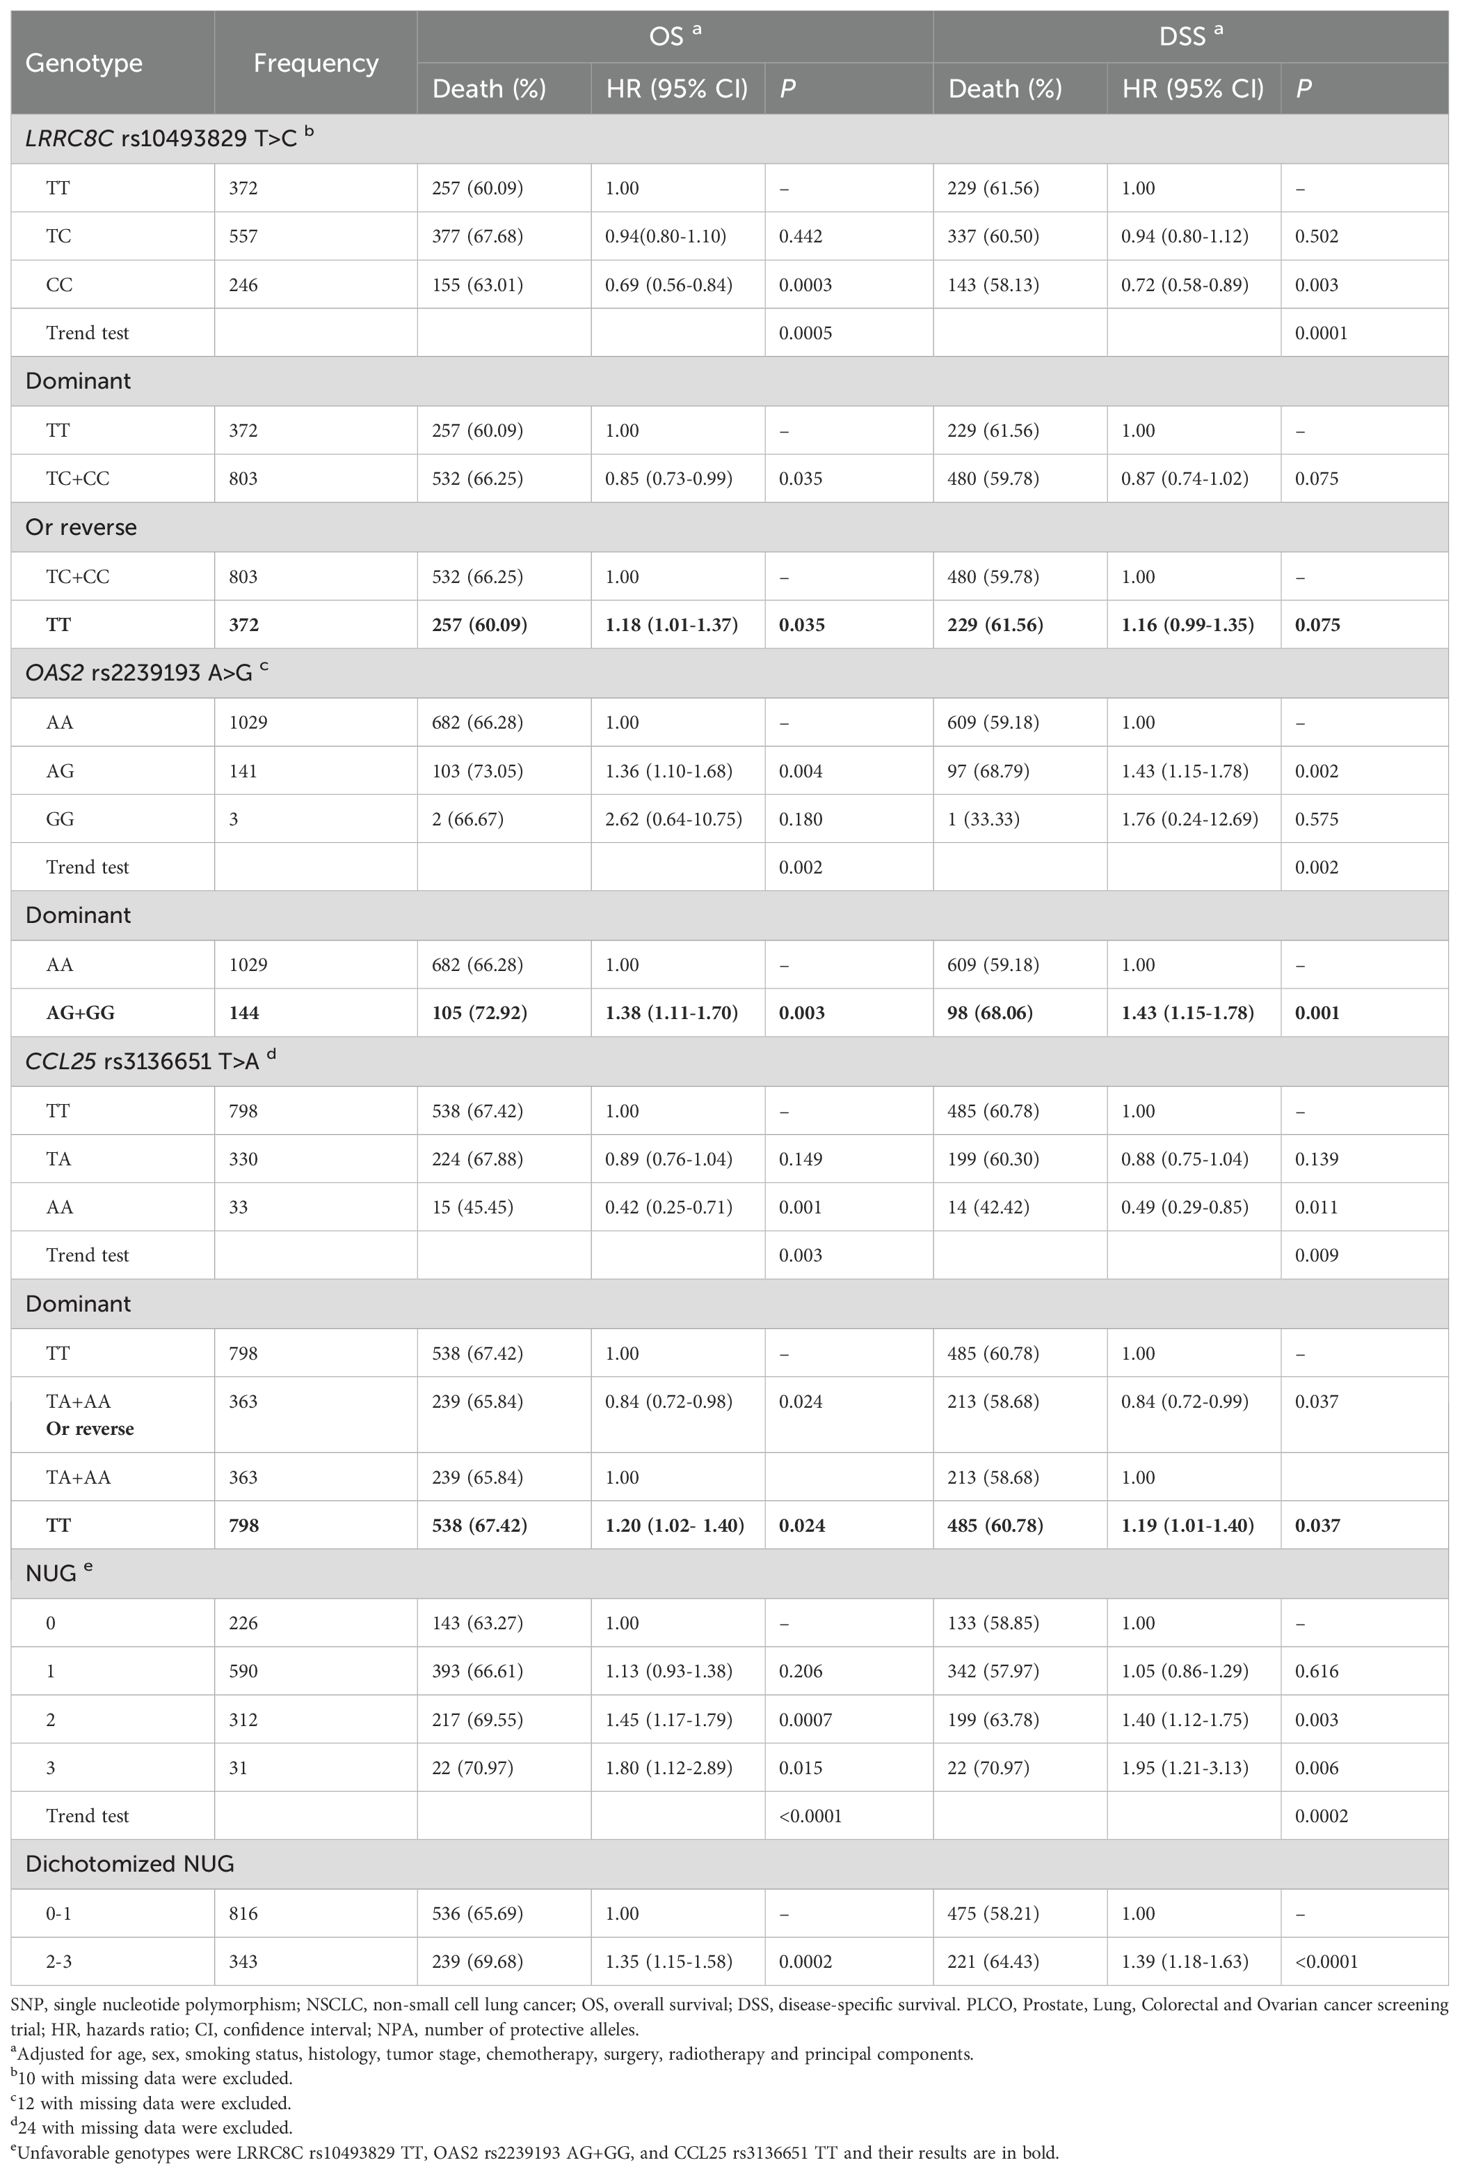
Table 2. Associations between the NUGs of three independent SNPs with NSCLC OS and DSS in the PLCO Trial.
3.3 Combined analyses of the associations between the three independent SNPs and NSCLC survival in the PLCO dataset
To evaluate accumulative effect of the three independent SNPs on NSCLC survival, we combined their unfavorable genotypes (i.e., LRRC8C rs10493829 TT, OAS2 rs2239193 AG+GG, and CCL25 rs3136651 TT) into a genetic score that was used to categorize all NSCLC patients into four groups (i.e., 0, 1, 2, and 3) by the number of their unfavorable genotypes (NUG). The results presented in Table 2 suggested that an increased NUG score was associated with a poorer NSCLC survival for both OS (Ptrend < 0.0001) and DSS (Ptrend = 0.0002) in the multivariable Cox model. We further dichotomized all NSCLC patients into two groups: 0-1 and 2-3 NUGs. Compared with the 0-1 NUG group, the 2-3 NUG group had a significantly poorer OS (HR = 1.35, 95% CI = 1.15-1.58, P = 0.0002) and DSS (HR = 1.39, 95% CI = 1.18-1.63, P < 0.0001). Furthermore, we also depicted these results with Kaplan-Meier survival curves (Figures 5A–D). To sum up, these combined analyses indicated that an increased NUG score was associated with a poorer NSCLC survival.
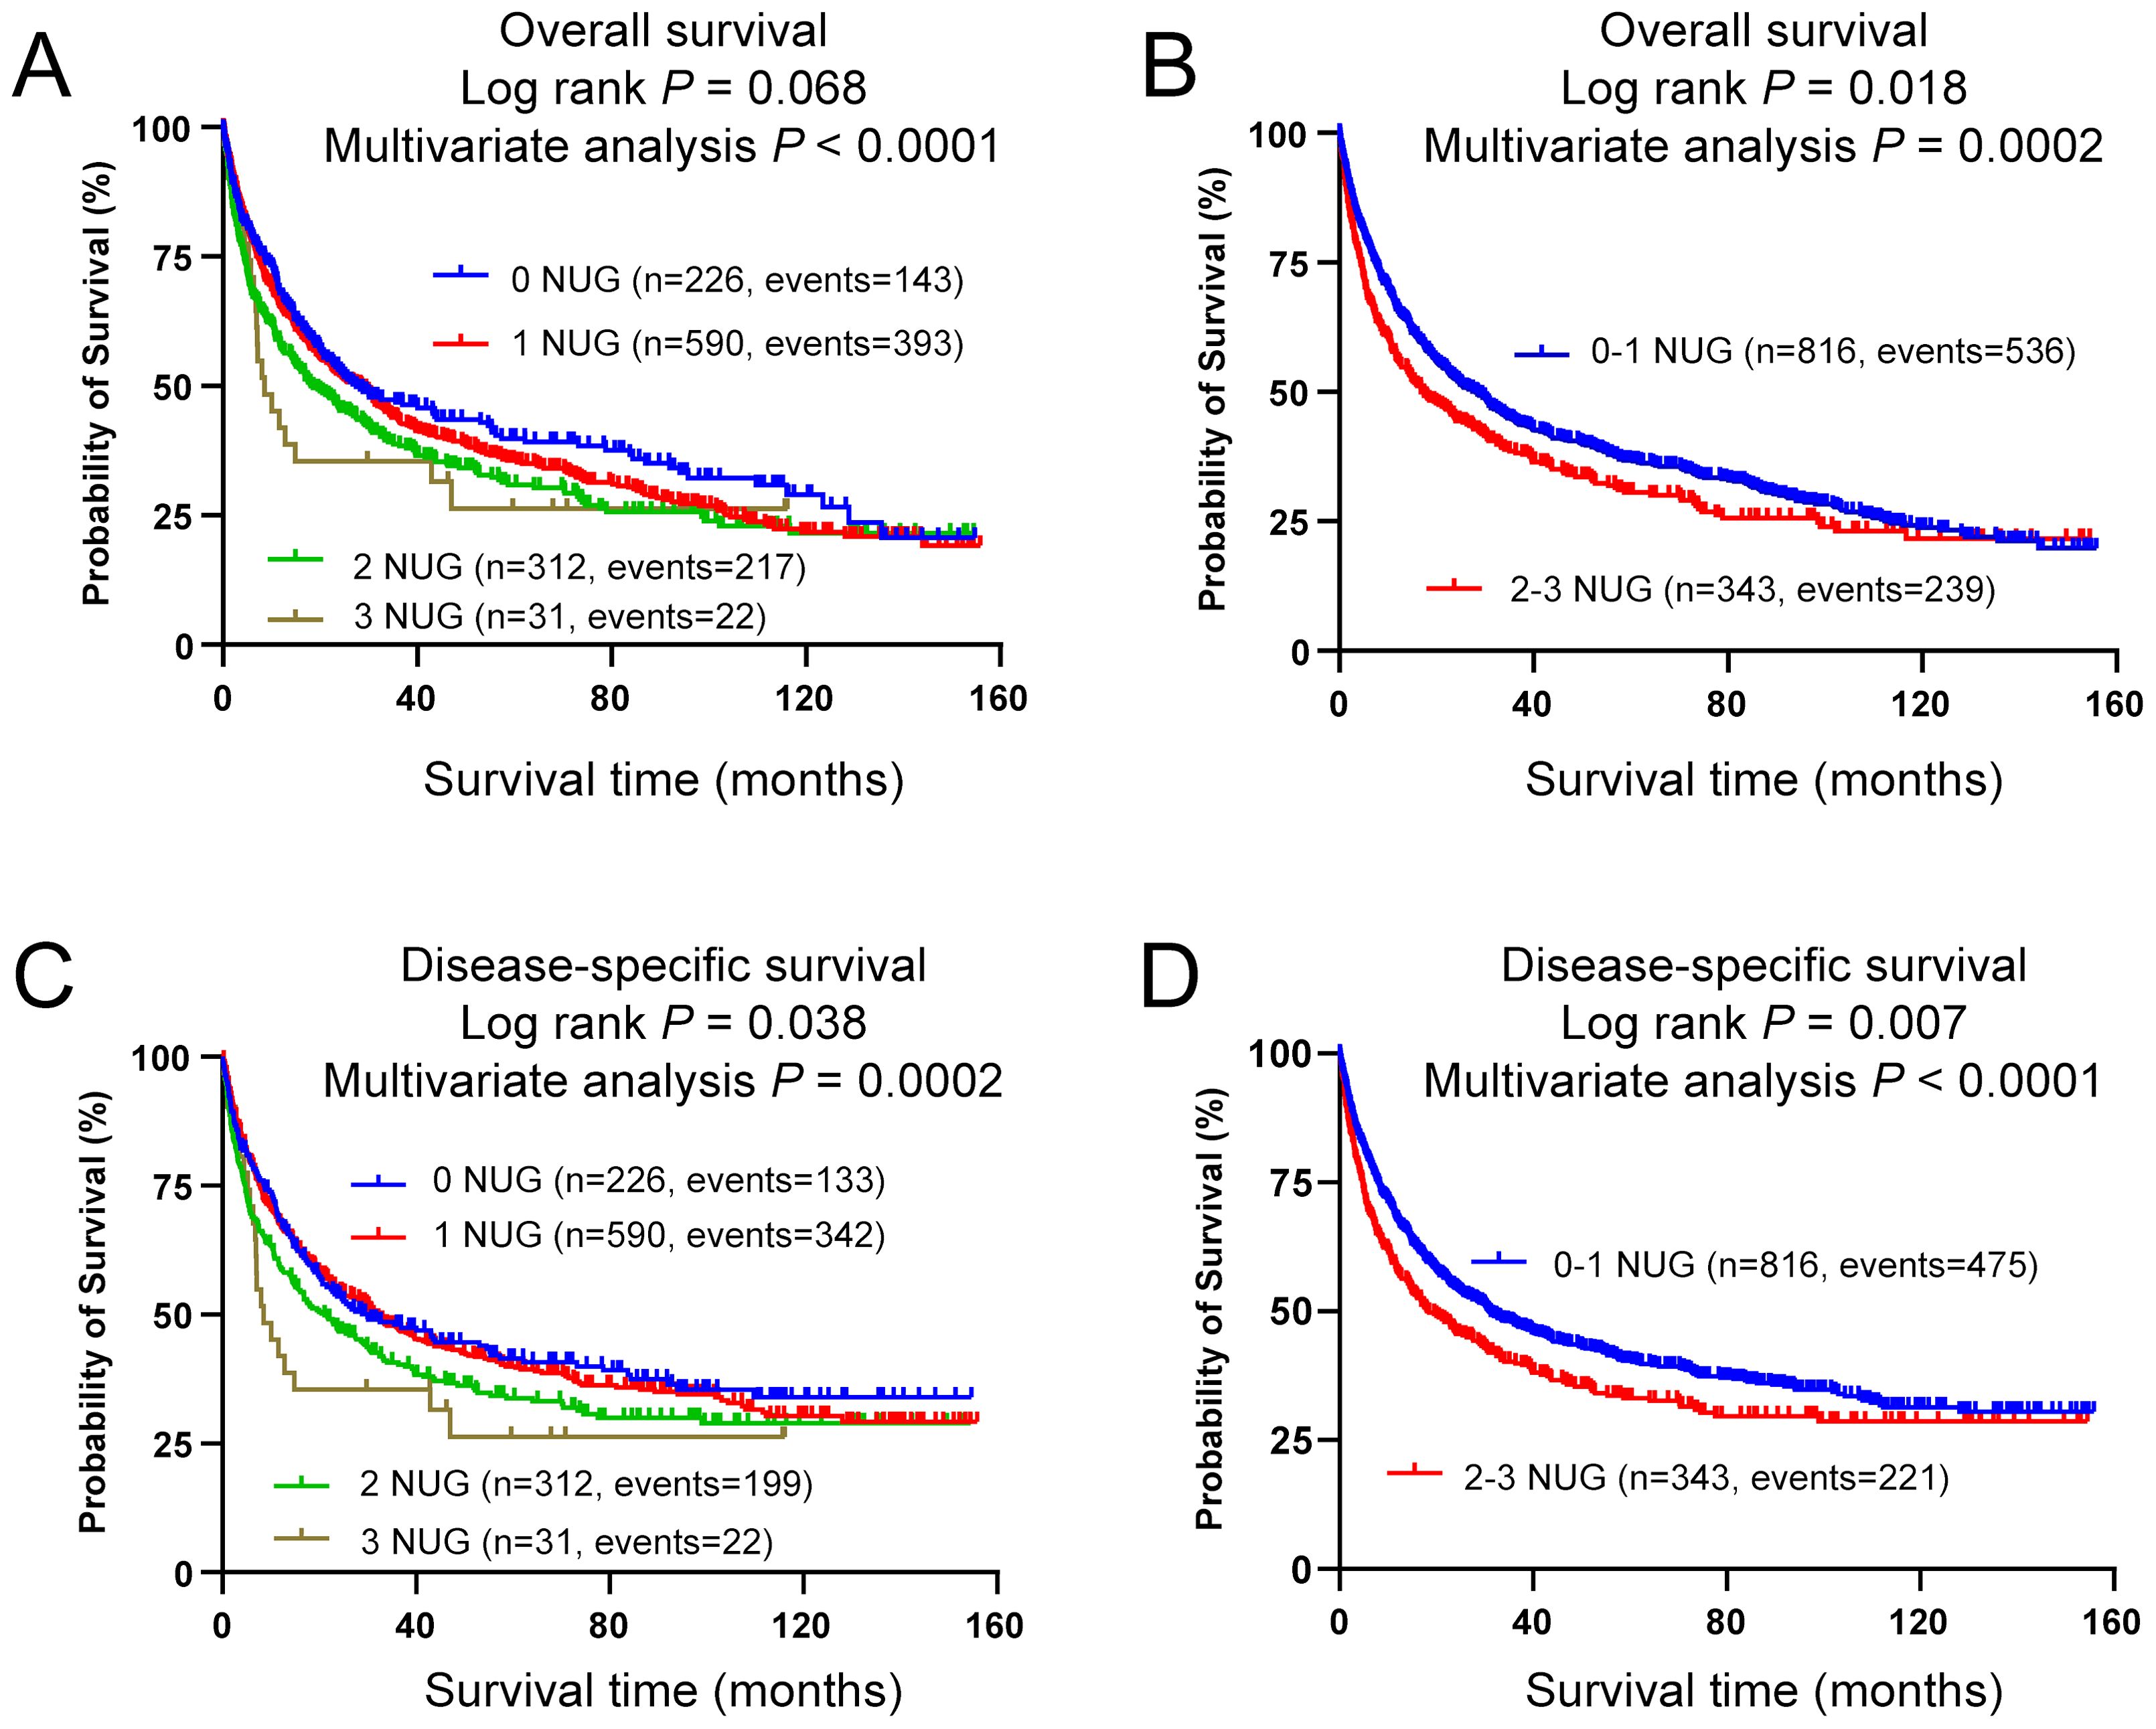
Figure 5. Prediction of survival with combined unfavorable genotypes. Kaplan-Meier survival curves in the PLCO dataset for (A) OS with the combined unfavorable genotypes, (B) OS with the dichotomized groups of the NUGs, (C) DSS with the combined unfavorable genotypes, (D) DSS with dichotomized groups of the NUGs. Unfavorable genotypes were LRRC8C rs10493829 TT, OAS2 rs2239193 AG+GG, and CCL25 rs3136651 TT.
3.4 Stratified analyses for the effect of NUG on NSCLC survival in the PLCO dataset
To explore whether the effect of NUG on NSCLC survival was influenced by other clinical covariates, we performed stratified analyses by age, sex, smoking status, histology, tumor stage, chemotherapy, radiotherapy, and surgery in the PLCO trial. As shown in Supplementary Table 5, for the effect on NSCLC OS and DSS, there were no significant interactions of NUG with age, smoking status, histology, tumor stage on DSS, chemotherapy, radiotherapy, and surgery (all Pinter > 0.05). However, the interaction of NUG with sex (OS: P = 0.0004 and DSS: P = 0.0005) and tumor stage (P = 0.034) was statistically significant (Pinter < 0.05).
3.5 Time-dependent AUC and ROC curves to predict NSCLC survival for the three independent SNPs
To further assess the predictive value of these three independent SNPs, we performed the time-dependent AUC and ROC curves for OS and DSS at the 12th, 36th, and 60th month with the clinical variables in the PLCO trial. Time-dependent AUC for OS and DSS are listed in Supplementary Figures 4A, B. With the addition of the three SNPs to the predictive model, there were no significantly improved NSCLC survival curves at 12th for OS (P = 0.087) and DSS (P = 0.065) (Supplementary Figures 4C, D), 36th for OS (P = 0.607) and DSS (P = 0.329) (Supplementary Figures 4E, F), 60th for OS (P = 0.090) (Supplementary Figure 4G). However, the predictive performance of AUC curves at the 60th month for DSS was significantly improved (P = 0.045) (Supplementary Figure 4H). These data suggested that the addition of the three SNPs to the predictive model could only improve AUC at the 5-year DSS.
3.6 The result of eQTL analyses
To explore potential mechanisms underlying the associations of three independent SNPs with NSCLC survival, we performed eQTL analyses to investigate the correlations between these three independent SNPs and their corresponding mRNA expression levels. First, with RNA-Seq data of the lymphoblastoid cell lines from 373 European descendants in the 1000 Genomes Project, the LRRC8C rs10493829 C allele was significantly correlated with increased expression levels of LRRC8C mRNA in additive (P = 0.003, Figure 6A) and recessive models (P = 0.001, Figure 6B), but not in the dominant model (Supplementary Figure 5A). The OAS2 rs2239193 G allele and CCL25 rs3136651 A allele showed no correlation with their mRNA expression levels in additive, dominant, and recessive models (Supplementary Figures 5B–G). Then, using data from the GTEx project, we found that the LRRC8C rs10493829 C allele was significantly correlated with high mRNA expression levels of LRRC8C in normal lung tissues (P = 7.22e-4, Figure 6C) and whole blood samples (P = 1.76e-3, Figure 6D). The OAS2 rs2239193 G allele showed no correlation with OAS2 mRNA expression levels in normal lung tissues and whole blood (Supplementary Figures 5H, I). However, there was no data for CCL25 rs3136651 A allele in the GTEx project. These data indicated that the LRRC8C rs10493829 C allele might regulate the mRNA expression levels of its corresponding gene.
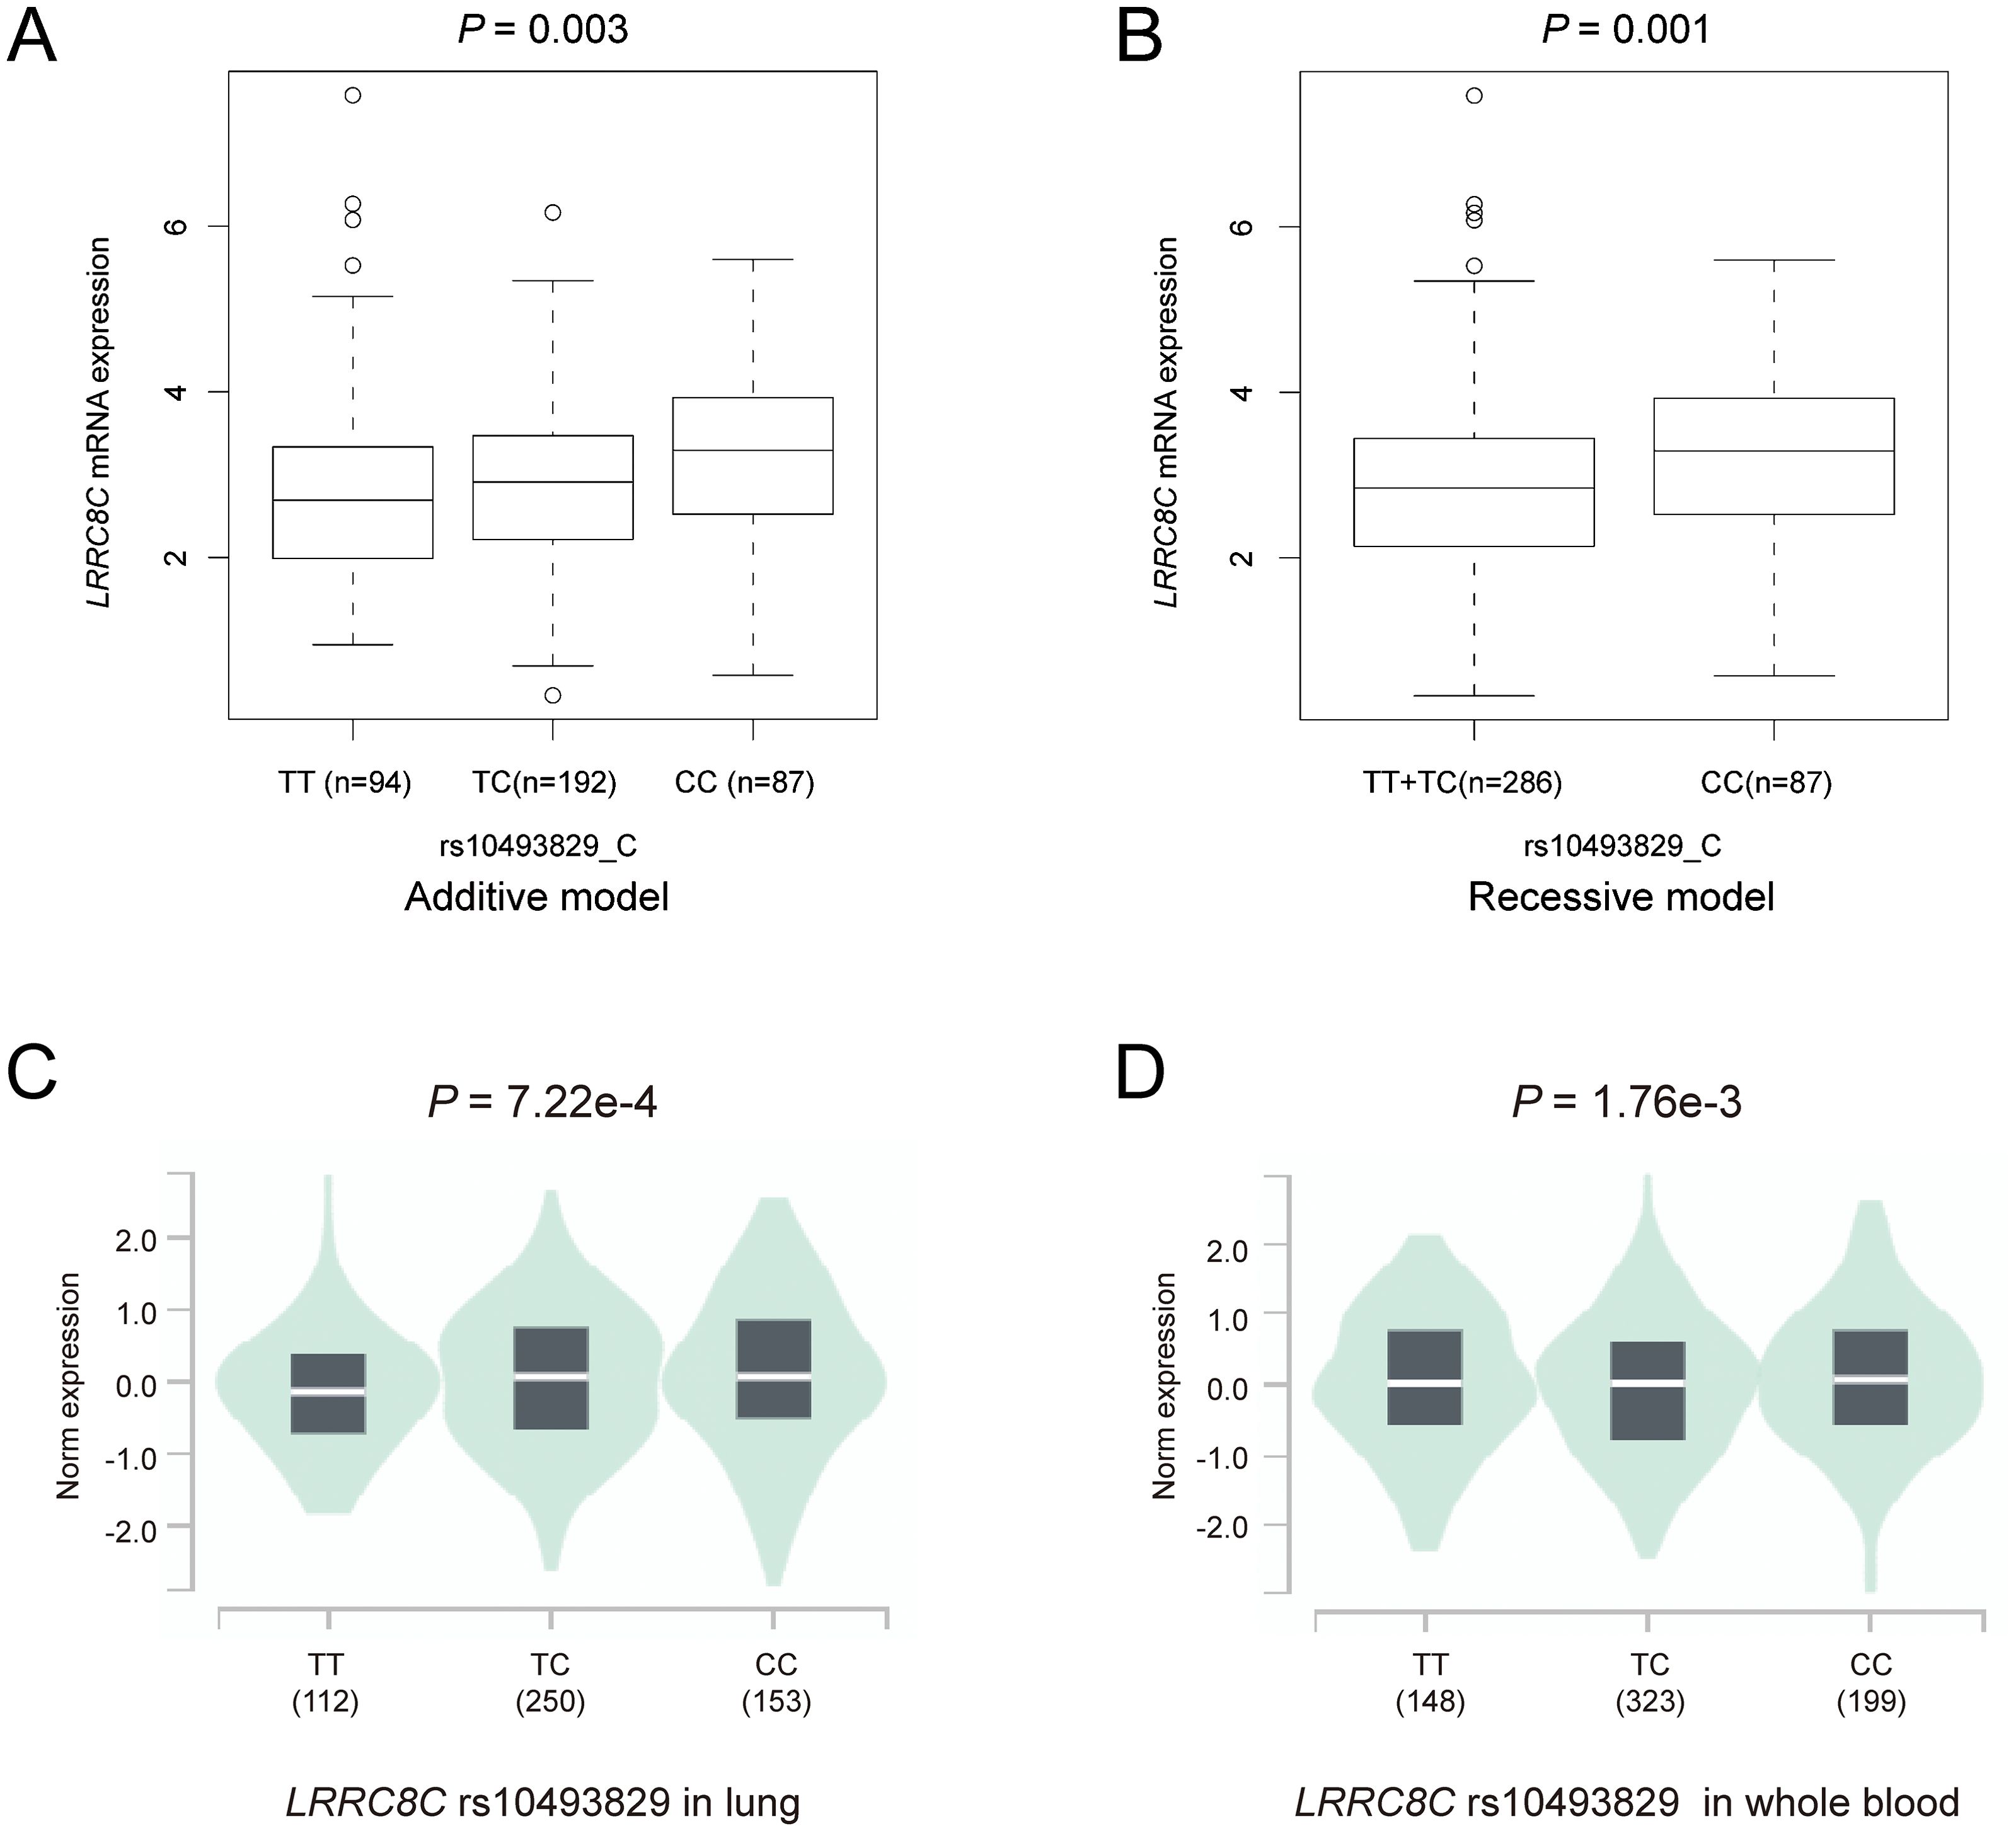
Figure 6. The results of eQTL analyses. The LRRC8C rs10493829 C allele was associated with high mRNA expression levels of LRRC8C in (A) additive model and (B) recessive model in normal lymphoblastoid cells, (C) normal lung tissues and (D) whole blood samples in the GTEx project.
3.7 The result of mRNA expression levels and survival
To explore the mRNA expression levels of LRRC8C, OAS2, and CCL25 with paired and unpaired tests, we input these three genes in the module “paired samples” and “disease and non-disease” of the XIANTAO online tool. Paired t-tests suggested that compared with normal lung tissue, LRRC8C mRNA was significantly down-regulated in combined lung squamous cell carcinoma (LUSC) + lung adenocarcinoma (LUAD) (Figure 7A), LUSC, and LUAD (all P < 0.0001) (Supplementary Figures 6A, B). Similar results were also observed with unpaired tests for combined LUSC + LUAD (Figure 7B), LUSC, and LUAD (Supplementary Figures 6C, D). Furthermore, survival analysis from the Kaplan-Meier Plotter database suggested that high LRRC8C mRNA expression levels were associated with a better NSCLC survival (HR = 0.62, 95% CI: 0.51-0.75, log-rank P < 0.0001) (Figure 7C). Paired tests suggested that OAS2 mRNA expression levels were down-regulated in combined LUSC + LUAD (P = 0.004) (Figure 7D), LUSC (P = 0.026), but not in LUAD (P = 0.066) (Supplementary Figures 6E, F), and the unpaired tests indicated that mRNA expression levels of OAS2 were lower in LUSC + LUAD (P = 4.6e-05) (Figure 7E), LUSC (P = 0.003), and LUAD (P = 0.006) (Supplementary Figures 6G, H). Moreover, high OAS2 mRNA expression levels were associated with favorable NSCLC survival (HR = 0.77, 95% CI: 0.66-0.90, log-rank P = 8.6e-04) (Figure 7F). Furthermore, paired and unpaired tests indicated that the mRNA expression levels of CCL25 were up-regulated in combined LUSC + LUAD, LUSC, and LUAD (Figures 7G, H, Supplementary Figures 6–L). High mRNA expression levels of CCL25 were associated with a poor NSCLC OS (HR = 1.17, 95% CI: 1.03-1.33, log-rank P = 0.015) (Figure 7I). Taken together, these findings suggested that LRRC8C and OAS2 might act as suppressor genes, while CCL25 might function as an oncogene.
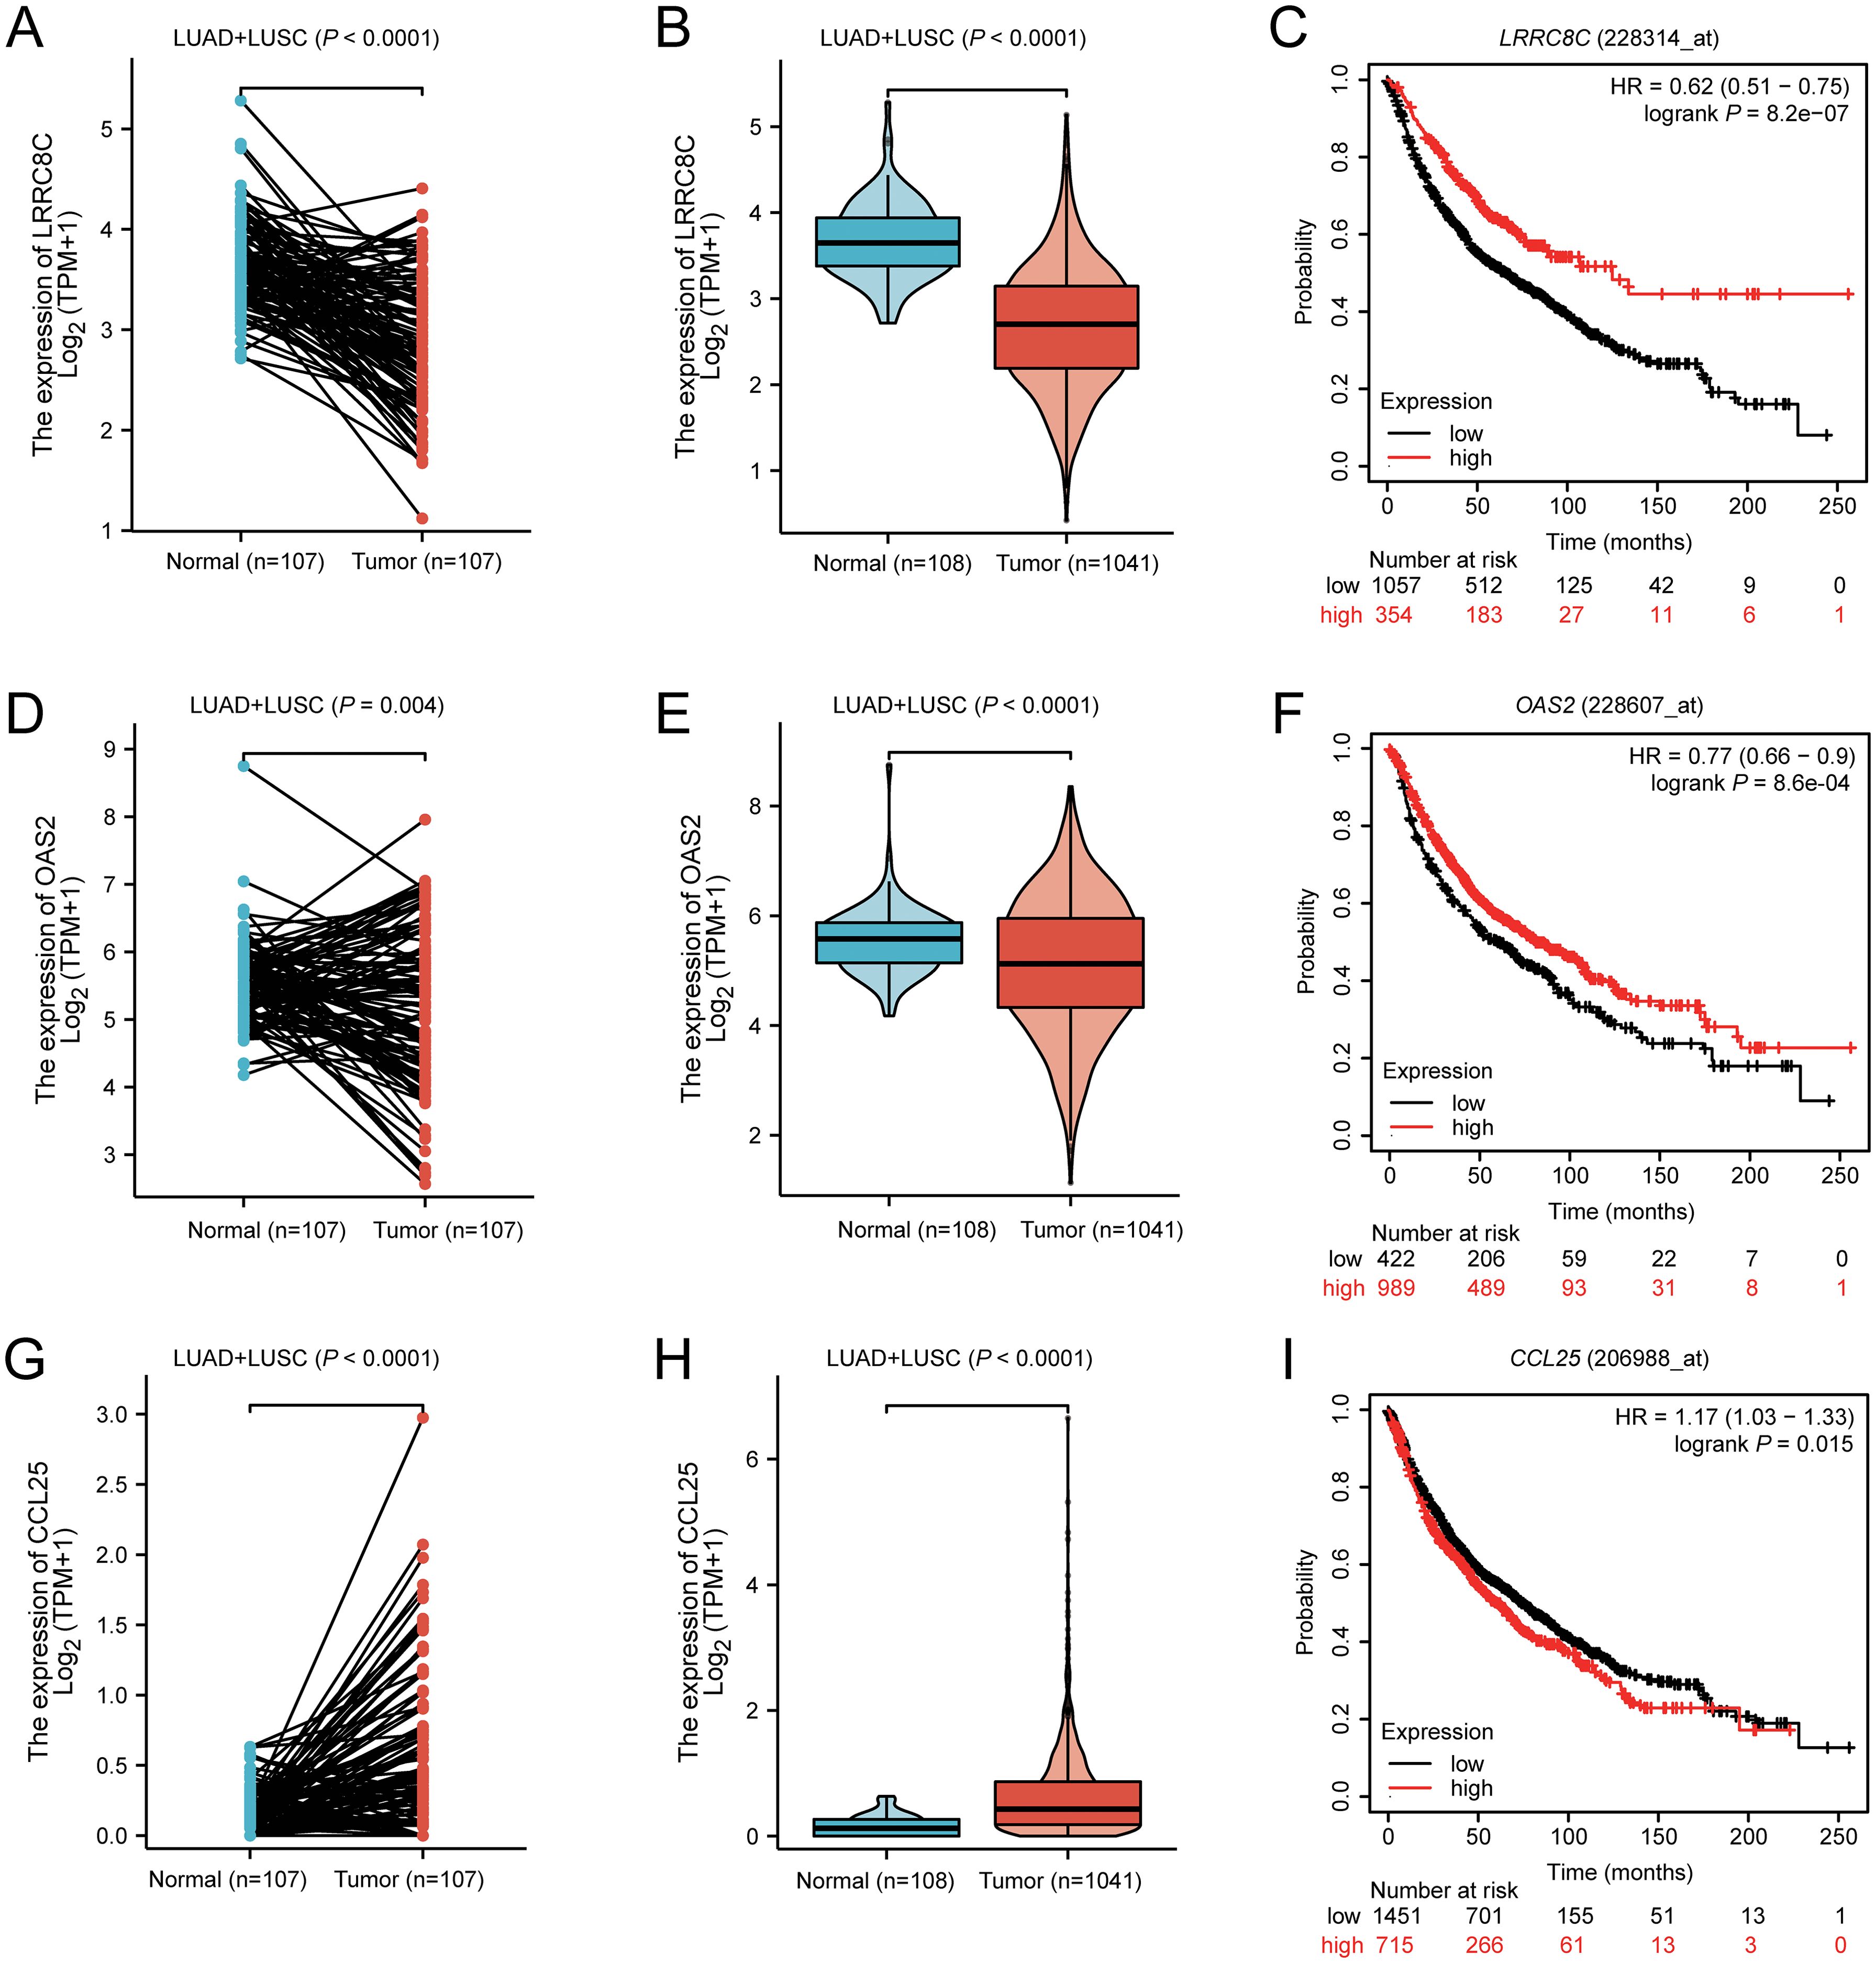
Figure 7. The result of mRNA expression levels from XIANTAO and survival from Kaplan-Meier Plotter database for LRRC8C, OAS2, and CCL25. LRRC8C mRNA was down-regulated in combined LUAD+LUSC with (A) paired and (B) unpaired tests, (C) high LRRC8C mRNA expression levels were associated with a better NSCLC survival; OAS2 mRNA was down-regulated in combined LUAD+LUSC with (D) paired and (E) unpaired tests, (F) high OAS2 mRNA expression levels were associated with a better NSCLC survival; CCL25 mRNA was up-regulated in combined LUAD+LUSC with (G) paired and (H) unpaired tests, (I) high CCL25 mRNA expression levels were associated with a poor NSCLC survival.
4 Discussion
In the present study, we assessed the associations between 52,103 SNPs in the 672 T cell exhaustion-related genes and NSCLC survival by using available NSCLC genotyping data from two public GWAS datasets and clinical information from both the PLCO trial and the HLCS study. We identified three SNPs (i.e., the LRRC8C rs10493829 T>C, OAS2 rs2239193 A>G, and CCL25 rs3136651 T>A) that were independently associated with the survival of NSCLC patients. Additionally, an increased NUG score was associated with poorer NSCLC OS and DSS. Furthermore, the addition of these three SNPs to the predictive model significantly improved 5-year DSS, suggesting that these three independent SNPs may be predictors for NSCLC survival. In the functional SNP-mRNA analysis, we also found that LRRC8C rs10493829 C allele was associated with significantly higher LRRC8C mRNA expression levels. Moreover, high LRRC8C and OAS2 mRNA expression levels were associated with a better NSCLC survival, while high CCL25 mRNA expression levels were associated with a poorer NSCLC survival. These data indicated that LRRC8C rs10493829 C allele could modulate the mRNA expression levels of LRRC8C to influence NSCLC survival, which provided some evidence for biological plausibility of the observed SNP-survival associations, particularly for the LRRC8C rs10493829 T>C SNP.
Recent advances in immunotherapy have dramatically improved the prognosis of NSCLC patients; however, the acquired resistance limits the percentage of patients with durable therapeutic responses (39). T cell exhaustion, a hypofunctional state of T cells resulting from a prolonged exposure to antigenic stimulation, is a key hallmark of the immunosuppressive TME status and mechanism of the acquired resistance to immunotherapy (40, 41). However, there was no reported role of genetic variants in the T cell exhaustion-related genes on survival of NSCLC patients. For the first time, in the present study, we identified three SNPs in T cell exhaustion-related genes, which collectively predicted NSCLC survival.
LRRC8C, the leucine-rich repeat containing 8 volume-regulated anion channel (VRAC) subunit C, is located on chromosome 1 and composed of 803 amino acids. Previous studies of LRRC8C have focused on the immune system. As an essential component for VRAC, LRRC8C mediates the transport of 2’3cGAMP and activates STING and P53 to inhibit the enhanced T cell function, further regulating T cell proliferation and survival (42). On the contrary, the deletion of Lrrc8c enhanced the CD4+ and CD8+ T cell function by down-regulating p53 signaling (42, 43). These discoveries added to the evidence that LRRC8C-STING-p53 signaling axis may act as a new inhibitory pathway that controls the function and adaptive immunity of T cells.
However, what is not yet known is the role of LRRC8C in NSCLC survival. To the best of our knowledge, the present study is the first to to have identified the associations between genetic variants of LRRC8C and NSCLC survival. Notably, LRRC8C rs10493829 T>C showed a significant protective effect on the survival of NSCLC patients and was associated with elevated mRNA expression levels in normal lymphoblastoid cells, lung tissue, and whole blood. Furthermore, LRRC8C mRNA expression levels were upregulated in normal tissues and associated with favorable NSCLC survival. These findings imply that LRRC8C may act as a suppressor gene and that the LRRC8C rs10493829 C allele may regulate the mRNA expression levels of its corresponding gene to influence prognosis in NSCLC.
OAS2, 2’-5’-Oligoadenylate Synthetase 2, is located on chromosome 12 and composed of 719 amino acids. Previous studies have suggested that OAS2 regulates multiple cellular processes, including cell proliferation, invasion, and autophagy. For example, it was reported that OAS2 suppressed cell proliferation and invasion and promoted autophagy in colorectal cancer (44). Moreover, OAS2 overexpression was found to be significantly associated with a favorable prognosis in various cancers (44, 45). As for NSCLC, OAS2 was significantly down-regulated in human gefitinib-resistant tissues, while up-regulation of OAS2 reversed the resistance in gefitinib-resistant cell lines (46). In the present study, we found that the OAS2 rs2239193 G allele was associated with NSCLC survival. In addition, OAS2 mRNA expression levels were increased in normal lung tissues than NSCLC tissues, and up-regulation of OAS2 was associated with favorable NSCLC survival. Consistent with previous studies, these findings also suggested that OAS2 might function as a potential suppressor gene in NSCLC. However, we did not find an association between OAS2 rs2239193 G allele and mRNA expression levels of OAS2. Taken together, additional experiments should be designed to explore the potential mechanisms underlying the observed associations.
CCL25, C-C Motif Chemokine Ligand 25, is located on chromosome 19 and composed of 150 amino acids. CCL25 is the natural ligand for C-C motif chemokine receptor 9 (CCR9). Data from previous studies have established that CCR9/CCL25 interaction promote tumor proliferation, invasion, anti-apoptosis, and migration in a variety of malignant tumors (47–49). In NSCLC, the CCR9/CCL25 interaction induced tumorigenesis and inhibited apoptosis of tumor cells by activating the PI3K/Akt signaling pathway (50). Similarly, another study demonstrated that CCL25 enhanced the phenotype of migration and invasion in NSCLC lines and that NSCLC patients with lower CCL25 expression had a better OS (51). Moreover, the CCR9/CCL25 chemokine axis plays an important role in shaping TME by attracting immune cells in the tumor, leading TME toward an immunosuppressive state (52). In the present study, we found that the CCL25 rs3136651 A allele had a significant protective effect on NSCLC survival and that CCL25 mRNA levels were markedly up-regulated in NSCLC tissues and associated with a reduced survival. These results were consistent with the above-mentioned previous studies, suggesting that CCL25 may function as an oncogene in NSCLC; however, additional functional studies should be designed to investigate the underlying molecular mechanisms.
There are several limitations in the present study. Firstly, although the evidence showing that genetic variants in T cell exhaustion-related genes are associated with NSCLC survival, the molecular mechanisms underlying the observed associations are still uncertain. Further experiments in vitro and in vivo should be designed to investigate the potential mechanisms. Secondly, because the two available GWAS datasets were of European descendants, our results may not be generalized to other ethnic populations. Thirdly, the detailed genotype and clinical outcome data were not available from HLCS for us to replicate the results of the same combined and stratified analyses performed with the PLCO data only.
In conclusion, in the present study, we identified that three independent SNPs were associated with NSCLC survival in both the PLCO trial and the HLCS study. We also found that LRRC8C rs10493829 C allele affected NSCLC survival possibly by regulating the targeted mRNA expression. Our results indicate that these three SNPs in the T cell exhaustion-related genes may be potential biomarkers for NSCLC survival.
Data availability statement
The datasets presented in this study can be found in online repositories. The names of the repository/repositories and accession number(s) can be found below: https://www.ncbi.nlm.nih.gov/gap/, phs000093.v2.P2; https://www.ncbi.nlm.nih.gov/snp/, phs000336.v1.p1.
Ethics statement
The use of the two GWAS datasets for experimentation was approved by the Internal Review Board of Duke University School of Medicine (Project #Pro00054575) and the dbGaP database (Project #6404). The studies were conducted in accordance with the local legislation and institutional requirements. The participants provided their written informed consent to participate in this study.
Author contributions
GL: Writing – review & editing, Writing – original draft, Software, Funding acquisition, Formal analysis, Conceptualization. HL: Writing – review & editing, Validation, Supervision, Software, Methodology, Data curation, Conceptualization. HW: Writing – review & editing, Formal analysis. XT: Writing – review & editing, Software. SL: Writing – review & editing, Supervision, Methodology. MD: Writing – review & editing, Validation, Formal analysis, Data curation. DC: Writing – review & editing, Supervision, Methodology, Funding acquisition. QW: Writing – review & editing, Supervision, Methodology, Funding acquisition, Conceptualization.
Funding
The author(s) declare financial support was received for the research, authorship, and/or publication of this article. Programme Development Grants (Award number(s): 2R01 ES011740, 1R01CA 131274, U01CA209414, CA092824, CA074386, CA090578). Qingyi Wei was supported by NIH grants 2R01 ES011740 and 1R01CA 131274 and also partly supported by the Duke Cancer Institute as part of the P30 Cancer Center Support Grant (Grant ID: NIH/NCI CA014236). The Harvard Lung Cancer Susceptibility Study was supported by NIH grants U01CA209414, CA092824, CA074386 and CA090578 to David C. Christiani. Guojun Lu was supported by Jiangsu Health International Exchange Program.
Acknowledgments
The authors thank all the participants of the PLCO Cancer Screening Trial. The authors also thank the National Cancer Institute for granting access to the data collected during the PLCO trial. The authors would also like to acknowledge the dbGaP repository for providing valuable cancer genotyping datasets. The accession numbers for the lung cancer datasets are phs000336.v1.p1 and phs000093.v2.p2. A list of contributing investigators and funding agencies for those studies can be found in the Supplementary Data.
Conflict of interest
The authors declare that the research was conducted in the absence of any commercial or financial relationships that could be construed as a potential conflict of interest.
Publisher’s note
All claims expressed in this article are solely those of the authors and do not necessarily represent those of their affiliated organizations, or those of the publisher, the editors and the reviewers. Any product that may be evaluated in this article, or claim that may be made by its manufacturer, is not guaranteed or endorsed by the publisher.
Supplementary material
The Supplementary Material for this article can be found online at: https://www.frontiersin.org/articles/10.3389/fimmu.2024.1455927/full#supplementary-material
Abbreviations
AUC, receiver operating characteristic curve; BFDP, Bayesian false discovery probability; CCL25, C-C Motif Chemokine Ligand 25; CI, confidence interval; DSS, disease special survival; eQTL, expression quantitative trait loci; GWAS, Genome-Wide Association Study; HWE, Hardy-Weinberg equilibrium; HLCS, Harvard Lung Cancer Susceptibility; HR, hazards ratio; LD, linkage disequilibrium; LRRC8C, leucine rich repeat containing 8 volume-regulated anion channel (VRAC) subunit C; LUAD, lung adenocarcinoma; LUSC, lung squamous cell carcinoma; MAF, minor allelic frequency; NSCLC, non-small cell lung cancer; OAS2, 2’-5’-Oligoadenylate Synthetase 2; OS, overall survival; ROC, receiver operating characteristic; PLCO, the Prostate, Lung, Colorectal and Ovarian Cancer Screening Trial; SNPs, single nucleotide polymorphisms; TCGA, the Cancer Genome Atlas.
References
1. Bray F, Laversanne M, Sung H, Ferlay J, Siegel RL, Soerjomataram I, et al. Global cancer statistics 2022: GLOBOCAN estimates of incidence and mortality worldwide for 36 cancers in 185 countries. CA Cancer J Clin. (2024) 74:229–63. doi: 10.3322/caac.21834
2. Siegel RL, Giaquinto AN, Jemal A. Cancer statistics, 2024. CA Cancer J Clin. (2024) 74:12–49. doi: 10.3322/caac.21820
3. Amatu A, Sartore-Bianchi A, Bencardino K, Pizzutilo EG, Tosi F, Siena S. Tropomyosin receptor kinase (TRK) biology and the role of NTRK gene fusions in cancer. Ann Oncol. (2019) 30:viii5–viii15. doi: 10.1093/annonc/mdz383
4. Stinchcombe TE, Jänne PA, Wang X, Bertino EM, Weiss J, Bazhenova L, et al. Effect of erlotinib plus bevacizumab vs erlotinib alone on progression-free survival in patients with advanced EGFR-mutant non-small cell lung cancer: A phase 2 randomized clinical trial. JAMA Onco. (2019) 5:1448–55. doi: 10.1001/jamaoncol.2019.1847
5. Fu Q, Huang Y, Ge C, Li Z, Tian H, Li Q, et al. SHIP1 inhibits cell growth, migration, and invasion in non−small cell lung cancer through the PI3K/AKT pathway. Oncol Rep. (2019) 41:2337–50. doi: 10.3892/or.2019.6990
6. Oya Y, Hayakawa Y, Koike K. Tumor microenvironment in gastric cancers. Cancer Sci. (2020) 111:2696–707. doi: 10.1111/cas.14521
7. Zhang M, Di Martino JS, Bowman RL, Campbell NR, Baksh SC, Simon-Vermot T, et al. Adipocyte-derived lipids mediate melanoma progression via FATP proteins. Cancer Discovery. (2018) 8:1006–25. doi: 10.1158/2159-8290.CD-17-1371
8. Ghosh S, Dutta R, Ghatak D, Goswami D, De R. Immunometabolic characteristics of Dendritic Cells and its significant modulation by mitochondria-associated signaling in the tumor microenvironment influence cancer progression. Biochem Biophys Res Commun. (2024) 726:150268. doi: 10.1016/j.bbrc.2024.150268
9. Seliger B. Combinatorial approaches with checkpoint inhibitors to enhance anti-tumor immunity. Front Immunol. (2019) 10:999. doi: 10.3389/fimmu.2019.00999
10. Giraldo NA, Sanchez-Salas R, Peske JD, Vano Y, Becht E, Petitprez F, et al. The clinical role of the TME in solid cancer. Br J Cancer. (2019) 120:45–53. doi: 10.1038/s41416-018-0327-z
11. Deniger DC, Pasetto A, Robbins PF, Gartner JJ, Prickett TD, Paria BC, et al. T-cell responses to TP53 “Hotspot” Mutations and unique neoantigens expressed by human ovarian cancers. Clin Cancer Res. (2018) 24:5562–73. doi: 10.1158/1078-0432.CCR-18-0573
12. Holl EK, Frazier VN, Landa K, Beasley GM, Hwang ES, Nair SK. Examining peripheral and tumor cellular immunome in patients with cancer. Front Immunol. (2019) 10:1767. doi: 10.3389/fimmu.2019.01767
13. Topper MJ, Vaz M, Marrone KA, Brahmer JR, Baylin SB. The emerging role of epigenetic therapeutics in immuno-oncology. Nat Rev Clin Oncol. (2020) 17:75–90. doi: 10.1038/s41571-019-0266-5
14. Liu Y, Wang T, Ma W, Jia Z, Wang Q, Zhang M, et al. Metabolic reprogramming in the tumor microenvironment: unleashing T cell stemness for enhanced cancer immunotherapy. Front Pharmacol. (2023) 14:1327717. doi: 10.3389/fphar.2023.1327717
15. Li Y, Wang Z, Jiang W, Zeng H, Liu Z, Lin Z, et al. Tumor-infiltrating TNFRSF9(+) CD8(+) T cells define different subsets of clear cell renal cell carcinoma with prognosis and immunotherapeutic response. Oncoimmunology. (2020) 9:1838141. doi: 10.1080/2162402X.2020.1838141
16. Lei Q, Wang D, Sun K, Wang L, Zhang Y. Resistance mechanisms of anti-PD1/PDL1 therapy in solid tumors. Front Cell Dev Biol. (2020) 8:672. doi: 10.3389/fcell.2020.00672
17. Shi H, Chen S, Chi H. Immunometabolism of CD8(+) T cell differentiation in cancer. Trends Cancer. (2024) 10:610–626. doi: 10.1016/j.trecan.2024.03.010
18. Baessler A, Vignali DAA. T cell exhaustion. Annu Rev Immunol. (2024) 42:179–206. doi: 10.1146/annurev-immunol-090222-110914
19. Chow A, Perica K, Klebanoff CA, Wolchok JD. Clinical implications of T cell exhaustion for cancer immunotherapy. Nat Rev Clin Oncol. (2022) 19:775–90. doi: 10.1038/s41571-022-00689-z
20. Chen AS, Liu H, Wu Y, Luo S, Patz EF Jr, Glass C, et al. Genetic variants in DDO and PEX5L in peroxisome-related pathways predict non-small cell lung cancer survival. Mol Carcinog. (2022) 61:619–28. doi: 10.1002/mc.23400
21. Mu R, Liu H, Luo S, Patz EF Jr, Glass C, Su L, et al. Genetic variants of CHEK1, PRIM2 and CDK6 in the mitotic phase-related pathway are associated with nonsmall cell lung cancer survival. Int J Cancer. (2021) 149:1302–12. doi: 10.1002/ijc.33702
22. Lewis CM, Vassos E. Polygenic risk scores: from research tools to clinical instruments. Genome Med. (2020) 12:44. doi: 10.1186/s13073-020-00742-5
23. Zhu CS, Huang WY, Pinsky PF, Berg CD, Sherman M, Yu KJ, et al. The prostate, lung, colorectal and ovarian cancer (PLCO) screening trial pathology tissue resource. Cancer Epidemiol Biomarkers Prev. (2016) 25:1635–42. doi: 10.1158/1055-9965.EPI-16-0506
24. Zhu CS, Pinsky PF, Kramer BS, Prorok PC, Purdue MP, Berg CD, et al. The prostate, lung, colorectal, and ovarian cancer screening trial and its associated research resource. J Natl Cancer Inst. (2013) 105:1684–93. doi: 10.1093/jnci/djt281
25. Tryka KA, Hao L, Sturcke A, Jin Y, Wang ZY, Ziyabari L, et al. NCBI’s database of genotypes and phenotypes: dbGaP. Nucleic Acids Res. (2014) 42:D975–979. doi: 10.1093/nar/gkt1211
26. Mailman MD, Feolo M, Jin Y, Kimura M, Tryka K, Bagoutdinov R, et al. The NCBI dbGaP database of genotypes and phenotypes. Nat Genet. (2007) 39:1181–6. doi: 10.1038/ng1007-1181
27. Zhai R, Yu X, Wei Y, Su L, Christiani DC. Smoking and smoking cessation in relation to the development of co-existing non-small cell lung cancer with chronic obstructive pulmonary disease. Int J Cancer. (2014) 134:961–70. doi: 10.1002/ijc.28414
28. Zhang Z, Chen H, Yan D, Chen L, Sun J, Zhou M. Deep learning identifies a T-cell exhaustion-dependent transcriptional signature for predicting clinical outcomes and response to immune checkpoint blockade. Oncogenesis. (2023) 12:37. doi: 10.1038/s41389-023-00482-2
29. Aulchenko YS, Ripke S, Isaacs A, van Duijn CM. GenABEL: an R library for genome-wide association analysis. Bioinformatics. (2007) 23:1294–6. doi: 10.1093/bioinformatics/btm108
30. Wakefield J. A Bayesian measure of the probability of false discovery in genetic epidemiology studies. Am J Hum Genet. (2007) 81:208–27. doi: 10.1086/519024
31. Moskvina V, Schmidt KM. On multiple-testing correction in genome-wide association studies. Genet Epidemiol. (2008) 32:567–73. doi: 10.1002/gepi.20331
32. Barrett JC, Fry B, Maller J, Daly MJ. Haploview: analysis and visualization of LD and haplotype maps. Bioinformatics. (2005) 21:263–5. doi: 10.1093/bioinformatics/bth457
33. Dong S, Zhao N, Spragins E, Kagda MS, Li M, Assis P, et al. Annotating and prioritizing human non-coding variants with RegulomeDB v.2. Nat Genet. (2023) 55:724–6. doi: 10.1038/s41588-023-01365-3
34. Ward LD, Kellis M. HaploReg v4: systematic mining of putative causal variants, cell types, regulators and target genes for human complex traits and disease. Nucleic Acids Res. (2016) 44:D877–881. doi: 10.1093/nar/gkv1340
35. Pruim RJ, Welch RP, Sanna S, Teslovich TM, Chines PS, Gliedt TP, et al. LocusZoom: regional visualization of genome-wide association scan results. Bioinformatics. (2010) 26:2336–7. doi: 10.1093/bioinformatics/btq419
36. Kamarudin AN, Cox T, Kolamunnage-Dona R. Time-dependent ROC curve analysis in medical research: current methods and applications. BMC Med Res Methodol. (2017) 17:53. doi: 10.1186/s12874-017-0332-6
37. Human genomics. The Genotype-Tissue Expression (GTEx) pilot analysis: multitissue gene regulation in humans. Science. (2015) 348:648–60. doi: 10.1126/science.1262110
38. Győrffy B. Transcriptome-level discovery of survival-associated biomarkers and therapy targets in non-small-cell lung cancer. Br J Pharmacol. (2024) 181:362–74. doi: 10.1111/bph.16257
39. Ricciuti B, Lamberti G, Puchala SR, Mahadevan NR, Lin JR, Alessi JV, et al. Genomic and immunophenotypic landscape of acquired resistance to PD-(L)1 blockade in non-small-cell lung cancer. J Clin Oncol. (2024) 42:1311–21. doi: 10.1200/JCO.23.00580
40. Lin WP, Li H, Sun ZJ. T cell exhaustion initiates tertiary lymphoid structures and turbocharges cancer-immunity cycle. EBioMedicine. (2024) 104:105154. doi: 10.1016/j.ebiom.2024.105154
41. Altorki NK, Markowitz GJ, Gao D, Port JL, Saxena A, Stiles B, et al. The lung microenvironment: an important regulator of tumour growth and metastasis. Nat Rev Cancer. (2019) 19:9–31. doi: 10.1038/s41568-018-0081-9
42. Concepcion AR, Wagner LE2, Zhu J, Tao AY, Yang J, Khodadadi-Jamayran A, et al. The volume-regulated anion channel LRRC8C suppresses T cell function by regulating cyclic dinucleotide transport and STING-p53 signaling. Nat Immunol. (2022) 23:287–302. doi: 10.1038/s41590-021-01105-x
43. Missiroli S, Giorgi C, Pinton P. The LRRC8C-STING-p53 axis in T cells: A Ca(2+) affair. Cell Calcium. (2022) 105:102596. doi: 10.1016/j.ceca.2022.102596
44. Kim JC, Ha YJ, Tak KH, Roh SA, Kwon YH, Kim CW, et al. Opposite functions of GSN and OAS2 on colorectal cancer metastasis, mediating perineural and lymphovascular invasion, respectively. PloS One. (2018) 13:e0202856. doi: 10.1371/journal.pone.0202856
45. Zhang Y, Yu C. Prognostic characterization of OAS1/OAS2/OAS3/OASL in breast cancer. BMC Cancer. (2020) 20:575. doi: 10.1186/s12885-020-07034-6
46. Ren S, Zhu Y, Wang S, Zhang Q, Zhang N, Zou X, et al. The pseudogene DUXAP10 contributes to gefitinib resistance in NSCLC by repressing OAS2 expression. Acta Biochim Biophys Sin. (2023) 55:81–90. doi: 10.3724/abbs.2022176
47. Zhang Z, Sun T, Chen Y, Gong S, Sun X, Zou F, et al. CCL25/CCR9 signal promotes migration and invasion in hepatocellular and breast cancer cell lines. DNA Cell Biol. (2016) 35:348–57. doi: 10.1089/dna.2015.3104
48. Johnson EL, Singh R, Singh S, Johnson-Holiday CM, Grizzle WE, Partridge EE, et al. CCL25-CCR9 interaction modulates ovarian cancer cell migration, metalloproteinase expression, and invasion. World J Surg Oncol. (2010) 8:62. doi: 10.1186/1477-7819-8-62
49. Sharma PK, Singh R, Novakovic KR, Eaton JW, Grizzle WE, Singh S. CCR9 mediates PI3K/AKT-dependent antiapoptotic signals in prostate cancer cells and inhibition of CCR9-CCL25 interaction enhances the cytotoxic effects of etoposide. Int J Cancer. (2010) 127:2020–30. doi: 10.1002/ijc.25219
50. Li B, Wang Z, Zhong Y, Lan J, Li X, Lin H. CCR9-CCL25 interaction suppresses apoptosis of lung cancer cells by activating the PI3K/Akt pathway. Med Oncol. (2015) 32:66. doi: 10.1007/s12032-015-0531-0
51. Niu Y, Tang D, Fan L, Gao W, Lin H. CCL25 promotes the migration and invasion of non-small cell lung cancer cells by regulating VEGF and MMPs in a CCR9-dependent manner. Exp Ther Med. (2020) 19:3571–80. doi: 10.3892/etm.2020.8635
Keywords: non-small cell lung cancer, T cell exhaustion, single-nucleotide polymorphism, prognosis, immunotherapy
Citation: Lu G, Liu H, Wang H, Tang X, Luo S, Du M, Christiani DC and Wei Q (2024) Genetic variants of LRRC8C, OAS2, and CCL25 in the T cell exhaustion-related genes are associated with non-small cell lung cancer survival. Front. Immunol. 15:1455927. doi: 10.3389/fimmu.2024.1455927
Received: 27 June 2024; Accepted: 09 September 2024;
Published: 02 October 2024.
Edited by:
Nagaraj Gowda, Head Drug Discovery Oncology, IndiaReviewed by:
Rajeev Nema, Manipal University Jaipur, IndiaMichael Volkmar, German Cancer Research Center (DKFZ), Germany
Copyright © 2024 Lu, Liu, Wang, Tang, Luo, Du, Christiani and Wei. This is an open-access article distributed under the terms of the Creative Commons Attribution License (CC BY). The use, distribution or reproduction in other forums is permitted, provided the original author(s) and the copyright owner(s) are credited and that the original publication in this journal is cited, in accordance with accepted academic practice. No use, distribution or reproduction is permitted which does not comply with these terms.
*Correspondence: Guojun Lu, Z3VvanVubHVAbmptdS5lZHUuY24=; Qingyi Wei, cWluZ3lpLndlaUBkdWtlLmVkdQ==
 Guojun Lu
 Hongliang Liu
 Huilin Wang
 Xiaozhun Tang2,3,5
 Sheng Luo
 Mulong Du
 David C. Christiani
 Qingyi Wei