 Zhixiong Su
 Yufang He†
 Zhenhua Liu
94% of researchers rate our articles as excellent or good
Learn more about the work of our research integrity team to safeguard the quality of each article we publish.
Find out more
ORIGINAL RESEARCH article
Front. Immunol. , 03 April 2024
Sec. Cancer Immunity and Immunotherapy
Volume 15 - 2024 | https://doi.org/10.3389/fimmu.2024.1363834
This article is part of the Research Topic Harnessing Single-Cell Insights: Pioneering Predictive Markers for Immunotherapy Efficacy in Solid Tumors View all 9 articles
Background: Hyaluronan-mediated motility receptor (HMMR) is overexpressed in multiple carcinomas and influences the development and treatment of several cancers. However, its role in hepatocellular carcinoma (HCC) remains unclear.
Methods: The “limma” and “GSVA” packages in R were used to perform differential expression analysis and to assess the activity of signalling pathways, respectively. InferCNV was used to infer copy number variation (CNV) for each hepatocyte and “CellChat” was used to analyse intercellular communication networks. Recursive partitioning analysis (RPA) was used to re-stage HCC patients. The IC50 values of various drugs were evaluated using the “pRRophetic” package. In addition, quantitative reverse transcription polymerase chain reaction (qRT-PCR) was performed to confirm HMMR expression in an HCC tissue microarray. Flow cytometry (FCM) and cloning, Edu and wound healing assays were used to explore the capacity of HMMR to regulate HCC tumour.
Results: Multiple cohort studies and qRT-PCR demonstrated that HMMR was overexpressed in HCC tissue compared with normal tissue. In addition, HMMR had excellent diagnostic performance. HMMR knockdown inhibited the proliferation and migration of HCC cells in vitro. Moreover, high HMMR expression was associated with “G2M checkpoint” and “E2F targets” in bulk RNA and scRNA-seq, and FCM confirmed that HMMR could regulate the cell cycle. In addition, HMMR was involved in the regulation of the tumour immune microenvironment via immune cell infiltration and intercellular interactions. Furthermore, HMMR was positively associated with genomic heterogeneity with patients with high HMMR expression potentially benefitting more from immunotherapy. Moreover, HMMR was associated with poor prognosis in patients with HCC and the re-staging by recursive partitioning analysis (RPA) gave a good prognosis prediction value and could guide chemotherapy and targeted therapy.
Conclusion: The results of the present study show that HMMR could play a role in the diagnosis, prognosis, and treatments of patients with HCC based on bulk RNA-seq and scRAN-seq analyses and is a promising molecular marker for HCC.
Liver cancer is one of the most common cancers worldwide, with increasing incidence worldwide, and hepatocellular carcinoma (HCC) represents the most common type of liver cancer, accounting for over 90% of the cases (1). For early-stage disease, surgical resection and liver transplantation are the primary treatment options with excellent long-term outcomes (2). Radiofrequency ablation (RFA) is the primary local modality employed for early-stage HCC, whereas transarterial chemoembolisation (TACE) remains the standard of care for patients with intermediate-stage HCC (3). With the development of tyrosine kinase inhibitors (TKIs) and immune checkpoint inhibitors (ICIs), targeted immunotherapy has become an indispensable treatment for patients with advanced HCC and has greatly improved prognosis (4). However, owing to drug resistance and a lack of reliable therapeutic reference markers, the efficacy of chemoembolization, TKIs, and ICIs remains unsatisfactory. Therefore, the search for HCC biomarkers and the development and prediction of therapeutic effect are current research hotspots.
Hyaluronan mediated motility receptor (HMMR), also known as CD168, is a protein-coding gene located on chromosome 5. The HMMR protein can bind to hyaluronan, which is an extracellular matrix component, to promote cellular growth and movement (5). HMMR expression is cell cycle-regulated, with peak expression occurring between the late G2 phase and early mitosis (6). Furthermore, HMMR expression is low in most healthy tissues but is elevated in proliferative tissues (7, 8). Moreover, elevated HMMR expression is associated with poor prognosis in various cancers, including breast (9), colorectal (10), stomach (11), endometrial (12), and prostate cancers (13), as well as multiple myeloma (14). In addition, HMMR promotes peritoneal implantation of gastric cancer by increasing cell-cell interactions and may promote prostate cancer proliferation and metastasis via the AURKA/mTORC2/E2F1 positive feedback loop (15). It has received considerable attention as an emerging cancer biomarker. Notably, He et al. recently found that HMMR regulated autophagy to control endoplasmic reticulum (ER) stress intensity in HCC progression (16). Additionally, HMMR has been incorporated as a pivotal prognostic factor in several predictive model studies in HCC (17–19). Nevertheless, the precise significance of HMMR in clinical diagnosis and treatment, as well as its role within the immune microenvironment, remains inadequately comprehended.
Single-cell RNA sequencing (scRNA-Seq) uses optimized next-generation sequencing technologies to define the global gene expression profiles of single cells, facilitating dissection of the previously hidden heterogeneity with in cell populations (20, 21). In the current study, we integrated multiple datasets from TCGA, GEO, and ICGC to comprehensively expound the predictive role of HMMR in HCC diagnosis, prognosis, and treatment, as well as its crosstalk effect in the tumour microenvironment using bulk RNA-seq and scRNA-seq, and comprehensively explored the potential value of HMMR for patients with HCC.
The bulk RNA-seq data download from the TCGA, ICGC and GEO database. The scRNA-seq data came from the GSE149614 (22), which generated > 70,000 single-cell transcriptomes for 10 HCC patients from four relevant sites: primary tumour, portal vein tumour thrombus (PVTT), metastatic lymph node (MLN) and normal tissue.
The HCC cDNA microarry were purchased from Shanghai Outdo Biotech Co.,Ltd (Shanghai, China) with 87 samples (including 21 normal liver samples and 66 HCC samples, Ethics No.SHYJS-CP-1707015).
The matrix of HMMR expression were integrated in Supplementary Table 1 and the clinical characteristics of these data were integrated in Supplementary Table 2 (23).
In order to make bulk RNA-seq data from different sources have good consistency, we conducted normality test on bulk RNA-seq data, and performed log2 (x+1) transformation on data that did not obey the normality test. The 10× scRNA-seq data were processed according to the following steps: 1) R software, “Seurat” package was adopted to convert 10× scRNA-seq data as a Seurat object; 2) quality control (QC) of the raw counts by calculating the percentage of mitochondrial (<5%) or ribosomal genes (>50) and excluding low-quality cells; 3) the “FindVariableFeatures” function was adopted to filter the top 1500 highly variable genes after QC; 4) principal component analysis (PCA) was performed based on the 1500 genes, and t-distributed stochastic neighbor embedding (t-SNE) was used for dimensionality reduction and cluster identification; 5) the “FindAllMarkers” function was exploited to identify significant marker genes; and 6) The cluster annotation was based the markers of different cell types which download from CellMarker 2.0 website (http://bio-bigdata.hrbmu.edu.cn/CellMarker/index.html).
We isolated hepatocytes and construct a new gene-cell matrix. Somatic large-scale chromosomal CNV score of each hepatocytes were calculated using the R package “inferCNV” (v1.6.0). A raw counts matrix, annotation file, and gene/chromosome position file were prepared according to data requirements (https://github.com/broadinstitute/inferCNV). The hepatocytes came form normal tissue were selected as reference normal cells. The default parameters were applied (cutoff = 0; denoise = 0.1).
The cell-to-cell interaction analysis was based on the expression of specifific ligands (Ls) and receptors (Rs). In current study, we used the R package “CellChat” (24), a tool that was able to quantitatively infer and analyze intercellular communication networks from single-cell RNA-sequencing (scRNA-seq) data. Through manifold learning and quantitative contrasts, CellChat classifies signaling pathways and delineates conserved and context-specific pathways across different datasets.
Gene set variation analysis (GSVA) was completed to estimate the biological functions and signaling pathways in bulk RNA-seq and scRNA-seq. The reference molecular signature was “h.all.v2023.1.Hs.symbols” (downloaded from https://www.gsea-msigdb.org/gsea/msigdb/).
CIBERSORTx was utilized to measure the per sample levels of tumour-infltrating immune cell types. CIBERSORTx is an analytical tool to impute gene expression profiles and estimate the abundances of member cell types in a mixed cell population using gene expression data (https://cibersortx.stanford.edu/).
Mutation data were downloaded from the TCGA database, and the quantity and quality of gene mutations were analysed by using the “Maftools” package of R. The tumour mutation burden (TMB) was defined as the total number of somatic mutations. The aneuploidy scores, cancer-testis antigen (CTA) scores and homologous recombination defificiency (HRD) scores were downloaded from the Supplementary Material of a previous publication.
Recursive Partitioning Analysis (RPA) is one of the most recognized methods for cancer prognosis staging. We performed RPA in the web of autoRPA (http://rpa.renlab.org/index.html) (25). Using a permutation test, autoRPA can evaluate the contribution of each submitted factor and help singling out factors that significantly contributed to cancer staging.
The sensitivity of each drugs was evaluated by IC50 calculation using the “pRRophetic” package, and the corresponding data were obtained from the Genomics of Drug Sensitivity in Cancer (GDSC) database.
Relative quantitation was determined by quantitative reverse transcription polymerase chain reaction (qRT-PCR; SuperScript IV Reverse Transcriptase 18090010; Thermo Fisher, United States). The amplification reactions were performed as described previously (Bustin and Mueller, 2005). HMMR-specific primers were: forward primer, 5′-TGACCAGGACTAATGAA-3′ and reverse primer, 5′-AGACTCCTTTGGGTGAC-3’.
Human HCC cells of SNU-449, SMMC7721, HepG2, Huh7, LM3, H22, and Hepa 1-6 were purchased from the American Type Culture Collection (ATCC). Cells of SUN-449, HepG2, Huh7, and LM3were cultured with DMEM medium (Gibco, USA), and SMMC7721, H22, and Hepa 1-6 were cultured with 1640 medium (Gibco, USA), both of which were supplemented by 10% foetal bovine serum (FBS) (Gibco, USA). All cells were cultured in an incubator at 37°C with 5% CO2.
Lipofectamine 3000 (Invitrogen, USA) was used to transfect cells plated in 6-well plates with an siRNA specific for HMMR or a control construct purchased from GeneChem (Shanghai, China). Cells were utilized for downstream assays at 48 h post-transfection. Analyses were conducted in triplicate. siRNA for HMMR was customized from Zaigene (Fuzhou, China).
According to the super Proliferation Kit (RiboBio, China), cells were first seeded into 24-well plates at a density of 5 ×10⁴/well and cultured for 24h. Then, cells were fixed with 4% paraformaldehyde after 2h incubation with 5-ethynyl-2′- deoxyuridine (Edu). Edu cells were counted under an Olympus FSX100 microscope (Olympus, Japan) to determine the cell proliferation.
Firstly, 500 cells/well were plated into 6-well plates and cultured for ~10 days. When the colony reached a sufficient size, it was gently washed with PBS, fixed by formalin, and stained with 0.1% crystal violet. Stained colonies were imaged and counted via ImageJ software (version 2.0.0) to evaluate the cloning efficiency.
Cells from each group were plated into 6-well plates at around 95% confluence. Then, we used a 200ul pipette tip to make symmetrical wounds. After being washed by PBS twice, cells were incubated with a non-serum medium for 24h (or 48h). Migration pictures were taken at 0h, 24h and 48h after drawing the wound. The wound distance of each group at 40x magnification was measured by Image J software. Each experiment was performed in triplicate.
Antibodies against HMMR (1:1000, DF4809) were purchased from Affinity. Briefly, cells were lysed by RIPA buffer with protease and phosphatase inhibitor cocktail following the manufacturer’s specification, and then the concentrations were measured and normalized by BCA assay. Western blotting was performed according to the standard methods as depicted in the manufacturer’s specification and previous studies.
The cell cycle was detected by flow cytometry (FCM). Briefly, Cells at the logarithmic growth phase were stained with propidium iodide (PI) according to the manufacturer’s protocol and then detected by the flow Cytometer (Accuri C6 Plus; BD Pharmingen, Shanghai, China) and analysed by FlowJo-V10 software (Tree Star Inc, Ashland, OR, USA).
Distributed data were compared by performing the Student’s t-test and Wilcoxon test, whereas proportion differences were calculated by the chi-square test. Additionally, component analysis in subgroups were compared by the Fisher’s test. While survival differences between different groups were assessed via the log-rank test, prognostic factors were identified by the Cox regression analyses. All statistical analyses were performed using RStudio version 4.0.3, and two-sided p<0.05 was considered as statistically significant.
Differential expression analysis of 10 datasets from TCGA, ICGC, and GEO databases showed that HMMR expression was significantly up-regulated in the tumour tissues (all p<0.05, Figure 1A). To evaluate its diagnostic capacity for HCC, a diagnostic receiver operating characteristic (ROC) analysis was performed, and the diagnostic area under the curve (AUC) values of HMMR were all greater than 0.900, with good sensitivity, specificity, and accuracy (Figures 1B, C). We subsequently validated this result in 67 samples from patients with HCC and in 21 paracancerous samples from an HCC cDNA microarray, using qRT-PCR. The results shows that HMMR was highly expressed in the tumour tissue, both between matched samples and between tumour and normal tissues (Figures 1D, E). Furthermore, the AUC value of the diagnostic ROC curve of HMMR was 0.984, confirming the diagnostic value of HMMR in HCC (Figure 1F).
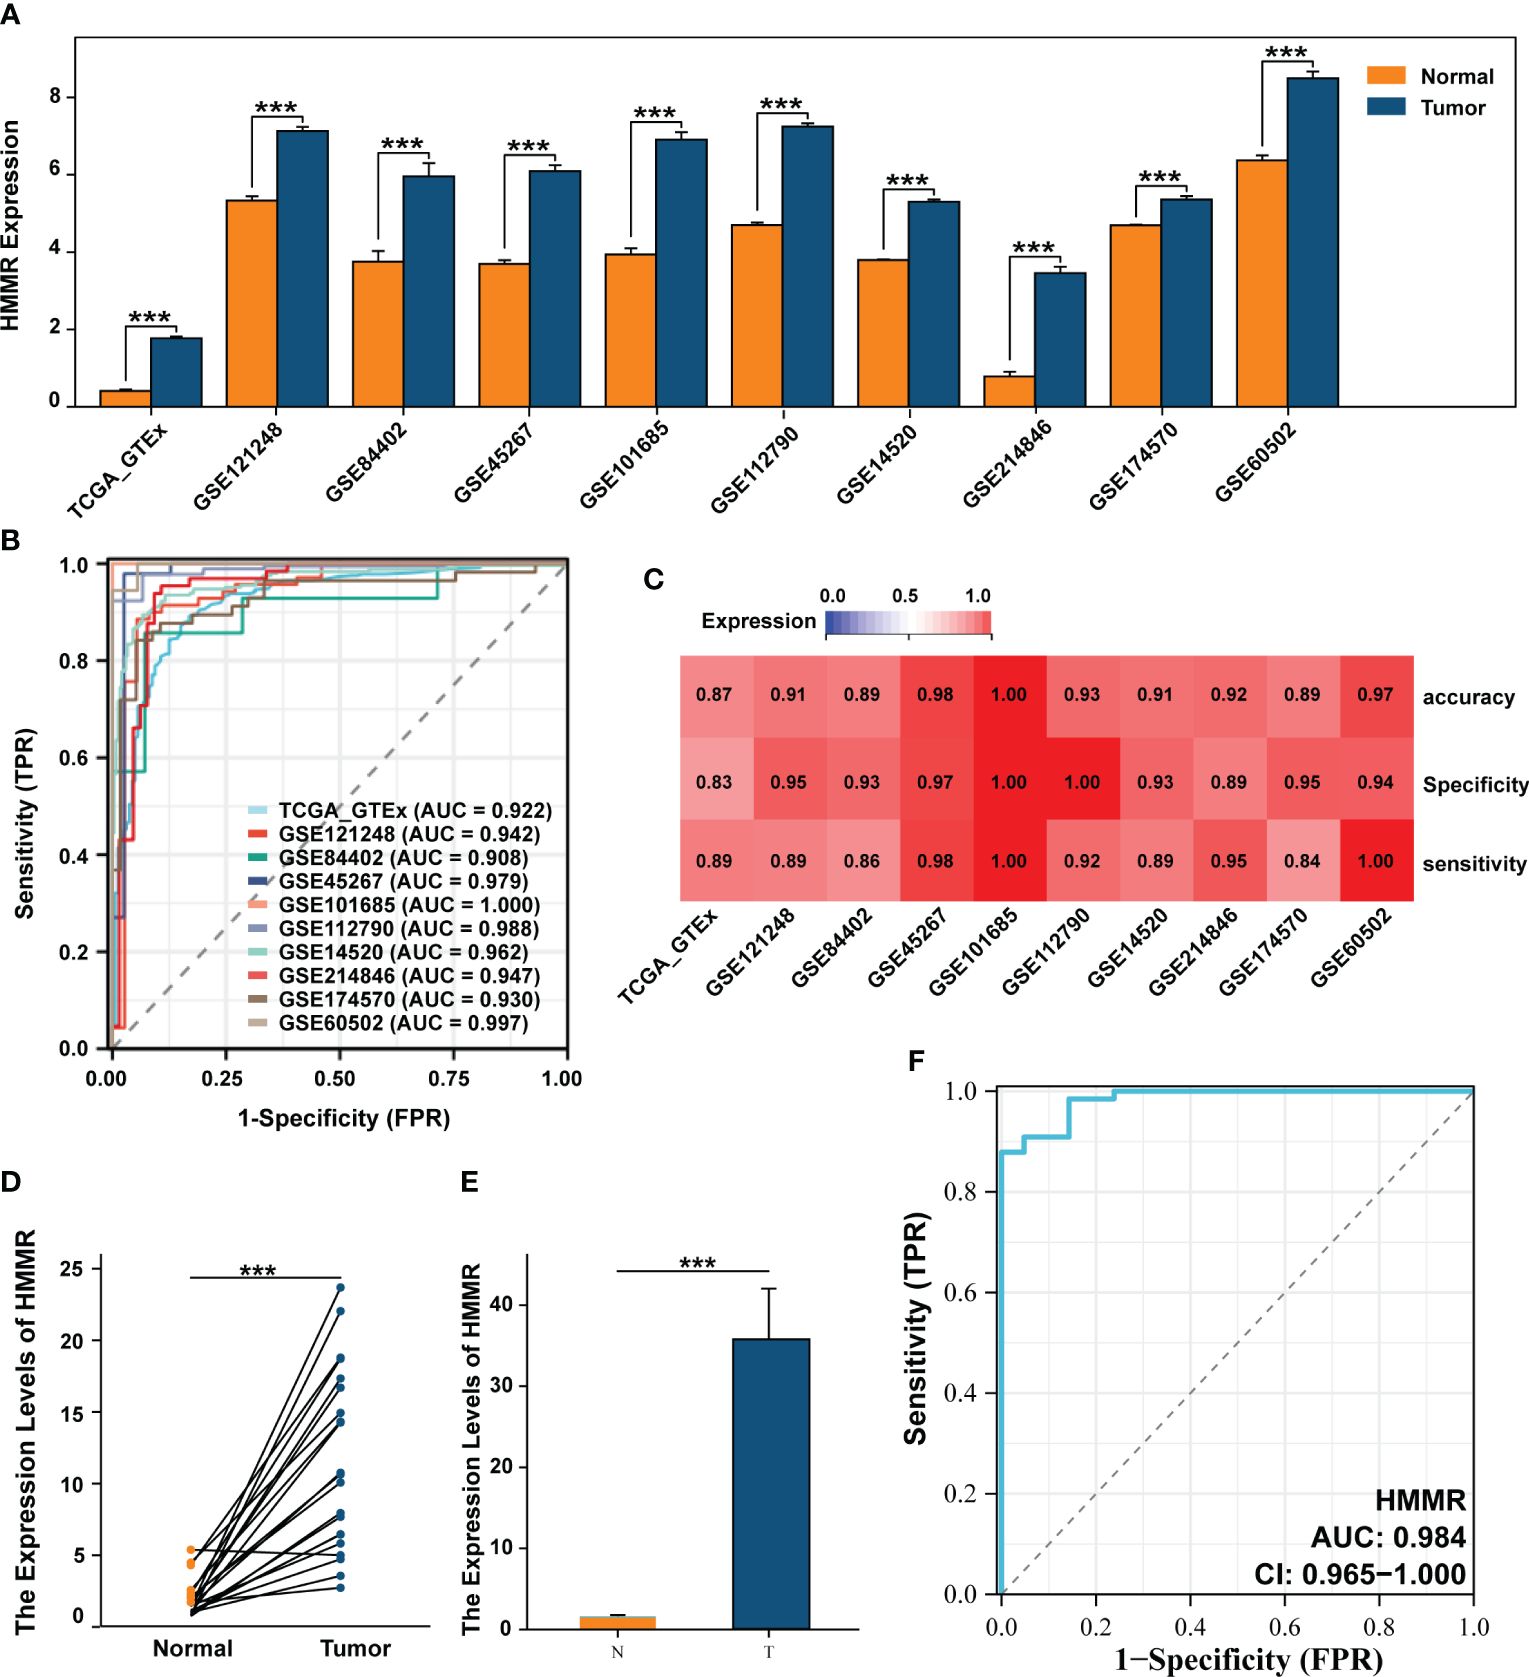
Figure 1 HMMR was up-expressed in HCC and has a good diagnostic value. (A) The differential expression of HMMR between normal and tumour tissues in multiply cohorts. (B) Diagnostic ROC curves of HMMR for predicting the HCC in multiply cohorts. (C) Heatmap showed the sensitivity, specificity and accuracy of HCC cohorts. Differential expression of HMMR among paired samples (D) and unpaired samples (E) in HCC cDNA microarray by qRT-PCR. (F) ROC curves of HMMR for predicting the HCC in HCC cDNA microarray cohort. ***P<0.001.
To further validate the differential expression of HMMR, we analysed its expression using scRNA-seq. First, the cells that passed the quality control (QC) screening were subjected to dimensionality reduction using t-SNE and divided into 33 subgroups (Figure 2A; Supplementary Figure 1). Subsequently, 33 clusters were annotated as “B cell”, “dendritic cell (DC)”, “Endothelial cell”, “Hepatocyte”, “Hepatic stellate cell (HSC)”, “Macrophage”, “Monocyte”, “NK cell,” and “T cell” (Figure 2B). The expression of marker genes of each cell type is illustrated in Figure 2C. HMMR was overexpressed in tumour tissues, portal vein tumour thrombi (PVTT), and metastatic lymph nodes (MLN) (Figure 2D). In addition, patients with hepatitis B virus (HBV) infection had higher HMMR expression than patients with hepatitis C virus infection and those without infection (Figure 2E). Moreover, HMMR was mainly expressed in hepatocytes (Figure 2F). To evaluate the differential expression of HMMR between different hepatocytes, all hepatocytes were isolated and further divided into seven clusters (H0−H6) (Figure 2G). Figure 2H shows the hepatocytes in H6 almost come from normal tissue. Therefore, H6 was used as a reference cell for inferCNV analysis, which showed that H0−H5 had higher copy number of variant(CNV) than H6 (Supplementary Figure 2). In addition, H0, H1, H3, and H4 had higher HMMR expression levels and CNV scores (Figure 2I), suggesting that HMMR expression may be associated with malignant hepatocellular transformation.
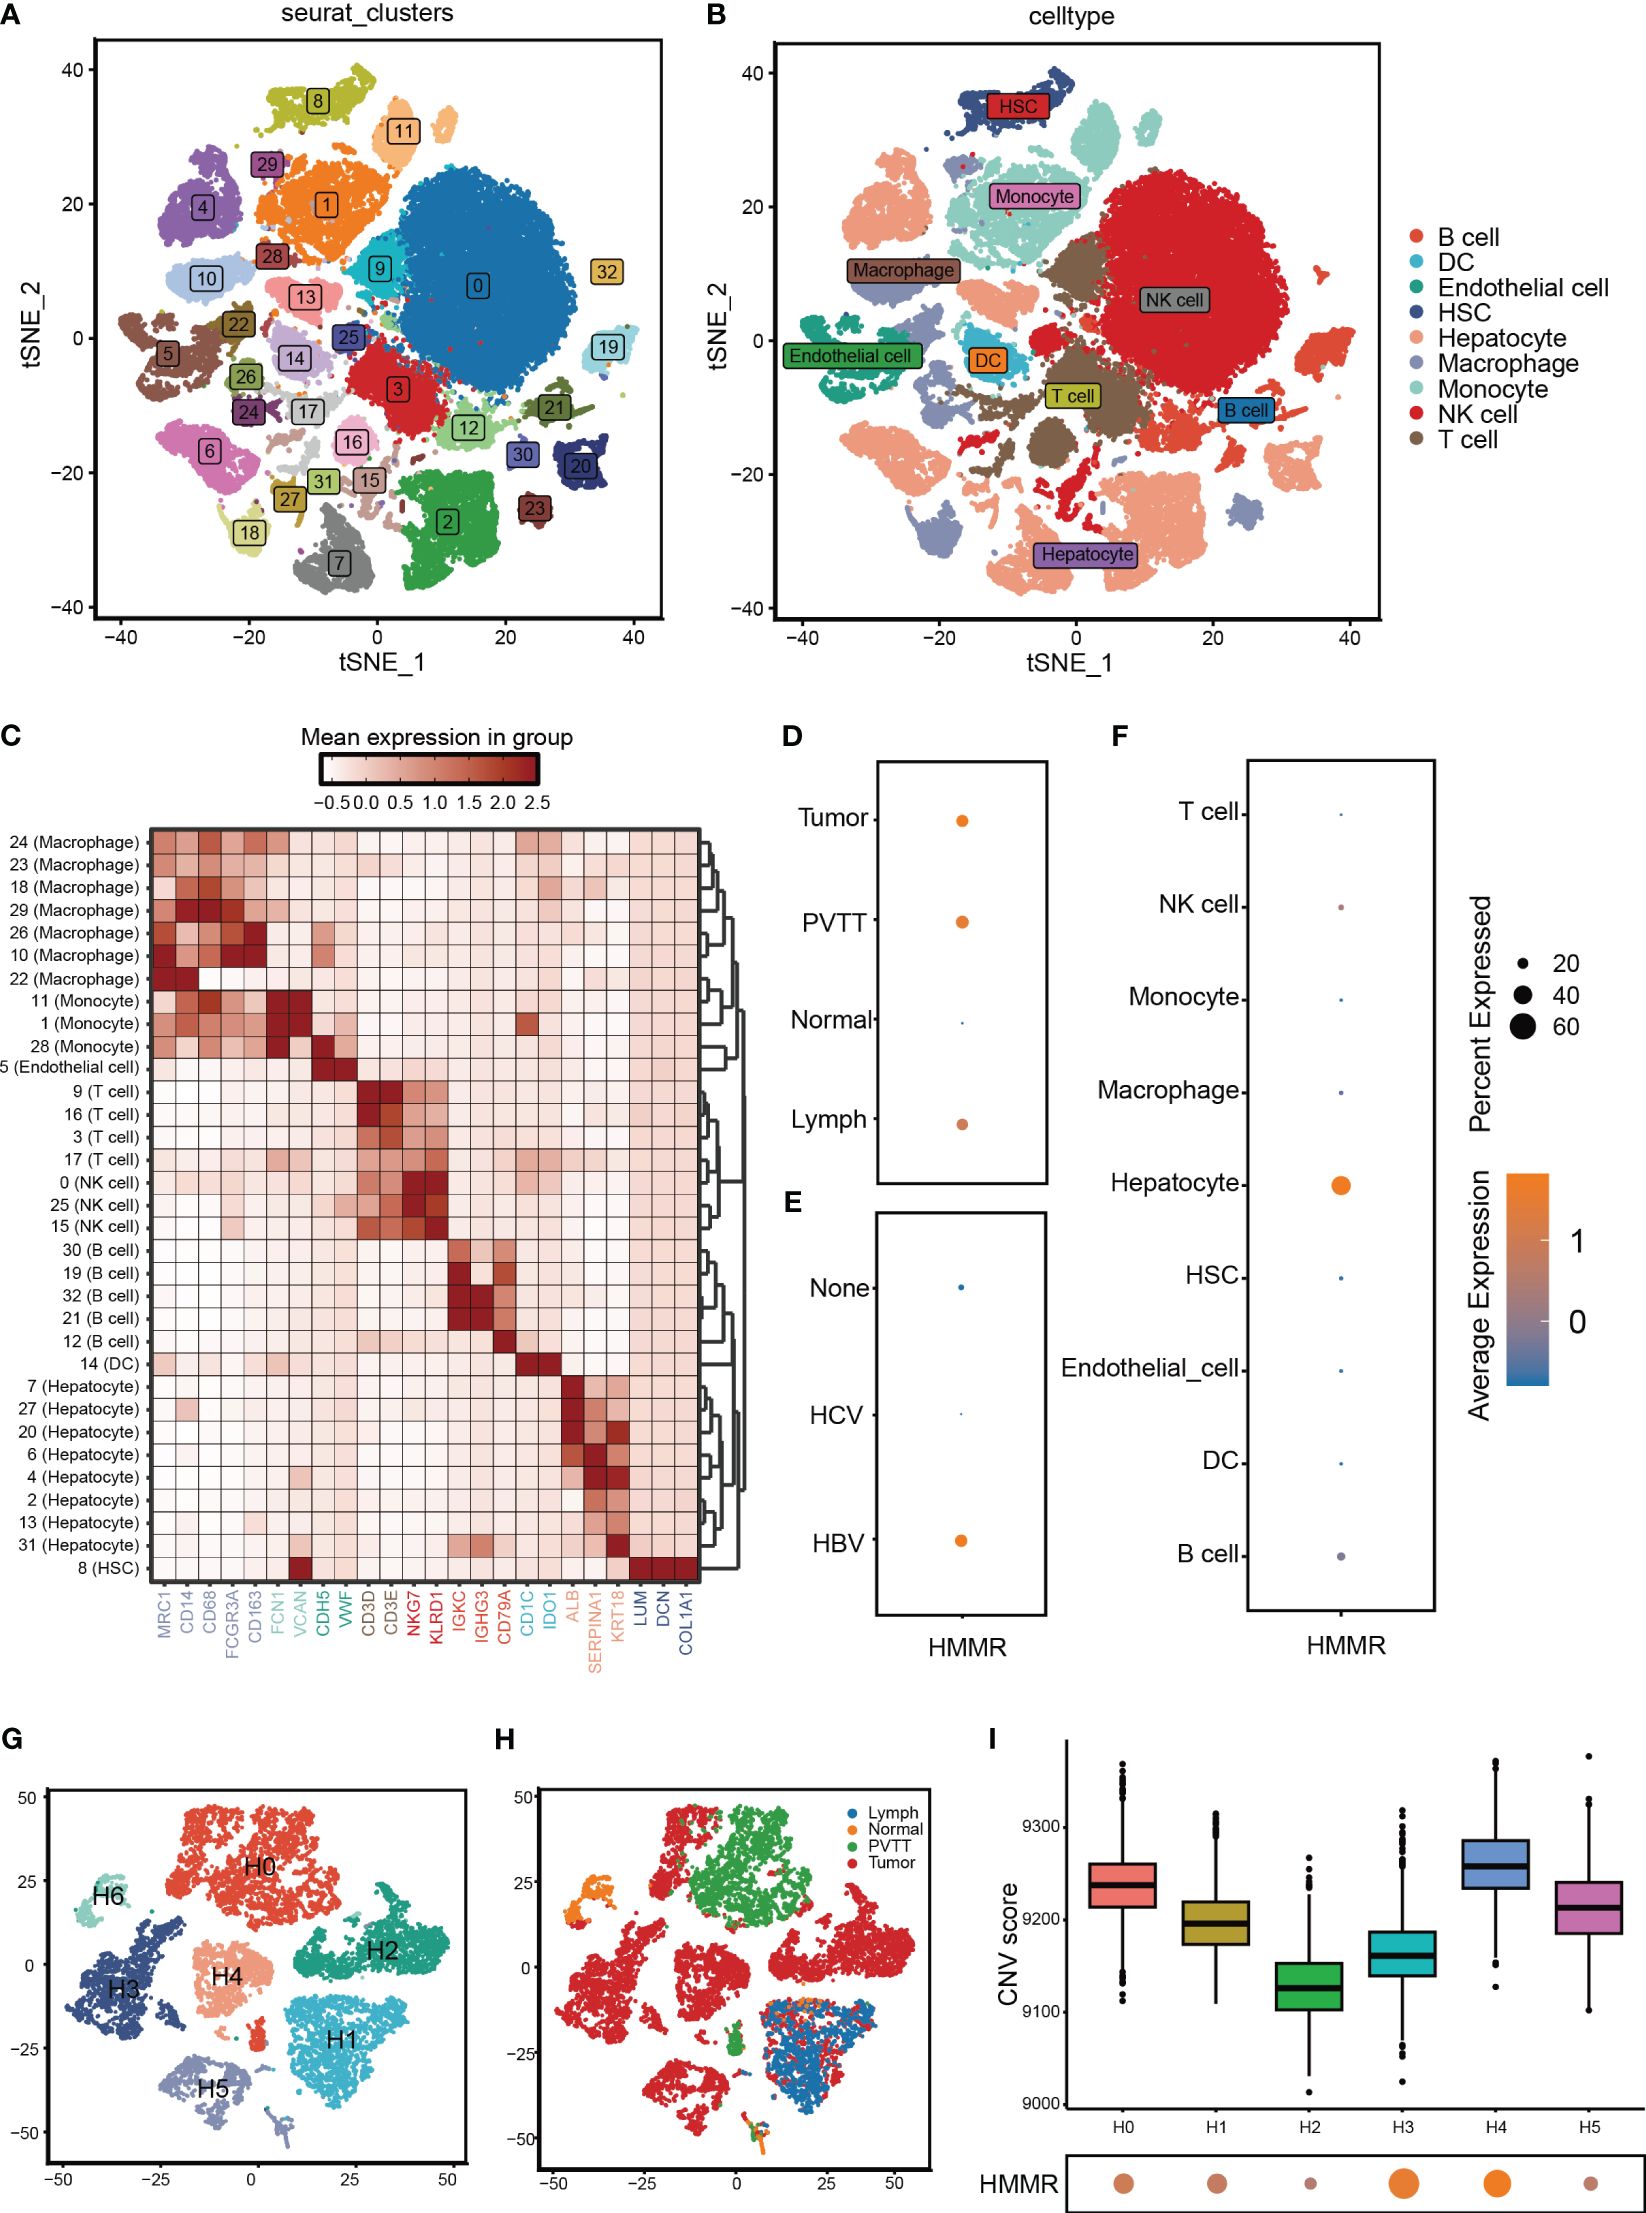
Figure 2 HMMR was over-expression in HCC cells. (A) All cells from GSE149614 were classified into 33 clusters with the t-SNE algorithm. (B) t-SNE plot showed different clusters of cells. (C) The expression of corresponding markers for different cells. (D) The expression of HMMR in different tissue. (E) The expression of HMMR in different viral infection states. (F) The expression of HMMR in different cells. (G) Hepatocytes were redivided into 7 clusters with the t-SNE algorithm. (H) t-SNE plot showed that the tissue origin of the different hepatocytes. (I) The CNV scores of different clusters of hepatocytes.
To further explore the effects of HMMR expression on the malignant phenotype of HCC cells, the HMMR expression was examined in cell lines SNU-449, SMMC7721, HepG2, Huh7, LM3, H22, and Hepa 1-6 (Supplementary Figure 3). SMMC7721, Huh7, and LM3 cell lines had higher HMMR expression and were selected for HMMR knockdown using siRNAs. Western blotting for HMMR showed that siRNA#3 had the best knockdown effect (Figure 3A). Therefore, siRNA#3 was selected as the siRNA for subsequent assays. Cloning assays and Edu proliferation assays demonstrated similar results, with HMMR knockdown inhibiting HCC cell proliferation (all p<0.05, Figures 3B–E). Finally, wound healing assays indicated that HMMR knockdown was sufficient to inhibit HCC cell invasion compared with that of control cells (all p<0.05, Figures 3F, G). In summary, HMMR knockdown could inhibit HCC cell proliferation and invasion.
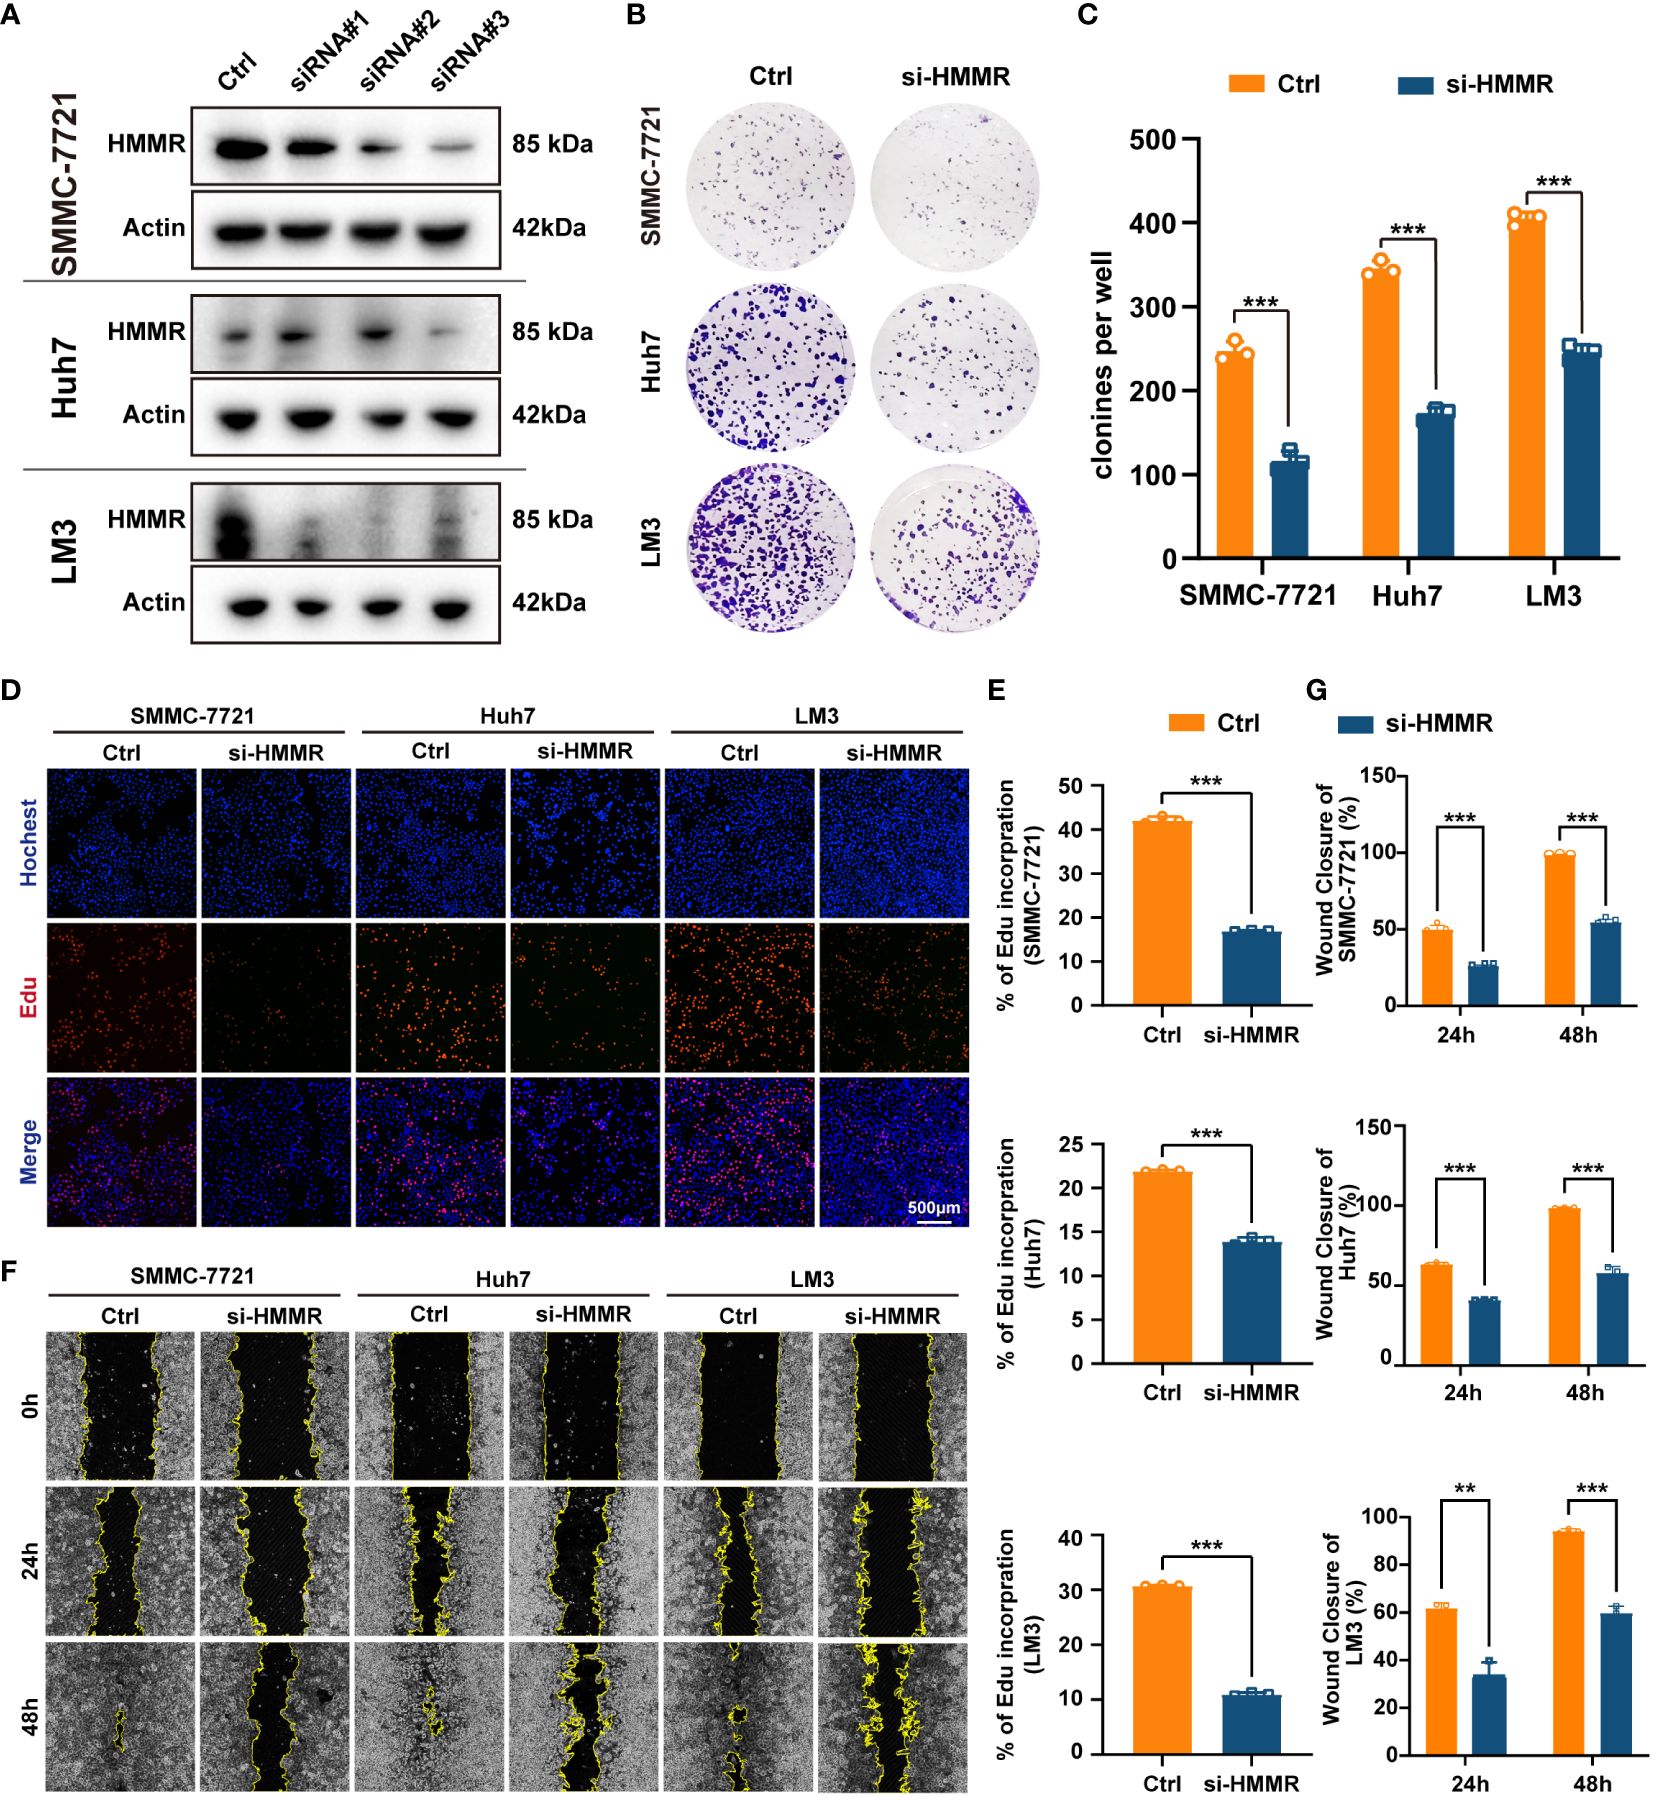
Figure 3 Knockdown of HMMR inhibited proliferation and invasion of HCC cells. (A) The knockdown efficiency of si-HMMRs have been testified by western blot in SMMC-7721, Huh7 and LM3. (B, C) The results of clone assays. (D, E) The results of Edu assays. (F, G) The results of wound healing assays.**P<0.01; ***P<0.001.
To identify the most commonly enriched pathways in patients with HCC with different HMMR expression levels, GSVA was performed to assess in all samples in TCGA-LIHC. The GSVA results indicated that HMMR expression was positively correlated with the “E2F targets”, “G2M checkpoint”, “Spermatogenesis”, “Mitotic spindle”, “MYC targets V1”, “DNA repair”, “PI3K/AKT/mTOR signaling” and “mTORC1 signaling” pathways (|cor|>0.4, Figure 4A). In addition, to explore the potential pathways of HCC cells with different levels of HMMR expression, the 10 HCC scRNA-seq samples were screened. The results of t-SNE were shown in Supplementary Figure 4A. Figure 4B and Supplementary Figure 4B show the annotations of the HCC samples, and clusters 2, 3, 6, 7, 11, and 14 are annotated as HCC cells. The GSVA results for the different HCC cell clusters demonstrate higher activities of “E2F targets” and “G2M checkpoint”, which could regulate cell cycle, in clusters 3, 6, and 7, which had higher HMMR expression (Figure 4C). Therefore, it was hypothesized that HMMR could affect HCC progression by regulating the cell cycle. FCM showed that there were more G2 phase cells and fewer G1 phase cells in the si-HMMR groups than in the control groups (all p<0.05; Figures 4D, E). The findings were consistent with our hypothesis.
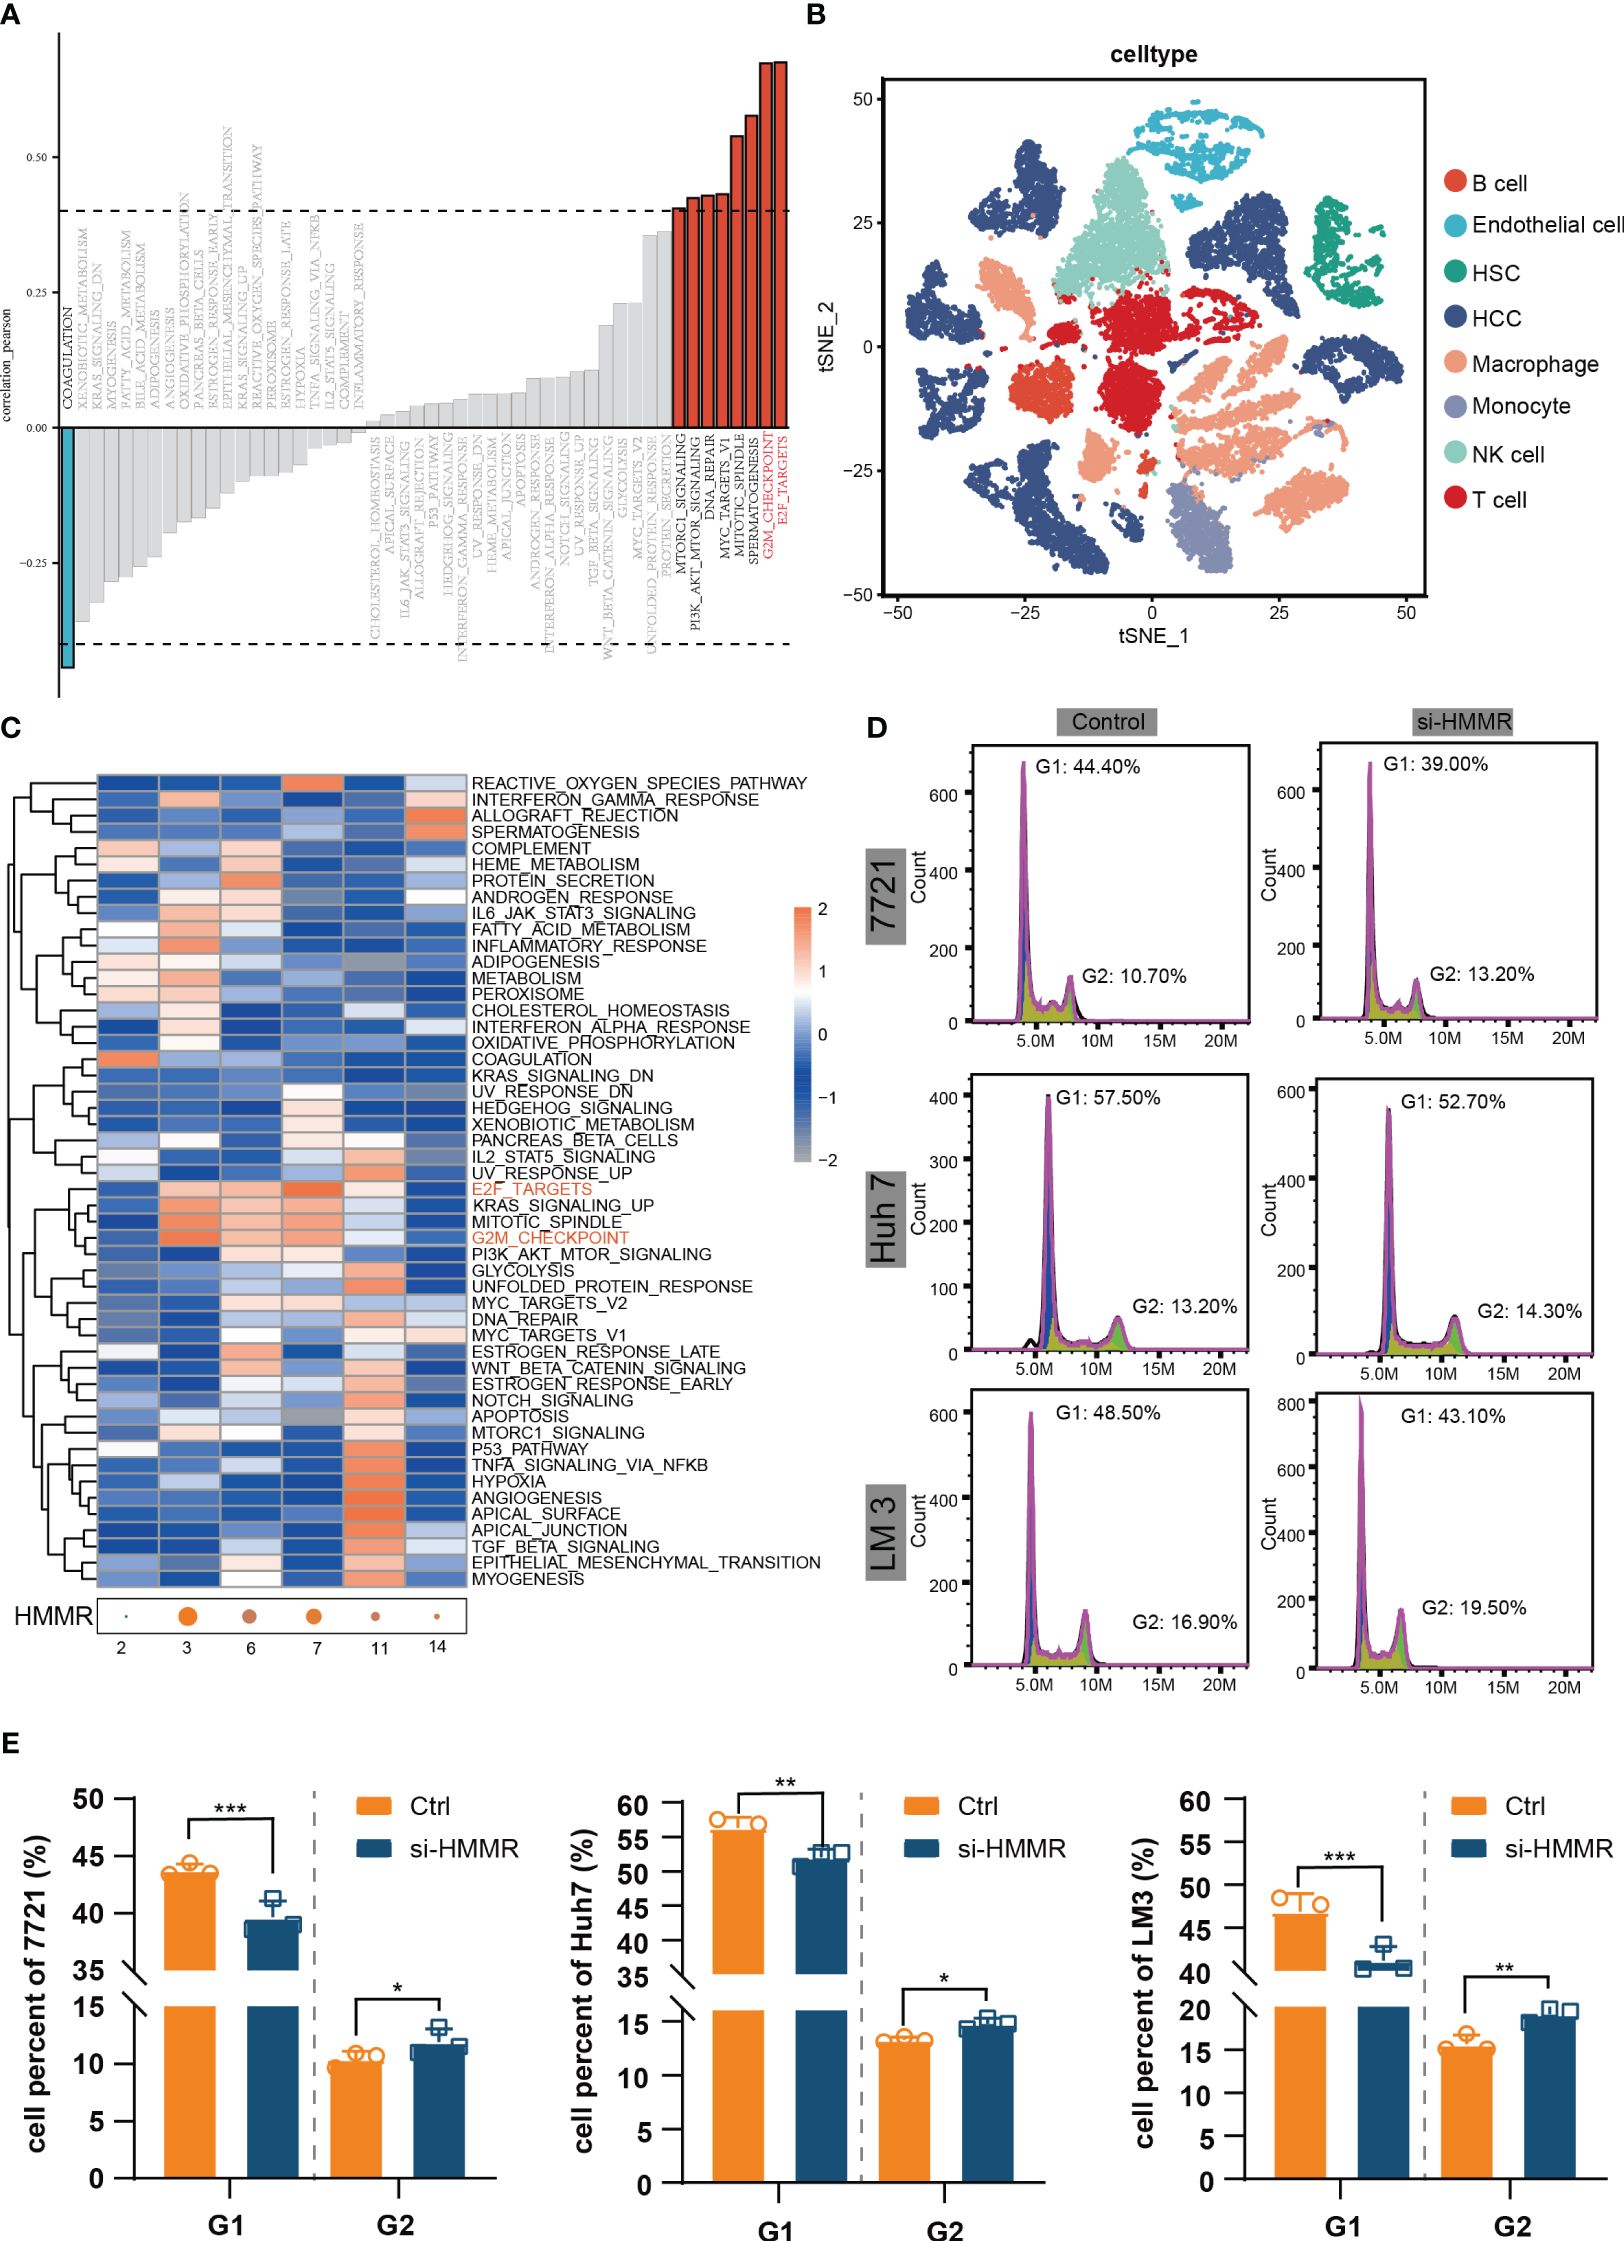
Figure 4 HMMR could regulate the cell cycle. (A) Correlation bar graphs showed the relationship between HMMR expression and pathway activity by GSVA. (B) t-SNE plot showed different clusters of cells in HCC tissue. (C) Heatmap showed the activity of hallmark pathway for different HCC clusters. (D, E) The results of FCM to detected cell cycle. *P<0.05; **P<0.01; ***P<0.001.
Additionally, we conducted an analysis of miRNAs that potentially regulate HMMR. Utilizing the starBase database (https://rnasysu.com/), we screened for miRNAs that may interact with HMMR in all cancers (Supplementary Table 3). Subsequently, correlation analysis revealed that only hsa-let-7c-5p had a negative association with HMMR (p<0.05, Supplementary Figure 5A). Furthermore, differential analysis showed down-regulation of hsa-let-7c-5p expression in HCC tissue (p<0.05, Supplementary Figures 5B, C), and survival analysis demonstrated a positive association between hsa-let-7c-5p expression and a favourable prognosis in HCC (p<0.05, Supplementary Figure 5D).
The tumour immune microenvironment (TiME) can affect tumour progression, efficacy, and drug resistance (26). In the present study, CIBERSORTx analysis revealed that the TiME had more resting memory CD4+ T cells, resting NK cells, monocytes, macrophages, and eosinophils in the low-expression HMMR groups, and more follicular helper T cells and Tregs in the high-expression HMMR groups(p<0.05; Figure 5A). To further confirm the bulk RNA-seq results, the 10 scRNA-seq samples were divided into HMMR+ and HMMR- groups based on HMMR expression level (Figure 5B). Figure 5C shows the different proportions of cells in HMMR+ and HMMR- groups; the proportions of NK cells and macrophages were higher in the in HMMR- than in the HMMR+ groups (both p<0.05, Figures 5D, E). However, the proportions of T cells were lower in the HMMR- groups (p<0.05, Figures 5F), which was consistently associated with better prognosis. Therefore, the T cells were isolated and further divided into 12 clusters (Supplementary Figure 6A) and annotated as effector T cells (Teff), memory T cells (Tmem), exhausted T cells (Tex), and others (Figure 5G) based on corresponding marker gene expression (Supplementary Figure 6B). Figure 5H shows the proportions of different T cell subtypes in the HMMR+/- groups. There were significantly more Teff in the HMMR- groups and more Tex in HMMR+ groups (both p<0.05, Figure 5I). The results implied that HMMR overexpression may inhibit Teff infiltration and promote Teff exhaustion, although more experiments were required to validate these findings.
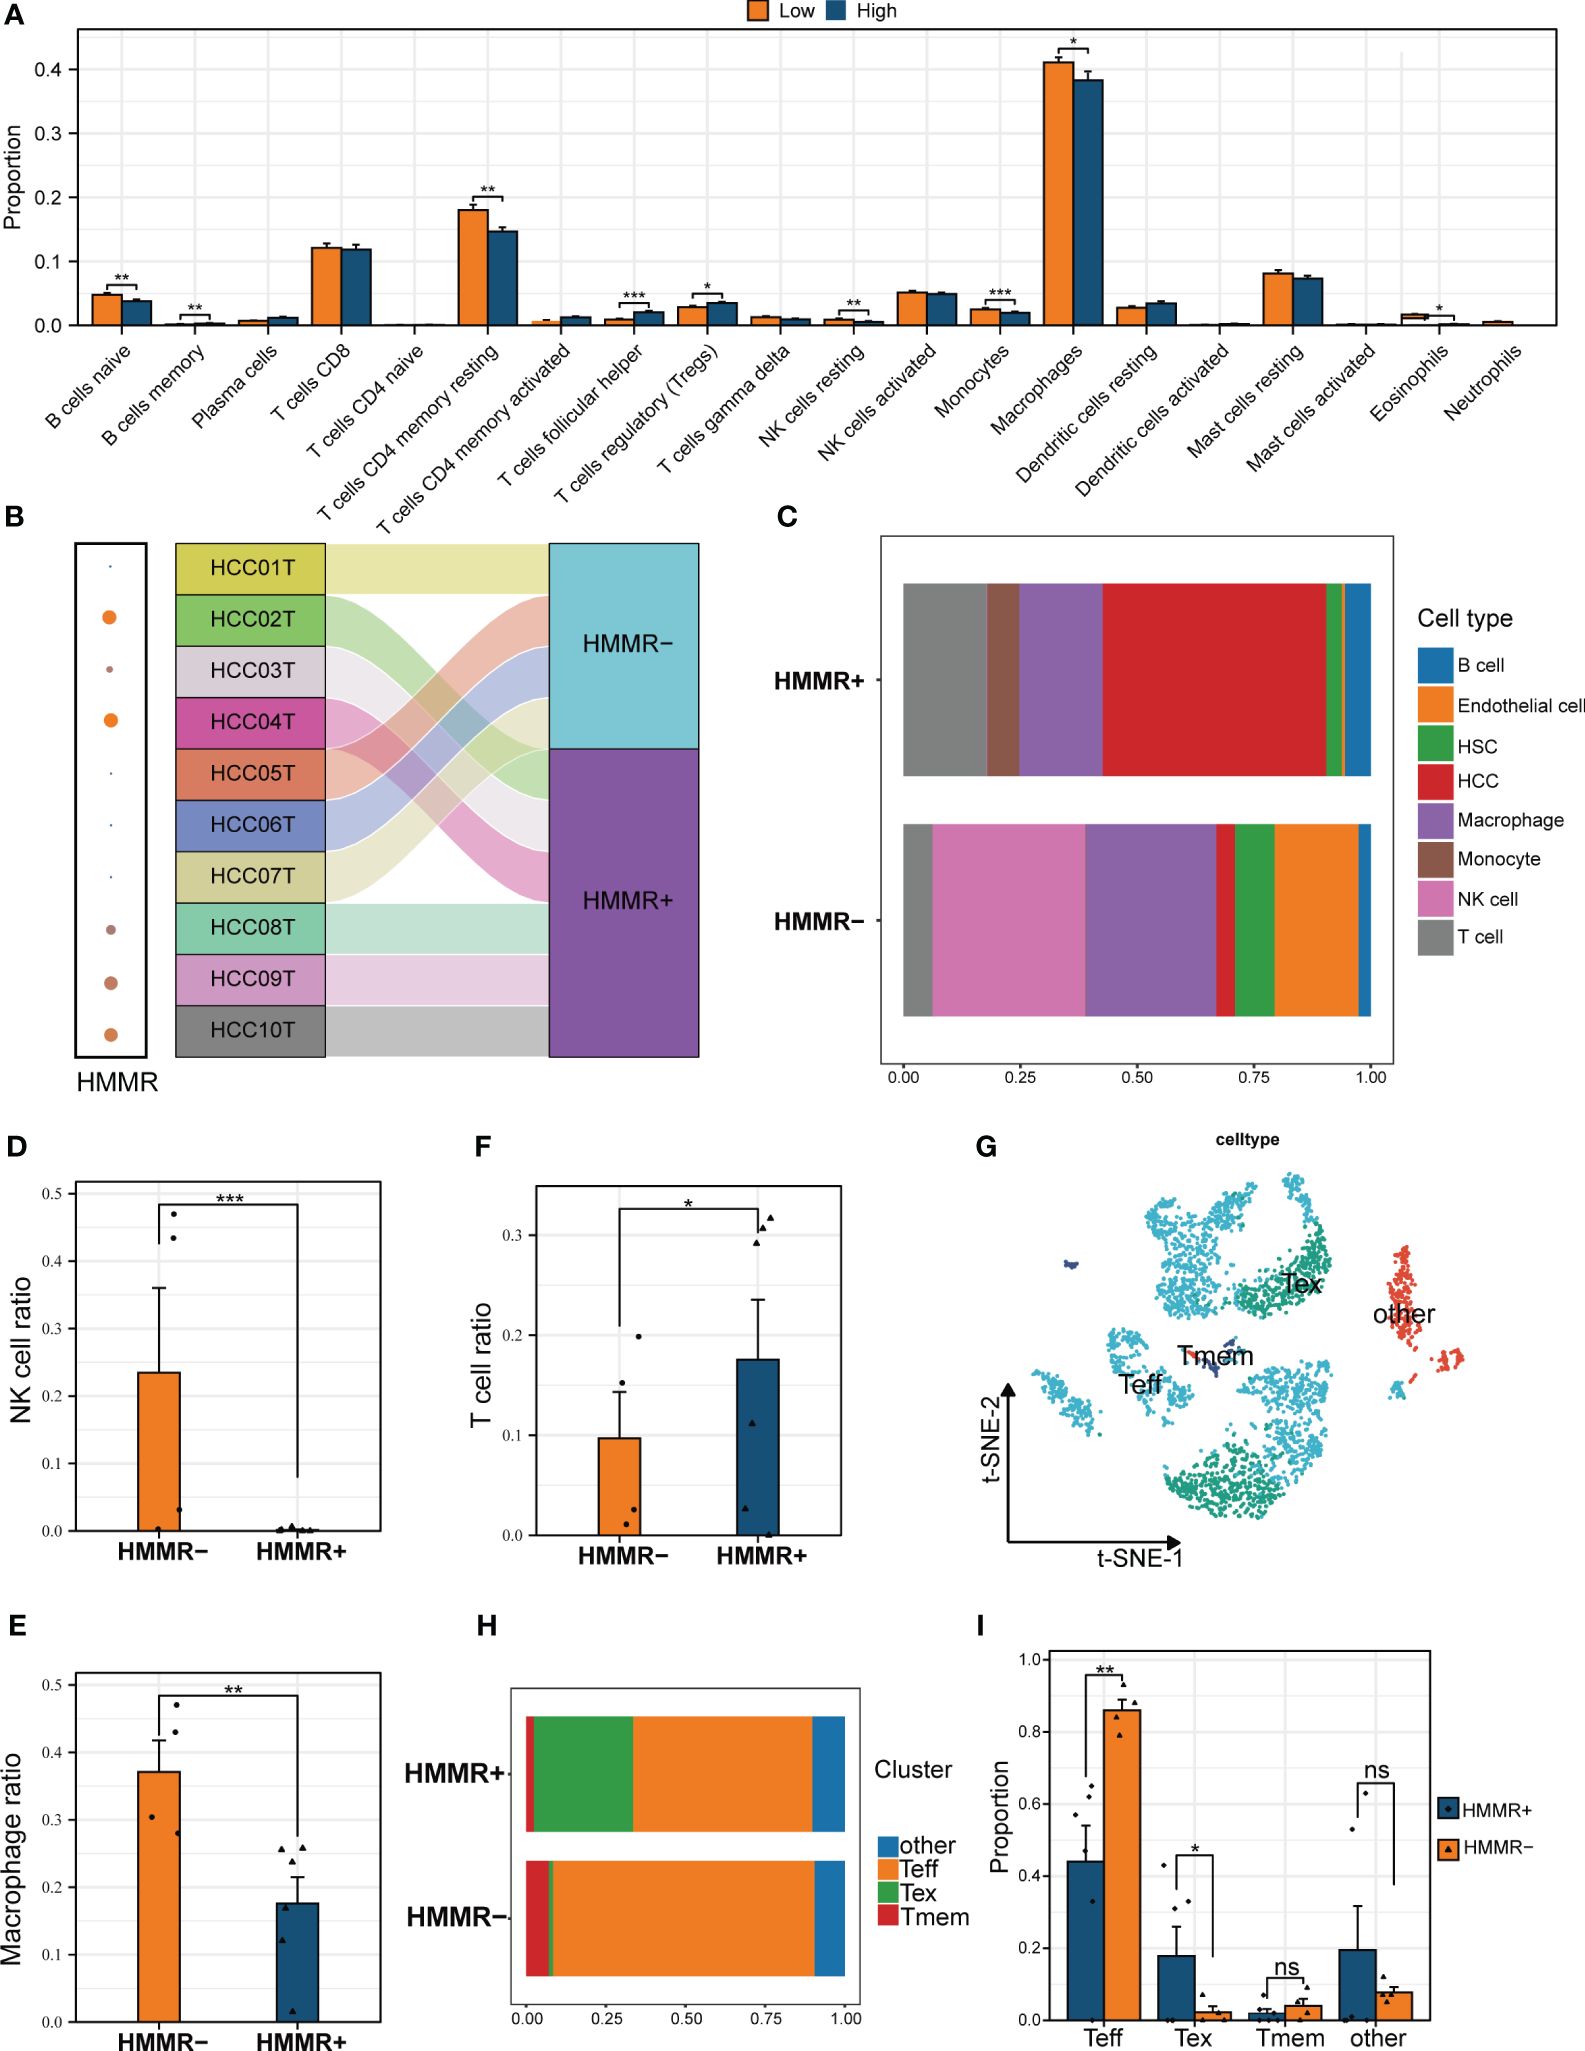
Figure 5 HMMR affected the immune cell infiltration in HCC TiME. (A) The differential infiltration of immune cells by CIBERSORTx analysis in different HMMR expression groups. (B) Sankey diagram showed the grouping of different samples. (C) The percentage of each type of cells in HMMR+/- groups. The different proportion of NK cell (D), macrophage (E), and T cell (F) between HMMR+/- groups. (G) t-SNE plot showed different clusters of T cells. (H) The percentage of each type of T cells in HMMR+/- groups. (I) The different proportion of Teff, Tex, Tmem and other T cells between HMMR+/- groups. ns: P>0.05; *P<0.05; **P<0.01; ***P<0.001.
To explore the influence of HMMR on the TiME, cell-to-cell interactions were compared using “CellChat”. HMMR+ groups had more interactions than HMMR- groups (Figure 6A). Figures 6B, C illustrate the numbers of all the intercellular interactions in HMMR+ and HMMR- groups. Figure 6D shows the upregulated (red) or downregulated (blue) cell-to-cell interactions between the HMMR+ and HMMR- groups, indicating more cell-to-cell interactions between HMMR+ HCC cells and other cells. Figure 6E shows the cell-to-cell difference in signaling activity between the HMMR+ and HMMR- groups. To further explore the role of individual cell types in cell-to-cell interactions, the cell signaling patterns were analysed in different groups. In the HMMR+ group, the migration inhibitory factors (MIF) pathway was mainly initiated in the HCC, and the receivers were immune effector cells, while in the HMMR- group, the initiators were mainly monocytes. In addition, T cells in the HMMR- group exhibited greater CXCL pathway activity (Figures 6F, G). Briefly, differential intercellular signaling was observed between the HMMR+/- groups.
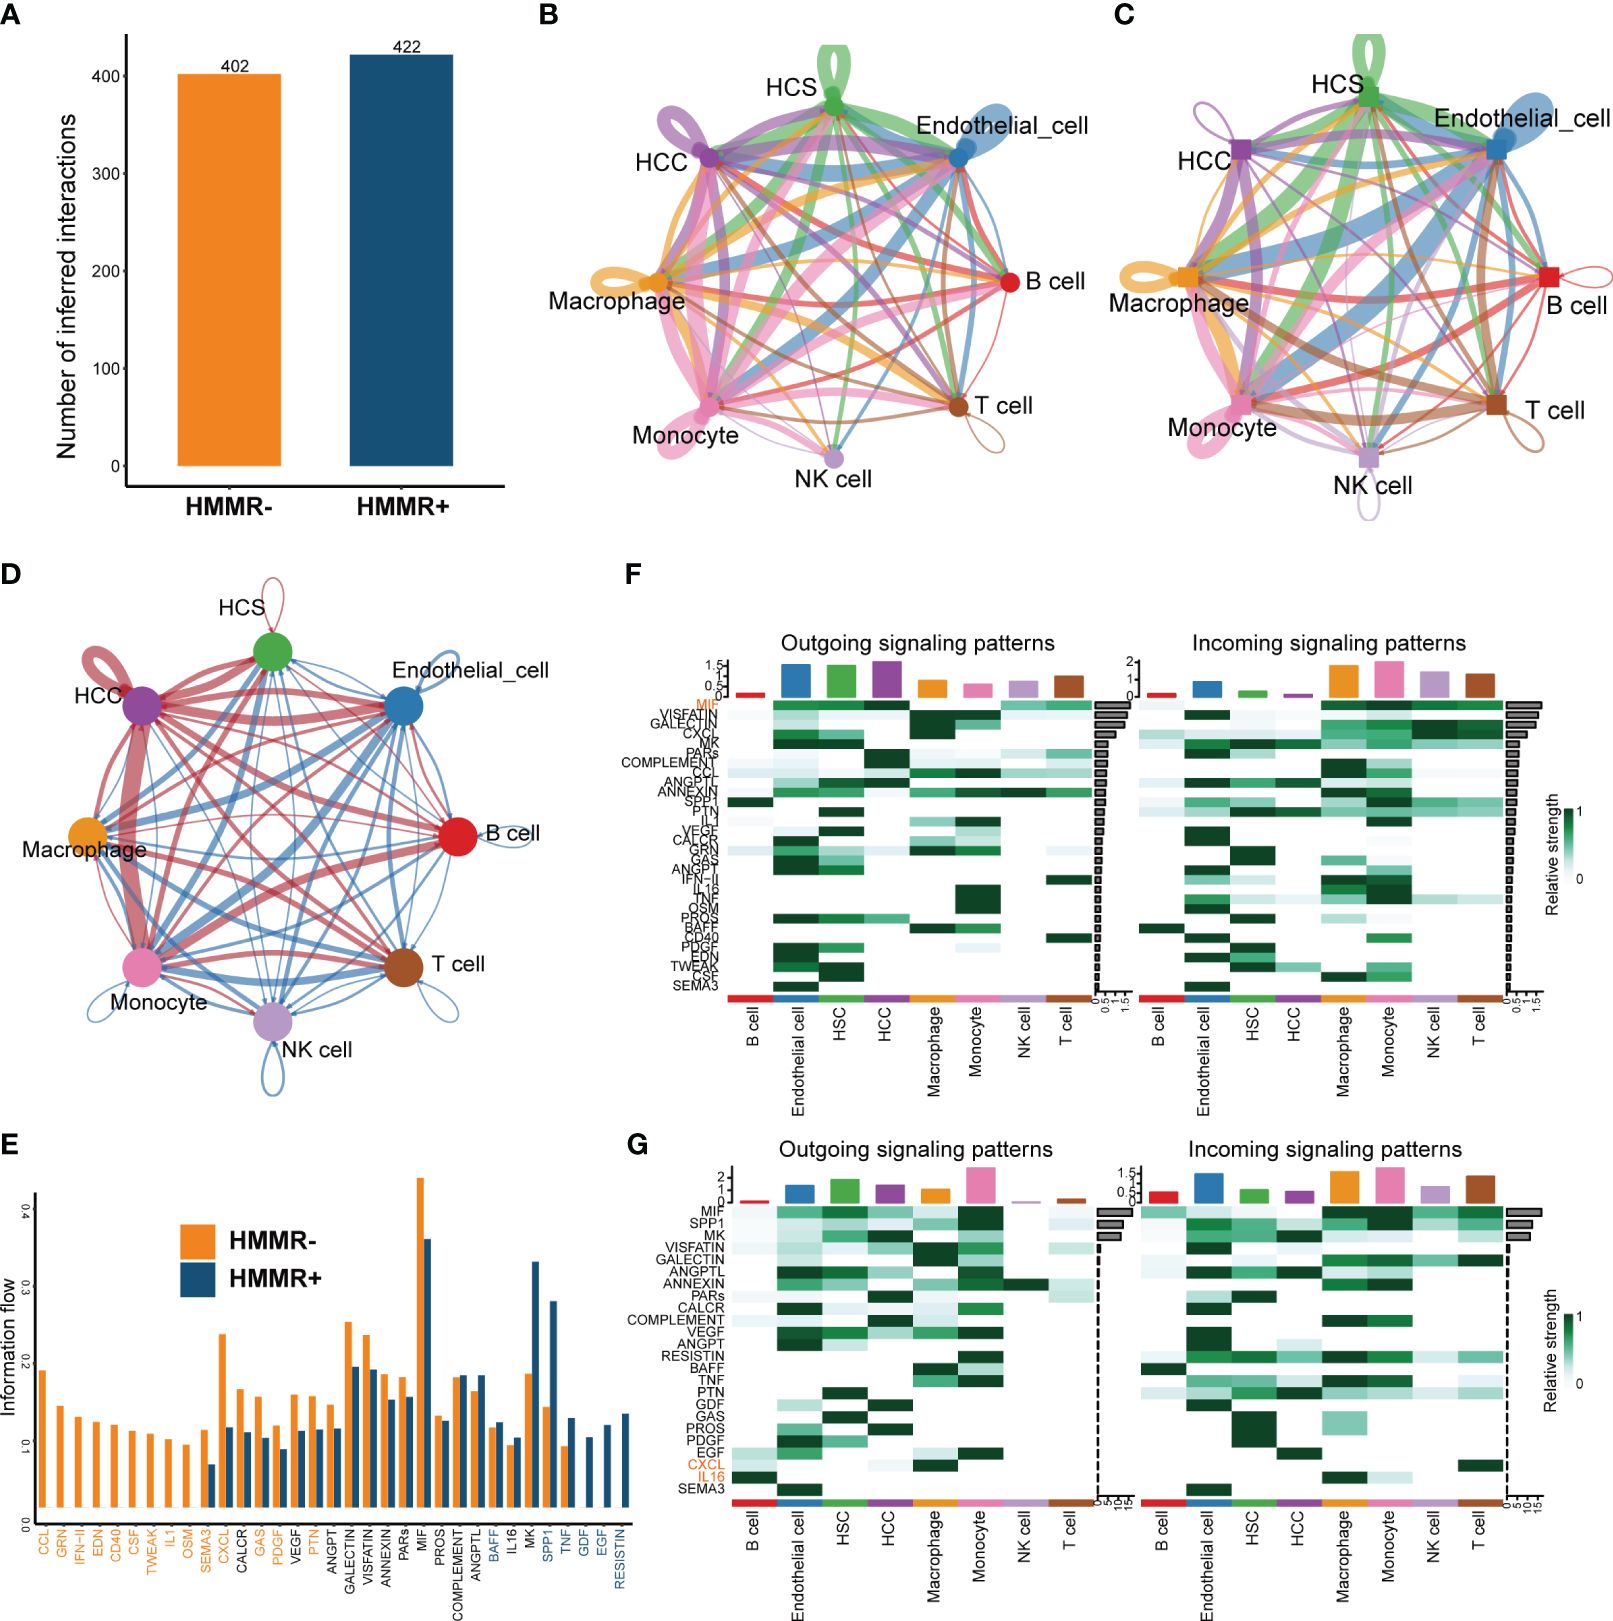
Figure 6 The differential of cell-to-cell interactions between HMMR+ and HMMR- groups. (A) The number of interactions of HMMR+/- groups. (B) The network plot showed the number of interactions between different cell populations in HMMR+ groups. (C) The network plot showed the number of interactions between different cell populations in HMMR- groups. (D) The network plot showed the differential interactions between HMMR+/- groups (red: up-regulated in HMMR+ groups; blue: down-regulated in HMMR+ groups). (E) The bar plot illustrated the signaling pathways between HMMR+/- groups. (F) The heatmap show overall signaling patterns in HMMR+ group. (G) The heatmap show overall signaling patterns in HMMR- group.
Tumour mutation burden (TMB), homologous recombination deficiency (HRD), and other genomic changes can affect the malignancy of the tumours and the efficacy of immunotherapy (27, 28). The waterfall diagram exhibited the landscape of genetic mutations under different levels of HMMR expression. TP53 mutations, known to be major cancer-causing mutations, were more prevalent in the high-HMMR expression samples (Figures 7A, B). In addition, we analysed the relationship between HMMR and various genomic heterogeneity scores was analysed. HMMR expression was positively correlated with TMB, aneuploidy, HRD, and cancer-testis antigen scores, suggesting that high HMMR expression may be associated with higher immunotherapy response rates (p<0.05; Figures 7C–F). To confirm this conclusion, we analysed the influence of HMMR on ICIs in the “IMvigor 210”. The high expression of HMMR was associated with better prognosis in patients with advanced urothelial carcinoma receiving ICIs (p<0.05, HR=0.59 [0.44−0.80], Figure 7G). Moreover, diagnostic ROC analysis showed that HMMR was a better predictor of ICIs response rate than CD274 (Figure 7H). Figure 7I illustrates that high HMMR-expression groups had significantly higher proportions of complete response (CR) and part response (PR) and lower proportions of the stable disease (SD) and progression disease (PD). The results indicate that patients with higher HMMR expression patients maybe benefit more from ICIs therapy.
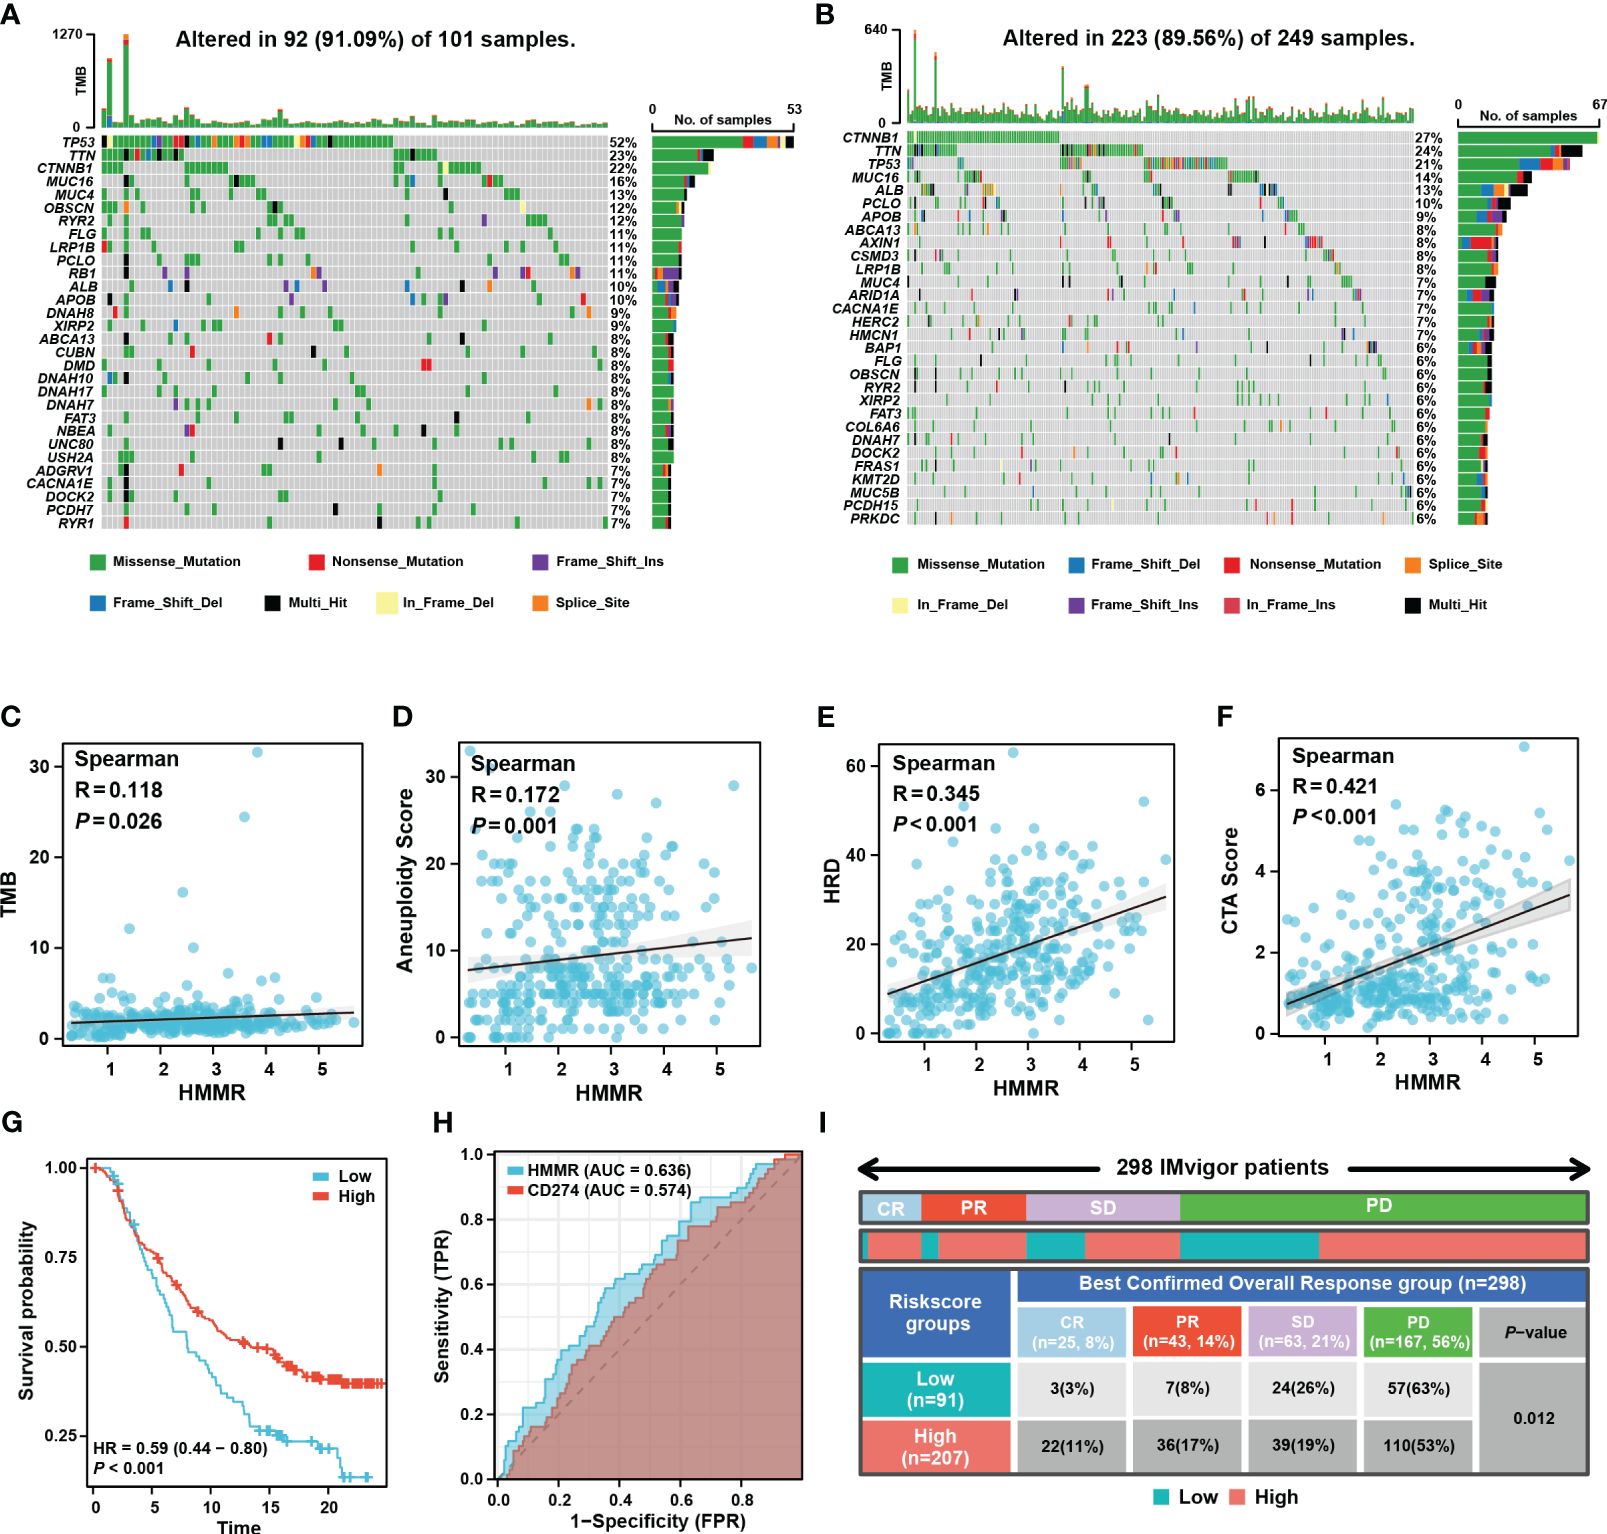
Figure 7 HMMR could predict the response to ICIs. Mutated genes (rows, top 30) are ordered by mutation rate in the HMMR+ group (A) and HMMR- group (B). The correlation between HMMR expression and TMB score (C), aneuploidy (D), HRD (E) and CTA (F) score. (G) The K-M curve showed the prognosis of the patients grouped by the best cut-off value of HMMR in IMvigor 210 cohort. (H) ROC curve showed the value of HMMR to predict the response to ICIs in IMvigor 210 cohort. (I) Distribution of immune response to ICIs in different subgroups in IMvigor 210 cohort.
Figure 8A shows that HMMR expression was associated with poor prognosis in the TCGA-LIHC, GEO, ICGC, and FPH cohorts (all p<0.05, Figure 8A). Univariate and multiple Cox regression analyses showed that the T stage and HMMR expression were independent risk factors for HCC (Supplementary Table 4). Therefore, T stage and HMMR were incorporated into the RPA model (Figure 8B). The RPA model divided the patients with HCC into three clusters, of which C1 had the lowest HMMR expression and T1–2 had the best prognosis (p<0.001, Figure 8C). The RPA model had a good calibration with respect to the predicted vs observed 1-, 2-, and 3- years OS of patients (Figure 8D). The AUC values of the ROC curves for 1, 2, and 3 years were 0.744, 0.679, and 0.672, respectively (Figure 8E). Additionally, decision curve analysis (DCA) revealed the superiority of the RPA model over the AJCC_T stage and HMMR expression in predicting the 1-, 2-, and 3-year OS (Figure 8F).
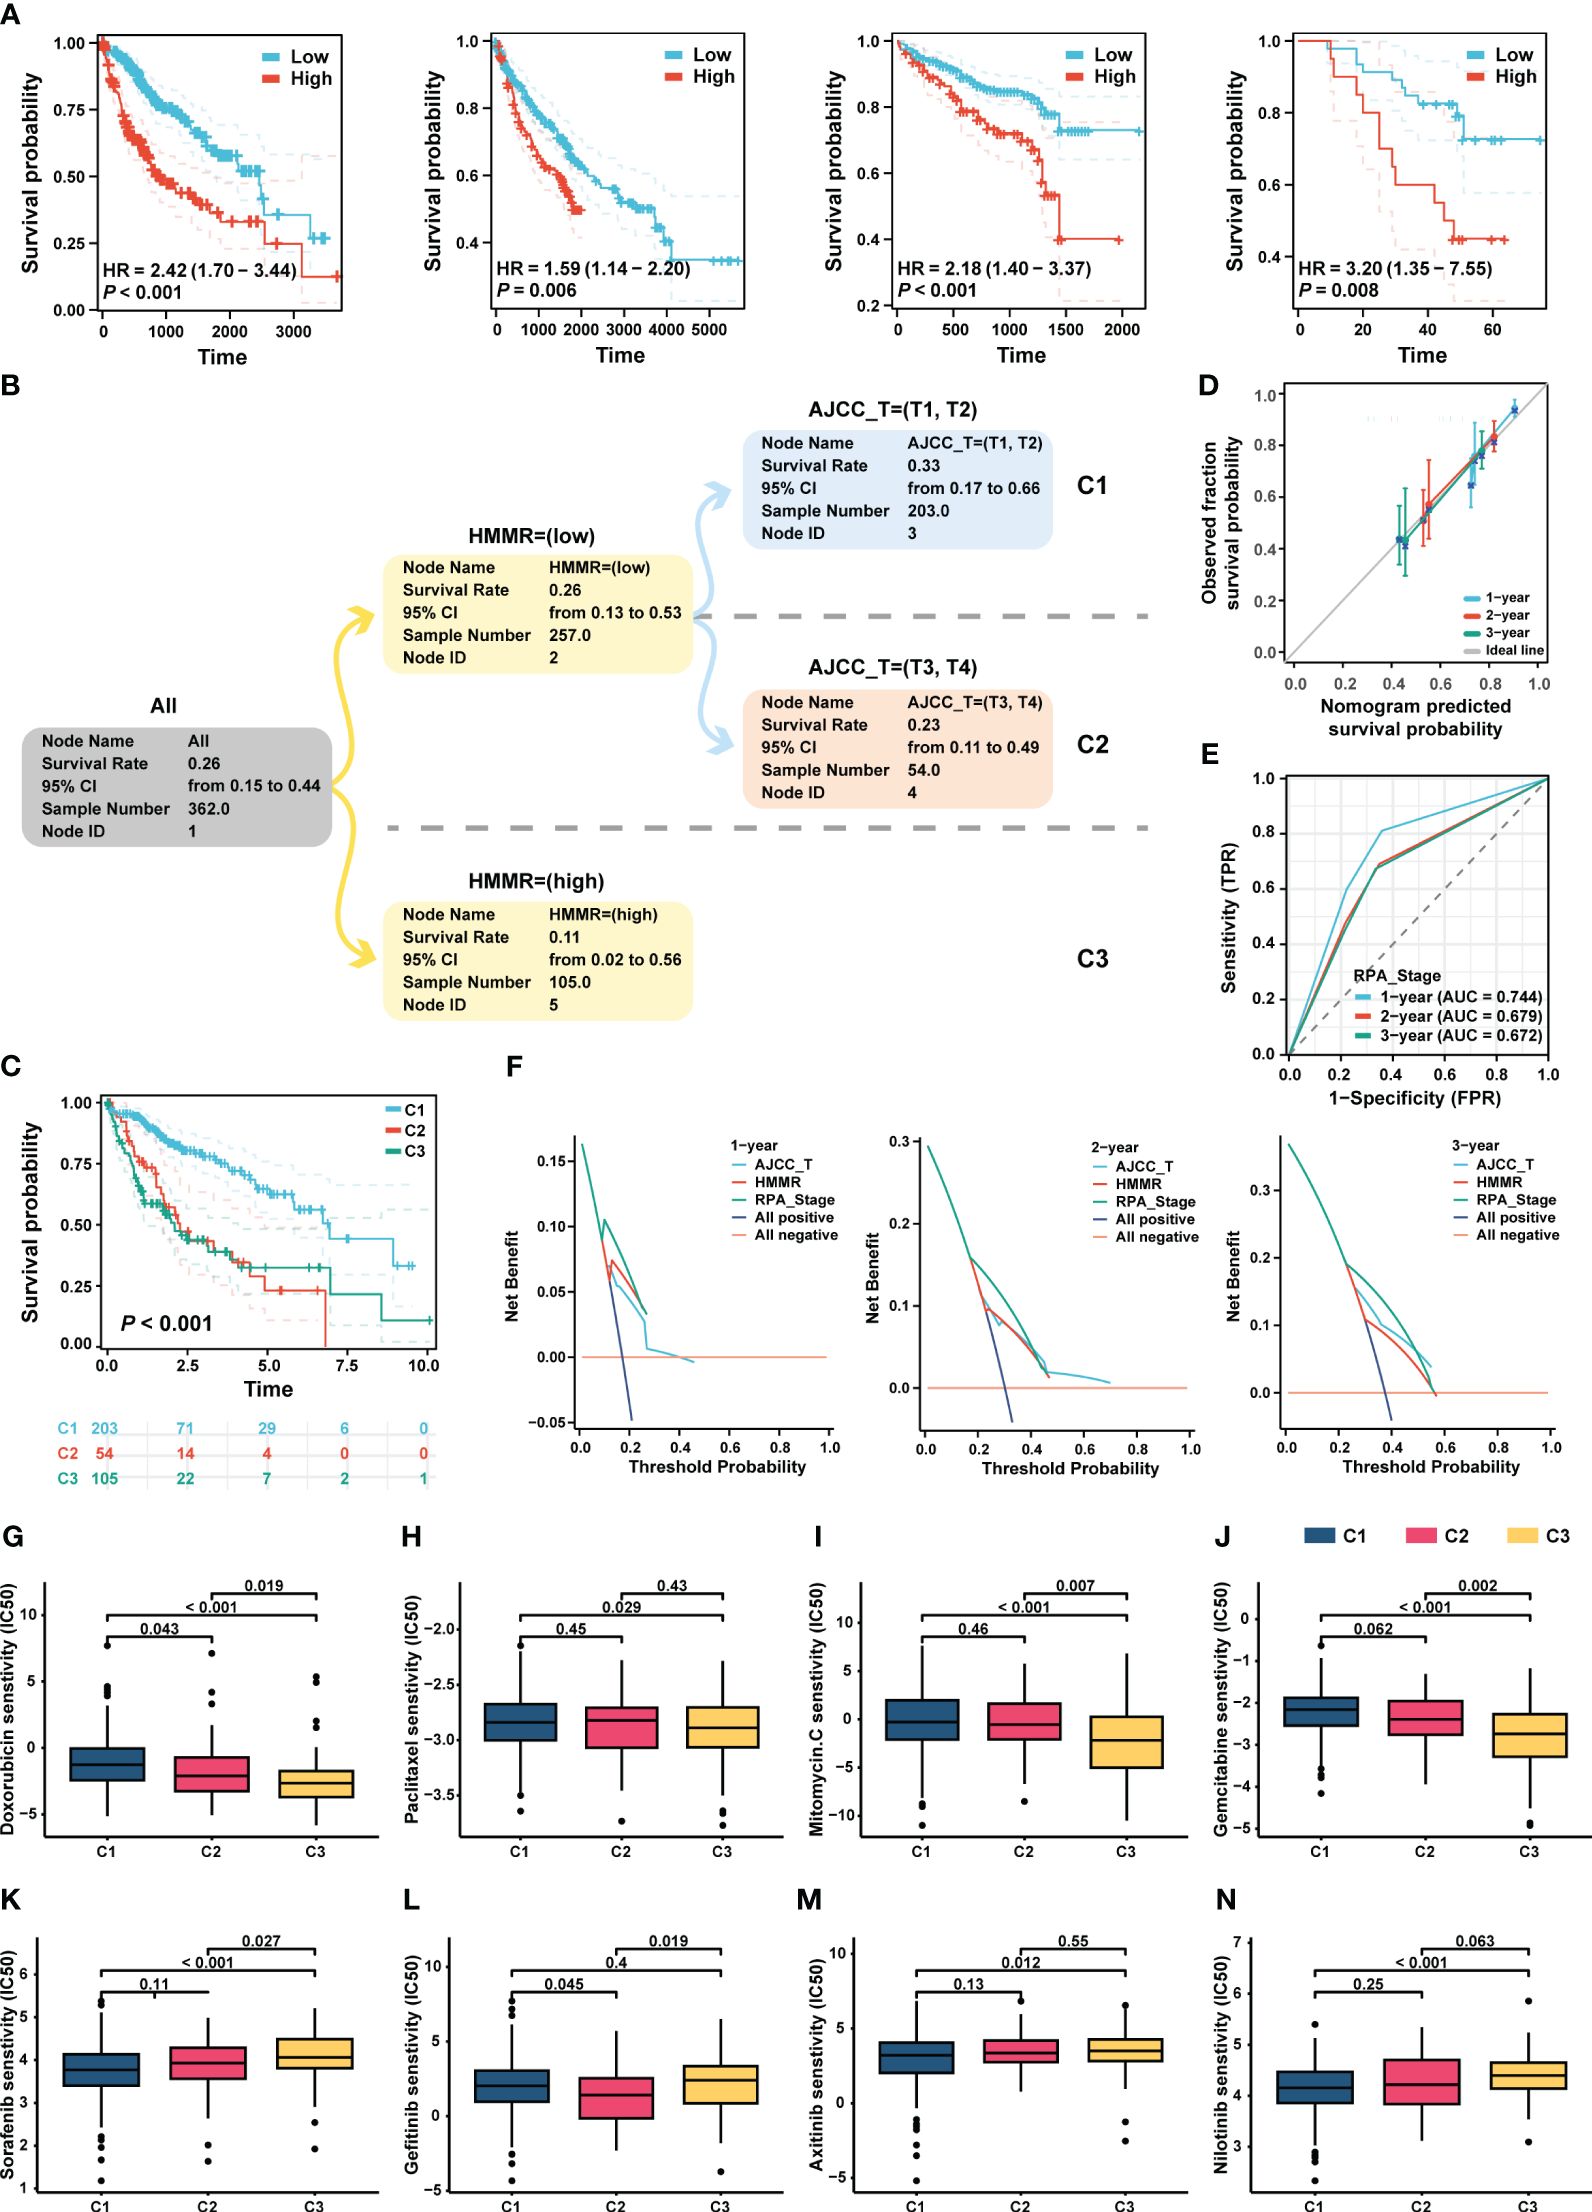
Figure 8 RPA model re-staged the HCC patients. (A) The K-M curve showed the prognosis of the patients grouped by the best cut-off value of HMMR in TCGA-LIHC, GEO, ICGC and HCC cDNA microarray cohorts, respectively. (B) The dendrogram showed the grouping of the RPA model. (C) Kaplan-Meier survival curve of OS between different clusters. (D) Calibration curves showed the concordance between predicted and observed 1-, 2-, and 3-years survival rates. (E) The broken line graph showed the AUCs of RPA_stage. (F) DCA for RPA_stage, AJCC_T, and HMMR at 1-, 2-, and 3-years to assess clinical utility in TCGA-LIHC cohort. The sensitivity of doxorubicin (G), paclitaxel (H), mitomycin C (I), and gemcitabine (J), sorafenib (K), gefitinib (L), axitinib (M), and nilotinib (N) in different RPA clusters.
Based on the RPA model, we performed a drug sensitivity analysis of commonly used chemotherapeutic and targeted drugs for HCC. Our results revealed that patients in C3 had the highest sensitivity to chemotherapeutic drugs, such as doxorubicin, paclitaxel, mitomycin, and gemcitabin (all p < 0.05, Figures 8G–J). In addition, the patients in C1 had the highest sensitivity to sorafenib, gefitinib, axitinib, and nilotinib (all p<0.05, Figures 8K–N).
In this study, we comprehensively explored the role of HMMR in HCC using multiple databases and sequencing levels. In addition, we analysed the diagnostic and prognostic value of HMMR in patients with HCC and revealed the impact of HMMR in TiME. Moreover, the clinical application values of HMMR in HCC was demonstrated by constructing an RPA model and exploring the sensitivity of different treatment modalities. These findings suggest that HMMR may be a biomarker or treatment indicator for patients with HCC.
HMMR, which was associated with cell movement, was expressed at low levels in the normal tissue, whereas it was highly expressed in tissues with active proliferation such as the testes and cancers (29). HMMR was overexpressed in most carcinomas, including acute myeloid leukaemia, breast cancer, and lung cancer. Similarly, in the present study, we found that HMMR was more highly expressed in HCC tissues, and MLN and PVTT tissues, than in normal liver tissues. HMMR could be used as a diagnostic biomarker for HCC with good sensitivity, accuracy, and specificity, based on multiple cohorts and qRT-PCR analyses.
Previous studies have reported that HMMR is associated with a poor prognosis in various cancers. HMMR, as a centrosome- and microtubule-associated protein (30), can regulate cell growth via complex signalling pathways. In breast cancer, elevated HMMR activates AURKA and reduces ARPC2 localisation in the mitotic cell cortex, which correlates with micronucleation and the activation of cGAS-STING and non-canonical NF-κB signalling (31). In gastric cancer, HMMR promoted gastric cancer peritoneal metastasis by enhancing cell-cell interactions and activating of AKT-FOXO1 signalling (32). However, the HMMR-related signalling pathways in patients with HCC remained unknown. In the present study, HMMR knockdown could inhibit in vitro HCC cell proliferation and invasion in vitro assays. In addition, G2M checkpoint and E2F target pathways were highly enriched in patients with high-HMMR expression. Furthermore, their activities of these pathways were elevated in the high-HMMR expression, and the results were confirmed using FCM. The results suggested that HMMR may promote HCC development of via cell cycle regulation.
In recent years, the significant role of microRNAs (miRNAs) in disease formation, development, diagnosis, and treatment has garnered considerable attention from researchers (33, 34). As gene regulators implicated in the pathogenesis of complex diseases like cancer, miRNAs have been extensively investigated in oncogenic gene studies (35, 36). In current study, we hypothesize that hsa-let-7c-5p may serve as a potential regulator of HMMR expression, which was down-regulated in tumour tissues and associated with a favourable prognosis. This aligns with previous research conducted by Andrei et al., who demonstrated that hsa-let-7c-5p inhibits colorectal cancer invasion by targeting the IGF axis (37).
The TiME influences tumour growth, metastatic spread, and response to treatment. Ma et al. suggested that HMMR expression was associated with immune infiltration in lung adenocarcinoma (38). In the present study, the high HMMR expression groups had relatively low NK cells and macrophage infiltration, which was demonstrated by scRNA-seq analysis. In addition, the HMMR+ groups had lower numbers of Teff and higher of Tex, suggesting that HMMR is associated with the process of T cell exhaustion. Ciaran et al. showed that the MIF pathway occupies a central role in the inflammatory pathway and has been implicated in the tumourigenesis, angiogenesis, and metastasis of numerous cancer phenotypes (39). In tumour cells, the MIF pathway was triggered by autocrine signals and stimulates the production of cytokines, chemokines, and angiogenic factors, which lead to tumour growth, increasing its aggressiveness and metastatic potential (40). In the present study, there were more HCC cell-to-cell interactions in the HMMR+ groups, and MIF was one of pathways identified, which implies the MIF pathway might regulate the malignant phenotype in HMMR+ HCC.
For a decade, sorafenib has remained the only approved first-line treatment and standard of care for advanced HCC. However, a randomized, open-label phase III trial (NCT03434379) suggested that atezolizumab combined with bevacizumab has better overall and progression-free survival outcomes than sorafenib for patients with unresectable HCC (41). Therefore, the rational selection of targeted therapy, immunotherapy and chemotherapy drugs is crucial for the improvement of the prognosis of HCC patients. In the present study, patients in the IMvigor 210 cohort with high HMMR expression had a better prognosis after receiving ICIs, with higher proportions of CR and PR. Moreover, HMMR demonstrated a higher accuracy of ICIs efficacy assessment than CD274. Traditional clinical staging does not consider the biomolecular characteristics of patients; therefore, in this study, the RPA algorithm was used to re-stage the TCGA-LIHC patients. ROC and DCA curve analysis showed that the RPA model had excellent clinical value with regard to treatment guidance. Based on the RPA model, we further analysed the sensitivity to chemotherapy drugs and targeted drugs in different clusters. C3 patients had higher sensitivity to chemotherapy drugs whereas C1 patients had higher sensitivity to TKIs. These results provide an important reference to aid and guide further clinical research and clinical practice. However, owing to the lack of a corresponding clinical treatment cohort for validation, these conclusions need to be confirmed by future clinical research.
By integrating bulk RNA-seq and scRNA-seq, we analysed the role of HMMR in the diagnosis, prognosis, and treatment of HCC, and revealed its value as a promising molecular target for the disease.
The datasets presented in this study can be found in online repositories. The names of the repository/repositories and accession number(s) can be found in the article/Supplementary Material.
ZS: Conceptualization, Data curation, Formal analysis, Investigation, Writing – original draft, Writing – review & editing. LY: Conceptualization, Data curation, Formal analysis, Funding acquisition, Investigation, Software, Writing – review & editing. YH: Conceptualization, Investigation, Writing – review & editing. JC: Formal analysis, Methodology, Project administration, Writing – review & editing. GZ: Formal analysis, Project administration, Resources, Supervision, Validation, Writing – review & editing. ZL: Conceptualization, Funding acquisition, Investigation, Methodology, Project administration, Resources, Supervision, Visualization, Writing – review & editing, Writing – original draft.
The author(s) declare financial support was received for the research, authorship, and/or publication of this article. Joint Funds for the Innovation of Science and Technology, Fujian Province (No.2023Y9342). Special Grant for Education and Scientific Research of Fujian Provincial Department of Finance (Fujian Finance Document (2023) 834), Fujian Provincial Health Technology Project (No.2016-CX-4).
We sincerely thank the researchers and study participants for their contributions to this study. We are also grateful to the data providers of the various public databases.
The authors declare that the research was conducted in the absence of any commercial or financial relationships that could be construed as a potential conflict of interest.
All claims expressed in this article are solely those of the authors and do not necessarily represent those of their affiliated organizations, or those of the publisher, the editors and the reviewers. Any product that may be evaluated in this article, or claim that may be made by its manufacturer, is not guaranteed or endorsed by the publisher.
The Supplementary Material for this article can be found online at: https://www.frontiersin.org/articles/10.3389/fimmu.2024.1363834/full#supplementary-material
1. Sung H, Ferlay J, Siegel RL, Laversanne M, Soerjomataram I, Jemal A, et al. Global cancer statistics 2020: GLOBOCAN estimates of incidence and mortality worldwide for 36 cancers in 185 countries. CA Cancer J Clin. (2021) 71(3):209–49. doi: 10.3322/caac.21660
2. Llovet JM, De Baere T, Kulik L, Haber PK, Greten TF, Meyer T, et al. Locoregional therapies in the era of molecular and immune treatments for hepatocellular carcinoma. Nat Rev Gastroenterol Hepatol. (2021) 18(5):293–313. doi: 10.1038/s41575-020-00395-0
3. . EASL Clinical Practice Guidelines: Management of hepatocellular carcinoma. J Hepatol. (2018) 69(1):182–236. doi: 10.1016/j.jhep.2018.03.019
4. Llovet JM, Pinyol R, Kelley RK, El-Khoueiry A, Reeves HL, Wang XW, et al. Molecular pathogenesis and systemic therapies for hepatocellular carcinoma. Nat Cancer. (2022) 3(4):386–401. doi: 10.1038/s43018-022-00357-2
5. Morath I, Hartmann TN, Orian-Rousseau V. CD44: More than a mere stem cell marker. Int J Biochem Cell Biol. (2016) 81(Pt A):166–73. doi: 10.1016/j.biocel.2016.09.009
6. Maxwell CA, Keats JJ, Belch AR, Pilarski LM, Reiman T. Receptor for hyaluronan-mediated motility correlates with centrosome abnormalities in multiple myeloma and maintains mitotic integrity. Cancer Res. (2005) 65(3):850–60.
7. Connell M, Chen H, Jiang J, Kuan CW, Fotovati A, Chu TL, et al. HMMR acts in the PLK1-dependent spindle positioning pathway and supports neural development. Elife. (2017) 6. doi: 10.7554/eLife.28672
8. Fieber C, Plug R, Sleeman J, Dall P, Ponta H, Hofmann M. Characterisation of the murine gene encoding the intracellular hyaluronan receptor IHABP (RHAMM). Gene. (1999) 226(1):41–50. doi: 10.1016/s0378-1119(98)00566-6
9. Assmann V, Gillett CE, Poulsom R, Ryder K, Hart IR, Hanby AM. The pattern of expression of the microtubule-binding protein RHAMM/IHABP in mammary carcinoma suggests a role in the invasive behaviour of tumour cells. J Pathol. (2001) 195(2):191–6. doi: 10.1002/path.941
10. Zlobec I, Baker K, Terracciano LM, Lugli A. RHAMM, p21 combined phenotype identifies microsatellite instability-high colorectal cancers with a highly adverse prognosis. Clin Cancer Res. (2008) 14(12):3798–806. doi: 10.1158/1078-0432.Ccr-07-5103
11. Li H, Guo L, Li JW, Liu N, Qi R, Liu J. Expression of hyaluronan receptors CD44 and RHAMM in stomach cancers: relevance with tumor progression. Int J Oncol. (2000) 17(5):927–32.
12. Rein DT, Roehrig K, Schöndorf T, Lazar A, Fleisch M, Niederacher D, et al. Expression of the hyaluronan receptor RHAMM in endometrial carcinomas suggests a role in tumour progression and metastasis. J Cancer Res Clin Oncol. (2003) 129(3):161–4. doi: 10.1007/s00432-003-0415-0
13. Gust KM, Hofer MD, Perner SR, Kim R, Chinnaiyan AM, Varambally S, et al. RHAMM (CD168) is overexpressed at the protein level and may constitute an immunogenic antigen in advanced prostate cancer disease. Neoplasia. (2009) 11(9):956–63. doi: 10.1593/neo.09694
14. Maxwell CA, Rasmussen E, Zhan F, Keats JJ, Adamia S, Strachan E, et al. RHAMM expression and isoform balance predict aggressive disease and poor survival in multiple myeloma. Blood. (2004) 104(4):1151–8. doi: 10.1182/blood-2003-11-4079
15. Guo K, Liu C, Shi J, Lai C, Gao Z, Luo J, et al. HMMR promotes prostate cancer proliferation and metastasis via AURKA/mTORC2/E2F1 positive feedback loop. Cell Death Dis. (2023) 9(1):48. doi: 10.1038/s41420-023-01341-0
16. He L, Li H, Li C, Liu ZK, Lu M, Zhang RY, et al. HMMR alleviates endoplasmic reticulum stress by promoting autophagolysosomal activity during endoplasmic reticulum stress-driven hepatocellular carcinoma progression. Cancer Commun (Lond). (2023) 43(9):981–1002. doi: 10.1002/cac2.12464
17. Li Y, Qi D, Zhu B, Ye X. Analysis of m6A RNA methylation-related genes in liver hepatocellular carcinoma and their correlation with survival. Int J Mol Sci. (2021) 22(3). doi: 10.3390/ijms22031474
18. Lei X, Zhang M, Guan B, Chen Q, Dong Z, Wang C. Identification of hub genes associated with prognosis, diagnosis, immune infiltration and therapeutic drug in liver cancer by integrated analysis. Hum Genomics. (2021) 15(1):39. doi: 10.1186/s40246-021-00341-4
19. Gao Q, Fan L, Chen Y, Cai J. Identification of the hub and prognostic genes in liver hepatocellular carcinoma via bioinformatics analysis. Front Mol Biosci. (2022) 9:1000847. doi: 10.3389/fmolb.2022.1000847
20. Suvà ML, Tirosh I. Single-cell RNA sequencing in cancer: Lessons learned and emerging challenges. Mol Cell. (2019) 75(1):7–12. doi: 10.1016/j.molcel.2019.05.003
21. Olsen TK, Baryawno N. Introduction to single-cell RNA sequencing. Curr Protoc Mol Biol. (2018) 122(1):e57. doi: 10.1002/cpmb.57
22. Lu Y, Yang A, Quan C, Pan Y, Zhang H, Li Y, et al. A single-cell atlas of the multicellular ecosystem of primary and metastatic hepatocellular carcinoma. Nat Commun. (2022) 13(1):4594. doi: 10.1038/s41467-022-32283-3
23. Li X, Zuo H, Zhang L, Sun Q, Xin Y, Zhang L. Validating HMMR expression and its prognostic significance in lung adenocarcinoma based on data mining and bioinformatics methods. Front Oncol. (2021) 11:720302. doi: 10.3389/fonc.2021.720302
24. Jin S, Guerrero-Juarez CF, Zhang L, Chang I, Ramos R, Kuan CH, et al. Inference and analysis of cell-cell communication using CellChat. Nat Commun. (2021) 12(1):1088. doi: 10.1038/s41467-021-21246-9
25. Xie Y, Luo X, Li H, Xu Q, He Z, Zhao Q, et al. autoRPA: A web server for constructing cancer staging models by recursive partitioning analysis. Comput Struct Biotechnol J. (2020) 18:3361–7. doi: 10.1016/j.csbj.2020.10.038
26. Bilotta MT, Antignani A, Fitzgerald DJ. Managing the TME to improve the efficacy of cancer therapy. Front Immunol. (2022) 13:954992. doi: 10.3389/fimmu.2022.954992
27. Palmeri M, Mehnert J, Silk AW, Jabbour SK, Ganesan S, Popli P, et al. Real-world application of tumor mutational burden-high (TMB-high) and microsatellite instability (MSI) confirms their utility as immunotherapy biomarkers. ESMO Open. (2022) 7(1):100336. doi: 10.1016/j.esmoop.2021.100336
28. Toh M, Ngeow J. Homologous recombination deficiency: Cancer predispositions and treatment implications. Oncologist. (2021) 26(9):e1526–37. doi: 10.1002/onco.13829
29. He Z, Mei L, Connell M, Maxwell CA. Hyaluronan mediated motility receptor (HMMR) encodes an evolutionarily conserved homeostasis, mitosis, and meiosis regulator rather than a hyaluronan receptor. Cells. (2020) 9(4). doi: 10.3390/cells9040819
30. Assmann V, Jenkinson D, Marshall JF, Hart IR. The intracellular hyaluronan receptor RHAMM/IHABP interacts with microtubules and actin filaments. J Cell Sci. (1999) 112(Pt 22):3943–54. doi: 10.1242/jcs.112.22.3943
31. Mateo F, He Z, Mei L, de Garibay GR, Herranz C, García N, et al. Modification of BRCA1-associated breast cancer risk by HMMR overexpression. Nat Commun. (2022) 13(1):1895. doi: 10.1038/s41467-022-29335-z
32. Yang M, Chen B, Kong L, Chen X, Ouyang Y, Bai J, et al. HMMR promotes peritoneal implantation of gastric cancer by increasing cell-cell interactions. Dis Oncol. (2022) 13(1):81. doi: 10.1007/s12672-022-00543-9
33. Huang L, Zhang L, Chen X. Updated review of advances in microRNAs and complex diseases: towards systematic evaluation of computational models. Brief Bioinform. (2022) 23(6). doi: 10.1093/bib/bbac407
34. Zhang L, Chen X, Yin J. Prediction of potential miRNA-disease associations through a novel unsupervised deep learning framework with variational autoencoder. Cells. (2019) 8(9). doi: 10.3390/cells8091040
35. Huang L, Zhang L, Chen X. Updated review of advances in microRNAs and complex diseases: taxonomy, trends and challenges of computational models. Brief Bioinform. (2022) 23(5). doi: 10.1093/bib/bbac358
36. Huang L, Zhang L, Chen X. Updated review of advances in microRNAs and complex diseases: experimental results, databases, webservers and data fusion. Brief Bioinform. (2022) 23(6). doi: 10.1093/bib/bbac397
37. Niculae AM, Dobre M, Herlea V, Manuc TE, Trandafir B, Milanesi E, et al. Let-7 microRNAs are possibly associated with perineural invasion in colorectal cancer by targeting IGF axis. Life (Basel). (2022) 12(10). doi: 10.3390/life12101638
38. Ma X, Xie M, Xue Z, Yao J, Wang Y, Xue X, et al. HMMR associates with immune infiltrates and acts as a prognostic biomaker in lung adenocarcinoma. Comput Biol Med. (2022) 151(Pt A):106213. doi: 10.1016/j.compbiomed.2022.106213
39. O'Reilly C, Doroudian M, Mawhinney L, Donnelly SC. Targeting MIF in cancer: Therapeutic strategies, current developments, and future opportunities. Med Res Rev. (2016) 36(3):440–60. doi: 10.1002/med.21385
40. Nobre CC, de Araújo JM, Fernandes TA, Cobucci RN, Lanza DC, Andrade VS, et al. Macrophage migration inhibitory factor (MIF): Biological activities and relation with cancer. Pathol Oncol Res. (2017) 23(2):235–44. doi: 10.1007/s12253-016-0138-6
Keywords: HMMR, HCC, single cell RNA sequence, RPA, treatment, bulk RNA sequence
Citation: Su Z, He Y, You L, Zhang G, Chen J and Liu Z (2024) Coupled scRNA-seq and Bulk-seq reveal the role of HMMR in hepatocellular carcinoma. Front. Immunol. 15:1363834. doi: 10.3389/fimmu.2024.1363834
Received: 31 December 2023; Accepted: 20 March 2024;
Published: 03 April 2024.
Edited by:
Raquel Alarcon Rodriguez, University of Almeria, SpainReviewed by:
You Zhou, First People’s Hospital of Changzhou, ChinaCopyright © 2024 Su, He, You, Zhang, Chen and Liu. This is an open-access article distributed under the terms of the Creative Commons Attribution License (CC BY). The use, distribution or reproduction in other forums is permitted, provided the original author(s) and the copyright owner(s) are credited and that the original publication in this journal is cited, in accordance with accepted academic practice. No use, distribution or reproduction is permitted which does not comply with these terms.
*Correspondence: Zhenhua Liu, bGl1emhlbmh1YTY5MDlAMTYzLmNvbQ==; Jingbo Chen, MTM2MzUyOTQxOTJAMTYzLmNvbQ==; Guifeng Zhang, OTg0Mzg2NTM3QHFxLmNvbQ==
†These authors have contributed equally to this work
Disclaimer: All claims expressed in this article are solely those of the authors and do not necessarily represent those of their affiliated organizations, or those of the publisher, the editors and the reviewers. Any product that may be evaluated in this article or claim that may be made by its manufacturer is not guaranteed or endorsed by the publisher.
Research integrity at Frontiers
Learn more about the work of our research integrity team to safeguard the quality of each article we publish.