 Ishtu Hageman1,2†
 Femke Mol2†
 Sadaf Atiqi3†
 Vincent Joustra1†Hilal Sengul1
 Peter Henneman4Ingrid Visman3Theodorus Hakvoort2Mike Nurmohamed3
 Gertjan Wolbink3Evgeni Levin5,6
 Andrew Y.F. Li Yim1,2,4Geert D’Haens1‡
 Wouter J. de Jonge2,7*‡
- 1Department of Gastroenterology and Hepatology, Amsterdam University Medical Centers (UMC), University of Amsterdam, Amsterdam, Netherlands
- 2Tytgat Institute for Liver and Intestinal Research, Amsterdam University Medical Centers (UMC), University of Amsterdam, Amsterdam, Netherlands
- 3Department of Rheumatology, Amsterdam Rheumatology and Immunology Center, Vrije Universiteit (VU) University Medical Center, Amsterdam, Netherlands
- 4Genome Diagnostics Laboratory, Department of Human Genetics, Amsterdam University Medical Centers (UMC), University of Amsterdam, Amsterdam, Netherlands
- 5Department of Vascular Medicine, Amsterdam University Medical Centers, University of Amsterdam, Amsterdam, Netherlands
- 6Horaizon BV, Delft, Netherlands
- 7Department of Surgery, University of Bonn, Bonn, Germany
Background and aims: Rheumatoid arthritis (RA) patients are currently treated with biological agents mostly aimed at cytokine blockade, such as tumor necrosis factor-alpha (TNFα). Currently, there are no biomarkers to predict therapy response to these agents. Here, we aimed to predict response to adalimumab (ADA) treatment in RA patients using DNA methylation in peripheral blood (PBL).
Methods: DNA methylation profiling on whole peripheral blood from 92 RA patients before the start of ADA treatment was determined using Illumina HumanMethylationEPIC BeadChip array. After 6 months, treatment response was assessed according to the European Alliance of Associations for Rheumatology (EULAR) criteria for disease activity. Patients were classified as responders (Disease Activity Score in 28 Joints (DAS28) < 3.2 or decrease of 1.2 points) or as non-responders (DAS28 > 5.1 or decrease of less than 0.6 points). Machine learning models were built through stability-selected gradient boosting to predict response prior to ADA treatment with predictor DNA methylation markers.
Results: Of the 94 RA patients, we classified 49 and 43 patients as responders and non-responders, respectively. We were capable of differentiating responders from non-responders with a high performance (area under the curve (AUC) 0.76) using a panel of 27 CpGs. These classifier CpGs are annotated to genes involved in immunological and pathophysiological pathways related to RA such as T-cell signaling, B-cell pathology, and angiogenesis.
Conclusion: Our findings indicate that the DNA methylome of PBL provides discriminative capabilities in discerning responders and non-responders to ADA treatment and may therefore serve as a tool for therapy prediction.
1 Introduction
Rheumatoid arthritis (RA) is an autoimmune disorder characterized primarily by pain and inflammation of the joints. The etiology of RA is not fully elucidated; however, it is known to occur in genetically predisposed patients and is triggered by environmental factors, such as smoking (1). Current treatments for RA are divided into conventional disease-modifying anti-rheumatic drugs (csDMARDs), such as methotrexate, or biological DMARDs (bDMARDs), such as tumor necrosis factor-alpha (TNFα) inhibitors (infliximab, adalimumab, or etanercept), costimulation modifiers (abatacept), interleukin-6 inhibitors (tocilizumab), and B cell-depleting drugs (rituximab) (2) or target synthetic DMARDs (tsDMARDs), such as Janus kinase (JAK) inhibitors (3). Adalimumab (ADA) is a human recombinant IgG1 monoclonal antibody that binds to soluble and membrane-bound TNFα and is utilized as therapy for RA treatment and other immune-mediated diseases (IMIDs) such as axial spondyloarthritis and inflammatory bowel disease (4).
The efficacy and safety of ADA in RA patients have been established by multiple clinical trials and usage in the clinical practice, with approximately 60%–70% of ADA-treated patients exhibiting response as indicated by the Disease Activity Score in 28 Joints (DAS28) using erythrocyte sedimentation rate (ESR) at weeks 12 and 24 and/or presence of radiological progression (5, 6). Although ADA, among other TNF inhibitors, has improved the treatment of RA, patients discontinue ADA due to a lack of response or the development of adverse events (4, 7).
Common practice involves shifting to an alternative treatment regimen by initiating treatment with a different biological upon inadequate therapy response (3). Expectedly, this procedure is very inefficient and debilitating, as it can result in the patient’s progression toward uncontrolled disease, ultimately causing irreversible joint damage (5). Hence, there is an unmet need to predict response to treatment, as no clinically validated biomarkers currently exist (8). So far, several studies have sought to identify prognostic biomarkers in RA patients that predict treatment outcomes by interrogating the genetic polymorphisms (3, 9–12), microRNAs (13), and basic TNFα levels (3, 12). An increasing body of evidence suggests that epigenetic alterations, such as aberrant DNA methylation, are involved in the pathogenesis of inflammatory conditions such as in RA (14–17). DNA methylation occurs when a methyl group binds to a cytosine–phosphate–guanosine (CpG) dinucleotide. DNA methylation is a molecular mechanism that can affect gene transcription, especially seen in hypo- or hypermethylation of gene promotors, of which the majority reside within CpG-rich regions called CpG islands (18, 19). Complex immune-mediated diseases such as RA are thought to manifest in a genetically susceptible host, which manifests into dysregulated inflammatory processes in combination with the environment through epigenetic mechanisms (20–22). Furthermore, differentially methylated patterns have been reported in peripheral mononuclear blood cells, fibroblast-like synoviocytes, and synovial T cells of RA patients (15, 20, 23). DNA methylation in peripheral blood or methylome has therefore been proposed as a biomarker tool to predict therapy response in RA patients (24). Different studies investigated the association of the DNA methylome with response to methotrexate in RA patients (25–31). DNA methylation signatures in peripheral blood associated with response to anti-TNFα therapy (ADA, etanercept, infliximab, and golimumab) have been reported by Plant et al. (32), Julia et al. (33), and Tao et al. (34).
Here, we performed an exploratory epigenome-wide association study (EWAS) on whole peripheral blood (PBL) of RA patients who were scheduled to start ADA treatment where we explored whether a response to ADA could be predicted a priori. Through stability selection gradient boosting (35), we identified a 27-CpG classification model that was capable of predicting response before starting treatment.
2 Methods
2.1 Study design and response assessment
A retrospective cohort was assembled consisting of adult RA patients followed up between 2004 and 2018 who were scheduled to start ADA treatment at Reade, Expertise Center for Rehabilitation and Rheumatology, in Amsterdam, the Netherlands. Whole PBL was collected before the start of treatment whereupon patients were followed up as part of routine clinical care. A second visit was scheduled 3 to 6 months into treatment where therapy response was assessed based on the DAS28 score. The DAS28 is a clinical scoring tool on a 1–10-point scale that scores the swollen and/or painful joints together with ESR or C-reactive protein (CRP) levels and visual analog scale (VAS) disease activity of the patient, allowing for both clinical and biochemical response to be measured (36). A decrease of at least 1.2 points and/or a disease activity of less than 3.2 points was defined as response to therapy (Table 1). The assembly of this cohort was approved by the local Medical Ethics Committee of Slotervaart Hospital and Reade (NTR6868), and written informed consent was obtained from all patients prior to sampling.
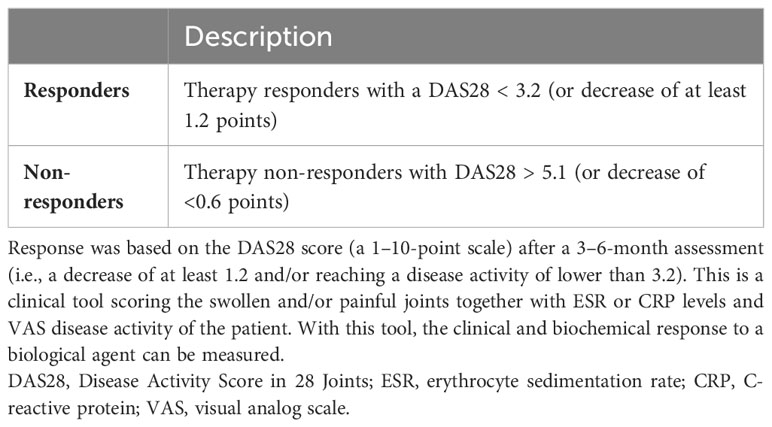
Table 1 Therapy response criteria.
2.2 Sample collection, DNA isolation, and whole-genome DNA methylation profiling
PBL samples were collected prior to the start of ADA treatment in 6.0 mL BD EDTA vacutainer tubes and stored at −80°C. PBL samples were thawed, and genomic DNA (gDNA) was extracted using the QIAsympony (Qiagen, Valencia, CA, USA) at the Department of Human Genetics, Amsterdam UMC, according to manufacturer protocol. The FLUOstar OMEGA was used for assessing the quantity of the DNA. The gDNA (750 ng) was then randomly distributed across the plate to limit potential batch effects, after which gDNA was subjected to bisulfite conversion using the Zymo EZ DNA Methylation™ kit according to the manufacturer’s protocol, and the DNA was hybridized onto the Illumina HumanMethylationEPIC BeadChip array for whole-genome DNA methylation profiling (37).
2.3 DNA methylation data analysis
Data were analyzed following the pipeline previously published by de Krijger et al. (38). In brief, raw DNA methylation data were imported into R (version 4.2.0) using the Bioconductor package minfi (version 1.44) (39), followed by functional normalization (40) and quality control using the shinyMethyl package (version 1.34) (41). Probes that hybridized to allosomes were excluded from the analysis. Gaphunter was utilized to identify potential genetic variants by harnessing the bi- or triclustered pattern often presented by genetic variants by setting the threshold to 0.3 (42). M-values were used for statistical analysis and percentage methylation for visualization (43). Subsequent differential methylation analyses were performed through generalized linear regression analysis using the limma package (version 3.54) (44) where age, sex, concomitant methotrexate use, and smoking were adjusted to investigate whether these confounders affected the prediction algorithm. The ChAMP package (version 2.28) (45) was subsequently used for gene set enrichment analysis (GSEA). Visualizations were put together in ggplot (version 3.4) (46). CpGs of interest were annotated to genes according to the Illumina platform as well as based on their presence within a range of 20.000 from the nearest gene. For the hypothesis-driven approach, we sought to understand whether RA-associated differentially methylated genes also displayed ADA response-associated differences. To this end, we identified all CpGs annotated to the RA-associated genes— CXCL12, DLGAP2, IL6, IL10, PRSS16, and STAT3— which represent genes that were found to be RA-associated at the level of DNA methylation in a review by Ciechomska et al. (14). A summary p-value was calculated per gene by aggregating the p-values using the Brown method (47), a method often used in meta-analyses. Visualizations were generated using ggplot (version 3.4) (46) and ggbio (version 1.46.0) (48).
2.4 Blood cell estimation
The blood cell distribution was estimated from the DNA methylation data using the estimateCellCounts2 function from FlowSorted.Blood.EPIC (version 1.12.1) package (49) against the IDOL dataset (49), which contains DNA methylation profiles from B, CD4T, CD8T, monocytes, neutrophils, and NK cells. A quadratic programming approach was employed to predict the cellular composition per sample, and a two-way ANOVA test was conducted to statistically compare differences between groups.
2.5 Stability-selected gradient boosting analysis
To identify DNA methylation markers that classify therapy responders from non-responders before the start of treatment, extreme gradient boosting analysis with feature selection was used (38). This methodology was reported by de Krijger et al. (38). The data were split into a 70% training set and a 30% testing set. The classifier was trained through repeated cross-validation on the training set, where the performance was evaluated on the withheld test set. For optimization purposes, the area under the receiver operating characteristic (AUROC) scores were calculated for each repetition of the cross-validation and averaged for the final test AUROC. To select the most predictive CpGs, during each training fold, a random noise variable was introduced into the model. All features whose calculated feature importance exceeded the random variable were retained, whereas the features that scored less than the random variable were discarded. The resultant trees (n = 100), each containing its own set of ranked CpG markers according to relative importance, were then combined using pairwise permutation analysis (35).
2.6 Statistical analysis of clinical variables
Baseline characteristics of all included patients were summarized using descriptive statistics (Table 2). Categorical variables are presented as percentages and continuous variables as mean or median annotated with the standard deviation (SD) or interquartile range (IQR), respectively. Differences in distribution between responders, non-responders, and the different cohorts were assessed using a chi-square test (categorical variables), independent samples t-test, or the Mann–Whitney U (continuous variables). Two-tailed probabilities were used with a p-value of ≤0.05 considered statistically significant. Analyses of clinical data were performed in IBM SPSS statistics (version 26).
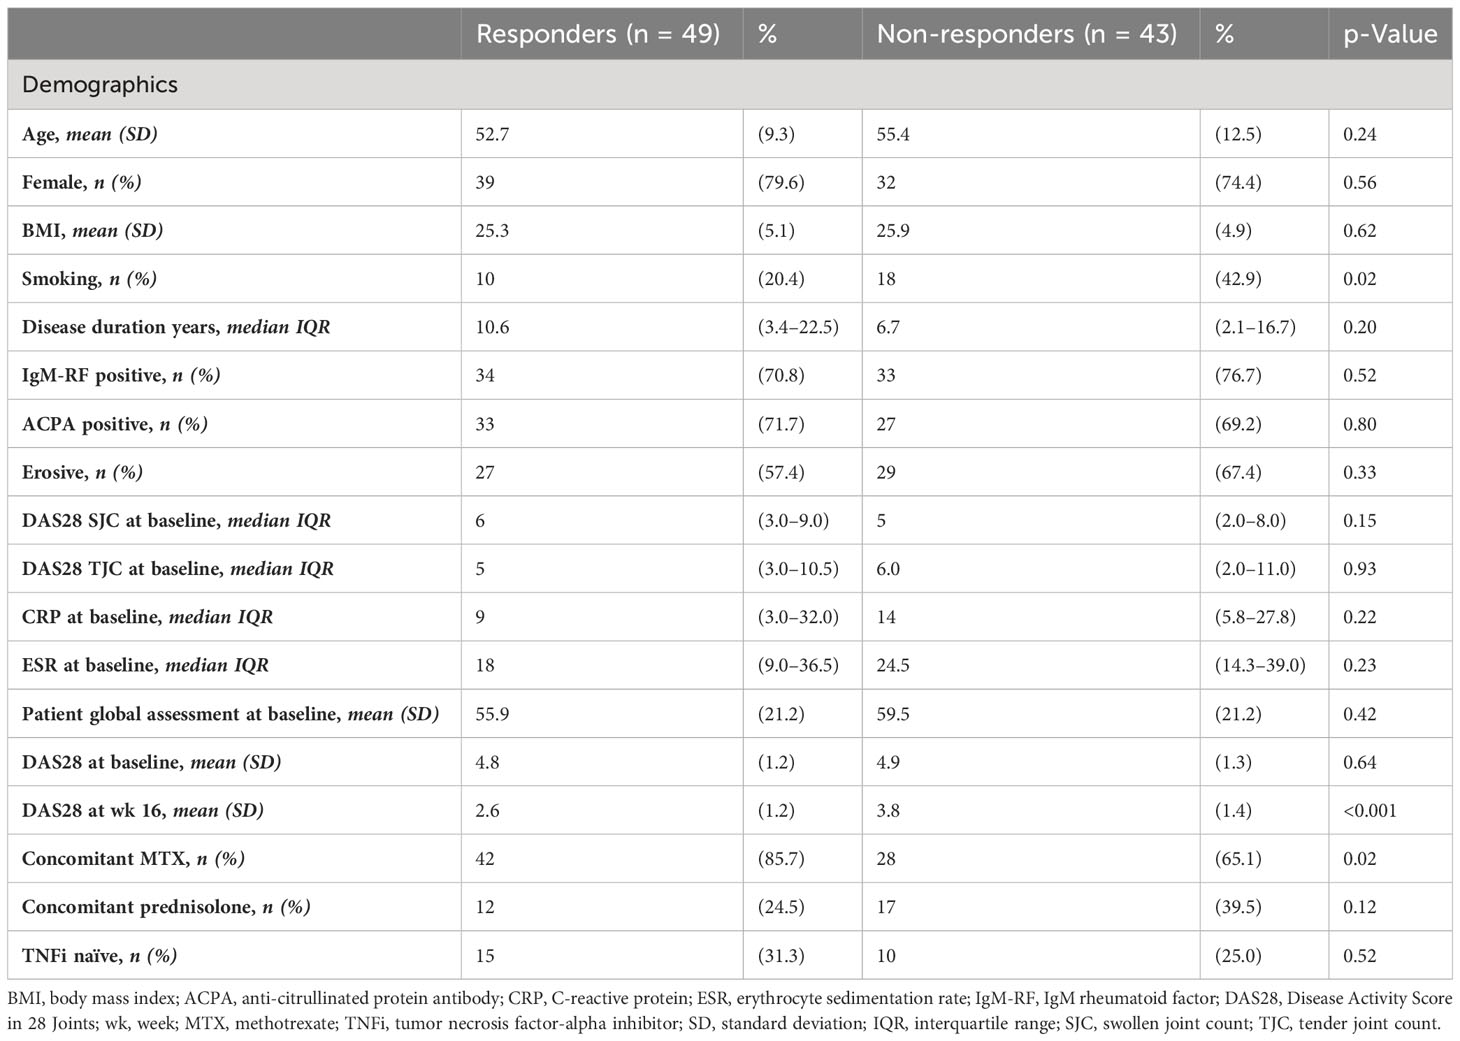
Table 2 Baseline characteristics of the patients.
3 Results
3.1 Study population
The demographic and disease characteristics of patients are summarized in Table 2. A total of 92 RA patients were retrospectively included, from which whole PBL was stored before the start of ADA treatment. Patients were categorized as therapy responders (R) or non-responders (NR) based on the criteria described in Table 1, which yielded 49 and 43 responders and non-responders, respectively. At baseline, clinical (age (p = 0.24), sex (p = 0.56), and body mass index (BMI) (p = 0.62)), disease (IgM-RF positive (p = 0.80), erosive phenotype (p = 0.33), or disease activity-related (CRP (p = 0.22) and DAS28 (p = 0.64)) parameters differed significantly between responders and non-responders. By contrast, non-responders had significantly more smokers (p = 0.02) and, expectedly, higher DAS28 at week 16 (p < 0.001). Furthermore, a higher percentage of the responders had concomitant methotrexate (MTX) use in addition to ADA (p = 0.002).
3.2 Exploratory data analyses
We first explored whether response to treatment was visible at an epigenome-wide level. Principal component (PC) analysis of the DNA methylome indicated no global differences between R and NR (Figure 1). Since we observed previously that significant differences existed in concomitant MTX use and smoking behavior at the time of sampling (Table 2), we assessed both by principal component analysis (PCA). Again, we detected no clustering according to the aforementioned confounders (Supplementary Figure 1). Since peripheral blood is composed of multiple different cell types, each of which has its own DNA methylation profile (50), we estimated the various cellular proportions and investigated whether differences were observable between responders and non-responders (Figure 2). There were no significant differences in the estimated cellular composition between R and NR with regard to the estimated B, CD4 T, CD8 T, monocytes, neutrophils, and NK populations.
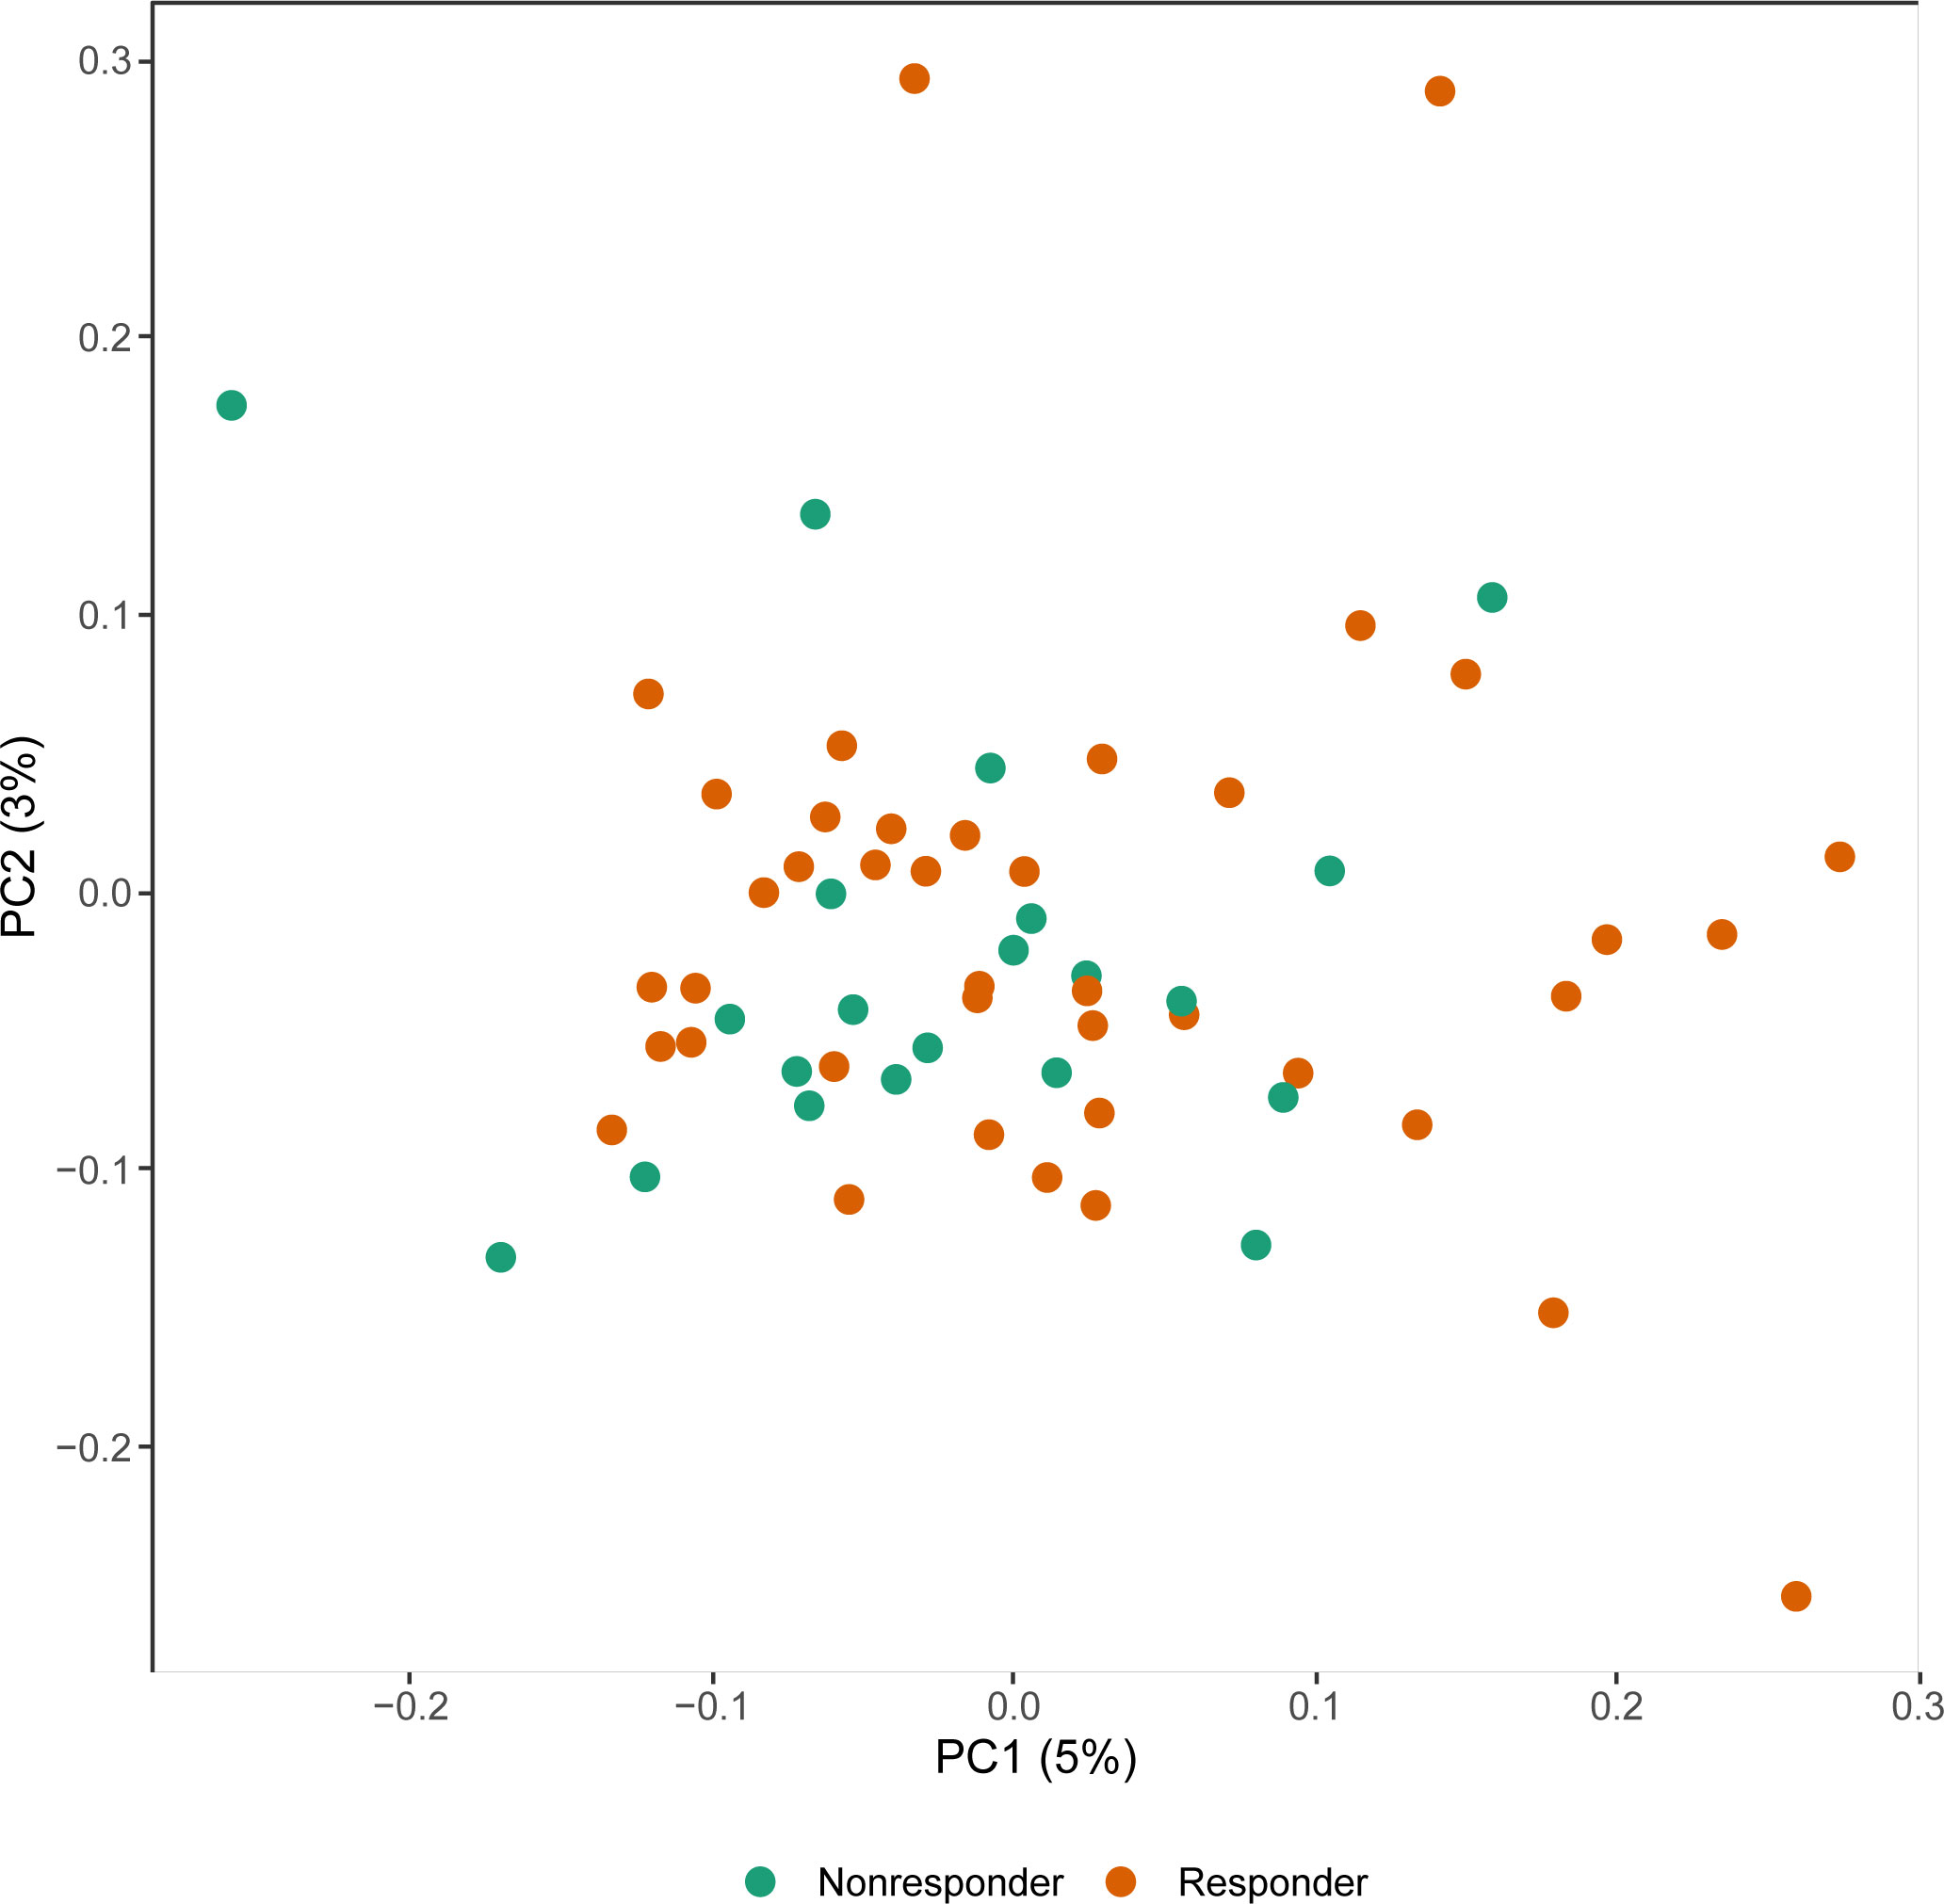
Figure 1 Principal component (PC) analysis of the methylome of rheumatoid arthritis (RA) therapy responders (orange) versus non-responders (green).
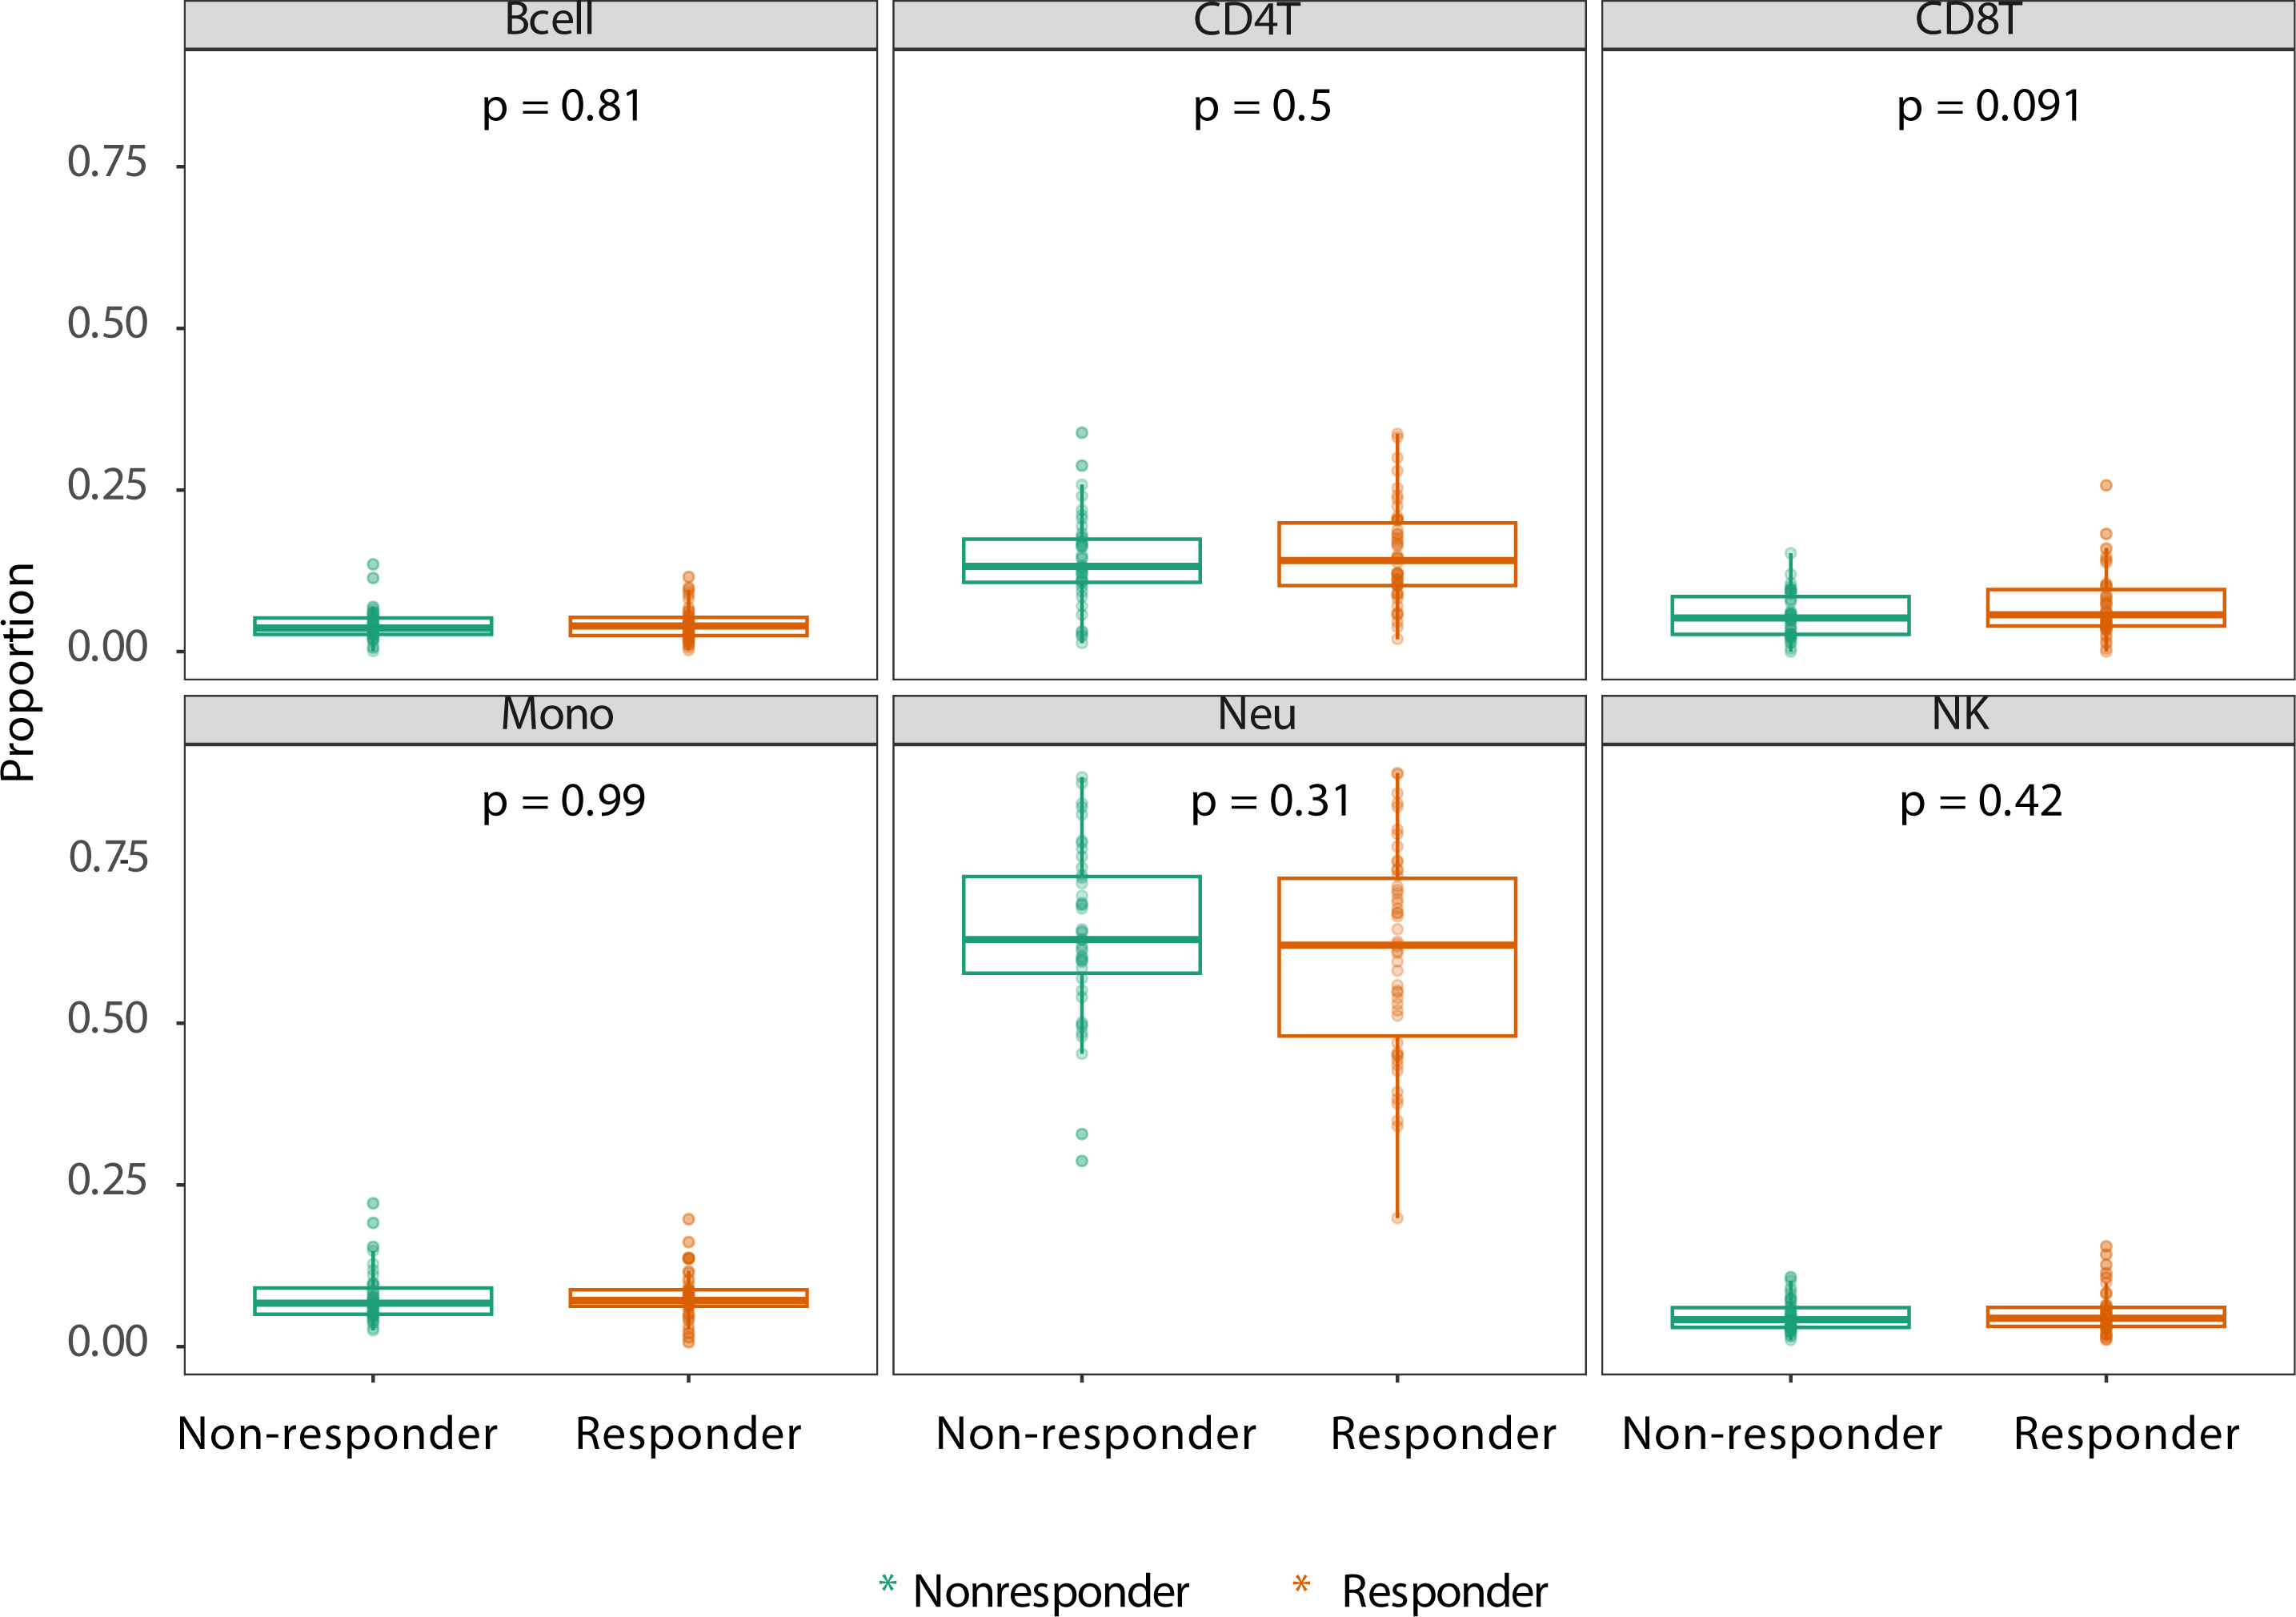
Figure 2 Estimated cell proportions as derived from Houseman algorithm cell mixture deconvolution from DNA methylation data of rheumatoid arthritis (RA) patients on adalimumab (ADA) treatment who are therapy responders (orange) and non-responders (green). The x-axis of each box illustrates the difference between RA responders and non-responders. p-Values are calculated using ANOVA testing. The y-axis demonstrates the proportion of reported cell type.
3.3 Stability-selected gradient boosting predicts objective response to adalimumab
To establish a prognostic predictive model of ADA response, we split the data into a 70% training and a 30% test set. We conducted stability-selected gradient boosting on the training data to define a prediction model that we subsequently validated against the test set. We observed that our best-performing classification model was capable of predicting prognostic response to therapy as evidenced by an AUROC of 0.76 (Figure 3A, Table 3). This classification model was composed of 27 CpGs (Figures 3B, C). Given the potential confounding by concomitant MTX use and smoking, we subsequently conducted a linear regression analysis on these 27 CpGs where we included concomitant MTX use, smoking, and sex and age as covariates (Supplementary File 1). Of the 27 CpGs, 20 presented p-values below 0.05, implying association with ADA response independent of concomitant MTX use and smoker behavior. Focusing on all 27 predictor CpGs, we found that hierarchical clustering of all samples did not show response-associated clustering, suggesting that the predictor probes were non-linearly associated with response (Figure 4A). Annotating all 27 CpGs, we found that 23 annotated to genes. Further interrogation of the 23 gene-bound CpGs indicated that response-associated hypermethylation was observed in the predictor CpGs annotated to genes ADAP1, MRPL28, GNA12, UBTD1, OLIG2, CCDC74A, RPH3AL, PRSS16, MIR3143, H2BC12, DMXL2, FBN1, and ADARB2. By contrast, response-associated hypomethylation was observed for TARS, GSTM5, KIF19, PPP4R2, PSMD5, FRMDA4A, KDR, CD180, MAST4, and SALL3. Interestingly, we identified multiple predictor CpGs within genes PRSS16 (Figure 4B) and DLGAP2 (Figure 4C). Overall, we observed that PRSS16 showed response-associated hypermethylation in the transcription start site (TSS), which is where the two predictor CpGs (cg10279314 and cg09817162) were located. By contrast, DLGAP2 demonstrated a more heterogeneous differential methylation pattern with hypomethylation near the TSS, which is where the two predictor CpGs (cg20088245 and cg03128011) were found, whereas the region of the gene downstream of the first exon (gene body) demonstrated a more dispersed differential methylated pattern. To understand the biological properties of our reported predictor CpGs, we performed GSEA to gain insight into the biological relevance of our reported predictor CpGs (Supplementary Figure 2). GSEA identified 83 significantly enriched processes (p < 0.05), with noteworthy hits related to immunological pathways such as “macrophage-enriched metabolic network” (1,075 genes), “immune (humoral) and inflammatory response” (504 genes), and “T-lymphocyte progenitors reprogrammed to natural killer cells” (276 genes) (Supplementary Figure 2, Supplementary Table 1).
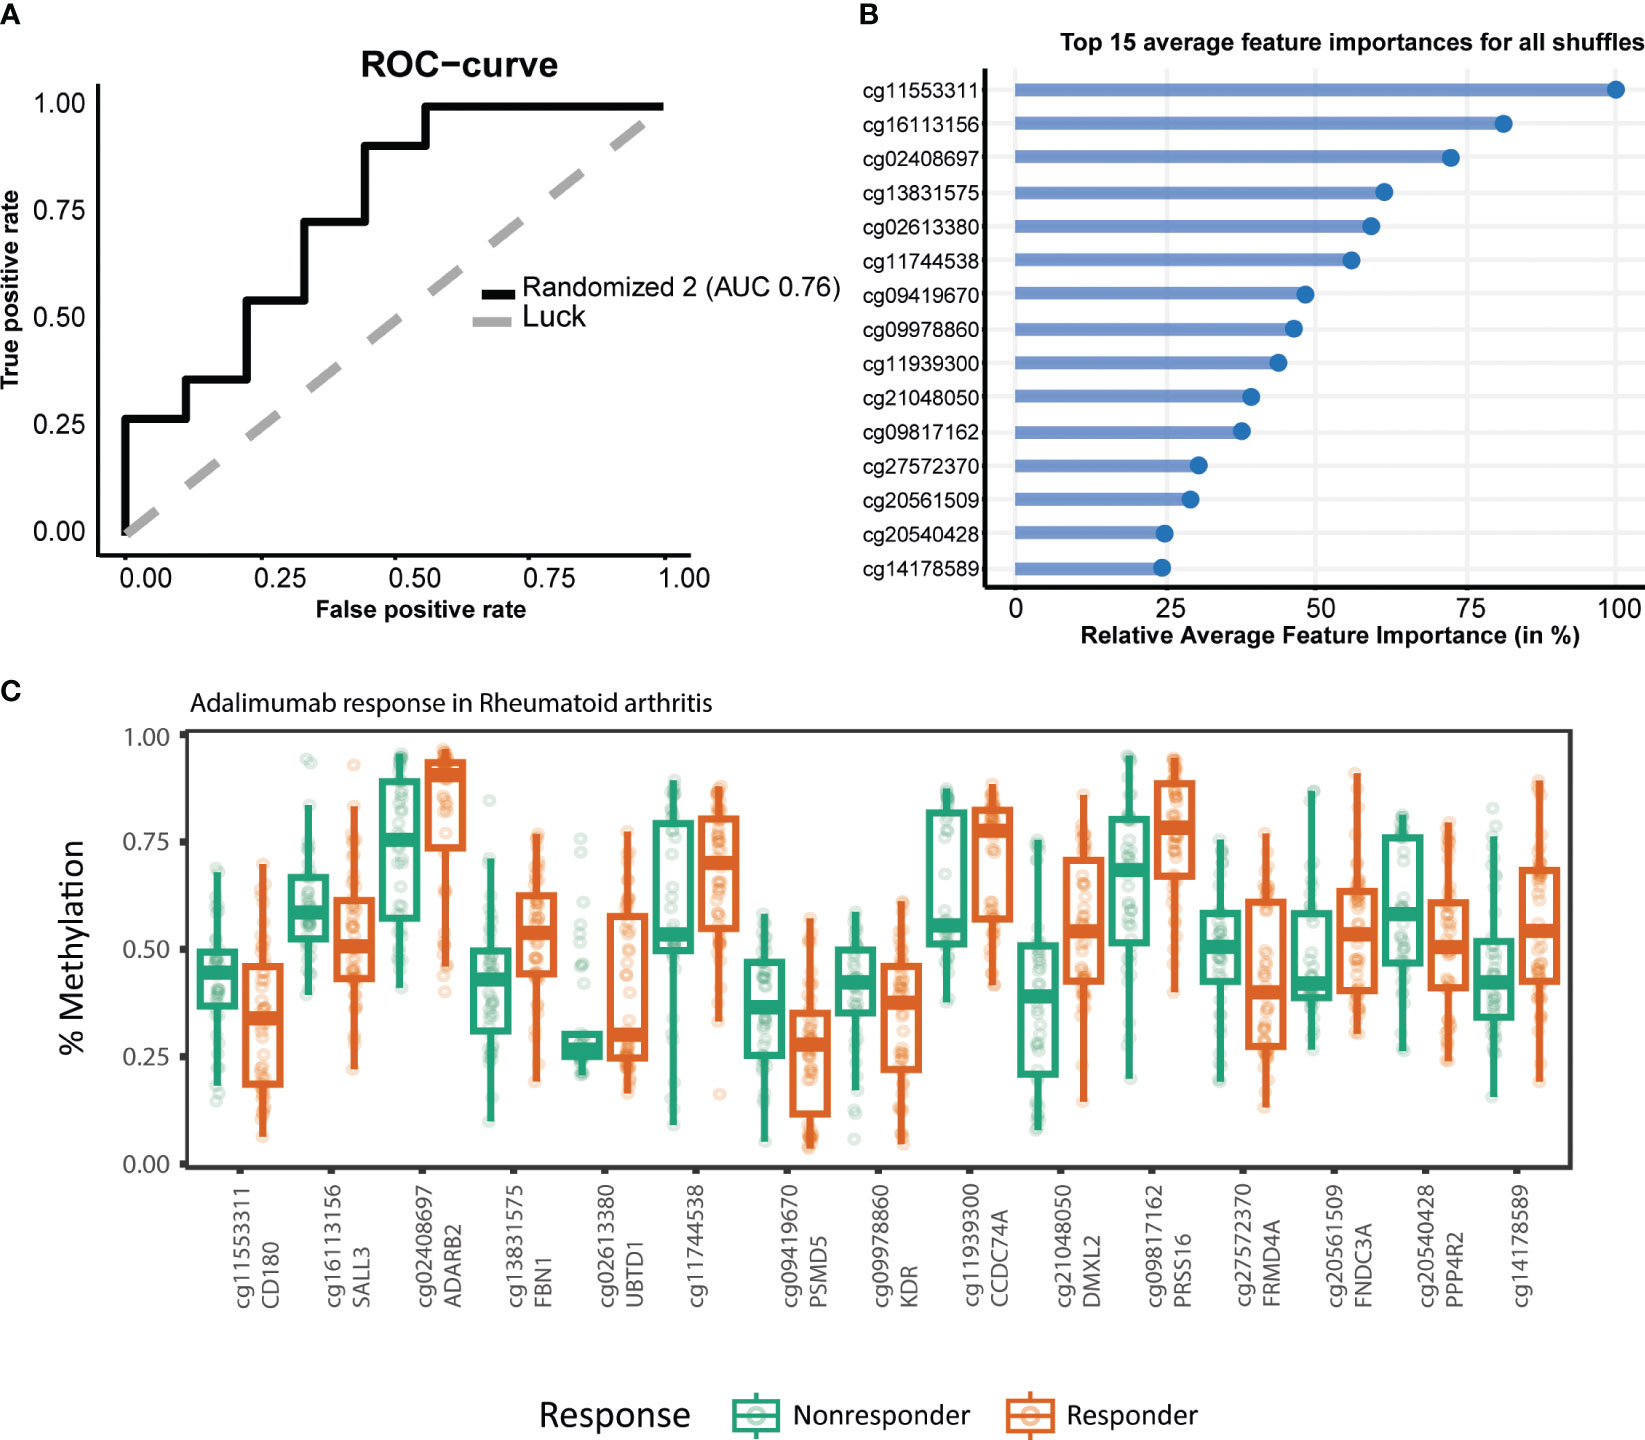
Figure 3 Stability-selected gradient boosting analysis performance of rheumatoid arthritis (RA) adalimumab (ADA) response prediction. (A) Receiver operating characteristic curve demonstrating an accuracy of 0.76 on the test set. The top 15 predictor CpGs visualized using (B) feature importance and (C) % methylation grouped by response.
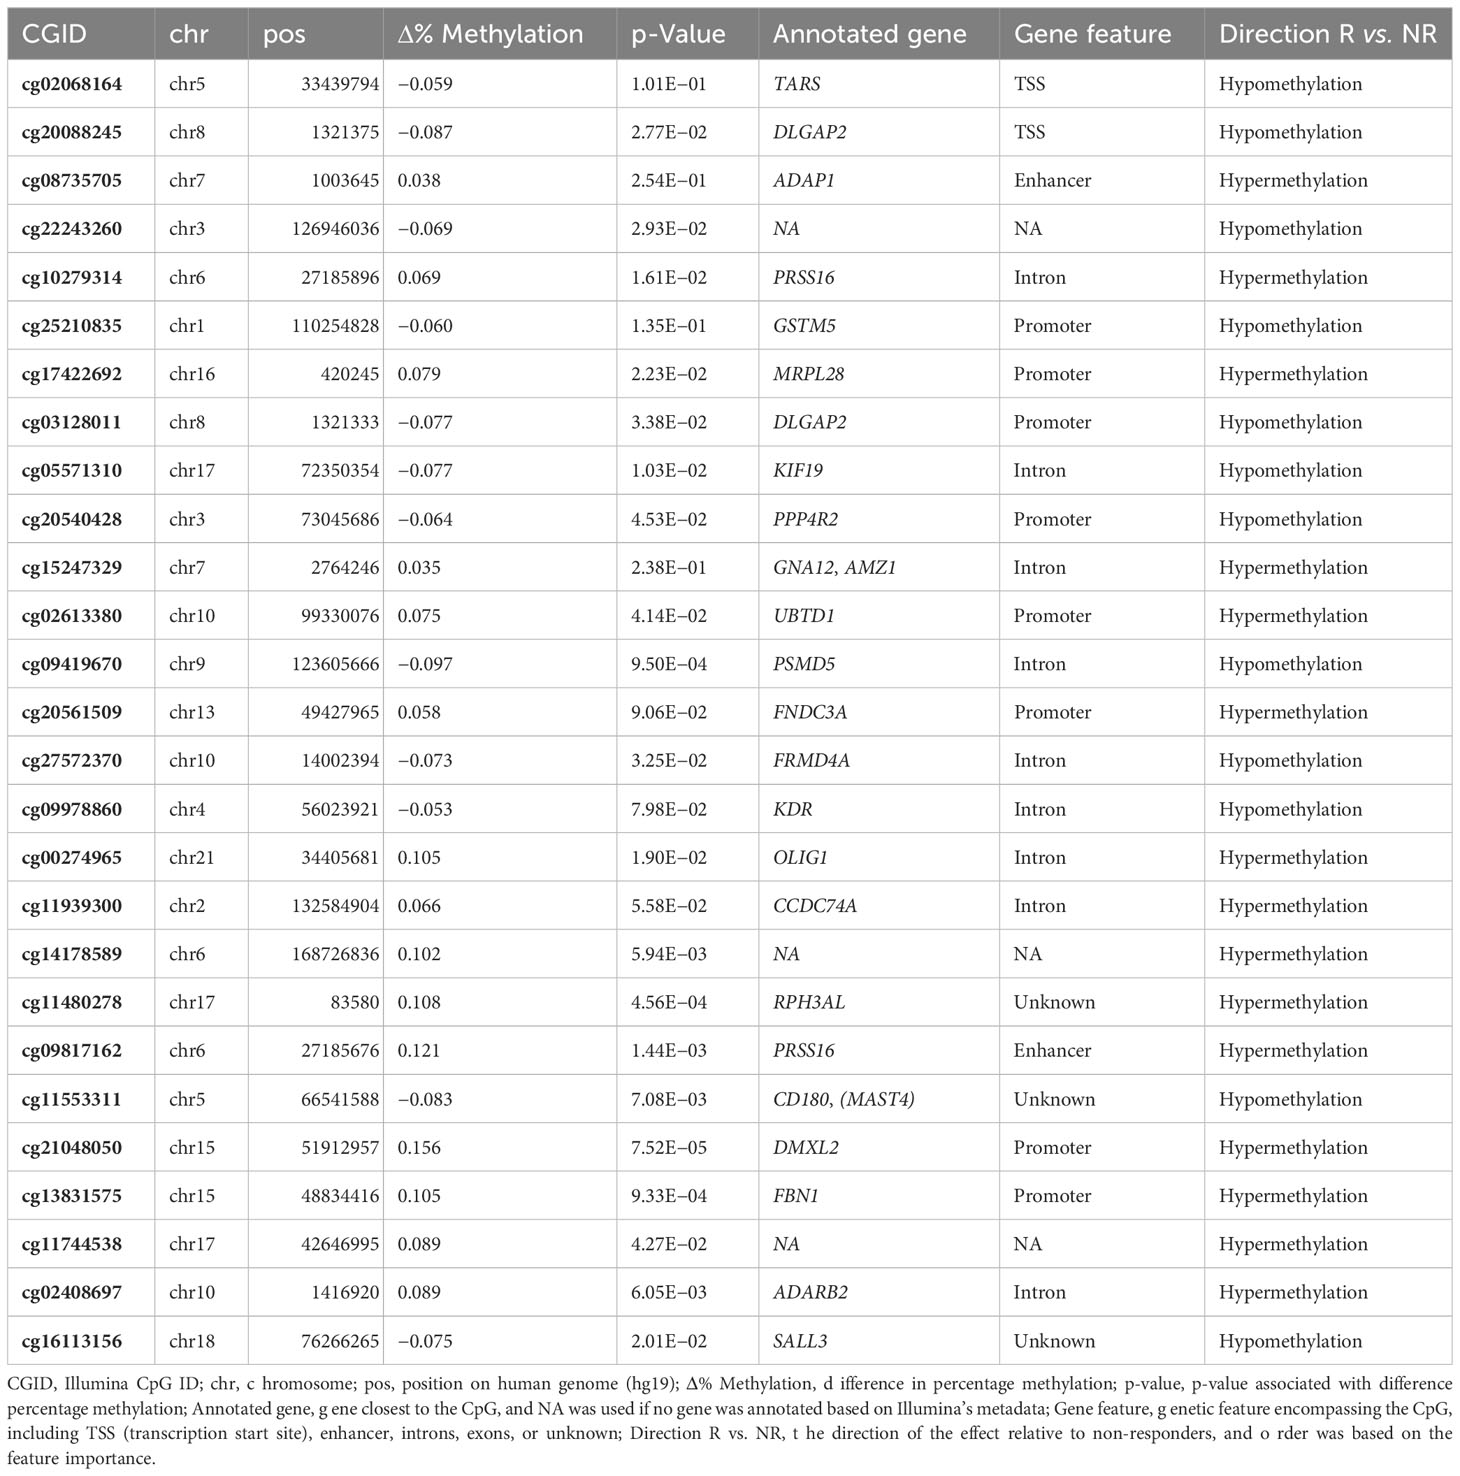
Table 3 The 27 predictor CpG capable of distinguishing responders and non-responders.
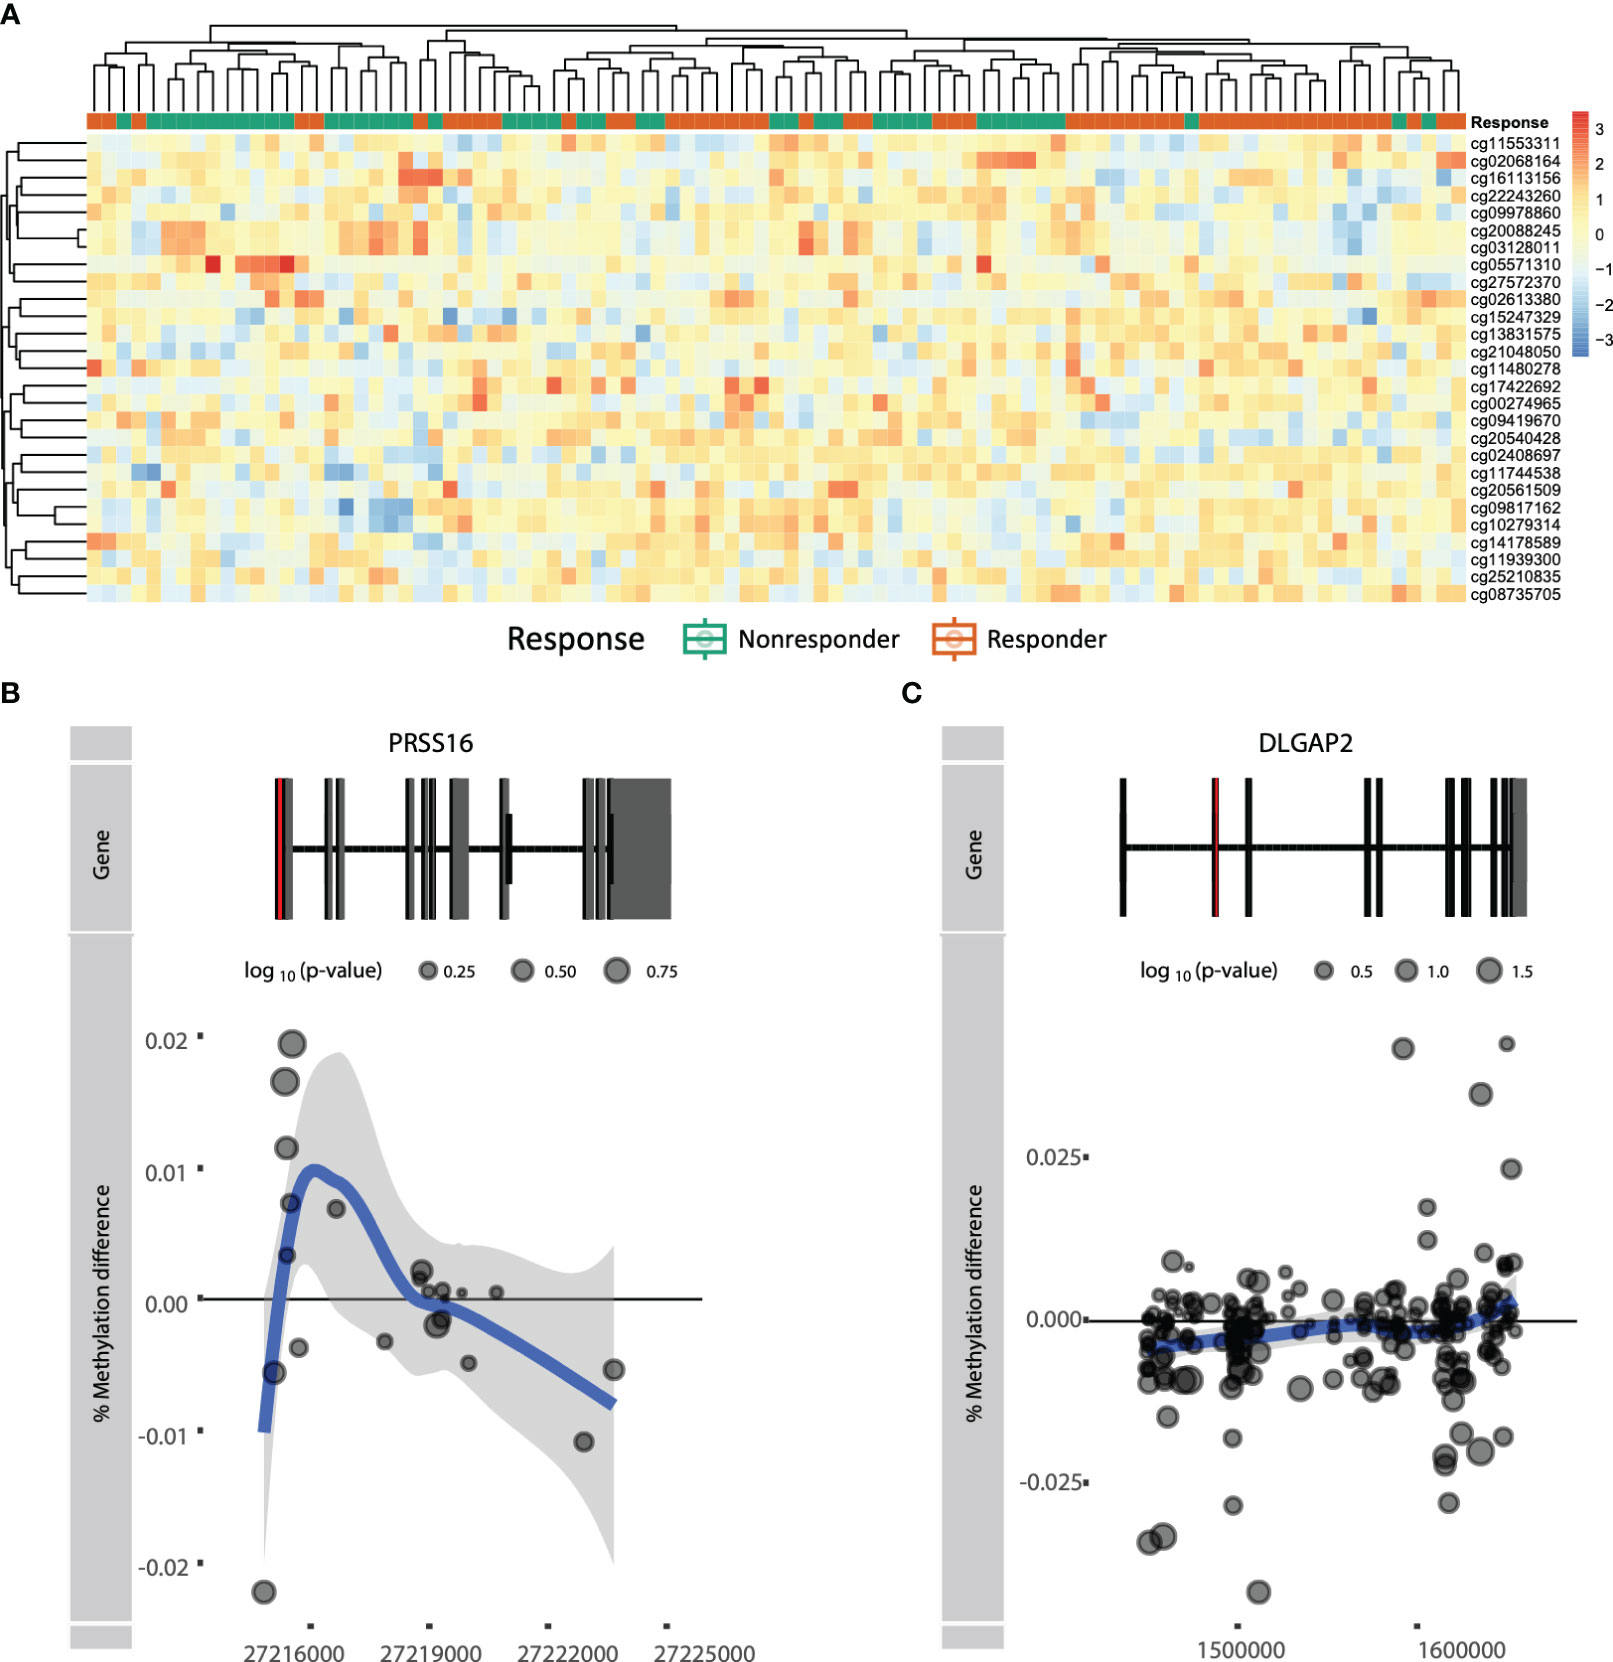
Figure 4 (A) Heatmap of actual methylation of the nominally significant predictor CpGs. Columns are sorted by hierarchical clustering and are colored by the response group: responders (orange) and non-responders (green). Visualization of genes (B) PRSS16 and (C) DLGAP2 by plotting the difference in mean % methylation on the y-axis relative to the position on the chromosome and the gene (“Gene”) on the x-axis. Dots represent probes on the Illumina HumanMethylationEPIC BeadChip array. The blue trend line represents the loess-smoothed average across all methylation probes for the indicated region with surrounding gray area representing the standard error. The first exon of the gene is represented in red.
3.4 Rheumatoid arthritis-associated differentially methylated genes also present response-associated differences in DNA methylation
We next investigated whether genes identified in previous RA DNA methylation studies displayed response-associated differential methylation as well. To this end, we exercised a hypothesis-driven approach where we examined the methylation status of previously reported genes described in STAT3, CXCL12, IL10, and IL6, as discussed in the review by Ciechomska et al. (14, 15). It was found that STAT3, CXCL12, and IL6 were hypomethylated in RA patients relative to non-RA individuals and that IL10 was hypermethylated (14). Interrogating these genes within the context of response to ADA revealed that CXCL12 and IL10 displayed hypomethylation in the TSS, whereas hypermethylation was seen within the gene body of both genes (Figures 5A, D). By contrast, IL6 presented hypomethylation within the gene body and in the intragenic region, but hypermethylation near the TSS (Figure 5B). Notably, STAT3 showed no distinct methylation pattern (Figure 5C).
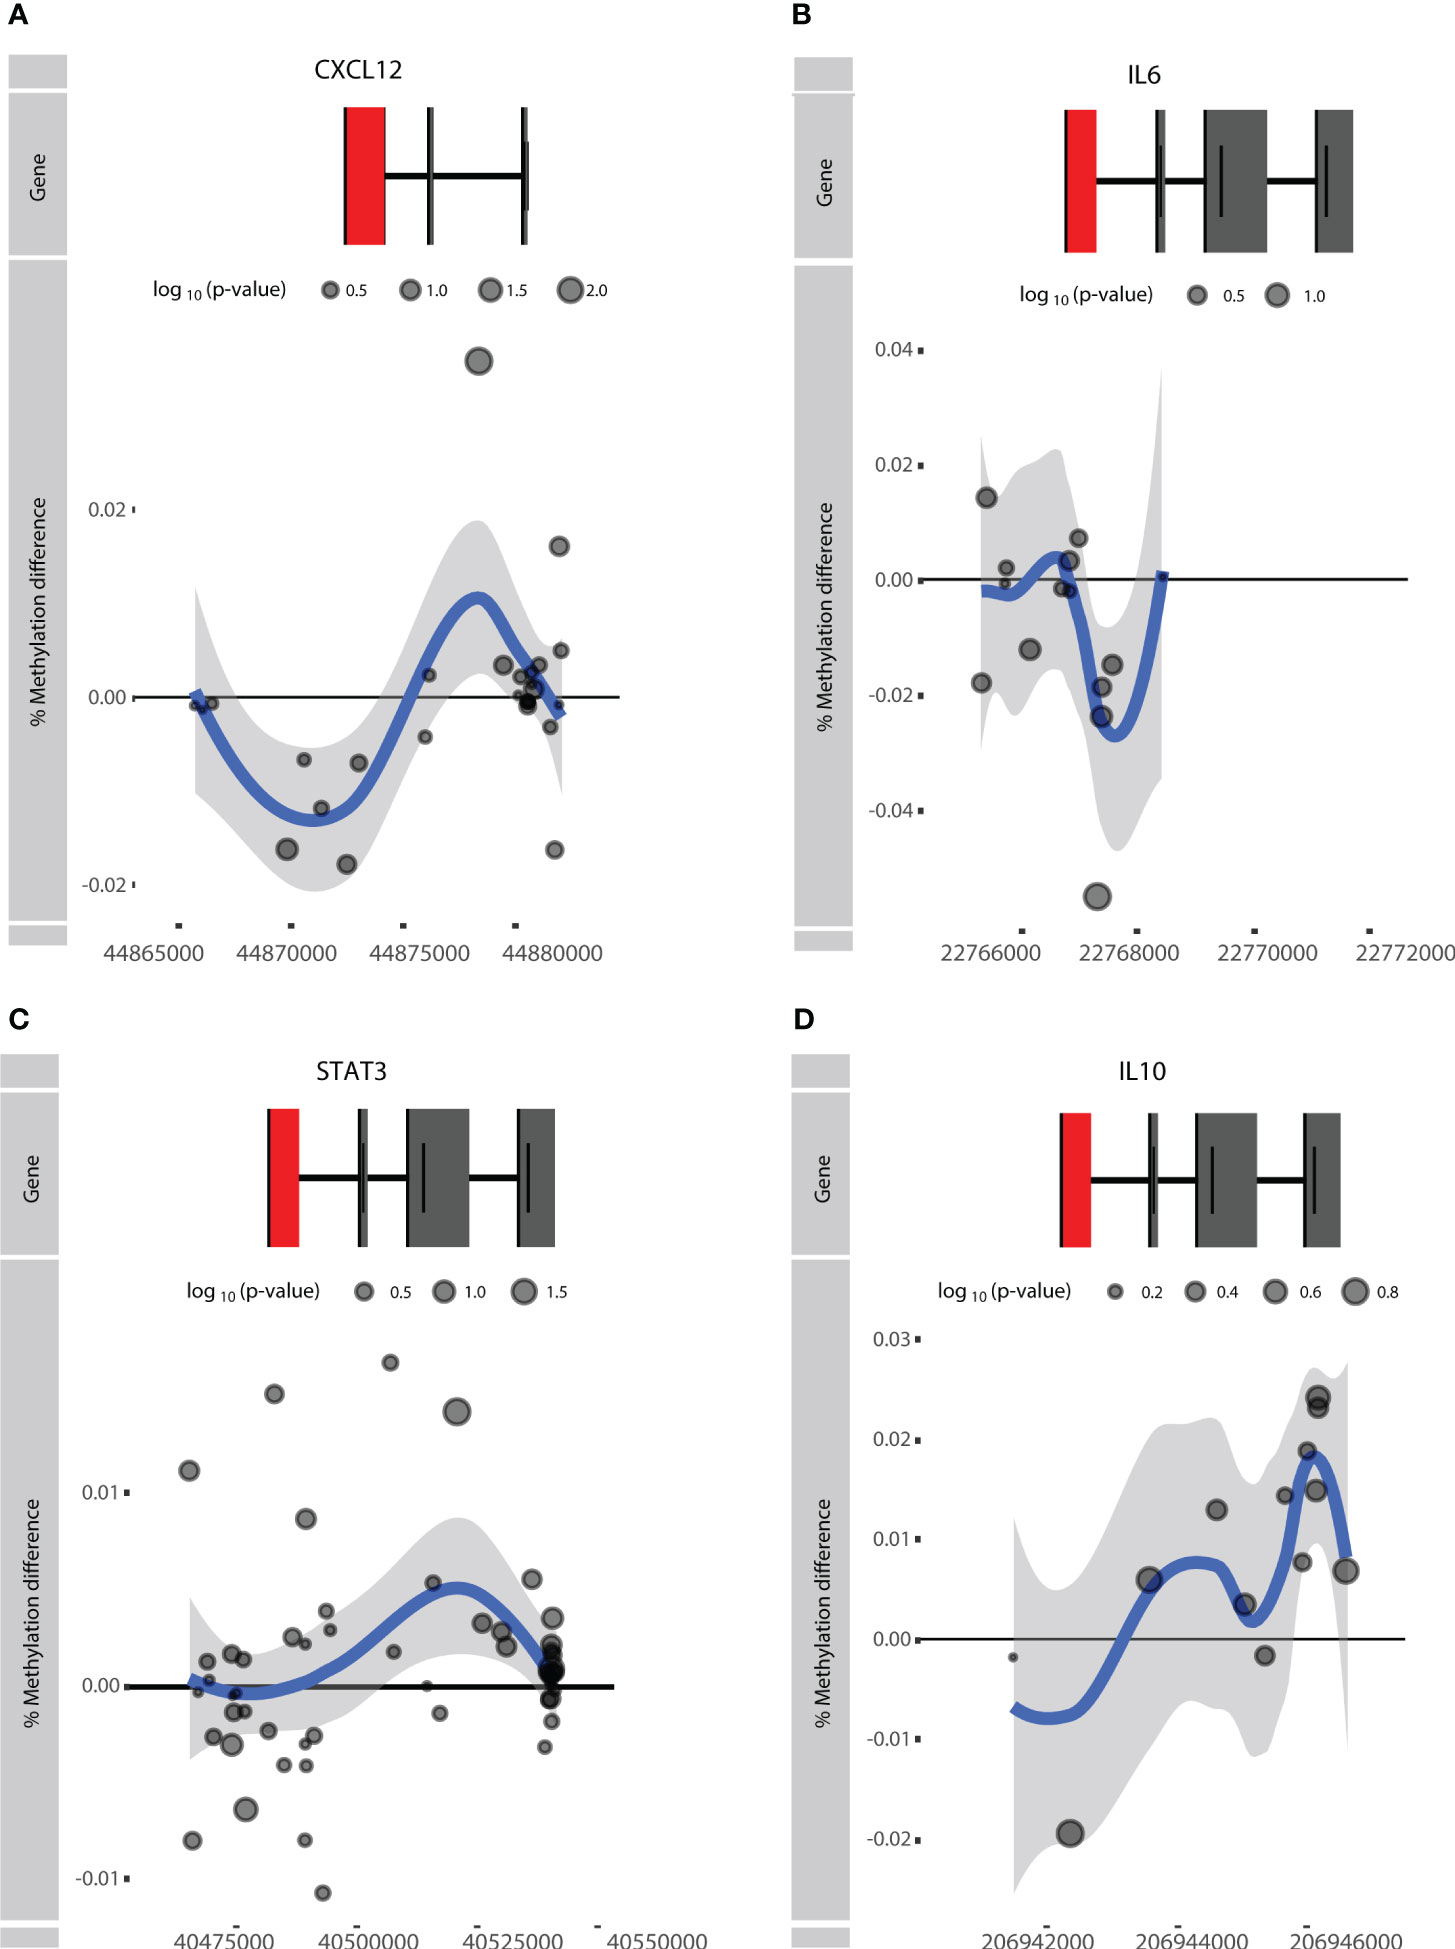
Figure 5 Visualization of the rheumatoid arthritis (RA)-associated genes (A) CXCL12, (B) IL6, (C) STAT3, and (D) IL10. Difference in % methylation is plotted on the y-axis relative to the position on the chromosome and the gene (“Gene”) on the x-axis. Dots represent probes on the Illumina HumanMethylationEPIC BeadChip array. The blue trend line represents the loess-smoothed average across all methylation probes for the indicated region with surrounding gray area representing the standard error. The first exon of the gene is represented in red.
4 Discussion
This study aimed to identify CpGs whose DNA methylation level was capable of predicting response to ADA therapy in RA patients prior to the start of treatment. Response to therapy was defined based on the DAS28 score assessed over a treatment period of 3 to 6 months (36). Through supervised stability-selected extreme gradient boosting, we were able to identify 27 CpGs whose DNA methylation collectively predicted response to therapy. Several of the predictor CpGs were annotated to genes that had previously been implicated in RA or general inflammatory processes, with a particular focus on T-cell biology. This corroborates observations made by Bek et al., where genetic variants associated with anti-TNFi response were found to map to genes involved in T-cell function (9). Multiple predictor CpGs were identified in PRSS16 and DLGAP2. PRSS16 is a gene whose protein is associated with gout, a form of inflammatory arthritis. PRSS16 mutations have been characterized by monosodium urate deposition that leads to inflammasome and subsequent cytokine production (51). PRSS16 maps to the extended HLA class I region (52). Moreover, PRSS16 is highly expressed in the cortex of the thymus and is proposed to be involved with T-cell development in the thymus, in particular the positive selection of T cells (53). Notably, cortical thymic epithelial cells contribute to the positive selection of T cells via antigen presentation. Interestingly, when aberrant positive selection occurs, autoimmunity is found in mouse models (54). Taken together, PRSS16 is proposed as a candidate gene for auto-inflammatory diseases. DLGAP2 encodes a membrane-associated protein that has been implicated in neuronal cells (55). While Dlgap2 has been implicated as being differentially methylated in both aging and osteoarthritis in mice (56), no further link with ADA or RA can be identified in the literature. Other genes that were found to harbor predictor CpGs included TARS, KDR/VEGFR2, and CD180. TARS encodes a threonyl-tRNA synthetase implicating a role in amino acid processing. Despite their household role, several CpGs within the genes were found to be differentially methylated between RA patients and non-RA individuals (17). KDR/VEGFR2 encodes vascular endothelial growth factor receptor 2 (VEGFR2), a receptor to VEGF. VEGF is responsible for endothelial activation, endothelial growth, and angiogenesis (57), where angiogenesis is one of the key pathways for the synovial tissue expansion in RA and is accompanied by a sustained inflammatory process in the synovial tissue characterized by proinflammatory cytokines and upregulated levels of VEGF in synovial tissue (57, 58). Accordingly, targeting angiogenesis in RA has been proposed as a treatment strategy for RA (1). CD180 encodes cluster of differentiation 180, a toll-like receptor homologue expressed mainly on B cells. Differential expression of CD180 was associated with other rheumatic diseases (59), such as systemic sclerosis (60), systemic lupus erythematosus (61), and Sjögren’s syndrome (62). While such a difference in either protein or gene expression of CD180 has not been reported for RA thus far, it stands to reason that CD180 might play a role in RA and its response to ADA.
The main strengths of our study lie in the strict patient selection criteria for response and non-response, which we based on the European Alliance of Associations for Rheumatology (EULAR) criteria. Furthermore, we explored the predictive features of the DNA methylome in a large RA patient cohort for ADA therapy response using extreme gradient boosting analysis, a state-of-the-art machine learning tool (35, 38). We intentionally investigated DNA methylation as a predictive biomarker for therapy response in peripheral blood since this material is easy to obtain in the context of developing an accessible diagnostic test. There are several limitations to address. First, concomitant MTX use may potentially exert an influence on the methylome as evidenced by prior investigations that demonstrated global DNA hypomethylation within blood cell populations, such as T cells and monocytes, isolated from RA patients following MTX treatment (25, 26, 63). Second, we were not able to perform gene expression on our own data set and could only theorize about the biology underlying the predictor CpGs. Third, to properly validate the performance of our predictive model, a properly setup validation cohort would need to be set up in an independent RA cohort. Several studies have reported differential methylated positions that distinguish therapy responders from non-responders treated with ADA, such as Tao et al. (34), where they performed a genome-wide epigenome association study on peripheral blood mononuclear cells (PBMCs) of RA patients treated with anti-TNFα medications such as ADA and etanercept. However, since we performed EWASs on whole blood patient materials, pooling our cohorts could lead to bias since the sample type is dissimilar. Fourth, since DNA methylation as an epigenetic mark is cell type-specific and peripheral blood is composed of different cell types, it is unclear whether the observed differential methylation signal is the result of actual DNA methylation or differences in cellular composition. While cellular composition can be largely estimated using the DNA methylome (50), such methods are often limited to the major cell populations. When interrogating these estimated cell proportions, we did not observe any response-associated differences in the estimated cellular composition. Finally, as DNA methylation measurements are conducted by “stamping” unmethylated cytosines into the genome through cytosine deamination, actual genetic variants can interfere with the methylation signal (64). However, we did not observe the characteristic tri- or bi-modal distribution of the methylation signal typically observed when interrogating genetic variants (42, 64).
Our results provide an initial, exploratory step toward the development of ADA response prediction in RA but require extensive validation in subsequent larger studies. We envision that future research can harness our data with the aim of developing a clinically applicable biomarker. Such a prognostic tool based on robust, validated, response-associated CpGs would reshape current clinical practice for RA, enabling treating clinicians to tailor medication to the patient and improving patient outcomes.
Data availability statement
The datasets presented in this study can be found in online repositories. The names of the repository/repositories and accession number(s) can be found below: EGA EuropeanGenome-Phenome Archive, accession number EGAD00010002610 (https://ega-archive.org/studies/EGAS00001007578); https://zenodo.org, 10225486.
Ethics statement
The studies involving humans were approved by Medical Ethics Committee of Slotervaart Hospital and Reade. The studies were conducted in accordance with the local legislation and institutional requirements. The participants provided their written informed consent to participate in this study.
Author contributions
IH: Conceptualization, Formal analysis, Methodology, Writing – original draft, Writing – review & editing. FM: Conceptualization, Formal analysis, Methodology, Writing – original draft, Writing – review & editing. SA: Conceptualization, Formal analysis, Methodology, Writing – original draft, Writing – review & editing. VJ: Conceptualization, Formal analysis, Methodology, Writing – review & editing. HS: Writing – review & editing. PH: Writing – review & editing. IV: Writing – review & editing. TH: Writing – review & editing. MN: Writing – review & editing. GW: Writing – review & editing. EL: Writing – review & editing. AL: Conceptualization, Formal analysis, Methodology, Writing – original draft, Writing – review & editing. GD: Conceptualization, Writing – review & editing. Wd: Conceptualization, Writing – review & editing.
Funding
The author(s) declare financial support was received for the research, authorship, and/or publication of this article. The authors received financial support from the Amsterdam Institute for Infection and Immunity (All) Collaboration Grant for research.
Acknowledgments
We thank the board of the Amsterdam Institute for Infection and Immunity (AII) organization (Amsterdam University Medical Centre, the Netherlands) for providing us with the funding necessary to conduct the current study. We further thank the employees at Reade Biobank for aiding us in the collection of peripheral blood samples. Finally, we offer our gratitude to the patients who volunteered to donate biological samples to the Reade Biobank.
Conflict of interest
Author EL was employed by the company Horaizon BV.
The remaining authors declare that the research was conducted in the absence of any commercial or financial relationships that could be construed as a potential conflict of interest.
Publisher’s note
All claims expressed in this article are solely those of the authors and do not necessarily represent those of their affiliated organizations, or those of the publisher, the editors and the reviewers. Any product that may be evaluated in this article, or claim that may be made by its manufacturer, is not guaranteed or endorsed by the publisher.
Supplementary material
The Supplementary Material for this article can be found online at: https://www.frontiersin.org/articles/10.3389/fimmu.2023.1303231/full#supplementary-material
Supplementary Figure 1 | Principal component analysis (PCA) of the methylome of RA therapy responders (orange) versus non-responders (green) and concomitant MTX users (triangle) or MTX naïve patients (circle).
Supplementary Figure 2 | Gene set enrichment analysis (GSEA) against the gene ontology (GO) gene sets of our reported predictor CpGs (adjusted ρ<0.05).
Supplementary File 1 | HTML Markdown output of the script used to perform the analysis.
Supplementary Table 1 | Gene set enrichment analysis output of the predictor CpGs against GO gene sets. Columns represent the GO term, number of genes enriched in this pathway, area under the receiver operator curve of the Wilcoxon test, p value calculated using the Wilcoxon test, p value calculated using the Known Population Median Test, the Benjamini-Hochberg-adjusted p-value, and the pathway description. Table is ranked by p-value (low to high).
References
1. Elshabrawy HA, Chen Z, Volin MV, Ravella S, Virupannavar S, Shahrara S. The pathogenic role of angiogenesis in rheumatoid arthritis. Angiogenesis (2015) 18:433–48. doi: 10.1007/s10456-015-9477-2
2. Chatzidionysiou K, Emamikia S, Nam J, Ramiro S, Smolen J, van der Heijde D, et al. Efficacy of glucocorticoids, conventional and targeted synthetic disease-modifying antirheumatic drugs: a systematic literature review informing the 2016 update of the EULAR recommendations for the management of rheumatoid arthritis. Ann Rheumatic Dis (2017) 76:1102–7. doi: 10.1136/annrheumdis-2016-210711
3. Cuchacovich M, Bueno D, Carvajal R, Bravo N, Aguillón JC, Catalán D, et al. Clinical parameters and biomarkers for anti-TNF treatment prognosis in rheumatoid arthritis patients. Clin Rheumatol (2014) 33:1707–14. doi: 10.1007/s10067-014-2756-2
4. Cuppen BV, Welsing PM, Sprengers JJ, Bijlsma JW, Marijnissen AC, van Laar JM, et al. Personalized biological treatment for rheumatoid arthritis: a systematic review with a focus on clinical applicability. Rheumatol (Oxford) (2016) 55:826–39. doi: 10.1093/rheumatology/kev421
5. Zhao S, Chadwick L, Mysler E, Moots RJ. Review of biosimilar trials and data on adalimumab in rheumatoid arthritis. Curr Rheumatol Rep (2018) 20:57. doi: 10.1007/s11926-018-0769-6
6. Weinblatt ME, Keystone EC, Furst DE, Moreland LW, Weisman MH, Birbara CA, et al. Adalimumab, a fully human anti-tumor necrosis factor alpha monoclonal antibody, for the treatment of rheumatoid arthritis in patients taking concomitant methotrexate: the ARMADA trial. Arthritis Rheum (2003) 48:35–45. doi: 10.1002/art.10697
7. Keystone EC, Kavanaugh AF, Sharp JT, Tannenbaum H, Hua Y, Teoh LS, et al. Radiographic, clinical, and functional outcomes of treatment with adalimumab (a human anti-tumor necrosis factor monoclonal antibody) in patients with active rheumatoid arthritis receiving concomitant methotrexate therapy: a randomized, placebo-controlled, 52-week trial. Arthritis Rheum (2004) 50:1400–11. doi: 10.1002/art.20217
8. Badot V, Galant C, Nzeusseu Toukap A, Theate I, Maudoux AL, Van den Eynde BJ, et al. Gene expression profiling in the synovium identifies a predictive signature of absence of response to adalimumab therapy in rheumatoid arthritis. Arthritis Res Ther (2009) 11:R57. doi: 10.1186/ar2678
9. Bek S, Bojesen AB, Nielsen JV, Sode J, Bank S, Vogel U, et al. Systematic review and meta-analysis: pharmacogenetics of anti-TNF treatment response in rheumatoid arthritis. Pharmacogenomics J (2017) 17:403–11. doi: 10.1038/tpj.2017.26
10. Ferreiro-Iglesias A, Montes A, Perez-Pampin E, Cañete JD, Raya E, Magro-Checa C, et al. Evaluation of 12 GWAS-drawn SNPs as biomarkers of rheumatoid arthritis response to TNF inhibitors. A potential SNP Assoc response to etanercept PloS One (2019) 14:e0213073. doi: 10.1371/journal.pone.0213073
11. Guan Y, Zhang H, Quang D, Wang Z, Parker SCJ, Pappas DA, et al. Machine learning to predict anti-tumor necrosis factor drug responses of rheumatoid arthritis patients by integrating clinical and genetic markers. Arthritis Rheumatol (2019) 71:1987–96. doi: 10.1002/art.41056
12. Cuchacovich M, Soto L, Edwardes M, Gutierrez M, Llanos C, Pacheco D, et al. Tumour necrosis factor (TNF)alpha -308 G/G promoter polymorphism and TNFalpha levels correlate with a better response to adalimumab in patients with rheumatoid arthritis. Scand J Rheumatol (2006) 35:435–40. doi: 10.1080/03009740600904284
13. Krintel SB, Dehlendorff C, Hetland ML, Hørslev-Petersen K, Andersen KK, Junker P, et al. Prediction of treatment response to adalimumab: a double-blind placebo-controlled study of circulating microRNA in patients with early rheumatoid arthritis. Pharmacogenomics J (2016) 16:141–6. doi: 10.1038/tpj.2015.30
14. Ciechomska M, Roszkowski L, Maslinski W. DNA methylation as a future therapeutic and diagnostic target in rheumatoid arthritis. Cells (2019) 8:953. doi: 10.3390/cells8090953
15. Ai R, Boyle DL, Wang W, Firestein GS. Distinct DNA methylation patterns of rheumatoid arthritis peripheral blood and synovial tissue T cells. ACR Open Rheumatol (2021) 3:127–32. doi: 10.1002/acr2.11231
16. Webster AP, Plant D, Ecker S, Zufferey F, Bell JT, Feber A, et al. Increased DNA methylation variability in rheumatoid arthritis-discordant monozygotic twins. Genome Med (2018) 10:64. doi: 10.1186/s13073-018-0575-9
17. Liu Y, Aryee MJ, Padyukov L, Fallin MD, Hesselberg E, Runarsson A, et al. Epigenome-wide association data implicate DNA methylation as an intermediary of genetic risk in rheumatoid arthritis. Nat Biotechnol (2013) 31:142–7. doi: 10.1038/nbt.2487
18. Hamilton JP. Epigenetics: principles and practice. Dig Dis (2011) 29:130–5. doi: 10.1159/000323874
19. Moore LD, Le T, Fan G, Methylation DNA. and its basic function. Neuropsychopharmacology (2013) 38:23–38. doi: 10.1038/npp.2012.112
20. Nakano K, Whitaker JW, Boyle DL, Wang W, Firestein GS. DNA methylome signature in rheumatoid arthritis. Ann Rheum Dis (2013) 72:110–7. doi: 10.1136/annrheumdis-2012-201526
21. Zhu H, Wu L-F, Mo X-B, Lu X, Tang H, Zhu X-W, et al. Rheumatoid arthritis–associated DNA methylation sites in peripheral blood mononuclear cells. Ann Rheumatic Dis (2019) 78:36–42. doi: 10.1136/annrheumdis-2018-213970
22. Li Yim AYF, Ferrero E, Maratou K, Lewis HD, Royal G, Tough DF, et al. Novel insights into rheumatoid arthritis through characterization of concordant changes in DNA methylation and gene expression in synovial biopsies of patients with differing numbers of swollen joints. Front Immunol (2021) 12:651475. doi: 10.3389/fimmu.2021.651475
23. Ai R, Hammaker D, Boyle DL, Morgan R, Walsh AM, Fan S, et al. Joint-specific DNA methylation and transcriptome signatures in rheumatoid arthritis identify distinct pathogenic processes. Nat Commun (2016) 7:11849. doi: 10.1038/ncomms11849
24. Wang SS, Lewis MJ, Pitzalis C. DNA methylation signatures of response to conventional synthetic and biologic disease-modifying antirheumatic drugs (DMARDs) in rheumatoid arthritis. Biomedicines (2023) 11:1987. doi: 10.3390/biomedicines11071987
25. de Andres MC, Perez-Pampin E, Calaza M, Santaclara FJ, Ortea I, Gomez-Reino JJ, et al. Assessment of global DNA methylation in peripheral blood cell subpopulations of early rheumatoid arthritis before and after methotrexate. Arthritis Res Ther (2015) 17:233. doi: 10.1186/s13075-015-0748-5
26. Liebold I, Grützkau A, Göckeritz A, Gerl V, Lindquist R, Feist E, et al. Peripheral blood mononuclear cells are hypomethylated in active rheumatoid arthritis and methylation correlates with disease activity. Rheumatology (2021) 60:1984–95. doi: 10.1093/rheumatology/keaa649
27. Gosselt HR, van Zelst BD, de Rotte MC, Hazes JM, de Jonge R, Heil SG. Higher baseline global leukocyte DNA methylation is associated with MTX non-response in early RA patients. Arthritis Res Ther (2019) 21:1–8. doi: 10.1186/s13075-019-1936-5
28. Glossop JR, Nixon NB, Emes RD, Sim J, Packham JC, Mattey DL, et al. DNA methylation at diagnosis is associated with response to disease-modifying drugs in early rheumatoid arthritis. Epigenomics (2017) 9:419–28. doi: 10.2217/epi-2016-0042
29. Nair N, Plant D, Verstappen SM, Isaacs JD, Morgan AW, Hyrich KL, et al. Differential DNA methylation correlates with response to methotrexate in rheumatoid arthritis. Rheumatol (Oxford) (2020) 59:1364–71. doi: 10.1093/rheumatology/kez411
30. Gosselt HR, Vallerga CL, Mandaviya PR, Lubberts E, Hazes JM, De Jonge R, et al. Epigenome wide association study of response to methotrexate in early rheumatoid arthritis patients. PLoS One (2021) 16:e0247709. doi: 10.1371/journal.pone.0247709
31. Guderud K, Sunde LH, Flåm ST, Mæhlen MT, Mjaavatten MD, Lillegraven S, et al. Both newly diagnosed and methotrexate treated, show more DNA methylation differences in CD4(+) memory than in CD4(+) naïve T cells. Front Immunol (2020) 11:194. doi: 10.3389/fimmu.2020.00194
32. Plant D, Webster A, Nair N, Oliver J, Smith SL, Eyre S, et al. Differential methylation as a biomarker of response to etanercept in patients with rheumatoid arthritis. Arthritis Rheumatol (2016) 68:1353–60. doi: 10.1002/art.39590
33. Julia A, Gomez A, Lopez-Lasanta M, Blanco F, Erra A, Fernandez-Nebro A, et al. Longitudinal analysis of blood DNA methylation identifies mechanisms of response to tumor necrosis factor inhibitor therapy in rheumatoid arthritis. EBioMedicine (2022) 80:104053. doi: 10.1016/j.ebiom.2022.104053
34. Tao W, Concepcion AN, Vianen M, Marijnissen ACA, Lafeber F, Radstake T, et al. Multiomics and machine learning accurately predict clinical response to adalimumab and etanercept therapy in patients with rheumatoid arthritis. Arthritis Rheumatol (2021) 73:212–22. doi: 10.1002/art.41516
35. Reeskamp LF, Venema A, Pereira JPB, Levin E, Nieuwdorp M, Groen AK, et al. Differential DNA methylation in familial hypercholesterolemia. EBioMedicine (2020) 61:103079. doi: 10.1016/j.ebiom.2020.103079
36. Fransen J, van Riel PL. The Disease Activity Score and the EULAR response criteria. Rheumatic Dis Clinics North America (2009) 35:745–57. doi: 10.1016/j.rdc.2009.10.001
37. Bibikova M, Le J, Barnes B, Saedinia-Melnyk S, Zhou L, Shen R, et al. Genome-wide DNA methylation profiling using Infinium® assay. Epigenomics (2009) 1:177–200. doi: 10.2217/epi.09.14
38. de Krijger M, Hageman IL, Li Yim AYF, Verhoeff J, Garcia Vallejo JJ, van Hamersveld PHP, et al. Epigenetic signatures discriminate patients with primary sclerosing cholangitis and ulcerative colitis from patients with ulcerative colitis. Front Immunol (2022) 13:840935. doi: 10.3389/fimmu.2022.840935
39. Aryee MJ, Jaffe AE, Corrada-Bravo H, Ladd-Acosta C, Feinberg AP, Hansen KD, et al. Minfi: a flexible and comprehensive Bioconductor package for the analysis of Infinium DNA methylation microarrays. Bioinformatics (2014) 30:1363–9. doi: 10.1093/bioinformatics/btu049
40. Fortin JP, Labbe A, Lemire M, Zanke BW, Hudson TJ, Fertig EJ, et al. Functional normalization of 450k methylation array data improves replication in large cancer studies. Genome Biol (2014) 15:503. doi: 10.1186/s13059-014-0503-2
41. Fortin JP, Fertig E, Hansen K. shinyMethyl: interactive quality control of Illumina 450k DNA methylation arrays in R. F1000Res (2014) 3:175. doi: 10.12688/f1000research.4680.2
42. Andrews SV, Ladd-Acosta C, Feinberg AP, Hansen KD, Fallin MD. "Gap hunting" to characterize clustered probe signals in Illumina methylation array data. Epigenet Chromatin (2016) 9:56. doi: 10.1186/s13072-016-0107-z
43. Du P, Zhang X, Huang C-C, Jafari N, Kibbe WA, Hou L, et al. Comparison of Beta-value and M-value methods for quantifying methylation levels by microarray analysis. BMC Bioinf (2010) 11:587. doi: 10.1186/1471-2105-11-587
44. Ritchie ME, Phipson B, Wu D, Hu Y, Law CW, Shi W, et al. limma powers differential expression analyses for RNA-sequencing and microarray studies. Nucleic Acids Res (2015) 43:e47. doi: 10.1093/nar/gkv007
45. Morris TJ, Butcher LM, Feber A, Teschendorff AE, Chakravarthy AR, Wojdacz TK, et al. ChAMP: 450k chip analysis methylation pipeline. Bioinformatics (2014) 30:428–30. doi: 10.1093/bioinformatics/btt684
46. Wickham H. ggplot2: elegant graphics for data analysis. Springer New York (2009). Available at: https://www.jstor.org/stable/2529826?seq=1.
47. Brown MB. One-sided tests of significance. In: Biometrics, vol. 31. JSTOR. p. 987–92. M.B.A.M.f.C.N.-I. Brown. Available at: https://cran.r-project.org/web/packages/ggplot2/citation.html.
48. Yin T, Cook D, Lawrence M. ggbio: an R package for extending the grammar of graphics for genomic data. Genome Biol (2012) 13:R77. doi: 10.1186/gb-2012-13-8-r77
49. Salas LA, Koestler DC, Butler RA, Hansen HM, Wiencke JK, Kelsey KT, et al. An optimized library for reference-based deconvolution of whole-blood biospecimens assayed using the Illumina HumanMethylationEPIC BeadArray. Genome Biol (2018) 19:64. doi: 10.1186/s13059-018-1448-7
50. Jaffe AE, Irizarry RA. Accounting for cellular heterogeneity is critical in epigenome-wide association studies. Genome Biol (2014) 15:R31. doi: 10.1186/gb-2014-15-2-r31
51. Sandoval-Plata G, Morgan K, Abhishek A. Variants in urate transporters, ADH1B, GCKR and MEPE genes associate with transition from asymptomatic hyperuricaemia to gout: results of the first gout versus asymptomatic hyperuricaemia GWAS in Caucasians using data from the UK Biobank. Ann Rheum Dis (2021) 80:1220–6. doi: 10.1136/annrheumdis-2020-219796
52. Lie BA, Akselsen HE, Bowlus CL, Gruen JR, Thorsby E, Undlien DE. Polymorphisms in the gene encoding thymus-specific serine protease in the extended HLA complex: a potential candidate gene for autoimmune and HLA-associated diseases. Genes Immun (2002) 3:306–12. doi: 10.1038/sj.gene.6363858
53. Luther C, Wienhold W, Oehlmann R, Heinemann MK, Melms A, Tolosa E. Alternatively spliced transcripts of the thymus-specific protease PRSS16 are differentially expressed in human thymus. Genes Immun (2005) 6:1–7. doi: 10.1038/sj.gene.6364142
54. Kretz-Rommel A, Rubin RL. Disruption of positive selection of thymocytes causes autoimmunity. Nat Med (2000) 6:298–305. doi: 10.1038/73152
55. Rasmussen AH, Rasmussen HB, Silahtaroglu A. The DLGAP family: neuronal expression, function and role in brain disorders. Mol Brain (2017) 10:43. doi: 10.1186/s13041-017-0324-9
56. Izda V, Dunn CM, Prinz E, Schlupp L, Nguyen E, Sturdy C, et al. A pilot analysis of genome-wide DNA methylation patterns in mouse cartilage reveals overlapping epigenetic signatures of aging and osteoarthritis. ACR Open Rheumatol (2022) 4:1004–12. doi: 10.1002/acr2.11506
57. MacDonald IJ, Liu SC, Su CM, Wang YH, Tsai CH, Tang CH. Implications of angiogenesis involvement in arthritis. Int J Mol Sci (2018) 19(7):2012. doi: 10.3390/ijms19072012
58. Taylor PC, Sivakumar B. Hypoxia and angiogenesis in rheumatoid arthritis. Curr Opin Rheumatol (2005) 17:293–8. doi: 10.1097/01.bor.0000155361.83990.5b
59. Schultz TE, Blumenthal A. The RP105/MD-1 complex: molecular signaling mechanisms and pathophysiological implications. J Leukoc Biol (2017) 101:183–92. doi: 10.1189/jlb.2VMR1215-582R
60. Erdő-Bonyár S, Rapp J, Minier T, Ráth G, Najbauer J, Czirják L, et al. Toll-like receptor mediated activation of natural autoantibody producing B cell subpopulations in an autoimmune disease model. Int J Mol Sci (2019) 20:6152. doi: 10.3390/ijms20246152
61. Koarada S, Tada Y, Ushiyama O, Morito F, Suzuki N, Ohta A, et al. B cells lacking RP105, a novel B cell antigen, in systemic lupus erythematosus. Arthritis Rheum (1999) 42:2593–600. doi: 10.1002/1529-0131(199912)42:12<2593::AID-ANR12>3.0.CO;2-G
62. Kikuchi Y, Koarada S, Nakamura S, Yonemitsu N, Tada Y, Haruta Y, et al. Increase of RP105-lacking activated B cells in the peripheral blood and salivary glands in patients with Sjögren's syndrome. Clin Exp Rheumatol (2008) 26:5–12.
63. Guderud K, Sunde LH, Flåm ST, Mæhlen MT, Mjaavatten MD, Norli ES, et al. Methotrexate treatment of newly diagnosed RA patients is associated with DNA methylation differences at genes relevant for disease pathogenesis and pharmacological action. Front Immunol (2021) 12:713611. doi: 10.3389/fimmu.2021.713611
Keywords: DNA methylation, rheumatoid arthritis, adalimumab, machine learning, therapy response
Citation: Hageman I, Mol F, Atiqi S, Joustra V, Sengul H, Henneman P, Visman I, Hakvoort T, Nurmohamed M, Wolbink G, Levin E, Li Yim AYF, D’Haens G and de Jonge WJ (2023) Novel DNA methylome biomarkers associated with adalimumab response in rheumatoid arthritis patients. Front. Immunol. 14:1303231. doi: 10.3389/fimmu.2023.1303231
Received: 27 September 2023; Accepted: 04 December 2023;
Published: 22 December 2023.
Edited by:
Maria I. Bokarewa, University of Gothenburg, SwedenReviewed by:
Nisha Nair, The University of Manchester, United KingdomJuliana Imgenberg-Kreuz, Uppsala University, Sweden
Copyright © 2023 Hageman, Mol, Atiqi, Joustra, Sengul, Henneman, Visman, Hakvoort, Nurmohamed, Wolbink, Levin, Li Yim, D’Haens and de Jonge. This is an open-access article distributed under the terms of the Creative Commons Attribution License (CC BY). The use, distribution or reproduction in other forums is permitted, provided the original author(s) and the copyright owner(s) are credited and that the original publication in this journal is cited, in accordance with accepted academic practice. No use, distribution or reproduction is permitted which does not comply with these terms.
*Correspondence: Wouter J. de Jonge, dy5qLmRlam9uZ2VAYW1zdGVyZGFtdW1jLm5s
†These authors have contributed equally to this work and share first authorship
‡These authors share last authorship