 Zhenchao Zhuang1†
- 1Department of Laboratory Medicine, The First Affiliated Hospital of Zhejiang Chinese Medical University (Zhejiang Provincial Hospital of Chinese Medicine), Hangzhou, China
- 2School of Medical Technology and Information Engineering, Zhejiang Chinese Medical University, Hangzhou, China
Objective: Due to the increased likelihood of progression of severe pneumonia, the mortality rate of the elderly infected with coronavirus disease 2019 (COVID-19) is high. However, there is a lack of models based on immunoglobulin G (IgG) subtypes to forecast the severity of COVID-19 in elderly individuals. The objective of this study was to create and verify a new algorithm for distinguishing elderly individuals with severe COVID-19.
Methods: In this study, laboratory data were gathered from 103 individuals who had confirmed severe acute respiratory syndrome coronavirus 2 (SARS-CoV-2) infection using a retrospective analysis. These individuals were split into training (80%) and testing cohort (20%) by using random allocation. Furthermore, 22 COVID-19 elderly patients from the other two centers were divided into an external validation cohort. Differential indicators were analyzed through univariate analysis, and variable selection was performed using least absolute shrinkage and selection operator (LASSO) regression. The severity of elderly patients with COVID-19 was predicted using a combination of five machine learning algorithms. Area under the curve (AUC) was utilized to evaluate the performance of these models. Calibration curves, decision curves analysis (DCA), and Shapley additive explanations (SHAP) plots were utilized to interpret and evaluate the model.
Results: The logistic regression model was chosen as the best machine learning model with four principal variables that could predict the probability of COVID-19 severity. In the training cohort, the model achieved an AUC of 0.889, while in the testing cohort, it obtained an AUC of 0.824. The calibration curve demonstrated excellent consistency between actual and predicted probabilities. According to the DCA curve, it was evident that the model provided significant clinical advantages. Moreover, the model performed effectively in an external validation group (AUC=0.74).
Conclusion: The present study developed a model that can distinguish between severe and non-severe patients of COVID-19 in the elderly, which might assist clinical doctors in evaluating the severity of COVID-19 and reducing the bad outcomes of elderly patients.
Introduction
The severe acute respiratory syndrome coronavirus 2 (SARS-CoV-2) virus has given rise to a worldwide pandemic known as coronavirus disease 2019 (COVID-19). The trends of the pandemic vary among different countries and regions. Clinical experiences have shown that COVID-19 is a highly heterogeneous disease, representing a range of clinical severity, from asymptomatic and mild to severe pneumonia, acute respiratory distress syndrome (ARDS), and even death (1, 2). The first report of SARS-CoV-2 infections in the population was from China. Initial findings from China suggested that older age is associated with a higher likelihood of experiencing and suffering from COVID-19. Immunological senescence and inflammation play a severe role in contributing to older patients who are more prone to severe outcomes of COVID-19 (1, 3).
IgG antibodies, also known as immunoglobulin G, offer a prominent means of protection against contagious illnesses. Antigen–IgG immune complexes could be formed when IgG antibodies bind directly to pathogens. During an infection, the inflammatory response is directed by these complexes of the immune system. Following viral infection, the initiation of IgG-mediated effector control happens as reactive antibodies bind to viral particles (4). Chakraborty et al. (5) found that a greater number of individuals with severe COVID-19 have increased levels of particular pro-inflammatory antibody variants. These variants are identified by the presence of IgG 3 and IgG 1 antibodies with F0N0 glycoform modification.
Data mining algorithms and predictive analysis are the theoretical core of machine learning analysis, which is to identify individual features of data from machine learning, establish models through science, and subsequently utilize new data through these models to forecast future data (6). Machine learning (ML) is of great value in medical research and a number of studies have utilized machine learning as a tool that can be used to predict COVID-19 (7–10). Nevertheless, some studies require medical imaging such as CTs and X-rays, and the parameters are relatively complex, and the influences of ionizing radiation are unavoidable (11, 12). In addition, there is currently a lack of prediction models that consider IgG subtypes in COVID-19 patients, with the majority of existing models concentrating on the severity of the disease in ordinary individuals rather than the elderly population (13, 14). Table 1 summarizes recent work on COVID-19 by machine learning algorithms.

Table 1 Survey on existing machine learning algorithms.
As age increases, the probability of infection and the mortality rate of COVID-19 also increased. The elderly are particularly vulnerable to COVID-19 infection due to their weakened immune systems and the presence of other chronic diseases such as hypertension and diabetes. This study question thus highlights the therapeutic significance of early identification of COVID-19-related fatalities in elderly people. Because the immune response has such a large influence, it is also important to investigate immunological antibodies to distinguish between non-severe and severe COVID-19 instances and to provide unique treatment approaches.
Therefore, this study developed a model utilizing IgG subtypes and machine learning to help clinicians distinguish the severity of COVID-19 in elderly individuals and implement effective interventions to reduce mortality. In the present study, the major contributions are as follows:
1. A novel model for predicting the severity of COVID-19 based on IgG subtypes and machine learning is developed.
2. This study focuses on elderly patients over the age of 60 rather than ordinary individuals.
3. In this study, five machine learning algorithms are compared to predict the severity of elderly COVID-19 patients, and the logistic regression model demonstrated the highest prediction performance among them.
The structure of this research has been organized as follows. Section 2 shows the methods including patient involvement and dataset selection. Section 3 presents screening variables and optimal machine learning models to predict the severity of COVID-19 in elderly patients. Section 4 discusses the results. Section 5 discusses the limitations. Section 6 summarizes the article and the prospect of the next step.
Materials and methods
Ethics statement
This study was approved by the Ethics Committee of the First Affiliated Hospital of Zhejiang Chinese Medical University with approval number 2023-KLS-034-01.
Patient involvement
According to the standards of the China Novel Coronavirus Infection Diagnosis and Treatment Program (Trial 10th Edition) and the clinicians’ diagnoses (15), we conducted a search for patients of non-severe and severe COVID-19 (age ≥60 years) diagnosed from 1 to 16 January 2023, in Zhejiang Provincial Hospital of Chinese Medicine (Hubin). Two groups were formed for the elderly patients with COVID-19, namely, non-severe and severe groups. Included in the study were a combined total of 41 cases classified as non-severe and 62 cases classified as severe. Patients in the severe group progressed to severe or critical COVID-19 or pneumonia-related deaths while hospitalized, whereas patients in the non-severe group remained in non-severe states (mild or moderate COVID-19) while hospitalized. Furthermore, 22 cases from Zhejiang Provincial Hospital of Chinese Medicine (Qiantang and Xixi) were collected as an external validation cohort from 1 to 16 January 2023.
Mild pneumonia with respiratory tract infection, such as dry throat, sore throat, cough, and fever, was the main manifestation. Imaging findings show characteristics of COVID-19 pneumonia, and abnormal clinical symptoms can be observed in moderate pneumonia. Patients are determined to have severe pneumonia if they meet any of the following criteria (1): a notable rise in respiration rate, with RR ≥30/min; (2) oxygen saturation of 93% or lower while at rest; (3) a PaO2/FiO2 ratio of 300 mmHg or less (1 mmHg = 0.133 kPa); and (4) significant advancement of pulmonary lesions by more than 50% within 24–48 h, as observed through pulmonary imaging. Critical pneumonia occurs when the disease progresses rapidly with any of the following criteria: (1) respiratory insufficiency requiring mechanical ventilation, (2) shock, and (3) a combination of organ failure and monitoring in the ICU setting. The exclusion criterion was other viral pneumonia.
Data collection
Detailed information on the baseline population characteristics (age, gender, and comorbidities) and clinical laboratory data of these patients were meticulously gathered from their electronic medical records. Laboratory data include routine blood examinations, C-reactive protein, coagulation indicators, cytokines, and IgG subtypes. After enrollment, 103 elderly individuals were randomly assigned to the training cohort (80%) and the testing cohort (20%). By setting a random seed (random seed=1), the present study can ensure the repeatability of the random process, allowing us to accurately reproduce research results when needed. The best model hyperparameters selected were by grid search and carried out fivefold cross-validation. In the fivefold cross-validation, the dataset was split into five parts of approximately equal size: one of the five parts for testing and the remaining four parts for training. Fivefold cross-validation was cycled through the process five times. The models were constructed in the training cohort using laboratory tests and machine learning techniques and subsequently verified in the testing cohort. The external validation cohort was validated against the final filtered-out optimal model.
Statistical analysis
Analyses were performed utilizing SPSS 26.0 and R 4.3.1 software. Frequencies and percentages were used to present categorical variables, while mean ± standard deviation or median and interquartile range (IQR) were used for continuous variables. The χ2 test was used to analyze count data, while independent samples t-test or Wilcoxon test were used to analyze measurement data.
Significant differences between severe and non-severe groups were identified through a univariate analysis, followed by the utilization of least absolute shrinkage and selection operator (LASSO) regression to select the factors associated with COVID-19 severity. By cohort seed, we selected 80% of the patients for deriving the optimal model (training cohort), whereas the other 20% of patients were allocated to the validation cohort. Subsequently, the present study established predictive models using meaningful factors identified through LASSO regression. In both the training and validation cohorts, calibration plots were utilized to graphically evaluate calibration, while a receiver operating characteristic (ROC) curve and the area under the ROC curve (AUC) were employed to assess calibration. The interpretation of the feature ranking was done using Shapley additive explanations (SHAP) plots. Statistical significance was determined by considering a p-value<0.05.
Machine learning
For the development of an ML-based algorithm, the Deepwise & Beckman Coulter DxAI platform utilized an online statistics tool. The platform has the capability to automatically select machine learning models, display the analysis data and generate a page of analysis online.
Results
Demographic characteristics
The present study first compared IgG subtypes between COVID-19 elderly patients and healthy individuals 60 years of age and older. As can be seen in Table 2, there were significant differences in four subtypes of IgG between the two groups (p<0.05).
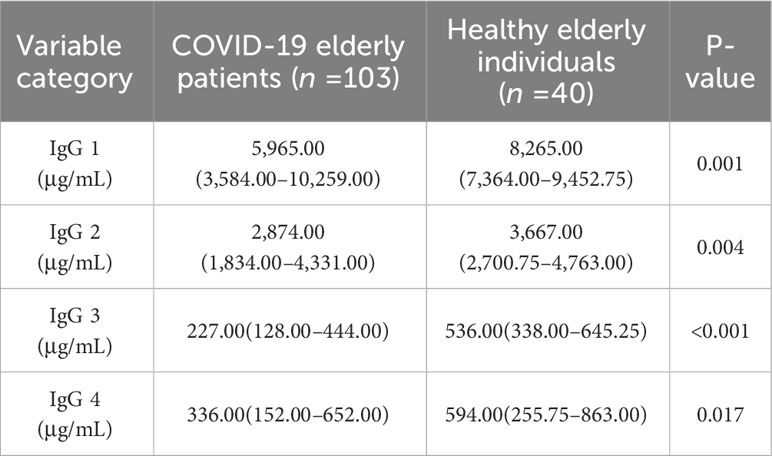
Table 2 Comparison of IgG subtypes between elderly COVID-19 patients and healthy individuals.
In order to conduct a more in-depth investigation, this study explored the distribution of IgG subtypes among elderly COVID-19 patients, distinguishing between those with severe symptoms and those with non-severe symptoms. The demographic characteristics of these patients are summarized in Table 3. This study consisted of 41 (39.81%) classified as non-severe and 62 (60.19%) classified as severe. There were 43 men (69.35%) and 19 women (30.65%) in the severe group, while there were 22 men (53.66%) and 19 women (46.34%) in the non-severe group. As shown in Table 3, there were no statistical differences in the non-severe and severe groups by gender (p=0.106 >0.05), which was comparable. In terms of age, the severe group had a significantly higher mean age compared to the non-severe group (median, 84.50: 75.00), with a highly significant difference between the two groups (p<0.001). Older men had a significantly higher rate of severe COVID-19 compared to women. The present research aligns with the findings reported by Jin et al. (16), who described worse outcomes and deaths in men with COVID-19. The most prevalent comorbidity among severe patients was hypertension (66.13%), followed by diabetes (32.26%). Additionally, coronary heart disease, anemia, tumors, and COPD were present in 20.97%, 16.13%, 12.90%, and 9.68% of severe patients, respectively.
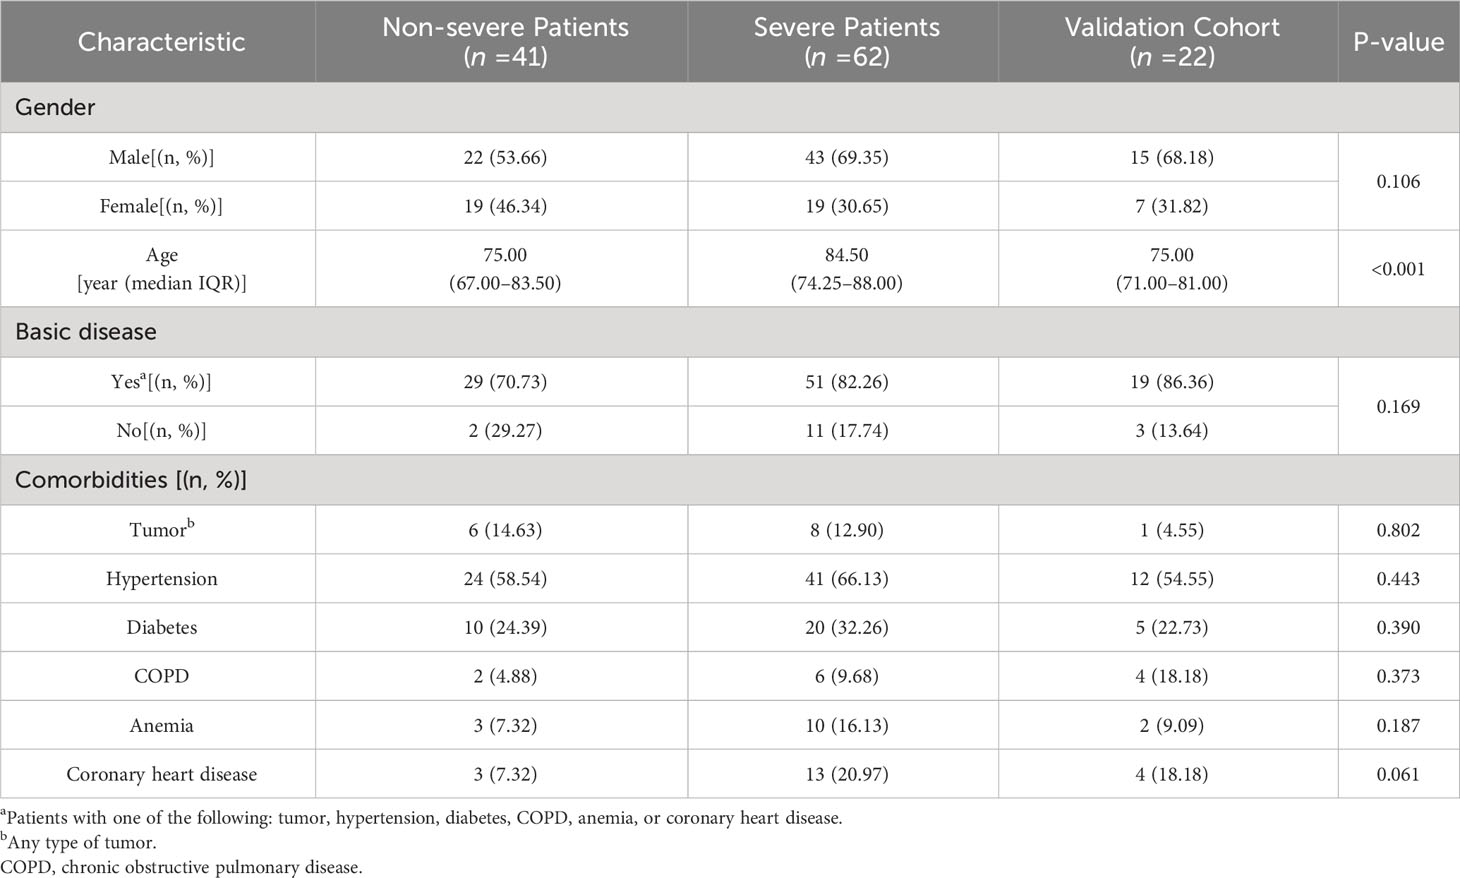
Table 3 Baseline characteristics of COVID-19-infected patients.
In an external validation cohort, this study consisted of 11 (50.00%) classified as non-severe and 11 (50.00%) classified as severe. In the group, 15 patients (68.18%) were male, and 7 (31.82%) were female. The median age of this group was 75. The most prevalent comorbidity among patients was hypertension (54.55%), followed by diabetes (22.73%). Additionally, coronary heart disease, COPD, anemia, and tumors were present in 18.18%, 18.18%, 9.09%, and 4.55% of patients, respectively.
Comparison of biomarkers between non-severe and severe COVID-19 patients
During the process of comparing the two biomarkers, the present study included each subtype of IgG and made pairwise ratios, which were also compared to IgG Sum, yielding several new indicators. As shown in Table 4, except for IgG 1/IgG 4, LY #, and HGB, the severe COVID-19 group exhibited significantly elevated levels of IL-2, IL-6, IgG 2/IgG 1, IgG Sum/IgG 1, IgG 2/IgG Sum, CRP, PT, INR, DD, WBC, NE #, NLR, RDW, and PDW in comparison to the non-severe COVID-19 group (p<0.05).
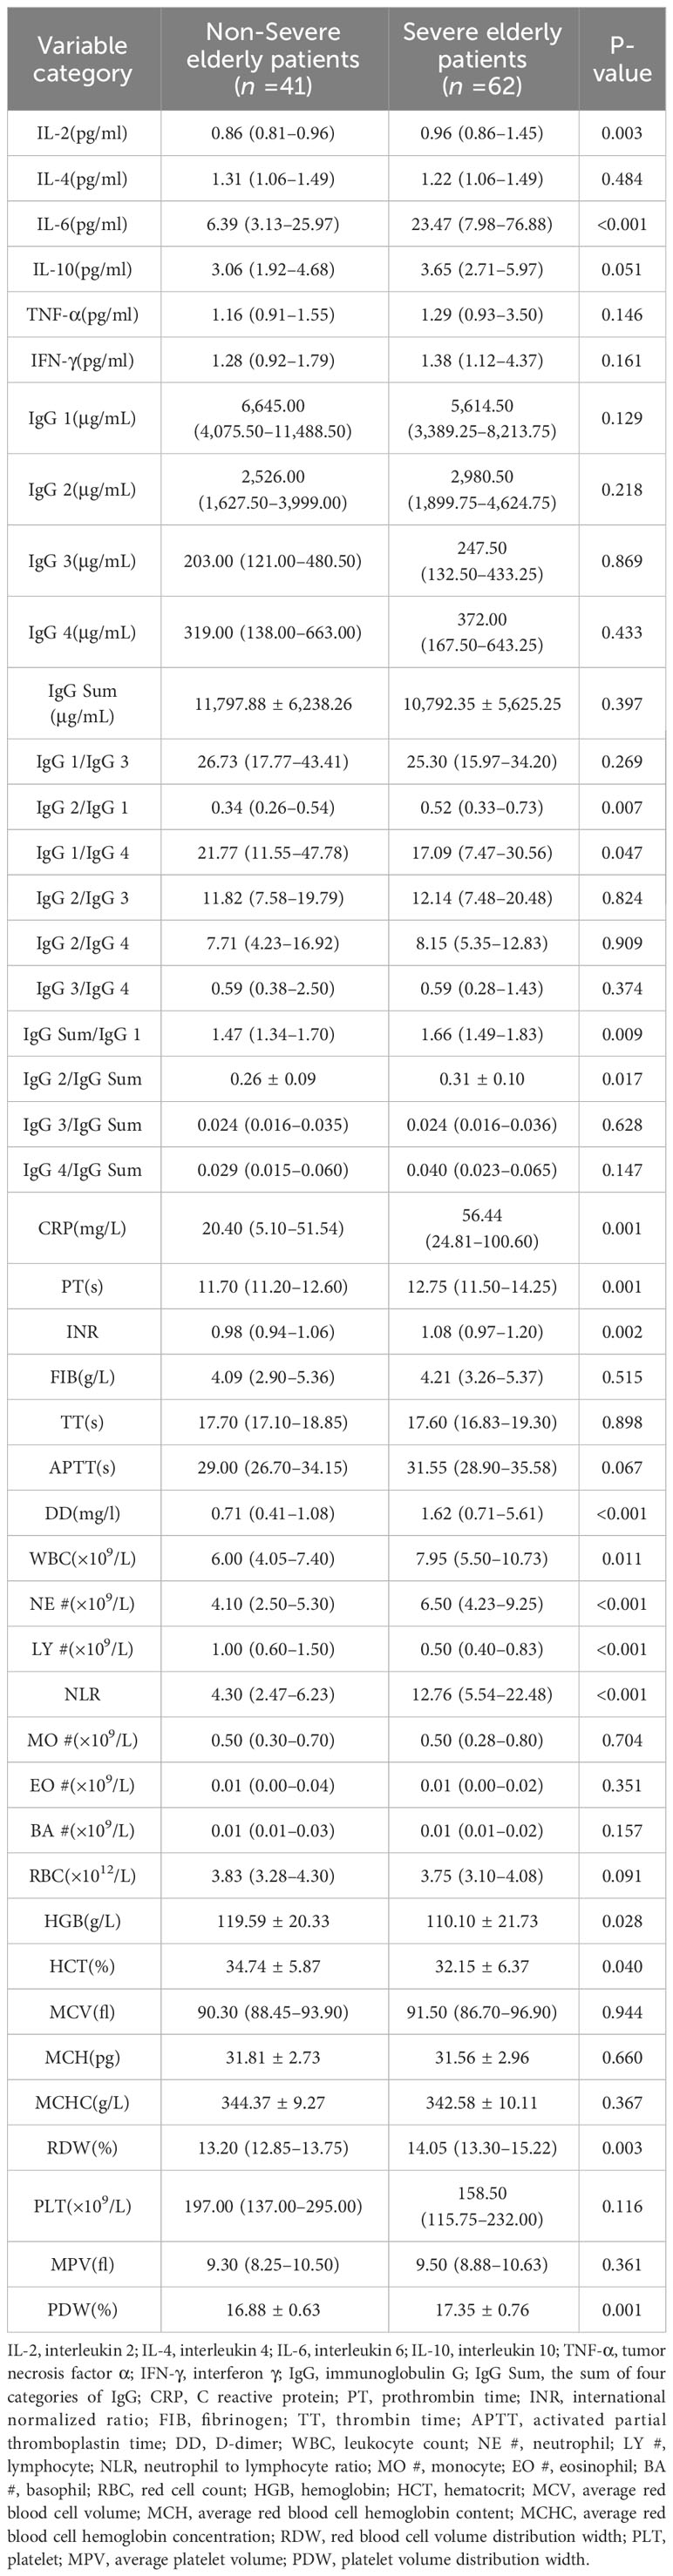
Table 4 Comparison of biomarkers between non-severe and severe COVID-19 patients.
The correlation between biomarkers and COVID-19 severity in two groups
The present study collected 46 features from elderly individuals diagnosed with COVID-19, and after excluding unrelated and redundant features, 18 features were retained for LASSO regression analysis. To screen for factors associated with the severity of COVID-19, an analysis using LASSO regression was conducted. The results of 103 elderly patients showed that age, IL-2, IgG Sum/IgG 1, DD, LY #, NLR, and PDW were considered to be relevant factors affecting the severe degree of COVID-19 (Figure 1). Additionally, the present study generated correlation heatmaps and determined feature importance using the correlation factors chosen through LASSO regression.
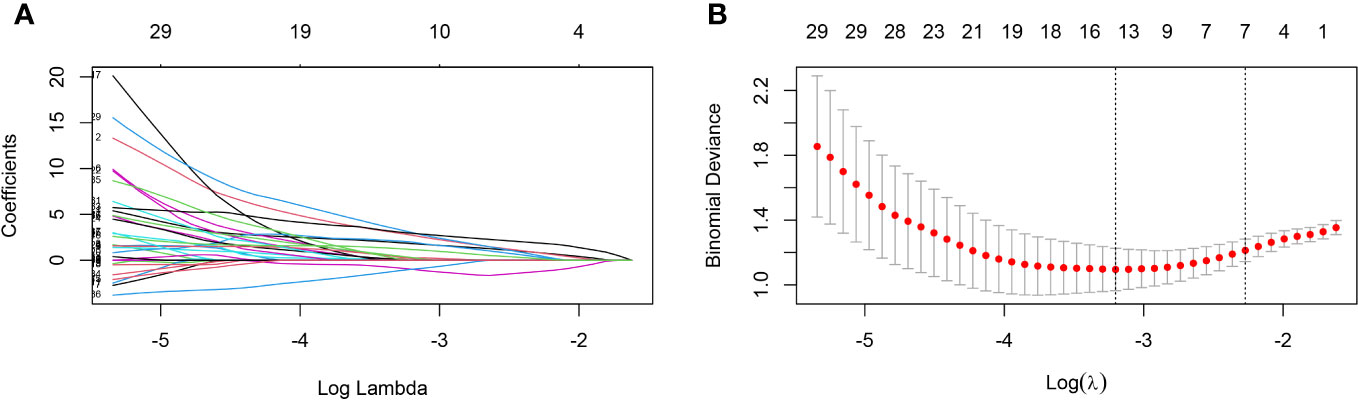
Figure 1 Predictors selection using LASSO regression analysis and 10-fold cross-validation. (A) Bias selection of the tuning parameter (lambda) in LASSO regression based on the minimum standard (left dashed line) and 1-SE standard (right dashed line). (B) A joint plot was created based on the log-likelihood. In this study, the selection of predictive factors was based on the 1-SE standard (right dashed line), resulting in the selection of seven non-zero factors. LASSO, least absolute shrinkage and selection operator; SE, the standard error.
Areas under ROC
In Figure 2, the ROC curves and AUC are depicted, representing various biomarkers with significant differences between the two groups in predicting severe COVID-19 elderly patients. Among them, NLR was the most efficient of these (AUC=0.790), followed by DD and LY # (AUC=0.760).
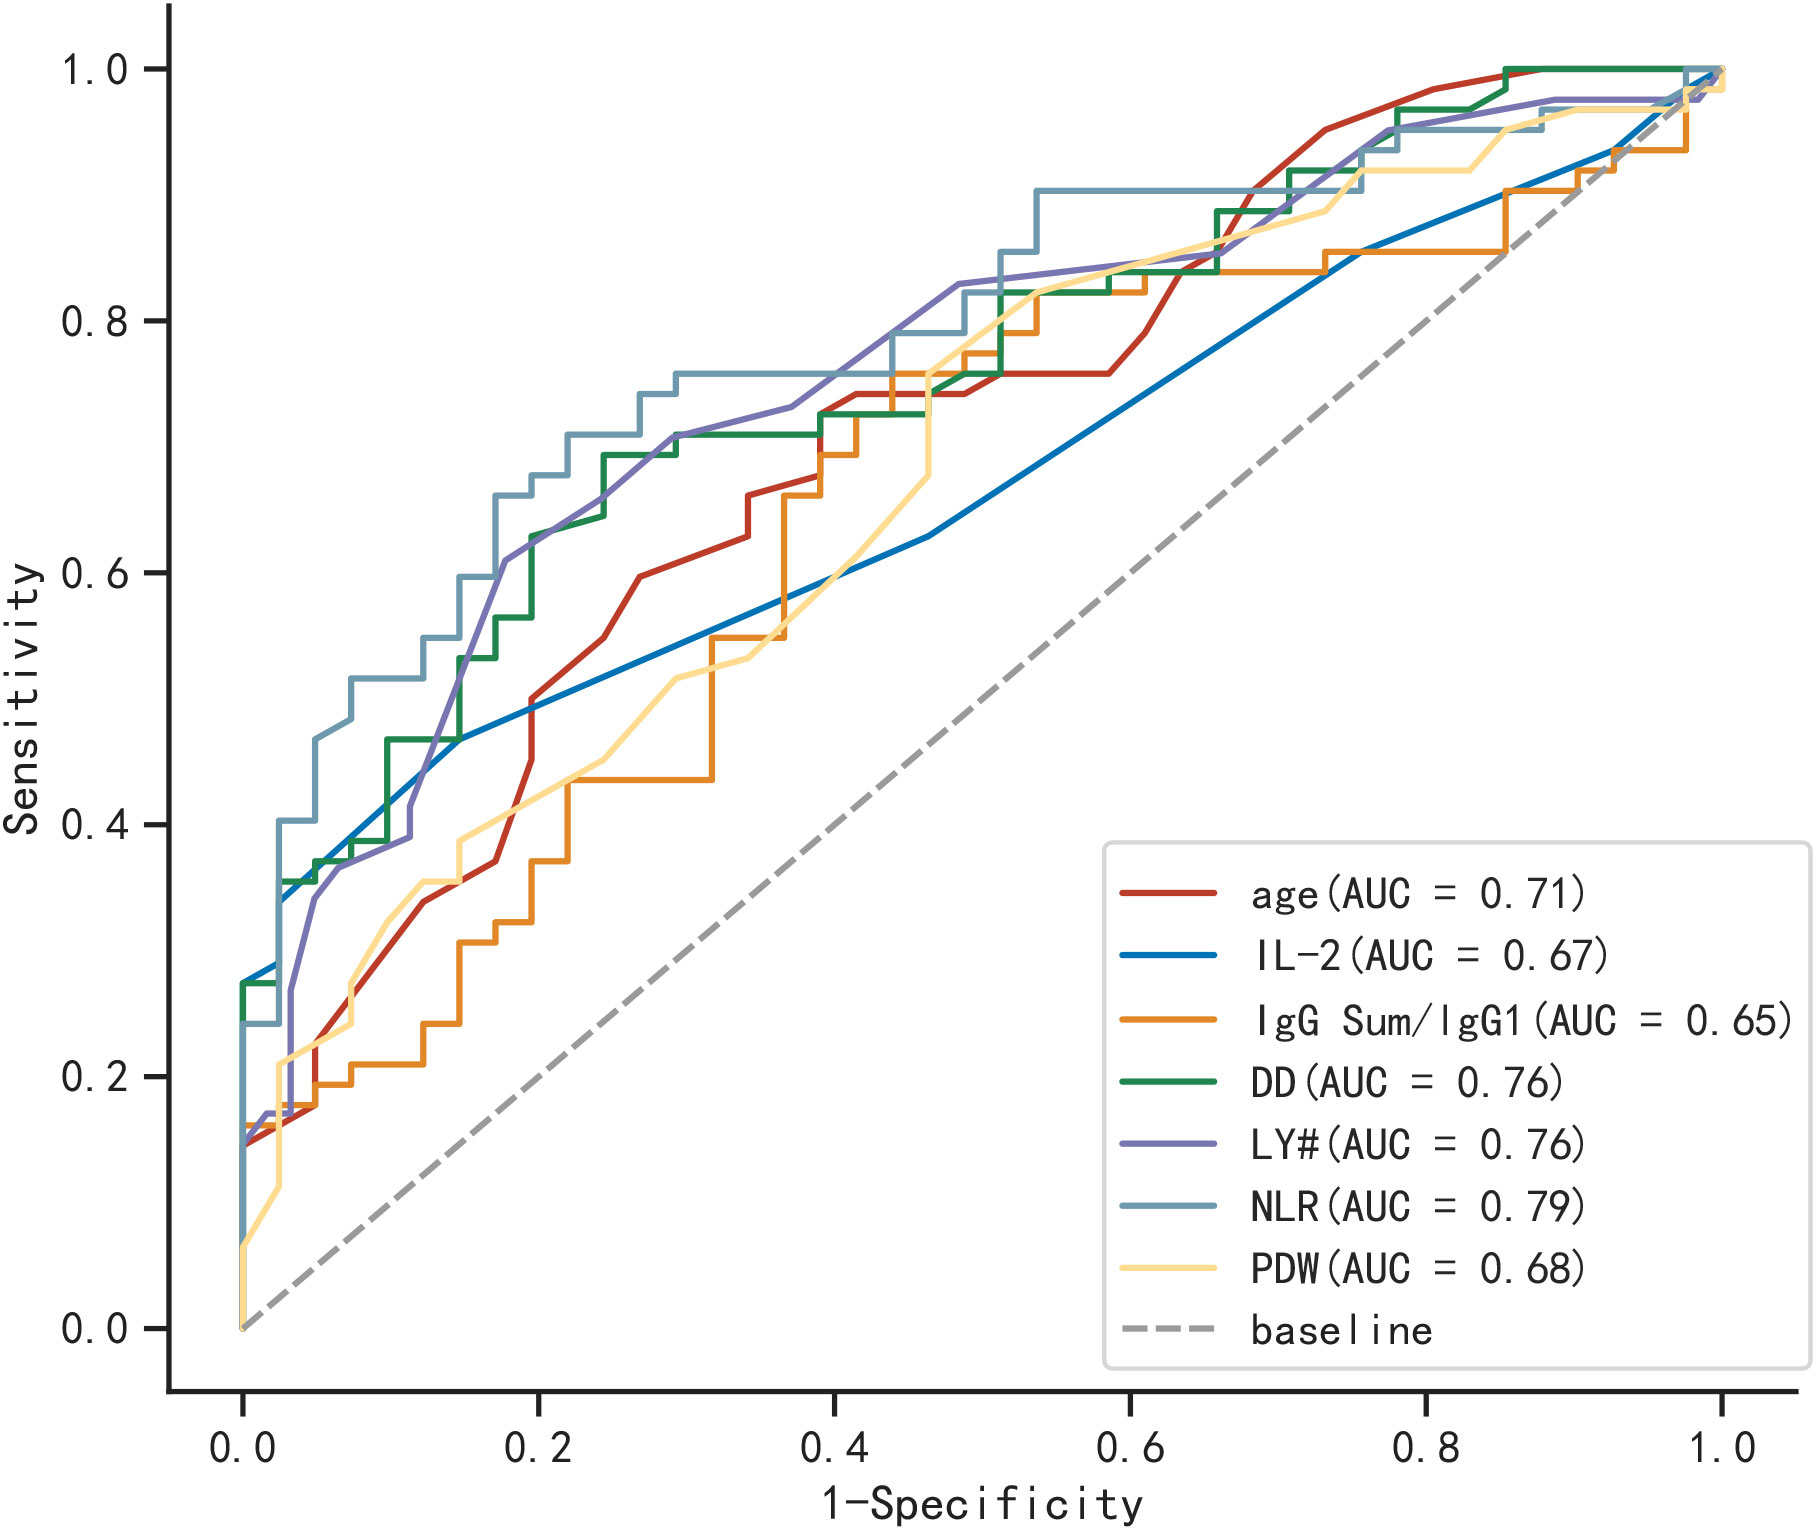
Figure 2 ROC curves for different biomarkers in predicting severe COVID-19 elderly patients.
Correlation heatmaps and feature importance of biomarkers
After analyzing the importance of various features, the present study ultimately selected four indicators based on the number of elderly individuals affected by COVID-19. The feature importance between age, IL-2, IgG Sum/IgG 1, DD, LY, PDW, and NLR are shown in Figure 3A. Age, IL-2, IgG Sum/IgG 1, and DD are the top 4 of the seven indicators. Then, the correlations among four individual indicators are examined. As shown in Figure 3B, age, IL-2, IgG Sum/IgG 1, and DD showed a low correlation, which could prevent the model from overfitting.
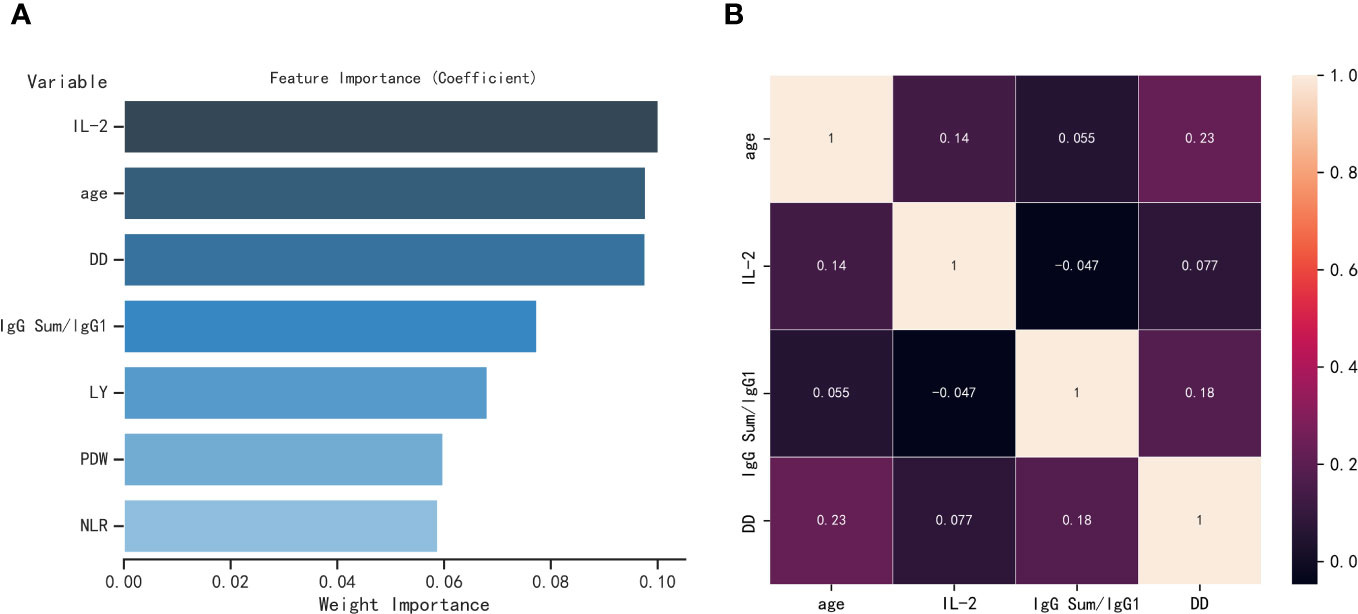
Figure 3 (A) Feature importance of seven parameters selected by LASSO regression. (B) Heatmap of correlation of four parameters, where one variable is plotted on the x-axis and the other on the y-axis for both severe elderly and non-severe elderly patients; antique white for positive correlation and black for negative correlation.
Comparison of machine learning algorithms and identification of the optimal model
The AUCs of five machine learning algorithms for fivefold cross-validation on the training cohort are shown in Table 5. In the testing cohort, the results of five machine learning algorithms show AUCs of 0.735 for eXtreme gradient boosting (XGBoost), 0.866 for logistic regression, 0.781 for random forest, 0.812 for adaptive boosting (AdaBoost), and 0.856 for support vector machines (SVMs). The logistic regression model demonstrated the highest prediction performance among these models.
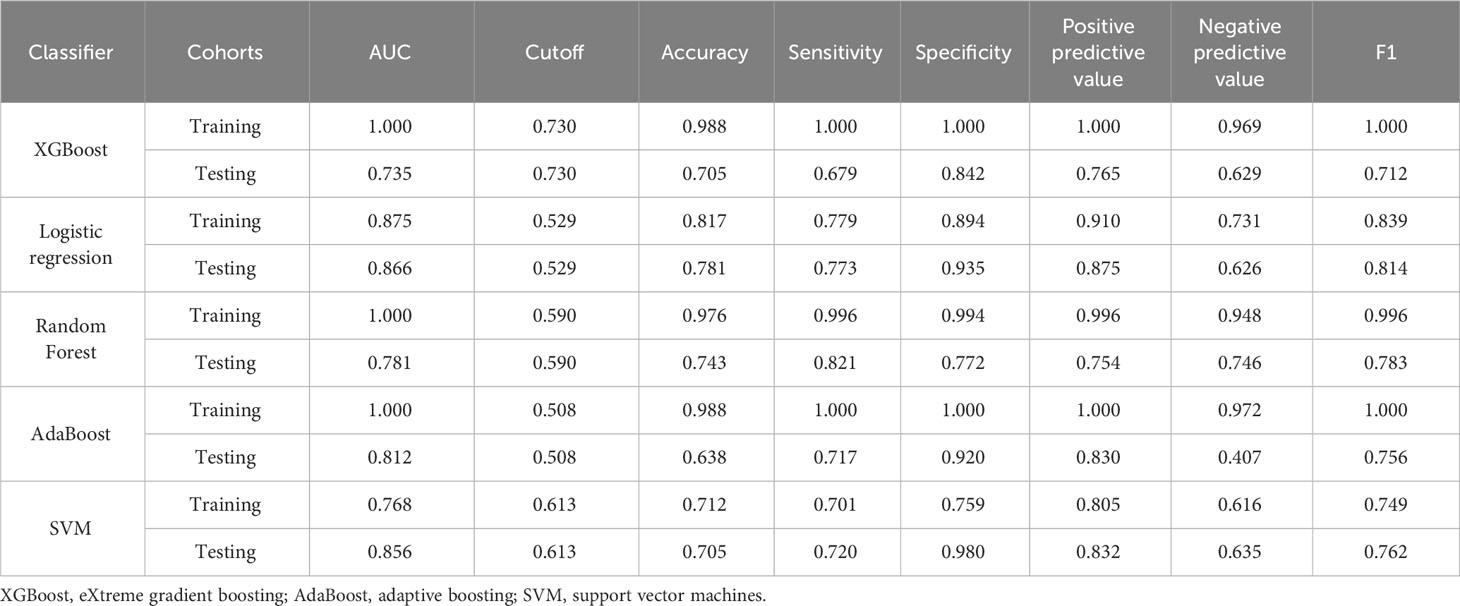
Table 5 Diagnostic efficacy of five classifiers in the training and testing cohorts for fivefold cross-validation.
Analysis and assessment of machine learning model
On the basis of the results shown in Table 6 and Figure 4, it can be observed that the logistic regression model exhibited a strong discriminatory ability in distinguishing between two groups. In the testing cohort, the model demonstrated AUC, accuracy, specificity, and positive predictive value exceeding 80% (Figures 4A, B). Moreover, the calibration curve demonstrated a strong correlation between actual and predicted probabilities, indicating excellent calibration of the model. According to Figures 4C, D, the DCA curve indicated a strong clinical benefit of the model.
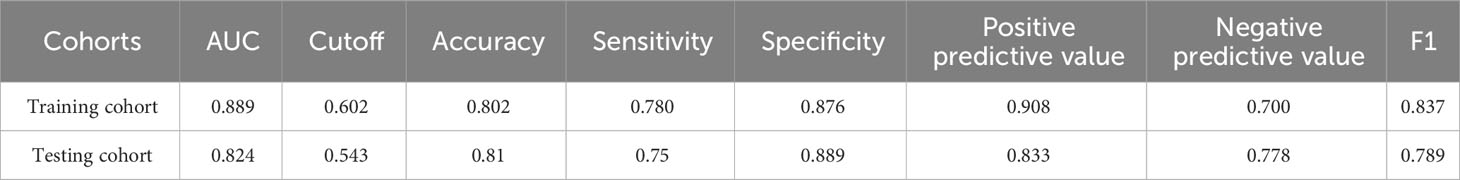
Table 6 Diagnostic efficacy of logistic regression model in the training and testing cohorts for fivefold cross-validation.
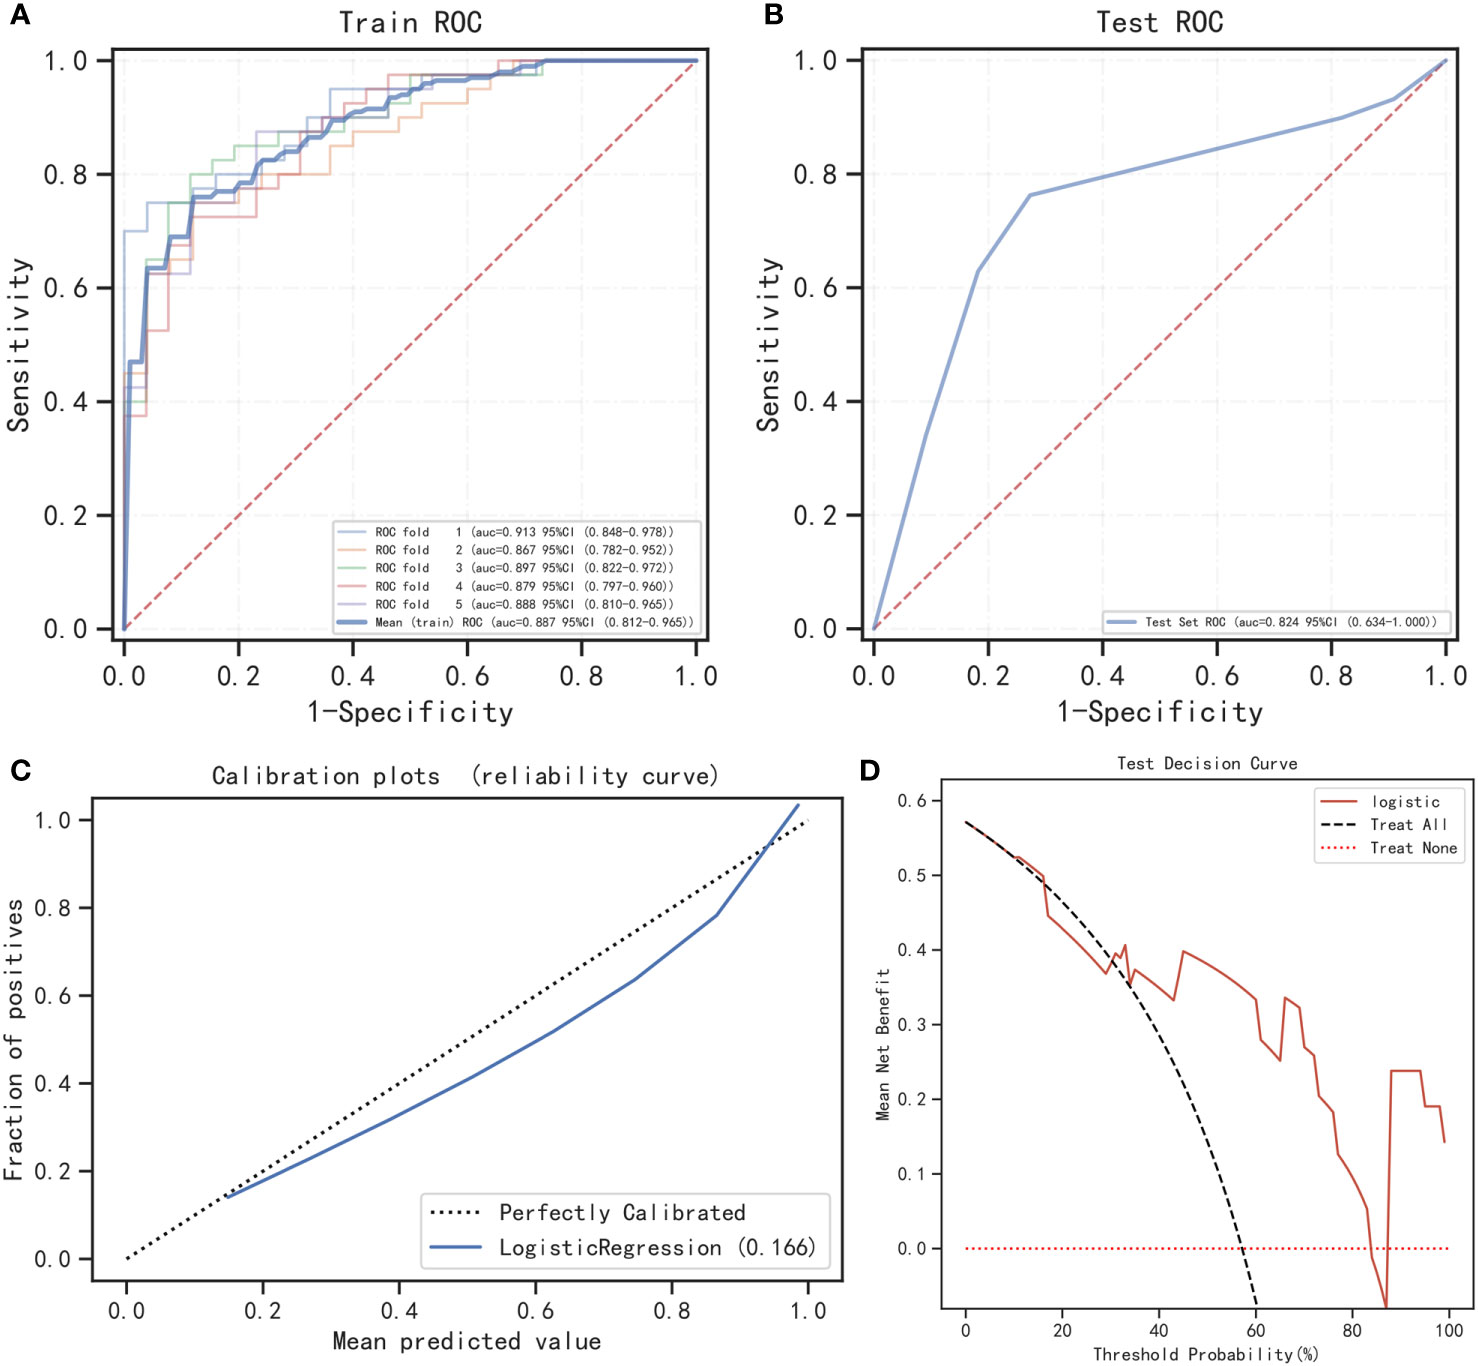
Figure 4 Performance of the prediction model. (A) The training cohort’s ROC curve; (B) the testing cohort’s ROC curve; (C) calibration curve analysis; (D) decision curve analysis.
Figure 5A shows the relationship between the observed values of the four most relevant features that we selected and the SHAP values. As shown in Figure 5B, the logistic regression model interpretation of feature ranking, as per the SHAP algorithm, indicates that age, DD, IL-2, and IgG Sum/IgG 1 were the most influential characteristics for predicting outcomes of elderly patients. The greater the mean absolute Shapley value of the features, the greater the importance of the clinical features for the model prediction. Using SHAP force plots, the study can visualize the Shapley value for each feature as a force that increases (positive) or decreases (negative) its baseline predicted value. Figure 5 shows the individual force plots for severe patients with COVID-19 (Figure 5C) and non-severe patients with COVID-19 (Figure 5D). The probabilistic predicted value of the severe group was 0.759. The positive contribution value features in red represent pushing up the model score, while the negative contribution features in blue represent pushing down the model score. The length of the arrow helps to visualize the extent of the impact on the prediction. The longer the arrow, the greater the impact on the prediction of COVID-19 severity.
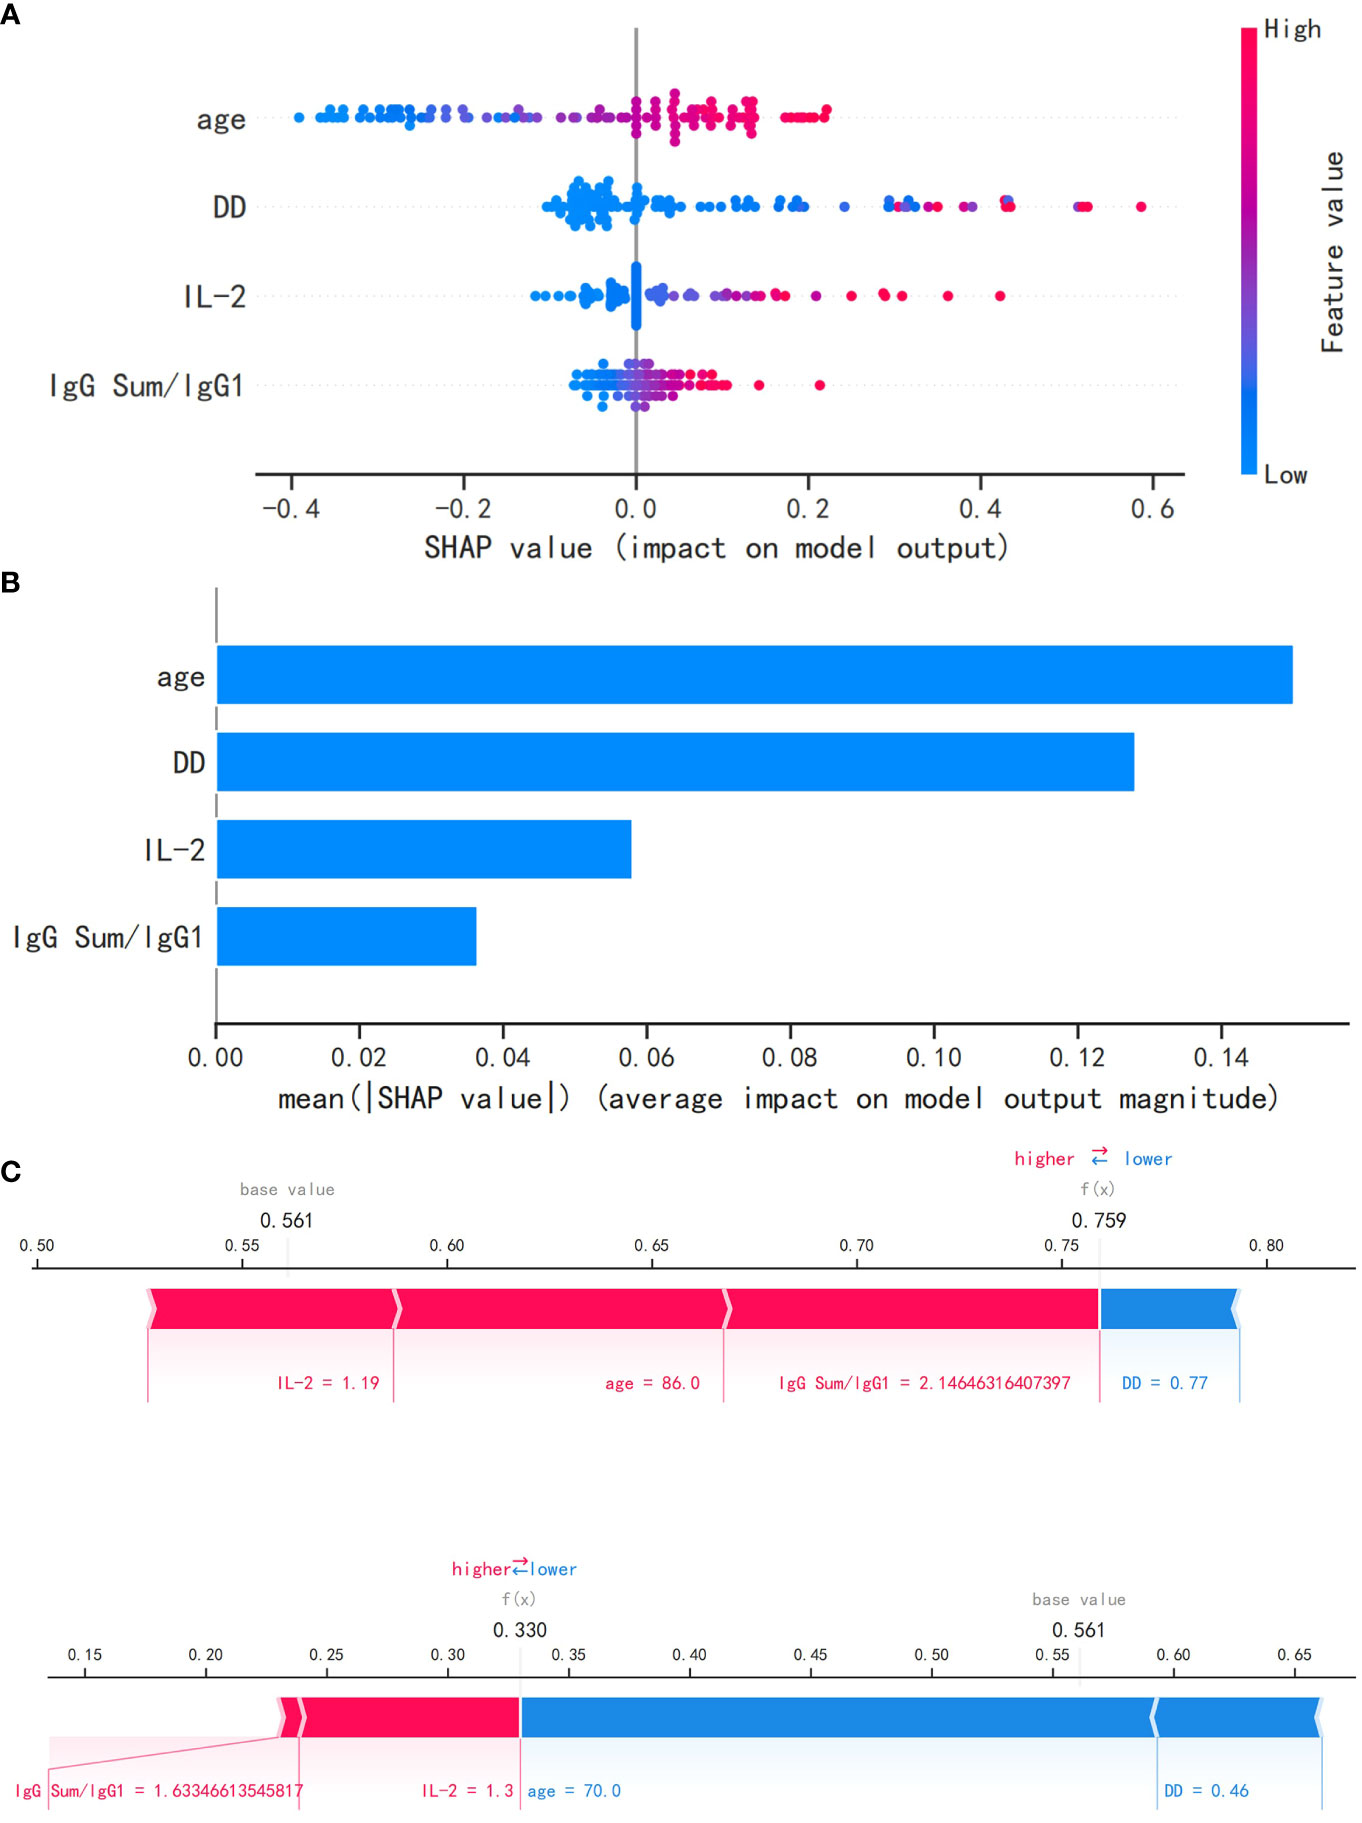
Figure 5 The logistic regression model utilizing the SHAP algorithm. (A) The SHAP value, which indicates the level of impact on the result, is represented on the abscissa for each feature. A sample is represented by each dot. As the color becomes more red, the feature’s value increases, while a bluer color indicates a lower value. (B) The SHAP analysis revealed the ranking of feature importance. IL-2, interleukin 2; SHAP, Shapley additive explanations. (C) The SHAP force plot for severe patients with COVID-19. (D) The SHAP force plot for non-severe patients with COVID-19.
External validation of logistic regression model
A total of 22 elderly COVID-19 patients were collected from other two centers as an external validation cohort. The AUC of the newly built model was 0.74, as demonstrated in Figure 6, using the validation cohort from an external source.
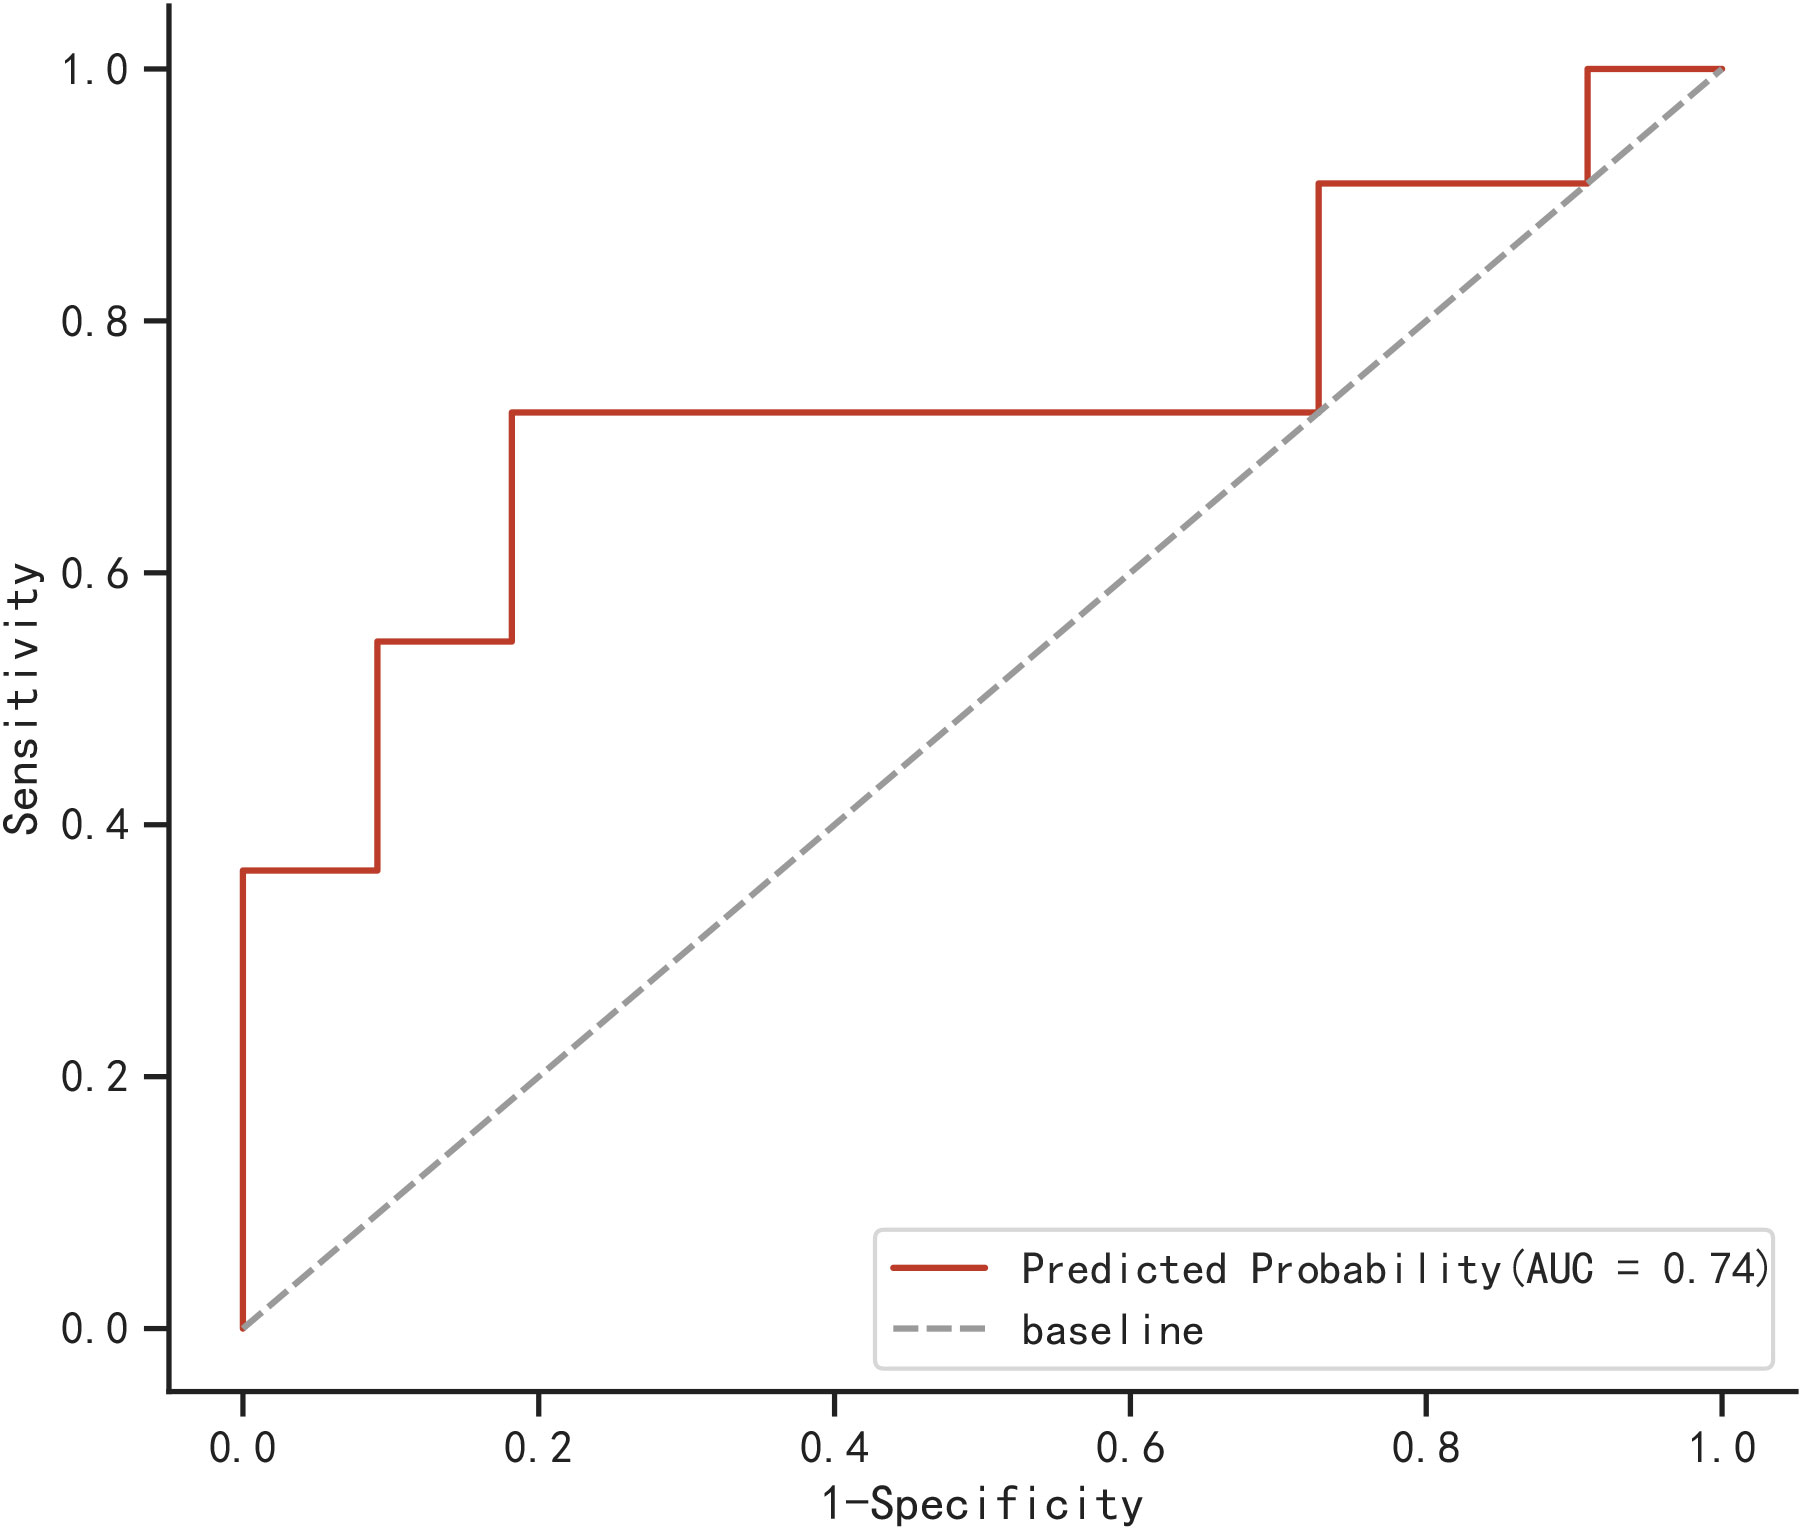
Figure 6 ROC for external validation of logistic regression model.
Compared with different levels of clinicians
Using a logistic regression model, the present study compared the performance of four clinicians (including two junior clinicians and two senior clinicians) in predicting the severity of elderly COVID-19 patients. Figure 7 demonstrates the performance comparison between the logical regression model and the human diagnosis of elderly COVID-19 patients. Among the results, the logistic regression model had an accuracy rate of 0.875, which is significantly higher than that of senior clinicians (0.8375) and junior clinicians (0.7375). The newly built model also performed better than human classifiers in terms of F1-score, recall, and precision.
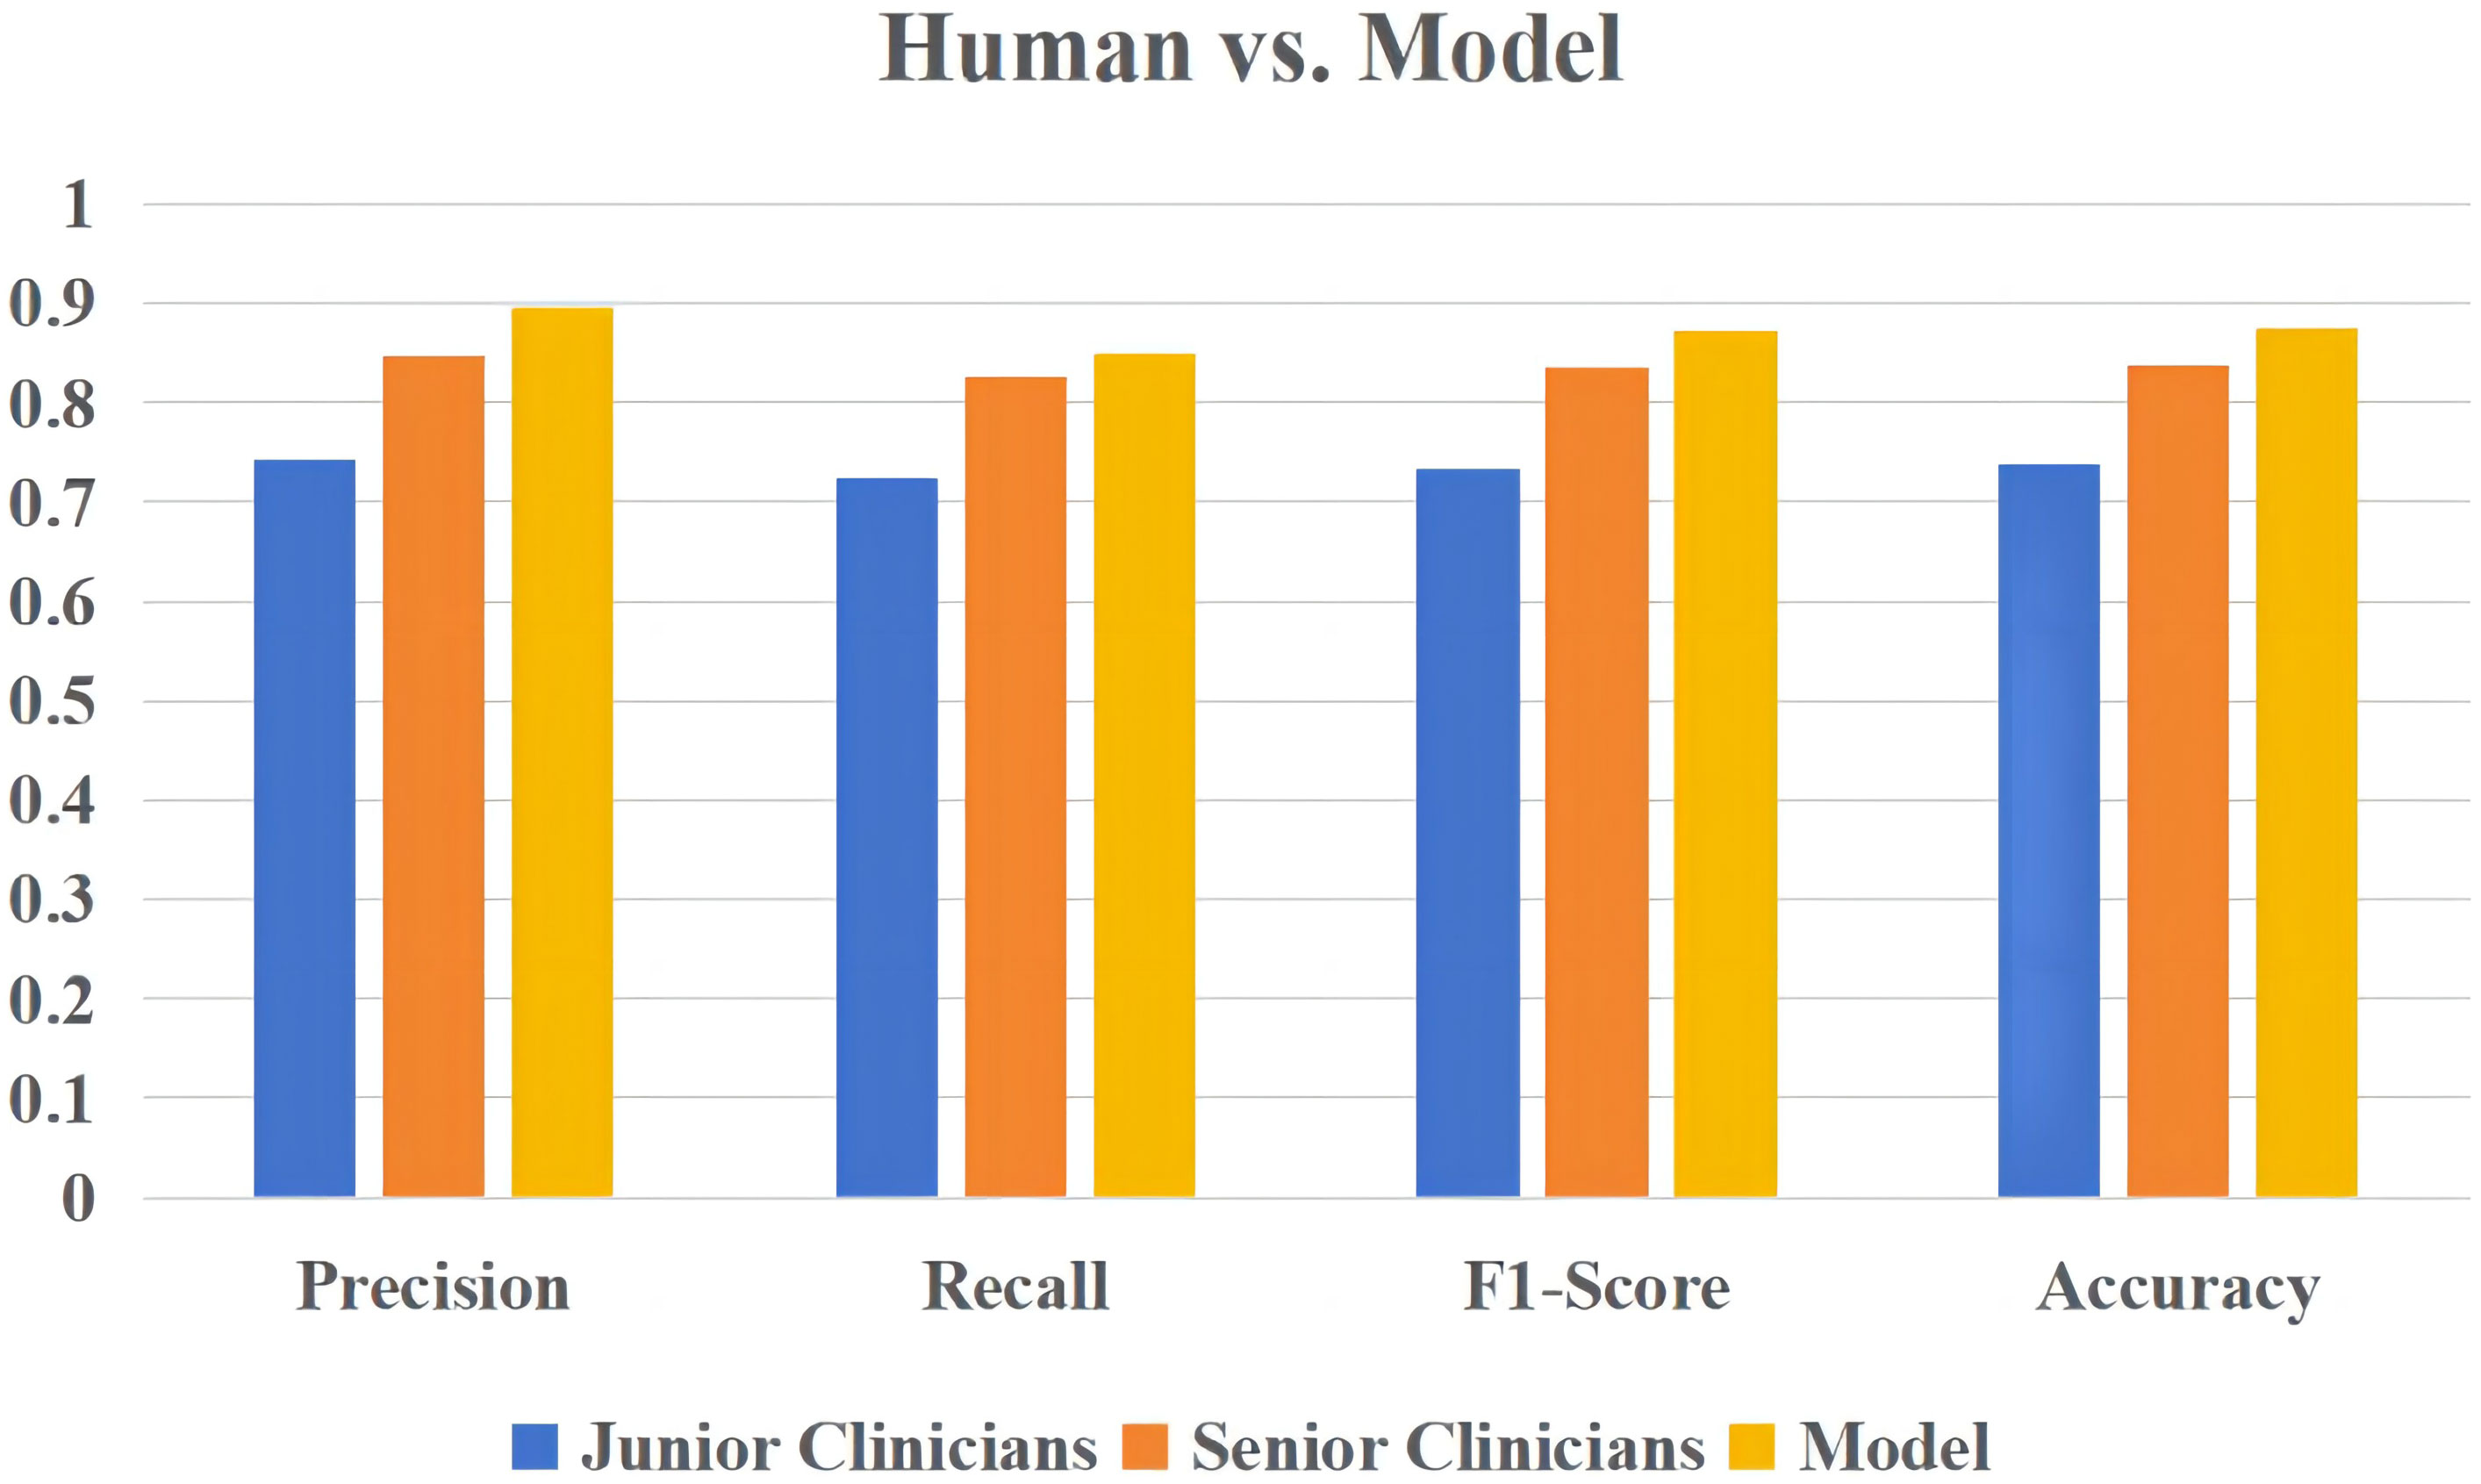
Figure 7 The overall performance of the logistic regression model versus human diagnosis in predicting the severity of elderly COVID-19 patients.
Discussion
COVID-19 is spreading throughout the world at a high speed. Although the majority of individuals have modest symptoms and a favorable prognosis, COVID-19 could progress to ARDS and possibly death. The risk of contracting COVID-19 is higher among the elderly, and they experience more severe symptoms compared to other age groups (17, 18). Effective COVID-19 treatments are still lacking (19, 20). Currently, several models have been suggested for forecasting the severity of COVID-19, with the majority concentrating on ordinary patients, while limited emphasis has been placed on elderly patients (13, 21, 22). Therefore, a predictive model for monitoring disease progression and forecasting the severity of COVID-19 in elderly individuals is urgently needed.
In recent years, machine learning has been developing rapidly, which has been widely used in predicting human diseases (23, 24), recognizing medical images (25, 26), and analyzing clinical laboratory data (27). ML can help humans efficiently process large amounts of clinical data and look for connections between different laboratory results. As medical laboratory practitioners, what are we trying to do through machine learning to help clinicians differentiate the severity of elderly COVID-19 patients?
In this study, age, IL-2, IgG Sum/IgG 1, and DD were identified and utilized in the development of the model. Through evaluation using the AUC value, calibration plot, and DCA plot, the model demonstrated good discrimination and calibration in predicting severe and non-severe cases of COVID-19 in elderly patients. This indicates a strong performance and higher clinical utility. Furthermore, the model performed effectively in both the testing cohort (AUC=0.824) and the external validation cohort (AUC=0.74). These results indicated that the model had significant value in accurately evaluating the probability of severe COVID-19 occurring in elderly patients on an individual basis.
Patients with comorbidities have been shown to be more likely to present with severe pneumonia (28). The present study found no statistically significant difference in tumor, diabetes, hypertension, coronary heart disease, COPD, and anemia between the two groups of different severity (p >0.05). In this study, 63.11% of patients were male, which was similar to the proportion of men (67.68%) reported by Chen et al. (2). Additionally, it was observed that severe patients tended to be significantly older compared to non-severe patients.
Among the common laboratory abnormalities, this study observed an increased total leukocyte count, increased NE #, and decreased LY # in severe patients. Pneumonia progression in elderly individuals with COVID-19 was influenced by elevated NLR and age, as reported in a study (29). This corresponds with the results of the present study. The differences in NE #, LY #, and NLR were statistically significant compared with the non-severe group (p<0.001), while the difference in total leukocyte count was statistically significant (p =0.011<0.05). RDW reflects the level of a size change between red blood cells; Lee et al. (30) found a potential association between it and the risk of death in COVID-19 patients, while the present study reveals that RDW was greater in severe elderly patients compared to non-severe individuals (median, 14.05: 13.20, p<0.01) and also suggest that elevated RDW levels are associated with adverse outcomes in elderly patients. Interestingly, it is worth noting that PDW was a significant indicator of severe cases of COVID-19. PDW is utilized to depict the distribution of PLT volume, and when PLT is excessively consumed, the bone marrow produces abundant immature PLT that is larger than mature PLT. PDW is also significantly associated with sepsis and other severe illnesses, which is closely linked to poor COVID-19 outcomes and death (31, 32). In this study, the severe group showed a larger PDW, with a mean of 17.35 versus 16.88, which was significantly different from the non-severe group (p =0.001).
During the stage of systemic inflammation in COVID-19, there is a significant increase in inflammatory biomarkers like IL-2, IL-6, and CRP, which are dramatically enhanced. This stage represents the most severe manifestation of cytokine storms, and excessive inflammation may lead to multiple organ dysfunction (33–35). According to recent research, IL-6 has been identified as a predictive factor for the early detection of COVID-19 patients who are at a heightened risk of experiencing worsening disease progression (36, 37). Elevated IL-2 levels observed in individuals with COVID-19 could potentially suggest the activation of T cells (38). In this study, the levels of IL-2, IL-6, and CRP in the severe group were significantly higher than those in the non-severe group (p<0.01). Research has indicated that individuals with severe COVID-19 often experience a high prevalence of coagulation abnormalities (39). Recent pathological results show that immune thrombosis in these patients gathers inflammatory cells such as lymphocytes and neutrophils, and the immune thrombosis can develop into serious complications, which are strongly associated with the severity of the disease and mortality rates (40–42). In the present study, the levels of DD and PT were markedly elevated in severe patients than in non-severe individuals (p<0.01), consistent with the findings of Huang et al. (41) and Wang et al. (43). Elderly patients exhibit a continual inflammatory response and compromised coagulation after being infected with SARS-CoV-2, as evidenced by elevated levels of coagulation and inflammatory markers. Severe patients exhibited a greater degree of inflammation.
Of all antibodies against post-infection immunization, the IgG antibodies were the most prominent signature. This antibody not only marks the later stages of infection but also remains in the body for at least 6 months (44). IgG 1 is the most common IgG subtype, and viral infection usually induces both IgG 1 and IgG 3 (45). There were a few studies that reported the emergence of IgM and IgG antibodies when the SARS-CoV-2 virus invaded and suggested the application of serologic tests in the diagnosis of COVID-19 (46, 47). However, there is limited documentation regarding the IgG subtypes that are generated following SARS-CoV-2 infection (48, 49). According to Husain et al. (39), it was discovered that there could be a prevalence of abnormalities in IgG subtypes among severely ill COVID-19 patients, which should be further examined, as it could serve as an indicator of disease severity and a potential target for therapy. In the present study, significant variations in IgG subcategories were observed between healthy individuals and elderly COVID-19 patients (p<0.05). The study included IgG Sum/IgG 1 in the LASSO regression, which indicated that its predictor of COVID-19 severity in elderly patients outperformed individual IgG subtypes. Another important finding of the study was that IgG Sum/IgG 1 showed extremely significant differences between the two groups compared to IgG subtypes alone (p =0.009). The data show that the IgG 1 level of severe patients is significantly lower than that of non-severe patients (median, 5,614.50: 6,645.00), and IgG3 levels are higher than non-severe patients (median, 247.50: 203.00), and this variation could be attributed to the source of the samples and the clinical treatment received, indicating distinct in vivo IgG subtypes among different populations, even when they are infected by the identical pathogen.
Nomograms were used to assess their capability to predict the likelihood of severe illness upon admission in a number of studies (50, 51). No study, however, has investigated the potential of novel factors related to IgG subtypes in elderly patients with COVID-19. Although Sun et al. (14) established a model for predicting severe COVID-19 (sensitivity=100%, specificity=88.89%), it only included IgA, NE #, and EO # while neglecting IgG subtypes. In the present study, a predictive model of elderly patients was constructed with AUC=0.824, which is higher than the AUC=0.800 in the study by Zeng et al. (13). However, this study included specific laboratory indicators like IL-2 and IgG subtypes, which included new indicators of the immune response. Based on our current understanding, this model is the initial attempt to forecast the severity of elderly COVID-19 patients based on IgG subtypes.
Limitations
There were some limitations in this study. First of all, this study consisted of only 103 elderly individuals diagnosed with COVID-19. The sample size of 103 patients may be considered small. In further research, we will expand more participants and diversify the sample size from multiple sources to improve the generalization and performance of the model in different settings. Second, this model was built and verified using data from China. Patients from diverse nations and races in future studies need to be included to confirm the results. Moreover, there may be some inevitable bias, and clinicians’ assessment of disease severity may be subjective, potentially leading to some overlap between the severity groups. Finally, the present study might have resulted in variations in the outcomes of elderly COVID-19 patients from different hospitals at distinct time points during the peak of the COVID-19 outbreak in the current year. In the future, we will optimize the model and correct the defects of our model based on the present study.
Conclusion
In conclusion, a model based on machine learning for predicting the severity of COVID-19 was constructed. Four indicators (age, DD, IL-2, and IgG Sum/IgG 1) are filtered to construct the model. Five machine learning models (XGBoost, AdaBoost, SVM, logistic regression, and random forest) were used on the same dataset to predict the severity of elderly COVID-19 patients. The logistic regression model demonstrated the best prediction performance among them. In addition, the present study conducted external validation of the model using data from two other centers. This model demonstrates excellent discrimination and calibration, making it readily applicable in clinical practice, may predict outcomes as early as admission, and could assist clinicians in estimating COVID-19 severity and improving elderly patient outcomes. In further research, we will collect further data and conduct a multi-center study to enhance the generalization of the model. In addition, we are working on developing an online website or an applet plugin based on our model to facilitate its use by clinical practitioners. This will provide an efficient and user-friendly interface for doctors to input patient symptoms and get predictive results from the model.
Data availability statement
The original contributions presented in the study are included in the article/supplementary material. Further inquiries can be directed to the corresponding author.
Ethics statement
The studies involving humans were approved by Ethics Committee of The First Affiliated Hospital of Zhejiang Chinese Medical University. The studies were conducted in accordance with the local legislation and institutional requirements. The participants provided their written informed consent to participate in this study.
Author contributions
ZZ: Investigation, Writing – review & editing. YQ: Formal Analysis, Writing – original draft. YMY: Data curation, Methodology, Writing – review & editing. YY: Project administration, Writing – review & editing.
Funding
The author(s) declare that no financial support was received for the research, authorship, and/or publication of this article.
Conflict of interest
The authors declare that the research was conducted in the absence of any commercial or financial relationships that could be construed as a potential conflict of interest.
Publisher’s note
All claims expressed in this article are solely those of the authors and do not necessarily represent those of their affiliated organizations, or those of the publisher, the editors and the reviewers. Any product that may be evaluated in this article, or claim that may be made by its manufacturer, is not guaranteed or endorsed by the publisher.
References
1. Chen Y, Klein SL, Garibaldi BT, Li H, Wu C, Osevala NM, et al. Aging in Covid-19: vulnerability, immunity and intervention. Ageing Res Rev (2021) 65:101205. doi: 10.1016/j.arr.2020.101205
2. Chen N, Zhou M, Dong X, Qu J, Gong F, Han Y, et al. Epidemiological and clinical characteristics of 99 cases of 2019 novel coronavirus pneumonia in Wuhan, China: A descriptive study. Lancet (2020) 395(10223):507–13. doi: 10.1016/S0140-6736(20)30211-7
3. Kontopantelis E, Mamas MA, Deanfield J, Asaria M, Doran T. Excess mortality in England and wales during the first wave of the Covid-19 pandemic. J Epidemiol Community Health (2021) 75(3):213–23. doi: 10.1136/jech-2020-214764
4. Gonzalez JC, Chakraborty S, Thulin NK, Wang TT. Heterogeneity in Igg-Cd16 signaling in infectious disease outcomes. Immunol Rev (2022) 309(1):64–74. doi: 10.1111/imr.13109
5. Chakraborty S, Gonzalez J, Edwards K, Mallajosyula V, Buzzanco AS, Sherwood R, et al. Proinflammatory Igg Fc structures in patients with severe Covid-19. Nat Immunol (2021) 22(1):67–73. doi: 10.1038/s41590-020-00828-7
6. Zack JE, Garrison T, Trovillion E, Clinkscale D, Coopersmith CM, Fraser VJ, et al. Effect of an education program aimed at reducing the occurrence of ventilator-associated pneumonia. Crit Care Med (2002) 30(11):2407–12. doi: 10.1097/00003246-200211000-00001
7. Moulaei K, Shanbehzadeh M, Mohammadi-Taghiabad Z, Kazemi-Arpanahi H. Comparing machine learning algorithms for predicting Covid-19 mortality. BMC Med Inform Decis Mak (2022) 22(1):2. doi: 10.1186/s12911-021-01742-0
8. Shahin OR, Alshammari HH, Taloba AI, El-Aziz RMA. Machine learning approach for autonomous detection and classification of Covid-19 virus. Comput Electr Eng (2022) 101:108055. doi: 10.1016/j.compeleceng.2022.108055
9. Alali Y, Harrou F, Sun Y. A proficient approach to forecast Covid-19 spread via optimized dynamic machine learning models. Sci Rep (2022) 12(1):2467. doi: 10.1038/s41598-022-06218-3
10. Pan P, Li Y, Xiao Y, Han B, Su L, Su M, et al. Prognostic assessment of Covid-19 in the intensive care unit by machine learning methods: model development and validation. J Med Internet Res (2020) 22(11):e23128. doi: 10.2196/23128
11. Budimirovic N, Prabhu E, Antonijevic M, Zivkovic M, Bacanin N, Strumberger I, et al. Covid-19 severity prediction using enhanced whale with Salp swarm feature classification. Comput Mater Continua (2022) 1(7):1685–98. doi: 10.32604/cmc.2022.023418
12. Zivkovic M, Bacanin N, Antonijevic M, Nikolic B, Kvascev G, Marjanovic M, et al. Hybrid Cnn and Xgboost model tuned by modified arithmetic optimization algorithm for Covid-19 early diagnostics from X-ray images. Electr (2022) 11(22):3798. doi: 10.3390/electronics11223798
13. Zeng F, Deng G, Cui Y, Zhang Y, Dai M, Chen L, et al. A predictive model for the severity of Covid-19 in elderly patients. Aging (Albany NY) (2020) 12(21):20982–96. doi: 10.18632/aging.103980
14. Sun C, Xue M, Yang M, Zhu L, Zhao Y, Lv X, et al. Early prediction of severe Covid-19 in patients by a novel immune-related predictive model. mSphere (2021) 6(5):e0075221. doi: 10.1128/mSphere.00752-21
15. National Health Commission of the People’s Republic of China. Diagnosis and treatment plan for COVID-19 (Trial Version 10) [J]. Chin J Infect Dis (2023) 16(1):1–9. doi: 10.3760/cma.j.issn.1674-2397.2023.01.001
16. Jin JM, Bai P, He W, Wu F, Liu XF, Han DM, et al. Gender differences in patients with Covid-19: focus on severity and mortality. Front Public Health (2020) 8:152. doi: 10.3389/fpubh.2020.00152
17. Lynch SM, Guo G, Gibson DS, Bjourson AJ, Rai TS. Role of senescence and aging in Sars-Cov-2 infection and Covid-19 disease. Cells (2021) 10(12):3367. doi: 10.3390/cells10123367
18. Guan WJ, Ni ZY, Hu Y, Liang WH, Ou CQ, He JX, et al. Clinical characteristics of coronavirus disease 2019 in China. N Engl J Med (2020) 382(18):1708–20. doi: 10.1056/NEJMoa2002032
19. Russell CD, Millar JE, Baillie JK. Clinical evidence does not support corticosteroid treatment f-or 2019-Ncov lung injury. Lancet (2020) 395(10223):473–5. doi: 10.1016/S0140-6736(20)30317-2
20. Li G, De Clercq E. Therapeutic options for the 2019 novel coronavirus (2019-Ncov). Nat Rev Drug Discov (2020) 19(3):149–50. doi: 10.1038/d41573-020-00016-0
21. Gong J, Ou J, Qiu X, Jie Y, Chen Y, Yuan L, et al. A tool for early prediction of severe coronavirus disease 2019 (Covid-19): A multicenter study using the risk nomogram in Wuhan and Guangdong, China. Clin Infect Dis (2020) 71(15):833–40. doi: 10.1093/cid/ciaa443
22. Ji D, Zhang D, Xu J, Chen Z, Yang T, Zhao P, et al. Prediction for progression risk in patients with Covid-19 pneumonia: the call score. Clin Infect Dis (2020) 71(6):1393–9. doi: 10.1093/cid/ciaa414
23. Tomasev N, Glorot X, Rae JW, Zielinski M, Askham H, Saraiva A, et al. A clinically applicable approach to continuous prediction of future acute kidney injury. Nature (2019) 572(7767):116–9. doi: 10.1038/s41586-019-1390-1
24. Zou H, Lu Z, Weng W, Yang L, Yang L, Leng X, et al. Diagnosis of neurosyphilis in Hiv-negative patients with syphilis: development, validation, and clinical utility of a suite of machine learning models. EClinicalMedicine (2023) 62:102080. doi: 10.1016/j.eclinm.2023.102080
25. Saric R, Kevric J, Hadziabdic N, Osmanovic A, Kadic M, Saracevic M, et al. Dental age assessment based on Cbct images using machine learning algorithms. Forensic Sci Int (2022) 334:111245. doi: 10.1016/j.forsciint.2022.111245
26. Jukic S, Saraevi MH, Kevric J. Comparison of ensemble machine learning methods for automated classification of focal and non-focal epileptic Eeg signals. Mathematics (2020) 8(9):1418. doi: 10.3390/math8091481
27. Yang HS, Rhoads DD, Sepulveda J, Zang C, Chadburn A, Wang F, et al. Challenges and considerations of developing and implementing machine learning tools for clinical laboratory medicine practice. Arch Pathol Lab Med (2023). 147(7):826–36. doi: 10.5858/arpa.2021-0635-RA
28. Wang T, Du Z, Zhu F, Cao Z, An Y, Gao Y, et al. Comorbidities and multi-organ injuries in the treatment of Covid-19. Lancet (2020) 395(10228):e52. doi: 10.1016/S0140-6736(20)30558-4
29. Yang AP, Liu JP, Tao WQ, Li HM. The diagnostic and predictive role of Nlr, D-Nlr and Plr in Covid-19 patients. Int Immunopharmacol (2020) 84:106504. doi: 10.1016/j.intimp.2020.106504
30. Lee JJ, Montazerin SM, Jamil A, Jamil U, Marszalek J, Chuang ML, et al. Association between red blood cell distribution width and mortality and severity among patients with covid-19: A systematic review and meta-analysis. J Med Virol (2021) 93(4):2513–22. doi: 10.1002/jmv.26797
31. Zhang S, Cui YL, Diao MY, Chen DC, Lin ZF. Use of platelet indices for determining illness severity and predicting prognosis in critically ill patients. Chin Med J (Engl) (2015) 128(15):2012–8. doi: 10.4103/0366-6999.161346
32. Dubey A, Kumar S, Acharya S, Wanjari AK, Bawankule S, Agrawal S, et al. Impact of red cell and platelet distribution width in patients of medical intensive care unit. J Lab Physicians (2021) 13(4):309–16. doi: 10.1055/s-0041-1730883
33. Siddiqi HK, Mehra MR. Covid-19 illness in native and immunosuppressed states: A clinical-ther-apeutic staging proposal. J Heart Lung Transplant (2020) 39(5):405–7. doi: 10.1016/j.healun.2020.03.012
34. Karki R, Sharma BR, Tuladhar S, Williams EP, Zalduondo L, Samir P, et al. Synergism of Tnf-Alpha and Ifn-gamma triggers inflammatory cell death, tissue damage, and mortality in Sars-Cov-2 infection and cytokine shock syndromes. Cell (2021) 184(1):149–68.e17. doi: 10.1016/j.cell.2020.11.025
35. Karki R, Kanneganti TD. Innate immunity, cytokine storm, and inflammatory cell death in Covid-19. J Transl Med (2022) 20(1):542. doi: 10.1186/s12967-022-03767-z
36. Zhou Y, Fu B, Zheng X, Wang D, Wei H. Aberrant pathogenic Gm-Csf + T cells and inflammatory Cd14 + Cd16 + Monocytes in severe pulmonary syndrome patients of a new coronavirus. Natl Sci Rev (2020). 7(6):998–1002. doi: 10.1101/2020.02.12.945576
37. Han H, Ma Q, Li C, Liu R, Zhao L, Wang W, et al. Profiling serum cytokines in covid-19 patients reveals Il-6 and Il-10 are disease severity predictors. Emerg Microbes Infect (2020) 9(1):1123–30. doi: 10.1080/22221751.2020.1770129
38. Akbari H, Tabrizi R, Lankarani KB, Aria H, Vakili S, Asadian F, et al. The role of cytokine profile and lymphocyte subsets in the severity of coronavirus disease 2019 (Covid-19): A systematic review and meta-analysis. Life Sci (2020) 258:118167. doi: 10.1016/j.lfs.2020.118167
39. Lin L, Lu L, Cao W, Li T. Hypothesis for potential pathogenesis of Sars-Cov-2 infection-a review of immune changes in patients with viral pneumonia. Emerg Microbes Infect (2020) 9(1):727–32. doi: 10.1080/22221751.2020.1746199
40. Fox SE, Akmatbekov A, Harbert JL, Li G, Quincy Brown J, Vander Heide RS. Pulmonary and cardiac pathology in African American patients with Covid-19: an autopsy series from New Orleans. Lancet Respir Med (2020) 8(7):681–6. doi: 10.1016/S2213-2600(20)30243-5
41. Huang C, Wang Y, Li X, Ren L, Zhao J, Hu Y, et al. Clinical features of patients infected with 2019 novel coronavirus in Wuhan, China. Lancet (2020) 395(10223):497–506. doi: 10.1016/S0140-6736(20)30183-5
42. Berkman SA, Tapson VF. Covid-19 and its implications for thrombosis and anticoagulation. Semin Respir Crit Care Med (2021) 42(2):316–26. doi: 10.1055/s-0041-1722992
43. Wang D, Hu B, Hu C, Zhu F, Liu X, Zhang J, et al. Clinical characteristics of 138 hospitalized patients with 2019 novel coronavirus-infected pneumonia in Wuhan, China. JAMA (2020) 323(11):1061–9. doi: 10.1001/jama.2020.1585
44. Chansaenroj J, Yorsaeng R, Posuwan N, Puenpa J, Wanlapakorn N, Sudhinaraset N, et al. Long-term specific Igg response to Sars-Cov-2 nucleocapsid protein in recovered Covid-19 patients. Sci Rep-Uk (2021) 11(1):23216. doi: 10.1038/s41598-021-02659-4
45. Bruhns P, Iannascoli B, England P, Mancardi DA, Fernandez N, Jorieux S, et al. Specificity and affinity of human Fcgamma receptors and their polymorphic variants for human igg subclasses. Blood (2009) 113(16):3716–25. doi: 10.1182/blood-2008-09-179754
46. Long QX, Liu BZ, Deng HJ, Wu GC, Deng K, Chen YK, et al. Antibody responses to Sars-Cov-2 in patients with Covid-19. Nat Med (2020) 26(6):845–8. doi: 10.1038/s41591-020-0897-1
47. Kong WH, Zhao R, Zhou JB, Wang F, Kong DG, Sun JB, et al. Serologic response to Sars-Cov-2 in Covid-19 patients with different severity. Virol Sin (2020) 35(6):752–7. doi: 10.1007/s12250-020-00270-x
48. Suthar MS, Zimmerman MG, Kauffman RC, Mantus G, Linderman SL, Hudson WH, et al. Rapid generation of neutralizing antibody responses in Covid-19 patients. Cell Rep Med (2020) 1(3):100040. doi: 10.1016/j.xcrm.2020.100040
49. Ni L, Ye F, Cheng ML, Feng Y, Deng YQ, Zhao H, et al. Detection of Sars-Cov-2-specific humoral and cellular immunity in Covid-19 convalescent individuals. Immunity (2020) 52(6):971–7.e3. doi: 10.1016/j.immuni.2020.04.023
50. Xue G, Gan X, Wu Z, Xie D, Xiong Y, Hua L, et al. Novel serological biomarkers for inflammation in predicting disease severity in patients with Covid-19. Int Immunopharmacol (2020) 89(Pt A):107065. doi: 10.1016/j.intimp.2020.107065
Keywords: COVID-19, elderly patients, severity, IgG subtypes, predictive model, machine learning
Citation: Zhuang Z, Qi Y, Yao Y and Yu Y (2023) A predictive model for disease severity among COVID-19 elderly patients based on IgG subtypes and machine learning. Front. Immunol. 14:1286380. doi: 10.3389/fimmu.2023.1286380
Received: 31 August 2023; Accepted: 15 November 2023;
Published: 30 November 2023.
Edited by:
Calogero Caruso, University of Palermo, ItalyReviewed by:
Changzheng Chen, Renmin Hospital of Wuhan University, ChinaMuzafer Saracevic, University of Novi Pazar, Serbia
Miodrag Zivkovic, Singidunum University, Serbia
Copyright © 2023 Zhuang, Qi, Yao and Yu. This is an open-access article distributed under the terms of the Creative Commons Attribution License (CC BY). The use, distribution or reproduction in other forums is permitted, provided the original author(s) and the copyright owner(s) are credited and that the original publication in this journal is cited, in accordance with accepted academic practice. No use, distribution or reproduction is permitted which does not comply with these terms.
*Correspondence: Ying Yu, yuying721030@163.com
†These authors have contributed equally to this work and share first authorship