
95% of researchers rate our articles as excellent or good
Learn more about the work of our research integrity team to safeguard the quality of each article we publish.
Find out more
ORIGINAL RESEARCH article
Front. Immunol. , 01 November 2024
Sec. Viral Immunology
Volume 15 - 2024 | https://doi.org/10.3389/fimmu.2024.1445618
This article is part of the Research Topic Mathematical Modeling in Discovery and Analysis of Immune Responses View all 5 articles
 Linchao Zhu
 Yimin Yao*
Introduction: The mortality rate among older people infected with severe acute respiratory syndrome coronavirus 2 is alarmingly high. This study aimed to explore the predictive value of a novel model for assessing the risk of death in this vulnerable cohort.
Methods: We enrolled 199 older patients with coronavirus disease 2019 (COVID-19) from Zhejiang Provincial Hospital of Chinese Medicine (Hubin) between 16 December 2022 and 17 January 2023. Additionally, 90 patients from two other centers (Qiantang and Xixi) formed an external independent testing cohort. Univariate and multivariate analyses were used to identify the risk factors for mortality. Least absolute shrinkage and selection operator (LASSO) regression analysis was used to select variables associated with COVID-19 mortality. Nine machine-learning algorithms were used to predict mortality risk in older patients, and their performance was assessed using receiver operating characteristic curves, area under the curve (AUC), calibration curve analysis, and decision curve analysis.
Results: Neutrophil–monocyte ratio, neutrophil–lymphocyte ratio, C‐ reactive protein, interleukin 6, and D-dimer were considered to be relevant factors associated with the death risk of COVID-19-related death by LASSO regression. The Gaussian naive Bayes model was the best-performing model. In the validation cohort, the model had an AUC of 0.901, whereas in the testing cohort, the model had an AUC of 0.952. The calibration curve showed a good correlation between the actual and predicted probabilities, and the decision curve indicated a strong clinical benefit. Furthermore, the model had an AUC of 0.873 in an external independent testing cohort.
Discussion: In this study, a predictive machine-learning model was developed with an online prediction tool designed to assist clinicians in evaluating mortality risk factors and devising targeted and effective treatments for older patients with COVID-19, potentially reducing the mortality rates.
Severe acute respiratory syndrome coronavirus-2 (SARS-CoV-2) has posed a significant global health challenge since December 2019 with the coronavirus disease 2019 (COVID-19) pandemic spreading rapidly worldwide. As of 12 February 2024, the infection has affected over 760 million individuals worldwide, resulting in 6.9 million deaths (1). COVID-19 manifests as a spectrum of clinical symptoms, from asymptomatic or mild cases to severe presentations such as pneumonia, respiratory distress syndrome, or death (2). Notably, older adults experience higher severity and mortality rates than younger people, with those over the age of 85 years facing a 330-fold higher risk of death (3). Immunosenescence and the presence of underlying chronic diseases contribute to the heightened vulnerability of older people to severe COVID-19 outcomes (4–6). It is imperative to establish robust laboratory diagnostics to mitigate the risk of mortality among older patients.
Machine learning (ML) is of great value in the medical field, and many studies have utilized machine learning as a tool to identify and classify data, aiming to identify individual features of data from ML, establish models through science, and subsequently utilize new data through these models to forecast future data (7). Machine-learning algorithms have been employed as an effective research approach for predicting the spread of deadly infectious diseases, such as COVID-19 (8). Moulaei et al. (9) found that ML-based predictive models, particularly the random forest (RF) algorithm, potentially facilitate the identification of patients who are at high risk of mortality and inform appropriate interventions by clinicians using the most important clinical features (dyspnea, intensive care unit admission, and oxygen therapy). However, there is a lack of predictive models based on data from basic laboratory blood tests that focus on mortality. Predictive models can identify patients who are at increased risk of mortality and provide support to reduce deaths as soon as possible, which can provide more accurate predictions than relying on single factors or doctors’ intuitive judgments. Many studies have shown that inflammation and a hypercoagulable state play a significant role in older patients who are more prone to death from COVID-19 (10, 11). Neutrophil (NEU) count, lymphocyte (LYM) count, monocyte (MON) count, neutrophil–lymphocyte ratio (NLR), neutrophil–monocyte ratio (NMR), lymphocyte–monocyte ratio (LMR), C‐reactive protein (CRP) level, procalcitonin (PCT) level, and interleukin 6 (IL6) level are common indicators of systemic inflammation, and D-dimer (DD) is a hypercoagulable marker as well as an indicator for monitoring inflammation and severe infection (12–14). Laboratory blood tests are more convenient, economical, and less invasive than medical imaging, and the above indicators are obtained from basic and routine clinical blood tests that can be acquired at short notice.
In this study, we collected and analyzed inflammation and hypercoagulable indicators to build a predictive ML model that can assist clinicians in predicting the risk factors associated with mortality and in developing unique and effective treatment approaches for older patients infected with SARS-CoV-2.
This study was approved by the Ethics Committee of The First Affiliated Hospital of Zhejiang Chinese Medical University (reference number 2023-KLS-034-01). We conducted a retrospective analysis of 199 patients with COVID-19 diagnosed and treated at the Zhejiang Provincial Hospital of Chinese Medicine (Hubin) and 90 patients from two additional centers (Qiantang and Xixi) between 16 December 2022 and 17 January 2023. Patient data, including electronic medical records and laboratory indices, were obtained from the hospital information system. The inclusion criteria were as follows: 1) availability of complete clinical data, 2) age of 60 years or older, and 3) a positive real-time polymerase chain reaction result for SARS-CoV-2 RNA. On the other hand, the exclusion criteria were as follows: 1) presence of other infections, 2) co-occurrence with malignant tumors or severe blood/immune system disorders, and 3) receipt of blood transfusion within the previous month.
Detailed clinical information and data of the subjects were collected, including age, sex, comorbidities, routine peripheral blood examination (NEU count, LYM count, and MON count), CRP, DD, PCT, and IL6. The NLR, NMR, and LMR values were calculated as follows: NLR = NEU count (109/L)/LYM count (109/L); NMR = NEU count (109/L)/MON count (109/L); LMR = LYM count (109/L)/MON count (109/L). Peripheral blood was collected upon admission and centrifuged at 3,000g/min for 5 min to detect the above markers, and the results were available within 2 h. Based on patient outcomes, the 199 patients were divided into two groups: discharged group and deceased group. After enrollment, the 199 individuals were randomly assigned to the training cohort (75%, including 15% of the validation cohort) and the testing cohort (25%) for ML. By setting a random seed (random seed = 1), repeatability of the random process was ensured, allowing us to accurately reproduce the results when required. The random forest filling method was used to fill the data of age, NEU count, LYM count, MON count, NLR, NMR, LMR, CRP, PCT, IL6, and DD before training. The best model hyperparameters were selected by a grid search and a 10-fold cross-validation was performed. Ninety patients from the two other centers (Qiantang and Xixi) were included as an external independent testing cohort.
The Beckman Coulter DxAI platform (https://www.xsmartanalysis.com/beckman/login/) was used for statistical analysis. Least absolute shrinkage and selection operator (LASSO) regression analysis was used to identify factors associated with COVID-19 mortality. The optimal ML model was selected from nine candidates: XGBoost, logistic regression (LR), LightGBM (LGBM), RF, AdaBoost, decision tree (DT), gradient boosting decision tree (GBDT), Gaussian naive Bayes (GNB), and complement naive Bayes (CNB). The models were evaluated based on calibration plots, and their predictive performance was assessed using sensitivity, specificity, accuracy, predictive value, and the area under the curve (AUC) in both the testing and validation cohorts. The filtered model was validated using an external independent testing cohort.
Statistical analyses were performed using SPSS 16.0 and R version V4.2.3. Student’s t-test and the Wilcoxon signed-rank test were used to analyze measurement data, and the chi-square test was used to analyze count data between two groups. Numerical variables with normal distribution and homogeneity of variance were compared using Student’s t-test, whereas numerical variables with a normal distribution and heterogeneity of variance were compared using the Wilcoxon signed-rank test. LASSO regression analysis was performed to identify the factors associated with COVID-19-related death. The performance of these factors was assessed using receiver operating characteristic (ROC) curves. Statistical significance was set at P <0.05.
The baseline characteristics of the 199 patients are shown in Table 1. Of these, 157 (78.89%) were categorized as having recovered and were discharged, including 89 male patients (56.69%). There were 42 (21.11%) patients in the deceased group, including 30 male patients (71.43%). No significant sex differences for all laboratory indices were observed (P = 0.084). The mean age of the patients in the deceased group was significantly higher than that of the patients in the discharged group (P = 0.002). Hypertension was the most prevalent comorbidity in the deceased group, followed by diabetes, coronary heart disease, and renal dysfunction. Compared with the discharged group, the deceased group had significantly higher NEU counts, NLR, NMR, CRP, PCT, IL6, and DD. There were also markedly lower LYM and MON counts and lower LMR (P < 0.05).
LASSO regression analysis was conducted to identify factors influencing COVID-19 mortality (Table 1). NMR, NLR, CRP, IL6, PCT, and DD were identified as relevant factors associated with the risk of COVID-19-related death (Figure 1). Furthermore, we analyzed the AUC of these factors using ROC analysis (Figure 2) to predict the risk of mortality in older individuals with COVID-19 between the two groups. The AUC values for the NMR, NLR, CRP, IL6, PCT, and DD were 0.845, 0.865, 0.816, 0.783, 0.812, and 0.834, respectively.
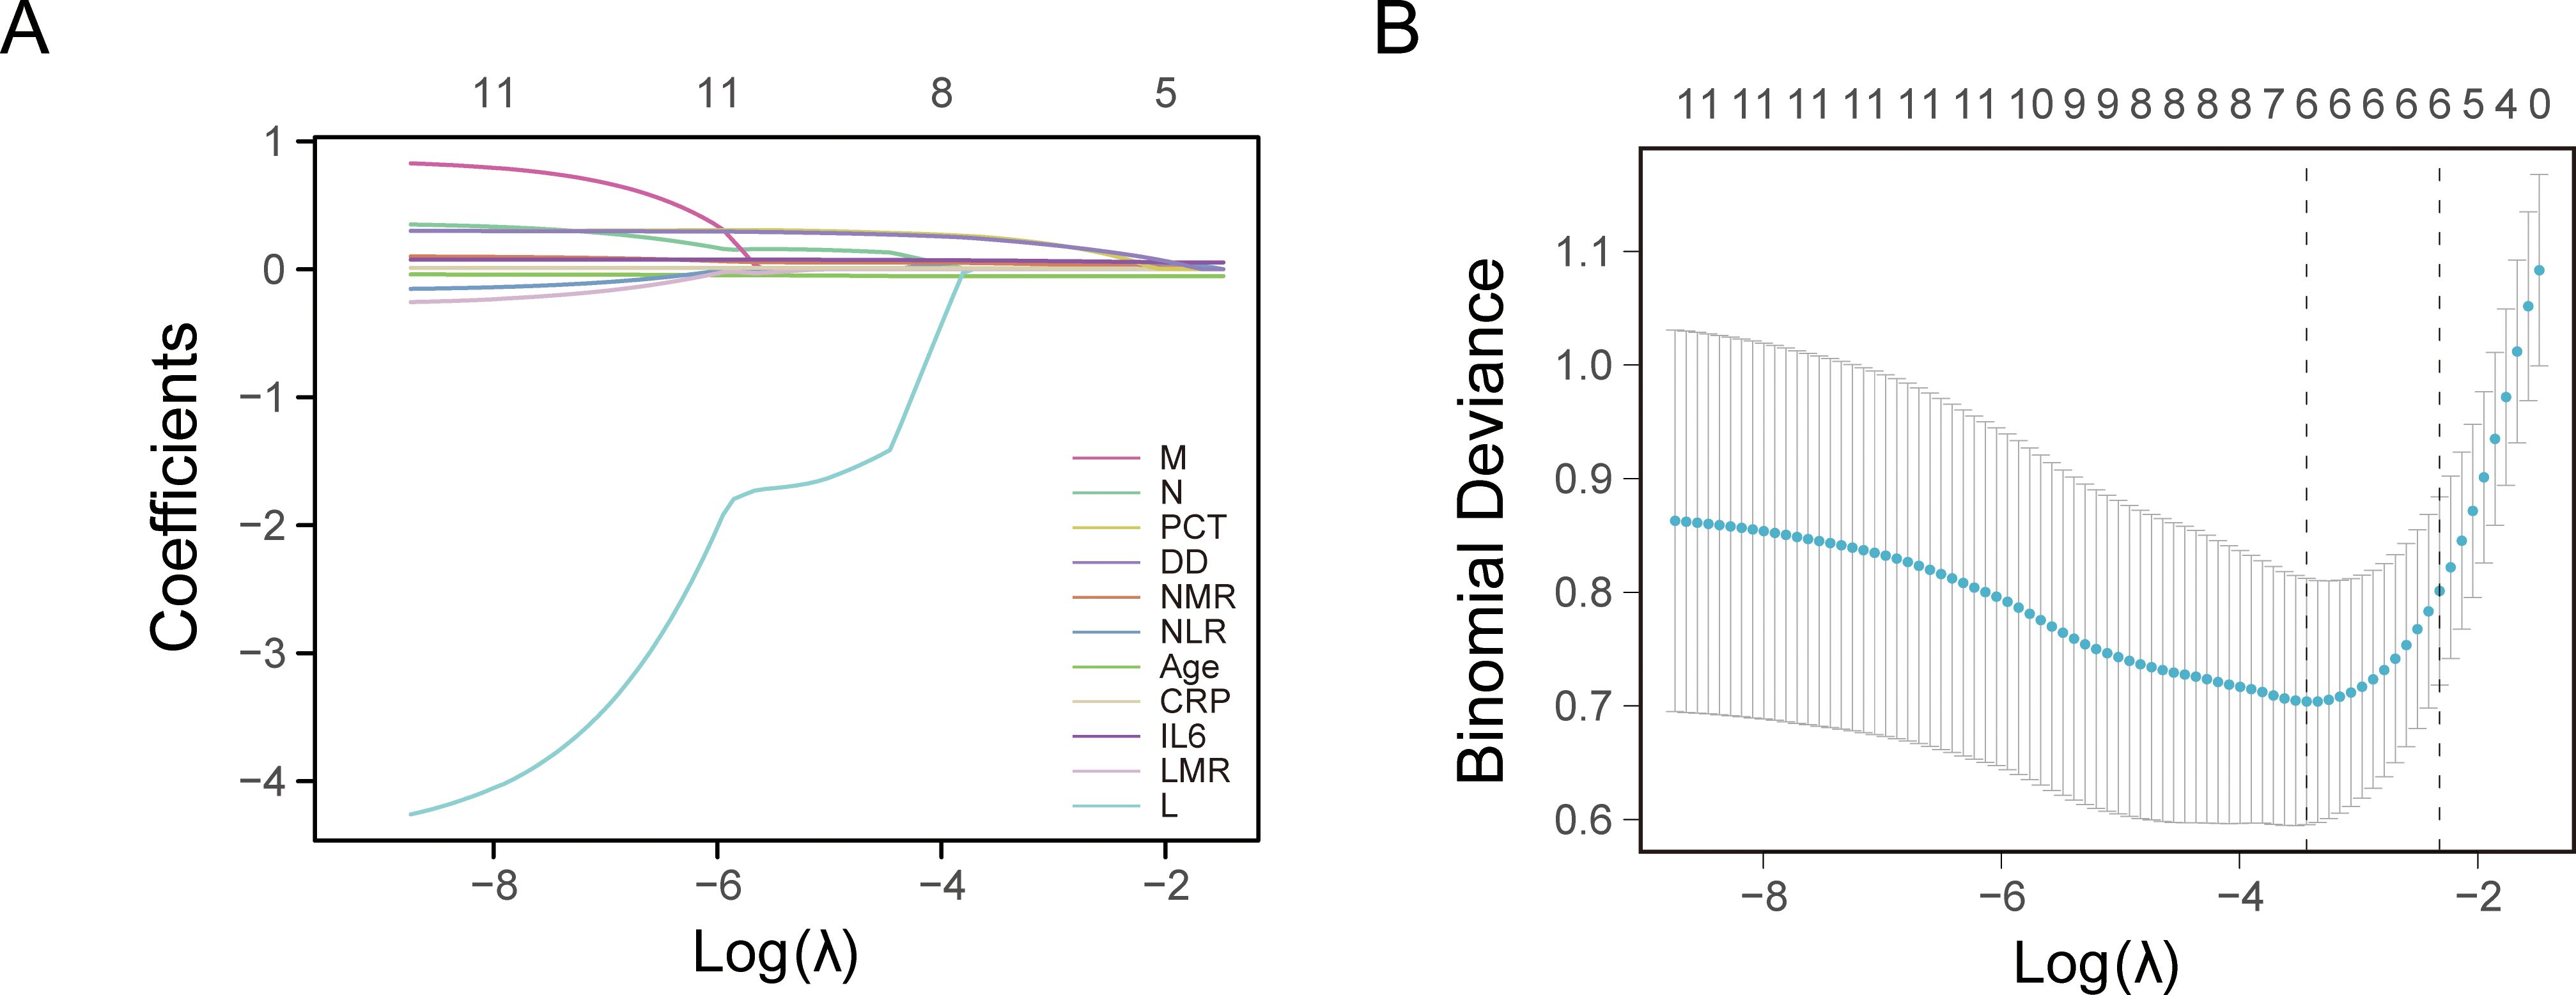
Figure 1. Least absolute shrinkage and selection operator (LASSO) regression analysis and 10-fold cross-validation for selecting factors associated with the death of coronavirus disease 2019 (COVID-19) elderly patients. (A) Bias selection of the tuning parameter (lambda) in LASSO regression based on the minimum standard (left dashed line) and 1-SE (standard error) standard (right dashed line). (B) A joint plot was created based on the log-likelihood.
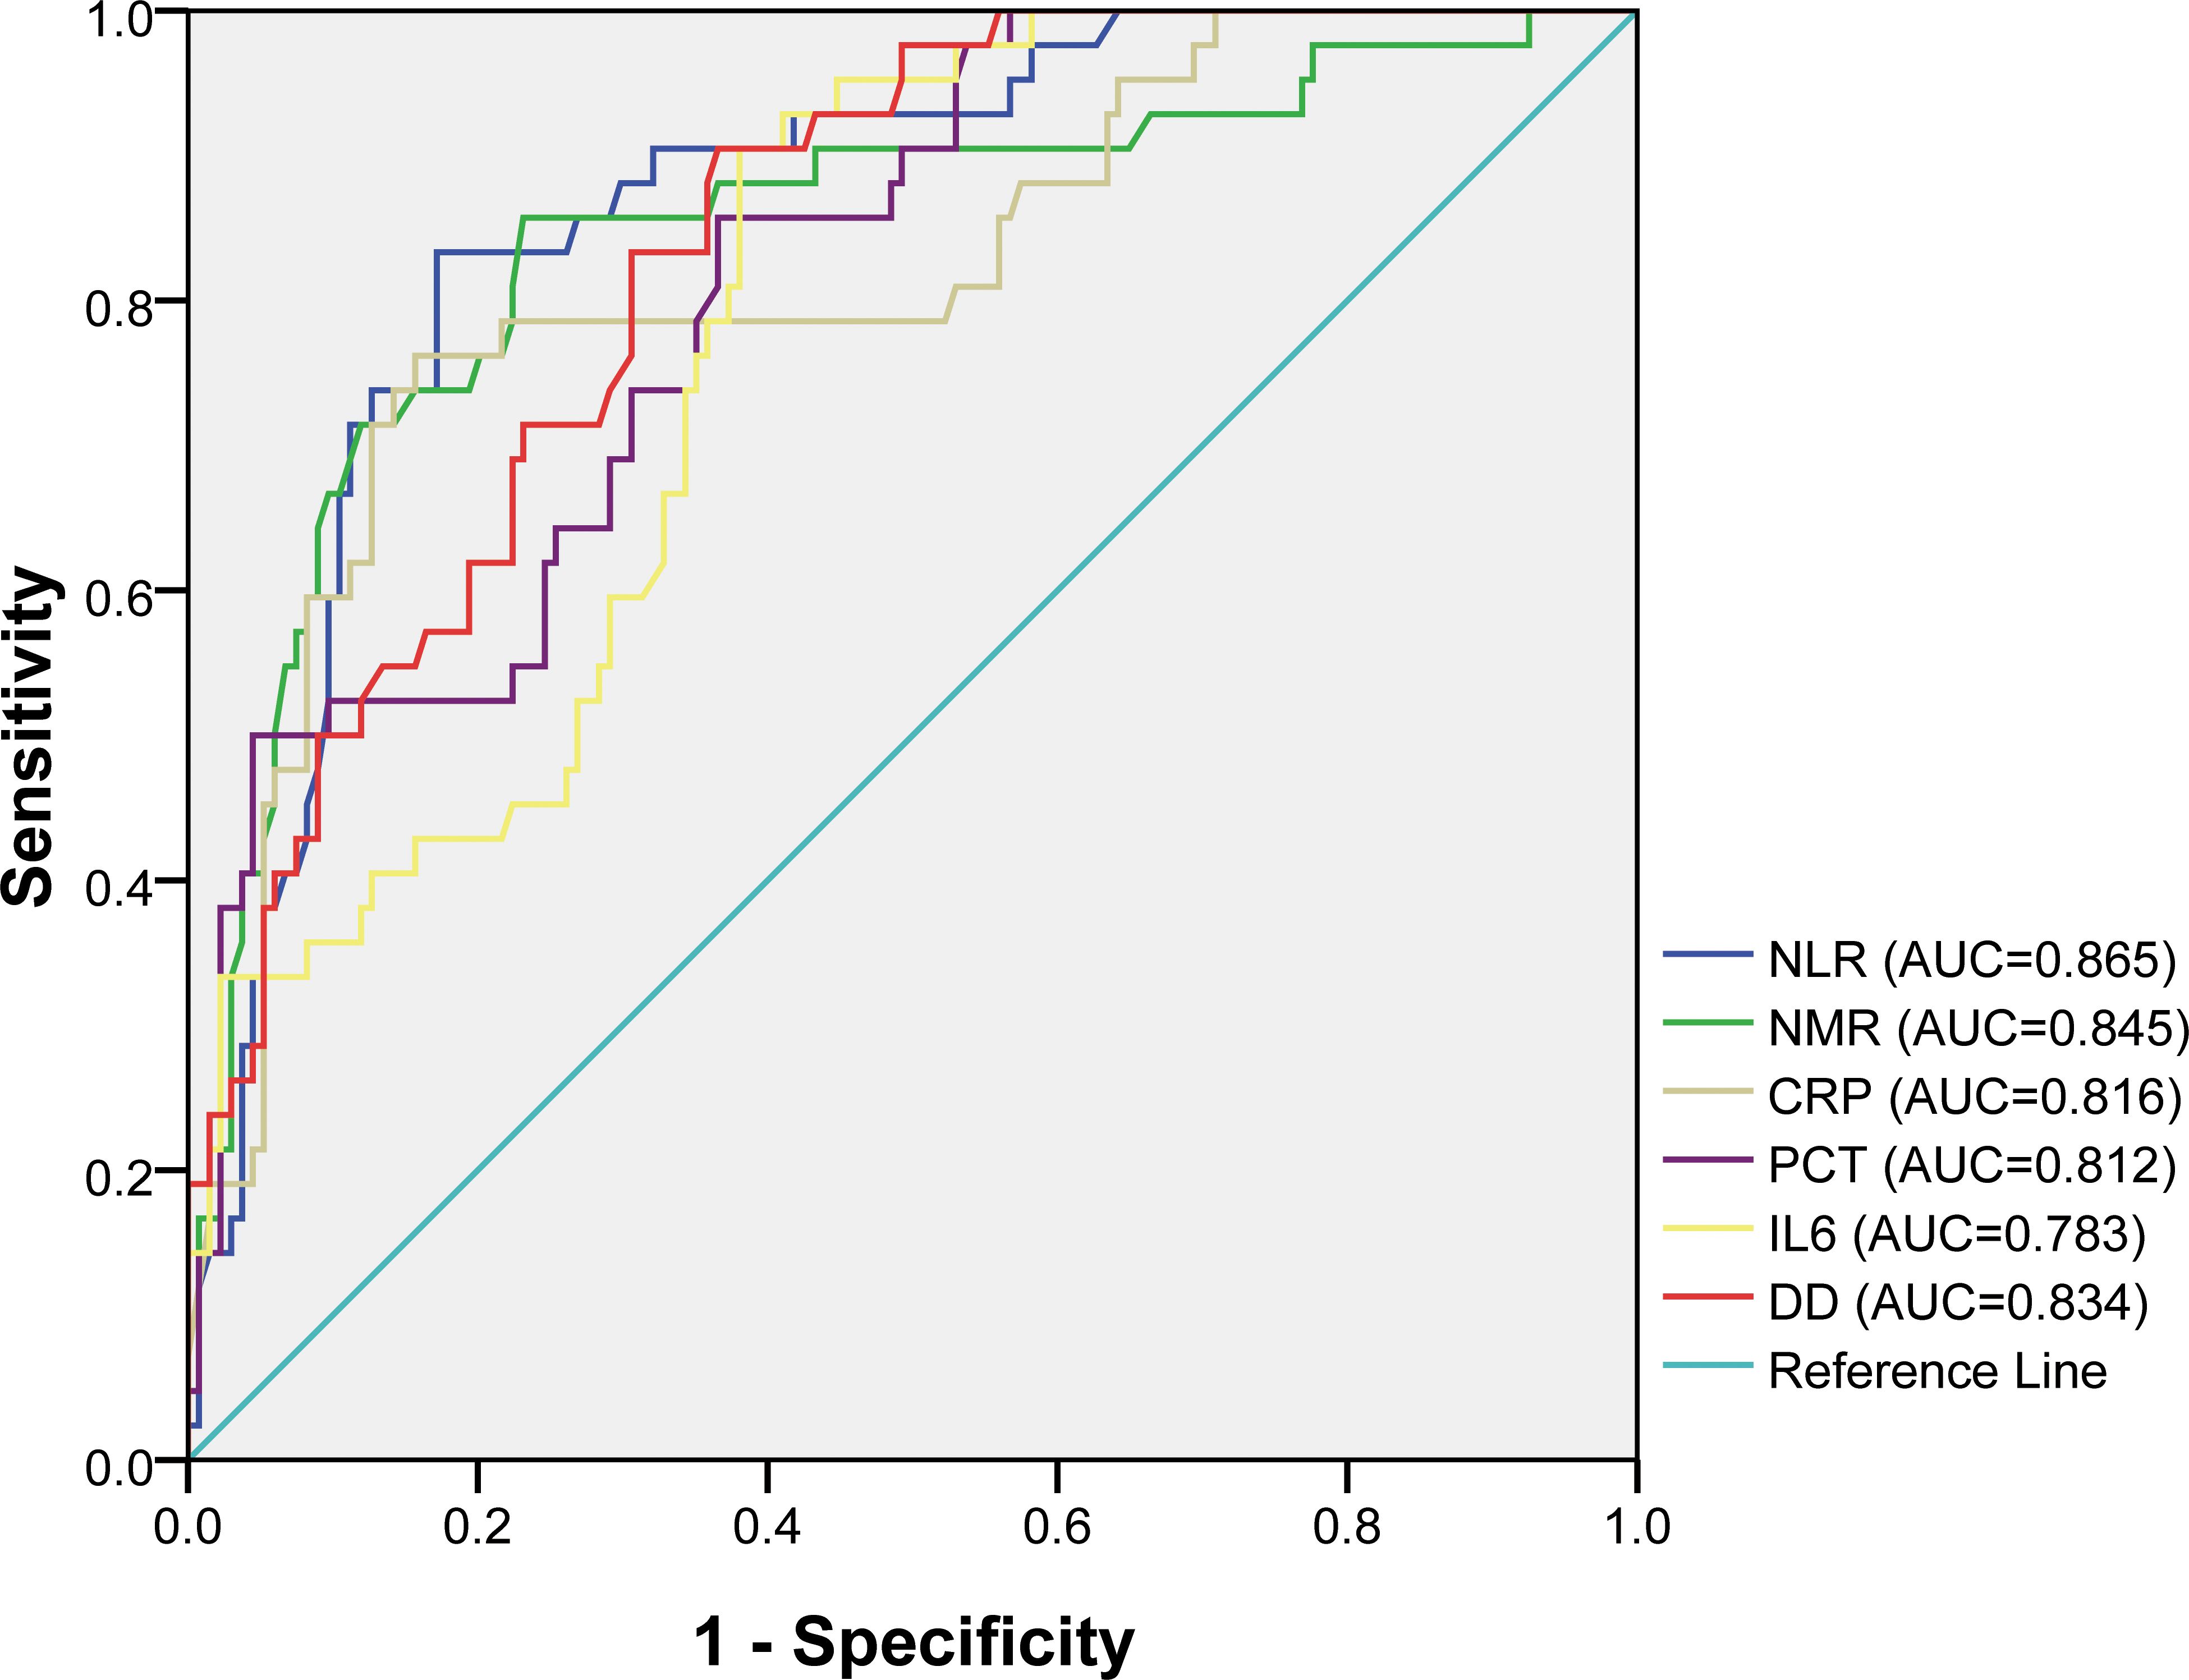
Figure 2. Receiver operating characteristic (ROC) curves for different factors in predicting the risk of mortality of COVID-19 elderly patients.
The LASSOCV, REFCV, and SVMREFCV algorithms were used to identify markers (Figures 3A–C, respectively), and Venn diagrams were drawn in the R language (Figure 3D). After considering the intersection of the three algorithms, five overlapping markers were identified: NMR, NLR, CRP, IL6, and DD.
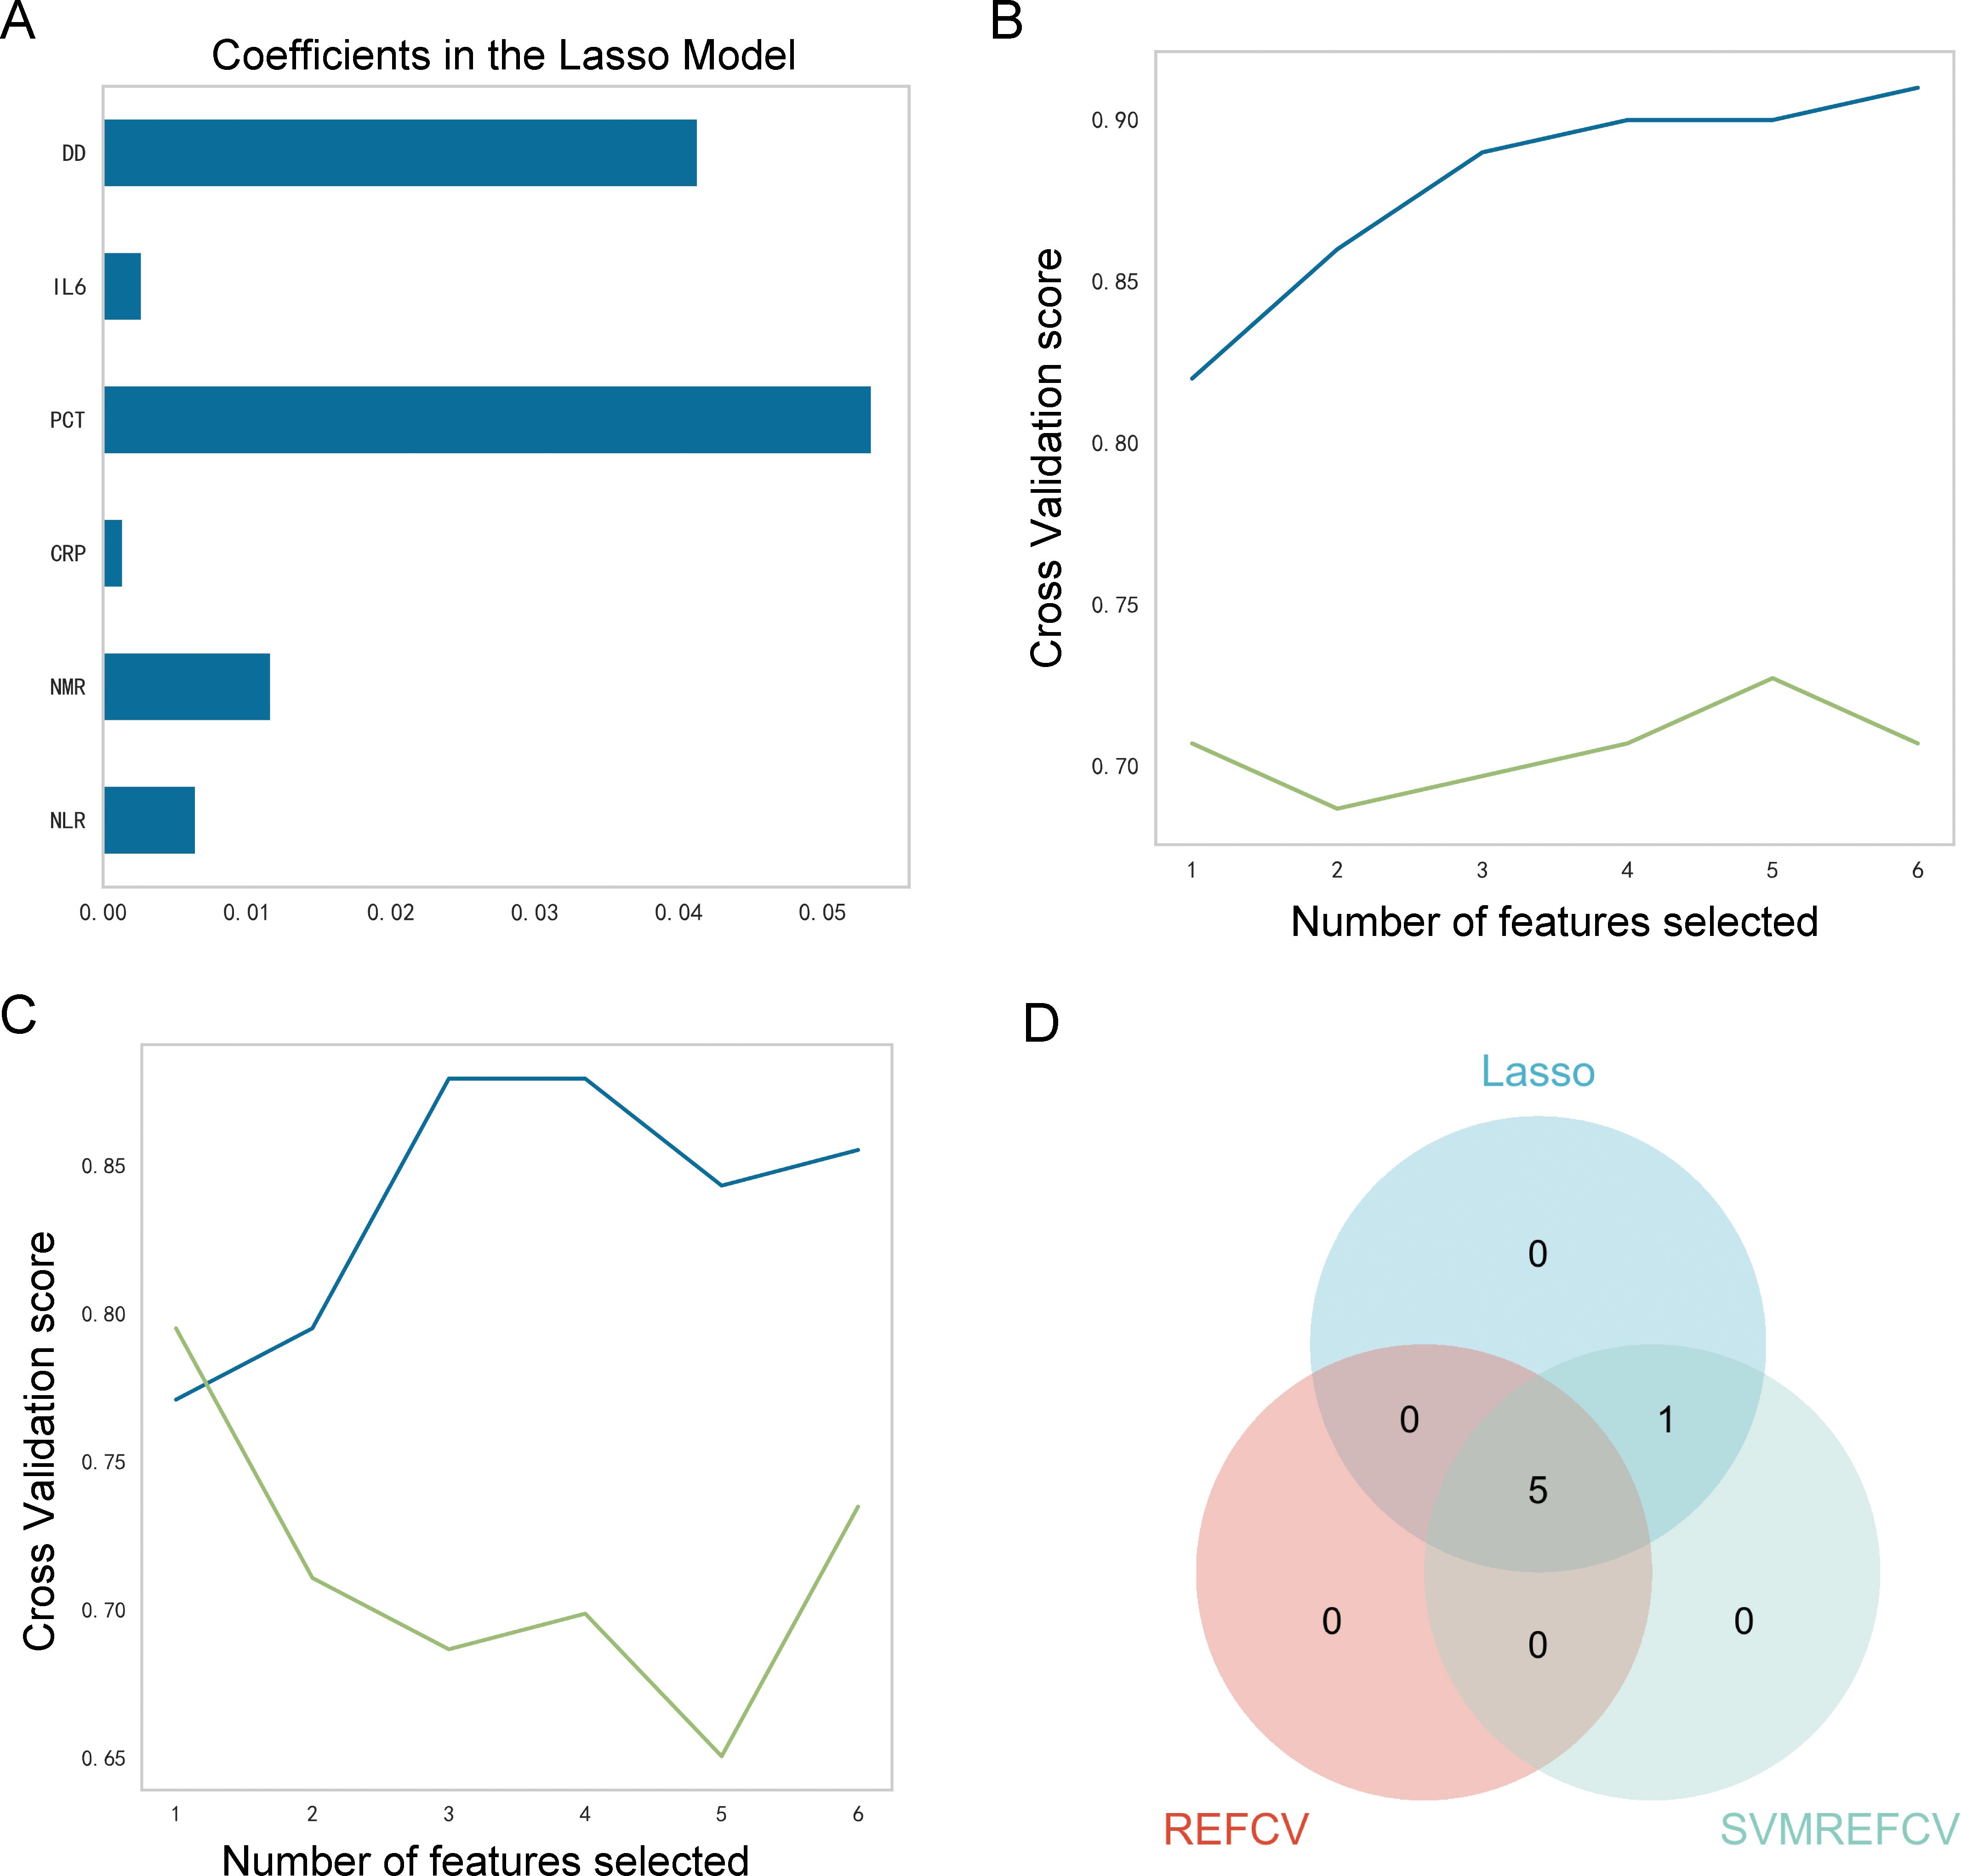
Figure 3. Identification of characteristic markers. (A) Six markers were identified using the LASSOCV algorithm; (B) five markers were identified using the REFCV algorithm; (C) six markers were identified using the SVMREFCV algorithm; (D) Venn plot of markers for three machine-learning algorithms.
The performances of the nine ML models in the training and validation cohorts are presented in Table 2, Figure 4. The GNB model demonstrated the highest predictive accuracy with AUC values of 0.924 and 0.936 in the validation and testing cohorts, respectively. Calibration and decision curves confirmed the superior performance and clinical utility of the GNB model.
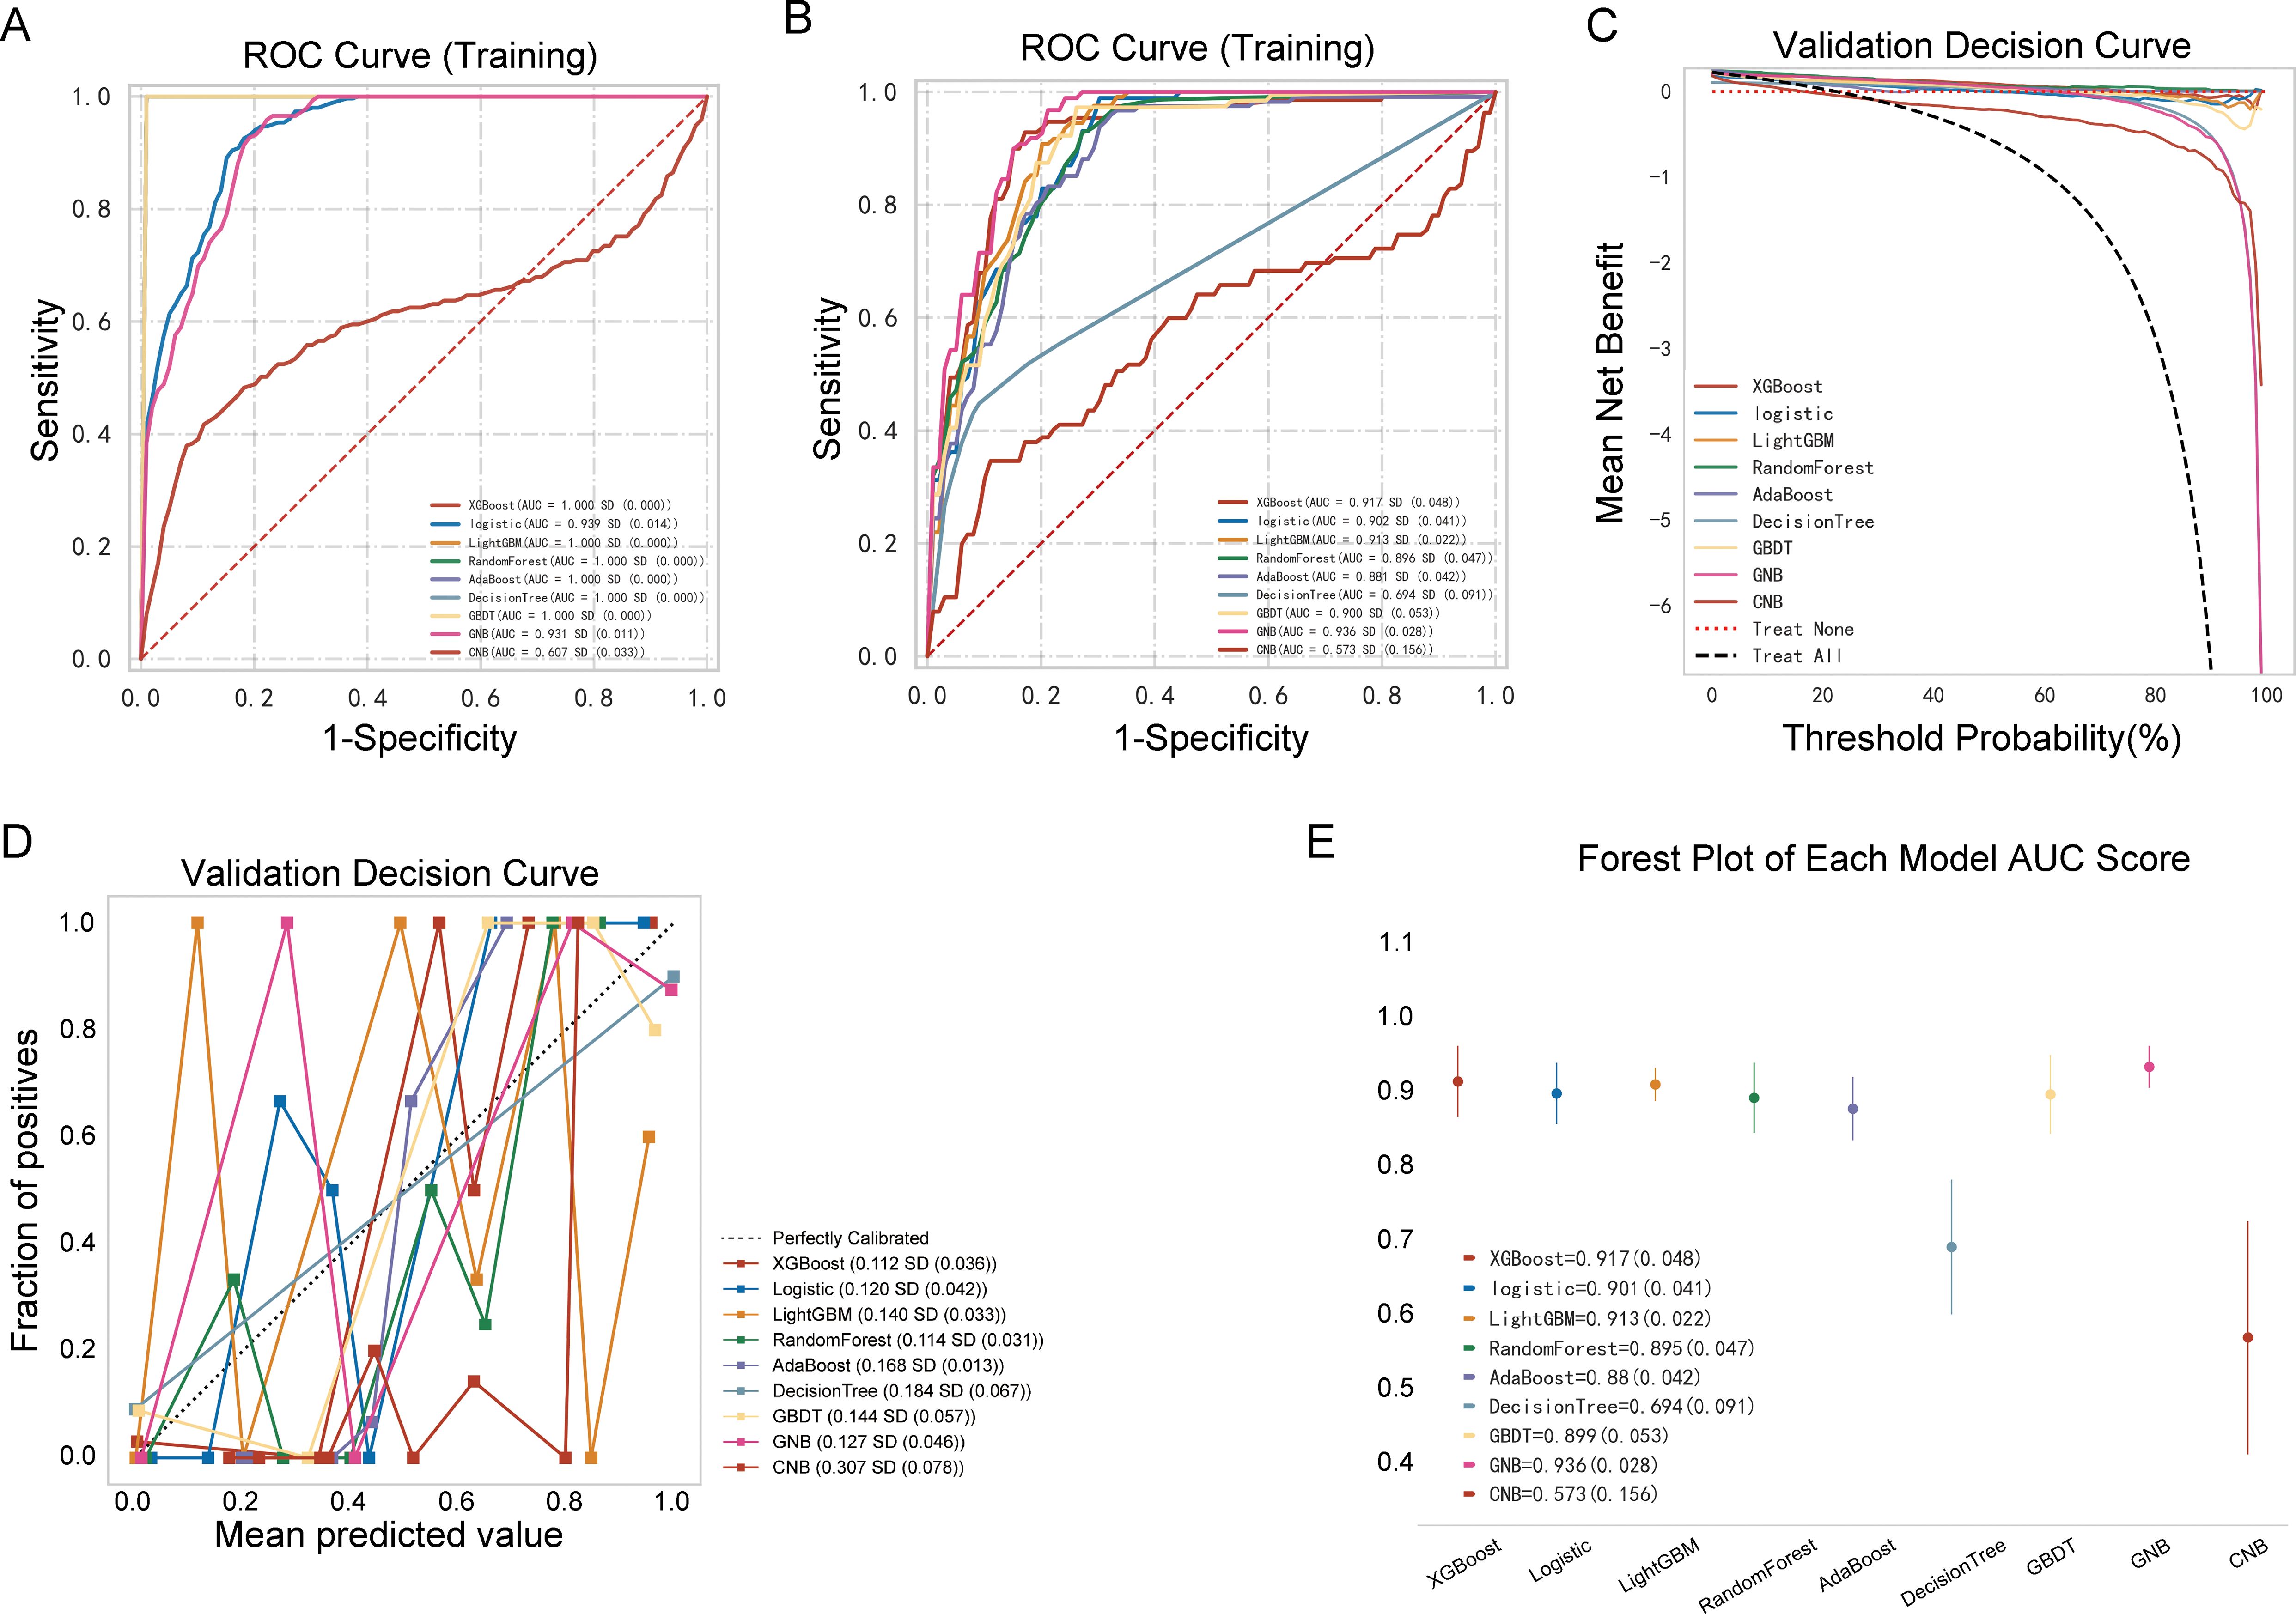
Figure 4. Performance comparison between multiple models. (A) Receiver operating characteristic (ROC) curve of the training cohort; (B) ROC curve of the validation cohort; (C) decision curve of the nine machine-learning models; (D) calibration curve of the nine machine-learning models; (E) forest plot of each area under the curve (AUC) score.
As shown in Table 3, Figures 5A–C, the AUC of the validation cohort did not exceed that of the testing cohort and the AUC of the validation cohort did not exceed that of the training cohort in Figure 5D, demonstrating that the GNB model had a strong fitting ability. Table 3 shows that accuracy, sensitivity, and specificity exceeded 78% in the testing cohort. The differences in metrics for GNB models in Tables 2, 3 were due to reassignment of the data used to test the models. In addition, the calibration curve illustrates a good correlation between the actual and predicted probabilities (Figure 5E), and the decision curve indicates a strong clinical benefit (Figure 5F), indicating that GNB was an excellent model.
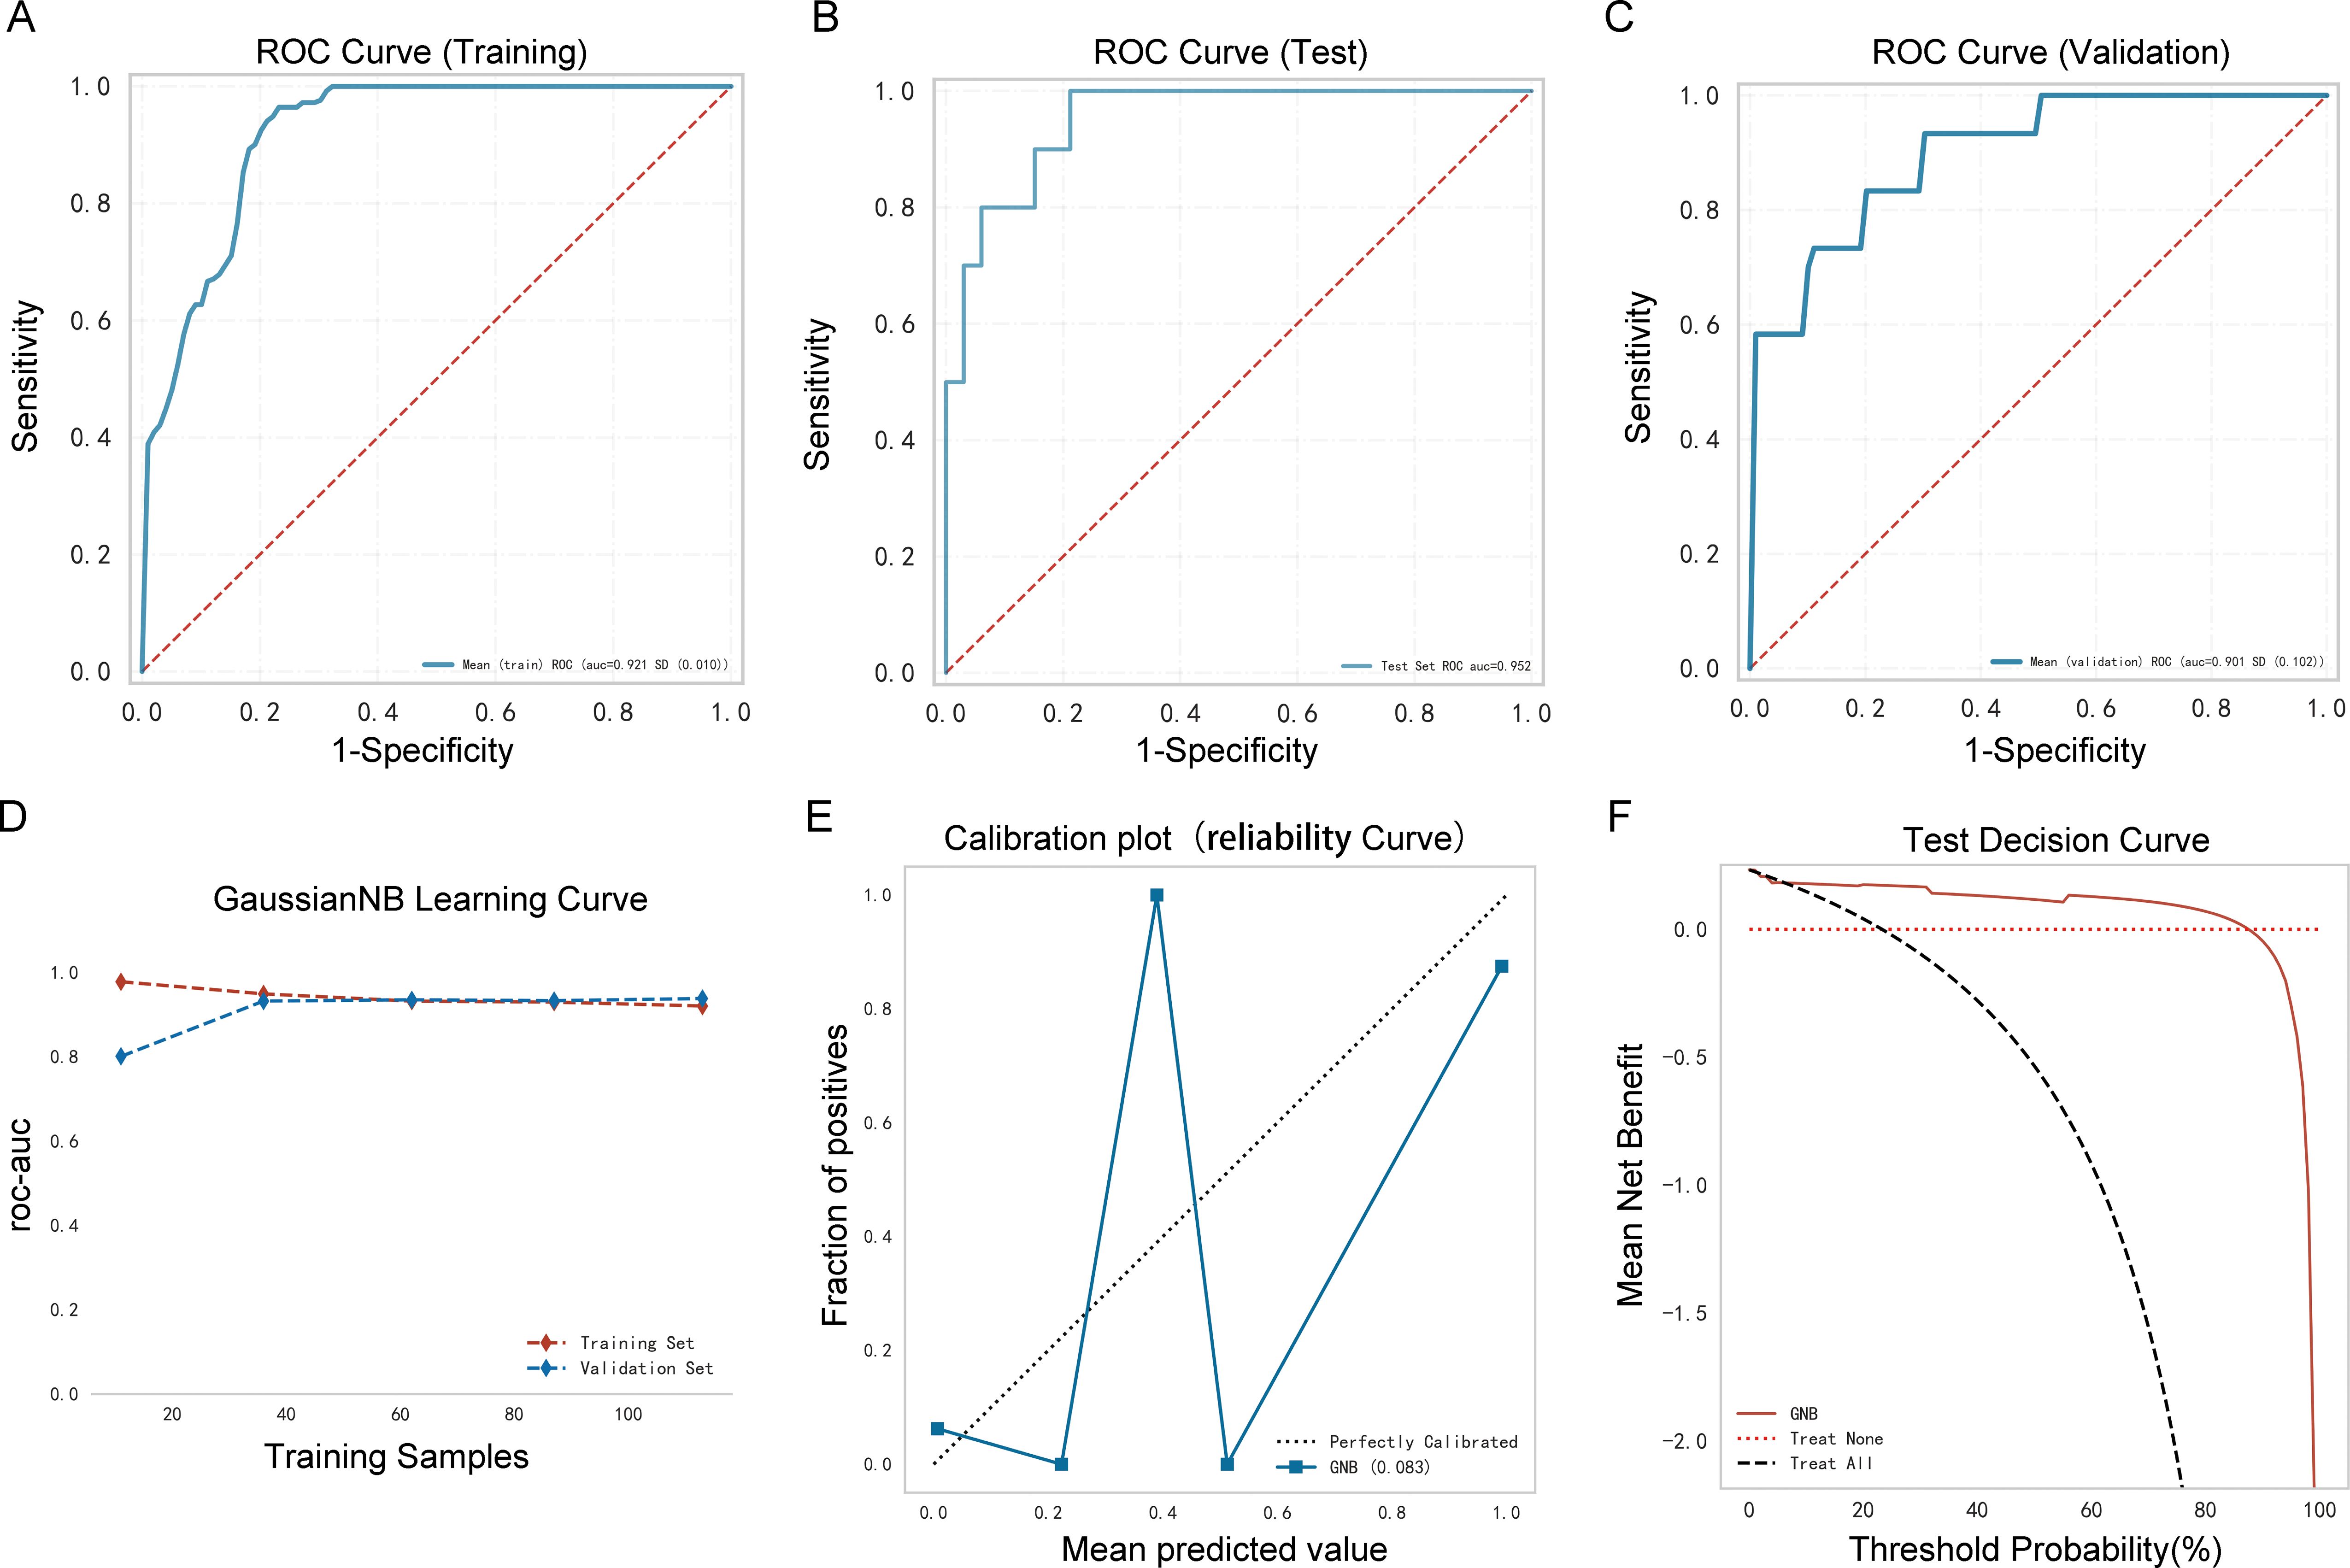
Figure 5. Performance of the prediction model. (A) Receiver operating characteristic (ROC) curve of the training cohort; (B) ROC curve of the validation cohort; (C) ROC curve of the testing cohort; (D) AUC of the validation cohort and the testing cohort; (E) calibration curve analysis; (F) decision curve analysis.
Ninety older people with COVID-19 were enrolled in an external independent testing cohort from two other centers. The AUC of the model was 0.873 (Figure 6A), and the decision curve indicated that the tool had a strong clinical benefit (Figure 6B).
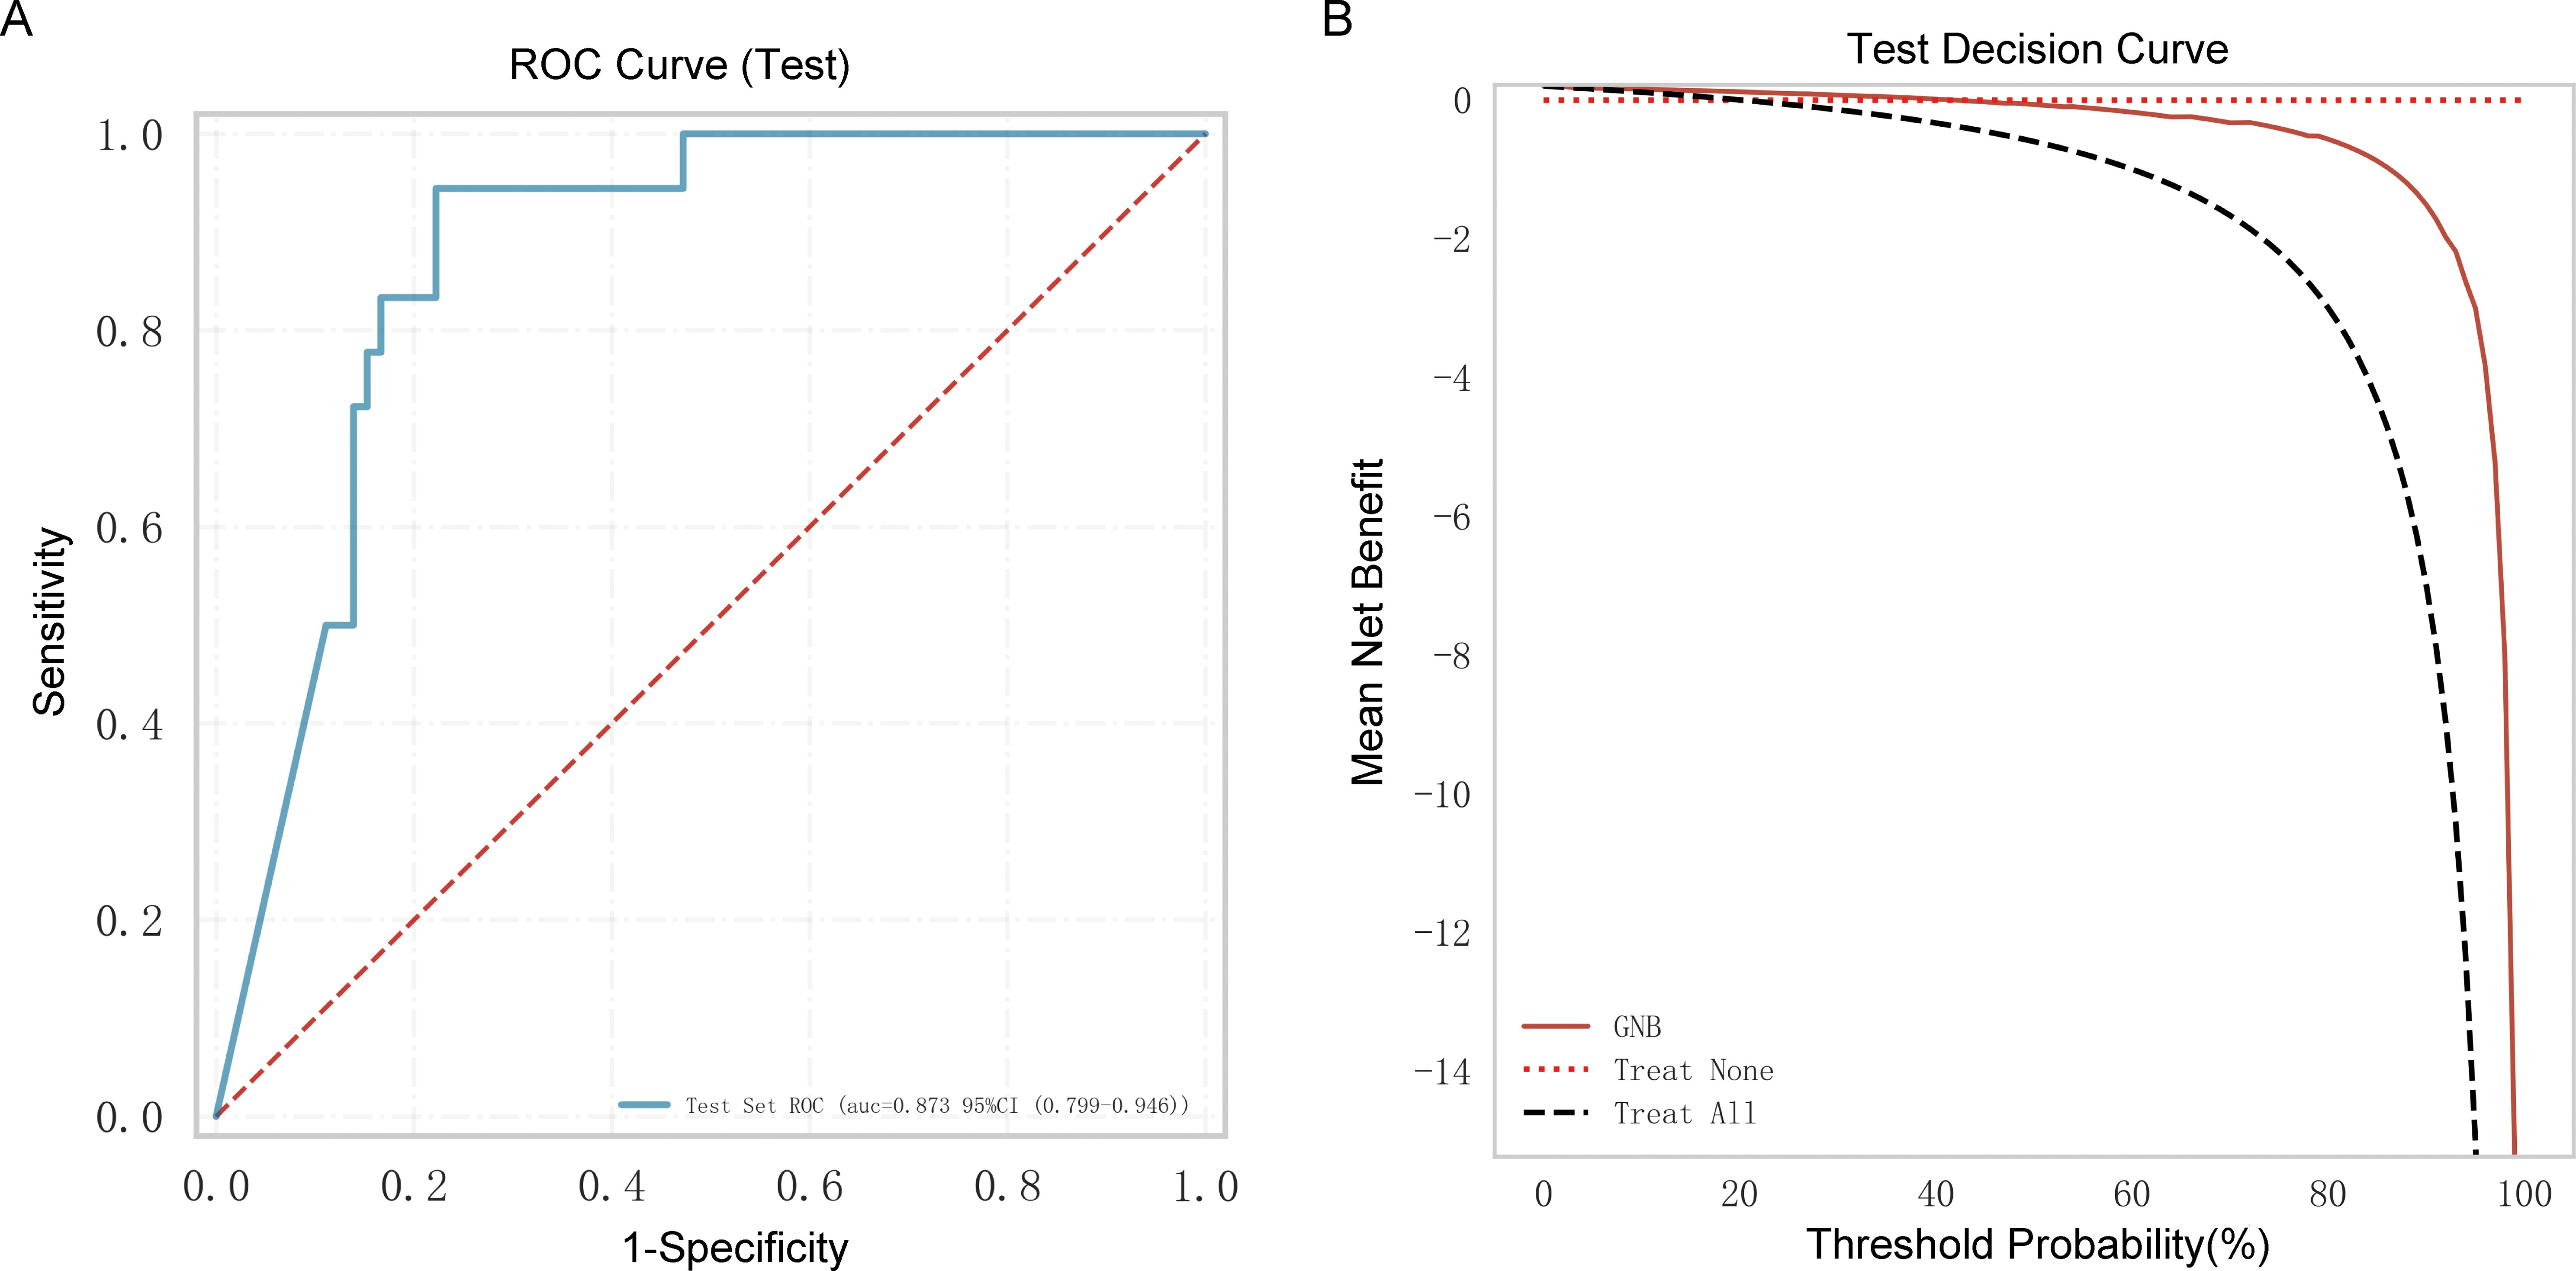
Figure 6. External independent testing of the Gaussian naive Bayes (GNB) regression model. (A) Receiver operating characteristic (ROC) curve of the external independent testing cohort. (B) Test decision curve of the external independent testing cohort.
Based on the above analysis, an online prediction tool was built for clinicians to predict the risk of mortality in older patients with COVID-19 (http://www.xsmartanalysis.com/model/list/predict/model/html?mid=15316&symbol=41716818278ELBg2YAyL). The blood indices (NLR, NMR, CRP, IL6, and DD) were entered in the website. If the results indicate a high risk of death, clinicians should be vigilant and prepare treatment in advance (Figure 7).
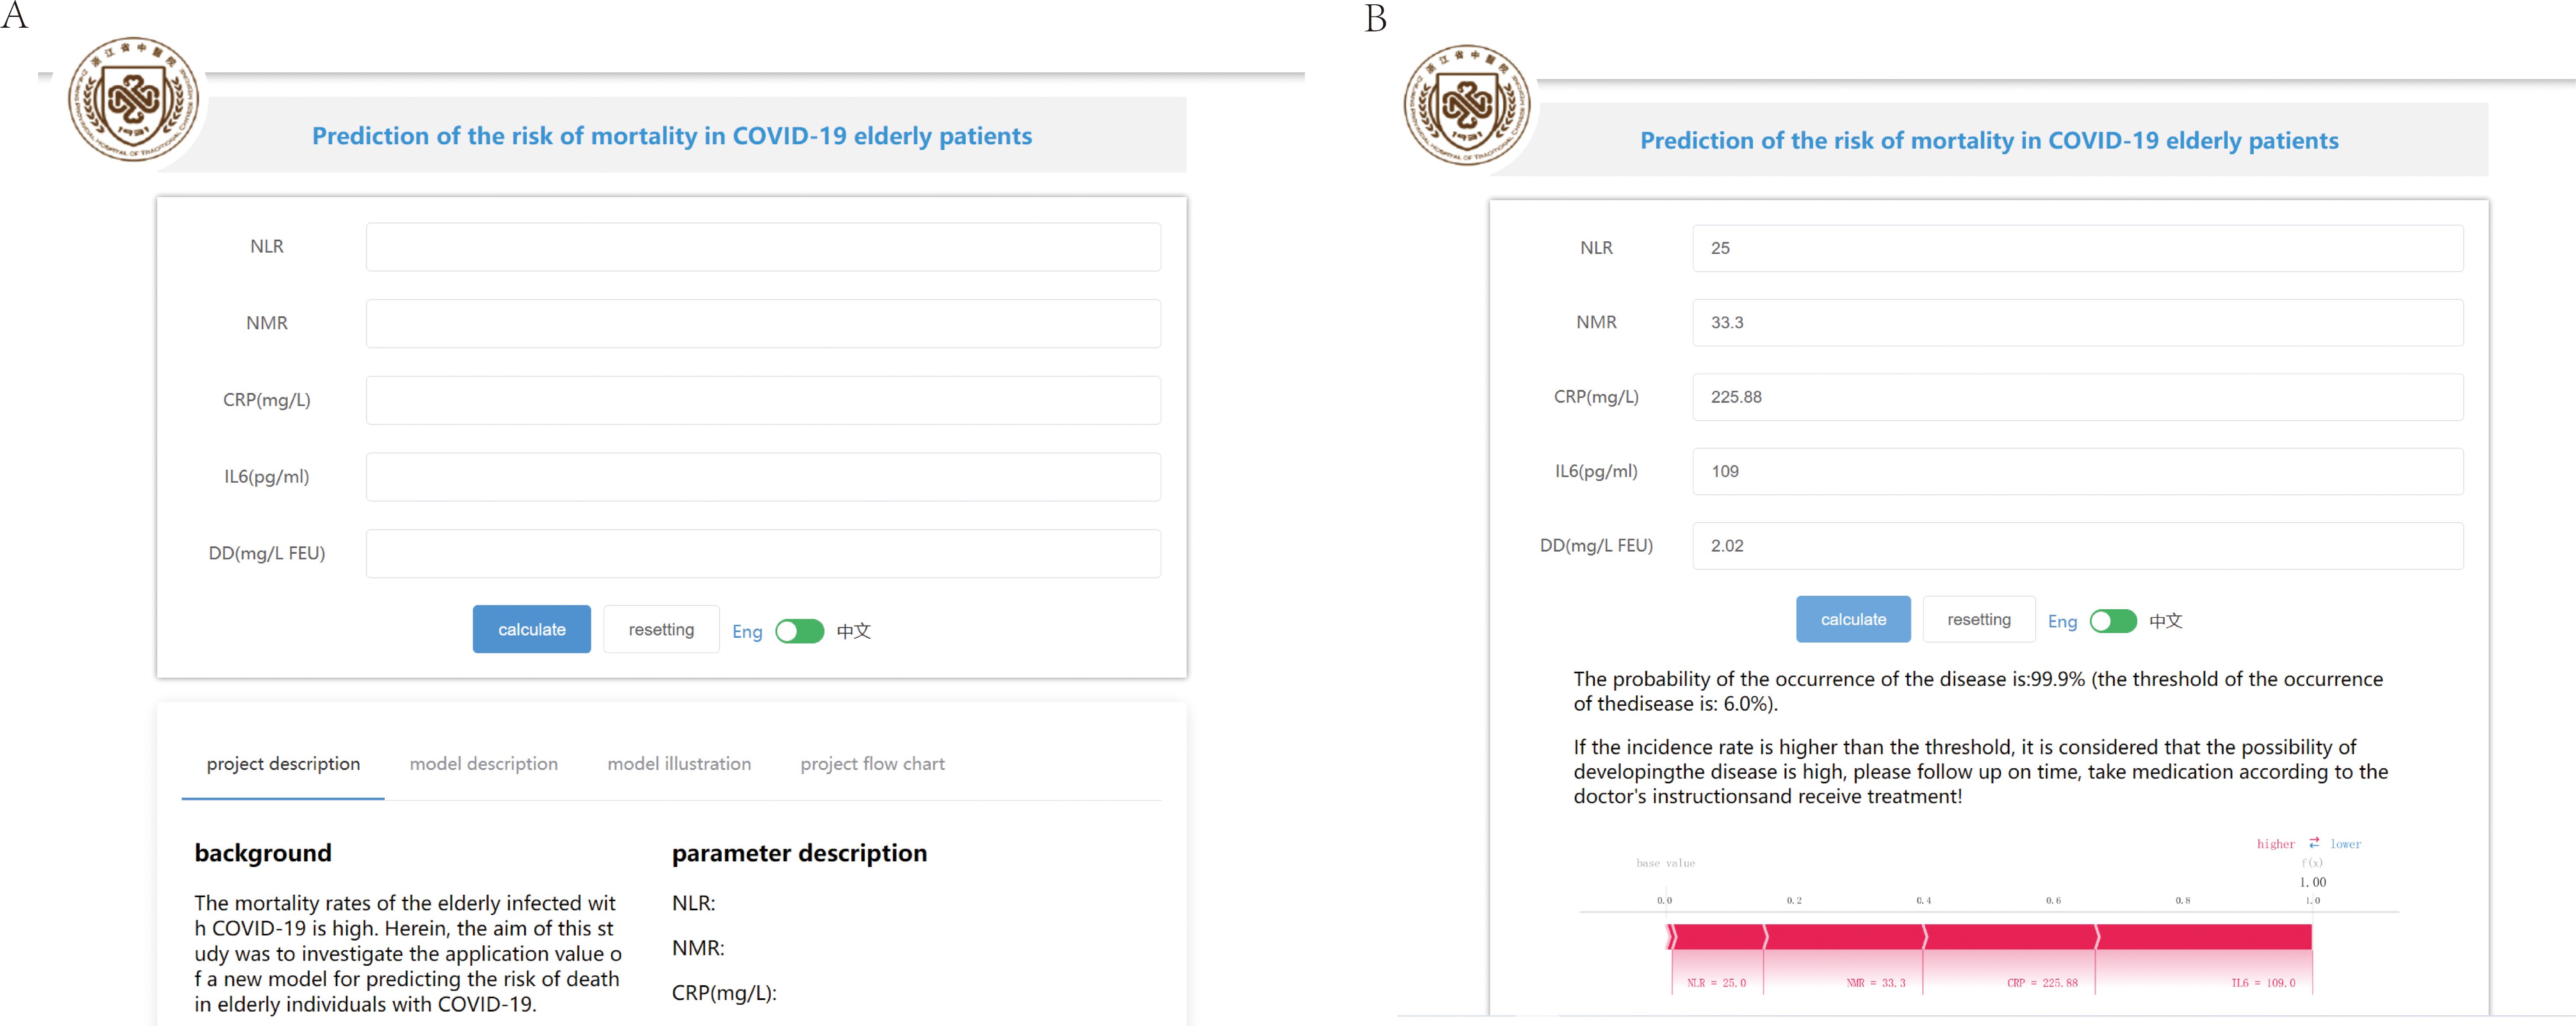
Figure 7. An online prediction tool to predict the risk of mortality. (A) An online page based on the Gaussian naive Bayes (GNB) algorithm. (B) An online page to predict the risk of COVID-19 mortality based on five indicators.
SARS-CoV-2 spreads very rapidly with human-to-human transmission. Although COVID-19 has a relatively low fatality rate overall, it has a higher mortality rate in older people, particularly those 80 years and older (11, 15). To date, safe and effective treatments have been lacking. Although a COVID-19 “wonder drug” is used clinically, its side effects and limitations are unavoidable; thus, it is not suitable for all patients. In recent years, there have been many studies on COVID-19, but few have focused on older people, particularly in predicting the risk of mortality in this group. Blood tests contain a large amount of information about the disease and are readily accepted by patients. To explore the potential dependencies between blood test biomarkers and COVID-19, an ML approach can be used. Currently, ML algorithms are rapidly developing as model-building tools that have been widely applied in the medical field with powerful predictive and parallel processing capabilities (16). Therefore, we developed a predictive model after assessing nine ML models (LGBM, GBDT, XGBoost, RF, GNB, AdaBoost, LR, DT, and CNB) to determine the risk of COVID-19-related death in older people using laboratory data.
This study identified five blood markers (NMR, NLR, CRP, IL6, and DD) that were significantly associated with the risk of death in patients with COVID-19. Among the nine ML algorithms tested, the GNB model showed the highest predictive accuracy, with high AUC values in both the validation and testing cohorts. The well-calibrated predictions of the model, as indicated by the calibration curve, are crucial for clinical application. Decision curve analysis further supported the clinical utility of the GNB model, indicating a high net benefit across various threshold probabilities and the ability of the model to guide clinical decision-making by accurately identifying patients who would benefit most from intensive care and targeted interventions.
SARS-CoV-2 infection induces shortness of breath more frequently in older people than in younger people (17). However, clinicians may overlook this symptom because of similar presentations due to age-related declines and comorbidities (18). Therefore, the establishment of predictive models has significant clinical utility. Our data revealed that older patients with chronic diseases were at a higher risk, with those who died having a median age of 86 years, which was significantly higher than that of the discharged patients, with a median age of 81 years (P < 0.01). This aligns with the findings by McMichael et al. (19) showing that hospitalization and mortality rates were higher in patients with a median age of 83 years and a 94% prevalence of underlying conditions. Notably, a higher proportion of male patients was observed in the deceased group.
Systemic inflammation plays a significant role in the progression of COVID-19 (20). Excessive inflammation may lead to a weak immune response, thereby contributing to multiple organ dysfunction. Blood indices, such as NEU count, LYM count, MON count, NLR, NMR, LMR, CRP, PCT, and IL6, can represent inflammation and immune status (21). This study showed that NLR, NMR, CRP, and IL6 in the deceased group were significantly higher than those in the discharged group (P < 0.05). Our study also found that NLR and NMR had good screening effects on COVID-19 prognosis and death, with an AUC of 0.865 and 0.845, respectively, which is consistent with previous reports (22, 23), indicating that these indicators were related to poor COVID-19 outcomes. CRP and IL6 are commonly used as inflammatory markers in clinical settings. In a study by Wolszczak-Biedrzycka et al. (24), the CRP level increased with disease severity, assessed based on the modified early warning score, indicating that CRP is a useful predictor of disease severity and the risk of mortality. The present study confirmed this result as the CRP level was significantly higher in patients who died from COVID-19 (P < 0.01), with an AUC of 0.816. According to some studies, IL6 is an excellent predictor of mortality in patients with COVID-19 (25). Excessive IL6 is secreted by CD14+ and CD16+ monocytes during COVID-19 progression, which is associated with a systemic inflammatory reaction known as a cytokine storm (26, 27). Our results align with the existing body of evidence that an elevated IL6 level is linked to an increased mortality risk (P < 0.01). In addition to excessive systemic inflammation, a hypercoagulable state is strongly associated with the severity and mortality of COVID-19 (28). DD is not only a specific biomarker for hypercoagulability but also a biomarker for monitoring inflammation and severe infection (29). According to a recent report, along with COVID-19 progression, DD level is closely related to severity (30). Our study found that DD was significantly higher in the deceased group (P < 0.01).
The predictive model developed in this study has important implications for managing older patients with COVID-19. With early identification of those at high risk of mortality, clinicians can effectively allocate resources and implement timely interventions. The reliance of the model on readily available blood markers makes it practical for widespread application, potentially improving outcomes in resource-limited settings. Furthermore, the predictive accuracy of the model could support personalized treatment strategies, enabling a more tailored management of older patients with COVID-19. This might involve early initiation of antiviral therapies, immunomodulatory treatments, or other supportive care measures based on the risk profile of an individual. The combination of ML and extensive laboratory data offers a rapid and reliable technique to assist clinicians in disease differentiation.
Our study has some limitations. First, the sample size was relatively small. Second, the data were derived from a single center and were retrospective. Future studies should consider integrating this model with additional clinical and imaging data to enhance its predictive capabilities. Finally, in the present study, the patients diagnosed with tumors or severe blood system disorders or those who have received blood transfusions were excluded. However, these patients are particularly vulnerable to SARS-CoV-2 infection and prone to poor outcomes and death. Therefore, these patients should be included in future studies to confirm the results or to assess improvements to the model. Although the peak of COVID-19 has passed, the SARS-CoV-2 virus remains present, and humans continue to be intermittently infected. Thus, this study maintains its relevance and value.
This study identified NMR, NLR, CRP, IL6, and DD as factors associated with the risk of COVID-19-related death using LASSO regression. Assessing nine ML models, the GNB model was the best performing, demonstrating superior predictive accuracy and clinical benefit. The correlation between the actual and predicted probabilities was strong, and the online prediction tool directly contributed to improved predictions of disease progression and mortality risk in older patients with COVID-19.
The original contributions presented in the study are included in the article/Supplementary Material. Further inquiries can be directed to the corresponding author.
The study was approved by the Zhejiang Province Hospital of Traditional Chinese Medicine (2023-KLS-034-01). All studies were performed in accordance with the ethical standards as laid down in the 1964 Declaration of Helsinki and its later amendments or comparable ethical standards. Due to retrospective analysis, according to national legislation and institutional requirements, this study does not require written informed consent.
LZ: Data curation, Formal analysis, Software, Writing – original draft. YY: Funding acquisition, Methodology, Project administration, Resources, Writing – review & editing.
The author(s) declare financial support was received for the research, authorship, and/or publication of this article. This work was supported by the Science and Technology Project of Traditional Chinese Medicine in Zhejiang Province (2024ZL055).
The authors would like to express their gratitude to HelixLife for the expert linguistic services provided.
The authors declare that the research was conducted in the absence of any commercial or financial relationships that could be construed as a potential conflict of interest.
All claims expressed in this article are solely those of the authors and do not necessarily represent those of their affiliated organizations, or those of the publisher, the editors and the reviewers. Any product that may be evaluated in this article, or claim that may be made by its manufacturer, is not guaranteed or endorsed by the publisher.
The Supplementary Material for this article can be found online at: https://www.frontiersin.org/articles/10.3389/fimmu.2024.1445618/full#supplementary-material
1. Worldmeters: COVID-19 Updates: Real-time database and live updates of Covid-19 cases (n.d.). Available online at: http://www.worldometers.info/coronavirus/64. (Accessed February 03, 2024).
2. Hu B, Guo H, Zhou P, Shi ZL. Characteristics of SARS-coV-2 and COVID-19. Nat Rev Microbiol. (2021) 19:141–54. doi: 10.1038/s41579-020-00459-7
3. Centers for Disease Control and Prevention Risk for COVID-19 Infection, Hospitalization, and Death by Age . Available online at: https://www.cdc.gov/coronavirus/2019-ncov/coviDData/investigations-discovery/hospitalization-death-by-age.html (Accessed August 3, 2022).
4. Azar A, Ballas ZK. Immune function in older adults, in: UpToDate . Waltham, MA: UpToDate (Accessed July 29, 2022).
5. Gold JAW, Rossen LM, Ahmad FB, Sutton P, Li ZY, Salvatore PP, et al. Race, ethnicity, and age trends in persons who died from COVID-19 in the United States from May to August 2020. MMWR Morb Mortal Wkly Rep. (2020) 69:1517–21. doi: 10.15585/mmwr.mm6942e1
6. Gustafson CE, Kim C, Weyand CM, Goronzy JJ. Effects of immune aging on the vaccine responses. J Allergy Clin Immunol. (2020) 145:1309–21. doi: 10.1016/j.jaci.2020.03.017
7. Heinrichs B, Eickhoff SB. Your evidence? Machine learning algorithms for medical diagnosis and prediction. Hum Brain Mapp. (2020) 41:1435–44. doi: 10.1002/hbm.24886
8. Wong ZS, Zhou J, Zhang Q. Artificial intelligence for infectious disease big data analytics. Infect Dis Health. (2019) 24:44–8. doi: 10.1016/j.idh.2018.10.002
9. Zhu N, Zhang D, Wang W, Li XW, Yang B, Song JD, et al. A novel coronavirus from patients with pneumonia in China, 2019. N Engl J Med. (2020) 382:727–33. doi: 10.1056/NEJMoa2001017
10. Klok FA, Kruip M, van der Meer NJM, Arbous MS, Gommers DAMPJ, Kant KM, et al. Incidence of thrombotic complications in critically ill ICU patients with COVID-19. Thromb Res. (2020) 191:145–7. doi: 10.1016/j.thromres.2020.04.013
11. Wu Z, McGoogan JM. Characteristics of and important lessons from the coronavirus disease 2019 (COVID-19) outbreak in China. Summary of a report of 72 314 cases from the chinese center for disease control and prevention. JAMA. (2020) 323:1239–42. doi: 10.1001/jama.2020.2648
12. Liu J, He R, Wu R, Wang B, Xu H, Zhang Y, et al. Mycoplasma pneumonia-associated thrombosis at Beijing Children’s hospital. BMC Infect Dis. (2020) 20:51. doi: 10.1186/s12879-020-4774-9
13. Zhang L, Yan X, Fan Q, Liu H, Liu X, Liu Z, et al. D-Dimer levels on admission to predict in-hospital mortality in patients with Covid-19. J Thromb Haemost. (2020) 18:1324–9. doi: 10.1111/jth.14859
14. Moulaei K, Shanbehzadeh M, Mohammadi-Taghiabad Z, Kazemi-Arpanahi H. Comparison machine learning algorithms for predicting COVID-19 mortality. BMC Med Inform Decis Mak. (2022) 22:2. doi: 10.1186/s12911-021-01742-0
15. Williamson EJ, Walker AJ, Bhaskaran K, Bacon S, Bates C, Morton CE, et al. Factors associated with COVID-19-related death using Open SAFELY. Nature. (2020) 584:430–6. doi: 10.1038/s41586-020-2521-4
16. Kononenko I. Machine learning for medical diagnosis: History, state of the art and perspective. Artif Intell Med. (2001) 23:89–109. doi: 10.1016/S0933-3657(01)00077-X
17. Lian J, Jin X, Hao S, Cai H, Zhang S, Zheng L, et al. Epidemiological and clinical features in older patients with coronavirus disease 2019 (COVID-19) outside Wuhan. Clin Infect Dis. (2020) 71:740–7. doi: 10.1093/cid/ciaa242
18. Nikolich-Zugich J, Knox KS, Rios CT, Natt B, Bhattacharya D, Fain MJ. SARS-CoV-2 and COVID-19 in older adults: What is expected regarding the pathogenesis, immune responses, and outcomes? Geroscience. (2020) 42:505–14. doi: 10.1007/s11357-020-00186-0
19. McMichael TM, Currie DW, Clark S, Pogosjans S, Kay M, Schwartz NG, et al. Epidemiology of Covid-19 in a long-term care facility in King County, Washington, USA. N Engl J Med. (2020) 382:2005–11. doi: 10.1056/NEJMoa2005412
20. Moore JB, June CH. Cytokine release syndrome in severe COVID-19. Science. (2020) 368:473–4. doi: 10.1126/science.abb8925
21. Karki R, Kanneganti TD. Innate immunity, cytokine storm, and inflammatory cell death in Covid-19. J Transl Med. (2022) 20:542. doi: 10.1186/s12967-022-03767-z
22. Yang AP, Liu JP, Liu WP, Tao WQ, Li HM. The diagnostic and predictive roles of NLR, d-NLR and PLR in COVID-19 patients. Int Immunopharmacol. (2020) 84:106504. doi: 10.1016/j.intimp.2020.106504
23. Ye W, Chen G, Li X, Lan X, Ji C, Hou M, et al. Dynamic changes in D-dimer levels and neutrophil-lymphocyte count ratios as prognostic biomarkers for COVID-19. Respir Res. (2020) 21:169. doi: 10.1186/s12931-020-01428-7
24. Wolszczak-Biedrzycka B, Dorf J, Milewska A, Łukaszyk M, Naumnik W, Kosidło JW, et al. Assessing the severity of COVID-19 symptoms based on the MEWS and predicting the risk of mortality. J Inflammation Res. (2023) 16:2173–88. doi: 10.2147/JIR.S406658
25. Han H, Ma Q, Li C, Liu R, Zhao L, Wang W, et al. Profiling serum cytokines in covid-19 patients reveals Il-6 and Il-10 are disease severity predictors. Emerg Microbes Infect. (2020) 9:1123–30. doi: 10.1080/22221751.2020.1770129
26. Tarique M, Suhail M, Naz H, Muhammad N, Tabrez S, Zughaibi TA, et al. Where do T cell subsets stand in SARS-CoV-2 infection: an update? Front Cell Infect Microbiol. (2022) 12:964265. doi: 10.3389/fcimb.2022.964265
27. Zhou Y, Fu B, Zheng X, Wang D, Zhao C, Qi Y, et al. Pathogenic T-cells and inflammatory monocytes incite inflammatory storms in severe COVID-19 patients. Natl Sci Rev. (2020) 7:998–1002. doi: 10.1093/nsr/nwaa041
28. Berkman SA, Tapson VF. Covid-19 and its implications for thrombosis and anticoagulation. Semin Respir Crit Care Med. (2021) 42:316–26. doi: 10.1055/s-0041-1722992
29. Ge YL, Liu CH, Wang N, Xu J, Zhu XY, Su CS, et al. Elevated plasma D-dimer levels in adult community-Acquired pneumonia patients is associated with an increased inflammatory reactions and lower survival. Clin Lab. (2019) 65. doi: 10.7754/Clin.Lab.2018.180720
30. Goncalves FAR, Besen BAMP, de Lima CA, Corá AP, Pereira AJR, Perazzio SF, et al. Use and misuse of biomarkers and the role of D-dimer and C-reactive protein in the management of COVID-19: A post-hoc analysis of a prospective cohort study. Clinics. (2021) 76:e3547. doi: 10.6061/clinics/2021/e3547
Keywords: COVID-19, older patients, mortality, blood markers, machine learning, Gaussian naïve Bayes
Citation: Zhu L and Yao Y (2024) Prediction of the risk of mortality in older patients with coronavirus disease 2019 using blood markers and machine learning. Front. Immunol. 15:1445618. doi: 10.3389/fimmu.2024.1445618
Received: 07 June 2024; Accepted: 11 October 2024;
Published: 01 November 2024.
Edited by:
Urszula Foryś, University of Warsaw, PolandReviewed by:
Kathy Kamath, Serimmune Inc, United StatesCopyright © 2024 Zhu and Yao. This is an open-access article distributed under the terms of the Creative Commons Attribution License (CC BY). The use, distribution or reproduction in other forums is permitted, provided the original author(s) and the copyright owner(s) are credited and that the original publication in this journal is cited, in accordance with accepted academic practice. No use, distribution or reproduction is permitted which does not comply with these terms.
*Correspondence: Yimin Yao, MjAxNzMyNjZAemNtdS5lZHUuY24=
Disclaimer: All claims expressed in this article are solely those of the authors and do not necessarily represent those of their affiliated organizations, or those of the publisher, the editors and the reviewers. Any product that may be evaluated in this article or claim that may be made by its manufacturer is not guaranteed or endorsed by the publisher.
Research integrity at Frontiers

Learn more about the work of our research integrity team to safeguard the quality of each article we publish.