 Eduardo Espada
 Dário Ligeiro
 Hélder Trindade3
 João F. Lacerda
94% of researchers rate our articles as excellent or good
Learn more about the work of our research integrity team to safeguard the quality of each article we publish.
Find out more
ORIGINAL RESEARCH article
Front. Immunol. , 12 December 2023
Sec. Alloimmunity and Transplantation
Volume 14 - 2023 | https://doi.org/10.3389/fimmu.2023.1286001
Introduction: The Portuguese donor Registry of CEDACE was the fifth largest per capita bone marrow donor Registry of the WMDA as of 2019 and has yet to be thoroughly analyzed. We aimed to characterize its various aspects, including demographics and HLA allele and haplotype frequencies, to evaluate the genetic matching propensity score and ultimately further develop it.
Methods: We described and compared characteristics of the donor population with census data and used an Expectation-Maximization algorithm and analyses of molecular variance to assess haplotype frequencies and establish phylogenetic distances between regions and districts within the country.
Results: We identified 396545 donors, corresponding to 3.85% of the Portuguese population; the median donor age was 39 years, with 60.4% of female donors. Most donors were Portuguese nationals, although 40 other nationalities were present, with a significant proportion of donors from Brazil and Portuguese-speaking African Countries; almost all donors self-reported as Western, with the second largest group reporting African ancestry. There was an asymmetric contribution of donors from different districts and regions, with most coming from coastal districts and few from the southern districts and autonomous regions; foreign and self-declared non-Western donors were mainly located in the Metropolitan Area of Lisbon and the South. Although most donors were typed in three loci (HLA-A, HLA-B and HLA-DRB1), only 44% were also typed in HLA-C, 1.28% in HLA-DQB1 and only 0.77% in all five loci and in high-resolution. There were varying allele and haplotype frequencies across districts and regions, with the most common three loci, low-resolution haplotypes, being HLA-A*01~B*08~DRB1*03, A*29~B*44~DRB1*07 and HLA-A*02~B*44~DRB1*04; some haplotypes were more prevalent in the South, others in the North and a few in the autonomous regions; African and foreign donors presented relevant differences in haplotype frequency distributions, including rare haplotypes of potential interest. We also report on four loci, low-resolution frequency distributions. Using AMOVA, we compared genetic distances between districts and regions, which recapitulated the country's geography.
Discussion: Our analysis showed potential paths to optimization of the Registry, including increasing the male donor pool and focusing on underrepresented districts and particular populations of interest, such as donors from Portuguese-speaking African countries.
The Human Leukocyte Antigen (HLA) genes, located in the major histocompatibility complex region in the short arm of chromosome 6, are a group of highly polymorphic genes involved in antigen presentation and T cell self-recognition that are preserved across generations, making them an appealing tool for assessing genetic differences and similarities between populations. Adequate HLA matching is still fundamental for unrelated hematopoietic cell transplantation, aiding in reducing the risk of acute and chronic graft-versus-host disease and graft rejection (1–6).
The CEDACE, an abbreviation of the National Center of Donors of Bone Marrow, Stem or Cord Blood Cells (Centro Nacional de Dadores de Células de Medula Óssea, Estaminais ou de Sangue do Cordão), was created in 1995 and includes the Portuguese bone marrow donor registry. It has multiple functions as described by the decree-law that generated its existence (Despacho 22/95), including organizing progenitor cell donor requests, coordinating progenitor cell donation, conservation and transplant activities, coordinating and organizing the recruitment and counseling of donors, and coordinating the HLA (Human Leukocyte Antigen) typing data of donors and keeping the aforementioned registry organized, among others. There are three Histocompatibility laboratories in Portugal, namely the Center for Blood and Transplantation of Lisbon (Centro de Sangue e da Transplantação de Lisboa), the Center for Blood and Transplantation of Porto (Centro de Sangue e da Transplantação do Porto), and the Center for Blood and Transplantation of Coimbra (Centro de Sangue e da Transplantação de Coimbra). CEDACE’s donor registry activities include communication with foreign registries, donors and donor centers, and transplantation and harvesting units to ultimately provide donor products to patients in need, regardless of country of origin (7).
Given the significant per capita size of the CEDACE registry, its composition in terms of foreign and ethnically diverse donors and the importance of its activities, we set out to characterize the Registry to fulfill three interconnected objectives: firstly, we aimed to evaluate the donor composition of the CEDACE registry in terms of demographics and distribution across the country; secondly, we attempted to describe and estimate HLA allele and haplotype frequencies of the CEDACE registry and subpopulations; and thirdly we intended to determine, using the results from the previous two objectives, which donor populations within the country should be targeted to further develop and improve the Registry.
The CEDACE database was queried on August 8, 2017, to obtain epidemiological and HLA data for subsequent analysis. The World Marrow Donor Association (WMDA) website (8) was consulted on May 2, 2019, to obtain worldwide bone marrow donor registry sizes for comparison; the World Bank website (9) was consulted on the same day to calculate per capita registry sizes.
Self-declared characteristics of the donor population obtained included age, gender, ethnicity/ancestry (described as “Origin”), nationality, and residence. Data from the 2011 national census (10) were used to compare with the Portuguese population. The statistical division in seven regions, using the Nomenclature of Territorial Units for Statistics (NUTS) II (North, Center, Metropolitan Area of Lisbon, Alentejo, Algarve, Autonomous Region of Azores and Autonomous Region of Madeira), and the administrative divisions in twenty districts (Açores, Aveiro, Beja, Braga, Bragança, Castelo Branco, Coimbra, Évora, Faro, Guarda, Leiria, Lisboa, Madeira, Portalegre, Porto, Santarém, Setúbal, Viana do Castelo, Vila Real and Viseu) and 308 municipalities were used for comparing subpopulations within the CEDACE registry and assess variations in donor distribution per capita. Graphical representations used maps adapted from http://d-maps.com (11, 12).
Information on HLA typing was collected for the five major loci used in matching for HCT (HLA-A, HLA-B, HLA-C, HLA-DRB1 and HLA-DQB1). The methods used for HLA data collection were sequence-specific oligonucleotide and sequence-specific primer for low- and intermediate-resolutions, whereas sequence-based typing was used for high-resolution data. After obtaining the raw database, empty cells corresponding to homozygous alleles were filled with the typing information from the other allele on the same loci, and one case of split antigen HLA-DR17 was converted into HLA-DRB1*03.
Several datasets were created based on the original raw data using the following sequence:
● Single letter referring to HLA typing resolution: L (low-resolution);
● Number of loci in the dataset: 3 (HLA-A/-B/-DRB1), 4 (HLA-A/-B/-C/-DRB1) and 5 (HLA-A/-B/-C/-DRB1/-DQB1);
● Descriptive of subpopulations within the dataset, if applicable: R (NUTS II Regions), D (districts), F (foreign donors), and NW (non-western donors). When no subpopulation was analyzed, the descriptive G (global) could be used.
As such, six low-resolution datasets, where the intermediate- and high-resolution data were converted into 2-digit, low-resolution data (e.g. HLA-DRB1*03:01 into HLA-DRB1*03) (13) were analyzed:
● Three loci (HLA-A, HLA-B and HLA-DRB1) datasets, dividing the donor populations by NUTS II Region and district (henceforth L3R and L3D, respectively – 394621 donors; L3G is derived from L3R); two datasets were also created analyzing foreign donors and donors with a self-declared non-western ancestry (L3F – 4022 donors – and L3NW – 2659 donors, respectively);
● Four loci (HLA-A, HLA-B, HLA-C and HLA-DRB1) and five loci (HLA-A, HLA-B, HLA-C, HLA-DRB1 and HLA-DQB1) datasets, divided by NUTS II Region, but mostly aimed at global donor database analysis (L4R – 174128 donors – and L5R – 5084 donors, respectively).
After the primary files were prepared with the assistance of CONVERT 1.3.1 (14), allele frequencies were calculated, HLA haplotype frequencies were estimated using the Expectation-Maximization algorithm in Arlequin ver. 3.5.2 (15), and exact tests of Hardy-Weinberg equilibrium were performed in the same software. Comparisons with the literature were then made with the assistance of the Allele Frequency Net Database (16), queried up to December 31, 2022. In the case of allele frequency data, gold standard population allele frequencies and the presence or absence of each frequent allele in typed populations were used to establish commonalities. In the case of haplotype frequency data, populations containing specific haplotypes with significant frequencies were considered if they comprised more than 1000 individuals, except in the case of rarer haplotypes, where all available evidence was used.
Assuming equal inter-allelic distances for all allele pairs, analyses of molecular variance (AMOVA) were also performed on Arlequin as a means to obtain a matrix of genetic distances between pairs of districts and regions at the low-resolution, three loci level, expressed by fixation indices (FST). This matrix was then processed by MEGA 7.0.26 (17) to create neighbor-joining trees (18).
The database obtained on August 14, 2017, comprised 396545 voluntary donors, corresponding to 3.85% of the Portuguese population. At the time, considering only bone marrow donor registries (excluding cord blood banks), CEDACE was the twelfth largest Registry in the world, and the fifth largest per capita, supplanted only by Cyprus, Israel, Germany, and Poland (Supplementary Table 1). Typing was performed at three CEDACE typing laboratories, with 46.01% of donors having been typed at the Center for Blood and Transplantation of Lisbon, 34.27% at the Center for Blood and Transplantation of Porto and 19.72% at the Center for Blood and Transplantation of Coimbra.
The median donor age in the CEDACE registry was 39 years (IQR 33-45). There was a predominance of female donors in the Registry (60.4% female; 39.6% male). Most donors in the Registry were of Portuguese nationality (98.98%), although 40 nationalities different than Portuguese were registered in CEDACE (Table 1). Brazil was the most represented country in the Registry other than Portugal, contributing 41.95% of foreign donors. When the Portuguese-speaking African Countries of Angola, Cape Verde, Guinea-Bissau, Mozambique, and São Tomé and Príncipe were added together, they contributed 30.48% of foreign donors. Of the 76.2% of donors who self-declared their ethnicity/ancestry, the vast majority (99.12%) reported being of Western origin; the second largest group (0.66%) reported African ancestry (Supplementary Table 2).
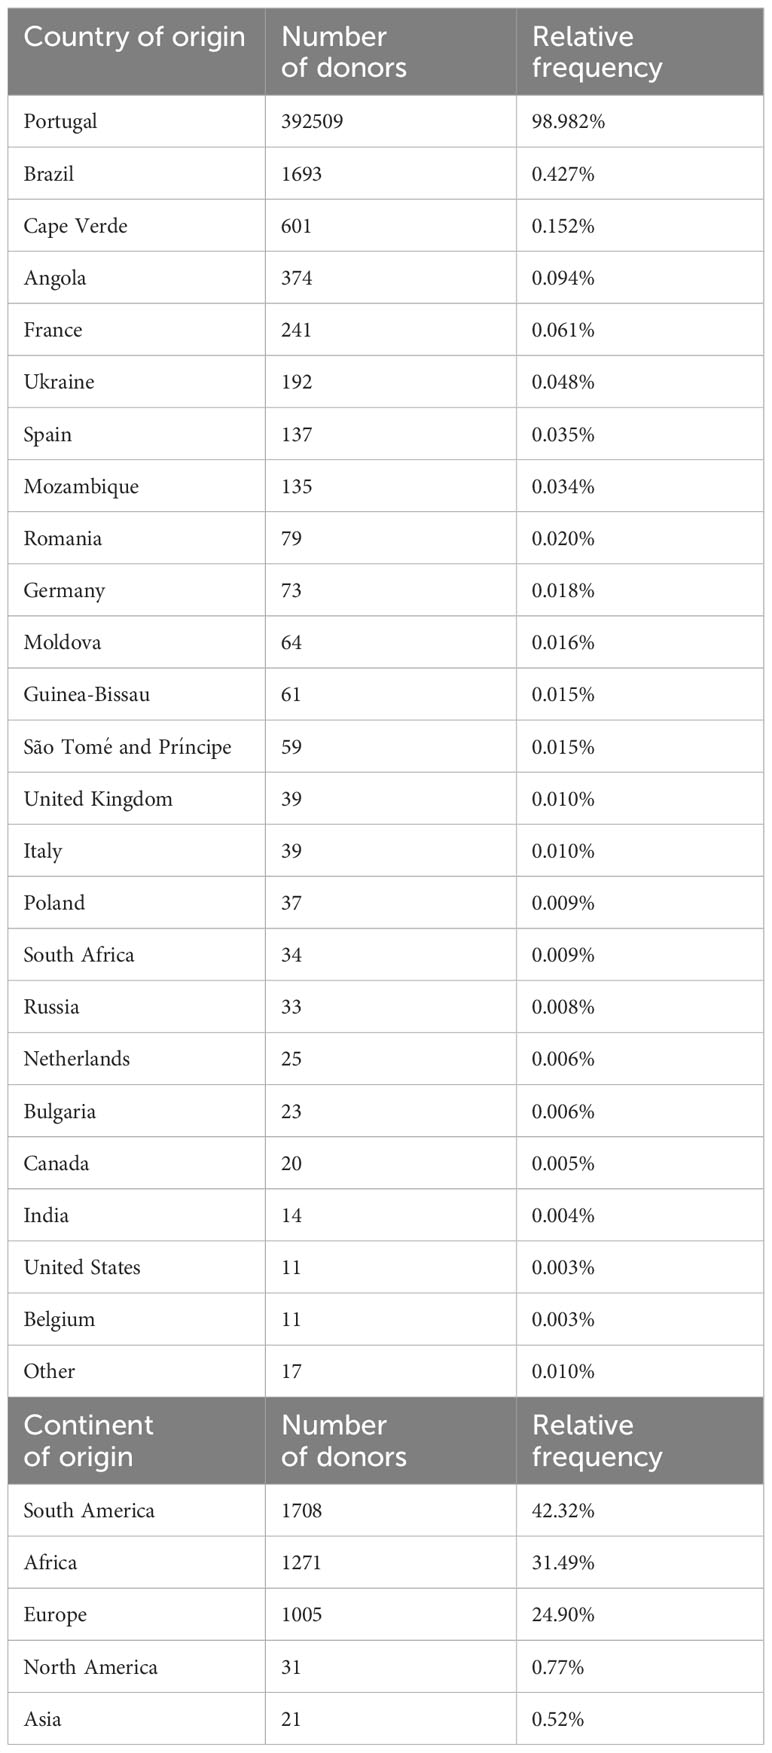
Table 1 Top: Countries of origin of donors represented in the CEDACE registry by at least 10 individuals and relative contribution. Bottom: Continents of origin of foreign donors in the CEDACE registry (Russia included in Europe).
Figure 1; Supplementary Table 3 show the geographical distributions of donors in the CEDACE registry, both as absolute counts and per capita (relative to the region’s population), according to NUTS II Region and district of residence. Although most donors (87.4%) were provided by the NUTS II Regions of North, Metropolitan Area of Lisbon and Center, the differences between regions became less pronounced when per capita contributions were considered, with the Center Region contributing the most per capita donors and the Autonomous Regions of Madeira and Azores contributing the least. The five districts that contributed with the most donors were Lisboa, Porto, Braga, Aveiro and Setúbal; when considering per capita contributions, however, the five districts that contributed the highest percentage of donors were Coimbra, Portalegre, Aveiro, Leiria and Lisboa. The least represented districts regarding absolute contribution were Madeira, Castelo Branco, Açores, Bragança and Beja; and the five districts that contributed the least percentage of donors were Beja, Castelo Branco, Faro, Madeira and Açores. All municipalities but one had registered donors in the Registry, the exception being Corvo, with no registered donors; the highest per capita contributor municipalities were Vieira do Minho, Sobral de Monte Agraço and Murtosa, with 8.54%, 8.14% and 7.79%, respectively, and the lowest (except Corvo) were Santa Cruz das Flores, Lajes das Flores and Santa Cruz da Graciosa, with 0.35%, 0.33% and 0.26%, respectively – all belonging to the Autonomous Region of Azores. The five municipalities with the most donors were Lisboa, Sintra, Vila Nova de Gaia, Cascais and Oeiras, contributing to 5.26%, 3.84%, 3.27%, 2.40% and 2.01% of the Registry, respectively – of note, four of these belong to the Lisboa district and the Metropolitan Area of Lisbon Region.
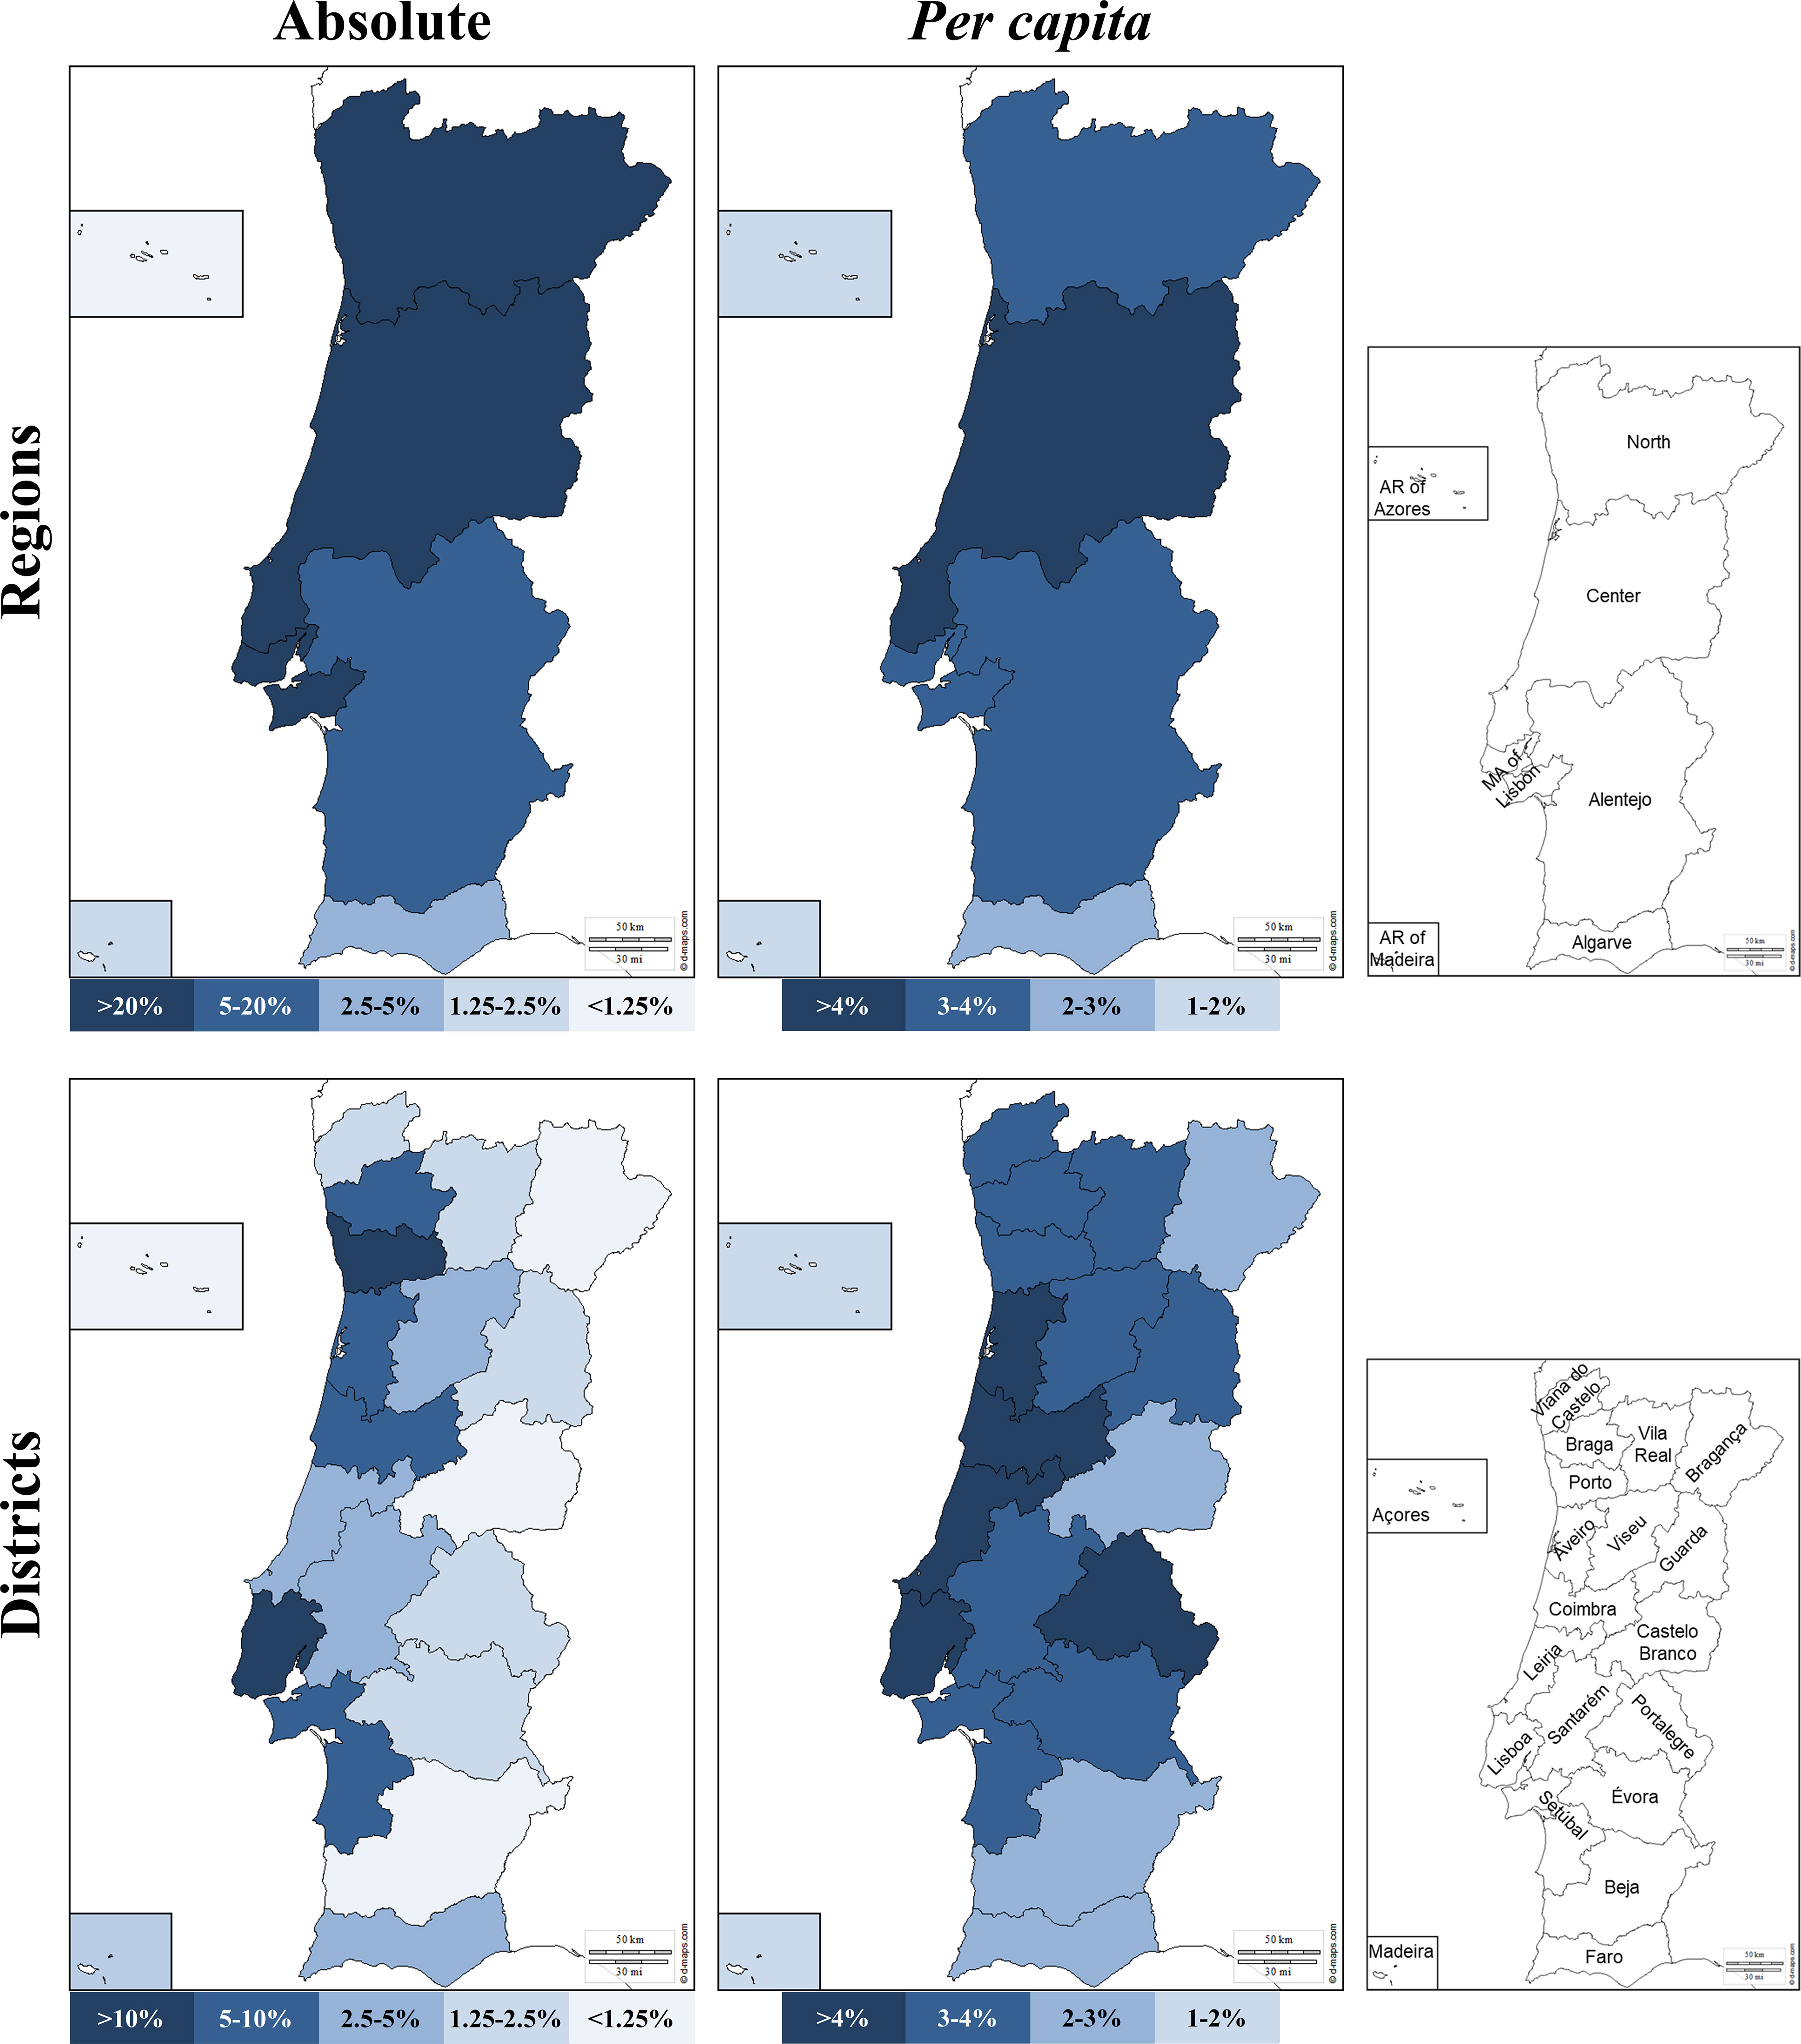
Figure 1 Donor NUTS II Region (top) and district of origin (bottom) in absolute (left) and per capita (right) contribution to the Registry. Maps adapted from http://d-maps.com.
The relative distribution of foreign donors and donors of self-declared non-western origin is represented in Supplementary Figure 1. The four regions that contributed with more foreign donors per capita were the Algarve, the Metropolitan Area of Lisbon, the Alentejo and the Autonomous Region of Azores, with 3.91%, 2.62%, 1.10% and 0.76%, respectively. In contrast, the Center, the Autonomous Region of Madeira and the North contributed with relatively few foreign donors, with 0.32%, 0.18% and 0.04%, respectively. Except for the Autonomous Regions, where the Azores had an unexpectedly higher percentage of foreign donors than Madeira, the frequency distribution relatively mimicked the distribution of foreign nationals residing in Portugal (10). In absolute terms, the Metropolitan Area of Lisbon contributed the vast majority of foreign donors (72.70%); it was followed by the Algarve, the Center, the Alentejo, the North, and the Autonomous Regions of Azores and Madeira, with 10.04%, 7.61%, 6.91%, 1.46%, 0.77% and 0.22%, respectively. The relative contribution of donors of self-declared non-western ethnicity shared some similarities with that of foreign donors, as it was higher in the South of the country (Metropolitan Area of Lisbon – 2.68%; Algarve – 1.66%; Alentejo – 0.65%), followed by the Autonomous Regions (Azores – 0.54%; Madeira – 0.18%) and lowest in the Center (0.15%) and North (0.02%). In absolute terms, most non-western donors resided in the Metropolitan Area of Lisbon (84.4%), followed by the Algarve, the Alentejo and the Center, with 5.09%, 4.68% and 4.49%. The North and the Autonomous Regions of Azores and Madeira contributed with a very low number of donors of non-western ethnicity, at 0.67%, 0.64% and 0.11%, respectively.
As previously stated, the obtained database query consisted of 396545 donors; of these, 394621 (99.51%) were typed in at least three loci (HLA-A/-B/-DRB1), 174128 (43.91%) in at least four loci (including, besides the ones previously mentioned, HLA-C), and 5084 (1.28%) in all five loci (including HLA-DQB1). 3048 donors (0.77%) were typed in all five loci and intermediate to high-resolution (at the four-digit level), 63.71% of these with no ambiguities as expressed by NMDP codes, corresponding to 1942 donors, or 0.49% of the Registry. Supplementary Tables 4, 5 show the number of typed donors per NUTS II Regions and districts in each relevant dataset.
Global low-resolution allele frequencies are shown in Table 2. As expected, HLA*B was the most polymorphic locus, followed by HLA*A; the least polymorphic locus was HLA-DQB1.
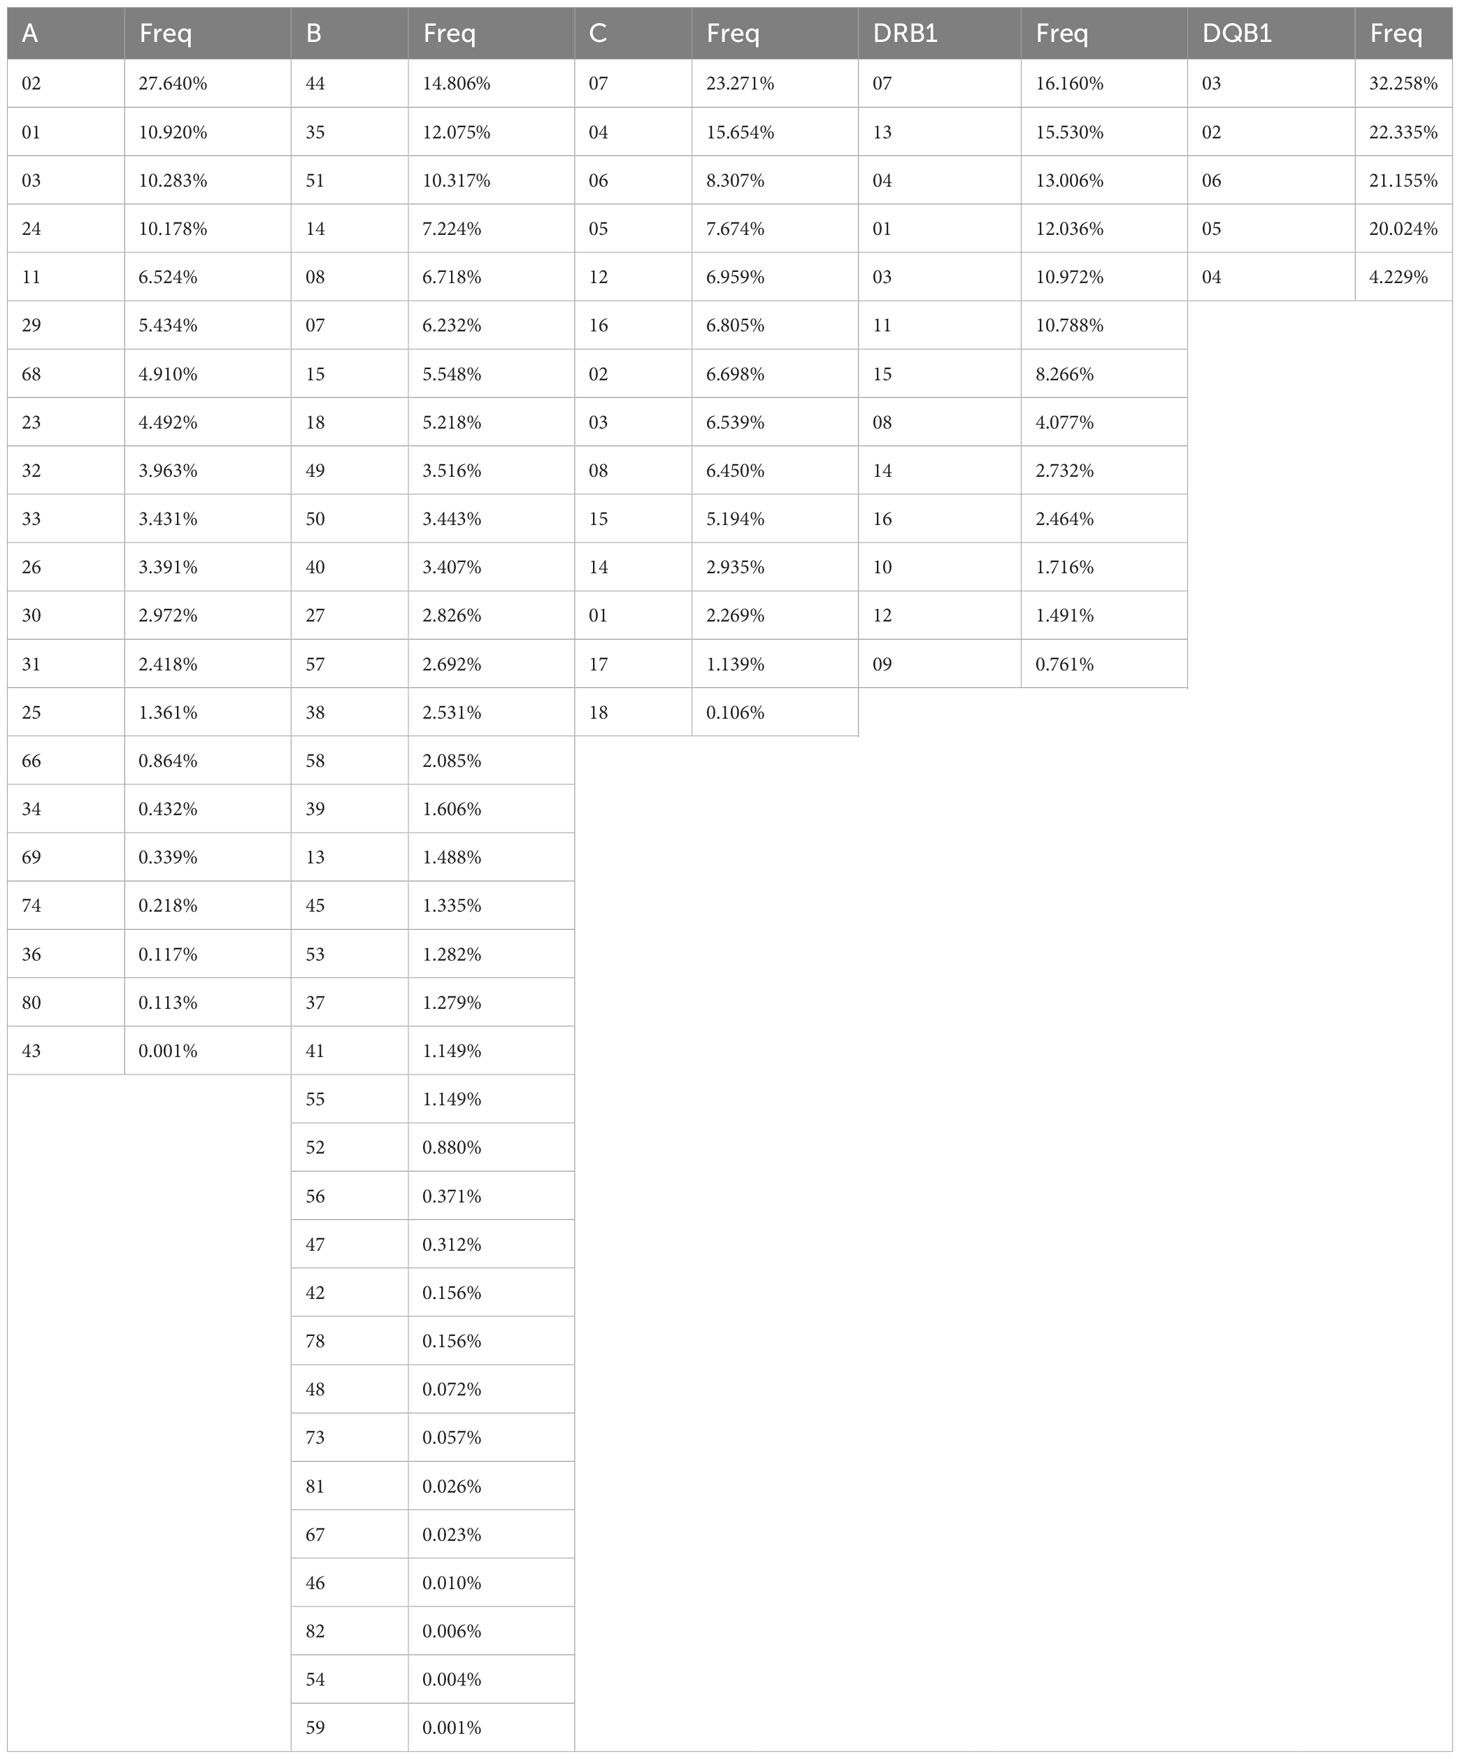
Table 2 Global low-resolution frequencies of HLA alleles. HLA-A, HLA-B and HLA-DRB1 frequencies obtained from L3R, HLA-C frequencies obtained from L4R and HLA-DQB1 frequencies obtained from L5R. Freq – frequency.
The most frequent HLA*A alleles found in the CEDACE registry were the common alleles HLA-A*02 and HLA-A*24, as well as the typically Western alleles HLA-A*01 and HLA-A*03, with a cumulative frequency of 59% of the identified low-resolution HLA-A polymorphisms. While it was shown to be a more polymorphic locus, the five most frequent HLA-B alleles (the common HLA-B*44, HLA-B*35, HLA-B*51 and HLA-B*08, and the Western/African HLA-B*14) cumulatively represented more than 50% of the identified low-resolution polymorphisms. Some rare alleles, such as the East Asian HLA-B*46, HLA-B*54 and HLA-B*59 or the Sub-Saharan African HLA-B*82, could be detected at very low frequencies in our Registry. The two common HLA*C alleles, HLA-C*07 and HLA-C*04 had a cumulative frequency of 39%; the rarest identified HLA-C allele is the Sub-Saharan African HLA-C*18, with a frequency of 0.106%. There were six HLA-DRB1 alleles with a detected frequency higher than 10%, comprising 78.5% of detected HLA-DRB1 alleles: the Western/African HLA-DRB1*07, HLA-DRB1*13 and HLA-DRB1*01, and the common HLA-DRB1*04, HLA-DRB1*03 and HLA-DRB1*11. The three HLA-DRB1 alleles identified at the lowest frequencies were the typically Asian alleles HLA-DRB1*10, HLA-DRB1*12 and HLA-DRB1*09. The five low-resolution HLA-DQB1 alleles were identified in the CEDACE registry, four of them with a cumulative frequency higher than 20%; the only HLA-DQB1 allele that was found with a lower frequency was HLA-DQB1*04 (16).
Allele and HLA frequencies varied according to districts and NUTS II Regions of residence, as well as ancestry and nationality of donors. Differential low-resolution allele distributions according to NUTS II Region are demonstrated in Supplementary Figures 2-6, after a brief description in the Supplementary data file (datasets L3R, L4R and L5R).
HLA haplotype frequency distribution in the CEDACE registry was skewed towards more frequent haplotypes. In fact, in the CEDACE registry at the three loci, low-resolution level, there was a significant deviation from Hardy-Weinberg equilibrium on all three loci (p-value<0.00001). Due to these factors, the most frequent haplotypes identified comprised a relatively high fraction of them.
A total of 4913 three loci, low-resolution HLA haplotypes with a frequency of at least 0.0001% were identified in the CEDACE registry (L3G). Of these, the five most common corresponded to 8.85% of the Registry, the ten most common to 13.82%, the 25 most common to 23.50%, the 50 most common to 31.96%, the 100 most common to 42.25%, the 150 most common to 50.03%, the 500 most common to 76.31%, and the 500 most common to 89.47%. For the 394621 donors identified in L3G, there were 167505 individual genotypes, leading to 227116 individuals, or 57.55%, having at least one other matched individual in the CEDACE registry at this resolution.
The frequency distribution of the 150 most common three loci, low-resolution haplotypes identified in the CEDACE registry (L3G) and corresponding frequencies according to NUTS II Region (L3R) are displayed in Supplementary Table 6, and a graphical representation of the frequency distribution of the 25 most common haplotypes is shown in Figure 2.
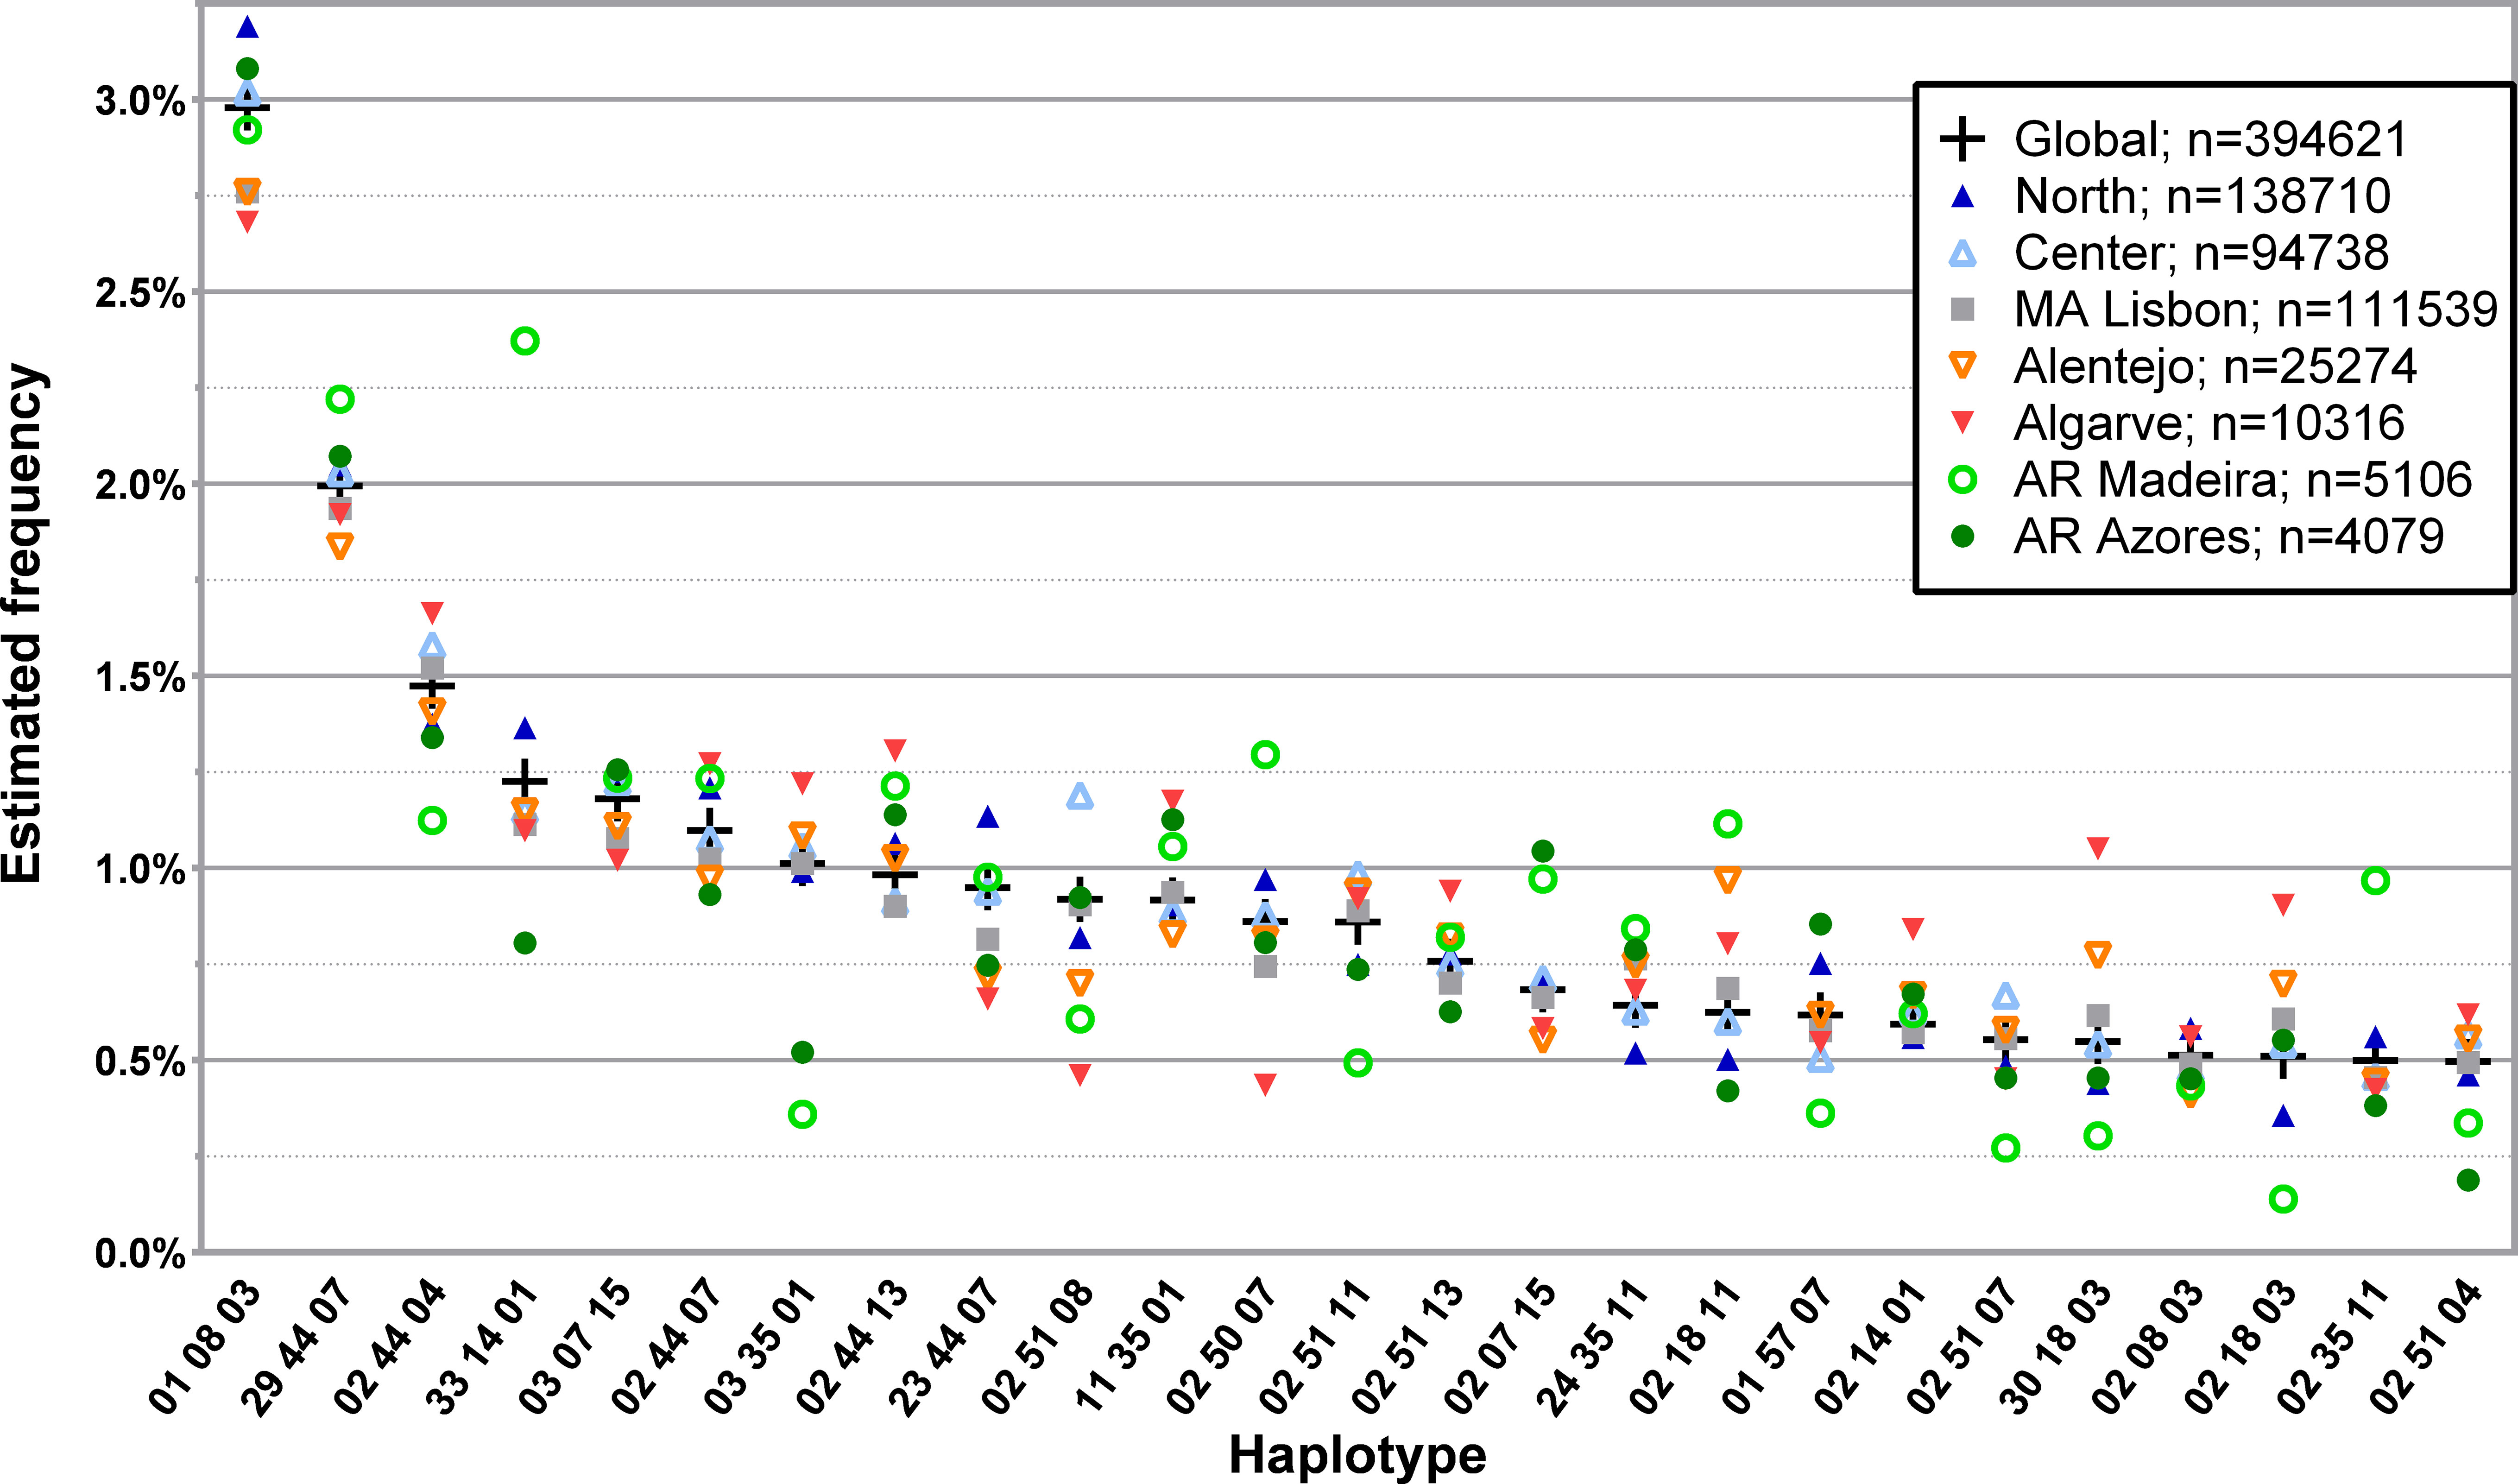
Figure 2 Frequency distribution of the 25 most common three loci, low-resolution HLA-A/-B/-DRB1 haplotypes in CEDACE and corresponding frequencies according to NUTS II Region. Dataset: L3R.
Considering the most frequent L3G haplotypes, some displayed increasing frequencies from south to north, such as HLA-A*01~B*08~DRB1*03, and some from north to south, such as HLA-A*02~B*18~DRB1*11, HLA-A*30~B*18~DRB1*03 and HLA-A*02~B*18~DRB1*03. Specific haplotypes had greater frequencies in the Autonomous Regions, such as HLA-A*29~B*44~DRB1*07, detected with a greater relative frequency in the Autonomous Region of Madeira, followed by the Autonomous Region of Azores. Similarly, HLA-A*33~B*14~DRB1*01 and HLA-A*02~B*35~DRB1*11 were seen in the Autonomous Region of Madeira with a much higher frequency than in the CEDACE registry (2.3724% vs. 1.2262% and 0.9684% vs. 0.4992%, respectively). HLA-A*03~B*35~DRB1*01, on the contrary, while frequent in the CEDACE registry (1.0120%), was much less frequently found in the Autonomous Regions of Madeira (0.3593%) and Azores (0.5214%).
The frequency distribution of the 150 most common haplotypes in L3G according to District (L3D) is displayed in Supplementary Tables 7, 8, and a graphical representation of the frequency distribution of the 25 most common haplotypes is shown in Supplementary Figure 7.
The analysis of L4R led to the identification of 9627 individual four loci, low-resolution haplotypes with a frequency of at least 0.0001%. For the 174128 donors in this database, there were 119196 individual genotypes, leading to 54932 individuals, or 31.55%, having at least one other matched individual in the CEDACE registry. The frequency distribution of the 25 and 50 most common four loci, low-resolution haplotypes in the CEDACE registry and according to NUTS II Region is represented in Figure 3; Supplementary Table 9, respectively.
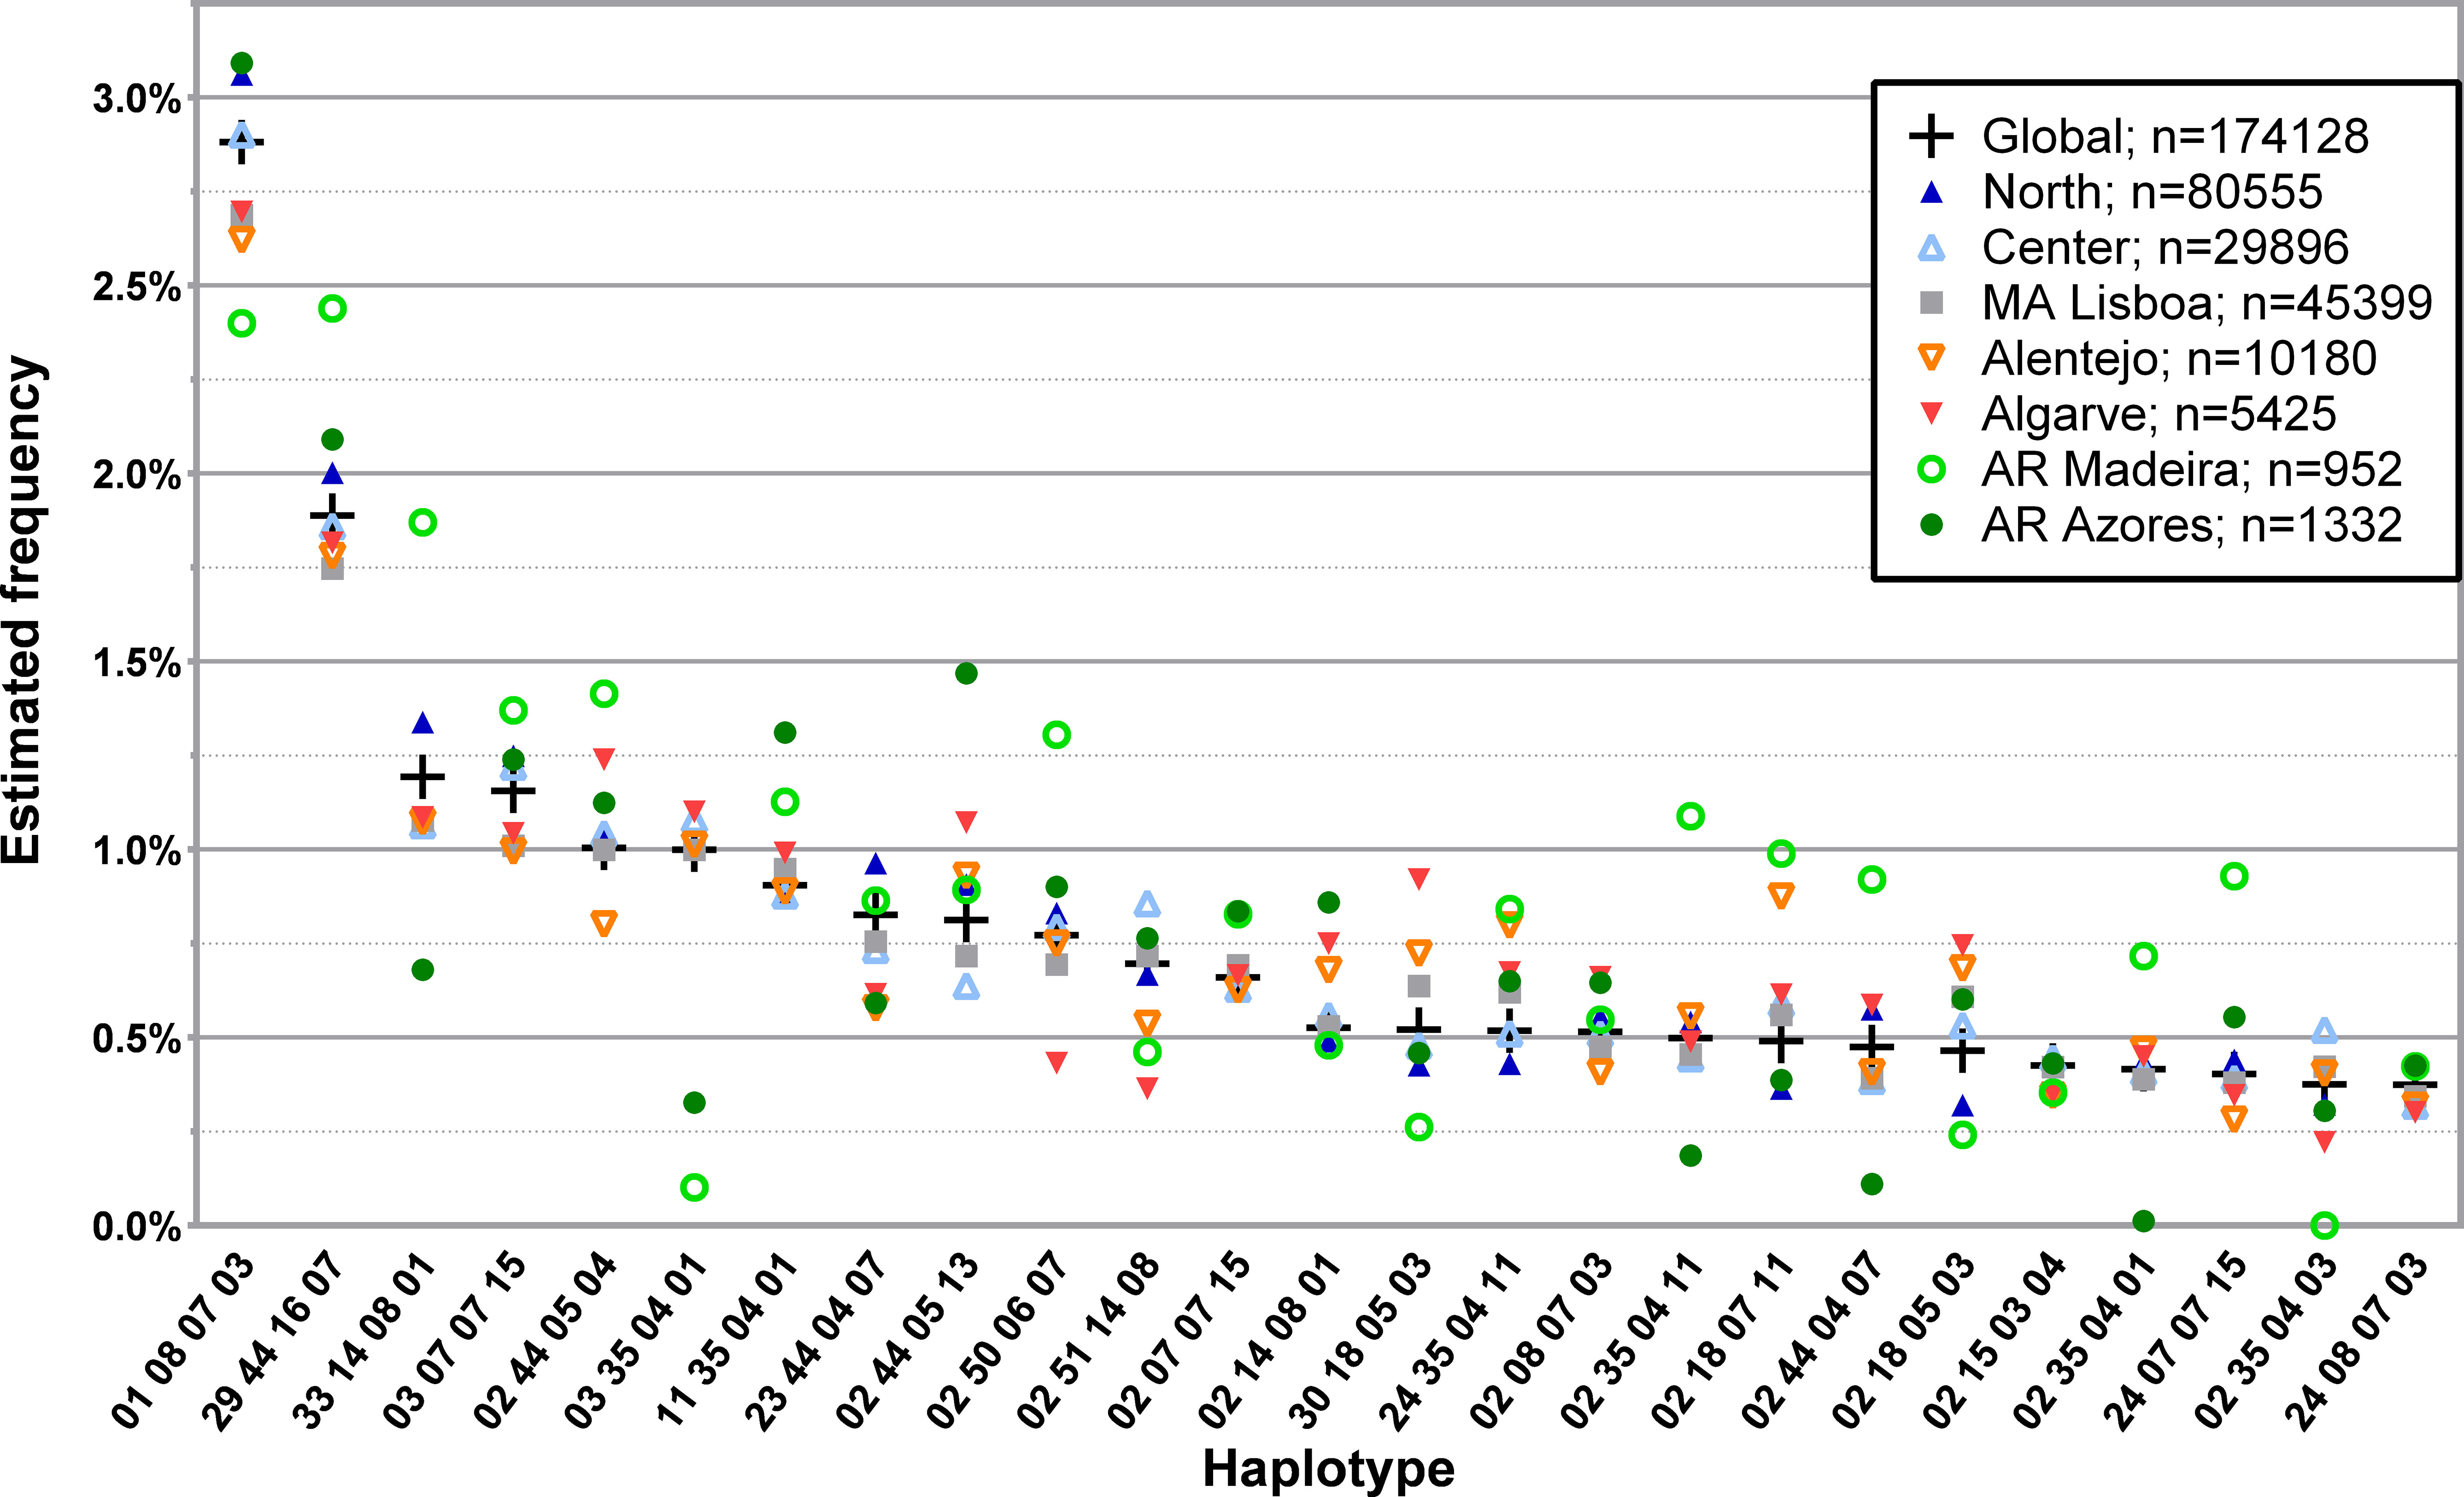
Figure 3 Frequency distribution of the 25 most common four loci, low-resolution HLA-A/-B/-C/-DRB1 haplotypes in CEDACE and corresponding frequencies according to NUTS II Region. Dataset: L4R.
Using the AMOVA function, as previously described, we obtained matrices of FST, reflecting the genetic distances between the donor populations of different NUTS II Regions and Districts, as shown in Supplementary Figures 8, 9 and displayed in graphical format in Figure 4. All pairwise comparisons were highly statistically significant, with p-values <0.00001.
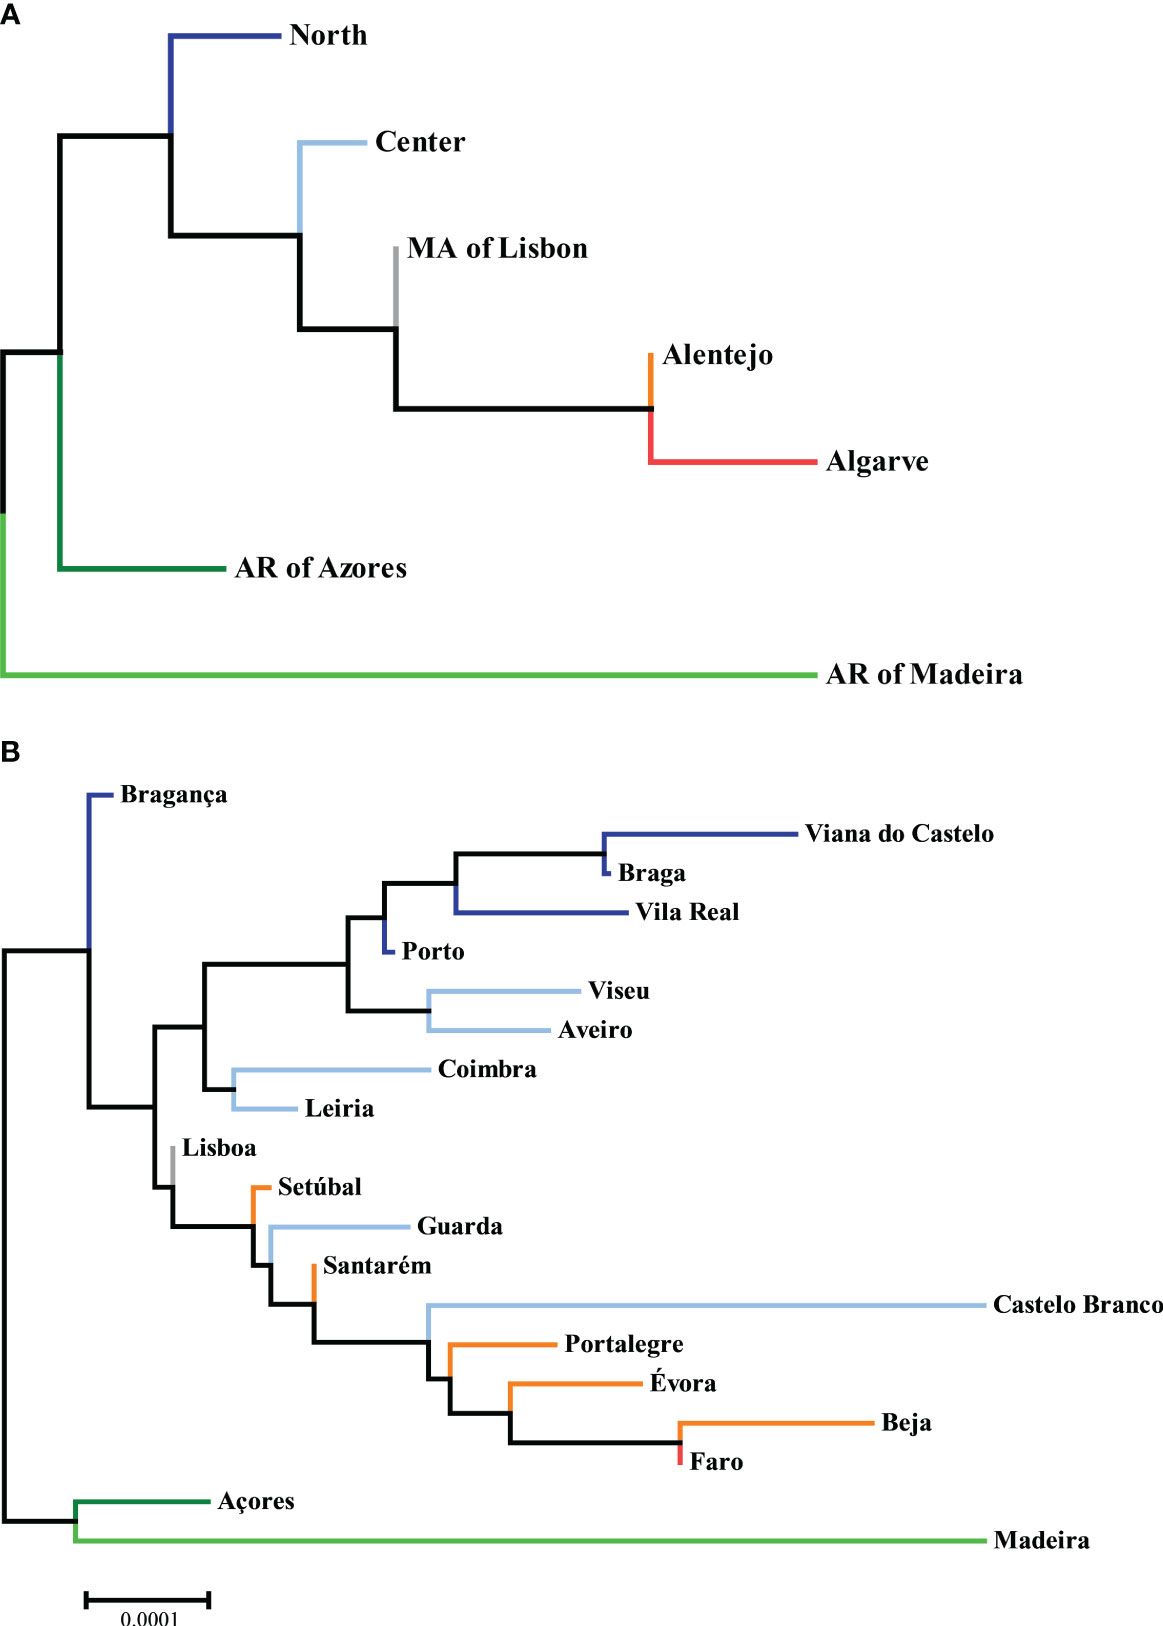
Figure 4 Neighbor-joining trees of phylogenetic distances between (A) NUTS II Regions and (B) Districts, with the sum of branch lengths of 0.00150375 and 0.00346773, respectively, drawn to scale. Datasets: L3R and L3D.
Regarding NUTS II Regions, one can appreciate that the ones more similar to the global CEDACE registry (and thus more reflective of overall contribution to itself) were the Metropolitan Area of Lisbon and the Center, whereas the one more unlike it was the Autonomous Region of Madeira, followed by the Algarve and the Autonomous Region of Azores. Regarding Districts, the closest one to the CEDACE registry was Lisboa, followed by Porto and Leiria, Santarém and Setúbal, and the one furthest from it was Madeira, followed by Castelo Branco, Beja, Évora and Faro.
Due to the low number of non-western donors in the Registry, only the African subset of L3NW was specifically analyzed. The 25 and 50 most common haplotypes found in the 1984 donors with self-declared African ancestry and the comparison with the corresponding L3G haplotype frequencies are represented in Figure 5; Supplementary Table 10, respectively. While the first and third most frequent three loci, low-resolution haplotypes in this donor group (HLA-A*01~B*08~DRB1*03 and HLA-A*29~B*44~DRB1*07, respectively), were the first and second most frequently identified haplotypes in the CEDACE registry, there were several haplotypes detected with significant frequency (greater than 0.5%) in this population that had comparatively low frequencies in the CEDACE registry.
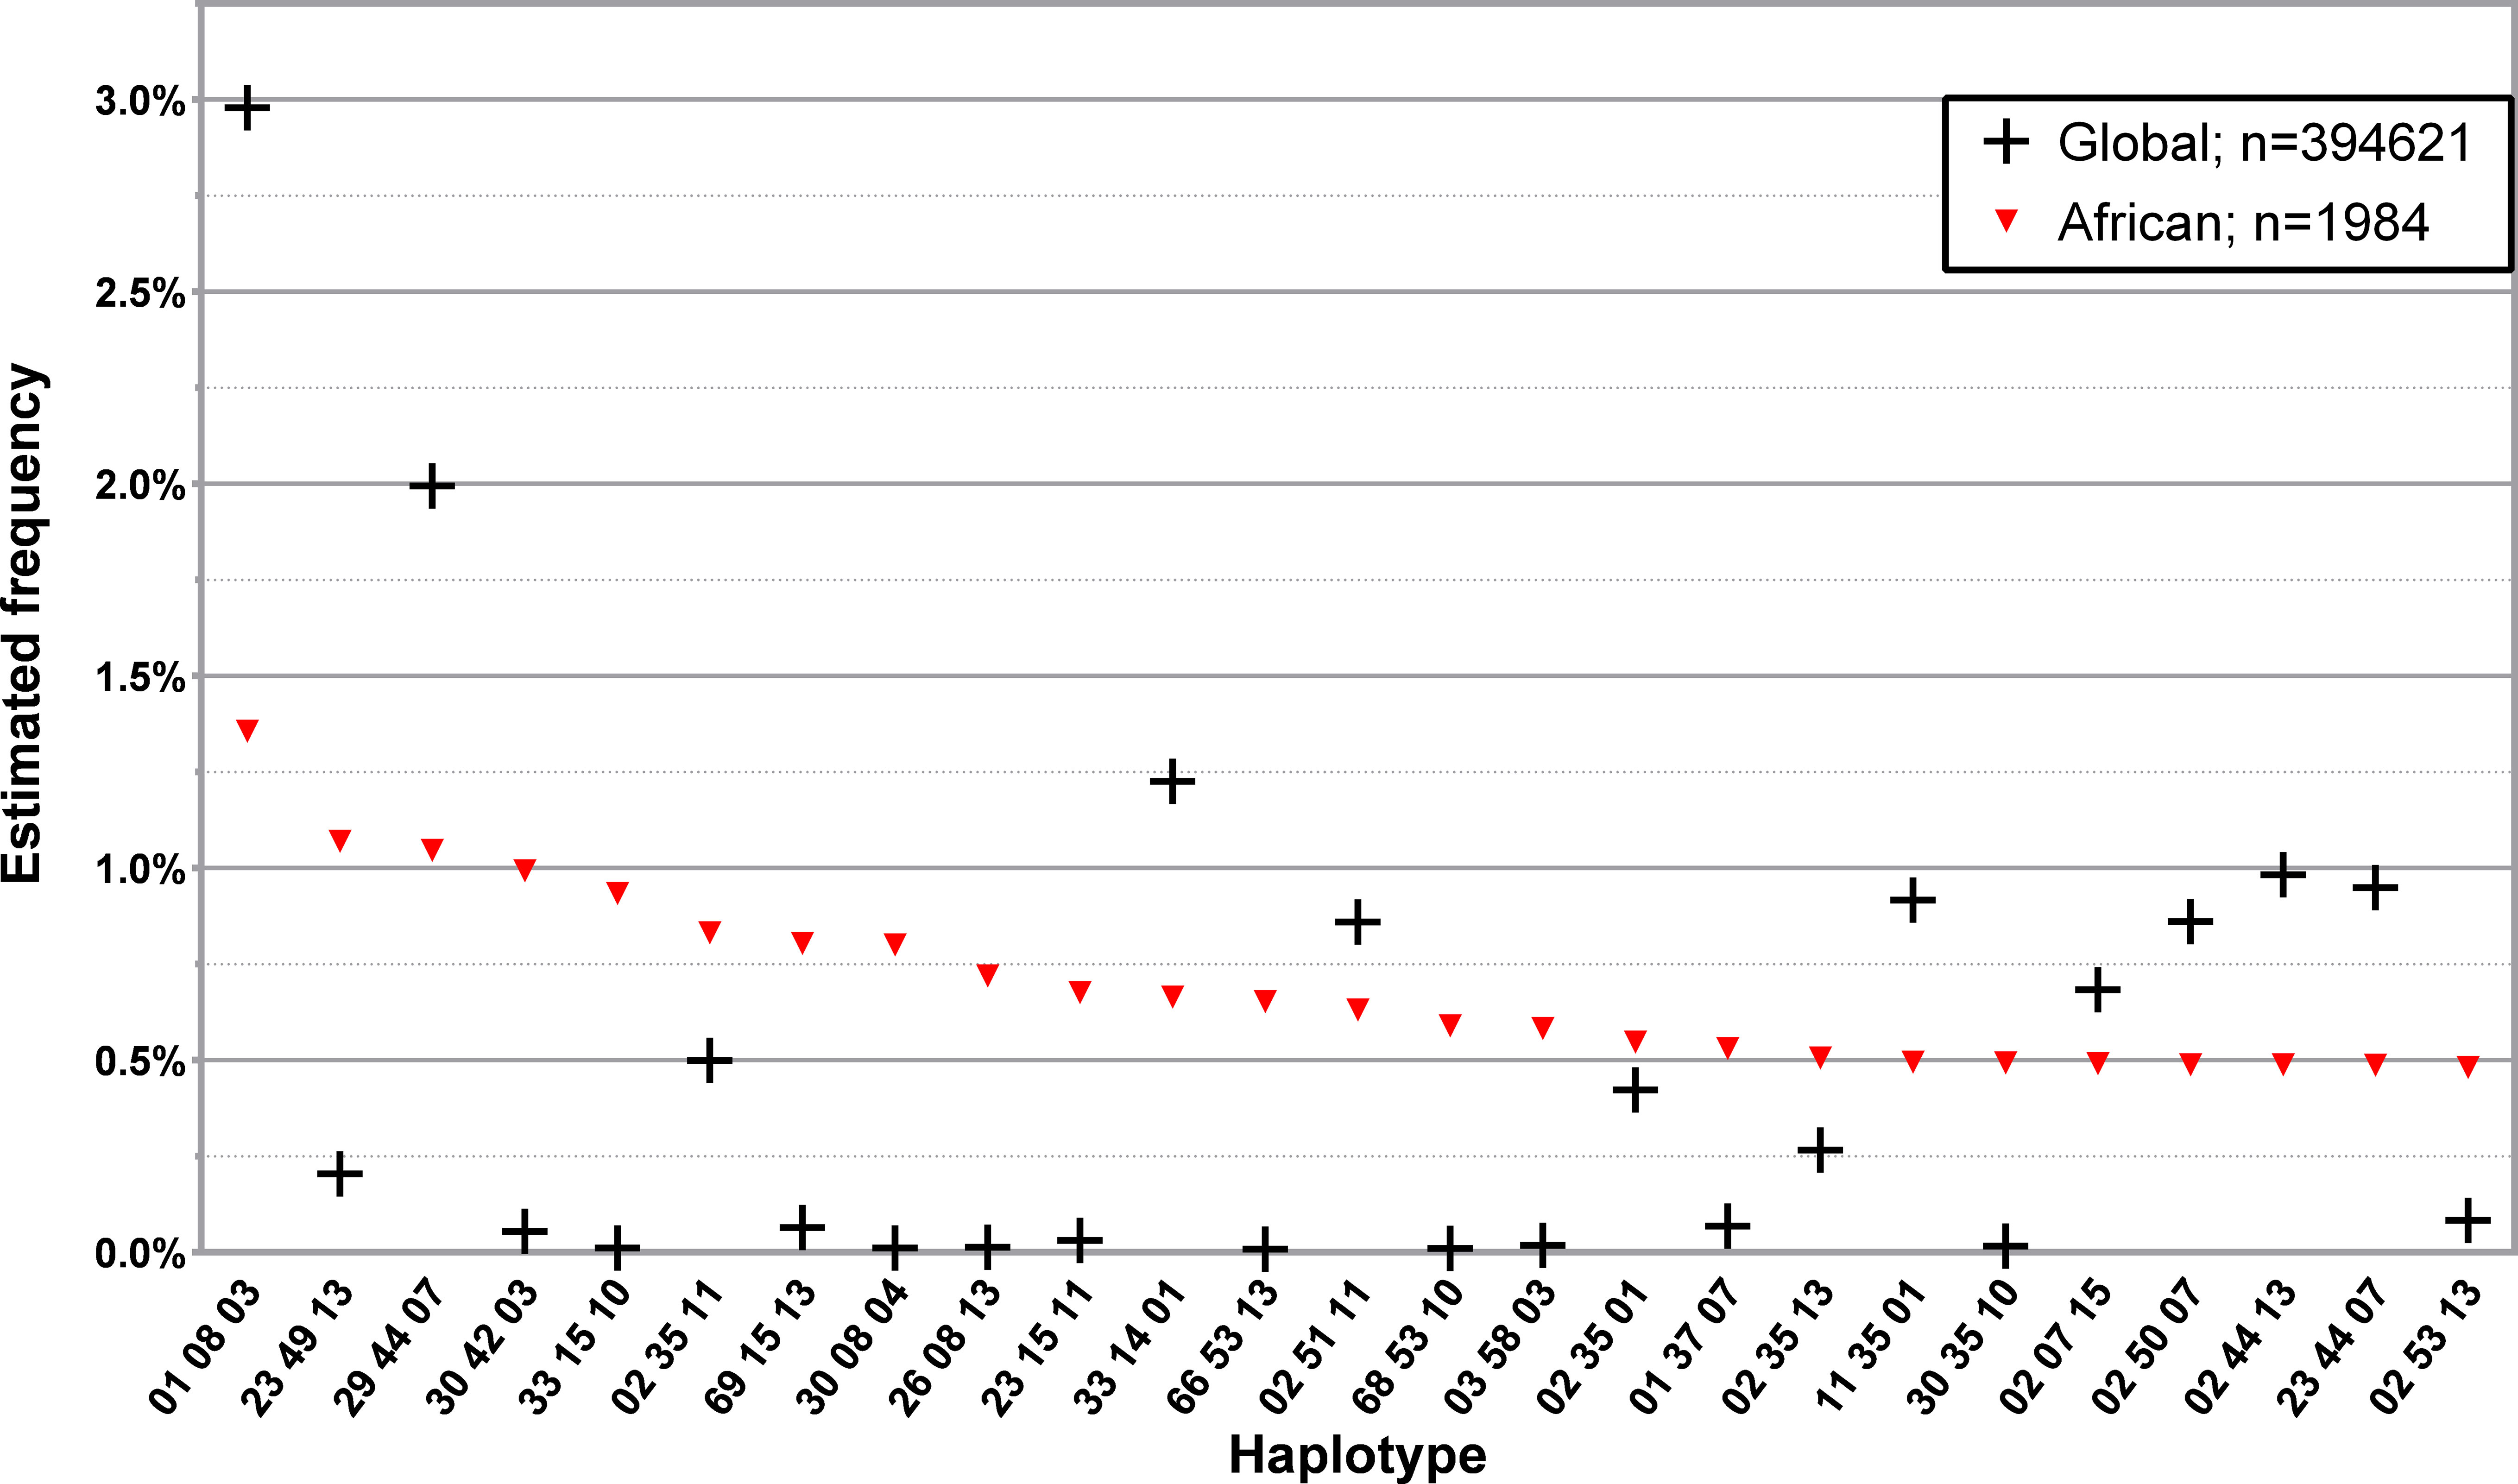
Figure 5 Frequency distribution of the 25 most common three loci, low-resolution HLA-A/-B/-DRB1 in donors of self-declared African ancestry. Dataset: L3NW.
Examples of this are HLA-A*23~B*49~DRB1*13, HLA-A*30~B*42~DRB1*03 and HLA-A*33~B*15~DRB1*10, the second, fourth and fifth most frequent haplotypes in African donors, which had a frequency of 1.0707%, 0.9937% and 0.9348% in this donor population and 0.2041%, 0.0547% and 0.0112% in the CEDACE registry, respectively.
Similarly to what was done in regards to L3NW, only a few donor populations from L3F were analyzed, according to historical interest, available evidence and donor population size. Figure 6; Supplementary Tables 11–13 show the 25 and 50 most common three loci, low-resolution haplotypes found in the 601, 135 and 374 donors with self-declared nationalities from the Portuguese-speaking African Countries (PALOP) with more than 100 registered donors: Cape Verde, Mozambique and Angola, respectively. Donors from Cape Verde (disregarding 7.3% missing data) were mainly (87.8%) of self-declared African ancestry, with 8.4% self-describing as Western and 3.6% as Mixed ancestry. Of the 134 donors from Mozambique in the CEDACE registry, only 46.3% self-declared their origin; of these, 48.4% reported Western ancestry, 40.3% African ancestry, and 9.7% Mixed ancestry (one donor reported Hindu ancestry). Only 206 out of the 372 (55.4%) donors from Angola declared their origin: 69.9% self-declared African ancestry, 23.3% Western, and 6.8% Mixed.
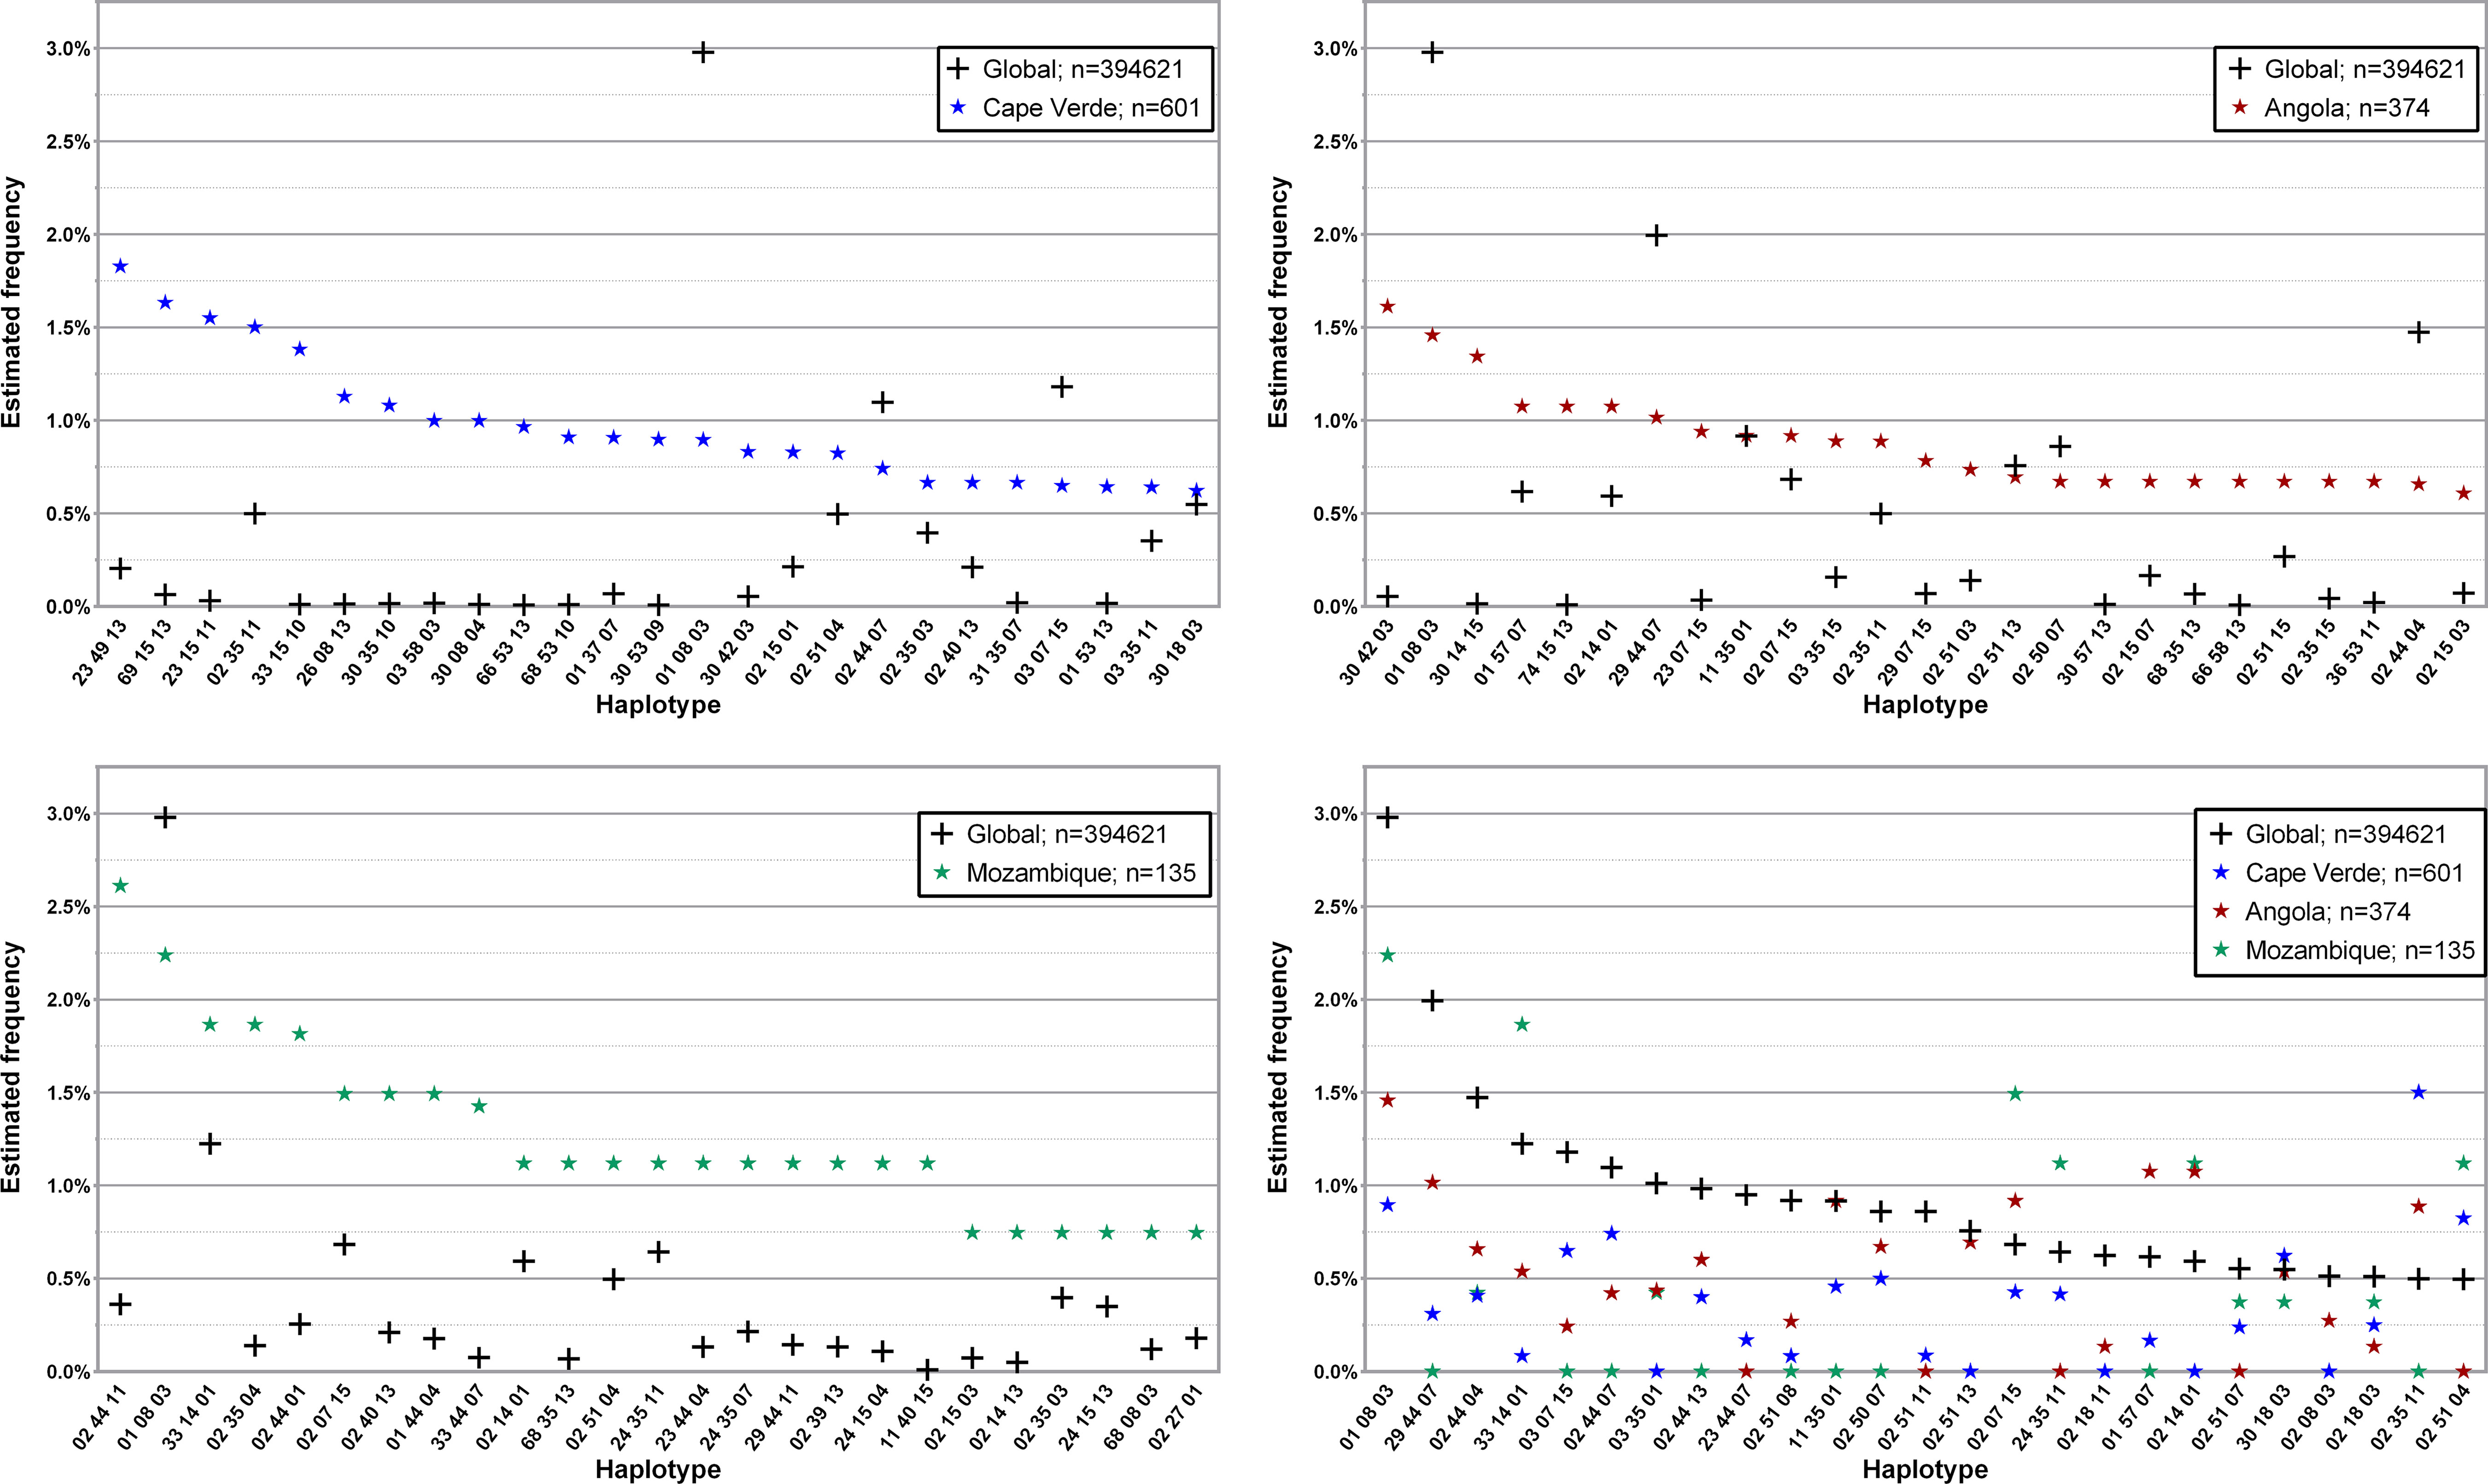
Figure 6 Frequency distribution of the 25 most common three loci, low-resolution HLA-A/-B/-DRB1 in donors from the three Portuguese-speaking African countries compared to the global CEDACE Registry. Top left: Cape Verde; top right: Angola; bottom left: Mozambique; bottom right: CEDACE and all three countries. Dataset: L3F.
The 25 and 50 most common three loci, low-resolution haplotypes in the Brazilian donor population of the CEDACE registry are displayed in Figure 7; Supplementary Table 14, respectively. Of the 81.1% who self-declared their ancestry, 89.1% were Western, 8.0% Mixed, 1.5% African and 0.8% Asian.
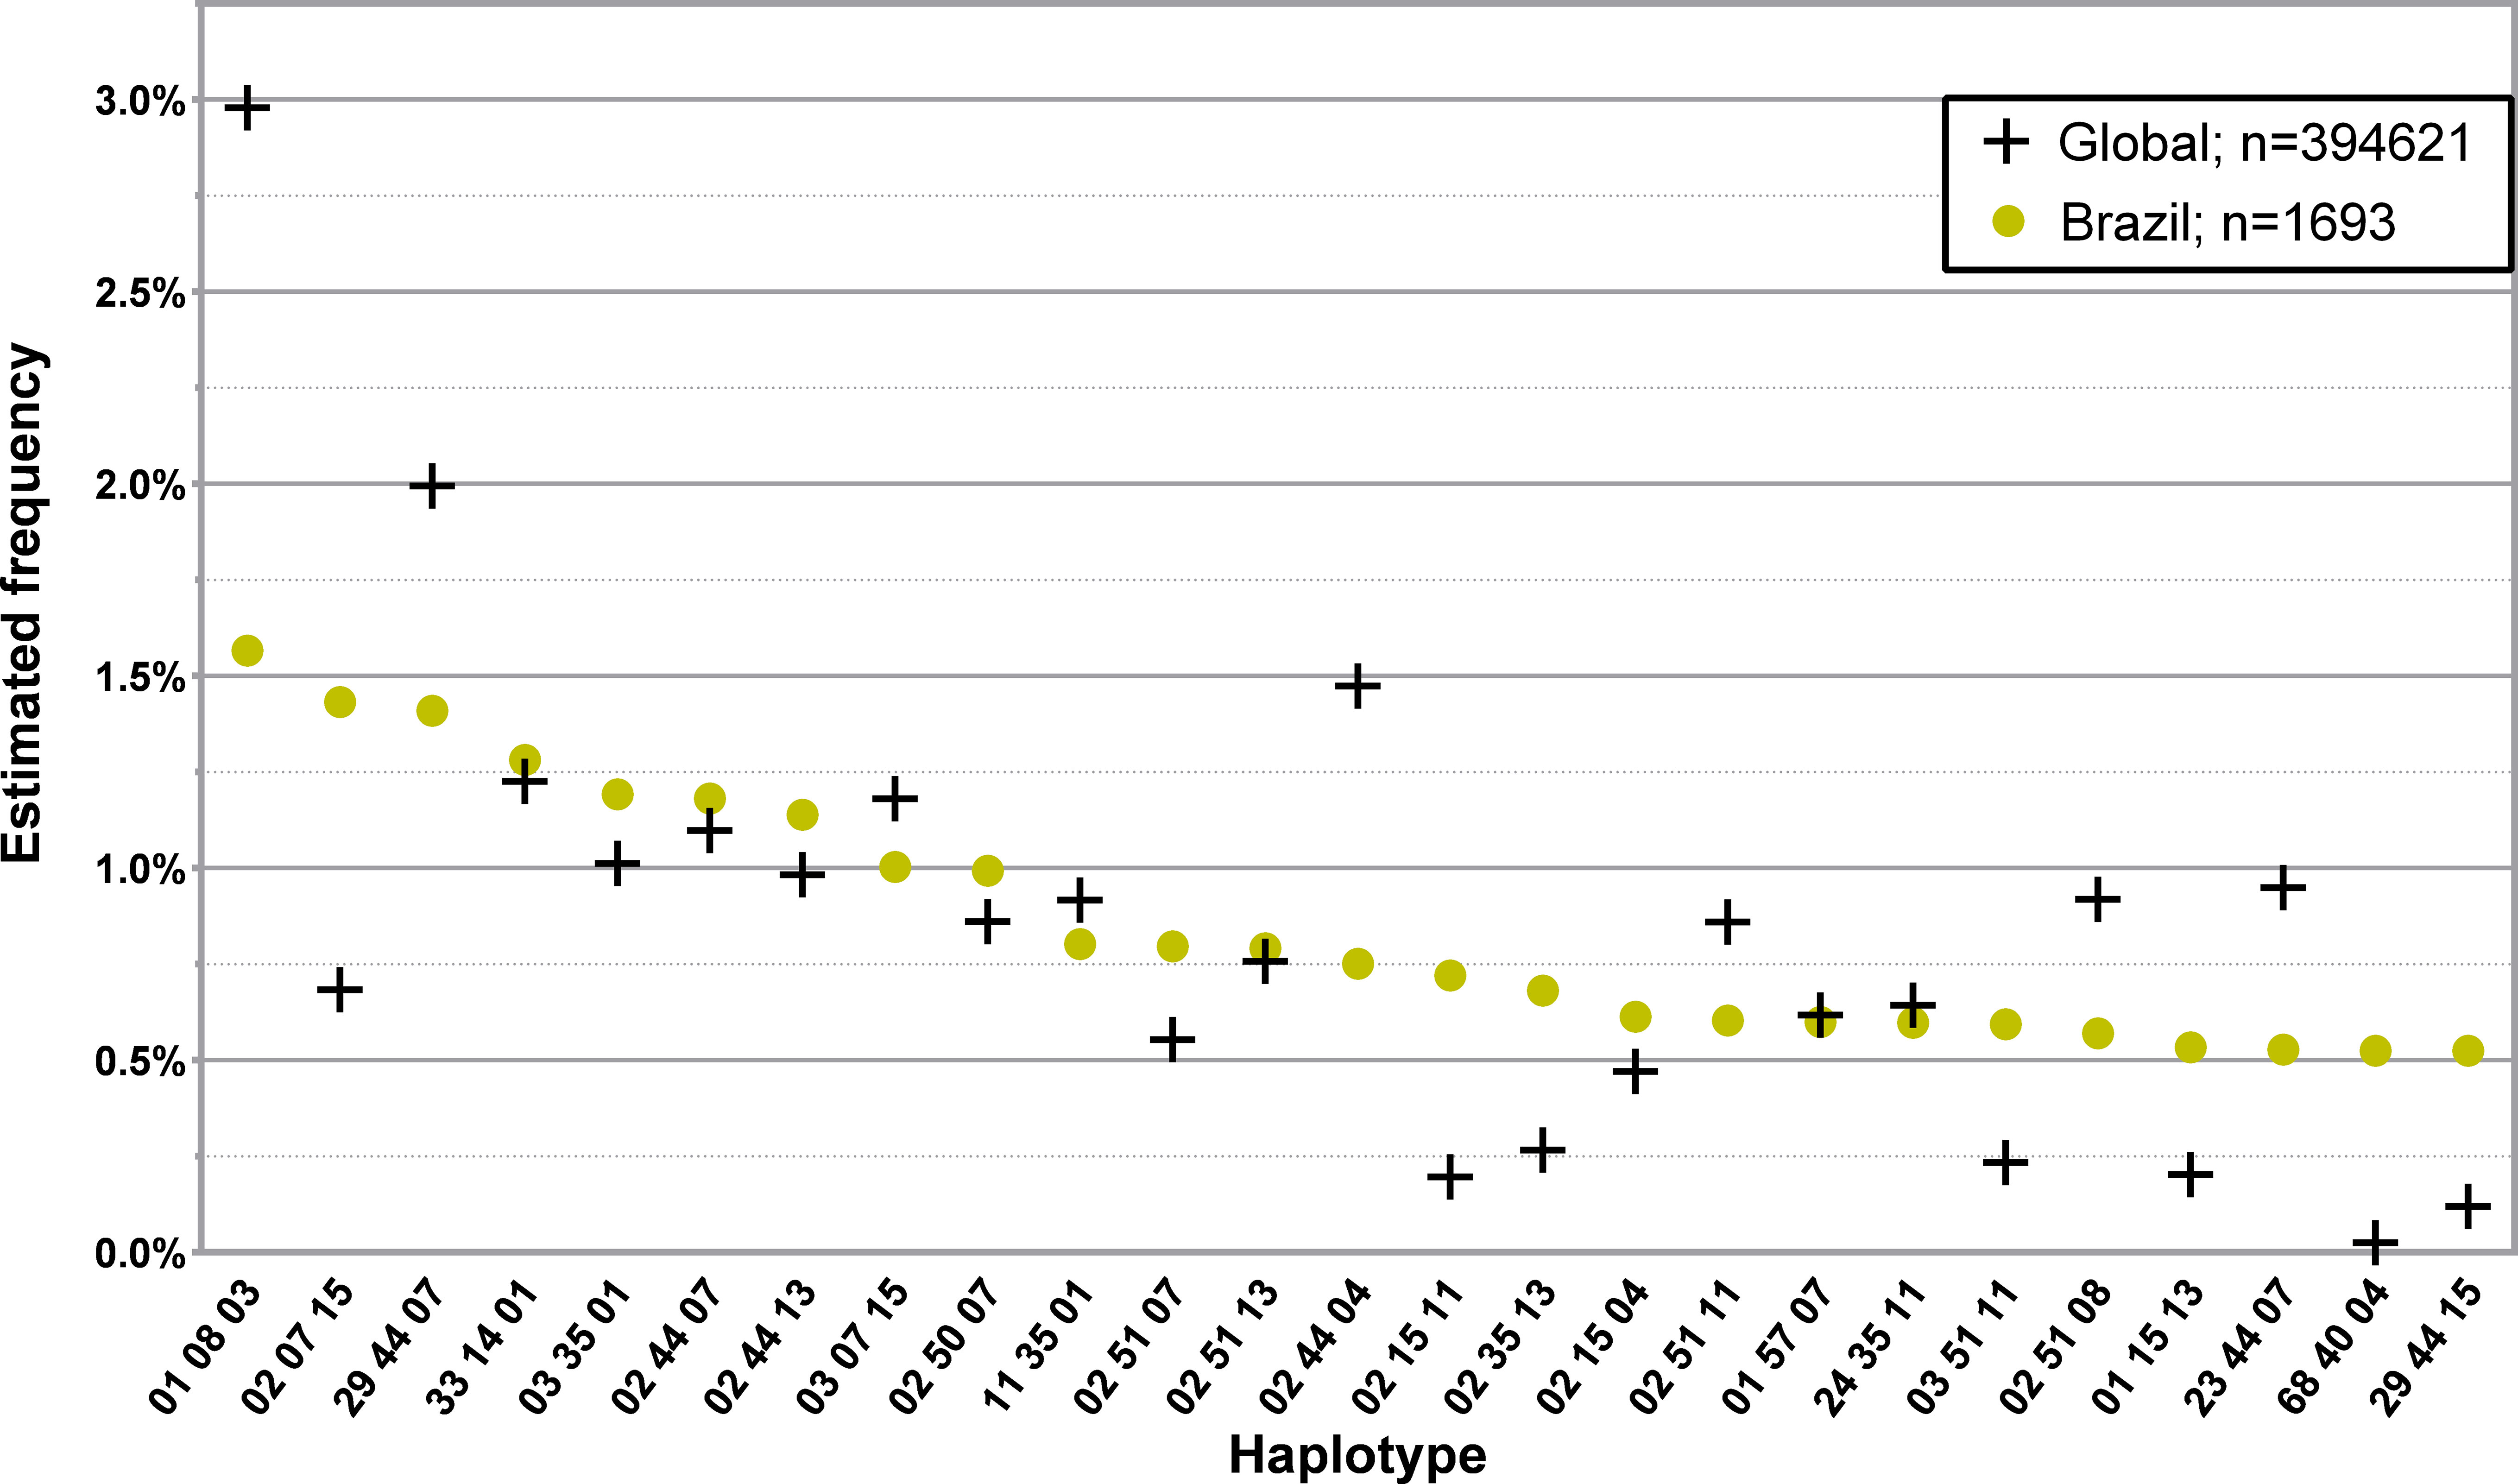
Figure 7 Frequency distribution of the 25 most common three loci, low-resolution HLA-A/-B/-DRB1 in donors from Brazil. Dataset: L3F.
Supplementary Table 15 highlights significant deviations from Hardy-Weinberg equilibrium in L3R, L3D, L4R, and in the analyzed subpopulations of L3NW and L3F.
In L3R, there was no significant deviation from Hardy-Weinberg equilibrium on any of the three loci in Alentejo and Algarve; there was significant deviation from Hardy-Weinberg equilibrium on all three loci in the Metropolitan Area of Lisbon and the Center, only on HLA-A and HLA-B in the North, only on HLA-A in the Autonomous Region of Madeira, and on HLA-B and HLA-DRB1 in the Autonomous Region of Azores. Regarding L3D, there was no significant deviation from Hardy-Weinberg equilibrium on any of the three loci in Viana do Castelo, Vila Real, Bragança, Castelo Branco, Évora, Beja and Faro; there was significant deviation from Hardy-Weinberg equilibrium on all three loci in Leiria, Lisboa and Setúbal, only on HLA-A in Madeira, only on HLA-B in Viseu, Guarda, Coimbra and Portalegre, on HLA-A and HLA-B in Porto, on HLA-A and HLA-DRB1 in Santarém, and on HLA-B and HLA-DRB1 in Braga, Aveiro and Açores.
In L4R, there was no significant deviation from Hardy-Weinberg equilibrium on any of the four loci in Alentejo, Algarve and the Autonomous Region of Madeira; there was significant deviation from Hardy-Weinberg equilibrium on all four loci in the Global analysis of the CEDACE registry and the Metropolitan Area of Lisbon, only on HLA-A and HLA-DRB1 in the Center and the North, and only on HLA-DRB1 in the Autonomous Region of Azores.
Regarding the population of African donors in L3NW, there was significant deviation from Hardy-Weinberg equilibrium on HLA-A and HLA-B. Finally, for the analyzed subpopulations of L3F, no significant deviations from Hardy-Weinberg equilibrium were found for any locus.
This is the first extensive analysis of HLA allele and haplotype frequencies of the CEDACE registry, one of the world’s largest per capita bone marrow donor registries. The general characterization herein presented is functional because it provides data on the composition of the Registry and allows for correlation with the Portuguese resident population. Namely, we demonstrated a predominance of female donors in the Registry, which was more expressive than the gender difference in the country: where the CEDACE registry contained 60.4% female donors, there were 52.6% female residents in the 2011 Census (10). We also showed a smaller relative representation of foreign nationals in the donor registry (1.02%) than the population residing in the country (3.49%) (10), noting the significant contribution of donors from Brazil and the Portuguese-speaking African countries. Although Portuguese census data lack ethnicity and ancestry data, the fact that more than 99% of donors who self-reported their ancestry identified as “Western” suggests a skew in the ethnic composition of the Registry, which, coupled with the knowledge of the gender imbalance and low representation of foreign nationals, provide a first step towards potential optimization of CEDACE, via targeted donor recruitment campaigns. Regarding the absolute and relative distributions of donors according to district and NUTS II Region, the distribution of donors suggests that ease of access to typing laboratories (North in Porto, Center in Coimbra and South in Lisbon) seems to be directly related to the relative contribution of donors to the Registry, with more remote locations consistently contributing fewer donors. Other reasons for this imbalance may be related to increased access to donor drives and better information resource availability in big cities, particularly those with large college communities, allowing for greater recruitment in these areas.
The most frequent three loci, low-resolution haplotype in the CEDACE registry was HLA-A*01~B*08~DRB1*03, which has been found at a frequency above 5% in populations of the British Isles, including populations of individuals of United Kingdom descent in the German Registry (19–21), American Caucasoid populations (22, 23) and Northern European populations, including those in the Polish and German Registries (21, 24, 25). The second most frequent haplotype identified in our Registry was HLA-A*29~B*44~DRB1*07; it has been found with frequencies greater than 2.5% in populations of Spain (21, 26) and the Caribbean (22). The third most commonly identified haplotype was HLA-A*02~B*44~DRB1*04, previously found in frequencies greater than 1.5% in populations of the British Isles (19–21) and Caucasoid populations in the American Registry (22, 23). HLA-A*33~B*14~DRB1*01, more predominant in the Autonomous Region of Madeira, has been previously found with frequencies greater than 2% in Jewish populations in the Israeli Registry, namely with self-declared Kavkazi, Argentinian, Ashkenazi, Polish, American and Russian descent (27), adding to the evidence of Jewish ancestry being prevalent in this region (28). The fifth most common haplotype was HLA-A*03~B*07~DRB1*15, commonly identified in Caucasoid populations of the NMDP registry (22) and northern European minority populations of the DKMS registry (21).
Disregarding a previous unpublished analysis of the CEDACE registry, HLA-A*02~B*44~DRB1*07, which had a frequency of 1.0981% in our Registry, has only been found with a relative frequency above 1% in populations larger than 1000 individuals in the Portuguese minority of the DKMS (21), in blood donors in Wales (19) and in the Jewish population from Lybia in the Israeli Registry (27). HLA-A*03~B*35~DRB1*01, commonly found in Russia, Norway, Germany and Austria (16, 21, 24, 29), was more frequent in continental Portugal than in the Autonomous Regions. HLA-A*02~B*50~DRB1*07, less common in the Algarve (0.4353%) and more common in the Autonomous Region of Madeira (1.2959%) than in the CEDACE registry (0.8603%) is another haplotype more commonly found in Jewish populations of the Israeli Registry, namely from Lybia, Tunisia, United States of America, Argentina and Poland, and the Druze minority (27).
HLA-A*02~B*18~DRB1*11, HLA-A*30~B*18~DRB1*03 and HLA-A*02~B*18~DRB1*03 were all found to have increasing relative frequencies from north to south. The first has previously been described with relative frequency over 1.5% in the Macedonian and Croatian Registries (30, 31), as well as in minorities from Greece, Croatia, Bosnia and Herzegovina and Romania in the DKMS registry (21) and in Kavkazi and Druze populations of the Israeli Registry (27); the second one with relative frequency over 1.5% in large populations in Spain and the Spanish minority of the DKMS (21, 26, 32–34); and the third one has only been described with a frequency above 0.5% in our previous unpublished analysis, in an unpublished analysis of the Spanish Registry (16), as well as small population reports in Mexico and Brazil (35, 36). Of note, HLA-A*02~B*35~DRB1*11, the 24th most common haplotype in the CEDACE registry, more commonly found in the Autonomous Region of Madeira, has only been described with a relative frequency over 1% in populations of Macedonia (30), Mexico (35), Iran (37), Albania (38), Gaza (39), Jordan (40), Israel (27), and a small population study in Guinea Bissau and Cape Verde (41).
Regarding the haplotype frequencies observed in African donors, it is important to note that certain haplotypes have only been described with relevant frequencies in small population studies. HLA-A*23~B*49~DRB1*13, for instance, has only been described with a frequency above 1% in two small studies, appearing in a small sample of Portuguese volunteers (46 individuals) from the North of Portugal (42) and in 62 individuals from the Northwest of Cape Verde (41); it has also been described with significant frequency (0.6190%) in Ethiopian Jews from the Israeli Registry (27). HLA-A*30~B*42~DRB1*03, a haplotype found to be 18 times more frequent in the African donor population of the CEDACE registry, when compared to the whole Registry, has been described with significant frequency in a small study of 202 unrelated blood donors from Mozambique (43), as well as short population reports from Kenya (44), Brazil (45), South Africa (46) and the United Arab Emirates (47) and African American individuals in the NMDP registry (22). HLA-A*33~B*15~DRB1*10, which had a frequency 83.5 times higher in the African donor population, was previously identified with a relative frequency above 0.5% only in populations of Guinea Bissau and Cape Verde (41). The sixth and seventh most frequent haplotypes in this population, HLA-A*69~B*15~DRB1*13 and HLA-A*30~B*08~DRB1*04, with frequencies of 0.8043% and 0.8008% (12.4 and 67.9 times more frequent than in the CEDACE registry) have only been identified with frequencies above 0.2% in the same previously cited study, in populations of Cape Verde (41) and, in the case of HLA-A*30~B*08~DRB1*04, in Mexico (35).
Regarding HLA frequencies of donors from Cape Verde, of the 25 most commonly identified haplotypes, only 9 were previously described in the largest study of Cape Verde nationals, which contained roughly one fifth of the population in our Registry (41). Of note, HLA-A*66~B*53~DRB1*13 and HLA-A*68~B*53~DRB1*10 have never been described in populations with frequencies above 0.5% (16) and were identified in this population with frequencies of 0.9659% and 0.9103%, respectively (120.7 and 90.1 times the respective frequencies in the CEDACE registry). Of the 25 most commonly identified 3 loci, low-resolution HLA haplotypes in the population of donors from Mozambique, only one, HLA-A*29~B*44~DRB1*11, was also reported among the 15 most common haplotypes in the most extensive study of Mozambican natives (43). The most commonly identified haplotype in the population of Angolan donors, HLA-A*30~B*42~DRB1*03, was the most frequently identified haplotype in the previously mentioned study of blood donors from Mozambique (43), as well as the fourth most commonly identified haplotype among self-declared African donors. There is a scarcity of literature regarding HLA haplotype frequencies of Angolan natives; our analysis is, to our knowledge, the first provider of HLA haplotype frequency data in this population.
We presented the most common haplotypes in the Brazilian donor population of the CEDACE registry because it is the largest foreign donor population in our Registry. In general, haplotype frequencies varied when compared to CEDACE, but frequent haplotypes were generally similar. A noteworthy exception is HLA-A*68~B*40~DRB1*04, with a frequency 20.9 times higher in this population than in CEDACE, which has mostly been described in indigenous populations of Mexico (35), as well as Costa Rica, Nicaragua (48), Venezuela (49) and Guatemala (50).
One of the limitations of our study was the widespread significant deviation from Hardy-Weinberg equilibrium observed in most populations. This may induce errors in the Estimation-Maximization algorithm, although is an expected phenomenon, commonly found in large datasets, such as donor registries, which can be attributed, among other causes, to non-random selection and migration (51). One aspect of our analysis that may serve to partially validate the results is that the neighbor-joining trees seem to reasonably recapitulate the geographical distances between Regions and Districts, even though the CEDACE registry is not a random sample of the Portuguese population. Its analysis can therefore not be fully equated to an analysis of Portugal as a whole.
Another critical limitation of our study is the low resolution of the HLA data presented, especially when current guidelines recommend high-resolution typing for patient-donor matching (52, 53). This stemmed from the fact that the vast majority of the donors in the CEDACE registry were typed on intermediate or low-resolution and no extrapolation from the limited number of donors typed in high-resolution was possible – only less than 2000 donors were typed in high-resolution and this typing was biased, since all the high resolution data, at the time of data collection, was obtained through retyping of donors done after activation to match patients. Since 2020-2021 typing for all new donors has been done using next-generation sequencing, including typing at the DPB1 locus, warranting a new analysis and comparison with the low-resolution haplotype frequencies herein presented after sufficient new donors have been typed using this method.
With the information presented in this study, we propose targeting specific groups within Portugal’s borders to optimize the Registry. Namely, targeting under-represented districts (per capita), such as Beja, Bragança, Castelo Branco and Açores, or genetically more distinct from the Registry, such as Madeira, Castelo Branco and, again, Beja, would increase the diversity of the Portuguese donor pool. Considering the significant proportion of foreign residents from Portuguese-speaking African Countries, as well as these countries’ historical, economic, and social ties to Portugal, the fact that there are no bone marrow donor registries in these countries and the diverse HLA haplotypes found in donors from these countries as well as self-declared African donors, it would be advantageous to the Registry and African patients to include more donors from these groups.
The original contributions presented in the study are included in the article/Supplementary Material. Further inquiries can be directed to the corresponding author.
Ethical approval was not required for the study involving humans in accordance with the local legislation and institutional requirements. Written informed consent to participate in this study was not required from the participants or the participants’ legal guardians/next of kin in accordance with the national legislation and the institutional requirements.
EE: Conceptualization, Formal analysis, Funding acquisition, Investigation, Methodology, Project administration, Visualization, Writing – original draft, Writing – review & editing. DL: Conceptualization, Data curation, Project administration, Writing – review & editing. HT: Conceptualization, Project administration, Writing – review & editing. JL: Conceptualization, Project administration, Supervision, Validation, Visualization, Writing – original draft, Writing – review & editing.
The author(s) declare financial support was received for the research, authorship, and/or publication of this article. EE is a PhD candidate at Universidade de Lisboa and this work is submitted in partial fulfillment of the requirement for the PhD, supported by a Grant for medical residents/fellows enrolled in a PhD program from Fundação para a Ciência e Tecnologia, IP (FCT) SFRH/SINTD/135312/2017. This work was also funded by national funds through the FCT, under the project LA/P/0082/2020.
The authors wish to express their gratitude to the CEDACE Donor Centres from Instituto Português do Sangue e Transplantação, IP: Centro de Sangue e da Transplantação de Lisboa, Centro de Sangue e da Transplantação do Porto e Centro de Sangue e da Transplantação de Coimbra, and especially to all the voluntary donors of the Registry.
The authors declare that the research was conducted in the absence of any commercial or financial relationships that could be construed as a potential conflict of interest.
All claims expressed in this article are solely those of the authors and do not necessarily represent those of their affiliated organizations, or those of the publisher, the editors and the reviewers. Any product that may be evaluated in this article, or claim that may be made by its manufacturer, is not guaranteed or endorsed by the publisher.
The Supplementary Material for this article can be found online at: https://www.frontiersin.org/articles/10.3389/fimmu.2023.1286001/full#supplementary-material
1. Sanchez-Mazas A, Fernandez-Vina M, Middleton D, Hollenbach JA, Buhler S, Di D, et al. Immunogenetics as a tool in anthropological studies. Immunology. (2011) 133(2):143–64. doi: 10.1111/j.1365-2567.2011.03438.x
2. Fernandez Vina MA, Hollenbach JA, Lyke KE, Sztein MB, Maiers M, Klitz W, et al. Tracking human migrations by the analysis of the distribution of HLA alleles, lineages and haplotypes in closed and open populations. Philos Trans R Soc Lond B Biol Sci (2012) 367(1590):820–9. doi: 10.1098/rstb.2011.0320
3. Askar M, Daghstani J, Thomas D, Leahy N, Dunn P, Claas F, et al. 16(th) IHIW: global distribution of extended HLA haplotypes. Int J Immunogenet (2013) 40(1):31–8. doi: 10.1111/iji.12029
4. Tiercy JM, Claas F. Impact of HLA diversity on donor selection in organ and stem cell transplantation. Hum Hered (2013) 76(3-4):178–86. doi: 10.1159/000358798
5. Robinson J, Barker DJ, Georgiou X, Cooper MA, Flicek P, Marsh SGE. IPD-IMGT/HLA database. Nucleic Acids Res (2020) 48(D1):D948–D55.
6. Arrieta-Bolanos E, Hernandez-Zaragoza DI, Barquera R. An HLA map of the world: A comparison of HLA frequencies in 200 worldwide populations reveals diverse patterns for class I and class II. Front Genet (2023) 14:866407. doi: 10.3389/fgene.2023.866407
7. Cedace. Available at: https://www.ipst.pt/index.php/pt/cidadao/cedace-inicio.
8. Total Number of Donors and Cord blood units: WMDA. Available at: https://statistics.wmda.info/.
9. Population, total The World Bank. Available at: https://data.worldbank.org/indicator/SP.POP.TOTL.
10. Instituto Nacional de Estatística IP. Censos 2011 resultados definitivos - Portugal. Lisboa, Portugal: Instituto Nacional de Estatística IP (2012).
11. d-maps.com. Portugal - República Portuguesa - boundaries, regions (white) 2007-2019. Available at: https://d-maps.com/carte.php?num_car=2505&lang=en.
12. d-maps.com. Portugal - República Portuguesa - boundaries, districts (white) 2007-2019. Available at: https://d-maps.com/carte.php?num_car=5785&lang=en.
13. Nunes E, Heslop H, Fernandez-Vina M, Taves C, Wagenknecht DR, Eisenbrey AB, et al. Definitions of histocompatibility typing terms. Blood. (2011) 118(23):e180–3. doi: 10.1182/blood-2011-05-353490
14. Glaubitz JC. convert: A user-friendly program to reformat diploid genotypic data for commonly used population genetic software packages. Mol Ecol Notes. (2004) 4(2):309–10. doi: 10.1111/j.1471-8286.2004.00597.x
15. Excoffier L, Lischer HE. Arlequin suite ver 3.5: a new series of programs to perform population genetics analyses under Linux and Windows. Mol Ecol Resour (2010) 10(3):564–7.
16. Gonzalez-Galarza FF, McCabe A, Santos E, Jones J, Takeshita L, Ortega-Rivera ND, et al. Allele frequency net database (AFND) 2020 update: gold-standard data classification, open access genotype data and new query tools. Nucleic Acids Res (2020) 48(D1):D783–d8. doi: 10.1093/nar/gkz1029
17. Kumar S, Stecher G, Tamura K. MEGA7: molecular evolutionary genetics analysis version 7.0 for bigger datasets. Mol Biol Evol (2016) 33(7):1870–4. doi: 10.1093/molbev/msw054
18. Saitou N, Nei M. The neighbor-joining method: a new method for reconstructing phylogenetic trees. Mol Biol Evol (1987) 4(4):406–25.
19. Darke C, Guttridge MG, Thompson J, McNamara S, Street J, Thomas M. HLA class I (A, B) and II (DR, DQ) gene and haplotype frequencies in blood donors from Wales. Exp Clin Immunogenet (1998) 15(2):69–83. doi: 10.1159/000019057
20. Williams F, Meenagh A, Single R, McNally M, Kelly P, Nelson MP, et al. High resolution HLA-DRB1 identification of a Caucasian population. Hum Immunol (2004) 65(1):66–77. doi: 10.1016/j.humimm.2003.10.004
21. Pingel J, Solloch UV, Hofmann JA, Lange V, Ehninger G, Schmidt AH. High-resolution HLA haplotype frequencies of stem cell donors in Germany with foreign parentage: how can they be used to improve unrelated donor searches? Hum Immunol (2013) 74(3):330–40. doi: 10.1016/j.humimm.2012.10.029
22. Gragert L, Madbouly A, Freeman J, Maiers M. Six-locus high resolution HLA haplotype frequencies derived from mixed-resolution DNA typing for the entire US donor registry. Hum Immunol (2013) 74(10):1313–20. doi: 10.1016/j.humimm.2013.06.025
23. Kollman C, Maiers M, Gragert L, Müller C, Setterholm M, Oudshoorn M, et al. Estimation of HLA-A, -B, -DRB1 haplotype frequencies using mixed resolution data from a National Registry with selective retyping of volunteers. Hum Immunol (2007) 68(12):950–8. doi: 10.1016/j.humimm.2007.10.009
24. Schmidt AH, Baier D, Solloch UV, Stahr A, Cereb N, Wassmuth R, et al. Estimation of high-resolution HLA-A, -B, -C, -DRB1 allele and haplotype frequencies based on 8862 German stem cell donors and implications for strategic donor registry planning. Hum Immunol (2009) 70(11):895–902. doi: 10.1016/j.humimm.2009.08.006
25. Schmidt AH, Solloch UV, Pingel J, Baier D, Böhme I, Dubicka K, et al. High-resolution human leukocyte antigen allele and haplotype frequencies of the Polish population based on 20,653 stem cell donors. Hum Immunol (2011) 72(7):558–65. doi: 10.1016/j.humimm.2011.03.010
26. Enrich E, Campos E, Martorell L, Herrero MJ, Vidal F, Querol S, et al. HLA-A, -B, -C, -DRB1, and -DQB1 allele and haplotype frequencies: An analysis of umbilical cord blood units at the Barcelona Cord Blood Bank. HLA (2019) 94(4):347–59. doi: 10.1111/tan.13644
27. Manor S, Halagan M, Shriki N, Yaniv I, Zisser B, Maiers M, et al. High-resolution HLA A∼B∼DRB1 haplotype frequencies from the Ezer Mizion Bone Marrow Donor Registry in Israel. Hum Immunol (2016) 77(12):1114–9. doi: 10.1016/j.humimm.2016.09.004
28. Nogueiro I, Teixeira JC, Amorim A, Gusmao L, Alvarez L. Portuguese crypto-Jews: the genetic heritage of a complex history. Front Genet (2015) 6:12. doi: 10.3389/fgene.2015.00012
29. Nerstheimer S, Tauscher P, Petek E, Schappacher-Tilp G. HLA-frequencies of Austrian umbilical cord blood samples. Hum Immunol (2015) 76(11):863–7. doi: 10.1016/j.humimm.2015.09.049
30. Kirijas M, Genadieva Stavrik S, Trajkov D, Hristomanova Mitkovska S, Senev A, Efinska Mladenovska O, et al. HLA profile of the donors in the Macedonian Bone Marrow Donor Registry. Int J Immunogenet (2018) 45(6):337–46. doi: 10.1111/iji.12400
31. Grubic Z, Burek Kamenaric M, Mikulic M, Stingl Jankovic K, Maskalan M, Zunec R. HLA-A, HLA-B and HLA-DRB1 allele and haplotype diversity among volunteer bone marrow donors from Croatia. Int J Immunogenet (2014) 41(3):211–21. doi: 10.1111/iji.12117
32. Martinez-Laso J, Ramirez-Puga A, Rivas-Garcia E, Fernandez-Tagarro E, Auyanet-Saavedra I, Guerra-Rodriguez R, et al. North African-Mediterranean HLA genetic contribution in a population of the kidney transplant waiting list patients of Canary origin (Gran Canaria). HLA (2018) 92(1):12–23. doi: 10.1111/tan.13298
33. Muro M, Marin L, Torio A, Moya-Quiles MR, Minguela A, Rosique-Roman J, et al. HLA polymorphism in the Murcia population (Spain): in the cradle of the archaeologic Iberians. Hum Immunol (2001) 62(9):910–21. doi: 10.1016/S0198-8859(01)00290-7
34. Campillo JA, Martinez-Escribano JA, Muro M, Moya-Quiles R, Marin LA, Montes-Ares O, et al. HLA class I and class II frequencies in patients with cutaneous Malignant melanoma from southeastern Spain: the role of HLA-C in disease prognosis. Immunogenetics (2006) 57(12):926–33. doi: 10.1007/s00251-005-0065-2
35. Barquera R, Hernandez-Zaragoza DI, Bravo-Acevedo A, Arrieta-Bolanos E, Clayton S, Acuna-Alonzo V, et al. The immunogenetic diversity of the HLA system in Mexico correlates with underlying population genetic structure. Hum Immunol (2020) 81(9):461–74. doi: 10.1016/j.humimm.2020.06.008
36. Castillo Lima Vendramini E, de Lima Neto QA, Guimaraes Reis P, Moliterno RA, de Souza VH, Sell AM, et al. HLA-A, -B, -DRB1, -DQA1, and -DQB1 genotyping of 641 individuals from southern Brazil. Hum Immunol (2020) 81(1):8–9. doi: 10.1016/j.humimm.2019.12.001
37. Amirzargar A, Rey D, Muñiz E, Palacio-Grüber J, Nikbin B, Nicknam H, et al. Kurds HLA genes: its implications in transplantation and pharmacogenomics. Open Med J (2015) 2(1):43–7. doi: 10.2174/1874220301401010043
38. Sulcebe G, Shyti E. HLA-A -B. -C, -DRB1 and -DQB1 allele and haplotype frequencies in a population of 432 healthy unrelated individuals from Albania. Hum Immunol (2016) 77(8):620–1. doi: 10.1016/j.humimm.2016.06.001
39. Orford G, Jones J, Corbett S, Kishawi A, Hammad A, Middleton D. Next generation HLA typing and haplotypes by descent in Gaza individuals. Hum Immunol (2020) 81(1):1–2. doi: 10.1016/j.humimm.2019.11.001
40. Elbjeirami WM, Abdel-Rahman F, Hussein AA. Probability of finding an HLA-matched donor in immediate and extended families: the Jordanian experience. Biol Blood Marrow Transplant (2013) 19(2):221–6. doi: 10.1016/j.bbmt.2012.09.009
41. Spinola H, Bruges-Armas J, Middleton D, Brehm A. HLA polymorphisms in Cabo Verde and Guine-Bissau inferred from sequence-based typing. Hum Immunol (2005) 66(10):1082–92. doi: 10.1016/j.humimm.2005.09.001
42. Spinola H, Brehm A, Williams F, Jesus J, Middleton D. Distribution of HLA alleles in Portugal and Cabo Verde. Relationships with the slave trade route. Ann Hum Genet (2002) 66(4):285–96.
43. Assane AA, Fabricio-Silva GM, Cardoso-Oliveira J, Mabunda NE, Sousa AM, Jani IV, et al. Human leukocyte antigen-A, -B, and -DRB1 allele and haplotype frequencies in the Mozambican population: a blood donor-based population study. Hum Immunol (2010) 71(10):1027–32. doi: 10.1016/j.humimm.2010.06.017
44. Arlehamn CS, Copin R, Leary S, Mack SJ, Phillips E, Mallal S, et al. Sequence-based HLA-A, B, C, DP, DQ, and DR typing of 100 Luo infants from the Boro area of Nyanza Province, Kenya. Hum Immunol (2017) 78(4):325–6. doi: 10.1016/j.humimm.2017.03.007
45. Nunes K, Piovezan B, Torres MA, Pontes GN, Kimura L, Carnavalli JE, et al. Population variation of HLA genes in rural communities in Brazil, the Quilombos from the Vale do Ribeira, Sao Paulo - Brazil. Hum Immunol (2016) 77(6):447–8. doi: 10.1016/j.humimm.2016.04.007
46. Loubser S, Paximadis M, Gentle NL, Puren A, Tiemessen CT. Human leukocyte antigen class I (A, B, C) and class II (DPB1, DQB1, DRB1) allele and haplotype variation in Black South African individuals. Hum Immunol (2020) 81(1):6–7. doi: 10.1016/j.humimm.2019.12.003
47. Arnaiz-Villena A, Yafei ZA, Juarez I, Palacio-Gruber J, Mahri AA, Alvares M, et al. HLA genetic study from United Arab Emirates (UAE), Abu Dhabi. Hum Immunol (2019) 80(7):421–2. doi: 10.1016/j.humimm.2019.04.013
48. Arrieta-Bolanos E, Madrigal-Sanchez JJ, Stein JE, Orlich-Perez P, Moreira-Espinoza MJ, Paredes-Carias E, et al. High-resolution HLA allele and haplotype frequencies in majority and minority populations of Costa Rica and Nicaragua: Differential admixture proportions in neighboring countries. HLA (2018) 91(6):514–29. doi: 10.1111/tan.13280
49. Layrisse Z, Guedez Y, Dominguez E, Paz N, Montagnani S, Matos M, et al. Extended HLA haplotypes in a Carib AmerIndian population: the Yucpa of the Perija Range. Hum Immunol (2001) 62(9):992–1000. doi: 10.1016/S0198-8859(01)00297-X
50. Escobar-Castro K, Hernandez-Zaragoza DI, Santizo A, Del Toro-Arreola S, Hernandez E, Toledo SM. HLA molecular study of patients in a public kidney transplant program in Guatemala. Hum Immunol (2022) 83(11):741–8. doi: 10.1016/j.humimm.2022.08.003
52. Dehn J, Spellman S, Hurley CK, Shaw BE, Barker JN, Burns LJ, et al. Selection of unrelated donors and cord blood units for hematopoietic cell transplantation: guidelines from the NMDP/CIBMTR. Blood (2019) 134(12):924–34. doi: 10.1182/blood.2019001212
Keywords: CEDACE, HLA, haplotype frequencies, Portugal, Portuguese-speaking African countries
Citation: Espada E, Ligeiro D, Trindade H and Lacerda JF (2023) HLA frequency distribution of the Portuguese bone marrow donor registry. Front. Immunol. 14:1286001. doi: 10.3389/fimmu.2023.1286001
Received: 30 August 2023; Accepted: 22 November 2023;
Published: 12 December 2023.
Edited by:
Manuel Muro, Virgen de la Arrixaca University Hospital, SpainReviewed by:
Martin Maiers, National Marrow Donor Program, United StatesCopyright © 2023 Espada, Ligeiro, Trindade and Lacerda. This is an open-access article distributed under the terms of the Creative Commons Attribution License (CC BY). The use, distribution or reproduction in other forums is permitted, provided the original author(s) and the copyright owner(s) are credited and that the original publication in this journal is cited, in accordance with accepted academic practice. No use, distribution or reproduction is permitted which does not comply with these terms.
*Correspondence: Eduardo Espada, ZXNwYWRhLmVkdWFyZG9AZ21haWwuY29t
Disclaimer: All claims expressed in this article are solely those of the authors and do not necessarily represent those of their affiliated organizations, or those of the publisher, the editors and the reviewers. Any product that may be evaluated in this article or claim that may be made by its manufacturer is not guaranteed or endorsed by the publisher.
Research integrity at Frontiers
Learn more about the work of our research integrity team to safeguard the quality of each article we publish.