
95% of researchers rate our articles as excellent or good
Learn more about the work of our research integrity team to safeguard the quality of each article we publish.
Find out more
METHODS article
Front. Immunol. , 20 September 2023
Sec. Systems Immunology
Volume 14 - 2023 | https://doi.org/10.3389/fimmu.2023.1212981
This article is part of the Research Topic Artificial intelligence in predicting, determining and controlling cell phenotype or tissue function in inflammatory diseases View all 18 articles
 Pablo Coto-Segura1†
 Cristina Segú-Vergés2,3†
 Antonio Martorell4*‡
 David Moreno-Ramírez5
 Guillem Jorba2,3
 Valentin Junet2,6
 Filippo Guerri2,6
 Xavier Daura6,7,8
 Baldomero Oliva3Carlos Cara9Olaya Suárez-Magdalena9Sonya Abraham10,11José Manuel Mas2
Background: Psoriasis is a chronic immune-mediated inflammatory systemic disease with skin manifestations characterized by erythematous, scaly, itchy and/or painful plaques resulting from hyperproliferation of keratinocytes. Certolizumab pegol [CZP], a PEGylated antigen binding fragment of a humanized monoclonal antibody against TNF-alpha, is approved for the treatment of moderate-to-severe plaque psoriasis. Patients with psoriasis present clinical and molecular variability, affecting response to treatment. Herein, we utilized an in silico approach to model the effects of CZP in a virtual population (vPop) with moderate-to-severe psoriasis. Our proof-of-concept study aims to assess the performance of our model in generating a vPop and defining CZP response variability based on patient profiles.
Methods: We built a quantitative systems pharmacology (QSP) model of a clinical trial-like vPop with moderate-to-severe psoriasis treated with two dosing schemes of CZP (200 mg and 400 mg, both every two weeks for 16 weeks, starting with a loading dose of CZP 400 mg at weeks 0, 2, and 4). We applied different modelling approaches: (i) an algorithm to generate vPop according to reference population values and comorbidity frequencies in real-world populations; (ii) physiologically based pharmacokinetic (PBPK) models of CZP dosing schemes in each virtual patient; and (iii) systems biology-based models of the mechanism of action (MoA) of the drug.
Results: The combination of our different modelling approaches yielded a vPop distribution and a PBPK model that aligned with existing literature. Our systems biology and QSP models reproduced known biological and clinical activity, presenting outcomes correlating with clinical efficacy measures. We identified distinct clusters of virtual patients based on their psoriasis-related protein predicted activity when treated with CZP, which could help unravel differences in drug efficacy in diverse subpopulations. Moreover, our models revealed clusters of MoA solutions irrespective of the dosing regimen employed.
Conclusion: Our study provided patient specific QSP models that reproduced clinical and molecular efficacy features, supporting the use of computational methods as modelling strategy to explore drug response variability. This might shed light on the differences in drug efficacy in diverse subpopulations, especially useful in complex diseases such as psoriasis, through the generation of mechanistically based hypotheses.
Psoriasis is a chronic immune-mediated inflammatory systemic disease with skin manifestations typically characterized by erythematous, scaly, itchy and/or painful plaques. The physiopathology of psoriasis is marked by a complex molecular interplay involving dysregulated cytokines, immune cell activation, and altered keratinocyte proliferation, contributing to the development and persistence of the disease (1, 2). Psoriasis affects 1-4% of the population worldwide (3–5). Patients with psoriasis generally present a significantly reduced health-related quality of life and a high burden of disease (6–10). Psoriasis is often linked to comorbidities, especially in its moderate-to-severe forms. These can include psoriatic arthritis, cardiometabolic diseases, metabolic syndrome, obesity, and depression (5, 11–13), highlighting the systemic nature of the disease and the importance of multidisciplinary care. The molecular mechanisms underlying the relationship between psoriasis and its comorbidities are not fully elucidated, underscoring the need for additional research to unravel the interplay between these conditions at a molecular level (14). This could affect treatment efficacy, urging the need to address psoriasis’ treatment in personalized clinical setting (15, 16). Current treatment for moderate-to-severe psoriasis includes phototherapy, oral systemic immunomodulatory drugs (methotrexate, apremilast, acitretin, and cyclosporine), and biologic agents (17, 18). The latter are monoclonal antibodies often administered subcutaneously that inhibit different cytokines, including tumor necrosis factor (TNF), interleukin (IL)-12/23, IL-17s, and IL-23.
Certolizumab pegol [CZP] is a PEGylated antigen binding fragment (Fab’) of a humanized monoclonal antibody against TNF-alpha. CZP is currently approved for the treatment of moderate-to-severe psoriasis, psoriatic arthritis, axial spondylarthritis, rheumatoid arthritis, and Crohn’s disease (Crohn’s disease is only approved by the FDA) (19–21). CZP has shown a rapid and sustained reduction of psoriasis activity and improvement in patients’ quality of life in pivotal studies CIMPASI-1, CIMPASI-2 and CIMPACT (22–25), with a favorable safety profile (26–28). Due to its molecular structure without constant fragment (Fc-free), CZP has no to minimal transfer from mother to infant across the placenta and to breast milk, and is the only biologic agent with pharmacokinetic clinical data in its label supporting potential use in both pregnancy and breastfeeding for chronic inflammatory diseases (29–31). The conjugation of the Fab’ fragment to two molecules of polyethylene glycol (PEG) has been associated to increased half-life and reduced antigenicity, immunogenicity, and toxicity (32). It has also been linked to enhanced selectivity for inflamed tissue compared to non-inflamed tissue. CZP has shown more rapid tissue penetration, higher levels, and greater persistence in inflamed tissue when compared to adalimumab and infliximab (33, 34).
In Europe, the approved CZP dosing schedule for the treatment of plaque psoriasis consists of a loading dose of CZP 400 mg (given as 2 subcutaneous injections of 200 mg each) at Weeks 0, 2 and 4, and a maintenance dose of CZP 200 mg Q2W. In patients with insufficient response, a dose of 400 mg Q2W can be considered (21). In the United States, the FDA approved CZP dosing schedule consists of 400 mg Q2W (given as 2 subcutaneous injections of 200 mg each). For some patients (with body weight ≤90 kg), a dose of 400 mg initially and at Weeks 2 and 4, followed by 200 mg every other week may be considered (20). From analysis of the baseline characteristics of patients included in CIMPASI-1, CIMPASI-2 and CIMPACT, it is not possible to identify which patients would most benefit from the CZP 400 mg Q2W dose. However, for almost all measures, CZP 400 mg Q2W demonstrates numerically superior efficacy results compared to CZP 200 mg Q2W. Interpatient variability in treatment response poses challenges in managing psoriasis. Molecular heterogenicity significantly contributes to this variability, highlighting the necessity of a better understanding of the molecular factors that underlie such differences (35, 36).
Modelling and computational techniques are increasingly being used in biomedical investigation. These approaches offer valuable tools for investigating complex issues that are challenging to test in live organisms, as well as for generating mechanistic hypotheses to elucidate clinical observations. The insights gained through modeling can then be further validated and contrasted with in vitro or in vivo experimental results, enhancing our understanding of biological processes, and facilitating advancements in medical science. They can also address methodological challenges, bridging the gap between randomized clinical trials (RCTs) and observational studies (37, 38). In fact, the US and European medicines agencies have endorsed in silico strategies as valuable complementary tools for defining randomized clinical trials (RCTs), enhancing study design, and even circumventing certain studies in specific situations, such as drug repositioning (39). In this regard, over the past few decades, substantial progress has been made in collaboration with the pharmaceutical industry to develop good practice guidelines and recommendations for various computational approaches, including pharmacometrics models (e.g., for pharmacometrics models) (40, 41). However, the absence of established guidelines for modelling approaches in other disciplines, such as systems medicine, remains a notable gap (42). Nonetheless, there is a widespread consensus on the essential principles governing these approaches. For instance, the Good Practices in Model-Informed Drug Discovery and Development (MID3) describes the “quantitative framework for prediction and extrapolation, centered on knowledge and inference generated from integrated models of compound, mechanism, and disease level data and aimed at improving the quality, efficiency, and cost-effectiveness of decision making” (43). These guidelines also classify the evidence extracted from the modelling approaches in three categories based on their purposes and their impact for industry decision-making (44) or for regulatory assessment (45): “LOW” impact, when the evidence generated does not allow to make clinical or commercial decisions; “MEDIUM” impact, when the obtained data could be useful in strategic conditioning of future trial or experimental design; and “HIGH” impact, when conclusions obtained from modelling directly support decision-making without the need for additional experimental or trial studies (43).
We recently described a computational method, according to the above-mentioned guidelines, that combined different modelling approaches (virtual population [vPop] randomization through population deconvolution, physiologically based pharmacokinetic [PBPK] modelling, and systems biology [SB] modelling) to build quantitative systems pharmacology (QSP) models and simulate the mechanism of action (MoA) of a drug in a virtual patient population (46). Herein, our objective is to assess the potential of this approach in offering molecular insights into the drug’s MoA, thereby establishing mechanistic profiles through the evaluation of patient-specific archetypes. To investigate the method’s ability to explore response variability beyond a mere dose effect, we utilized psoriasis as a representative example of a complex and heterogeneous disease, along with the evaluation of two approved CZP dosing schemes. Thus, we modified and adapted this methodology to simulate the two officially approved CZP dosing regimens within a virtual population (vPop) with moderate-to-severe psoriasis. Our aim was to assess the method’s capability to accurately replicate non-standard demographic distributions (i.e., increasing body mass index [BMI]), and effectively model a non-small molecule compound at both the physiologically-based pharmacokinetic (PBPK) and quantitative systems pharmacology (QSP) levels. Subsequently, we conducted an extensive evaluation of the models using biological and clinical data, and employed clustering analyses to investigate the molecular variability captured by the models.
Combining several modelling approaches, we followed sequential stages to generate the QSP model set and to create the virtual patient population based on a RCT population (Figure 1). In the design phase, we compiled information and defined the population (condition and patient population characterization and sample size calculation) and intervention (drug characterization) details. In the modelling phase, we embedded a series of vPop, PBPK, and SB-based models (Therapeutic Performance Mapping System [TPMS]) to create QSP models. We exploited clinical efficacy information on drugs used in moderate-to-severe psoriasis, along with known molecular information on psoriasis severity, as prior information to generate the models. Finally, we performed SB-based analyses and examined the molecular variability among the virtual patients’ models by applying a comprehensive and robust clustering approach.
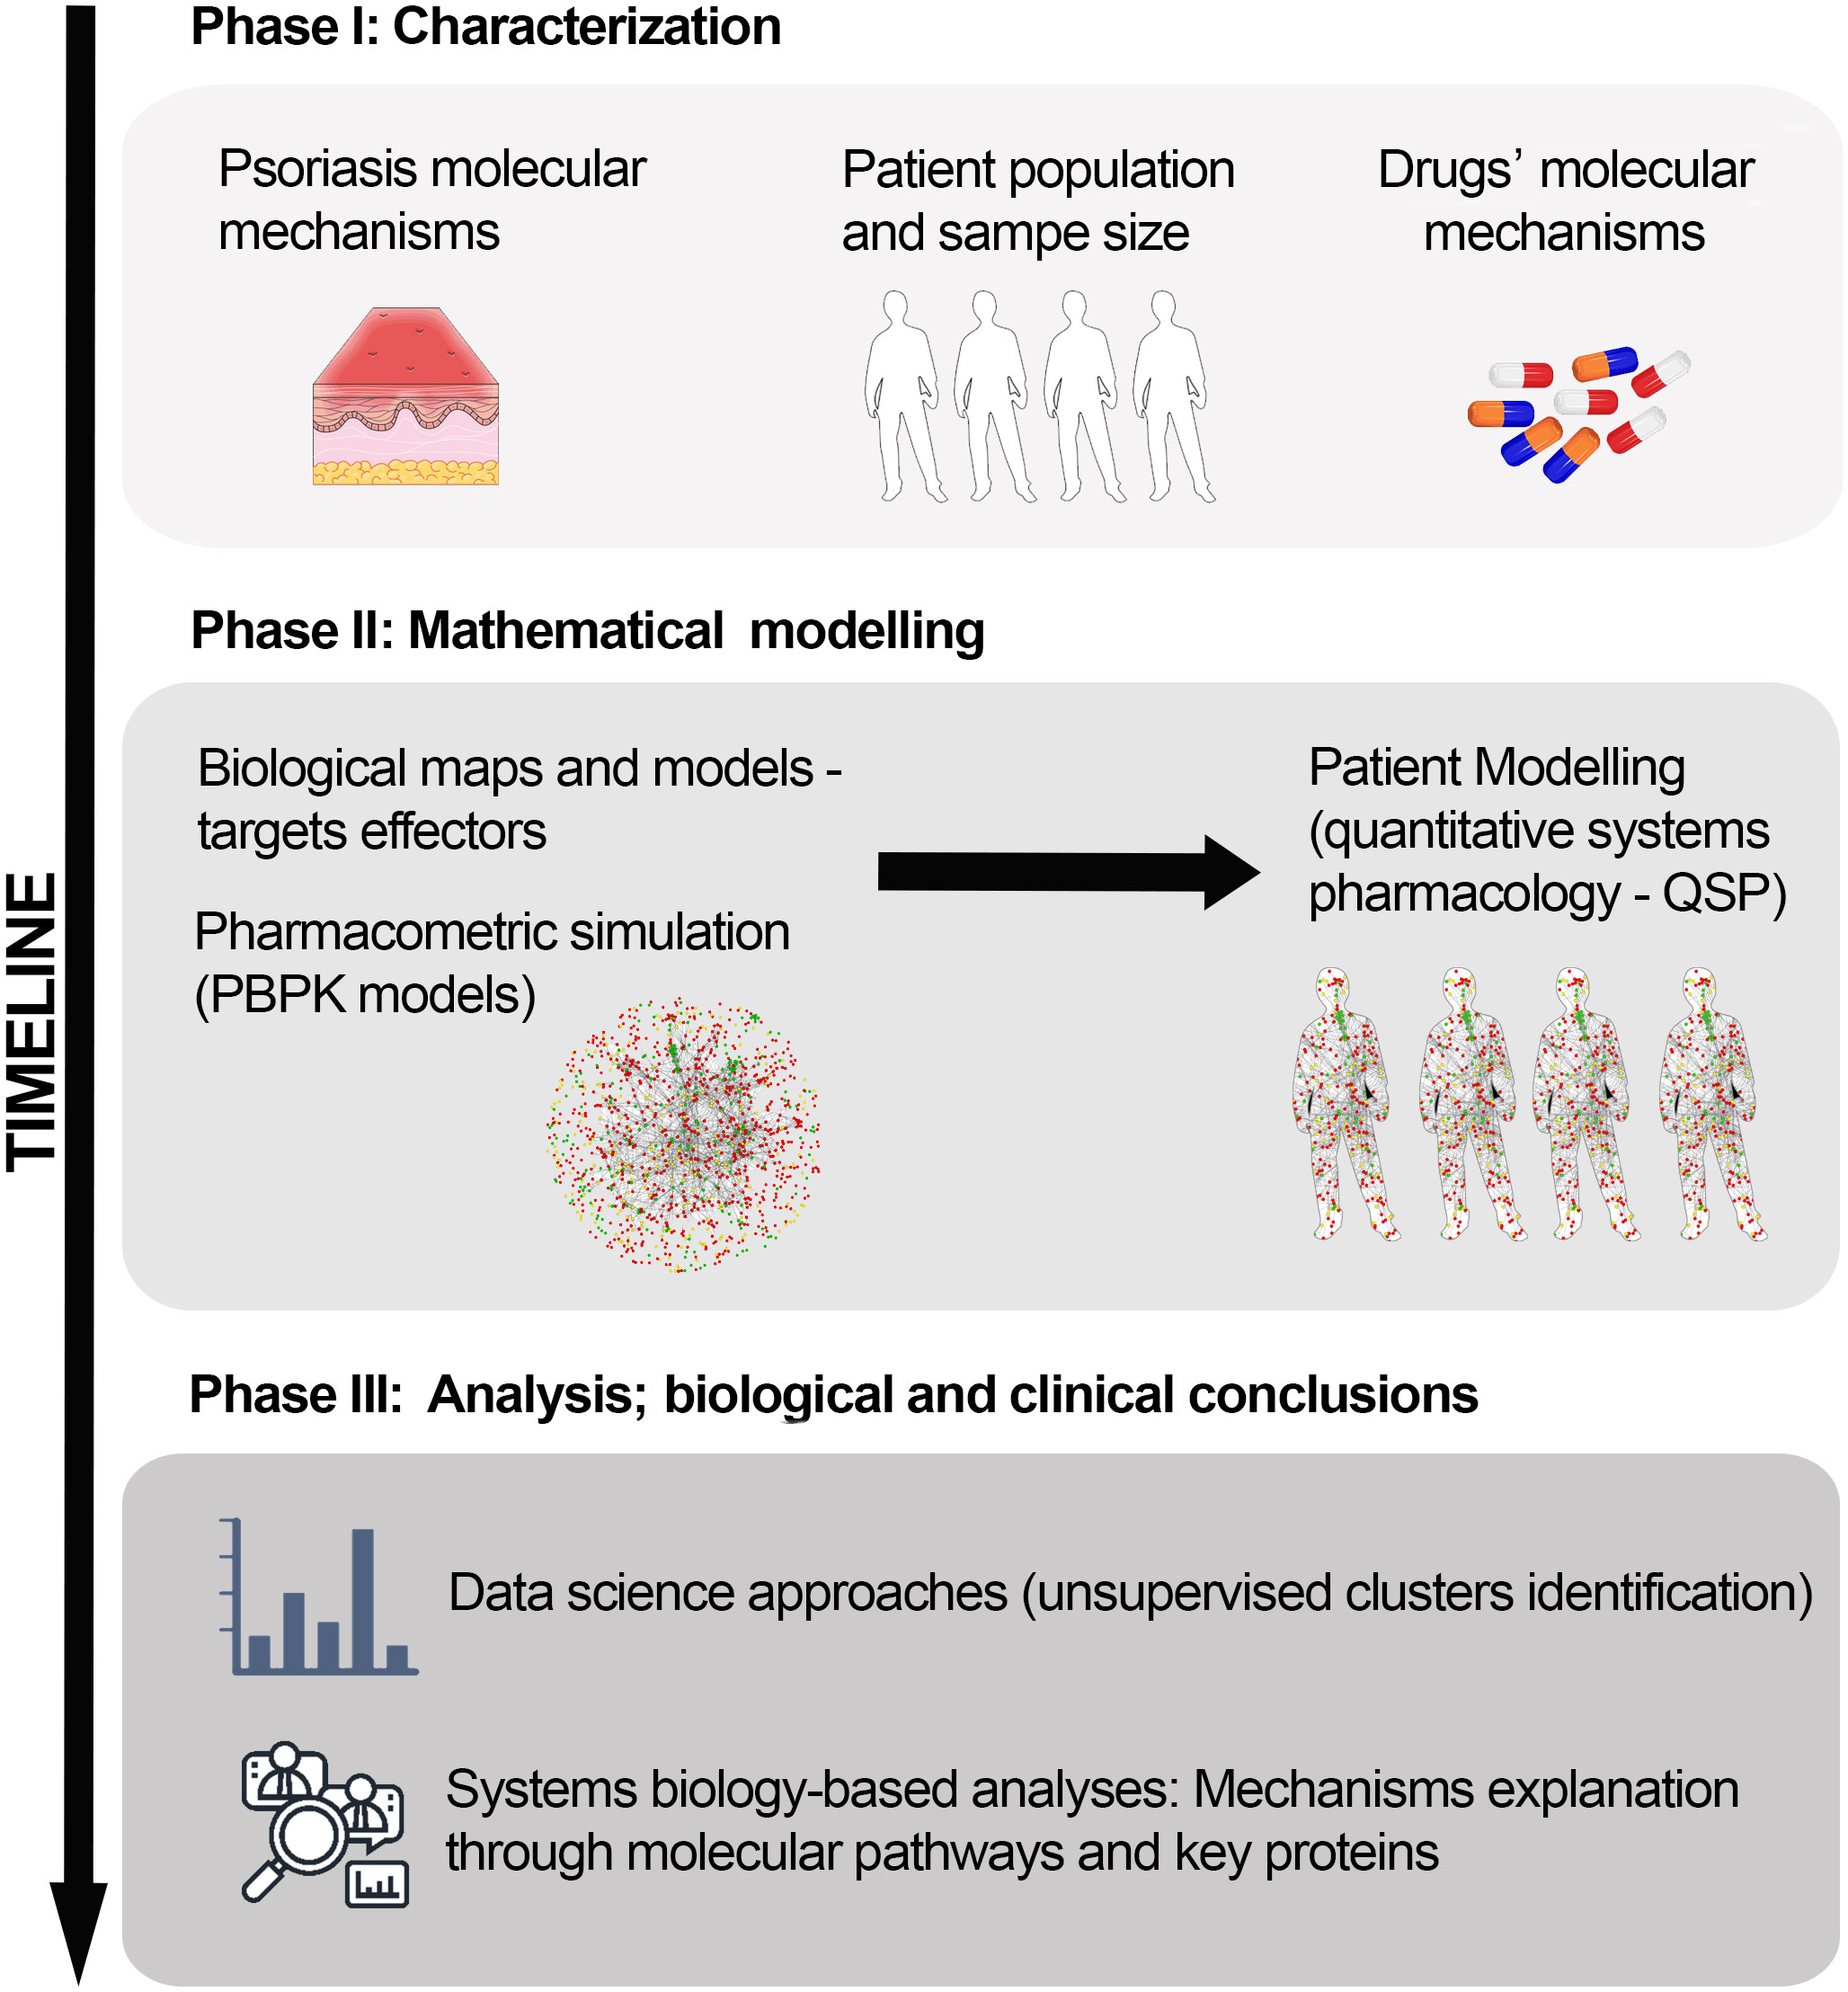
Figure 1 In silico clinical trial protocol overview. The protocol was divided into three main stages: Phase I, study design and information compilation; Phase II, mathematical modelling; and Phase III, data analysis to obtain molecular insights on the drug’s mechanisms of action. PBPK, Physiologically based pharmacokinetic; QSP, Quantitative systems pharmacology.
To reflect real demographic and comorbidity parameters, we used psoriasis-related studies as a reference. We obtained population demographic information from the CIMPASI I, CIMPASI II and CIMPACT trials (23–25), while we inferred the frequency of comorbidities (diabetes, hypertension, non-alcoholic fatty liver [NAFLD], anxiety, and depression) from the prevalence and odds ratio in the population with psoriasis (47–50). For psoriatic arthritis, we used the self-reported (not diagnosed-based) frequency reported in the CIMPASI I, CIMPASI II and CIMPACT trials (23–25).
To characterize the populations’ disease and comorbidities in detail, we carried out a manual literature curation protocol as previously described (51, 52). For psoriasis definition, we initiated an extensive and careful full-length review of relevant articles found in the PubMed database up until the moment of the start of the study (restricted from October 2013 to October 2018) obtained by the following search string: psoriasis [TITLE] AND (molecular [TITLE/ABSTRACT] AND (pathophysiology [TITLE/ABSTRACT] OR pathogenesis [TITLE/ABSTRACT])). We retrieved the list of publications identified and assessed them at the title and abstract level. When we found molecular information describing pathophysiology conditions, we thoroughly reviewed the full text to identify the main pathophysiological processes described as being involved in psoriasis (Supplementary Table A in the S2 File). We further characterized each pathophysiological process at the protein level by using the retrieved publications and saved for analysis all proteins whose activity (or lack thereof) was functionally associated with the development of the condition (Supplementary Table A in the S2 File). We characterized comorbidities with the same methodology.
Besides the bibliographical characterization, we collected additional data to further characterize moderate-to-severe psoriasis. We retrieved expression data from the Gene Expression Omnibus public repository (53) using the query [19th November 2018]: psoria* [TITLE]. We only considered studies performed in humans through expression array (Series type: Expression profiling by array) with more than 30 samples. We obtained three datasets that fitted the mentioned characteristics: GSE13355 (54, 55), GSE14905 (56), and GSE78097 (57) (which included information on severity; we considered psoriasis as moderate-to-severe when the Psoriasis Area Severity Index [PASI] >=12). We analyzed experiments using GEO2R software with the default settings. We then selected the proteins that resulted positively or negatively differential between severe and mild psoriasis lesions (GSE78097; adj. P-value< 0.01, |log2FC|>1) and between psoriatic lesions and control biopsies in at least one of the two psoriasis vs. control experiments (GSE13355, GSE14905; adj. P-value< 0.01). We detected 58 genes as representatives for the severe psoriatic state with respect to mild lesions and control biopsies (Supplementary Table B in the S2 File).
We calculated the minimum sample size of virtual patients to be generated as the population number for which a molecular classifier was able to discriminate between patients with psoriasis and healthy individuals while having enough statistical power. Given that TPMS models’ outcomes are based on predicted protein activity, we considered experimental measures that could relate to protein activity variability, particularly gene expression. We queried the Gene Expression Omnibus database (53) (February 2021) and obtained the following series containing the raw microarray files for skin biopsies from patients with psoriasis and controls: GSE13355, GSE14905, GSE78097 (Supplementary Table C in the S2 File). They totaled 209 patients (118 cases and 91 controls). We normalized raw data by using the CuBlock cross-platform normalization method (58) to enable analyzing experimental data from different platforms.
To identify the minimum sample size, we applied a previously described approach (46) based on a progressive sampling method (taking subsets from 10 to the maximum number of samples) proposed by Mukherjee et al. (59) and Figueroa et al. (60). This approach aims at identifying the minimum sample size needed to obtain a two-feature based classifier that achieves a determined discrimination accuracy—namely the maximum accuracy (“Max accuracy”) when considering all available samples (209 samples)—by applying a classification training procedure. We used K-fold cross-validated accuracy (k = 10) to validate the classifiers’ performance. The percentage of Max accuracy reached for each subset of samples and for the total was calculated using the classifiers obtained for that subset (Supplementary Figure S1 in the S1 File). All tested subsets with 20 or more samples reached a 90% Max accuracy when computed with statistical powers of 95% (and even 99%). Considering statistical powers of 95%, the 95% Max accuracy was achieved with around 30 patients (i.e., 15 patients per cohort) and remained above the 95% Max accuracy threshold for the evaluated increasing set sizes. To have enough representativity of all comorbidity groups (the lowest in frequency incidence, diabetes type II - 0.438 (49), would need a population of 343 individuals to reach a cohort of 15 patients), and given that our computational approach allowed us to obtain patients more easily than RCTs, we established 500 virtual patients as the sample size.
For the present study, we generated a vPop resembling a real CT patient population with psoriasis since the patients with psoriasis CT populations differ from global population distributions by reason of its increased BMI and weight. We used the CIMPASI I, CIMPASI II and CIMPACT trials (23–25) to gather the reference distribution parameters. We retrieved age, weight, and BMI and constructed the vPop using an adapted version of the algorithm proposed by Allen et al. (61), as described elsewhere (46). We assumed that height was unrelated to the disease and used general distributions from European standard population values (62).
Additionally, we assigned molecular tags to the patients to account for comorbidity prevalence. Tags were distributed randomly among the virtual patients, with no co-occurrence frequency for any paired comorbidity. As an exception, we only assigned the obese molecular definition tag to patients presenting a BMI >30 kg/m2.
While demographic parameters were later used to obtain individualized PBPK models of the two CZP dosing schemes, we used comorbidity data, once translated into molecular information, as preliminary restriction information for generating the QSP models.
In our model, the vPop was treated with the two approved dosing schemes of CZP. We used a two-branch scheme, one per dosage, to compare their differences, mimicking the CIMPASI I, CIMPASI II and CIMPACT trials. We used the same 500 virtual patients (i.e., same individualized PBPK models) to obtain the two study branches: subcutaneous administration of CZP 200 mg every two weeks for 16 weeks and subcutaneous administration of CZP 400 mg every two weeks for 16 weeks, with both arms receiving the loading dose of CZP 400 mg at weeks 0, 2, and 4. This resulted in two interventions, or QSP models, per patient, generating a total of 1,000 models.
To characterize CZP, aside from reviewing official regulatory documentation and drug-target dedicated databases, we performed an evaluation of the currently available bibliography regarding known targets of the drug, as well as pharmacokinetic information, in PubMed (search restricted from October 2013 to October 2018). The specific search queries were the following: certolizumab [TITLE] AND (target [TITLE/ABSTRACT] OR molecular [TITLE/ABSTRACT] OR pharmacokinet* [TITLE/ABSTRACT]). We analyzed all articles at the title and abstract levels. From those selected, we reviewed the presence of molecular and pharmacokinetic information in depth to identify possible proteins/genes to be considered drug target candidates, as well as additional information for subsequent modelling (Supplementary Table D in the S2 File).
To assess the relation of each dosage with the drug’s concentration in body organs, we built a PBPK model for each virtual patient. Because antibodies primarily distribute within the blood system, with low penetration in other organs and tissues, we constructed a two-compartment model system consisting of only the skin (administration tissue) and the blood (clearance system). We applied the equations associated with blood flow rates and skin volumes described by Brochot and Quindroit (63). However, blood volume was adjusted to fit the drug’s distribution volume for optimized modelling. Since these variables depend on cardiac frequency, age, BMI, and sex, they yielded individualized models as described elsewhere (64).
The absorption constant (ka) was calculated using the following formula (65):
Where is the absorption half-life.
When approximating (66), we obtained:
The clearance constant parameter (kel) was calculated by fitting a general model to pharmacokinetics data points. We used European Medicine Agency’s Cmax values, and additional points were extrapolated using Cmax, half-life, and Tmax parameters (67, 68).
We implemented all PBPK compartment models in MATLAB™ (69) and integrated differential equations describing the kinetics of the compounds and the fitting procedures by using the SimBiology Toolkit.
TPMS technology (51) generates mathematical models by applying supervised machine learning methods based on a human protein functional network, using known biological, medical, and pharmacological information as training data (Supplementary Table E in the S2 File). These models can be used to simulate the behavior of drugs and the pathophysiology of diseases in terms of changes in protein activity (52, 70–72).
Here, we used TPMS to build the mathematical models to simulate the behavior of CZP over psoriasis by modelling the changes in disease-related proteins’ activity (Supplementary Table A in the S2 File). Besides TPMS training data, which included specific psoriasis treating and inducing/exacerbating drugs (Supplementary Table E in the S2 File), we used additional molecular information to denote different patient types, including (i) gene expression in moderate-to-severe psoriasis (Supplementary Table B in the S2 File) and (ii) psoriasis common comorbidities (diabetes, hypertension, NAFLD, anxiety, and depression).
TPMS mechanism of action models can be defined by the predicted protein activity achieved for each protein (ranging between -1 [completely inhibited] and 1 [completely activated]) by the flow of the signal through the protein-protein interaction network (51). From the predicted protein activity of the proteins designated to define psoriasis, we calculated the previously described TPMS model-derived parameter tSignal (Equation 3) (51), which ranges between -1 and 1, and used it for the molecular definition of psoriasis (Supplementary Table A in the S2 File) in the QSP models:
Where n is the number of proteins defining the protein set with non-zero signal; vi are the protein signs (active or inactive) according to each disease/comorbidity definition; and yi are the resulting modelled signal values achieved by each protein “i” after stimulating the model with the corresponding drug.
We computed QSP models for each patient-dosage using the TPMS methodology as previously described (46). Briefly, we used two types of restrictions to generate the models: (i) quantitative dose-related data, which are related to the effectiveness of the drug-dosage, and was computed using concentration data and effectivity relation; and (ii) molecular data, which can be subdivided in patient-specific molecular information related to his/her disease and comorbidity characterizations, and protein known information from publicly available databases and Biological Effector Database (51). Consequently, the resulting models allowed evaluating the influence of the different dosing schemes.
In order to link the CZP concentration with efficacy, a proxy model-derived EC50 parameter was calculated as described previously (46). Here, a set of clinical trials evaluating moderate to severe psoriasis using different drugs were included with PASI75 as outcome measure, which were modelled using the same PBPK modelling strategy as for CZP (efficacy data, specific PK parameters and data sources in Supplementary Table D in the S2 file). Exceptionally, infliximab, however, was modelled as a single compartment, with an intravenous dosage; and for apremilast a model previously described (46) was used, with an oral dose and liver clearance.
We analyzed the generated data with MATLAB™ functions and Python or R packages. For the analysis of the population demographic and molecular parameters, we used descriptive statistics (mean and standard deviation, frequency tables, or pie charts) and applied the appropriate parametric and non-parametric tests. We used Pearson’s correlation to evaluate the fitting of tSignal to clinical and severity measures. We used Wilcoxon rank-sum test for the comparison of predicted protein activity level. In all cases, we reported the applied test and calculated the false discovery rate (FDR) according to Benjamini-Hochberg (73) multi-test correction method to control for type I errors, whenever applicable. We set the statistical significance level based on p- or q-values for each analysis, always being, at least,<0.05. We applied a data science-based approach (51) to identify classifier molecules by using cross-validated accuracy as a quality measure.
A selection and conversion methodology was applied (46) to evaluate whether the predicted protein activity of the proteins defined in the psoriasis definition were able to fit an efficacy metric, namely PASI75, as defined in available clinical trials (Supplementary Table D in the S2 file). We evaluated the tSignal on the set of drug models created as a proxy of this clinical efficacy measure. In order to link the clinical efficacy measure, PASI75, with the model-derived value, ADHD-tSignal, linear regression analysis (Pearson’s correlation) between both variables was performed to parameterize the following equation:
This process was designed to maximize the absolute value of the Pearson correlation coefficient (|ρ|) between clinical and tSignal values, maintaining molecular information from the bibliography-based characterization. Proteins within the psoriasis molecular definition distorting this relationship were identified and discarded iteratively to optimise the correlation and identify the protein set that best fitted the clinical measurements.We calculated the accuracies of SB and QSP models for each solution within each model and expressed them as the percentage of compliance of all drug-pathophysiology relationships included in the training set (51).
We used an unsupervised clustering strategy to find molecular patterns in the resulting model’s output. As input data, we used the resulting signal values of psoriasis’ characterized proteins for all patient-dosage models. First, we carried out a feature (protein) normalization for each arm by subtracting the mean predicted protein activity value to minimize the potential direct impact of drug concentration per patient without compromising inter- and intra-protein variability. Then, we applied a dimensional reduction method using Principal Component Analysis (74) or Multidimensional Scaling (MDS) (75) with two, three, and five dimensions. We obtained the clusters by applying a set of different clustering algorithms: Kmeans (76), self-organizing map (77), Spectral (78), Gaussian mixture model (79), and hierarchical (80). We encapsulated all the methodology in a single clustering strategy analysis, which also computed the optimal number of clusters for each setting, defined according to Calinski Harabasz (81), Davies-Bolduin (82), Gap (83), and Silhouette (84) indexes, being the latter prioritized among the rest. We evaluated the quality of the resulting clustering analyses by three quality indicators: Hopkins statistics (to measure the clustering tendency of a data set) (85), Dunn index (to evaluate the cluster compaction) (86), and Jaccard Bootstrap Index (to measure the stability of the clustering solution in a set of bootstrap resamples) (87). Once the best model was identified, we computed the Euclidean distance between clusters to evaluate their proximity.
To functionally evaluate the protein predicted activity, we carried out a hypergeometric enrichment analysis (88) over the proteins with a more characteristic behavior in each cluster compared with the complete set of model solutions. The complete list of proteins included in the models was used as protein universe. We used KEGG (89), Gene Ontology (90), and TRRUST (91, 92) as reference databases. We only selected enriched pathways with an FDR q-value< 0.01. Moreover, we excluded those containing either more than 300 genes—to keep biologically specific results—or less than 10 genes—to reduce artifacts. We used a modification of Hausdorff distance (93) between the enriched sets over the human protein network (51) as a link value between the sets to represent the results’ network. We performed all network representations with the software Cytoscape (94).
We executed all simulations described in this study in the Anaxomics’ cloud computing server, which integrates more than 800 computational threads in machines with 64 Gigabytes of RAM. Software, databases, and tools are the property of Anaxomics Biotech.
According to statistical evaluation, the patient deconvolution and vPop simulation led to the generation of a vPop with moderate-to-severe psoriasis that reproduced the demographic characteristics of real clinical trial reference populations (no statistically significant differences with the mean values of clinical trials, Table 1). As expected, mean weight and BMI were found higher than in general populations, with high proportions of patients with overweight - BMI >= 25 - and obesity - BMI >= 30 (Figure 2C). When comparing our vPop o a European-like population (62) with the same population size, age distribution, and sex ratio to assess demographic distribution similarity, both weight and BMI were found to be significantly higher in the vPop with psoriasis than in the European population (Wilcoxon rank sum test, p< 0.001). No differences were observed for height (Wilcoxon rank sum test, p= 0.802) or for age (Wilcoxon rank sum test, p= 0.226). Additionally, the vPop was created to include comorbid patients according to real-world data (Figure 2B), achieving a population of 87% moderate-to-severe psoriasis patients suffering at least one comorbidity. The 500 virtual patients, defined by their characteristics, were submitted to PBPK and SB mechanistic modelling of the two dosage regimens of CZP (Figure 2A), obtaining two arms of models for the same patients.
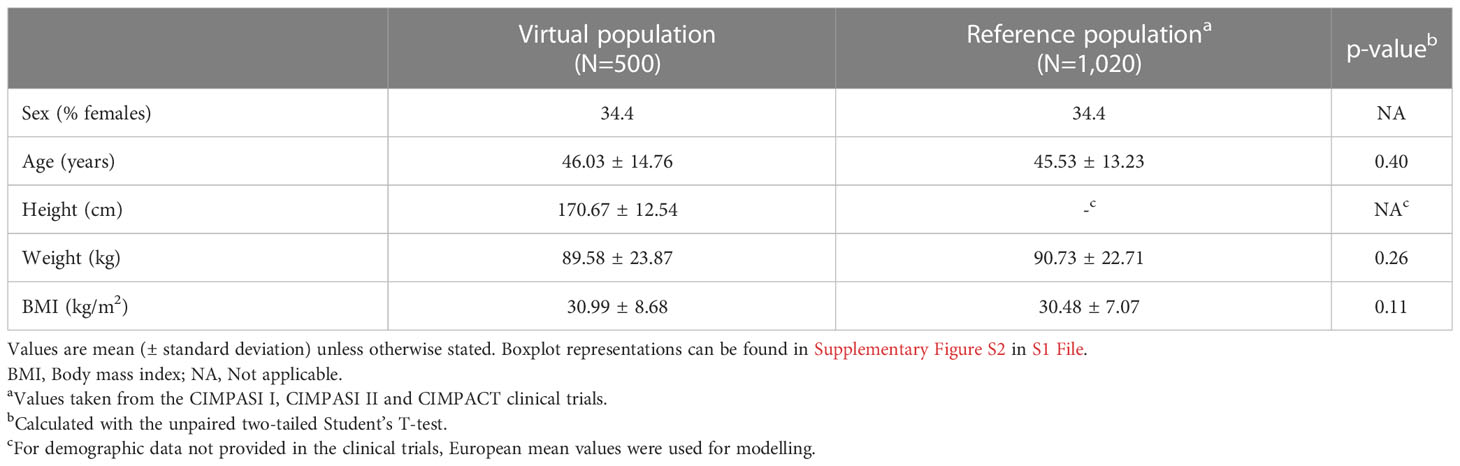
Table 1 Demographic characteristics of the generated virtual population and the reference population (23–25).
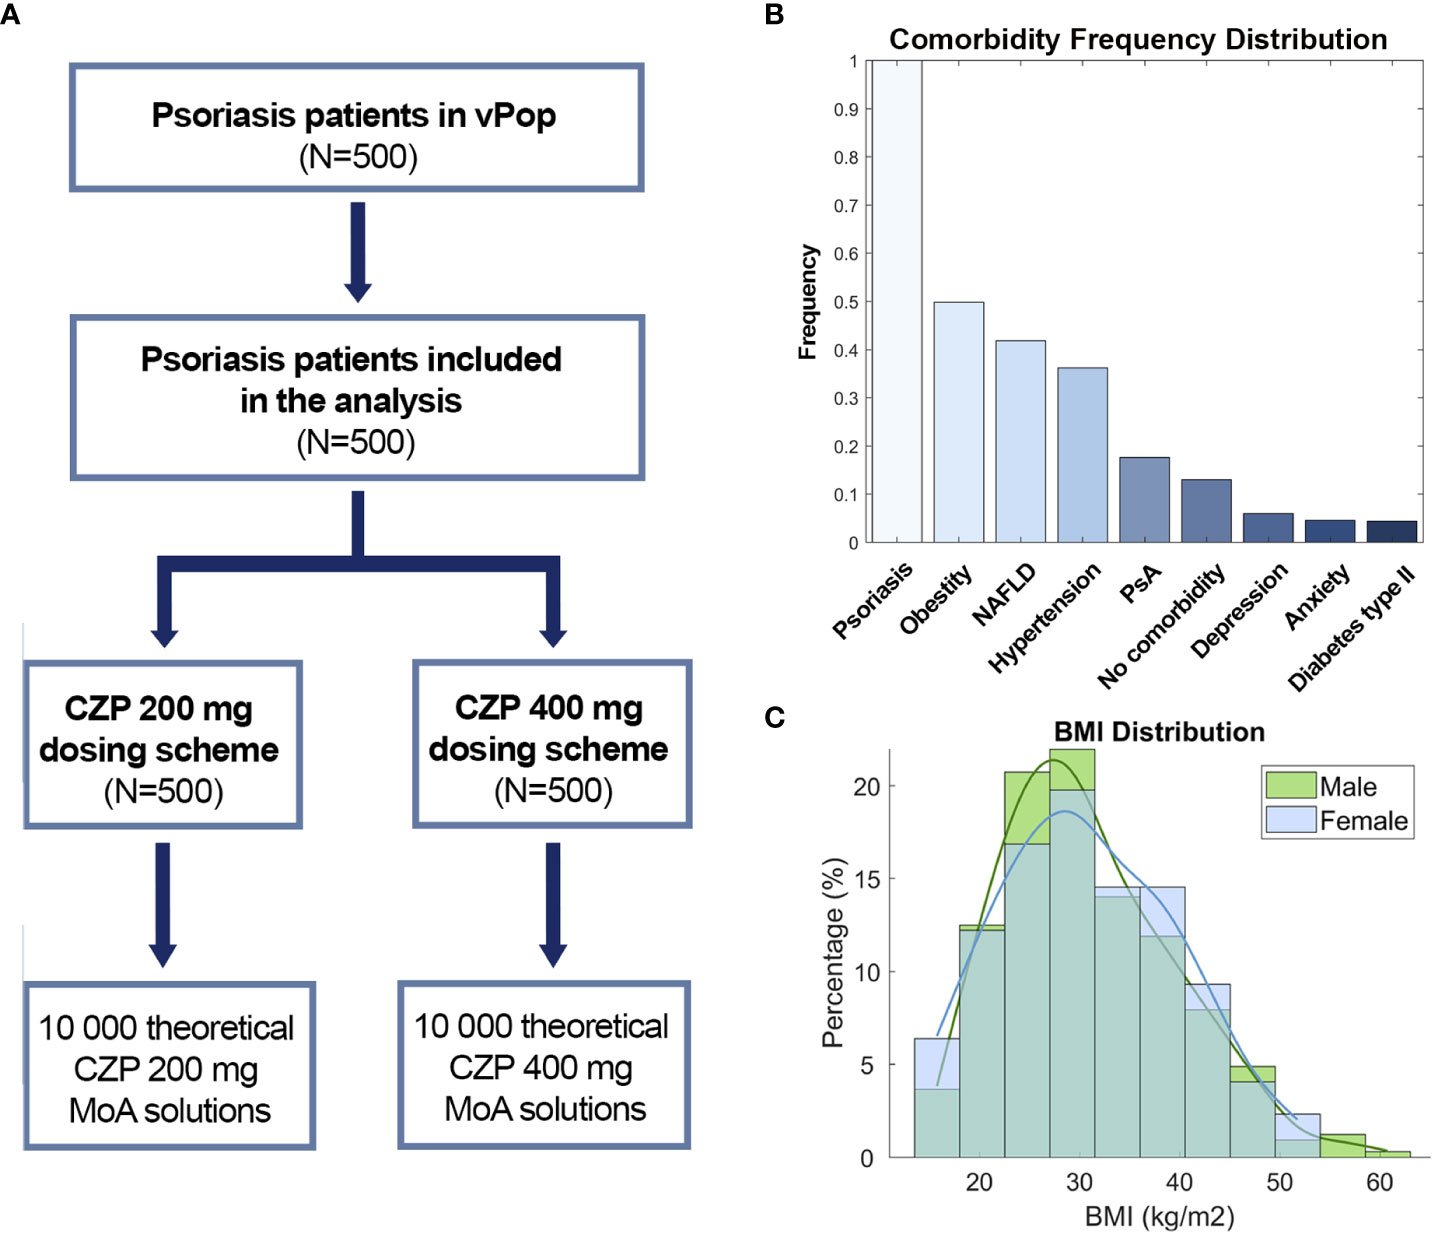
Figure 2 (A) Study branch scheme, (B) Comorbidity frequency distribution and (C) BMI distribution by sex. CZP, Certolizumab pegol; NAFLD, Non-alcoholic fatty liver disease; PsA, Psoriatic arthritis; BMI, Body mass index.
Several Cmax concentration datapoints were used to fit the PBPK models: 200 mg dose Cmax, 400 mg dose Cmax (67), and 400 mg initial dose followed by 200 mg doses until achieving Cmax at the steady state (95). Additionally, clearance-related datapoints were extrapolated and used to refine the model (68). The resulting PBPK models adjusted to all reported Cmax values and extrapolated clearance data points with an R2 > 0.95 (Figure 3). The calculated Tmax, half-life, and Cmax parameters for the standard-patient (75 kg, 170 cm, 40 years old) model were similar to literature values (Supplementary Table F in the S2 file).
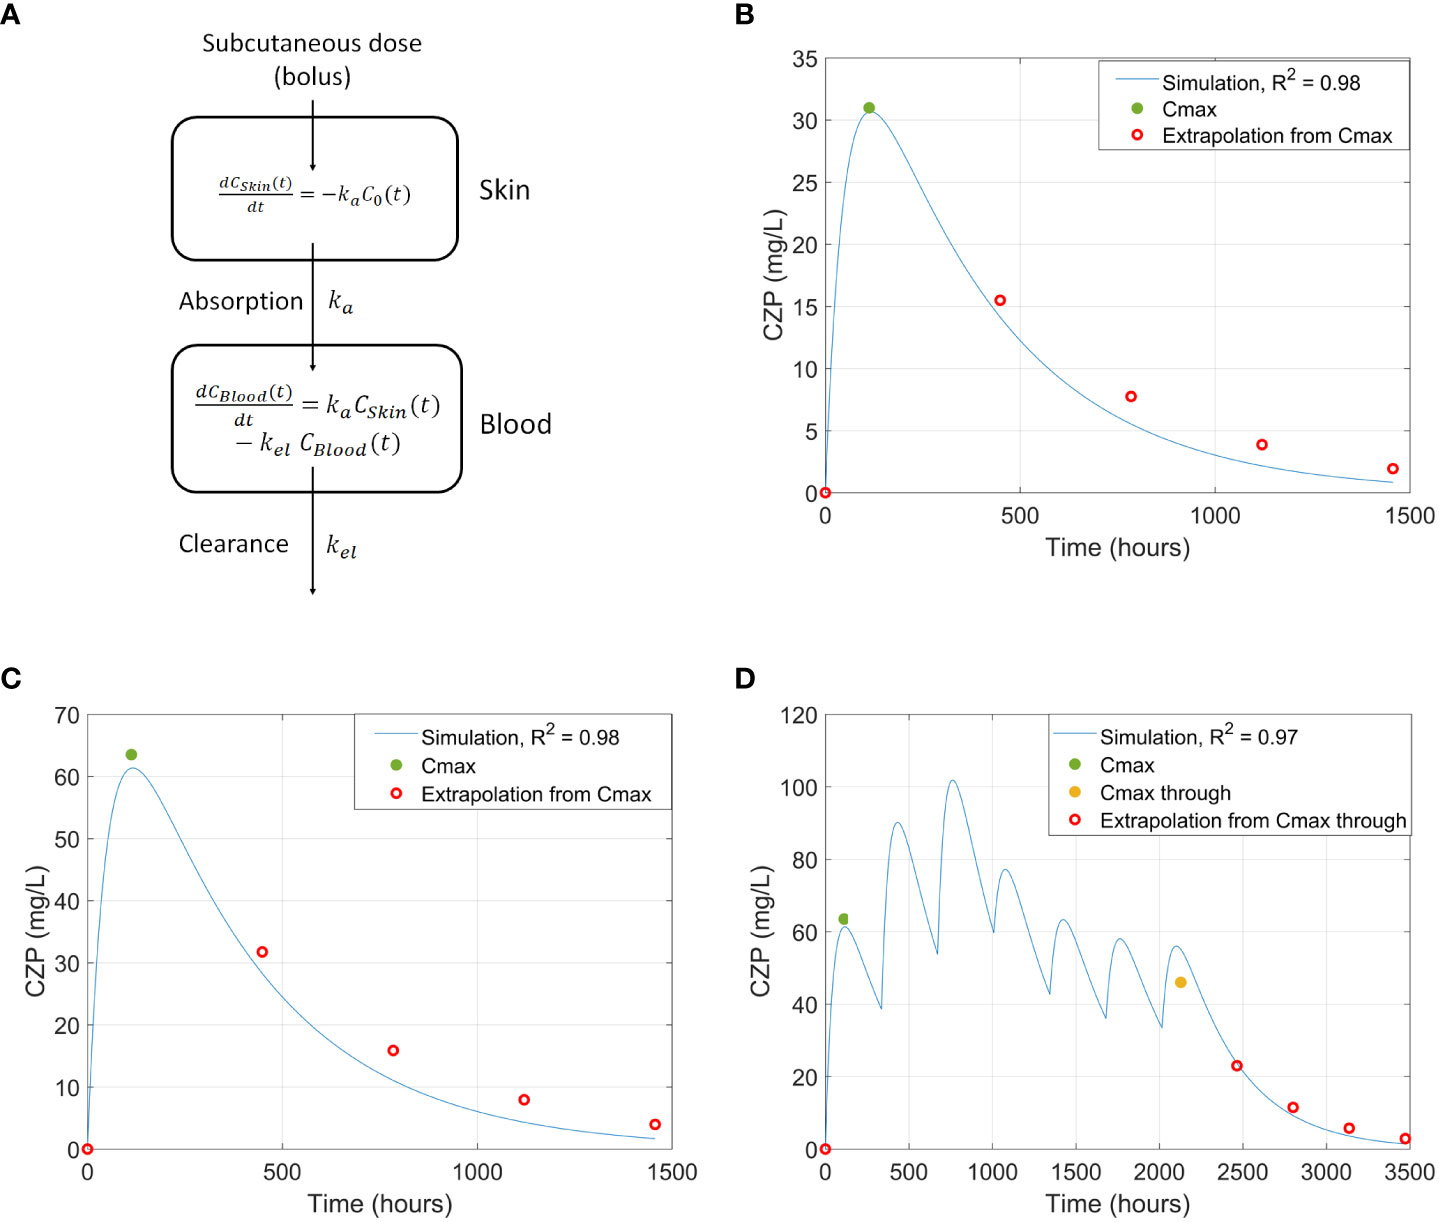
Figure 3 (A) PBPK model representation. (B-D) Comparison of CZP concentration in blood between literature’s Cmax values and extrapolated datapoints and the simulated curve using the PBPK model, generated from a standard adult patient, for: (B) 200 mg single dose of CZP (67); (C) 400mg single dose of CZP (67); and (D) 3 x 400 mg loading doses + 4 x 200mg doses (95). CZP, Certolizumab pegol; PBPK, Physiologically based pharmacokinetic.
The MoA of CZP in our vPop (QSP models) presented a mean accuracy value of 91.51% with respect to the training information. These simulations took into account the whole available data on pathologies, drugs, and the populations’ characteristics. Once built, the potential of QSP models to reproduce clinical and molecular data was tested.
We evaluated the psoriasis tSignal in models developed for the different psoriasis drugs to assess the correlation between the literature-based psoriasis definition and clinical observations (i.e., PASI75 scores). We identified a list of 115 proteins out of the 124 original psoriasis protein effectors (Supplementary Table A in S2 File) that, when measured together using the tSignal, correlated with |ρ|=0.85 to PASI75 measurements of (Supplementary Figure S3 in S1 File).
We analyzed the tSignal calculated from the optimized psoriasis definition of the CZP models developed for the virtual patient population. The tSignal was then compared with the predicted protein activity of known psoriasis severity-associated proteins. The predicted protein activity of 12 proteins were identified to correlate to the TPMS-psoriasis tSignal, 9 of them presenting moderate correlation (|ρ|>0.5) for both dosing schemes (Table 2).
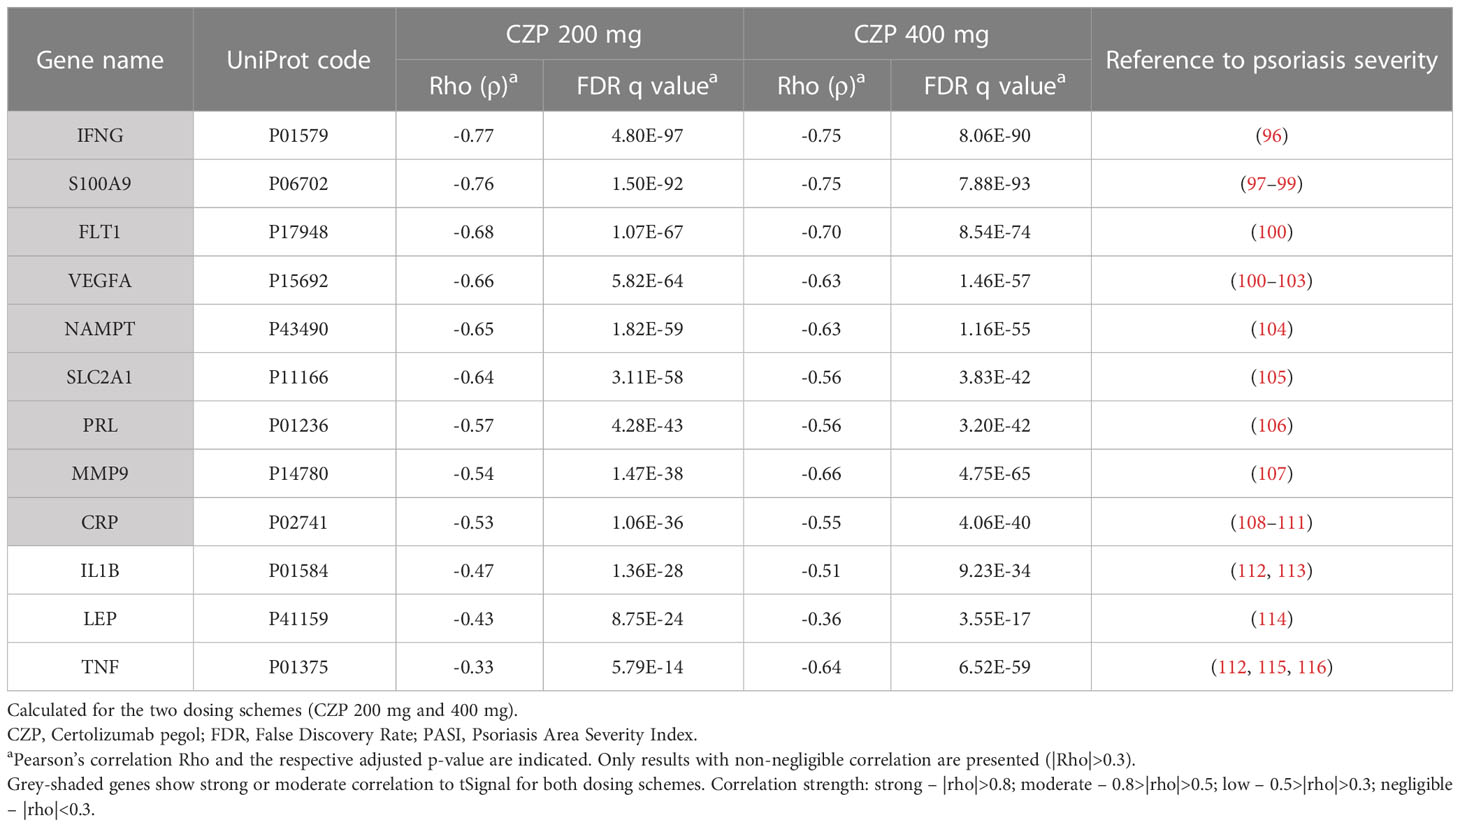
Table 2 Evaluation of correlation of predicted protein activity of proteins previously shown to correlate with psoriasis clinical severity (measured according to PASI) with tSignal.
We observed a strong correlation between the optimized psoriasis tSignal measure and the original psoriasis tSignal (i.e. considering the complete response) within the CZP models in the virtual patients population (ρ>0.99 for both dosing schemes).
To identify distinct mechanistic response patterns to CZP, we performed clustering analysis on the individualized patient models’ response to the drug using the predicted protein activity as a measure of variability. Several combinations of dimensionality reduction and clustering algorithms were applied, and the best model according to Hopkins (0.84), Dunn (0.09), and Jaccard Bootstrap (0.53) indexes was selected. The resulting model involved a hierarchical clustering algorithm with Euclidean distance and average aggregation function, using a five dimensions reduction space after MDS with Spearman coefficient as distance. This model identified three mechanistic clusters as optimal (Figure 4A) with a similar proportion of patients from both dosage arms (Figure 4B). Clusters were represented using the two main dimensions of MDS (Figure 4A), which, combined, explained the observed variability of 63.55%. According to Euclidean distance, all three clusters were at a similar distance from each other, with cluster 3 being the most distant among them (Supplementary Table G in the S2 file).
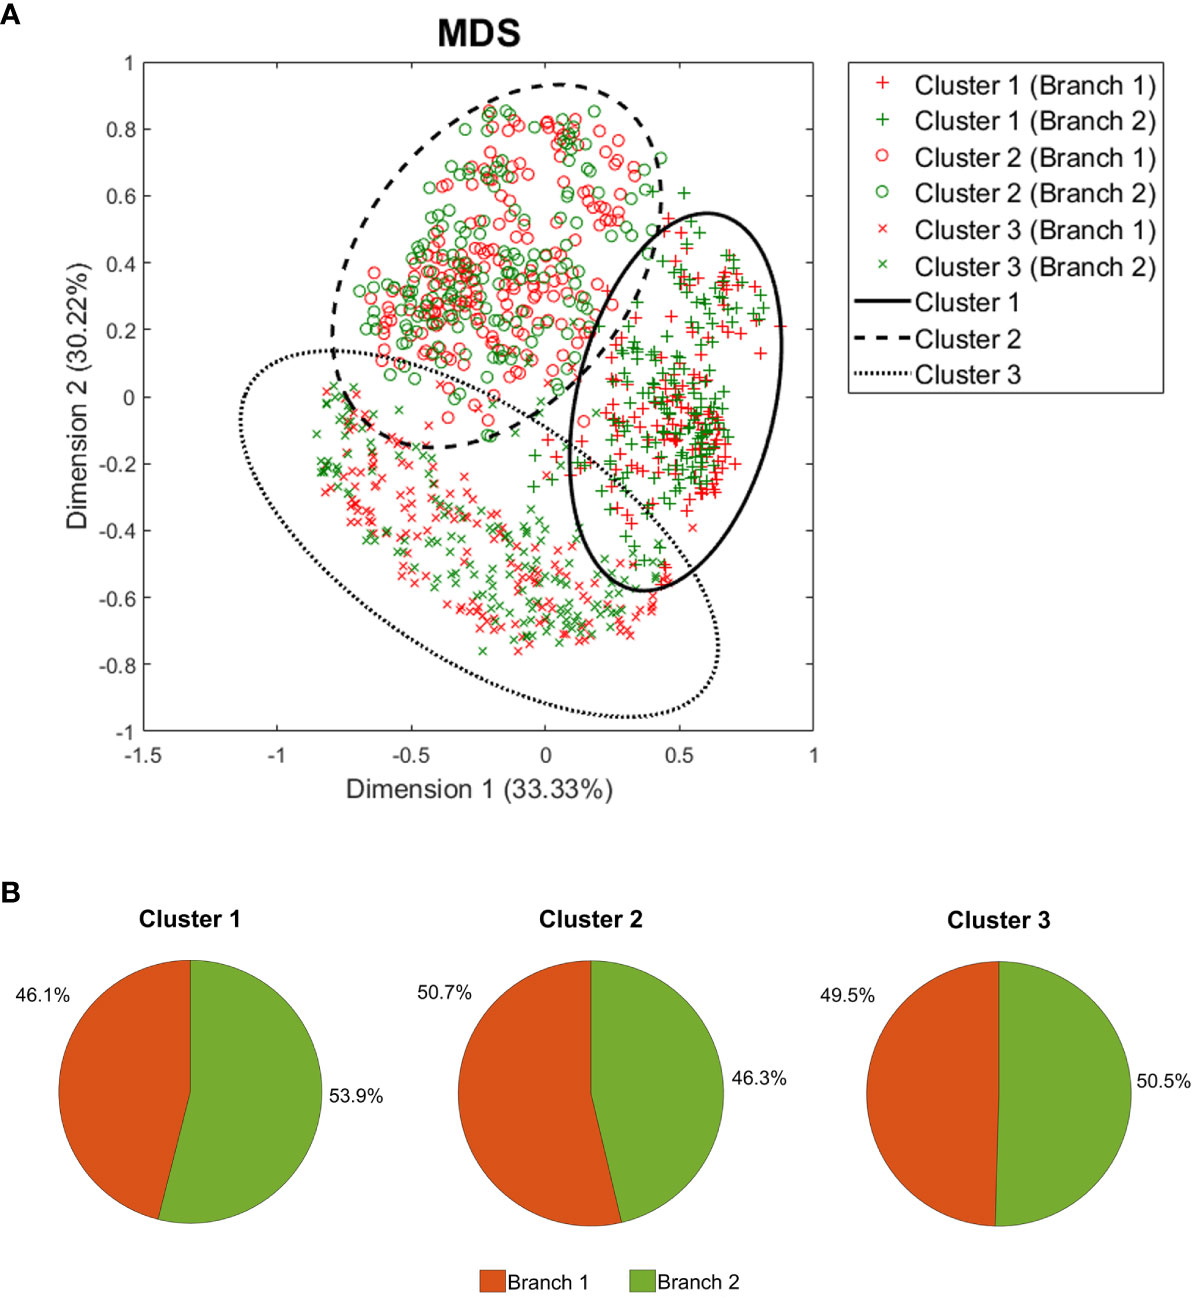
Figure 4 Clustering analysis results. (A) Two-dimension representation of the best clustering setting result using all 1,000 patient models after MDS, and (B) the branch incidence of each obtained cluster. MDS, Multidimensional scaling.
Clustering was found to be associated with differences in the dose-normalized tSignal. Cluster 1 showed a higher signal (with respect to the mean signal for the entire population per branch) than the rest of the samples (Student’s T-test, p< 0.001), while cluster 2 presented the lowest value (Student’s T-test, p< 0.001). To further characterize the clusters, additional comparison analyses were performed to identify potential differences regarding the demographic characteristics within the clusters. When comparing each cluster against the rest, cluster 1 was found to accumulate the highest ratio of females (Chi-squared test, p< 0.001) and the lowest height and weight values (Student’s T-test p< 0.001). On the other hand, cluster 2 presented a higher percentage of males and the highest values for weight and BMI (Student’s T-test p< 0.001) (Table 3).
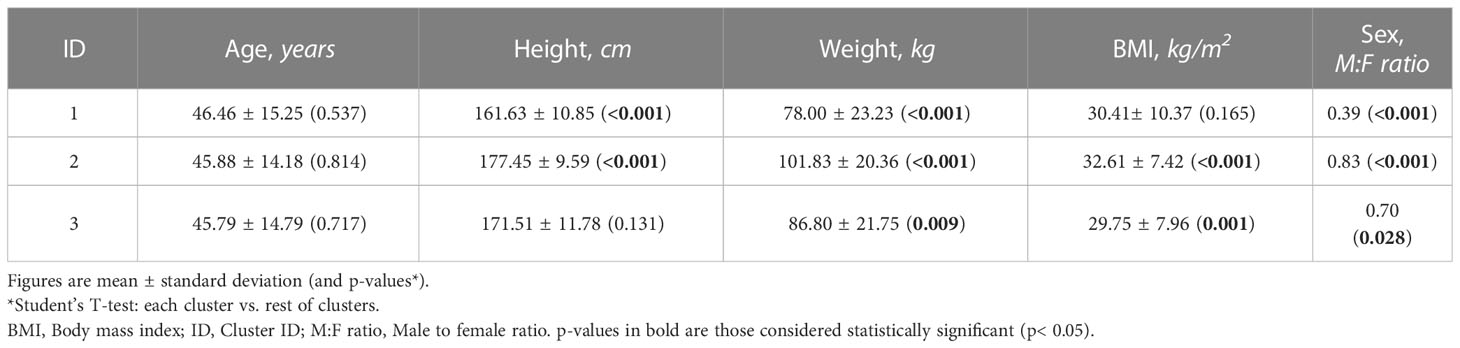
Table 3 Results of the comparison analysis between demographic characteristics within the clusters.
The proportion of patients suffering from comorbidities in each cluster was also evaluated and resulted in statistically significant findings. Cluster 2 showed a higher frequency of obese patients (Fisher test p< 0.001) than the other clusters. Conversely, cluster 1 had more patients suffering from diabetes type II and NAFLD (Fisher test p< 0.001) than the remaining clusters. Finally, cluster 3 stood out by accumulating all non-comorbid patients, comprising the lowest frequency of patients with diabetes type II, hypertension, NAFLD, and obesity (Fisher test p< 0.001).
To elucidate the underlying processes contributing to the mechanistic differences between clusters, enrichment analyses were conducted for the proteins from all models that differed in their mean predicted activity value more than 0.1 from the overall value in each cluster (Wilcoxon rank-sum test, FDR q< 10E-4, Supplementary Table H in the S2 File) (Figure 5, Supplementary Table I in the S2 File). In order to consider the direction of the differences, separate enrichment analyses were conducted for proteins exhibiting higher activity (UP) and lower activity (DOWN) within in each cluster, as compared to the overall model solutions (Supplementary Table H in the S2 File). According to the distance analysis, cluster 3 shared only a few enriched processes with clusters 1 or 2, which were related to signaling by cAMP and G proteins (Figure 5A). Clusters 1 and 2 demonstrated a similar profile of processes, although with an opposite modulation tendency compared to the mean population. Within the least active processes in cluster 1 (Figure 5B), the main components were integrin and adhesion-related pathways, including processes related to early development (formation of primary germ layer, gastrulation, embryonic morphogenesis, endoderm formation, endoderm development, endodermal cell differentiation, mesodermal cell differentiation). Angiogenesis-related pathways (positive regulation of angiogenesis, positive regulation of vasculature development) were also found among the least active processes in cluster 1. On the contrary, Wnt-related pathways were the least active in cluster 2 (Figure 5C) and included epithelial formation pathways (morphogenesis of epithelium, morphogenesis of embryonic epithelium).
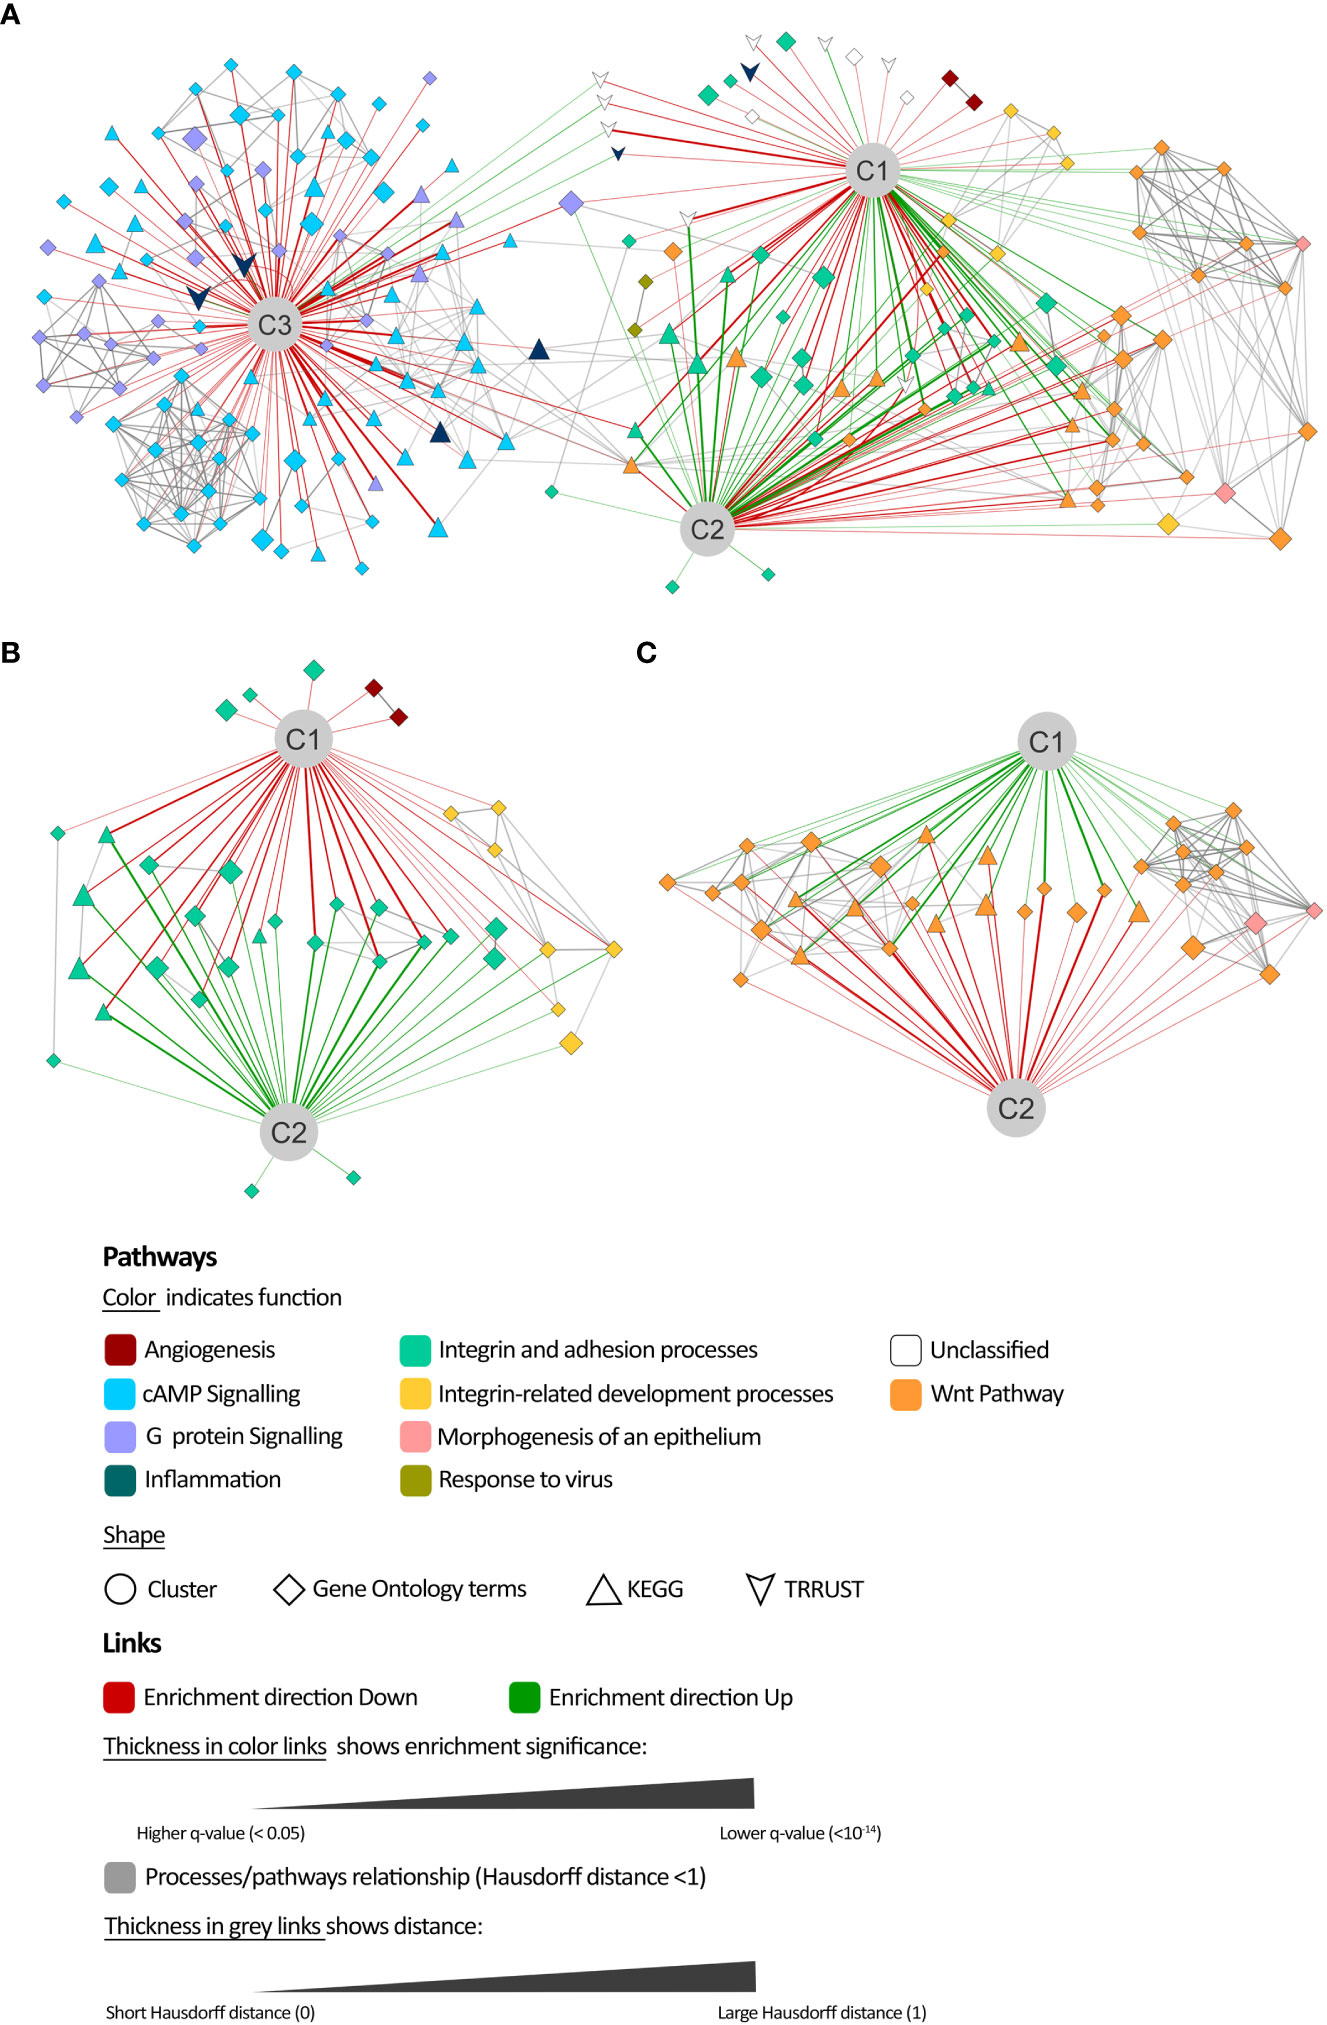
Figure 5 Comparison of mechanisms of action enrichment analysis. (A) Network representation of the enrichment analysis results of the most differentially modulated proteins in each cluster (C1, C2, and C3) with respect to the population mean and their relationship. Details on the least active processes in (B) cluster 1 and (C) cluster 2.
By applying feature selection and classification algorithms, we successfully identified proteins whose predicted activity allowed the differentiation of mechanisms within each cluster with a cross-validated balanced accuracy of at least 0.8 (Table 4).
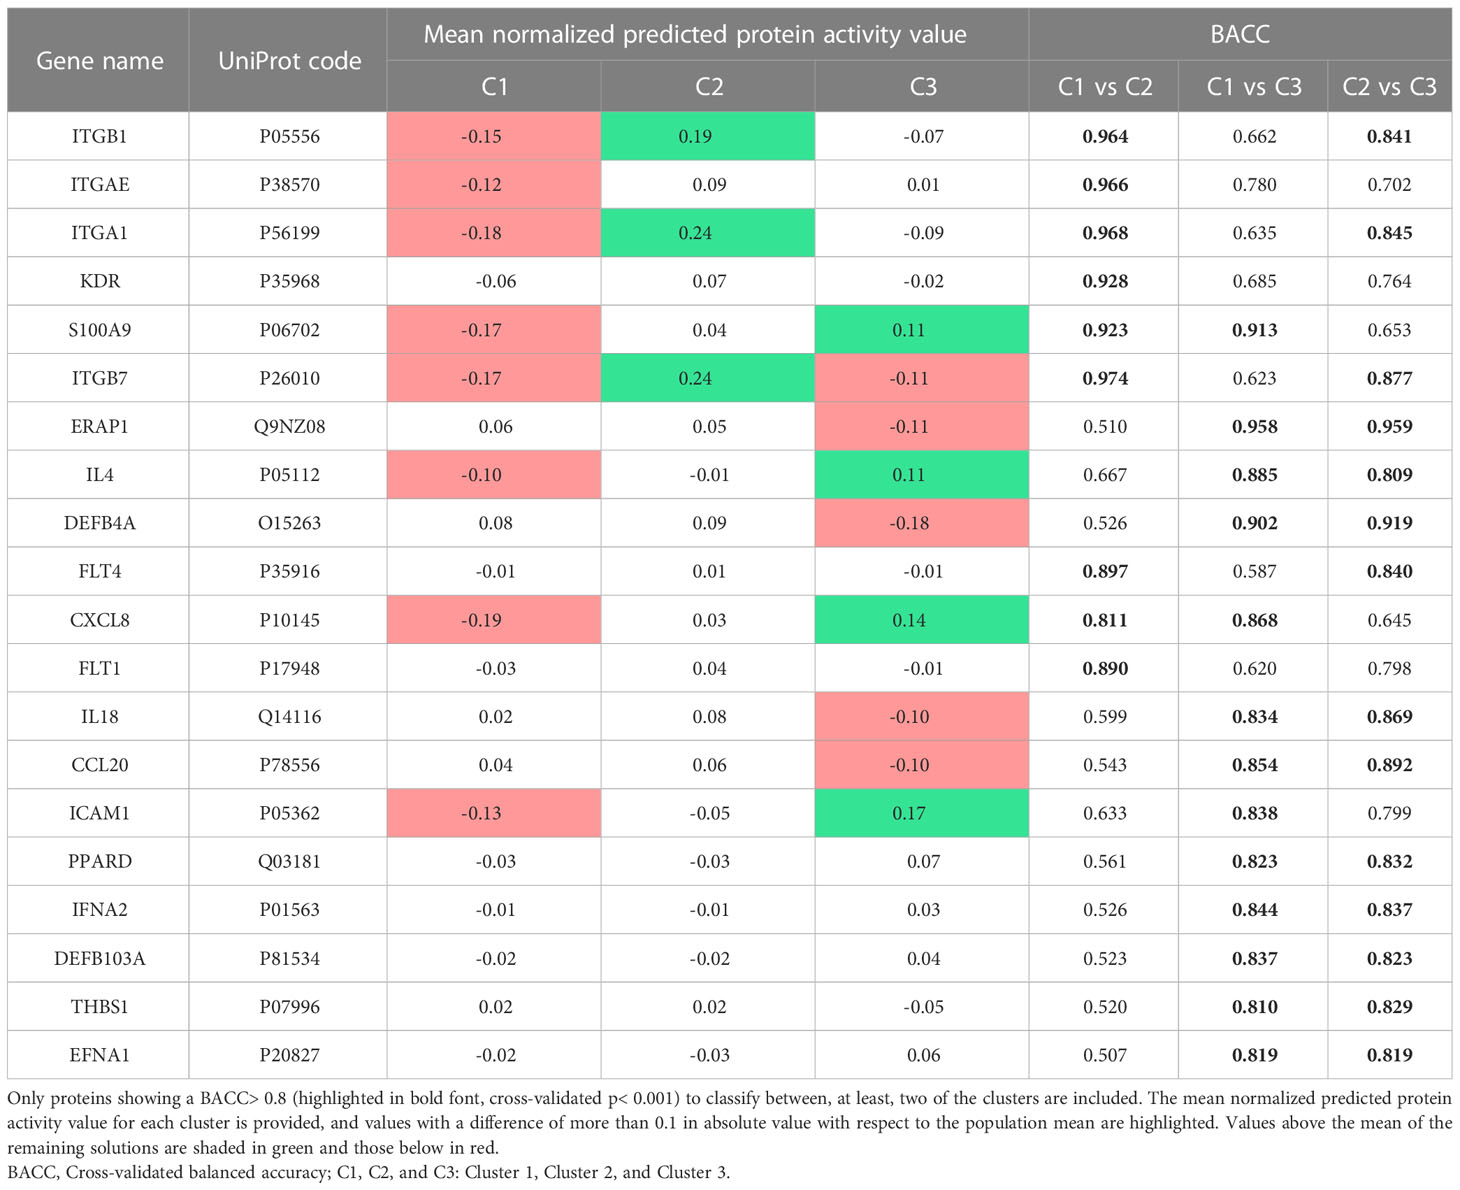
Table 4 Psoriasis effectors that best classify the patients in each cluster.
In the present study, we applied an in silico technology to build a QSP model of a clinical trial-like vPop with moderate-to-severe psoriasis treated with two dosing schemes of CZP. We successfully applied and combined different modelling approaches, namely: (i) an algorithm to generate vPop in accordance to RCT reference population values and comorbidity frequencies in real-world populations; (ii) PBPK models of the dosing schemes of CZP in each virtual patient; and (iii) SB-based models of the MoA of the drug, which provided outcomes that correlated with clinical efficacy measures and previously reported molecular markers of psoriasis severity (e.g. PASI score). Furthermore, we were able to identify clusters of virtual patients based on their psoriasis-related protein predicted activity when treated with CZP, which could help unravel differences in the drug efficacy in diverse subpopulations, classified according to the proteins involved in the disease’s MoA.
Utilizing epidemiological data, we successfully constructed a virtual population (vPop) that closely resembled a randomized clinical trial (RCT) population in terms of demographic parameters and frequencies of comorbidities (23–25, 47–50). Although the vPop compiled the anticipated demographic parameters and comorbidity frequencies, the relationship between these parameters was not taken into account. For instance, while patients were allowed to have up to two or three comorbidities, and obesity was assigned to individuals with a BMI>30, potential associations between demographic characteristics and comorbidities beyond these specific criteria were not considered. Indeed, we obtained a 13% of non-comorbid patients with psoriasis; this figure could not be verified because of the lack of epidemiological information on psoriasis and overall comorbidity. Moreover, it is possible that this percentage might be underestimated due to the scarcity of patients with multiple comorbidities in the dataset. In the same line, the number of obese patients included was based on the BMI distribution of the reference clinical trials (23–25), yielding 50% of obese patients in our study. This number was higher than the frequency reported on the clinical trials (around 40%), or the one that could be inferred from epidemiological data on obesity and psoriasis (around 29%) (12, 117). Thus, our method created a population enriched in obese patients, while underestimating or neglecting the number of extremely obese patients in real settings. The limitations associated with the algorithm used to generate virtual populations may impact the accuracy of conclusions regarding the percentage of the population. However, these limitations do not affect the validity of comparisons between different pharmacological strategies within the same population (46).
Our PBPK and SB-based models demonstrated high accuracy in reproducing known data. Through the identification of a subset of psoriasis-related proteins within the literature-based psoriasis definition, we successfully established a correlation between clinical efficacy values from clinical trials testing psoriasis drugs (i.e., PASI75) and the model-derived psoriasis activity proxy [i.e., the tSignal (51)]. This subset contained the majority of the initially identified proteins, further validating the accuracy of our approach. When considering the CZP models in the virtual population, the tSignal considering both definitions (original and optimized) strongly correlated. In addition, the predicted activity of proteins known to correlate with disease severity (measured with PASI), was also found to correlate with the tSignal, including inflammatory proteins [IL-1β (118, 119), TNFα (112, 115, 116), CRP (109–111, 120)], proteins related to skin immunological barrier and epithelial hyperplasia [S1009 (121–125), IFN-γ (124, 126, 127)], angiogenic proteins [VEGF/FLT1 (128), MMP9 (129)], adipokines [NAMPT (104, 116)], leptin (114, 130, 131), sexual hormones [prolactin, previously associated to autoimmune diseases (132)], and a glucose metabolism protein related to both keratinocyte proliferation (133, 134) and T cell activity regulation (135, 136). These results suggested that our models, and our psoriasis definition, could be useful to answer drug efficacy questions.
In this sense, our observations of the unsupervised clustering of patients regarding their predicted mechanisms match with previously published data. Both our study and existing literature consistently show that large morphometric characteristics (weight, height, BMI), particularly obesity, are associated with a poorer response to anti-TNF treatment (137–139). In line with our results, age has not been found to affect the biologics’ effectiveness in psoriasis (140). Interestingly, our models indicated a better response to CZP in women, despite conflicting evidence in the literature regarding the impact of sex on treatment efficacy for CZP and the anti-TNF class (139, 141–148). Given that most previously published data focused on adalimumab treatment, with limited CZP data included, it remains unclear whether the observed sex differences are specific to CZP, the entire anti-TNF class, or influenced by biological or gender-based factors such as hormonal levels, immunological status, age of diagnosis, or access to treatment. They might also be explained by sex differences in comorbidities. However, our population did not specifically model the association between female sex, comorbidities, and their clinical manifestations. Nevertheless, the impact of sex on the response to CZP in psoriasis may involve complexities beyond drug concentration differences, which were not captured by our QSP models. This limitation highlights the need for further investigation. Our results on the impact of comorbidities, especially regarding cluster 3 grouping all patients with psoriasis and no comorbidities, suggested that co-occurrent comorbidities could result in mechanistic differential response to treatment, supporting the current tendency towards managing patients with a multi-disciplinary approach (16). Further molecular analysis of these models, beyond the scope of this study, could uncover relevant hypotheses in this regard.
The molecular evaluation of the clusters showed that there is a molecular diversity within the model solutions and virtual patients to CZP mechanism of action, and that the processes involved in this diversity are related to psoriasis development. Our results showed that CZP treatment could regulate integrin and adhesion-related processes associated with immune cells recruitment and homing (149), as well as keratinocyte function (150–152) and tissue differentiation. While anti-TNF treatment has been related to the modulation of inflammatory cell recruitment and homing, its effect on integrin regulation has not been well established. Since the regulation of integrins and their interaction partners is key for homeostasis of the skin (151), a detailed evaluation of these results is granted for understanding whether the downregulation of this activity could be relevant to CZP mechanistic efficacy. Our models highlight that modulating the Wnt pathway, involved in psoriasis development (153) through its role in hyperproliferation of keratinocytes and angiogenesis (154–156), could be related to anti-TNF efficacy. TNFα has been reported to reduce the canonical Wnt/β-catenin pathway through DKK-1 induction (157), linking inflammation, particularly TNF, to bone pathology (158). Anti-TNF treatment in rheumatic conditions, such as psoriatic arthritis and rheumatoid arthritis, has been found to modulate this pathway (159–162). Non-canonical Wnt signalling pathways have been recently highlighted as relevant in inflammatory disorders (e.g., psoriasis and psoriatic arthritis) (163, 164). The reduced activity of these pathways in cluster 2 seemed to indicate suboptimal TNF inhibition. These findings might pinpoint the importance of effectively controlling the inflammatory component of psoriasis to prevent the development of rheumatic complications, including psoriatic arthritis. Given that the identified clusters presented different tSignal values, these results could point to different psoriasis pathophysiological mechanisms or CZP therapeutic mechanisms that could be determinants of clinical efficacy, although prospective validation is required.
Our study can be framed within the increasing tendency to leverage recently available high-performance computing technologies in the field of biomedicine. The use of these technologies, combined with regulatory frameworks, will advance precision medicine pipelines, enabling personalized healthcare while reducing, refining, and partially substituting animal and human experimentation (165). According to the MID3 guidelines definitions, this theoretical model yielded conclusions classified as MEDIUM, suggesting its potential as a reliable hypothesis-generation tool capable of providing molecular insights. However, further experimental and clinical assays are necessary before its translation into clinical practice.
In our study, we generated subject-specific models from population information deconvolution. While the use of population aggregated values solves the potential ethical issues implied in managing individualized patient data (165), it entails the limitation of the patients not being real patients, precluding a conclusion for personalized medicine. As previously discussed, potential associations between the evaluated factors, impacting population frequencies and molecular/clinical differences, were not considered in our study (e.g. co-occurrence of comorbidities, increased risk for occurrence of comorbidities depending on the patient profile, or associations between patient characteristics not occurring in general population). Other factors, such as smoking or alcohol consumption, which are challenging to define at the molecular level, were neither taken into consideration. The use of demographic data and distributions from real-world psoriasis registries can help correct biases in RCT values, including those related to inclusion and exclusion criteria (e.g. exclusion of females of childbearing age). However, it is important to note that this approach has limitations in evaluating highly specific subpopulations and relies on the assumptions made for each profile’s modeling (165). This methodology can build true patient-specific models when the necessary information is available, such as through real-world data registries. With computational power as the only limitation, our approach allows for the recruitment of a great number of patients, which can be difficult, costly, and even not feasible in a conventional clinical trial setting. Moreover, paired analysis of the same subject in relation to different interventions, akin to a cross-over study, can be conducted without requiring a washout period. This approach avoids even the slightest discrepancies in the characteristics of the populations included in each trial arm.
Finally, although we made efforts to gather extensive information on patients, disease, and treatments at the molecular and clinical level, and established benchmarks for validation, it is important to acknowledge that our approach, like any modelling technique, was constrained by the available information at the time of the study (46, 165). While our models were deemed suitable based on the available data, the presented models and conclusions are subject to updates and improvements over time as new prospective data and information are generated. The SB and QSP models were built by incorporating the whole human protein network and a wide range of drug-pathology relationships (Supplementary Table E in the S2 File) (51). This approach achieved an accuracy exceeding 90%, demonstrating the models’ ability to generalize and accommodate new information beyond the specific data compiled for psoriasis and the studied drugs.
Our study provided patient-specific QSP models of the MoA of CZP, a PEGylated Fab humanized monoclonal antibody against TNF-alpha, in a vPop of patients with moderate-to-severe psoriasis, based on PBPK and SB models. The models reproduced clinical (i.e., PASI scores from different psoriasis treatments) and molecular (i.e., known psoriasis severity markers) efficacy features, supporting the use of these approaches to build hypotheses-generating models. The models’ analyses allowed to identify clusters of MoA solutions regardless of the dosing scheme, inferring the existence of dose-independent MoA differences between virtual patients, potentially involving developmental processes, such as angiogenesis and the Wnt pathway. The presented findings highlight the potential of in silico population- and patient-specific modeling approaches in advancing the study of diverse and complex diseases like psoriasis. These approaches enable detailed investigation of distinct pathophysiology and drug mechanisms. However, it is important to recognize that the results obtained from these models should be considered as hypotheses, requiring further prospective studies for clinical applicability. Nonetheless, such modeling approaches have the potential to reduce and refine pre-clinical and clinical experimentation and provide valuable data in the post-marketing setting.
The original contributions presented in the study are included in the article/Supplementary Material, further inquiries can be directed to the corresponding authors.
Conceptualization: JM, BO, XD, CC, OS-M, PC-S, AM, DM-R, SA. Data curation: CS-V, GJ. Formal analysis: CS-V, GJ, VJ, JM. Funding acquisiton: JM. Investigation: CS-V, GJ. Methodology: CS-V, GJ, VJ, FG, JM, BO, XD. Project administration: CS-V, CC, OS-M. Resources: JM, CC, OS-M. Software: GJ, VJ, FG. Supervision: JM, BO, XD, CC, OS-M. Validation: JM, BO, XD, PC-S, AM, DM-R, SA. Visualization: CS-V, GJ. Writing – original draft preparation: CS-V, GJ. Writing – review & editing: VJ, FG, JM, BO, XD, CC, OS-M, PC-S, AM, DM-R, SA. All authors contributed to the article and approved the submitted version.
The study was funded by UCB Pharma and Anaxomics Biotech. Copy-editing was funded by UCB Pharma. Article processing fees were provided by UCB Pharma. Public funders provided support for some of the authors’ salaries: VJ has received funding from the European Union’s Horizon 2020 research and innovation programme under the Marie Skłodowska-Curie grant agreement No 765158 (COSMIC; www.cosmic-h2020.eu); GJ has received funding from the European Union’s Horizon 2020 research and innovation program under the Marie Skłodowska-Curie Grant Agreement No. 765912; FG has received funding from the European Union’s Horizon 2020 research and innovation program under the Marie Skłodowska-Curie Grant Agreement No. 813545. The funder UCB Biopharma was not involved in the study design, collection, analysis, interpretation of data, the writing of this article, or the decision to submit it for publication.
The authors thank Matías Rey-Carrizo (BCN Medical Writing, Barcelona, Spain) for his assistance in editing the manuscript and Raquel Valls (Anaxomics Biotech SL, Barcelona 08007, Catalonia, Spain) for her fruitful help in data analysis and visualization.
Authors CS-V, GJ, VJ, FG and JM are full-time employees at Anaxomics Biotech. Authors CC and OS-M are full-time employees at UCB Pharma. Author SA was a former employee at UCB Pharma.
The authors declare that this study received funding from Anaxomics Biotech. The funder had the following involvement in the study: data analysis.
All claims expressed in this article are solely those of the authors and do not necessarily represent those of their affiliated organizations, or those of the publisher, the editors and the reviewers. Any product that may be evaluated in this article, or claim that may be made by its manufacturer, is not guaranteed or endorsed by the publisher.
The Supplementary Material for this article can be found online at: https://www.frontiersin.org/articles/10.3389/fimmu.2023.1212981/full#supplementary-material
Supplementary Figures | Data Sheet 1.PDF
Supplementary Tables | Table 1.XLSX
1. Menter A, Gottlieb A, Feldman SR, Van Voorhees AS, Leonardi CL, Gordon KB, et al. Guidelines of care for the management of psoriasis and psoriatic arthritis: Section 1. Overview of psoriasis and guidelines of care for the treatment of psoriasis with biologics. J Am Acad Dermatol (2008) 58(5):826–50.
3. Rachakonda TD, Schupp CW, Armstrong AW. Psoriasis prevalence among adults in the United States. J Am Acad Dermatol (2014) 70(3):512–6.
4. Michalek IM, Loring B, John SM. A systematic review of worldwide epidemiology of psoriasis. J Eur Acad Dermatol Venereol (2017) 31(2):205–12.
5. Global report on psoriasis. World Health Organization. (2016). Available at: https://apps.who.int/iris/handle/10665/204417.
6. Chan B, Hales B, Shear N, Ho V, Lynde C, Poulin Y, et al. Work-related lost productivity and its economic impact on Canadian patients with moderate to severe psoriasis. J Cutan Med Surg (2009) 13(4):192–7.
7. Wu Y, Mills D, Bala M. Impact of psoriasis on patients' work and productivity: a retrospective, matched case-control analysis. Am J Clin Dermatol (2009) 10(6):407–10.
8. Mehrmal S, Uppal P, Nedley N, Giesey RL, Delost GR. The global, regional, and national burden of psoriasis in 195 countries and territories, 1990 to 2017: A systematic analysis from the Global Burden of Disease Study 2017. J Am Acad Dermatol (2021) 84(1):46–52.
9. Krueger GG, Feldman SR, Camisa C, Duvic M, Elder JT, Gottlieb AB, et al. Two considerations for patients with psoriasis and their clinicians: what defines mild, moderate, and severe psoriasis? What constitutes a clinically significant improvement when treating psoriasis? J Am Acad Dermatol (2000) 43(2 Pt 1):281–5.
10. Langley RG, Krueger GG, Griffiths CE. Psoriasis: epidemiology, clinical features, and quality of life. Ann Rheum Dis (2005) 64 Suppl 2(Suppl 2):ii18–23.
11. Engin A. The definition and prevalence of obesity and metabolic syndrome. Adv Exp Med Biol (2017) 960:1–17.
13. Henes JC, Ziupa E, Eisfelder M, Adamczyk A, Knaudt B, Jacobs F, et al. High prevalence of psoriatic arthritis in dermatological patients with psoriasis: a cross-sectional study. Rheumatol Int (2014) 34(2):227–34.
14. Elmets CA, Leonardi CL, Davis DMR, Gelfand JM, Lichten J, Mehta NN, et al. Joint AAD-NPF guidelines of care for the management and treatment of psoriasis with awareness and attention to comorbidities. J Am Acad Dermatol (2019) 80(4):1073–113.
15. Mrowietz U, Elder JT, Barker J. The importance of disease associations and concomitant therapy for the long-term management of psoriasis patients. Arch Dermatol Res (2006) 298(7):309–19.
16. Thatiparthi A, Martin A, Liu J, Egeberg A, Wu JJ. Biologic treatment algorithms for moderate-to-severe psoriasis with comorbid conditions and special populations: a review. Am J Clin Dermatol (2021) 22(4):425–42.
17. Armstrong AW, Read C. Pathophysiology, clinical presentation, and treatment of psoriasis: a review. JAMA (2020) 323(19):1945–60.
18. Stiff KM, Glines KR, Porter CL, Cline A, Feldman SR. Current pharmacological treatment guidelines for psoriasis and psoriatic arthritis. Expert Rev Clin Pharmacol (2018) 11(12):1209–18.
19. SUMMARY OF PRODUCT CHARACTERISTICS-Cimzia. (2022). Available at: http://www.medicines.org.uk/emc/medicine/32367.
20. Cimzia Prescribing Information (2019). Available at: https://www.accessdata.fda.gov/drugsatfda_docs/label/2019/125160s237lbl.pdf.
21. ANNEX I-SUMMARY OF PRODUCT CHARACTERISTICS-Cimzia. (2014). Available at: https://www.ema.europa.eu/en/documents/product-information/cimzia-epar-product-information_en.pdf.
22. Gordon KB, Warren RB, Gottlieb AB, Blauvelt A, Thaci D, Leonardi C, et al. Long-term efficacy of certolizumab pegol for the treatment of plaque psoriasis: 3-year results from two randomized phase III trials (CIMPASI-1 and CIMPASI-2). Br J Dermatol (2021) 184(4):652–62.
23. Lebwohl M, Blauvelt A, Paul C, Sofen H, Weglowska J, Piguet V, et al. Certolizumab pegol for the treatment of chronic plaque psoriasis: Results through 48 weeks of a phase 3, multicenter, randomized, double-blind, etanercept- and placebo-controlled study (CIMPACT). J Am Acad Dermatol (2018) 79(2):266–276 e5.
24. Gottlieb AB, Blauvelt A, Thaci D, Leonardi CL, Poulin Y, Drew J, et al. Certolizumab pegol for the treatment of chronic plaque psoriasis: Results through 48 weeks from 2 phase 3, multicenter, randomized, double-blinded, placebo-controlled studies (CIMPASI-1 and CIMPASI-2). J Am Acad Dermatol (2018) 79(2):302–314 e6.
25. Blauvelt A, Reich K, Lebwohl M, Burge D, Arendt C, Peterson L, et al. Certolizumab pegol for the treatment of patients with moderate-to-severe chronic plaque psoriasis: pooled analysis of week 16 data from three randomized controlled trials. J Eur Acad Dermatol Venereol (2019) 33(3):546–52.
26. Blauvelt A, Paul C, van de Kerkhof P, Warren RB, Gottlieb AB, Langley RG, et al. Long-term safety of certolizumab pegol in plaque psoriasis: pooled analysis over 3 years from three phase III, randomized, placebo-controlled studies. Br J Dermatol (2021) 184(4):640–51.
27. Curtis JR, Mariette X, Gaujoux-Viala C, Blauvelt A, Kvien TK, Sandborn WJ, et al. Long-term safety of certolizumab pegol in rheumatoid arthritis, axial spondyloarthritis, psoriatic arthritis, psoriasis and Crohn's disease: a pooled analysis of 11 317 patients across clinical trials. RMD Open (2019) 5(1):e000942.
28. Blauvelt A, Strober B, Langley R, Kavanagh S, Arendt C, Boehnlein M, et al. Safety of Certolizumab pegol in plaque psoriasis: pooled 96-week data from three phase 3, multicenter, randomized, placebo-controlled studies (CIMPASI-1, CIMPASI-2 and CIMPACT). SKIN J Cutaneous Med (2019) 3:39.
29. Clowse ME, Forger F, Hwang C, Thorp J, Dolhain RJ, van Tubergen A, et al. Minimal to no transfer of certolizumab pegol into breast milk: results from CRADLE, a prospective, postmarketing, multicentre, pharmacokinetic study. Ann Rheum Dis (2017) 76(11):1890–6.
30. Mariette X, Forger F, Abraham B, Flynn AD, Molto A, Flipo RM, et al. Lack of placental transfer of certolizumab pegol during pregnancy: results from CRIB, a prospective, postmarketing, pharmacokinetic study. Ann Rheum Dis (2018) 77(2):228–33.
31. Porter C, Armstrong-Fisher S, Kopotsha T, Smith B, Baker T, Kevorkian L, et al. Certolizumab pegol does not bind the neonatal Fc receptor (FcRn): Consequences for FcRn-mediated in vitro transcytosis and ex vivo human placental transfer. J Reprod Immunol (2016) 116:7–12.
32. Pasut G. Pegylation of biological molecules and potential benefits: pharmacological properties of certolizumab pegol. BioDrugs (2014) 28 Suppl 1:S15–23.
33. Palframan R, Airey M, Moore A, Vugler A, Nesbitt A. Use of biofluorescence imaging to compare the distribution of certolizumab pegol, adalimumab, and infliximab in the inflamed paws of mice with collagen-induced arthritis. J Immunol Methods (2009) 348(1-2):36–41.
34. Carron P, Lambert B, Van Praet L, De Vos F, Varkas G, Jans L, et al. Scintigraphic detection of TNF-driven inflammation by radiolabelled certolizumab pegol in patients with rheumatoid arthritis and spondyloarthritis. RMD Open (2016) 2(1):e000265.
35. Swindell WR, Xing X, Stuart PE, Chen CS, Aphale A, Nair RP, et al. Heterogeneity of inflammatory and cytokine networks in chronic plaque psoriasis. PloS One (2012) 7(3):e34594.
36. Gunter NV, Yap BJM, Chua CLL, Yap WH. Combining understanding of immunological mechanisms and genetic variants toward development of personalized medicine for psoriasis patients. Front Genet (2019) 10:395.
37. Holford NHG, Hale M, Ko HC, Steimer J-L, Sheiner LB, Peck CC. Simulation in Drug Development: Good Practices. Publication of the Center for Drug Development Science (CDDS). Available at: https://holford.fmhs.auckland.ac.nz/docs/simulation-in-drug-development-good-practices.pdf (Accessed April 14, 2020).
38. Holford N, Ma SC, Ploeger BA. Clinical trial simulation: a review. Clin Pharmacol Ther (2010) 88(2):166–82.
39. Viceconti M, Henney A, Morley-Fletcher E. In silico clinical trials: how computer simulation will transform the biomedical industry. Int J Clin Trials (2016) 3(2):10.
40. Guidance for industry: population pharmacokinetics. (1999). US Food and Drug Administration website. Available at: https://www.fda.gov/media/71364/download (Accessed April 14, 2020).
41. Nguyen TH, Mouksassi MS, Holford N, Al-Huniti N, Freedman I, Hooker AC, et al. Model evaluation of continuous data pharmacometric models: metrics and graphics. CPT Pharmacometrics Syst Pharmacol (2017) 6(2):87–109.
42. Kirouac DC. How do we "Validate" a QSP model? CPT Pharmacometrics Syst Pharmacol (2018) 7(9):547–8.
43. Visser SAG, Norton JD, Marshall S, O'Kelly M. Common best practice in modeling and simulation across quantitative disciplines: a comparison of independently emerging proposals. Stat Biopharm Res (2018) 10(2):72–5.
44. Marshall SF, Hemmings R, Josephson F, Karlsson MO, Posch M, Steimer JL. Modeling and simulation to optimize the design and analysis of confirmatory trials, characterize risk-benefit, and support label claims. CPT Pharmacometrics Syst Pharmacol (2013) 2:e27.
45. Shepard. Role of Modelling and Simulation in Regulatory Decision Making in Europe. European Medicines Agency. (2011). Available at: https://www.ema.europa.eu/en/documents/presentation/presentation-role-modelling-simulation-regulatory-decision-making-europe_en.pdf.
46. Gutierrez-Casares JR, Quintero J, Jorba G, Junet V, Martinez V, Pozo-Rubio T, et al. Methods to develop an in silico clinical trial: computational head-to-head comparison of lisdexamfetamine and methylphenidate. Front Psychiatry (2021) 12:741170.
47. Araújo AR, Rosso N, Bedogni G, Tiribelli C, Bellentani S. Global epidemiology of non-alcoholic fatty liver disease/non-alcoholic steatohepatitis: What we need in the future. Liver Int (2018) 38 Suppl 1:47–51.
48. Kearney PM, Whelton M, Reynolds K, Muntner P, Whelton PK, He J. Global burden of hypertension: analysis of worldwide data. Lancet (2005) 365(9455):217–23.
49. Wild S, Roglic G, Green A, Sicree R, King H. Global prevalence of diabetes: estimates for the year 2000 and projections for 2030. Diabetes Care (2004) 27(5):1047–53.
50. World Health O. Depression and other common mental disorders: global health estimates. Geneva: World Health Organization (2017).
51. Jorba G, Aguirre-Plans J, Junet V, Segú-Vergés C, Ruiz JL, Pujol A, et al. In-silico simulated prototype-patients using TPMS technology to study a potential adverse effect of sacubitril and valsartan. PloS One (2020) 15(2):e0228926.
52. Segú-Vergés C, Coma M, Kessel C, Smeets S, Foell D, Aldea A. Application of systems biology-based in silico tools to optimize treatment strategy identification in Still's disease. Arthritis Res Ther (2021) 23(1):126.
53. Barrett T, Wilhite SE, Ledoux P, Evangelista C, Kim IF, Tomashevsky M, et al. NCBI GEO: archive for functional genomics data sets–update. Nucleic Acids Res (2013) 41(Database issue):D991–5.
54. Nair RP, Duffin KC, Helms C, Ding J, Stuart PE, Goldgar D, et al. Genome-wide scan reveals association of psoriasis with IL-23 and NF-kappaB pathways. Nat Genet (2009) 41(2):199–204.
55. Swindell WR, Johnston A, Carbajal S, Han G, Wohn C, Lu J, et al. Genome-wide expression profiling of five mouse models identifies similarities and differences with human psoriasis. PloS One (2011) 6(4):e18266.
56. Yao Y, Richman L, Morehouse C, de los Reyes M, Higgs BW, Boutrin A, et al. Type I interferon: potential therapeutic target for psoriasis? PloS One (2008) 3(7):e2737.
57. Kim J, Bissonnette R, Lee J, Correa da Rosa J, Suárez-Fariñas M, Lowes MA, et al. The spectrum of mild to severe psoriasis vulgaris is defined by a common activation of IL-17 pathway genes, but with key differences in immune regulatory genes. J Invest Dermatol (2016) 136(11):2173–82.
58. Junet V, Farrés J, Mas JM, Daura X. CuBlock: a cross-platform norMalization method for gene-expression microarrays. Bioinformatics (2021) 37(16):2365–73.
59. Mukherjee S, Tamayo P, Rogers S, Rifkin R, Engle A, Campbell C, et al. Estimating dataset size requirements for classifying DNA microarray data. J Comput Biol (2003) 10(2):119–42.
60. Figueroa RL, Zeng-Treitler Q, Kandula S, Ngo LH. Predicting sample size required for classification performance. BMC Med Inform Decis Mak (2012) 12:8.
61. Allen RJ, Rieger TR, Musante CJ. Efficient generation and selection of virtual populations in quantitative systems pharmacology models. CPT Pharmacometrics Syst Pharmacol (2016) 5(3):140–6.
62. ESS Round 7: European Social Survey Round 7 Data. Data file edition 2.2. NSD - Norwegian Centre for Research Data, Norway - Data Archive and distributor of ESS data for ESS ERIC. (2014). Available at: https://www.europeansocialsurvey.org/data/download.html?r=7.
63. Brochot C, Quindroit P. Modelling the Fate of Chemicals in Humans Using a Lifetime Physiologically Based Pharmacokinetic (PBPK) Model in MERLIN-Expo. In:Ciffroy P, Tediosi A, Capri E editors. Modelling the Fate of Chemicals in the Environment and the Human Body. Cham: Springer International Publishing (2018). p. 215–57.
64. Ciffroy P, Alfonso B, Altenpohl A, Banjac Z, Bierkens J, Brochot C, et al. Modelling the exposure to chemicals for risk assessment: a comprehensive library of multimedia and PBPK models for integration, prediction, uncertainty and sensitivity analysis - the MERLIN-Expo tool. Sci Total Environ (2016) 568:770–84.
65. Murphy JE. Clinical Pharmacokinetics. 6th Edition: American Society of Health-System Pharmacists. (2016). Available at: https://www.ashp.org/-/media/store-files/p5365-frontmatter.ashx.
67. ASSESSMENT REPORT FOR Cimzia. (2009). Available at: https://www.ema.europa.eu/en/documents/assessment-report/cimzia-epar-public-assessment-report_en.
68. van Eerden RAG, Oomen-de Hoop E, Noordam A, Mathijssen RHJ, Koolen SLW. Feasibility of extrapolating randomly taken plasma samples to trough levels for therapeutic drug monitoring purposes of small molecule kinase inhibitors. Pharm (Basel) (2021) 14(2).
69. The MathWorks Inc. MATLAB and SimBiology Toolbox Release 5.7. Natick, MA: The MathWorks Inc. (2017).
70. Artigas L, Coma M, Matos-Filipe P, Aguirre-Plans J, Farrés J, Valls R, et al. In-silico drug repurposing study predicts the combination of pirfenidone and melatonin as a promising candidate therapy to reduce SARS-CoV-2 infection progression and respiratory distress caused by cytokine storm. PloS One (2020) 15(10):e0240149.
71. Lozano ML, Segú-Vergés C, Coma M, Álvarez-Roman MT, González-Porras JR, Gutiérrez L, et al. Elucidating the mechanism of action of the attributed immunomodulatory role of eltrombopag in primary immune thrombocytopenia: an in silico approach. Int J Mol Sci (2021) 22(13).
72. Romeo-Guitart D, Forés J, Herrando-Grabulosa M, Valls R, Leiva-Rodríguez T, Galea E, et al. Neuroprotective drug for nerve trauma revealed using artificial intelligence. Sci Rep (2018) 8(1):1879.
73. Benjamini Y, Hochberg Y. Controlling the false discovery rate: a practical and powerful approach to multiple testing. J R Stat Society Ser B (Methodol) (1995) 57(1):289–300.
74. Jolliffe IT. Principal Component Analysis. Springer Series in Statistics book series (SSS). Springer (2002). Available at: https://www.academia.edu/35320533/Principal_Component_Analysis_Second_Edition.
76. Arthur D, Vassilvitskii S. k-means++: the advantages of careful seeding. In Proceedings of the eighteenth annual ACM-SIAM symposium on Discrete algorithms. New Orleans, Louisiana: Society for Industrial and Applied Mathematics (2007), p.1027–35.
77. Ciampi A, Lechevallier Y. Clustering Large, Multi-level Data Sets: An Approach Based on Kohonen Self Organizing Maps. Berlin, Heidelberg: Springer Berlin Heidelberg (2000).
80. Hastie T, TibshIrani R, Friedman JH. The elements of statistical learning : data mining, inference, and prediction : with 200 full-color illustrations. Springer series in statistics Vol. xvi. . New York: Springer (2001). 533 pages.
82. Davies DL, Bouldin DW. A cluster separation measure. IEEE Trans Pattern Anal Mach Intelligence PAMI- (1979) 1(2):224–7.
83. TibshIrani R, Walther G, Hastie T. Estimating the number of clusters in a data set via the gap statistic. J R Stat Society: Ser B (2001) 63(2):411–23.
84. Rousseeuw P. Silhouettes: A graphical aid to the interpretation and validation of cluster analysis. Comput. Appl. Math. 20, 53-65. J Comput Appl Math (1987) 20:53–65.
85. Banerjee A, Dave RN. Validating clusters using the Hopkins statistic, in: 2004 IEEE International Conference on Fuzzy Systems (IEEE Cat. No.04CH37542) (2004) 1:149–53.
87. Chung NC, Miasojedow B, Startek M, Gambin A. Jaccard/Tanimoto similarity test and estimation methods for biological presence-absence data. BMC Bioinf (2019) 20(Suppl 15):644.
88. Rivals I, Personnaz L, Taing L, Potier MC. Enrichment or depletion of a GO category within a class of genes: which test? Bioinformatics (2007) 23(4):401–7.
89. Kanehisa M, Goto S, Kawashima S, Nakaya A. The KEGG databases at GenomeNet. Nucleic Acids Res (2002) 30(1):42–6.
90. The Gene Ontology Resource: 20 years and still GOing strong. Nucleic Acids Res (2019) 47(D1):D330–8.
91. Han H, Cho JW, Lee S, Yun A, Kim H, Bae D, et al. TRRUST v2: an expanded reference database of human and mouse transcriptional regulatory interactions. Nucleic Acids Res (2018) 46(D1):D380–6.
92. Han H, Shim H, Shin D, Shim JE, Ko Y, Shin J, et al. TRRUST: a reference database of human transcriptional regulatory interactions. Sci Rep (2015) 5:11432.
93. Pujol A VJ, Alba JL. A supervised modification of the Hausdorff distance for visual shape classification. Int J Pattern Recognit Artif Intelligence. (2002) 16(3):349–59.
94. Shannon P, Markiel A, Ozier O, Baliga NS, Wang JT, Ramage D, et al. Cytoscape: a software environment for integrated models of biomolecular interaction networks. Genome Res (2003) 13(11):2498–504.
95. Cimzia Prescribing Information. (2017). Available at: https://www.accessdata.fda.gov/drugsatfda_docs/label/2017/125160s270lbl.pdf.
96. Abdallah MA, Abdel-Hamid MF, Kotb AM, Mabrouk EA. Serum interferon-gamma is a psoriasis severity and prognostic marker. Cutis (2009) 84(3):163–8.
97. Benoit S, Toksoy A, Ahlmann M, Schmidt M, Sunderkötter C, Foell D, et al. Elevated serum levels of calcium-binding S100 proteins A8 and A9 reflect disease activity and abnormal differentiation of keratinocytes in psoriasis. Br J Dermatol (2006) 155(1):62–6.
98. D'Amico F, Granata M, Skarmoutsou E, Trovato C, Lovero G, Gangemi P, et al. Biological therapy downregulates the heterodimer S100A8/A9 (calprotectin) expression in psoriatic patients. Inflammation Res (2018) 67(7):609–16.
99. Qian M, Song NJ. Serum calprotectin correlates with risk and disease severity in psoriasis patients and the decrease of calprotectin predicts better response to tumor necrosis factor inhibitors. Eur Rev Med Pharmacol Sci (2018) 22(13):4299–309.
100. Flisiak I, Zaniewski P, Rogalska M, Myśliwiec H, Jaroszewicz J, Chodynicka B. Effect of psoriasis activity on VEGF and its soluble receptors concentrations in serum and plaque scales. Cytokine (2010) 52(3):225–9.
101. Flisiak I, Zaniewski P, Rogalska-Taranta M, Chodynicka B. Effect of psoriasis therapy on VEGF and its soluble receptors serum concentrations. J Eur Acad Dermatol Venereol (2012) 26(3):302–7.
102. Nofal A, Al-Makhzangy I, Attwa E, Nassar A, Abdalmoati A. Vascular endothelial growth factor in psoriasis: an indicator of disease severity and control. J Eur Acad Dermatol Venereol (2009) 23(7):803–6.
103. Sankar L, Arumugam D, Boj S, Pradeep P. Expression of angiogenic factors in Psoriasis vulgaris. J Clin Diagn Res (2017) 11(3):EC23–7.
104. Okan G, Baki AM, Yorulmaz E, Doğru-Abbasoğlu S, Vural P. Serum visfatin, fetuin-A, and pentraxin 3 levels in patients with psoriasis and their relation to disease severity. J Clin Lab Anal (2016) 30(4):284–9.
105. Hodeib AA, Neinaa YME, Zakaria SS, Alshenawy HA. Glucose transporter-1 (GLUT-1) expression in psoriasis: correlation with disease severity. Int J Dermatol (2018) 57(8):943–51.
106. Dilmé-Carreras E, Martín-Ezquerra G, Sánchez-Regaña M, Umbert-Millet P. Serum prolactin levels in psoriasis and correlation with cutaneous disease activity. Clin Exp Dermatol (2011) 36(1):29–32.
107. Voznyak IY, Syzon О, Dashko MO. Specific nature of changes in main immunohistochemical parameters of neoangiogenesis in patients with psoriasis. Wiad Lek (2018) 71(3 pt 2):658–62.
108. Uaratanawong R, Uaratanawong S, Chunhasewee C, Chawvavanich P. High sensitivity C-reactive protein level and psoriasis severity in Thai patients. J Med Assoc Thai (2016) 99(9):1039–45.
109. Chandrashekar L, Kumarit GR, Rajappa M, Revathy G, Munisamy M, Thappa DM. 25-hydroxy vitamin D and ischaemia-modified albumin levels in psoriasis and their association with disease severity. Br J BioMed Sci (2015) 72(2):56–60.
110. Chandrashekar L, Rajappa M, Revathy G, Sundar I, Munisamy M, Ananthanarayanan PH, et al. Is enhanced platelet activation the missing link leading to increased cardiovascular risk in psoriasis? Clin Chim Acta (2015) 446:181–5.
111. Boehncke S, Salgo R, Garbaraviciene J, Beschmann H, Hardt K, Diehl S, et al. Effective continuous systemic therapy of severe plaque-type psoriasis is accompanied by amelioration of biomarkers of cardiovascular risk: results of a prospective longitudinal observational study. J Eur Acad Dermatol Venereol (2011) 25(10):1187–93.
112. Yousefzadeh H, Jabbari Azad F, Banihashemi M, Rastin M, Mahmoudi M. Evaluation of psoriasis severity and inflammatory responses under concomitant treatment with methotrexate plus micronutrients for psoriasis vulgaris: a randomized double blind trial. Acta Dermatovenerol Alp Pannonica Adriat (2017) 26(1):3–9.
113. Tamilselvi E, Haripriya D, Hemamalini M, Pushpa G, Swapna S. Association of disease severity with IL-1 levels in methotrexate-treated psoriasis patients. Scand J Immunol (2013) 78(6):545–53.
114. Xue K, Liu H, Jian Q, Liu B, Zhu D, Zhang M, et al. Leptin induces secretion of pro-inflammatory cytokines by human keratinocytes in vitro–a possible reason for increased severity of psoriasis in patients with a high body mass index. Exp Dermatol (2013) 22(6):406–10.
115. Takahashi H, Tsuji H, Hashimoto Y, Ishida-Yamamoto A, Iizuka H. Serum cytokines and growth factor levels in Japanese patients with psoriasis. Clin Exp Dermatol (2010) 35(6):645–9.
116. Sereflican B, Goksugur N, Bugdayci G, Polat M, Haydar Parlak A. Serum visfatin, adiponectin, and tumor necrosis factor alpha (TNF-α) levels in patients with psoriasis and their correlation with disease severity. Acta Dermatovenerol Croat (2016) 24(1):13–9.
117. OECD. Obesity Update 2017 (2017). Available at: www.oecd.org/health/obesity-update.htm.
118. Sciutto E, Fragoso G, Trueba L, Lemus D, Montoya RM, Diaz ML, et al. Cysticercosis vaccine: cross protecting immunity with T. solium antigens against experimental murine T. crassiceps cysticercosis. Parasite Immunol (1990) 12(6):687–96.
119. Cai Y, Xue F, Quan C, Qu M, Liu N, Zhang Y, et al. A critical role of the IL-1β-IL-1R signaling pathway in skin inflammation and psoriasis pathogenesis. J Invest Dermatol (2019) 139(1):146–56.
120. Uysal S, Yılmaz FM, Karatoprak K, Artüz F, Cumbul NU. The levels of serum pentraxin3, CRP, fetuin-A, and insulin in patients with psoriasis. Eur Rev Med Pharmacol Sci (2014) 18(22):3453–8.
121. Koike A, Arai S, Yamada S, Nagae A, Saita N, Itoh H, et al. Dynamic mobility of immunological cells expressing S100A8 and S100A9 in vivo: a variety of functional roles of the two proteins as regulators in acute inflammatory reaction. Inflammation (2012) 35(2):409–19.
122. Simard JC, Girard D, Tessier PA. Induction of neutrophil degranulation by S100A9 via a MAPK-dependent mechanism. J Leukoc Biol (2010) 87(5):905–14.
123. Uluçkan Ö, Wagner EF. Role of IL-17A signalling in psoriasis and associated bone loss. Clin Exp Rheumatol (2016) 34(4 Suppl 98):17–20.
124. Tohyama M, Matsumoto A, Tsuda T, Dai X, Shiraishi K, Sayama K. Suppression of IL-17A-induced CCL20 production by cytokine inducible SH2-containing protein 1 in epidermal keratinocytes. J Dermatol Sci (2021) 101(3):202–9.
126. Woo YR, Cho DH, Park HJ. Molecular mechanisms and management of a cutaneous inflammatory disorder: psoriasis. Int J Mol Sci (2017) 18(12).
127. Tonel G, Conrad C. Interplay between keratinocytes and immune cells–recent insights into psoriasis pathogenesis. Int J Biochem Cell Biol (2009) 41(5):963–8.
128. Heidenreich R, Röcken M, Ghoreschi K. Angiogenesis drives psoriasis pathogenesis. Int J Exp Pathol (2009) 90(3):232–48.
129. Chua RA, Arbiser JL. The role of angiogenesis in the pathogenesis of psoriasis. Autoimmunity (2009) 42(7):574–9.
130. Abdel Hay RM, Rashed LA. Association between the leptin gene 2548G/A polymorphism, the plasma leptin and the metabolic syndrome with psoriasis. Exp Dermatol (2011) 20(9):715–9.
131. Baran A, Flisiak I, Jaroszewicz J, Świderska M. Effect of psoriasis activity on serum adiponectin and leptin levels. Postepy Dermatol Alergol (2015) 32(2):101–6.
132. Jara LJ, Lavalle C, Fraga A, Gómez-Sanchez C, Silveira LH, Martínez-Osuna P, et al. Prolactin, immunoregulation, and autoimmune diseases. Semin Arthritis Rheum (1991) 20(5):273–84.
133. Zhang Z, Zi Z, Lee EE, Zhao J, Contreras DC, South AP, et al. Differential glucose requirement in skin homeostasis and injury identifies a therapeutic target for psoriasis. Nat Med (2018) 24(5):617–27.
134. Cibrian D, de la Fuente H, Sánchez-Madrid F. Metabolic pathways that control skin homeostasis and inflammation. Trends Mol Med (2020) 26(11):975–86.
135. Macintyre AN, Gerriets VA, Nichols AG, Michalek RD, Rudolph MC, Deoliveira D, et al. The glucose transporter Glut1 is selectively essential for CD4 T cell activation and effector function. Cell Metab (2014) 20(1):61–72.
136. Buck MD, O'Sullivan D, Pearce EL. T cell metabolism drives immunity. J Exp Med (2015) 212(9):1345–60.
137. Singh S, Facciorusso A, Singh AG, Vande Casteele N, Zarrinpar A, Prokop LJ, et al. Obesity and response to anti-tumor necrosis factor-α agents in patients with select immune-mediated inflammatory diseases: A systematic review and meta-analysis. PloS One (2018) 13(5):e0195123.
138. Paroutoglou K, Papadavid E, Christodoulatos GS, Dalamaga M. Deciphering the association between psoriasis and obesity: current evidence and treatment considerations. Curr Obes Rep (2020) 9(3):165–78.
139. Van Voorhees AS, Mason MA, Harrold LR, Guo N, Guana A, Tian H, et al. Characterization of insufficient responders to anti-tumor necrosis factor therapies in patients with moderate to severe psoriasis: real-world data from the US Corrona Psoriasis Registry. J Dermatolog Treat (2021) 32(3):302–9.
140. Shary N, Kalb RE. Optimizing the treatment of moderate-to-severe psoriasis in older adults. Drugs Aging (2020) 37(10):715–23.
141. Tanaka Y, Atsumi T, Yamamoto K, Takeuchi T, Yamanaka H, Ishiguro N, et al. Factors associated with successful discontinuation of certolizumab pegol in early rheumatoid arthritis. Int J Rheum Dis (2020) 23(3):316–24.
142. Maksymowych WP, Kumke T, Auteri SE, Hoepken B, Bauer L, Rudwaleit M. Predictors of long-term clinical response in patients with non-radiographic axial spondyloarthritis receiving certolizumab pegol. Arthritis Res Ther (2021) 23(1):274.
143. Bilgin E, Farisoğulları B, Armağan B, Sarı A, Yardımcı GK, Bölek E, et al. Predictors of drug retention and treatment response in axial spondyloarthritis patients treated with certolizumab: real-life results from the HURBIO registry. Clin Exp Rheumatol (2020) 38(4):609–14.
144. Salah LA, Gillstedt M, Osmancevic A. A retrospective study of patients with psoriasis treated with biologics: relation to body mass index and gender. Acta Derm Venereol (2016) 96(7):974–5.
145. Garber C, Saraiya A, Au S-C, Argobi Y, Mansfield R, Smith N, et al. Analysis of gender differences in the efficacy of psoriasis treatment modalities resulting in clearance. Psoriasis Forum (2015) 21a(1):28–34.
146. van der Schoot LS, van den Reek J, Groenewoud JMM, Otero ME, Njoo MD, Ossenkoppele PM, et al. Female patients are less satisfied with biological treatment for psoriasis and experience more side-effects than male patients: results from the prospective BioCAPTURE registry. J Eur Acad Dermatol Venereol (2019) 33(10):1913–20.
147. Gniadecki R, Kragballe K, Dam TN, Skov L. Comparison of drug survival rates for adalimumab, etanercept and infliximab in patients with psoriasis vulgaris. Br J Dermatol (2011) 164(5):1091–6.
148. Esposito M, Gisondi P, Cassano N, Ferrucci G, Del Giglio M, Loconsole F, et al. Survival rate of antitumour necrosis factor-α treatments for psoriasis in routine dermatological practice: a multicentre observational study. Br J Dermatol (2013) 169(3):666–72.
149. Conrad C, Boyman O, Tonel G, Tun-Kyi A, Laggner U, de Fougerolles A, et al. Alpha1beta1 integrin is crucial for accumulation of epidermal T cells and the development of psoriasis. Nat Med (2007) 13(7):836–42.
150. Bata-Csorgo Z, Cooper KD, Ting KM, Voorhees JJ, Hammerberg C. Fibronectin and alpha5 integrin regulate keratinocyte cell cycling. A mechanism for increased fibronectin potentiation of T cell lymphokine-driven keratinocyte hyperproliferation in psoriasis. J Clin Invest (1998) 101(7):1509–18.
151. Li J, Chen Y, Tiwari M, Bansal V, Sen GL. Regulation of integrin and extracellular matrix genes by HNRNPL is necessary for epidermal renewal. PloS Biol (2021) 19(9):e3001378.
152. Ho TC, Yeh SI, Chen SL, Tsao YP. The psoriasis therapeutic potential of a novel short laminin peptide C16. Int J Mol Sci (2019) 20(13).
153. Gupta G, Singh Y, Tiwari J, Raizaday A, Alharbi KS, Al-Abbasi FA, et al. Beta-catenin non-canonical pathway: A potential target for inflammatory and hyperproliferative state via expression of transglutaminase 2 in psoriatic skin keratinocyte. Dermatol Ther (2020) 33(6):e14209.
154. Yu X, Yan N, Li Z, Hua Y, Chen W. FGF19 sustains the high proliferative ability of keratinocytes in psoriasis through the regulation of Wnt/GSK-3β/β-catenin signalling via FGFR4. Clin Exp Pharmacol Physiol (2019) 46(8):761–9.
155. Xue Y, Liu Y, Bian X, Zhang Y, Li Y, Zhang Q, et al. miR-205-5p inhibits psoriasis-associated proliferation and angiogenesis: Wnt/β-catenin and mitogen-activated protein kinase signaling pathway are involved. J Dermatol (2020) 47(8):882–92.
156. Wang Y, Cao Y. miR-145-5p inhibits psoriasis progression by regulating the Wnt/β-catenin pathway. Am J Transl Res (2021) 13(9):10439–48.
157. Cici D, Corrado A, Rotondo C, Cantatore FP. Wnt signaling and biological therapy in rheumatoid arthritis and spondyloarthritis. Int J Mol Sci (2019) 20(22).
158. Heiland GR, Zwerina K, Baum W, Kireva T, Distler JH, Grisanti M, et al. Neutralisation of Dkk-1 protects from systemic bone loss during inflammation and reduces sclerostin expression. Ann Rheum Dis (2010) 69(12):2152–9.
159. Szentpetery A, Bhattoa H, Antal-Szalmás P, Szekanecz Z, Fitzgerald O. Wnt pathway inhibitors in patients with psoriatic and rheumatoid arthritis treated with anti-TNF therapy. Irish J Med Sci (2013) 182:S105–6.
160. Mann DL, Popovic M, Sarin P, Murray C, Reitz MS, Strong DM, et al. Cell lines producing human T-cell lymphoma virus show altered HLA expression. Nature (1983) 305(5929):58–60.
161. Wang SY, Liu YY, Ye H, Guo JP, Li R, Liu X, et al. Circulating Dickkopf-1 is correlated with bone erosion and inflammation in rheumatoid arthritis. J Rheumatol (2011) 38(5):821–7.
162. Chung Y, Li ZC, Sun XL, Liu YY, Shao M, Gan YZ, et al. Elevated serum Dickkopf-1 is a biomarker for bone erosion in patients with psoriatic arthritis. Chin Med J (Engl) (2021) 134(21):2583–8.
163. Tian F, Mauro TM, Li Z. The pathological role of Wnt5a in psoriasis and psoriatic arthritis. J Cell Mol Med (2019) 23(9):5876–83.
164. Gudjonsson JE, Johnston A, Stoll SW, Riblett MB, Xing X, Kochkodan JJ, et al. Evidence for altered Wnt signaling in psoriatic skin. J Invest Dermatol (2010) 130(7):1849–59.
Keywords: psoriasis, anti-TNF, certolizumab pegol, mathematical modelling, virtual population, mechanism of action
Citation: Coto-Segura P, Segú-Vergés C, Martorell A, Moreno-Ramírez D, Jorba G, Junet V, Guerri F, Daura X, Oliva B, Cara C, Suárez-Magdalena O, Abraham S and Mas JM (2023) A quantitative systems pharmacology model for certolizumab pegol treatment in moderate-to-severe psoriasis. Front. Immunol. 14:1212981. doi: 10.3389/fimmu.2023.1212981
Received: 27 April 2023; Accepted: 07 August 2023;
Published: 20 September 2023.
Edited by:
Ryuji Kato, Nagoya University, JapanReviewed by:
Ming Zheng, Institute of Military Cognition and Brain Sciences, ChinaCopyright © 2023 Coto-Segura, Segú-Vergés, Martorell, Moreno-Ramírez, Jorba, Junet, Guerri, Daura, Oliva, Cara, Suárez-Magdalena, Abraham and Mas. This is an open-access article distributed under the terms of the Creative Commons Attribution License (CC BY). The use, distribution or reproduction in other forums is permitted, provided the original author(s) and the copyright owner(s) are credited and that the original publication in this journal is cited, in accordance with accepted academic practice. No use, distribution or reproduction is permitted which does not comply with these terms.
*Correspondence: Antonio Martorell, YW50bWFydG9AaG90bWFpbC5jb20=
†These authors have contributed equally to this work and share first authorship
‡ORCID: Antonio Martorrel, orcid.org/0000-0003-1378-1590
Disclaimer: All claims expressed in this article are solely those of the authors and do not necessarily represent those of their affiliated organizations, or those of the publisher, the editors and the reviewers. Any product that may be evaluated in this article or claim that may be made by its manufacturer is not guaranteed or endorsed by the publisher.
Research integrity at Frontiers
Learn more about the work of our research integrity team to safeguard the quality of each article we publish.