 Yujie Lu1†
 Dingyi Gu1†
 Chenyi Zhao1Ying Sun1
 Wenjing Li2
 Lulu He1
 Xiaoyan Wang1Zhongyang Kou3Jiang Su3*Feng Guo1*
- 1Department of Oncology, The Affiliated Suzhou Hospital of Nanjing Medical University, Suzhou Municipal Hospital, Gusu School, Nanjing Medical University, Suzhou, China
- 2Department of Clinical Laboratory, The Affiliated Suzhou Hospital of Nanjing Medical University, Suzhou Municipal Hospital, Gusu School, Nanjing Medical University, Suzhou, China
- 3Department of General Surgery, The Affiliated Suzhou Hospital of Nanjing Medical University, Suzhou Municipal Hospital, Gusu School, Nanjing Medical University, Suzhou, China
Background: Compared to other subtypes, the CMS4 subtype is associated with lacking of effective treatments and poorer survival rates.
Methods: A total of 24 patients with CRC were included in this study. DNA and RNA sequencing were performed to acquire somatic mutations and gene expression, respectively. MATH was used to quantify intratumoral heterogeneity. PPI and survival analyses were performed to identify hub DEGs. Reactome and KEGG analyses were performed to analyze the pathways of mutated or DEGs. Single-sample gene set enrichment analysis and Xcell were used to categorize the infiltration of immune cells.
Results: The CMS4 patients had a poorer PFS than CMS2/3. CTNNB1 and CCNE1 were common mutated genes in the CMS4 subtype, which were enriched in Wnt and cell cycle signaling pathways, respectively. The MATH score of CMS4 subtype was lower. SLC17A6 was a hub DEG. M2 macrophages were more infiltrated in the tumor microenvironment of CMS4 subtype. The CMS4 subtype tended to have an immunosuppressive microenvironment.
Conclusion: This study suggested new perspectives for exploring therapeutic strategies for the CMS4 subtype CRC.
1 Introduction
According to the National Cancer Center of China, colorectal cancer (CRC) has the second highest incidence among all malignant tumors and is the fourth leading cause of cancer-associated mortality (1). CRC can be divided into different subtypes based on different standards. Tumor node metastasis (TNM) classification and Duke’s classification are traditional classification models for CRC, according to infiltration depth of tumor and metastasis (2). TNM classification is applied predominantly to predict the prognosis of CRC patients (3), as well as to guide the choice of therapeutic schedule.
With the development of medical technology, it has entered into the stage of precise diagnosis and treatment. Genetic variation of different molecular, such as KRAS, NRAS, BRAF, Her2 and MSI-H, has been applied to guide clinical treatment and prognosis. It has been proved that KRAS/NRAS/BRAF wild-type patients have a better prognosis than KRAS/NRAS/BRAF mutated ones. Bazan et al. compared 74 KRAS mutated patients with 86 KRAS wild-type and found that patients with codon 13 KRAS mutation were related to risk of relapse or death independently (4). Schirripa et al. found that compared to all wild-type patients, RAS mutation were related to shorter overall survival (5). KRAS/NRAS/BRAF wild-type patients had a better prognosis when treated with monoclonal antibodies to the epithelial growth factor receptor (EGFR) and chemotherapy than treated with chemotherapy only. While addition of Cetuximab to standard chemotherapy couldn’t benefit RAS mutated patients (6, 7). What’s more, part of patients with BRAF V600E mutation can benefit from combination therapy including EGFR and BRAF inhibitors (8).
The consensus molecular subtype (CMS) is a developed classification model defined by Guinney et al. in 2015 and is determined by transcriptomic analyses (9). Although the CMS system was originally developed to classify early-stage non-metastatic CRC, it was used to classify metastasis CRC (mCRC) patients in recent several clinical trials (10, 11). CMS can be classified into four subtypes according to the transcriptomics of CRC. Immunohistochemistry of five markers, including ZEB1, FRMD6, KER, CDX2 and HTR2B, can also be used to identify CMS1-4 subtypes (12). Expression of CDX2 is higher in epithelial-like tumor (CMS2/3), while expression of HTR2B and FRMD6 is higher in mesenchymal-like tumor (CMS4). These five markers can be applied to differentiate mesenchymal from epithelial tumor (12). Suggested by the GALGB/SWOG 80405 trial, CMS2 is the most common subtype both in total and left-sided mCRC, while CMS1 is most common in right-sided mCRC (13).
Compared to the other three subtypes, the CMS4 subtype is revealed to possess high somatic copy number alterations, upregulation of genes related to epithelial mesenchymal transformation (EMT), activation of angiogenesis, transforming growth factor β (TGF-β) signaling and matrix remodeling pathways, notable stromal infiltration. In addition, the CMS4 subtype is also reported to show upregulation of integrin-β3, wound-like responses upregulation and a platelet activation signature (14). Importantly, the CMS4 subtype is confirmed to have poorer OS and relapse-free survival, and is associated with a higher risk of recurrence (15).
There are currently no effective therapies for the majority of mCRC patients, especially CMS4 patients. In the AGITG MAX trial, there is no significance in PFS can be found for the addition of bevacizumab to chemotherapy in CMS4 (16). Most mCRC patients with peritoneal metastases belong to the CMS4 subtype and show resistance to oxaliplatin (17). Compared to CMS2/3 patients treated with first-line chemotherapy, CMS4 patients can’t benefit from the combination of bevacizumab with chemotherapy (18). Thus, the CMS4 subtype is generally considered to be related to therapy resistance (19). Few studies have investigated the genetic landscape and its association with CMS4 and few potential mechanism for the phenomena has been reported.
In this study, we investigated the molecular landscape and profiled gene expression in mCRC with CMS4 subtype. FBXW7 and CARD11 mutation only occurred in the CMS2/3 subtypes, while CTNNB1, CDH1 and CCNE1 mutation merely occurred in CMS4. Mutated genes in CMS4 subtypes were enriched in Wnt signalosome, cellular localization, androgen receptor binding and signaling by FGFR1 pathway, etc. Notch pathway was enriched in the CMS2/3 subtype, while Wnt and cell cycle pathway was enriched in the CMS4 subtype. MATH was found significantly lower in the CMS4 subtype than in CMS2/3. We also first identified a PFS-related gene, several immune-related genes and immunologic signature gene in the CMS4 subtype. It was indicated that the CMS4 group had an immunosuppressive microenvironment. The discovery of our study may guide the select of treatment for CMS4 patients and allow more patients benefit from it in the future.
2 Methods
2.1 Immunohistochemical staining of tumor specimens
Paraffin-embedded specimens were cut into 4 μm thick sections, baked at 65°C for 60 min, and deparaffinized using leicaBondMax (Leica Biosystems, Wetzlar, Germany). Antigen retrieval was performed in BOND Epitope Retrieval Solution 2 (Cat. No. AR9640, pH9.0, Leica) by heating at 100°C for 20 min. Sections were incubated in 3% hydrogen peroxide for 5 min and rinsed with phosphate buffered saline (PBS). Sections were incubated with anti-FRMD6/Willin antibody (ab218209, dilution 1:150, Abcam, Shanghai, China), Anti-5-HT-2B antibody (HPA012867, dilution 1:2000, Merck, Beijing, China), Anti-CDX2 antibody [EPR2764Y] (ab76541, dilution 1:2000, Abcam, Shanghai, China), Anti-ZEB1 antibody [EPR17375] (ab203829, dilution 1:150, Abcam, Shanghai, China), Anti-pan Cytokeratin antibody [AE1/AE3] (ab27988, dilution 1:100, Abcam, Shanghai, China) for 20 min, respectively. Sections were washed by PBS, followed by incubation with primary antibody at 25°C for 10 min, washing by PBS, and incubation with secondary antibody at 25°C for 10 min. Finally, 3,3’-diaminobenzidine tetrahydrochloride (DAB) staining was performed at 25°C for 10 min and incubated by Hematoxylin for 5 min before sealing the sections.
2.2 Patients
Clinicopathological data of 24 patients with mCRC were obtained from the Department of Oncology, the Affiliated Suzhou Hospital of Nanjing Medical University. The patients were divided into two groups (G1 (CMS2/3) and G2 (CMS4)) according to an online IHC mini classifier tool (20) after acquiring IHC staining of FRMD6, ZEB1, HTR2B, CDX2 and KER in tumor specimens (Figure S1). Meanwhile, the CMS classification was also separately verified by the CMScaller R package (21) based on transcriptome data. The inclusion criteria were as follows: 1) aged between 18 and 80 years, 2) CRC as the only tumor, 3) confirmed by histopathological diagnosis, 4) treated with standard regimens, 5) CMS1 excluded, and 6) detailed clinical pathology information. All specimens were performed for DNA and RNA analyses, and DNA data of 13 specimens was further analyzed. Written informed consent to participate in the study was obtained from the patients. This study was approved by the ethics board of the Affiliated Suzhou Hospital of Nanjing Medical University (approval number: KL901250).
2.3 Targeted DNA sequencing and data analysis
Genomic DNA was acquired from formalin-fixed, paraffin-embedded (FFPE) specimens using the Tianquick FFPE DNA Kit (Beijing, China) following the manual guide. The DNA was quantified using a Qubit dsDNA HS assay kit (ThermoFisher Scientific, Waltham, MA, USA). After shearing the genomic DNA into 150-200 bp fragments using a Covaris M220 Focused-ultrasonicator (Covaris, Woburn, MA, USA), the fragmented DNA was used for library generation per the KAPA HTP Library Preparation Kit (KAPA Biosystems, Wilmington, MA, USA). The DNA library was hybridized using a 579-gene panel (Genecast, Wuxi, China) and sequenced I Illumina Novaseq platform (Illumina, San Diego, CA, USA). For somatic mutation calling, raw data were de-multiplexed. After removing low-quality reads, reads were aligned to the hg19 reference genome using BWA MEM and the aligned sequence was indexed using Samtools. Tumor tissues were analyzed using matched blood samples as controls. Somatic mutations analyzed by Varscan2 were defined as follows: 1) in exonic regions; 2) with a depth of ≥ 100× and an allele frequency of ≥ 5%; and 3) with an allele frequency of ≥ 0.2% in the Exome Aggregation Consortium and the Genome Aggregation Database. The calculation of MATH scores was referenced to Rocco et al. (22). Tumor mutation burden (TMB) (mutations/Mb) was calculated using algorithm as reported by Chalmers et al. (23). Nonsynonymous somatic mutations (variant frequencies no less than 5%) at the exonic and splicing regions were quantified. The total number of mutations counted was divided based on the size of the coding region of the targeted panel to calculate the TMB per megabase.
2.4 RNA sequencing and data analysis
RNA was acquired from FFPE samples using Rneasy FFPE Kit (Qiagen, Germantown, MA, USA). The RNA quality was assessed on a 2100 Bioanalyzer (Agilent Technologies, Santa Clara, CA, USA). Samples with high quality of RNA (with DV200 ≥ 25%) were used for subsequent experiments. The mRNA libraries were prepared using the NEBNext® Ultra™ RNA Library Prep Kit and they were sequenced on the Illumina NovaSeq platform. Raw reads were processed to remove low quality sequences (de-junction contamination, rRNA removal, etc). For gene expression analysis, clean reads were aligned to the reference human genome (hg19) using HISAT2 25751142 (http://ccb.jhu.edu/software/hisat2/index.shtml). Transcript assembly was performed using StringTie51 (v1.2.3). FeatureCounts (24) was used to estimate the expression level of each gene. Gene expression was determined by HTSeq. The quantification of gene expression was determined by fragments per kilobase per million mapped reads. We used the DESseq2 package (25) in the R software to screen differentially expressed genes between comparisons. Data were normalized by a negative binomial distribution statistical method. The resulting P values were subjected to multiple test corrections according to the Benjamini and Hochberg methods to exclude false positives. Genes, with |log2(fold change)| > 1 and P < 0.05, were defined as differentially expressed genes (DEGs) by DESseq.
2.5 Protein network analysis
For protein network analysis, protein-protein interaction (PPI) network data were obtained to retrieve the Interacting Genes (STRING; https://string-db.org/). An interaction score of > 0.4 was set as the threshold. The PPI network was envisioned by Cytoscape, and hub genes were identified by CytoHubba (26).
2.6 Tumor immune microenvironment analysis
For tumor immune composition analysis, gene set enrichment analysis (GSEA) was performed using GSEA tools (http://www.broadinstitute.org/gsea). Innate anti-PD-1 resistance (IPRES) data were downloaded from http://software.broadinstitute.org/gsea/msigdb (27). Single-sample gene set enrichment analysis (ssGSEA) and Xcell were used to quantify the infiltration of different types of immune cells.
2.7 Statistical analysis
Statistics was conducted by R package (version 4.0, https://cran.r-project.org/), and different groups were analyzed using Fisher’s exact test. Student’s t-test and chi-square test were used to analyze clinical characteristics and categorical variables, respectively. Kaplan–Meier curves were used to predict PFS and compared statistically using log-rank test (28, 29). Statistical significance was set at P < 0.05.
3 Results
3.1 Clinicopathological characteristics
Patients are classified into two groups according to the IHC expression and the transcriptome-based CMS classification, G1 and G2, represents CMS2/3 and CMS4 subtypes, respectively. The clinicopathological characteristics of CRC patients in the G1 and G2 groups are shown in Table 1. The median age is 56 years in both groups (P=0.70). 11 males and 4 females are in the G1 group, while 4 males and 5 females in G2. Most patients are adenocarcinomas (87.5%, 21/24) and others are signet ring cell carcinoma (2/24) and cancerization (1/24). All the G2 patients are adenocarcinomas. Ninety percent of the lesions are located on the left side of colon (21/24). The Eastern Cooperative Oncology Group (ECOG) performance status (PS) score of most patients are lower than 2 (87.5%, 21/24). Mutations in the KRAS, NARS and BRAF genes are more common in the G2 group than those in the G1 group (88.9% vs. 40.0%, P=0.02). The median values of tumor mutational burden (TMB) of the G1 group are 5.3, while those of the G2 group are 3.9 (P=0.31). Among all clinicopathological characteristics, only mutation type is statistically different between the two groups.
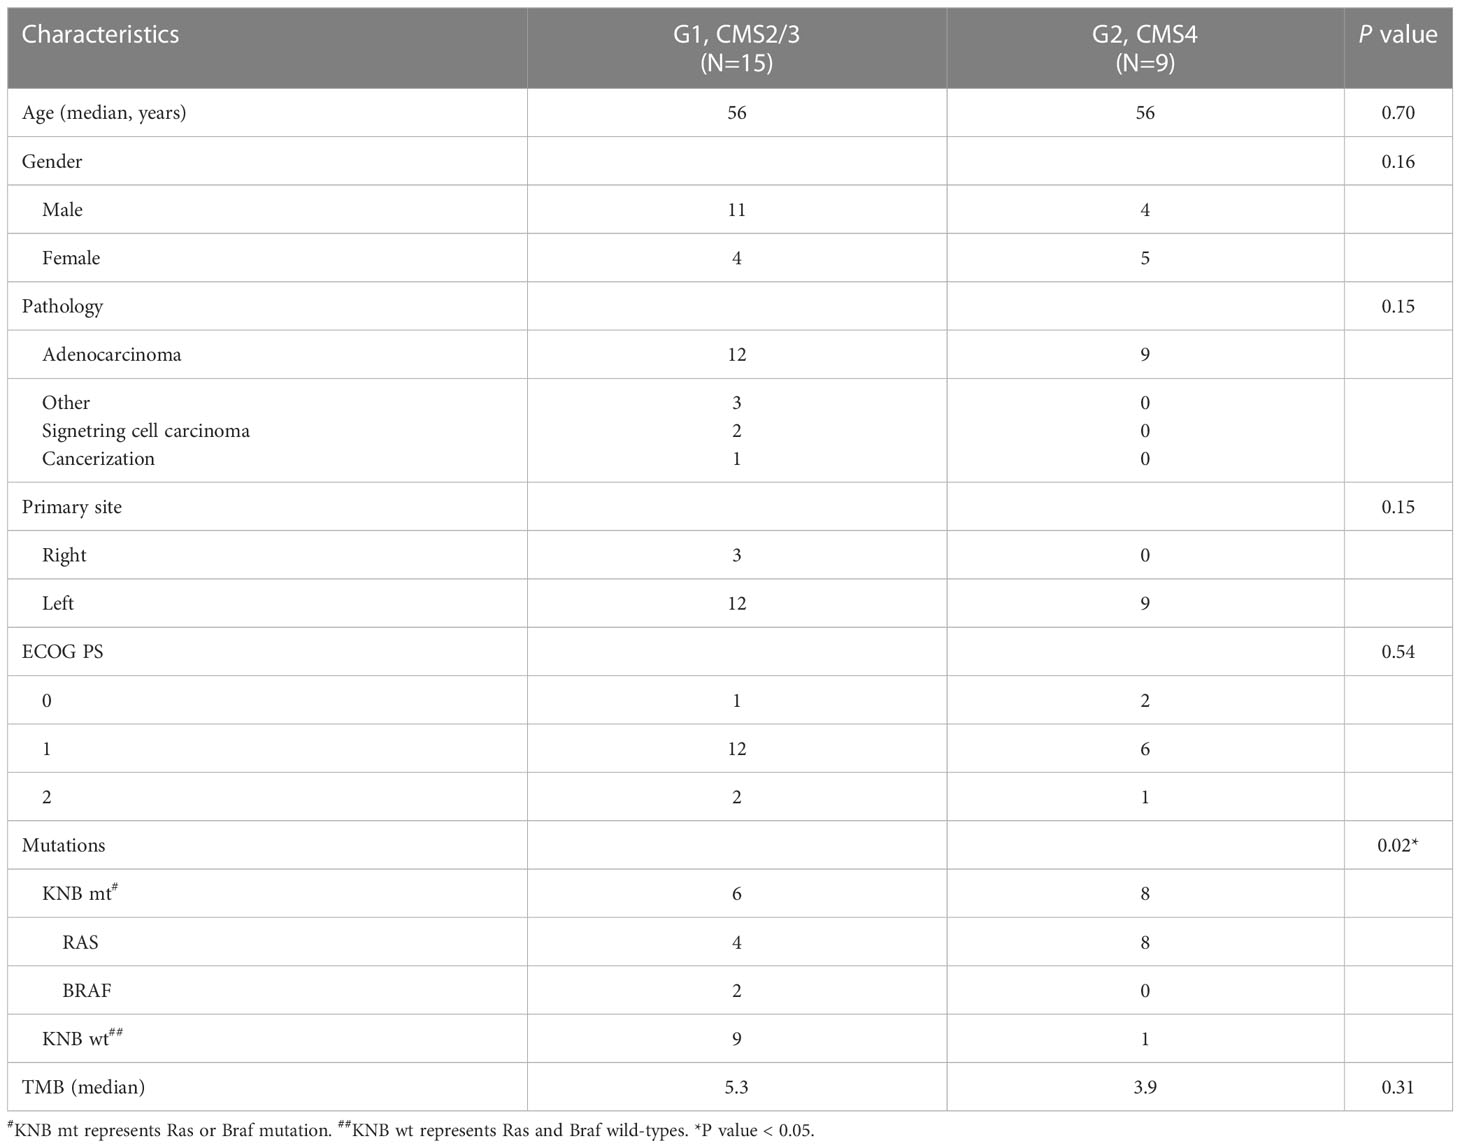
Table 1 Clinicopathological characteristics of the G1 and G2 patients.
As shown in Figure 1A, the PFS of the G2 group (7.0 months) is significantly shorter than that of the G1 group (14.0 months, P=0.041). Compared to patients with KRAS, NRAS and BRAF wild-types (15.0 months), those carrying the RAS (8.0 months) or BRAF (7.5 months) mutations have shorter PFS (P=0.008, Figure 1B). Patients treated with cetuximab and chemotherapy have a significantly longer PFS than those treated with bevacizumab and chemotherapy (P=0.047, Figure 1C).
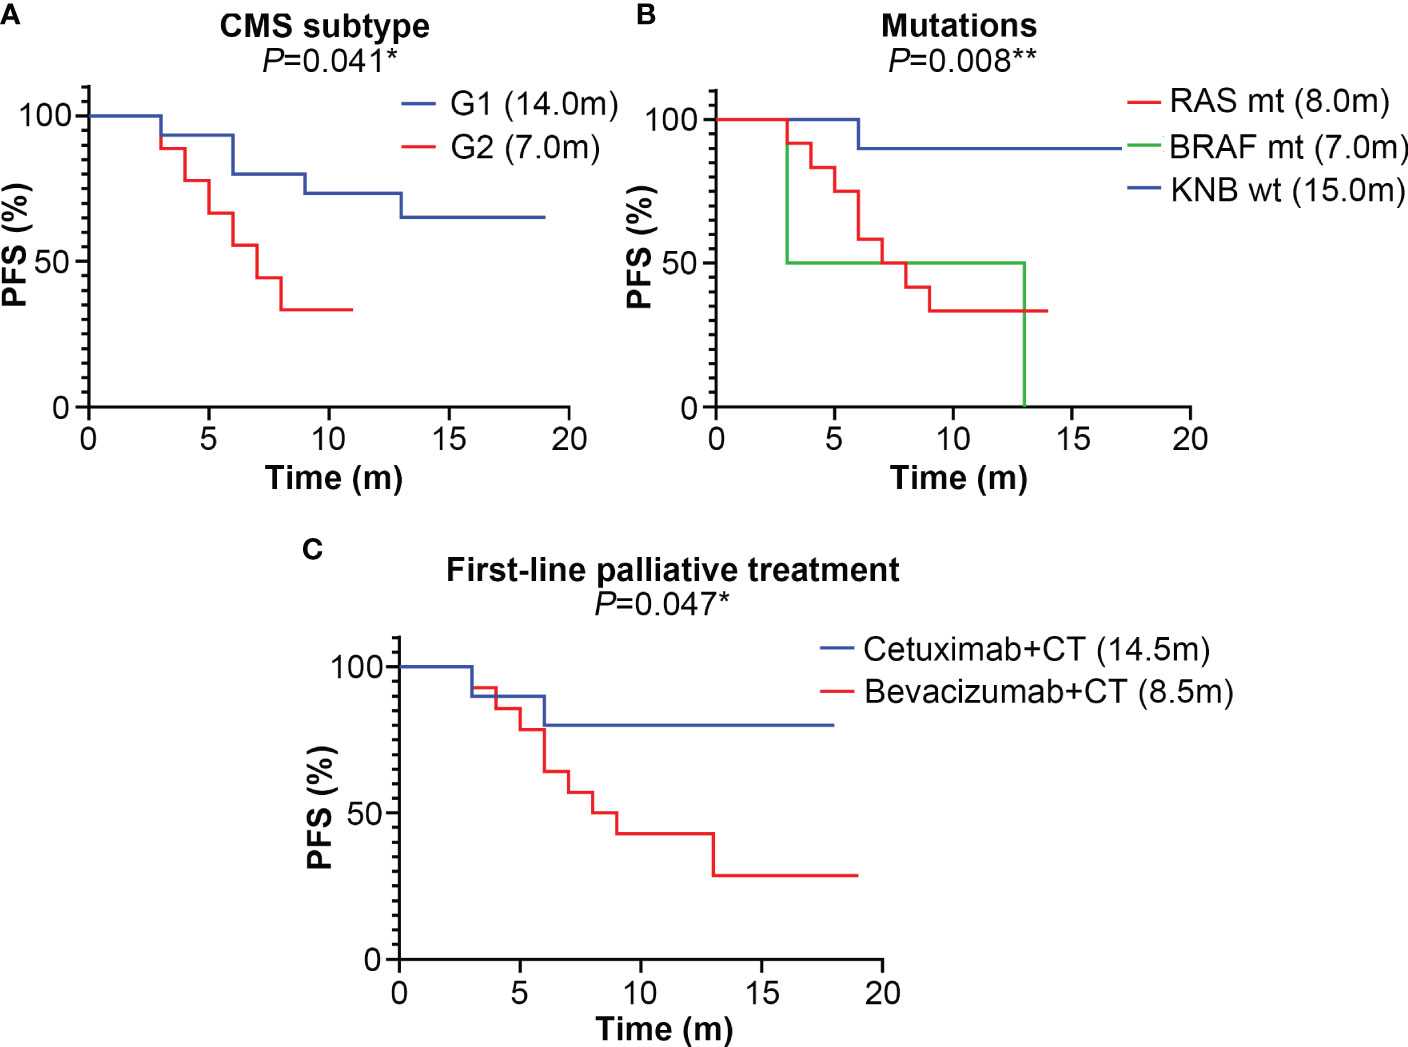
Figure 1 The median progression-free survival (PFS) (month) of different subtype groups of colorectal cancer patients. (A) The median PFS of the G1 (CMS2/3) and G2 (CMS4) groups; (B) The median PFS of KRAS, NRAS and BRAF mutation subtypes; mt represents mutant-type, wt represents wild-type; (C) The median PFS of different first-line palliative treatment subtypes; CT represents chemotherapy. * represents P<0.05; ** represents P<0.01; *** represents P<0.001.
3.2 Somatic mutations analyses
The landscape of somatic mutations is investigated and the top 50 mutated genes in the G1 and G2 groups are listed in Figure 2A. TP53 (92%), APC (69%) and KRAS (31%) are the most frequently mutated genes in the whole cohort. Missense mutations, nonsense mutations and frame-shift insertion/deletions are the major types in both G1 and G2 groups (Figures 2A-C). Interestingly, with regard to each specific mutated gene, the mutation types are completely different between the two groups. Such as the APC gene, nonsense mutation is the major type in the G1 group, while frame-shift deletion is predominant in the G2 group (Figures 2A-C). In the G1 group, the top 10 mutated genes are TP53, APC, FBXW7, CARD11, NRAS, BRAF, BMPR1A, B2M, ARID1B and AR (Figure 2B); while APC, TP53, KRAS, CTNNB1, CDH1, CCNE1, BRAF, BLM, AXL and ALK in G2 (Figure 2C). Of note, the FBXW7 and CARD11 mutations only occur in the G1 group (Figures 2A, B), whereas CTNNB1, CDH1 and CCNE1 mutations predominantly occur in the G2 group (Figures 2A, C).
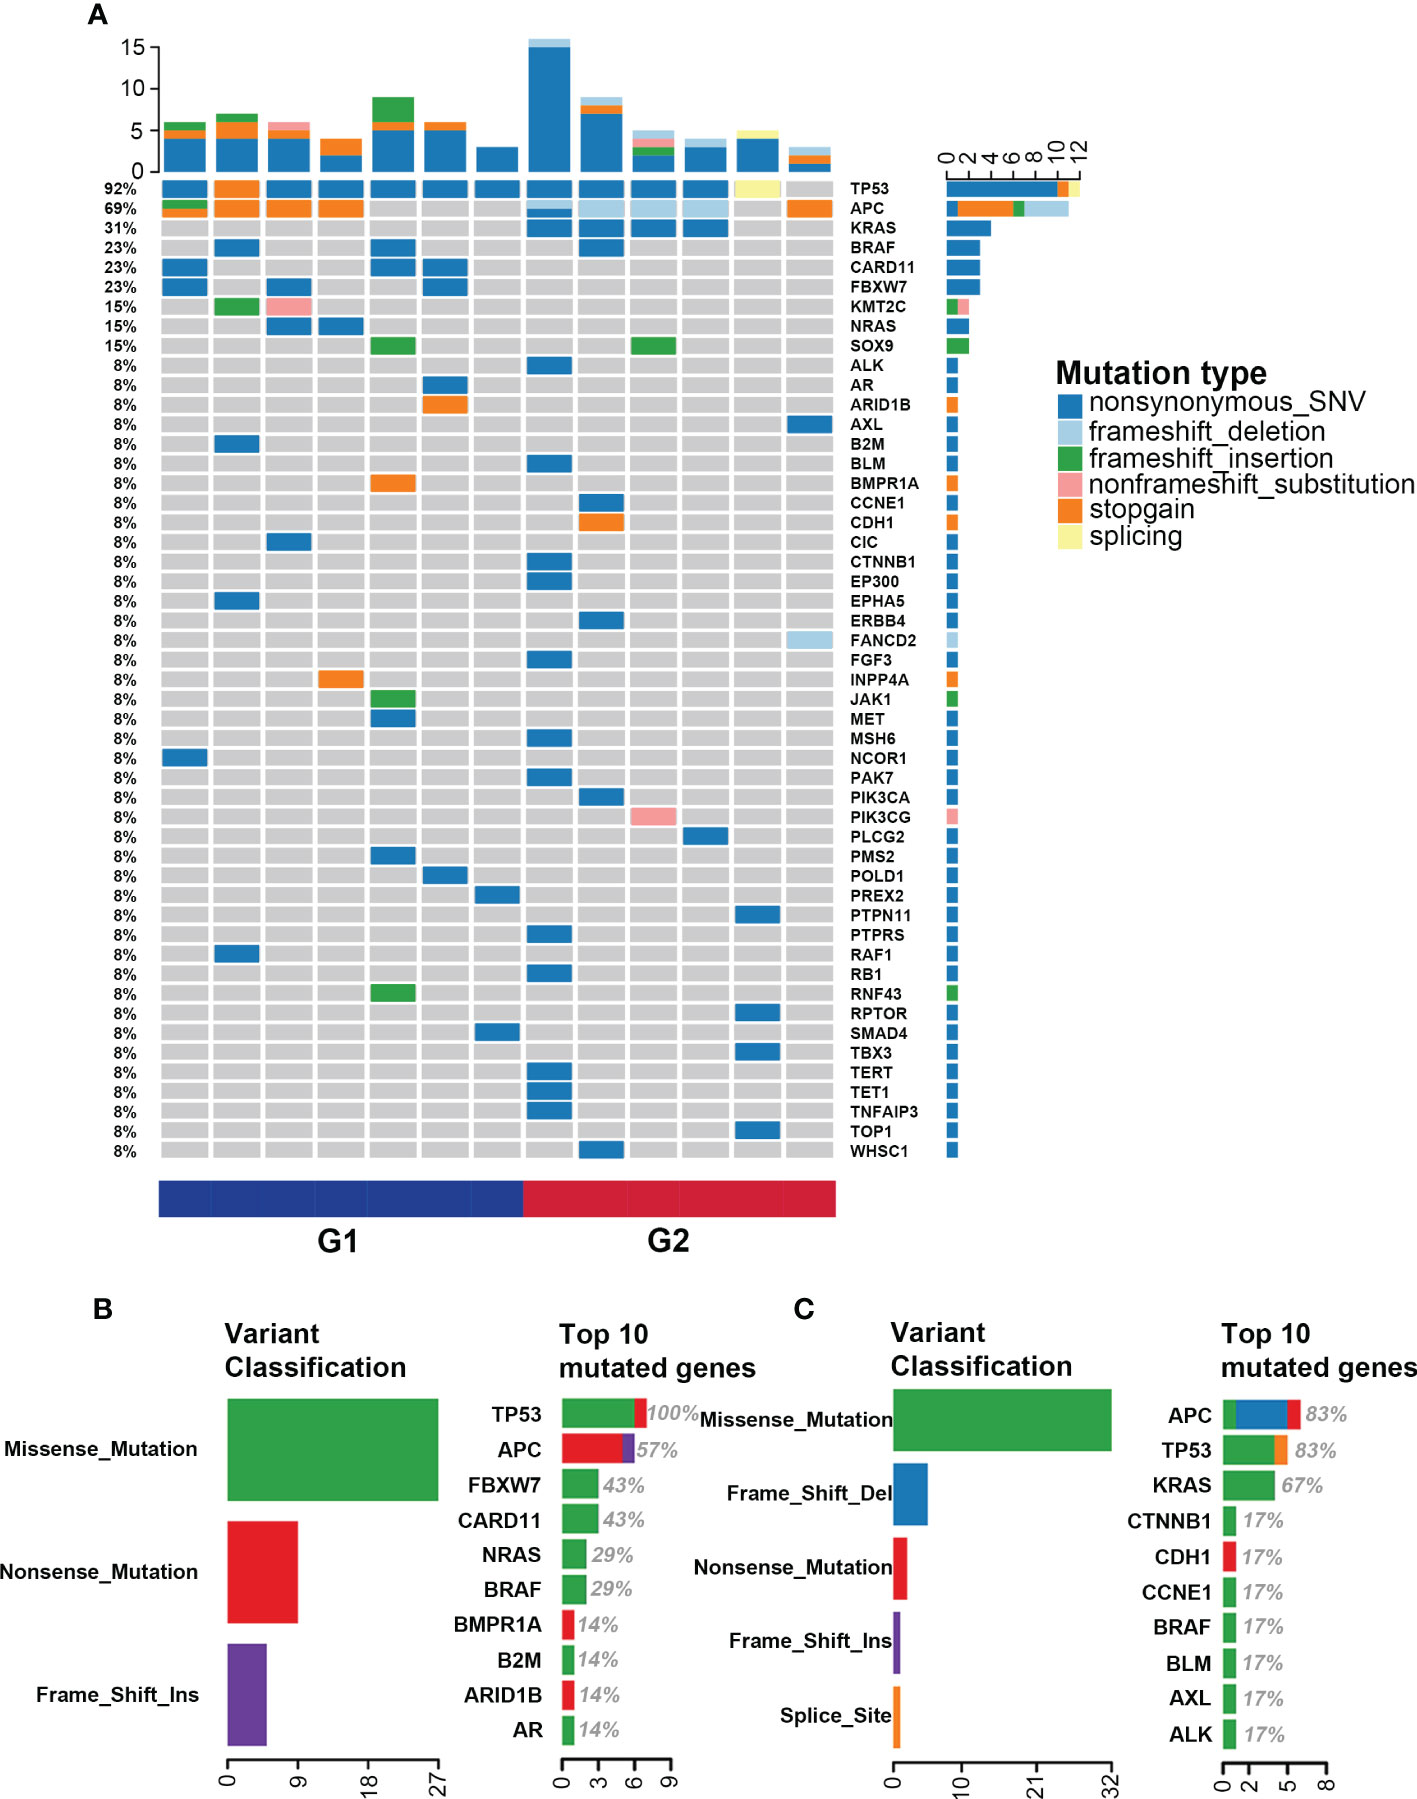
Figure 2 Single nucleotide variation landscape of both groups. (A) Landscape of somatic mutations in the G1 (CMS2/3) and G2 (CMS4) groups; (B) Detailed information of gene mutations in the G1 group; (C) Detailed information of gene mutations in the G2 group.
3.3 Enrichment analysis of mutated genes in the G1 and G2 groups
Gene ontology (GO) enrichment analysis shows that in the cellular component-associated category, the mutated genes in the G1 group are enriched in HFE-transferrin receptor complex, plasma membrane receptor complex and so on (Figure S2A), and the mutated genes in the G2 group are enriched in Wnt signalosome and catenin complex, etc (Figure S2B). For biologic process category, the mutated genes in the G1 group are enriched in signal transduction by protein phosphorylation (Figure S2C), and those in the G2 group are cellular localization, positive regulation of macromolecule metabolic process and regulation of transferase activity, etc (Figure S2D). For molecular function, the mutated genes in the G1 group are enriched in transcription factor activity (Figure S2E), and those in the G2 group are androgen receptor binding and kinase binding (Figure S2F).
KEGG pathway analysis reveals that the Notch pathway, in which the FBXW7 mutation located, is enriched in the G1 group. The cell cycle pathway that CCNE1 and RB1 mutations located in is enriched in the G2 group. Similarly, the Wnt pathway that the CTNNB1 mutation located in is enriched in the G2 group (Figure 3A). Reactome pathway analysis reveals the mutated genes in the G1 group are enriched in transcriptional regulation by RUNX2 pathway (Figure 3B), and those in G2 are enriched in signaling by FGFR1 and signaling by FGFR2 pathways (Figure 3C).
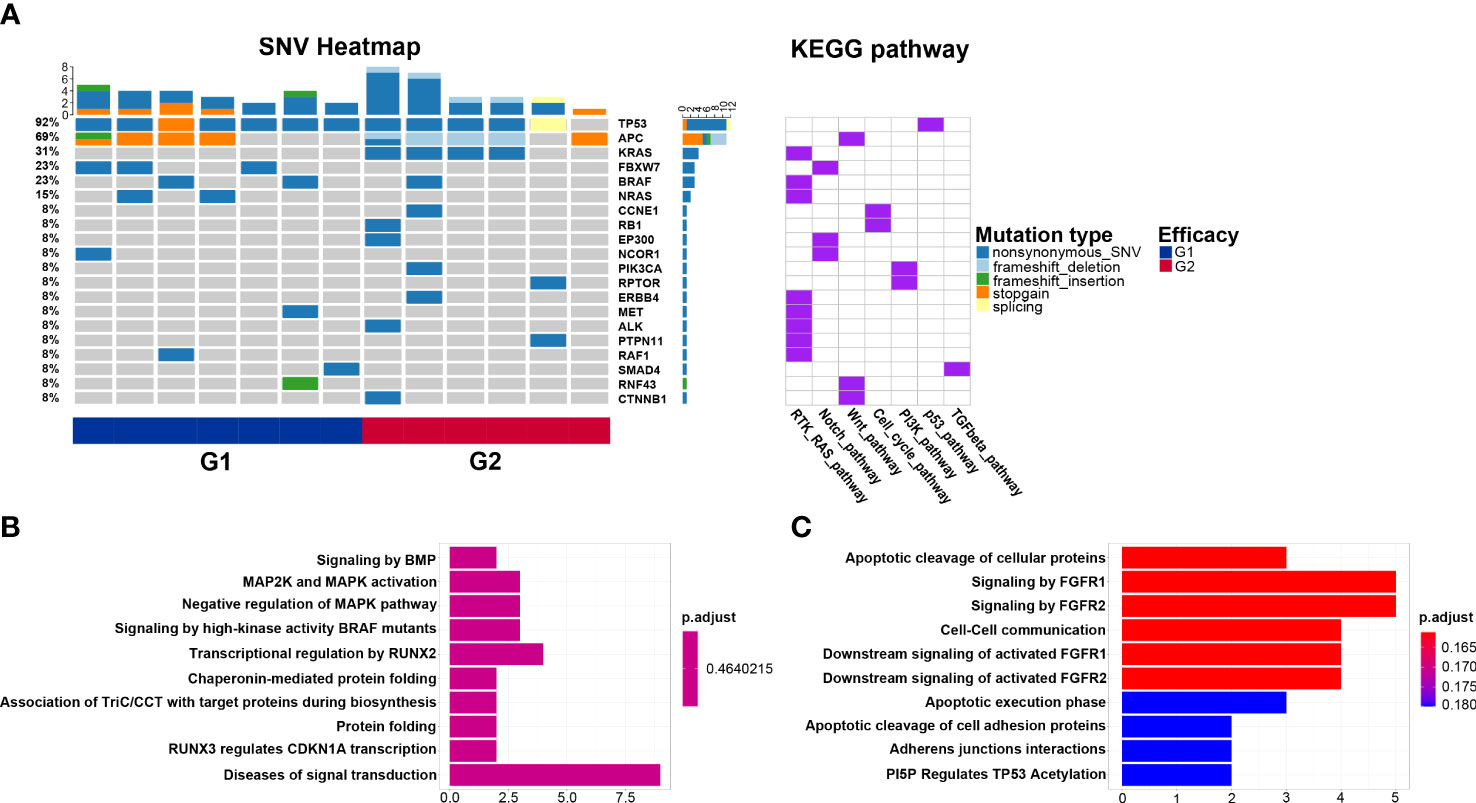
Figure 3 Biological pathways enriched from mutated genes. (A) Kyoto Encyclopedia of Genes and Genomes pathways of mutated genes in the G1 (CMS2/3) and G2 (CMS4) groups; (B) Reactome pathways of mutated genes in the G1 group; (C) Reactome pathways of mutated genes in the G2 group.
3.4 MATH in the G1 and G2 groups
MATH score is used to quantify intratumor heterogeneity and is predictive for drug resistance and tumor recurrence. Although the TMB value between G1 and G2 groups is insignificant, the MATH score in the G2 group is significantly lower than that in G2 (P=0.027, Figure 4), indicating that the level of intratumor genetic heterogeneity of CMS4 patients is lower than that of CMS2/3.
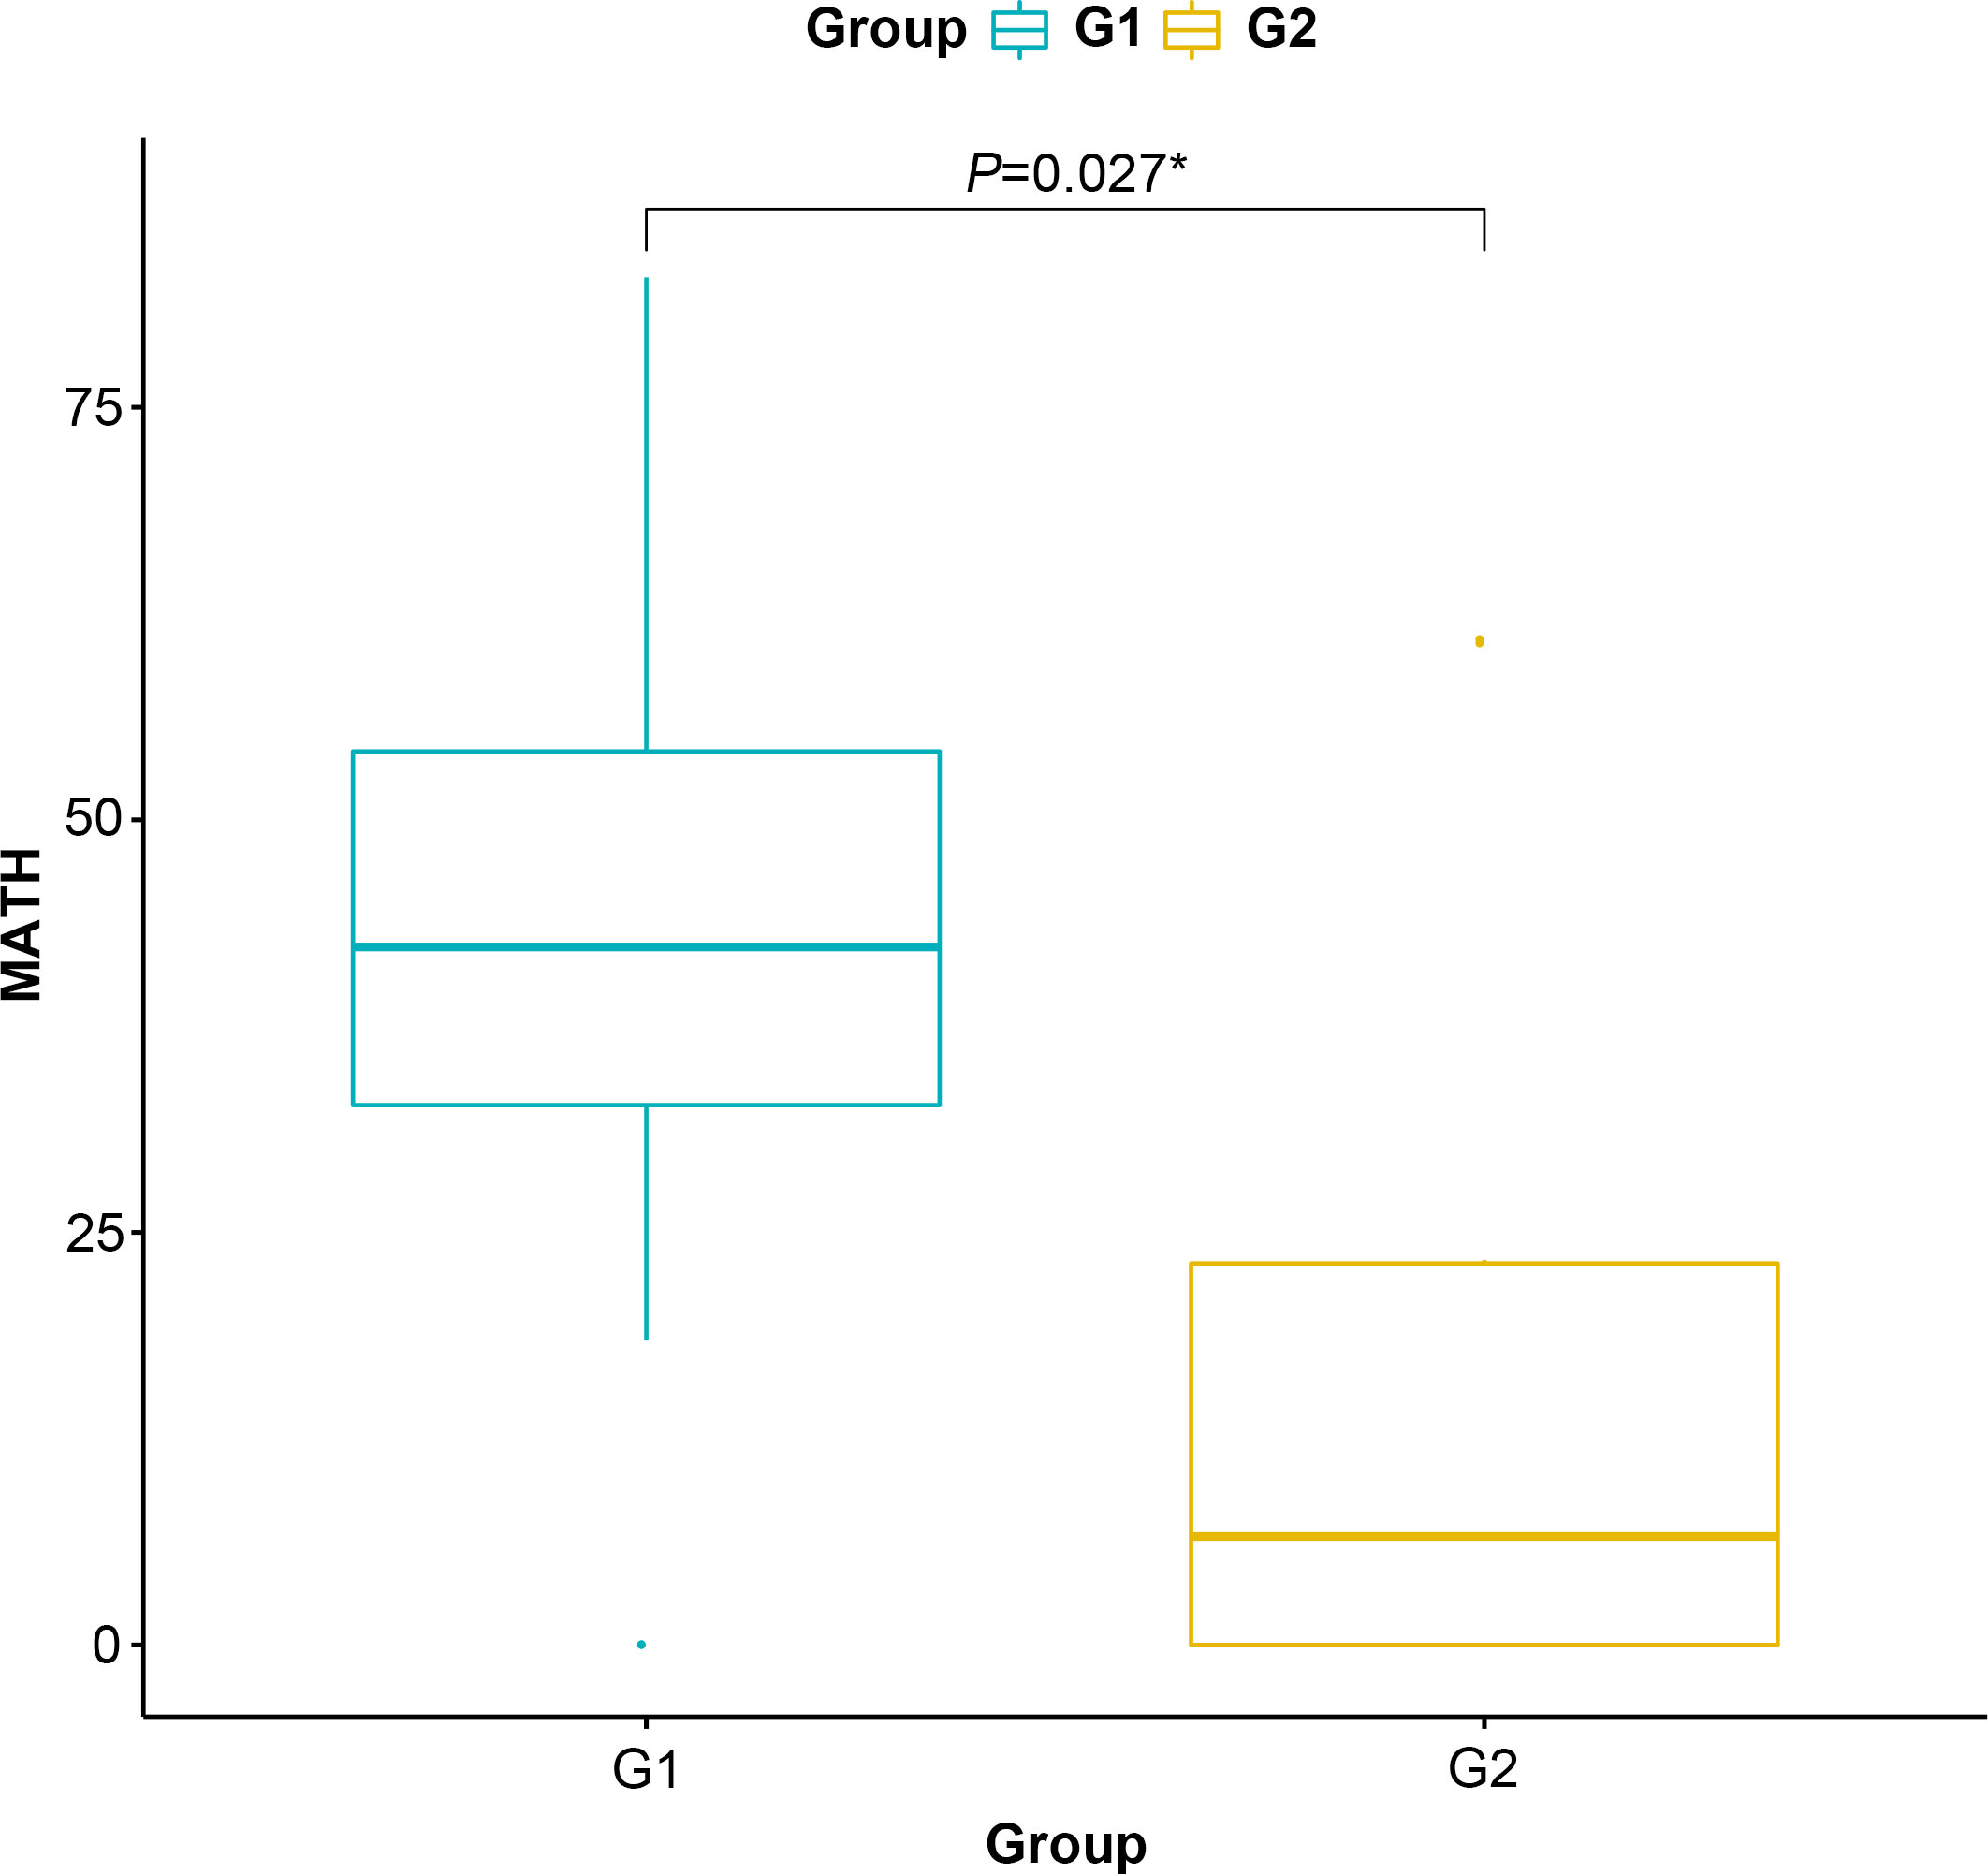
Figure 4 Mutant-allele tumor heterogeneity score of the G1 (CMS2/3) and G2 (CMS4) groups. * represents P<0.05.
3.5 Gene expression profiling in the G1 and G2 groups
A total of 3,510 DEGs are identified, and the majority of which are downregulated in the G2 group. The volcano plot of differentially expressed genes is shown in Figure 5A. PPI network downloaded from the STRING database is displayed in Figure S3. The top 20 hub genes with the highest nodes, including SLC17A6, ALB, AQP4, PGK2, PASD1, NANOG, FRMPD2, SCL7A3, BRDT, CRISP2, FTHL17, CA10, IL4, MAGEC2, TDRD12, SERPINA7, PLCZ1, RAD21L1, SPACA1 and ACTRT1, are shown in Figure 5B. Survival analysis of these hub genes shows only SLC17A6 is associated with the prognosis of CMS4 patients, and higher mRNA expression of SLC17A6 is associated with worse PFS (P=0.04, Figure S4).
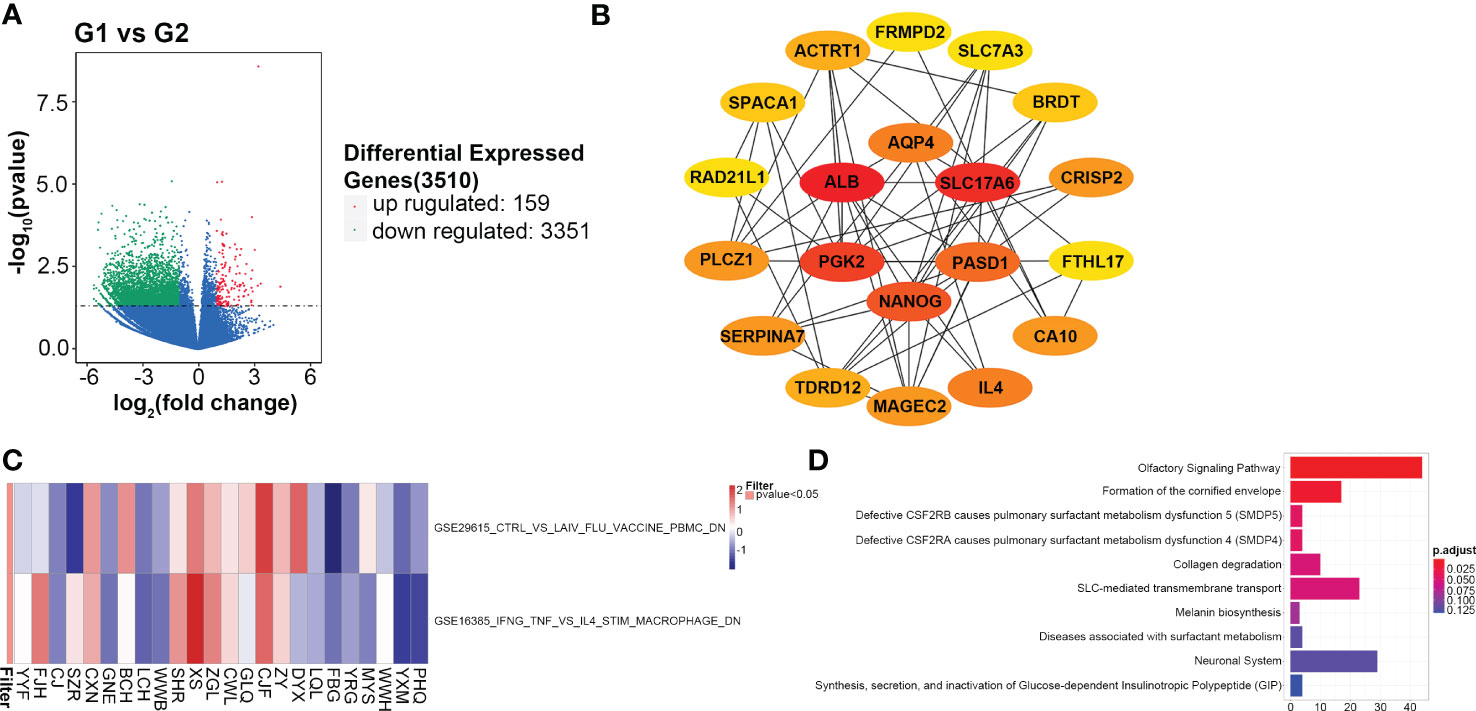
Figure 5 Gene expression profiling analyses. (A) Differential expressed genes between the G1 (CMS2/3) and G2 (CMS4) groups; (B) Top 20 hub genes in the protein and protein interaction network; (C) The enrichment analysis for immunologic signature gene sets; (D) Reactome pathways of differential expressed genes.
Among the differentially expressed genes, at least ten immune-related genes (CD1C, IDO2, IL4, IL17F, IL1A, CCL3, MAGEC2, KRT5, CEACAM8 and VTCN1) are found. The expression of these genes is higher in the G2 group than that in G1 except of CDIC and CEACAM8 (Figure S5). Of which, IDO2, IL4 and VTCN1 negatively regulate checkpoint and immune response; KRT5 is an oncogene that regulate tumorigenesis. CD1C stimulates immune response and CEACAM8 functions as lymphocyte markers (30, 31). Two immunologic signature gene sets, GSE29615 and GSE16395 are identified with high confidence in GSEA (P<0.05, Figure 5C). Reactome analysis shows the top ten enrichment pathways, including SLC-mediated transmembrane transport and formation of the cornified envelope (Figure 5D).
Thus, through analyzing gene expression profiling in both groups, a PFS-related gene, several immune-related genes and immunologic signature gene sets are first identified in the CMS4 subtype.
3.6 Immune-related genes and pathways associated with G2 group
IPRES contains 26 gene signatures that proven to be associated with PD-1 immunotherapy resistance. The IPRES analysis indicates that the immunotherapy resistance of MAPK inhibitor-induced EMT in the G2 group is significantly higher than that in G1 (G1=0.66 vs. G2=0.72, P<0.05). However, other gene sets, such as TGF-β signaling, tumor angiogenesis and VEGFA targets, are not significantly different between the two groups (Figure S6).
According to ssGSEA analysis, the G2 group is significantly associated with lower infiltration of effector memory CD4+ T cells (P<0.05), immature B cells (P<0.05), and myeloid-derived suppressor cells (MDSC, P<0.05, Figure 6A). Xcell analysis shows that some immune cells, including CD4+ T cells, CD8+ T cells, natural killer (NK) cells and macrophages, have no difference in infiltration levels (Figure 6B). The infiltration levels of CD4+ naïve T cells (P<0.05), CD4+ central memory T cells (Tcm) (P<0.01) and class-switched memory B cells (P<0.05) are lower in the G2 group, while the level of hepatocytes (P<0.05) is higher in the G2 group. The immune, stroma and microenvironment scores in the G2 group are all lower than those in the G1 group, although there are no statistical differences. Thus, immune-related analyses indicate the CMS4 group has an immunosuppressive microenvironment.
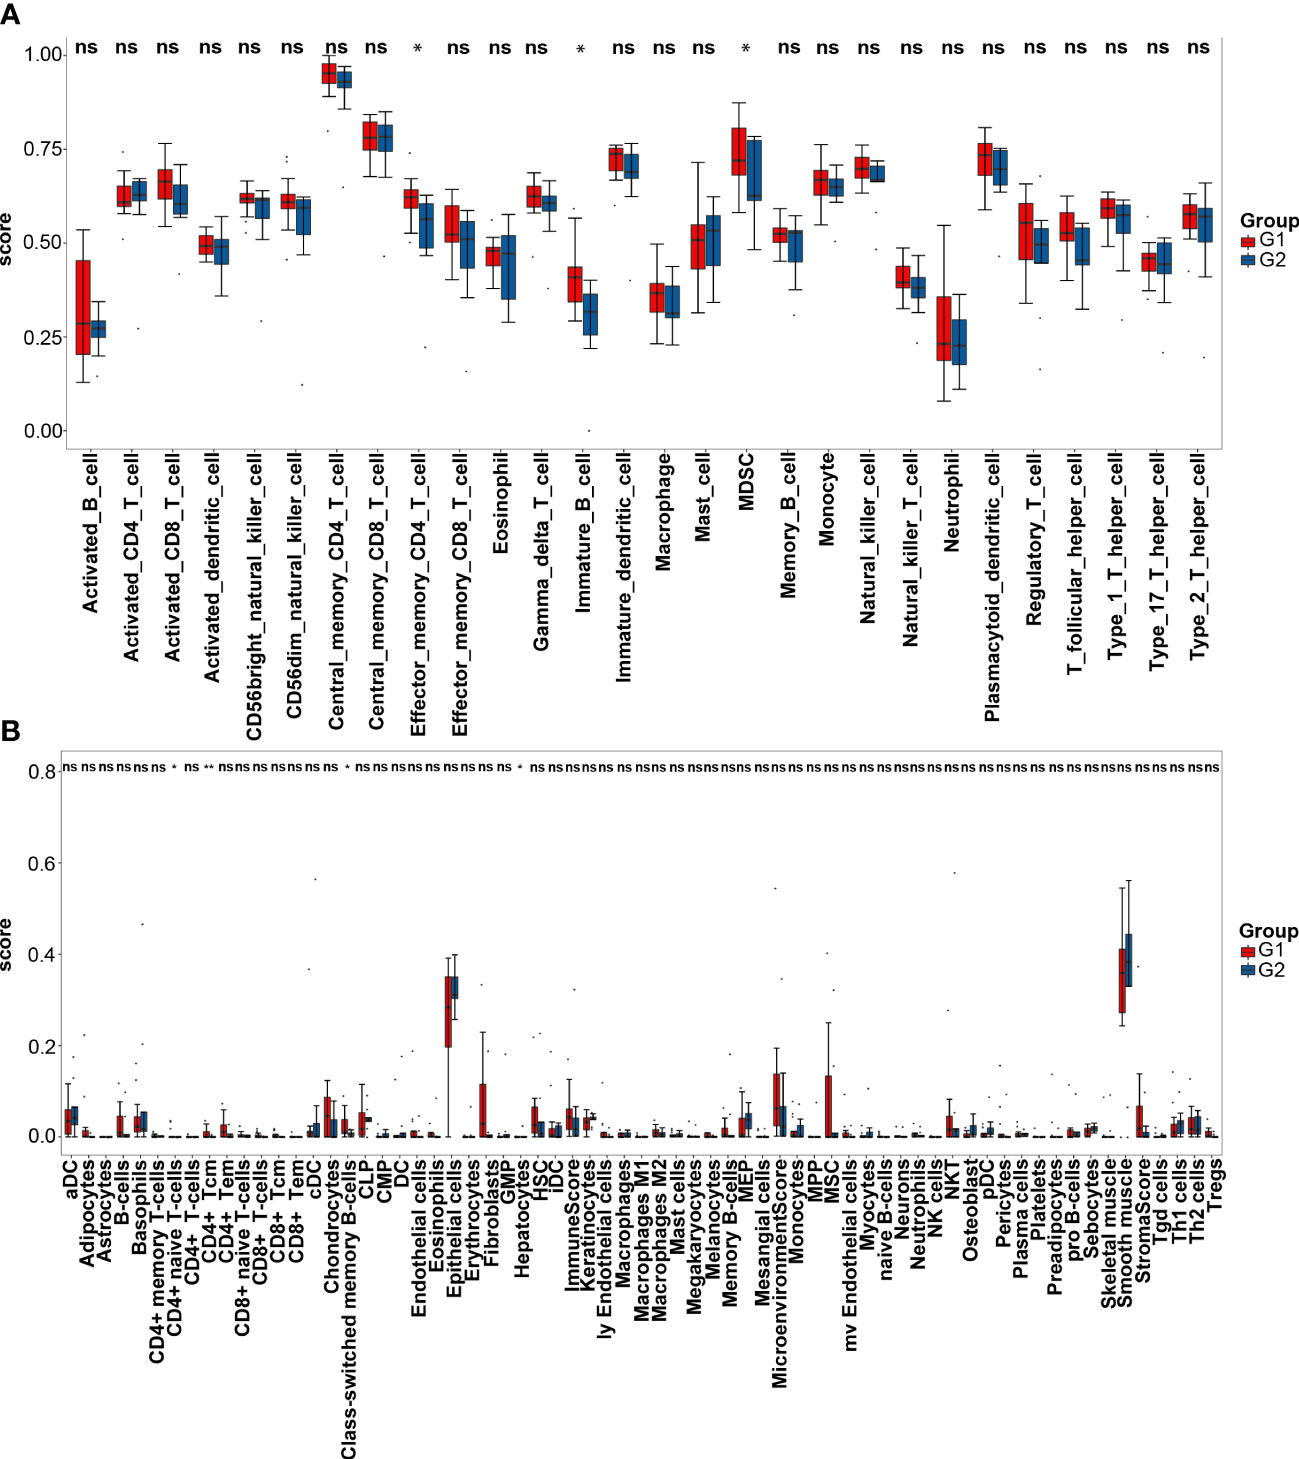
Figure 6 Immune infiltration analyses. (A) Single sample gene set enrichment analysis of the G1 (CMS2/3) and G2 (CMS4) groups; (B) Xcell analysis of the two groups. * represents PP<0.05; ** represents P<0.01; ns represents P>0.05.
4 Discussion
In this study, CMS2/3 or CMS4 subtype was differentiated based on IHC staining with FRMD6, ZEB1, HTR2B, CDX2 and KER markers, which was in line with the transcriptome-based classification system (12, 20). We found that the cell cycle and Wnt pathways were enriched in the CMS4 group. Immunologic signature gene sets and enrichment pathways as well as a novel predictor for CMS4 CRC patients were identified through gene expression analysis. Tumor microenvironment analysis implied a lower immune, stroma, and microenvironment scores in the CMS4 group, which indicated immunotherapy may not be beneficial to these patients. Our results provide a potential mechanism for the poor outcome of mCRC patients with CMS4 subtype and imply different treatment strategies based on the CMS subtype.
In our study, FBXW7 mutation, the most frequently mutated gene after TP53 and APC in the CMS2/3 group, was not found in the CMS4 group. FBXW7, as a ubiquitin ligase, can combine with lots of cancer-related factors, including c-Myc, cyclin E and mTOR (32–34). FBXW7 mutation in CRC leads to tumor cell proliferation, increases resistance to paclitaxel, 5-fluorouracil and oxaliplatin, as well as becomes sensitive to mTOR inhibitors (35–37). No correlation between FBXW7 mutation and CMS4 CRC has been reported in previous studies. FBXW7 mutation, enriched in the Notch pathway, was not been found in the CMS4 mCRC patients in our study, suggesting that the FBXW7-Notch axis might not be involved in the tumorigenesis of CMS4 CRC. Therefore, treatment targeting Notch or mTOR signaling might not be beneficial to the CMS4 CRC patients.
CTNNB1 and CCNE1 were the most frequently mutated genes found in the CMS4 group in our study. CTNNB1 mutation occurred in about half of CRC patients (38), while the mutation frequency of CCNE1 in CRC had not been explored. The mutation of these two genes in the CMS4 mCRC had not been reported previously. CTNNB1 is a significant Wnt signaling regulator that interacts with E-cadherin to mediate cell adhesion (39). The Wnt signaling pathway that CTNNB1 lies is a critical pathway in EMT, an important feature of CMS4 subtype (20, 40). In our study, CTNNB1 mutation was enriched in the Wnt pathway, suggesting that CTNNB1-Wnt axis might function importantly in the CMS4 mCRC. Further, therapeutic drugs targeting the Wnt pathway, including small molecules, biological agents and natural compounds (41), might be effective treatment of CMS4 subtype mCRC.
CCNE1 acts as a positive regulator of cell cycle and promotes the transition from G1 to S (42). Abnormal expression of CCNE1 activates cyclin-dependent kinase 2 to phosphorylate its substrate, resulting in tumor cell proliferation (43). In our study, CCNE1 mutation was enriched in the cell cycle pathway, suggesting that CCNE1-cell cycle axis might be involved in the tumorigenesis of CMS4 CRC. KEGG pathway analysis also showed that the cell cycle pathway was a unique pathway in the CMS4 type rather than CMS2/3. The arrest of the cell cycle in the G1 phase can be caused by TGF-β, which can induce the cell cycle pathway and effectively inhibit cell proliferation (44). Several studies show that combining ICIs and selective TGF-β inhibitors might be helpful for immunotherapy in CMS4 type mCRC patients (45, 46).
In our study, SLC17A6, one member of solute carrier family, was identified as a hub DEG between the two groups, and most hub DEGs were significantly enriched in the SLC-mediated transmembrane transport pathway. Tumor survival, migration, proliferation, and sensitivity to radiotherapy are regulated by SLC3A2, and its high expression is associated with poor prognosis (47–49). In a xenograft model, antitumor activity against human colon cancer was mediated by anti-SLC7A5 monoclonal antibodies (50). The exact roles of SLC17A6 in CMS4 subtype colon cancer warrant further investigation.
In our study, the mutated genes of the CMS4 subtype were enriched in signaling by FGFR1 and FGFR2 pathways according to Reactome pathway analysis. The FGFR tyrosine kinase family regulates migration, differentiation, apoptosis and angiogenesis after ligands (51). A combination of FGFR inhibitors and immune checkpoint blockers is reported to be a promising treatment strategy for malignant tumors (52). However, its application in CMS4 CRC patients requires further research.
According to the GSEA and tumor immune microenvironment analyses, the CMS4 CRC patients tended to have an immunosuppressive microenvironment. MDSCs are a heterogeneous group of cells derived from both myeloid progenitors and immature myeloid cells, which are precursors of dendritic cells, macrophages, and/or granulocytes (53). In our study, fewer MDSCs infiltrated in the CMS4 subtype than in CMS2/43, suggesting that CMS4 CRC cells tended to promote tumor growth (54). GSE16385 is a GEO dataset containing expression data from human macrophages, obtained by comparing macrophages activated by interleukin-4 (M2) and those activated by interferon-gamma and tumor necrosis factor (M1) (55). Macrophages in the immune environment of most cancer cells act as M2 phenotype and express various anti-inflammatory molecules, leading to an immunosuppressive microenvironment (56). Our study found that M2 macrophages infiltrated the tumor microenvironment in most CMS4 samples. Regorafenib transforms tumor-associated macrophage from M2 type to M1 type with anti-tumor function by inhibiting the colony-stimulating factor 1 receptor (57). Meanwhile, regorafenib can inhibit tumor angiogenesis by TIE2 pathway, and reduce proliferation of CMS4 subtype tumor cells in a patient-derived xenograft trail (58, 59). When combined with ICIs, it may have synergistic anti-tumor effect in CRC. One patient with CMS4 in our study, who failed first-line cetuximab and chemotherapy second-line bevacizumab and chemotherapy, was beneficial markedly from the treatment of regorafenib (data not shown). This might change the current clinical practice for mCRC patients with CMS4 subtype, overcome the lack of effective treatment options, and prolong their overall survival. The combination of modalities deserves further studies in vitro and in vivo. Besides MDSCs and macrophages, there were several other immune cell types infiltrating differently between the two CMS subtypes. Tcm is a long-term T cell derived from naive T cells activated by antigens and can home to lymph nodes to receive antigen re-stimulation. Activated Tcm cells can produce a large number of cloned effective memory T cells carrying the same antigen under the re-stimulation of antigen (60). In our study, the CMS4 subtype tended to have a malignant inflammatory environment that potentially blocked the antitumor effect of active T/immune cells, resulting in a poor immune response.
Additionally, several immune-related genes with significantly different expression levels between CMS4 and CMS2/3 subtypes were identified in our study. IL17F is a member of the IL−17 family of proteins. The investigation by Quan et al. showed that the upregulation of IL17F in mCRC promotes tumor invasion by inducing EMT transition (61) and elevated levels of Th17-associated cytokines in advanced-stage mCRC are associated with poorer overall survival and possible resistance to chemotherapy (62). The high expression of CEACAM8 was reported by Peng et al. (30) to be an independent factor of poor disease-free survival and inversely correlated with CD8+ T lymphocyte cells, predicting distant metastasis and inefficiency of chemotherapy. VTCN1 is an immunoregulatory protein that negatively regulates T cell-mediated immune response in the tumor microenvironment (63). Overexpression of VTCN1 was reported to play an oncogenic role, induce EMT, proliferation, and migration of CRC cells through the Wnt signaling pathway (64) and promote CRC stemness (65). VTCN1 can inhibit T cell activation and proliferation, negatively regulate T cell immune response, and its overexpression promotes tumor tolerance and might contribute to Treg development in a CRC tolerogenic milieu (66). Serving as a negative regulator of T-cell-mediated antitumor immunity, VTCN1 can inhibit T cell activation and cytokine secretion, and regulate cytotoxic T lymphocytes (CTLs) during tumor progression (67).
Our study provides new insights into the molecular characteristic of the CMS4 subtype. The CTNNB1-Wnt and CCNE1-cell cycle axes are likely involved in the tumorigenesis of CMS4 CRC and could be functioned as therapeutic targets. In contrast, the FBXW7-Notch pathway is unlikely involved in the tumorigenesis of CMS4 CRC. The CMS4 CRC patients have been found having an immunosuppressive microenvironment and transforming tumor-associated macrophages from M2 type to M1 type in CMS4 CRC cells might be a therapeutic direction. Through analyzing gene expression profiling in both groups, a PFS-related gene, several immune-related genes and immunologic signature gene sets were first identified in the CMS4 subtype. SLC17A6, as a novel predictor for PFS of CMS4 CRC patients, needs further exploration. The study requires more patient recruitment and data collections. Further verification in clinics is warrant.
Data availability statement
The data presented in the study are deposited in the GSA for Human repository, accession number PRJCA011830.
Ethics statement
The studies involving human participants were reviewed and approved by The ethics board of the Affiliated Suzhou Hospital of Nanjing Medical University (approval number: KL901250). The ethics committee waived the requirement of written informed consent for participation.
Author contributions
Contributions: (I) Conception and design: YL, JS, FG. (II) Administrative support: JS, FG. (III) Provision of study materials or patients: YL, DG. (IV) Collection and assembly of data: DG, YS, CZ, WL, LH, XW, ZK. (V) Data analysis and interpretation: YL, DG. (VI) Manuscript writing: All authors. All authors contributed to the article and approved the submitted version.
Funding
This study was funded by grants from Suzhou Municipal Science and Technology Bureau (Grant Number SKY2022006, SLJ202011 and SLT201959), Jiangsu Commission of Health (Grant Number M2020043) and China Digestive Tumor Clinical Research Public Welfare Project (Grant Number P014-038).
Conflict of interest
The authors declare that the research was conducted in the absence of any commercial or financial relationships that could be construed as a potential conflict of interest.
Publisher’s note
All claims expressed in this article are solely those of the authors and do not necessarily represent those of their affiliated organizations, or those of the publisher, the editors and the reviewers. Any product that may be evaluated in this article, or claim that may be made by its manufacturer, is not guaranteed or endorsed by the publisher.
Supplementary material
The Supplementary Material for this article can be found online at: https://www.frontiersin.org/articles/10.3389/fimmu.2023.1160052/full#supplementary-material
Supplementary Figure 1 | Immunohistochemical staining of CMS2/3 and CMS4 subtypes metastasis colorectal cancer.
Supplementary Figure 2 | Gene ontology (GO) analysis of mutated genes in the G1 (CMS2/3) and G2 (CMS4) groups. (A) Cellular component analysis of mutated genes in the G1 group; (B) Cellular component analysis of mutated genes in the G2 group; (C) Biological process analysis of mutated genes in the G1 group; (D) Biological process analysis of mutated genes in the G2 group; (E) Molecular Function analysis of mutated genes in the G1 group; (F) Molecular Function analysis of mutated genes in the G2 group.
Supplementary Figure 3 | Protein and protein interaction network of the differential expressed genes.
Supplementary Figure 4 | Survival curves of patients with different SLC17A6 expression.
Supplementary Figure 5 | Average expression of different immune-related genes in the G1 (CMS2/3) and G2 (CMS4) groups.
Supplementary Figure 6 | The innate anti–PD-1 resistance analysis of immune-related genes/pathways in the G1 (CMS2/3) and G2 (CMS4) groups.
Abbreviations
CMS, consensus molecular subtype; CRC, colorectal cancer; MATH, Mutant-allele tumor heterogeneity; PPI, Protein and protein network; KEGG, Kyoto Encyclopedia of Genes and Genomes; DEGs, differentially expressed genes; PFS, progression-free survival.
References
1. Chen W, Zheng R, Baade PD, Zhang S, Zeng H, Bray F, et al. Cancer statistics in China, 2015. CA Cancer J Clin (2016) 66:115–32. doi: 10.3322/caac.21338
2. Greene FL. Current TNM staging of colorectal cancer. Lancet Oncol (2007) 8:572–3. doi: 10.1016/S1470-2045(07)70185-7
3. Zhou K, Shi H, Chen R, Cochuyt JJ, Hodge DO, Manochakian R, et al. Association of race, socioeconomic factors, and treatment characteristics with overall survival in patients with limited-stage small cell lung cancer. JAMA Netw Open (2021) 4:e2032276. doi: 10.1001/jamanetworkopen.2020.32276
4. Bazan V, Migliavacca M Fau - Zanna I, Zanna I Fau - Tubiolo C, Tubiolo C Fau - Grassi N, Grassi N Fau - Latteri MA, Latteri Ma Fau - La Farina M, et al. Specific codon 13 K-ras mutations are predictive of clinical outcome in colorectal cancer patients, whereas codon 12 K-ras mutations are associated with mucinous histotype. Ann Oncol (2002) 13(9):1438–46.doi: 10.1093/annonc/mdf226
5. Schirripa M, Cremolini C Fau - Loupakis F, Loupakis F Fau - Morvillo M, Morvillo M Fau - Bergamo F, Bergamo F Fau - Zoratto F, Zoratto F Fau - Salvatore L, et al. Role of NRAS mutations as prognostic and predictive markers in metastatic colorectal cancer. Int J Cancer (2015) 136(1):83–90. doi: 10.1002/ijc.28955
6. Pentheroudakis G, Kotoula V Fau - De Roock W, De Roock W Fau - Kouvatseas G, Kouvatseas G Fau - Papakostas P, Papakostas P Fau - Makatsoris T, Makatsoris T Fau - Papamichael D, et al. Biomarkers of benefit from cetuximab-based therapy in metastatic colorectal cancer: interaction of EGFR ligand expression with RAS/RAF, PIK3CA genotypes. BMC Cancer (2013) 13:49. doi: 10.1186/1471-2407-13-49
7. Mao C, Yang Zy Fau - Hu XF, Hu Xf Fau - Chen Q, Chen Q Fau - Tang JL, Tang JL. PIK3CA exon 20 mutations as a potential biomarker for resistance to anti-EGFR monoclonal antibodies in KRAS wild-type metastatic colorectal cancer: a systematic review and meta-analysis. Ann Oncol (2012) 23(6):1518–25. doi: 10.1093/annonc/mdr464
8. Biller LH, Schrag D. Diagnosis and treatment of metastatic colorectal cancer: a review. JAMA (2021) 325:669–85. doi: 10.1001/jama.2021.0106
9. Guinney J, Dienstmann R, Wang X, de Reynies A, Schlicker A, Soneson C, et al. The consensus molecular subtypes of colorectal cancer. Nat Med (2015) 21:1350–6. doi: 10.1038/nm.3967
10. Stahler A, Hoppe B, Na IK, Keilholz L, Muller L, Karthaus M, et al. Consensus molecular subtypes as biomarkers of fluorouracil and folinic acid maintenance therapy with or without panitumumab in RAS wild-type metastatic colorectal cancer (PanaMa, AIO KRK 0212). J Clin Oncol (2023) 41(16):2975–87. JCO2202582. doi: 10.1200/JCO.22.02582
11. Stahler A, Heinemann V, Schuster V, Heinrich K, Kurreck A, Giessen-Jung C, et al. Consensus molecular subtypes in metastatic colorectal cancer treated with sequential versus combined fluoropyrimidine, bevacizumab and irinotecan (XELAVIRI trial). Eur J Cancer (2021) 157:71–80. doi: 10.1016/j.ejca.2021.08.017
12. Trinh A, Trumpi K, De Sousa EMF, Wang X, de Jong JH, Fessler E, et al. Practical and robust identification of molecular subtypes in colorectal cancer by immunohistochemistry. Clin Cancer Res (2017) 23:387–98. doi: 10.1158/1078-0432.CCR-16-0680
13. Lenz HJ, Ou FS, Venook AP, Hochster HS, Niedzwiecki D, Goldberg RM, et al. Impact of consensus molecular subtype on survival in patients with metastatic colorectal cancer: results from CALGB/SWOG 80405 (Alliance). J Clin Oncol (2019) 37:1876–85. doi: 10.1200/JCO.18.02258
14. Lam M, Roszik J, Kanikarla-Marie P, Davis JS, Morris J, Kopetz S, et al. The potential role of platelets in the consensus molecular subtypes of colorectal cancer. Cancer Metastasis Rev (2017) 36:273–88. doi: 10.1007/s10555-017-9678-9
15. Trinh A, Lädrach C, Dawson HE, Ten Hoorn S, Kuppen PJK, Reimers MS, et al. Tumour budding is associated with the mesenchymal colon cancer subtype and RAS/RAF mutations: a study of 1320 colorectal cancers with consensus molecular subgroup (CMS) data. Br J Cancer (2018) 119:1244–51. doi: 10.1038/s41416-018-0230-7
16. Mooi JK, Wirapati P, Asher R, Lee CK, Savas P, Price TJ, et al. The prognostic impact of consensus molecular subtypes (CMS) and its predictive effects for bevacizumab benefit in metastatic colorectal cancer: molecular analysis of the AGITG MAX clinical trial. Ann Oncol (2018) 29:2240–6. doi: 10.1093/annonc/mdy410
17. Laoukili J, Constantinides A, Wassenaar ECE, Elias SG, Raats DAE, van Schelven SJ, et al. Peritoneal metastases from colorectal cancer belong to consensus molecular subtype 4 and are sensitised to oxaliplatin by inhibiting reducing capacity. Br J Cancer (2022) 126:1824–33. doi: 10.1038/s41416-022-01742-5
18. Sawayama H, Miyamoto Y, Ogawa K, Yoshida N, Baba H. Investigation of colorectal cancer in accordance with consensus molecular subtype classification. Ann Gastroenterol Surg (2020) 4:528–39. doi: 10.1002/ags3.12362
19. Peters NA, Constantinides A, Ubink I, van Kuik J, Bloemendal HJ, van Dodewaard JM, et al. Consensus molecular subtype 4 (CMS4)-targeted therapy in primary colon cancer: a proof-of-concept study. Front Oncol (2022) 12:969855. doi: 10.3389/fonc.2022.969855
20. Ten Hoorn S, Trinh A, de Jong J, Koens L, Vermeulen L. Classification of colorectal cancer in molecular subtypes by immunohistochemistry. Methods Mol Biol (2018) 1765:179–91. doi: 10.1007/978-1-4939-7765-9_11
21. Eide PW, Bruun J, Lothe RA, Sveen A. CMScaller: an r package for consensus molecular subtyping of colorectal cancer pre-clinical models. Sci Rep (2017) 7:16618. doi: 10.1038/s41598-017-16747-x
22. Mroz EA, Tward AD, Hammon RJ, Ren Y, Rocco JW. Intra-tumor genetic heterogeneity and mortality in head and neck cancer: analysis of data from the cancer genome atlas. PloS Med (2015) 12:e1001786. doi: 10.1371/journal.pmed.1001786
23. Chalmers ZR, Connelly CF, Fabrizio D, Gay L, Ali SM, Ennis R, et al. Analysis of 100,000 human cancer genomes reveals the landscape of tumor mutational burden. Genome Med (2017) 9:34. doi: 10.1186/s13073-017-0424-2
24. Liao Y, Smyth GK, Shi W. featureCounts: an efficient general purpose program for assigning sequence reads to genomic features. Bioinformatics (2014) 30:923–30. doi: 10.1093/bioinformatics/btt656
25. Love MI, Huber W, Anders S. Moderated estimation of fold change and dispersion for RNA-seq data with DESeq2. Genome Biol (2014) 15:550. doi: 10.1186/s13059-014-0550-8
26. Chin CH, Chen SH, Wu HH, Ho CW, Ko MT, Lin CY. cytoHubba: identifying hub objects and sub-networks from complex interactome. BMC Syst Biol (2014) 8 Suppl 4:S11. doi: 10.1186/1752-0509-8-S4-S11
27. Bin Lim S, Chua MLK, Yeong JPS, Tan SJ, Lim WT, Lim CT. Pan-cancer analysis connects tumor matrisome to immune response. NPJ Precis Oncol (2019) 3:15. doi: 10.1038/s41698-019-0087-0
28. Rich JT, Neely JG, Paniello RC, Voelker CC, Nussenbaum B, Wang EW. A practical guide to understanding Kaplan-Meier curves. Otolaryngol Head Neck Surg (2010) 143:331–6. doi: 10.1016/j.otohns.2010.05.007
29. Rai S, Mishra P, Ghoshal UC. Survival analysis: a primer for the clinician scientists. Indian J Gastroenterol (2021) 40:541–9. doi: 10.1007/s12664-021-01232-1
30. Hu X, Li YQ, Ma XJ, Zhang L, Cai SJ, Peng JJ, et al. And T immune cells infiltration in colorectal cancer predicting distant metastases and efficiency of chemotherapy. Front Oncol (2019) 9:704. doi: 10.3389/fonc.2019.00704
31. Adams EJ. Diverse antigen presentation by the group 1 CD1 molecule, CD1c. Mol Immunol (2013) 55:182–5. doi: 10.1016/j.molimm.2012.10.019
32. Inuzuka H, Shaik S, Onoyama I, Gao D, Tseng A, Maser RS, et al. SCF(FBW7) regulates cellular apoptosis by targeting MCL1 for ubiquitylation and destruction. Nature (2011) 471:104–9. doi: 10.1038/nature09732
33. Cao J, Ge MH, Ling ZQ. Fbxw7 tumor suppressor: a vital regulator contributes to human tumorigenesis. Med (Baltimore) (2016) 95:e2496. doi: 10.1097/MD.0000000000002496
34. Fan J, Bellon M, Ju M, Zhao L, Wei M, Fu L, et al. Clinical significance of FBXW7 loss of function in human cancers. Mol Cancer (2022) 21:87. doi: 10.1186/s12943-022-01548-2
35. Yumimoto K, Nakayama KI. Recent insight into the role of FBXW7 as a tumor suppressor. Semin Cancer Biol (2020) 67:1–15. doi: 10.1016/j.semcancer.2020.02.017
36. Wang Y, Liu Y, Lu J, Zhang P, Wang Y, Xu Y, et al. Rapamycin inhibits FBXW7 loss-induced epithelial-mesenchymal transition and cancer stem cell-like characteristics in colorectal cancer cells. Biochem Biophys Res Commun (2013) 434:352–6. doi: 10.1016/j.bbrc.2013.03.077
37. Chan SM, Weng AP, Tibshirani R, Aster JC, Utz PJ. Notch signals positively regulate activity of the mTOR pathway in T-cell acute lymphoblastic leukemia. Blood (2007) 110:278–86. doi: 10.1182/blood-2006-08-039883
38. Sparks AB, Morin PJ, Vogelstein B, Kinzler KW. Mutational analysis of the APC/beta-catenin/Tcf pathway in colorectal cancer. Cancer Res (1998) 58:1130–4.
39. Willert K, Jones KA. Wnt signaling: is the party in the nucleus? Genes Dev (2006) 20:1394–404. doi: 10.1101/gad.1424006
40. Krishnamurthy N, Kurzrock R. Targeting the wnt/beta-catenin pathway in cancer: update on effectors and inhibitors. Cancer Treat Rev (2018) 62:50–60. doi: 10.1016/j.ctrv.2017.11.002
41. Zhao H, Ming T, Tang S, Ren S, Yang H, Liu M, et al. Wnt signaling in colorectal cancer: pathogenic role and therapeutic target. Mol Cancer (2022) 21:144. doi: 10.1186/s12943-022-01616-7
42. Zhang C, Zhu Q, Gu J, Chen S, Li Q, Ying L. Down-regulation of CCNE1 expression suppresses cell proliferation and sensitizes gastric carcinoma cells to cisplatin. Biosci Rep (2019) 39(6):BSR20190381. doi: 10.1042/BSR20190381
43. Möröy T, Geisen C. Cyclin E. Int J Biochem Cell Biol. (2004) 36:1424–39. doi: 10.1016/j.biocel.2003.12.005
44. Liu F. Smad3 phosphorylation by cyclin-dependent kinases. Cytokine Growth Factor Rev (2006) 17:9–17. doi: 10.1016/j.cytogfr.2005.09.010
45. Jackstadt R, van Hooff SR, Leach JD, Cortes-Lavaud X, Lohuis JO, Ridgway RA, et al. Epithelial NOTCH signaling rewires the tumor microenvironment of colorectal cancer to drive poor-prognosis subtypes and metastasis. Cancer Cell (2019) 36:319–336.e7. doi: 10.1016/j.ccell.2019.08.003
46. Mishra S, Bernal C, Silvano M, Anand S, Ruiz IAA. The protein secretion modulator TMED9 drives CNIH4/TGFα/GLI signaling opposing TMED3-WNT-TCF to promote colon cancer metastases. Oncogene (2019) 38:5817–37. doi: 10.1038/s41388-019-0845-z
47. Bajaj J, Konuma T, Lytle NK, Kwon HY, Ablack JN, Cantor JM, et al. CD98-mediated adhesive signaling enables the establishment and propagation of acute myelogenous leukemia. Cancer Cell (2016) 30:792–805. doi: 10.1016/j.ccell.2016.10.003
48. Cantor JM, Ginsberg MH. CD98 at the crossroads of adaptive immunity and cancer. J Cell Sci (2012) 125:1373–82. doi: 10.1242/jcs.096040
49. Fenczik CA, Sethi T, Ramos JW, Hughes PE, Ginsberg MH. Complementation of dominant suppression implicates CD98 in integrin activation. Nature (1997) 390:81–5. doi: 10.1038/36349
50. Ueda S, Hayashi H, Miyamoto T, Abe S, Hirai K, Matsukura K, et al. Anti-tumor effects of mAb against l-type amino acid transporter 1 (LAT1) bound to human and monkey LAT1 with dual avidity modes. Cancer Sci (2019) 110:674–85. doi: 10.1111/cas.13908
51. Turner N, Grose R. Fibroblast growth factor signalling: from development to cancer. Nat Rev Cancer (2010) 10:116–29. doi: 10.1038/nrc2780
52. Katoh M. FGFR inhibitors: effects on cancer cells, tumor microenvironment and whole-body homeostasis (Review). Int J Mol Med (2016) 38:3–15. doi: 10.3892/ijmm.2016.2620
53. Nakamura T, Ushigome H. Myeloid-derived suppressor cells as a regulator of immunity in organ transplantation. Int J Mol Sci (2018) 19. doi: 10.3390/ijms19082357
54. Veglia F, Perego M, Gabrilovich D. Myeloid-derived suppressor cells coming of age. Nat Immunol (2018) 19(8):2357. doi: 10.1038/s41590-017-0022-x
55. Szanto A, Balint BL, Nagy ZS, Barta E, Dezso B, Pap A, et al. STAT6 transcription factor is a facilitator of the nuclear receptor PPARγ-regulated gene expression in macrophages and dendritic cells. Immunity (2010) 33:699–712. doi: 10.1016/j.immuni.2010.11.009
56. Hao NB, Lü MH, Fan YH, Cao YL, Zhang ZR, Yang SM. Macrophages in tumor microenvironments and the progression of tumors. Clin Dev Immunol (2012) 2012:948098. doi: 10.1155/2012/948098
57. Arai H, Battaglin F, Wang J, Lo JH, Soni S, Zhang W, et al. Molecular insight of regorafenib treatment for colorectal cancer. Cancer Treat Rev (2019) 81:101912. doi: 10.1016/j.ctrv.2019.101912
58. Wilhelm SM, Dumas J, Adnane L, Lynch M, Carter CA, Schutz G, et al. Regorafenib (BAY 73-4506): a new oral multikinase inhibitor of angiogenic, stromal and oncogenic receptor tyrosine kinases with potent preclinical antitumor activity. Int J Cancer (2011) 129:245–55. doi: 10.1002/ijc.25864
59. Lafferty A, O'Farrell AC, Migliardi G, Khemka N, Lindner AU, Sassi F, et al. Molecular subtyping combined with biological pathway analyses to study regorafenib response in clinically relevant mouse models of colorectal cancer. Clin Cancer Res (2021) 27:5979–92. doi: 10.1158/1078-0432.CCR-21-0818
60. Mahnke YD, Brodie TM, Sallusto F, Roederer M, Lugli E. The who's who of T-cell differentiation: human memory T-cell subsets. Eur J Immunol (2013) 43:2797–809. doi: 10.1002/eji.201343751
61. Chen Y, Yang Z, Wu D, Min Z, Quan Y. Upregulation of interleukin17F in colorectal cancer promotes tumor invasion by inducing epithelialmesenchymal transition. Oncol Rep (2019) 42:1141–8. doi: 10.3892/or.2019.7220
62. Sharp SP, Avram D, Stain SC, Lee EC. Local and systemic Th17 immune response associated with advanced stage colon cancer. J Surg Res (2017) 208:180–6. doi: 10.1016/j.jss.2016.09.038
63. Podojil JR, Miller SD. Potential targeting of B7-H4 for the treatment of cancer. Immunol Rev (2017) 276:40–51. doi: 10.1111/imr.12530
64. Yin Y, Shi L, Yang J, Wang H, Yang H, Wang Q. B7 family member H4 induces epithelial-mesenchymal transition and promotes the proliferation, migration and invasion of colorectal cancer cells. Bioengineered (2022) 13:107–18. doi: 10.1080/21655979.2021.2009411
65. Feng Y, Yang Z, Zhang C, Che N, Liu X, Xuan Y. B7-H4 induces epithelial-mesenchymal transition and promotes colorectal cancer stemness. Pathol Res Pract (2021) 218:153323. doi: 10.1016/j.prp.2020.153323
66. Zhao LW, Li C, Zhang RL, Xue HG, Zhang FX, Zhang F, et al. B7-H1 and B7-H4 expression in colorectal carcinoma: correlation with tumor FOXP3(+) regulatory T-cell infiltration. Acta Histochem (2014) 116:1163–8. doi: 10.1016/j.acthis.2014.06.003
Keywords: colorectal cancer, consensus molecular subtype, genomic mutations, gene expression, tumor immune microenvironment
Citation: Lu Y, Gu D, Zhao C, Sun Y, Li W, He L, Wang X, Kou Z, Su J and Guo F (2023) Genomic landscape and expression profile of consensus molecular subtype four of colorectal cancer. Front. Immunol. 14:1160052. doi: 10.3389/fimmu.2023.1160052
Received: 06 February 2023; Accepted: 05 June 2023;
Published: 19 June 2023.
Edited by:
Jorge Melendez-Zajgla, National Institute of Genomic Medicine (INMEGEN), MexicoReviewed by:
Robin Mjelle, Norwegian University of Science and Technology, NorwayLan Zhao, Stanford University, United States
Copyright © 2023 Lu, Gu, Zhao, Sun, Li, He, Wang, Kou, Su and Guo. This is an open-access article distributed under the terms of the Creative Commons Attribution License (CC BY). The use, distribution or reproduction in other forums is permitted, provided the original author(s) and the copyright owner(s) are credited and that the original publication in this journal is cited, in accordance with accepted academic practice. No use, distribution or reproduction is permitted which does not comply with these terms.
*Correspondence: Feng Guo, Z3VvZmVuZzI3QGdtYWlsLmNvbQ==; Jiang Su, emhlbmdtaW4xMTE0QDEyNi5jb20=
†These authors have contributed equally to this work and share first authorship